q1 2016 - navidar · 4 q1 2016 software & internet sector review relative stock price...
TRANSCRIPT

7
Quarterly
Review of the
Software &
Internet Sector
Q1 2016
Member: FINRA / SIPC

2
About Navidar
Navidar is an investment banking firm providing companies and investors in dynamic industries with strategic
M&A advice, capital raising solutions, vital insights and breakthrough opportunities.
■ Big Firm Experience Combined with Senior Banker Attention
■ Global Relationships with Top-Tier Investors and World-Leading Companies
■ Greater Creativity and Customized Solutions
■ Focused on the Middle Corridor of the United States
Past Transactions Executed by Navidar
Note: Transactions above only represent a sample of past transactions executed by Navidar.
Has acquired
Buyside AdvisorSellside Advisor
Has been acquired by
Sellside Advisor
Has been acquired byHas been acquired by
Sellside Advisor
Sellside Advisor
Has been acquired by
Private Equity PlacementSellside Advisor
Has been acquired byHas been acquired by
Sellside Advisor
Sellside Advisor
Has been acquired by
Sellside Advisor
Has been acquired by
Sellside Advisor
Has been acquired byHas acquired
Buyside Advisor
Capital Structure ReviewNOL Shareholder Rights
Plan
Has been acquired by
Sellside Advisor Sellside Advisor
Has been acquired by
Private Equity PlacementDebt Placement
Private Equity PlacementBuyside Advisor
Has acquired
World Golf Systems Group PLC
3
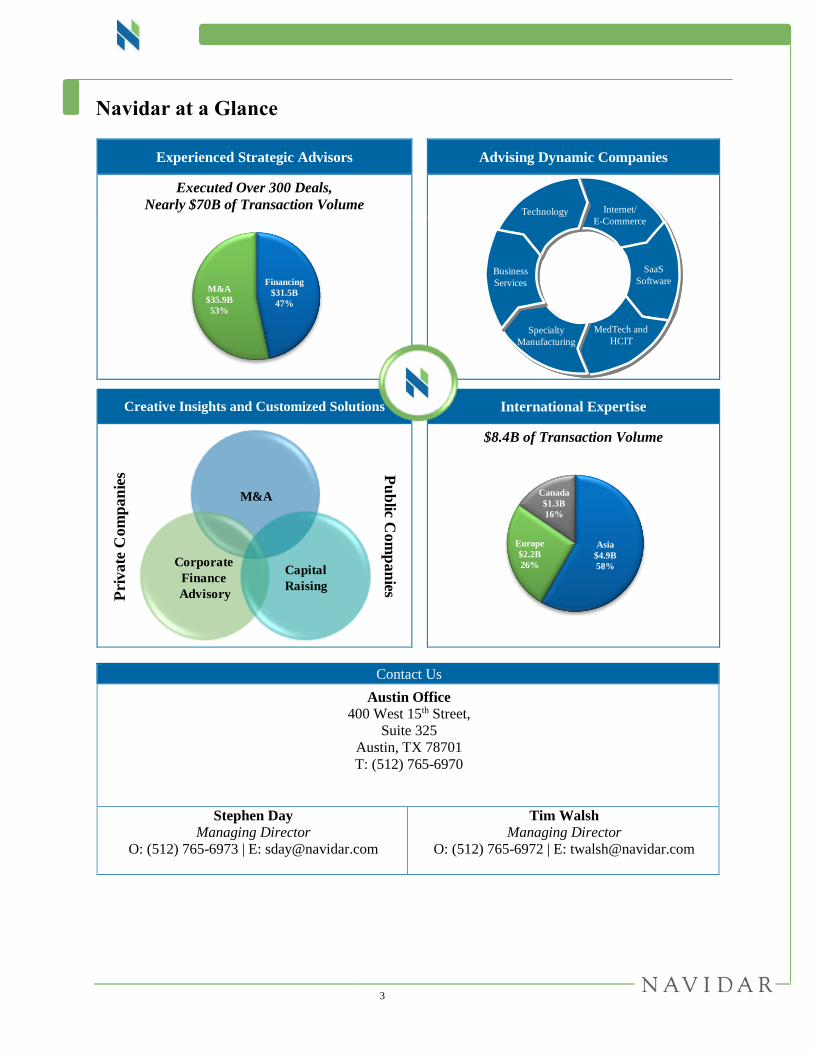
Navidar at a Glance
Experienced Strategic Advisors
Advising Dynamic Companies
Executed Over 300 Deals,
Nearly $70B of Transaction Volume
Creative Insights and Customized Solutions
International Expertise
$8.4B of Transaction Volume
Contact Us
Austin Office
400 West 15th Street,
Suite 325
Austin, TX 78701
T: (512) 765-6970
Stephen Day Managing Director
O: (512) 765-6973 | E: [email protected]
Tim Walsh Managing Director
O: (512) 765-6972 | E: [email protected]
Financing
$31.5B
47%
M&A
$35.9B
53%
M&A
Corporate
Finance
Advisory
Capital
Raising
Pu
blic C
om
pa
nies
Pri
va
te C
om
pa
nie
s
Asia
$4.9B
58%
Europe
$2.2B
26%
Canada
$1.3B
16%
Technology Internet/
E-Commerce
SaaS
SoftwareBusiness
Services
MedTech and
HCITSpecialty
Manufacturing
Technology Internet/
E-Commerce
SaaS
SoftwareBusiness
Services
MedTech and
HCITSpecialty
Manufacturing
4
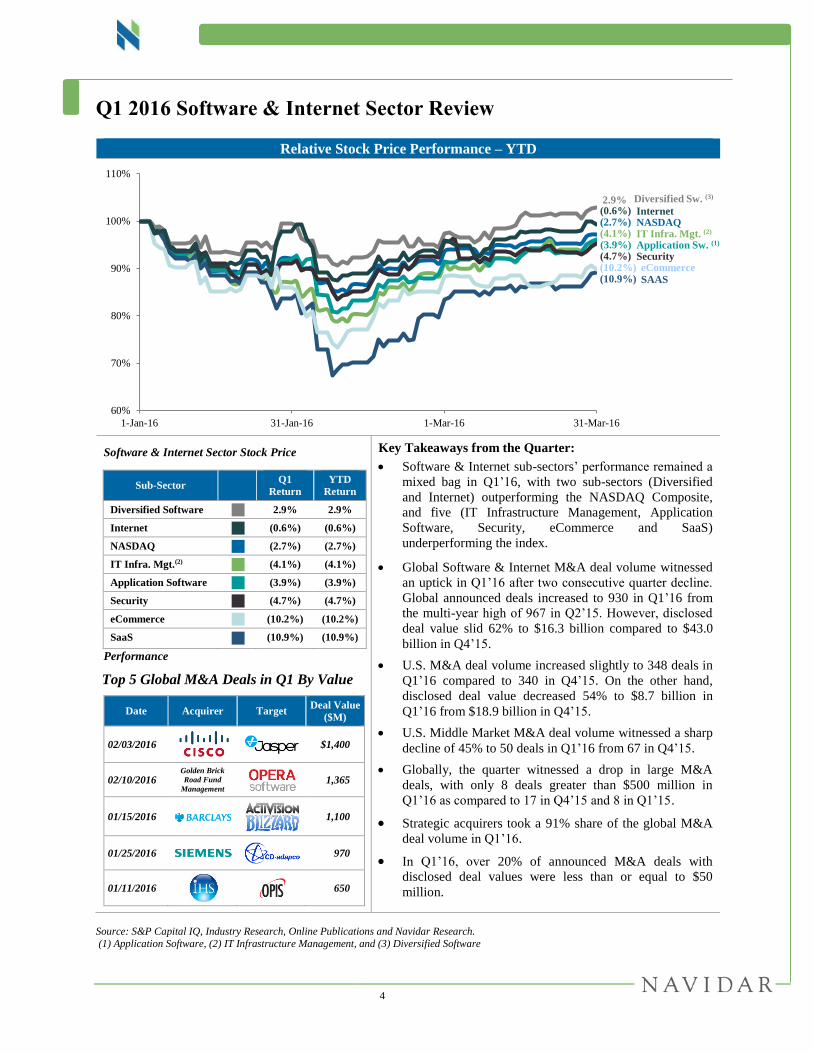
Q1 2016 Software & Internet Sector Review
Relative Stock Price Performance – YTD
Software & Internet Sector Stock Price
Performance
Top 5 Global M&A Deals in Q1 By Value
Date Acquirer Target Deal Value
($M)
02/03/2016
$1,400
02/10/2016 Golden Brick
Road Fund
Management 1,365
01/15/2016
1,100
01/25/2016
970
01/11/2016
650
Sub-Sector Q1
Return
YTD
Return
Diversified Software 2.9% 2.9%
Internet (0.6%) (0.6%)
NASDAQ (2.7%) (2.7%)
IT Infra. Mgt.(2) (4.1%) (4.1%)
Application Software (3.9%) (3.9%)
Security (4.7%) (4.7%)
eCommerce (10.2%) (10.2%)
SaaS
(10.9%) (10.9%)
Key Takeaways from the Quarter:
Software & Internet sub-sectors’ performance remained a
mixed bag in Q1’16, with two sub-sectors (Diversified
and Internet) outperforming the NASDAQ Composite,
and five (IT Infrastructure Management, Application
Software, Security, eCommerce and SaaS)
underperforming the index.
Global Software & Internet M&A deal volume witnessed
an uptick in Q1’16 after two consecutive quarter decline.
Global announced deals increased to 930 in Q1’16 from
the multi-year high of 967 in Q2’15. However, disclosed
deal value slid 62% to $16.3 billion compared to $43.0
billion in Q4’15.
U.S. M&A deal volume increased slightly to 348 deals in
Q1’16 compared to 340 in Q4’15. On the other hand,
disclosed deal value decreased 54% to $8.7 billion in
Q1’16 from $18.9 billion in Q4’15.
U.S. Middle Market M&A deal volume witnessed a sharp
decline of 45% to 50 deals in Q1’16 from 67 in Q4’15.
Globally, the quarter witnessed a drop in large M&A
deals, with only 8 deals greater than $500 million in
Q1’16 as compared to 17 in Q4’15 and 8 in Q1’15.
Strategic acquirers took a 91% share of the global M&A
deal volume in Q1’16.
In Q1’16, over 20% of announced M&A deals with
disclosed deal values were less than or equal to $50
million.
Source: S&P Capital IQ, Industry Research, Online Publications and Navidar Research.
(1) Application Software, (2) IT Infrastructure Management, and (3) Diversified Software
60%
70%
80%
90%
100%
110%
1-Jan-16 31-Jan-16 1-Mar-16 31-Mar-16
(10.2%) eCommerce
(0.6%) Internet
(4.7%) Security
(10.9%) SAAS
(2.7%) NASDAQ
(3.9%) Application Sw. (1)
2.9% Diversified Sw. (3)
(4.1%) IT Infra. Mgt. (2)
5
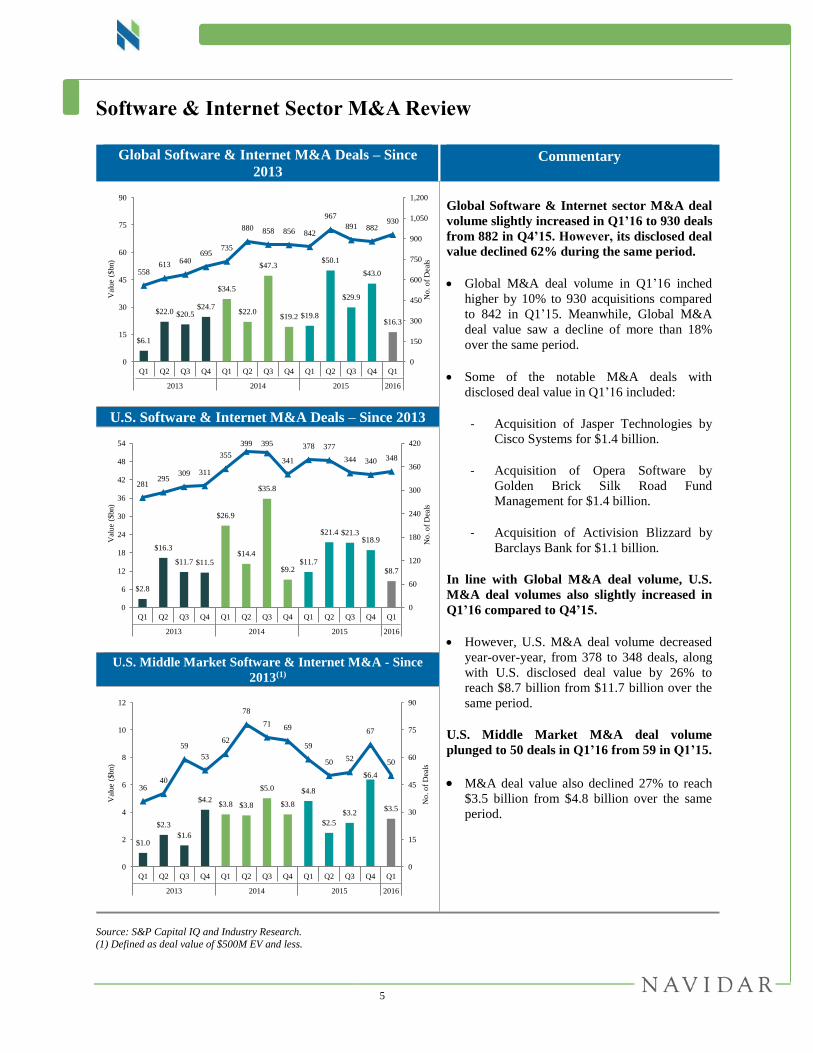
Software & Internet Sector M&A Review
Source: S&P Capital IQ and Industry Research.
(1) Defined as deal value of $500M EV and less.
Global Software & Internet M&A Deals – Since
2013 Commentary
Global Software & Internet sector M&A deal
volume slightly increased in Q1’16 to 930 deals
from 882 in Q4’15. However, its disclosed deal
value declined 62% during the same period.
Global M&A deal volume in Q1’16 inched
higher by 10% to 930 acquisitions compared
to 842 in Q1’15. Meanwhile, Global M&A
deal value saw a decline of more than 18%
over the same period.
Some of the notable M&A deals with
disclosed deal value in Q1’16 included:
- Acquisition of Jasper Technologies by
Cisco Systems for $1.4 billion.
- Acquisition of Opera Software by
Golden Brick Silk Road Fund
Management for $1.4 billion.
- Acquisition of Activision Blizzard by
Barclays Bank for $1.1 billion.
In line with Global M&A deal volume, U.S.
M&A deal volumes also slightly increased in
Q1’16 compared to Q4’15.
However, U.S. M&A deal volume decreased
year-over-year, from 378 to 348 deals, along
with U.S. disclosed deal value by 26% to
reach $8.7 billion from $11.7 billion over the
same period.
U.S. Middle Market M&A deal volume
plunged to 50 deals in Q1’16 from 59 in Q1’15.
M&A deal value also declined 27% to reach
$3.5 billion from $4.8 billion over the same
period.
U.S. Software & Internet M&A Deals – Since 2013
U.S. Middle Market Software & Internet M&A - Since
2013(1)
$6.1
$22.0 $20.5$24.7
$34.5
$22.0
$47.3
$19.2 $19.8
$50.1
$29.9
$43.0
$16.3
558613
640695
735
880 858 856 842
967
891 882930
0
150
300
450
600
750
900
1,050
1,200
0
15
30
45
60
75
90
Q1 Q2 Q3 Q4 Q1 Q2 Q3 Q4 Q1 Q2 Q3 Q4 Q1
2013 2014 2015 2016
No
. o
f D
eals
Val
ue
($bn)
$2.8
$16.3
$11.7 $11.5
$26.9
$14.4
$35.8
$9.2$11.7
$21.4 $21.3$18.9
$8.7
281295
309 311
355
399 395
341
378 377
344 340 348
0
60
120
180
240
300
360
420
0
6
12
18
24
30
36
42
48
54
Q1 Q2 Q3 Q4 Q1 Q2 Q3 Q4 Q1 Q2 Q3 Q4 Q1
2013 2014 2015 2016
No
. o
f D
eals
Val
ue
($bn)
$1.0
$2.3
$1.6
$4.2$3.8 $3.8
$5.0
$3.8
$4.8
$2.5
$3.2
$6.4
$3.5
3640
59
53
62
78
7169
59
5052
67
50
0
15
30
45
60
75
90
0
2
4
6
8
10
12
Q1 Q2 Q3 Q4 Q1 Q2 Q3 Q4 Q1 Q2 Q3 Q4 Q1
2013 2014 2015 2016
No
. o
f D
eals
Val
ue
($bn)
6
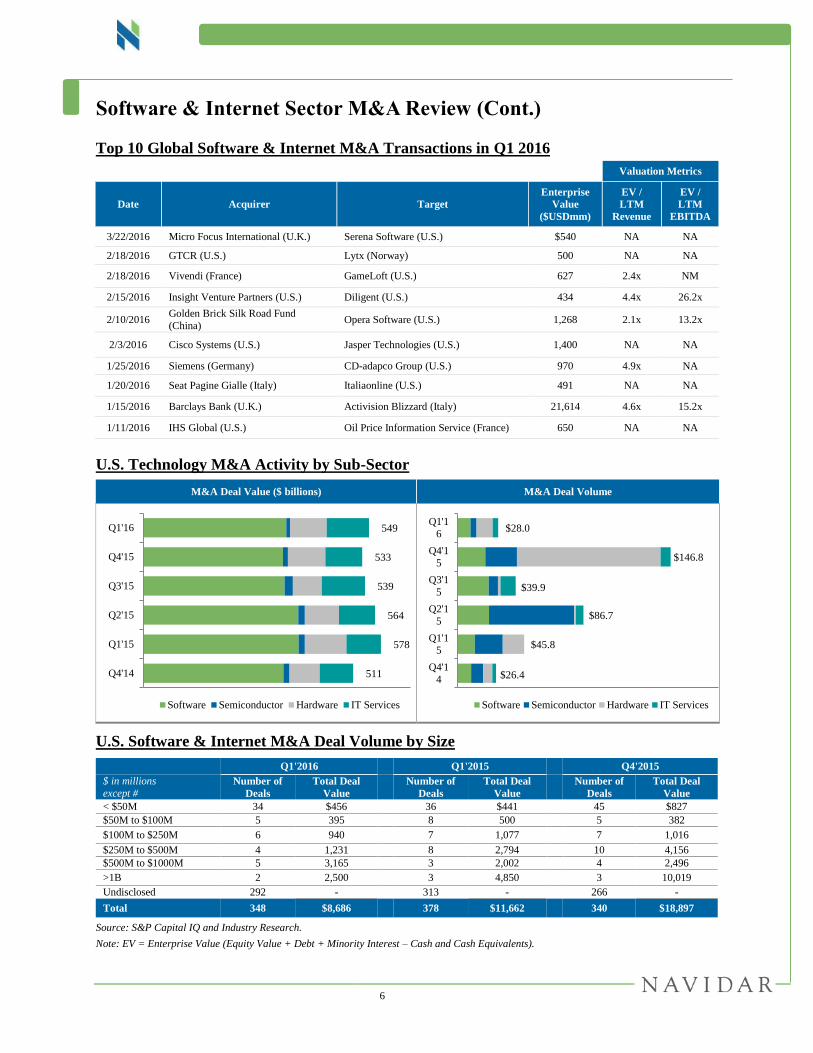
Software & Internet Sector M&A Review (Cont.)
Top 10 Global Software & Internet M&A Transactions in Q1 2016
Valuation Metrics
Date Acquirer Target
Enterprise
Value
($USDmm)
EV /
LTM
Revenue
EV /
LTM
EBITDA
3/22/2016 Micro Focus International (U.K.) Serena Software (U.S.) $540 NA NA
2/18/2016 GTCR (U.S.) Lytx (Norway) 500 NA NA
2/18/2016 Vivendi (France) GameLoft (U.S.) 627 2.4x NM
2/15/2016 Insight Venture Partners (U.S.) Diligent (U.S.) 434 4.4x 26.2x
2/10/2016 Golden Brick Silk Road Fund
(China) Opera Software (U.S.) 1,268 2.1x 13.2x
2/3/2016 Cisco Systems (U.S.) Jasper Technologies (U.S.) 1,400 NA NA
1/25/2016 Siemens (Germany) CD-adapco Group (U.S.) 970 4.9x NA
1/20/2016 Seat Pagine Gialle (Italy) Italiaonline (U.S.) 491 NA NA
1/15/2016 Barclays Bank (U.K.) Activision Blizzard (Italy) 21,614 4.6x 15.2x
1/11/2016 IHS Global (U.S.) Oil Price Information Service (France) 650 NA NA
U.S. Technology M&A Activity by Sub-Sector
U.S. Software & Internet M&A Deal Volume by Size
Q1'2016
Q1'2015
Q4'2015
$ in millions
except # Number of
Deals
Total Deal
Value
Number of
Deals
Total Deal
Value
Number of
Deals
Total Deal
Value
< $50M 34 $456
36 $441
45 $827
$50M to $100M 5 395
8 500
5 382
$100M to $250M 6 940
7 1,077
7 1,016
$250M to $500M 4 1,231
8 2,794
10 4,156
$500M to $1000M 5 3,165
3 2,002
4 2,496
>1B 2 2,500
3 4,850
3 10,019
Undisclosed 292 -
313 -
266 -
Total 348 $8,686
378 $11,662
340 $18,897
Source: S&P Capital IQ and Industry Research.
Note: EV = Enterprise Value (Equity Value + Debt + Minority Interest – Cash and Cash Equivalents).
M&A Deal Value ($ billions) M&A Deal Volume
511
578
564
539
533
549
Q4'14
Q1'15
Q2'15
Q3'15
Q4'15
Q1'16
Software Semiconductor Hardware IT Services
$26.4
$45.8
$86.7
$39.9
$146.8
$28.0
Q4'1
4
Q1'1
5
Q2'1
5
Q3'1
5
Q4'1
5
Q1'1
6
Software Semiconductor Hardware IT Services
7
Software & Internet Sector M&A Review (Cont.)
Review of Selected Cloud / SaaS Transactions in Q1
Cloud / SaaS
Asure Software acquired Mangrove Software for $18M EV. Valuation was not disclosed.
Acquisition enables Asure Software to alter the marketplace of Human Capital Management by offering
a comprehensive solution that brings workforce and workspace management together.
Combination forms a unified management platform, increases the Company’s bottom-line performance
through greater employee empowerment and engagement and Mangrove Software provides new data
metrics to manage the Company’s people and real estate.
Headquartered in Tampa, FL, Mangrove Software provides SaaS-based human capital management applications and
benefits administration services for mid-market and enterprise organizations. The Company’s solutions deliver the
functionality businesses need to manage their employees, including recruitment and onboarding, HR management
and compliance, benefits management and online enrollment, payroll, performance management, reporting and
analytical decision-making tools, time and attendance and a self-service Web portal for executives, managers,
administrators, recruiters and employees.
inContact acquired AC2 Solutions for $12M EV. Valuation was not disclosed.
Acquisition added AC2 solutions to inContact’s workforce management tools, which are covered by 5
U.S. patents and will be a big differentiator.
Combination brings efficiency and utilization of inContact’s agents through intelligent scheduling, and
automated workforce management tools.
Headquartered in Hazlet, NJ, AC2 Solutions develops workforce management product technology and platform
solutions. The Company offers Forecaster, a forecasting technology to develop accurate forecasts; Concurrent
Optimal Scheduler, a solution to meet various user defined schedule requirements; and Advanced Workforce
Optimization, a portal to address the challenges faced in managing multi-site contact center environment with a
multi-skilled workforce providing service through multimedia channels including phone, fax, email, chat, and social
media.
International Business Machines acquired Optevia. Valuation was not disclosed.
Acquisition expands IBM’s SaaS CRM offerings to the public sectors across the globe and also helps to
leverage the technology to develop similar solutions for other sectors.
Headquartered in Kent, United Kingdom, Optevia develops Microsoft Dynamics customer relationship
management-based IT solutions. The Company focuses on CRM SaaS solutions. The Company offers solutions in
the areas of emergency services, health and social care, social housing, local government and transport essentials;
and Dynamic Correspondence, a solution for automating the creation of documents using pre-written and pre-
approved content and addresses parliamentary questions, freedom of information requests, subject access requests,
complaints, and official / unofficial correspondence.
Source: S&P Capital IQ, Press Releases, Equity Research, Online Publications, Industry Research and Navidar Research. Note: EV = Enterprise Value (Equity Value + Debt + Minority Interest – Cash and Cash Equivalents) and LTM = Last Twelve Months.

8
Software & Internet Sector M&A Review (Cont.)
Review of Selected Cloud / SaaS Transactions in Q1
Cloud / SaaS
BroadSoft acquired Transera Communications. Valuation was not disclosed.
Acquisition enables BroadSoft to offer a comprehensive cloud contact center portfolio with minimal new
investments, rapid time-to-market and seamless integration with BroadSoft’s BroadWorks and
BroadCloud solutions.
Headquartered in Sunnyvale, CA, Transera Communications develops and provides cloud-based software for
contact centers. The Company offers its software for sales team tracking, customer behavior analytics, retention,
marketing return on investment, performance optimization and operational efficiency aspects. The Company
provides software for e-tail, retail and direct marketing customers; business process outsourcers and consumer
finance, technology, travel and hospitality, and consumer products and services industries.
Pitney Bowes acquired Enroute Systems. Valuation was not disclosed.
Acquisition will complement and expand Pitney Bowes’s global eCommerce offerings for companies
throughout the retail supply chain.
Acquisition will benefit new clients with Pitney Bowes’s eCommerce scale and end-to-end capabilities,
which help retailers, brands and online marketplaces expand globally and transact with consumers in
more than 220 countries and territories and more than 74 currencies worldwide.
Headquartered in Seattle, WA, Enroute Systems offers SaaS-based transportation management solutions. The
Company offers ShipIt! Portal, a supply chain management software that supports package execution and provides
address correction, residential delivery indication, return label for print or email, document generation, manifest
creation and tracking services.
Source: S&P Capital IQ, Press Releases, Equity Research, Online Publications, Industry Research and Navidar Research. Note: EV = Enterprise Value (Equity Value + Debt + Minority Interest – Cash and Cash Equivalents) and LTM = Last Twelve Months.
9
Software & Internet Sector M&A Review (Cont.)
Mobile
Snapchat acquired Bitstrips for $100M EV. Valuation was not disclosed
Deal complements Snapchat’s new product Chat 2.0, which includes the ability to send over 200 stickers.
Bitstrips will be used to make and send stickers that look like users.
Acquisition adds personalization to Snapchat’s existing emojis, provides an additional push into face-
morphing technology and also adds a unique way for Snapchat to sell sponsorships to advertisers for
revenue by setting up stickers that look like users.
Headquartered in Toronto, Canada, Bitstrips develops a mobile application that uses people into their own set of
personal emojis that are shared in a chat application. The Company offers Bitmoji, a mobile application that gives
users an entertaining and dynamic visual identity to express themselves, as well as allows them to insert emojis into
Gmail, Messenger, Slack, virtually anywhere on the Web.
Zynga acquired Zindagi Games for $75M EV. Valuation was not disclosed.
Acquisition added games like Yummy Gummy and Crazy Kitchen into Zynga's catalog of offerings.
Acquisition enables Zynga to focus on five genres of games: racing, invest and express, action strategy,
social casino, and casual.
Headquartered in Camarillo, CA, Zindagi Games develops motion-controlled games for PlayStation and mobile
devices. The Company is behind the development of Crazy Kitchen, Yummy Gummy and a series of PlayStation
movie titles.
Asics to acquire FitnessKeeper. Valuation was not disclosed.
Acquisition will allow Asics to establish a one-to-one marketing channel utilizing user data including
fitness information, obtain a digital technology development platform, as well as provide new contents
and services utilizing advanced digital technology.
Headquartered in Boston, MA, Fitnesskeeper develops and builds a smartphone application and operates an online
community for tracking personal fitness programs. The Company offers RunKeeper application that enables users to
use GPS in their phone to track the pace, workout distance, time, cadence and elevation of bikes, hikes, runs, walks,
and more, as well as allows them to share this information with their family, friends and others application users
through an online community.
Source: S&P Capital IQ, Press Releases, Equity Research, Online Publications, Industry Research and Navidar Research.
Note: EV = Enterprise Value (Equity Value + Debt + Minority Interest – Cash and Cash Equivalents) and LTM = Last Twelve Months.
10
Software & Internet Sector M&A Review (Cont.)
Vertical Specific Software
Siemens to acquire CD-adapco Group for $970M EV. Valuation was not disclosed.
Acquisition will allow Siemens to focus on growth of digital business and expand the Company’s portfolio
in the area of industry software.
Deal will enable Siemens to leverage CD-adapco simulation tools led by the flagship product STAR-
CCM+, which allows engineers to discover better designs and faster.
Headquartered in Melville, NY, CD-adapco Group provides engineering simulation and design exploration solutions
for academic, aerospace, batteries, chemical process, electronics, electric machines, energy, ground transportation,
life sciences, manufacturing, marine, oil and gas, sports, turbo machinery and civil and MEP industries. The
Company offers STAR-CCM+, an engineering simulation software that solves problems involving flow of fluids or
solids, heat transfer and stress; STAR-Cast, a casting simulation add-on for STAR-CCM+; Battery Design Studio, a
tool that allows engineers to design battery cells, simulate performance and analyze data from simulation and test
work; DARS, a simulation tool for 0D and 1D management and analyses of chemical reactions; and wave6, a
frequency domain simulation software package for modeling the transmission of noise and vibration.
GTCR to acquire Lytx for $500M EV. Valuation was not disclosed.
Acquisition provides a financial foundation for Lytx to grow and develop customer base and service
offerings.
Acquisition showcases GTCR's expertise of investing in companies with hard-to-replicate data and highly
valuable workflow applications.
Headquartered in San Diego, CA, Lytx develops video-based driver safety / fleet management solutions. The
Company offers DriveCam that identifies, prioritizes and corrects the causes of poor driving to set standards for
driver safety needs; RAIR Web-based suite of compliance services that help carriers to manage CSA, hours-of-
service, driver vehicle inspection report and driver qualification aspects; and a fleet tracking solution and a fuel
management solution. The Company serves customers in the United States and internationally.
Fiserv acquired Community Financial Services Business of ACI Worldwide for $200M EV.
Valuation was not disclosed.
Acquisition strengthens Fiserv’s digital banking and electronic payments solutions capabilities.
Combination enables the Company to become the leading provider of software products and SaaS-based
solutions facilitating real-time electronic and eCommerce payments for large financial institutions,
enablers, retailers and billers worldwide.
Acquisition led to the addition of technology solutions including architect banking, SSB internet banking,
WebFederal internet banking and advantage internet banking solutions, advantage consolidated bank
bill pay and ACI defense services.
Headquartered in Naples, FL, ACI Worldwide develops, markets, installs, and supports software products and
services for facilitating electronic payments worldwide. The Company offers products and services covering various
domains within the payments and banking marketplace, including online banking and cash management that
manages payments and cash flows through the online or mobile channel; managing and processing monetary, non-
monetary, sales, and account origination financial transactions; and managing trade-related transaction types.
Source: S&P Capital IQ, Press Releases, Equity Research, Online Publications, Industry Research and Navidar Research.
Note: EV = Enterprise Value (Equity Value + Debt + Minority Interest – Cash and Cash Equivalents) and LTM = Last Twelve Months
11
Software & Internet Sector M&A Review (Cont.)
Vertical Specific Software
LinkedIn to acquire Connectifier for $100M EV. Valuation was not disclosed.
Acquisition strengthens LinkedIn’s core product offerings and accelerates product roadmap by
leveraging powerful machine learning-based searching and matching technology, which helps recruiters
and hiring managers to find the perfect talent fit.
Headquartered in Costa Mesa, CA, Connectifier develops an online platform for discovering, qualifying and
connecting with candidates among various recruiting technologies. The Company offers Connectifier Search, a
search index that pulls out professional information about candidates from various sites and delivers suitable
candidates as a result, and Connectifier Auto Search, a web browser plug-in that automatically pops up and provides
additional information such as email addresses and phone numbers whenever a user views a profile on supported
sites.
Firstsource acquired ISGN’s BPO Division for $12M EV. Valuation was not disclosed.
Acquisition helps Firstsource to penetrate the growing US mortgage BPO market and strengthens the
Company’s banking, financial services and insurance (BFSI) portfolio.
Acquisition enables Firstsource to leverage ISGN's deep knowledge in the mortgage outsourcing space
coupled with a set of marquee customers to tap significant opportunities for cross-selling capabilities and
global relationships.
Headquartered in Bensalem, PA, ISGN Solutions offers technology and fulfillment services to lenders for various
phases of loan origination and closing, including customer service, document preparation, loan closing coordination,
post closing review, title and settlement services, as well as staffing and on-site services.
Source: S&P Capital IQ, Press Releases, Equity Research, Online Publications, Industry Research and Navidar Research.
Note: EV = Enterprise Value (Equity Value + Debt + Minority Interest – Cash and Cash Equivalents) and LTM = Last Twelve Months

12
Software & Internet Sector M&A Review (Cont.)
eCommerce and Marketing
Web.com acquired Yodle for $342M EV. Valuation was not disclosed.
Acquisition added complementary vertical market solutions, franchise-specific products and cloud-based
office automation business applications in Web.com's ongoing initiatives of expansion.
Deal elevates Web.com's position and scale as a leading, national provider of value-added digital
marketing solutions to small businesses and improves its profile by adding higher growth revenue
streams.
Headquartered in New York, NY, Yodle provides online marketing services to local business owners. The
Company’s services include web presence, local search placement, social media, customer reviews, email marketing
and special offers distribution. The Company works with franchises and multi-location businesses.
Ritchie Bros. acquired Mascus for $30M EV. Valuation was not disclosed.
Acquisition provides Ritchie Bros. with additional multichannel solutions for customers, an expanded
buyer audience and a larger presence in Europe.
Combination enhanced the current capabilities for end-to-end services that they can provide to OEMs,
dealers and private equipment sellers.
Headquartered in Amsterdam, the Netherlands, Mascus International operates an online portal for sale and purchase
of heavy machinery and vehicles. The Company makes trading in used machinery and equipment quicker and more
efficient by collecting information about supply and demand in one place. All dealers, producers and end users can
offer their used equipment and trucks for sale via Mascus' online equipment listing service.
Zillow Group acquired Naked Apartments for $13M EV. Valuation was not disclosed.
Acquisition reinforces commitment of Zillow Group to provide New York City-centric tools and
information for buyers, sellers, renters and real estate professionals.
Combination shares the common goal of using data, tools and technology to bring transparency and ease
to New York City's complex real estate landscape.
Headquartered in New York, NY, Naked Apartments owns and operates a search portal that lists the apartments for
sale. The Company features include limiting the results to only no-fee apartments; viewing the closest transportation
options for each apartment; contacting apartment representatives anonymously; receiving email alerts for new
rentals and reviews of brokers written by other renters.
Propel Marketing acquired ThriveHive for $12M EV. Valuation was not disclosed.
Combination provides unique market access and ability to deliver a full suite of marketing solutions to
local businesses and help them to compete and succeed in the digital marketplace.
Acquisition reinforces Propel’s status as a dynamic leader in the SMB digital marketing ecosystem.
Headquartered in Cambridge, MA, Conversion Innovations doing business as ThriveHive, operates an online
marketing platform that provides marketing tools and guidance to small business owners for managing and growing
their business. The Company offers various marketing resources such as blogging, business knowledge / marketing
plans, content creation, email marketing, search engine marketing, search engine optimization, social media and
website design.
Source: S&P Capital IQ, Press Releases, Equity Research, Online Publications, Industry Research and Navidar Research.
Note: EV = Enterprise Value (Equity Value + Debt + Minority Interest – Cash and Cash Equivalents) and LTM = Last Twelve Months
13
Software & Internet Sector M&A Review (Cont.)
Social
YouTube acquired BandPage for $8M EV. Valuation was not disclosed.
Acquisition complements YouTube’s tools and resources such as YouTube for Artists and YouTube
Space to help musicians increase both exposure and revenue.
Combination to grow an open network of digital music services, develop intelligent new tools for
managing / distributing artist content & commerce and create new opportunities.
Headquartered in San Francisco, CA, BandPage operates a music-sharing platform for musicians to connect with
and retain fans. The Company’s platform enables musicians to manage their online presence by uploading their
profile, bio, pictures, videos, tracks and tour dates and updates that information across the Web, including Facebook,
Twitter, SoundCloud, VEVO, Xbox Music, Pandora, WordPress, their website. The Company also provides
BandPage Everywhere, a new tool for musicians to update their profiles, content, Websites and blogs on BandPage
and BandPage Connect, which allows musicians to connect to various platforms.
Starflick.com acquired Yinfomatics for $8M EV. Valuation was not disclosed.
Acquisition enables Starflick.com to expand and grow by serving underserved markets through
Yinformatics, 22 cities were chosen as initial servicing locations with an emphasis on China.
Headquartered in USA, Yinfomatics operates an online social networking portal. The networking portal supports
both free and paid membership, granting differential access and control features. There are forums for general
conversation as well as dedicated pages to list products and services. This includes job openings, casting calls, stage
set rentals, equipment for Sale, personals, and services such as lessons, promotions and resumes. The users have the
option of listing locally (default), nation-wide or globally. The portal contains mapping and directions software,
allowing the user to quickly determine the location of the product or service.
Clickable acquired Talkwheel.com. Valuation was not disclosed.
Acquisition of Talkwheel is aligned with Clickable's strategy to offer customers the most complete, end-
to-end social marketing solution and expand its ability to offer a social community component to
accelerate brand engagement for current and future customers.
Acquisition also brings complementary capabilities and technologies to Clickable, including key
influencer and trending topics analytics.
Headquartered in San Francisco, CA, Talkwheel.com operates a social media community and analytics platform that
unifies and analyzes a brand's social media. The Company social media community and analytics platform allows
brands to build visual, hosted and consumer-facing communities; integrates into various websites, mobile
applications, blogs and social media channels to unify conversations of consumers interacting in consumer-facing
communities; determines the specific influencers that drive brands communities; and customizes key influencer
algorithms tailored specifically to brands data.
Source: S&P Capital IQ, Press Releases, Equity Research, Online Publications, Industry Research and Navidar Research. Note: EV = Enterprise Value (Equity Value + Debt + Minority Interest – Cash and Cash Equivalents) and LTM = Last Twelve Months.
14
Software & Internet Sector M&A Review (Cont.)
Big Data / Analytics / Business Intelligence
IHS Global acquired Oil Price Information Service for $650M EV. Valuation was not disclosed.
Acquisition diversifies IHS energy portfolio in a new area of business by serving the downstream energy
market earlier served by OPIS, thus providing visibility across the entire petroleum value chain.
Combination provides complete source of U.S.-refined pricing information and analytics, which will
bring additional value to their customers by layering new insight on top of current product offerings.
Headquartered in Gaithersburg, MD, Oil Price Information Service provides real-time and historical spot, wholesale
/ rack, and retail fuel prices for refined products, renewable fuels, and natural gas and gas liquids industries. The
Company offers real-time, daily, weekly, monthly, and historical pricing and news; mobile applications for real-time
fuel pricing and news; and news and publications, directories, special reports, pump decals, and software solutions
for various commodities, including gasoline, LPG / natural gas liquids, diesel, jet fuel, renewable fuels, refinery
feedstock, crude / natural gas, propane, resid, kerosene, ethanol and biodiesel.
Insight Venture Partners to acquire Diligent for $434M EV, which implied 4.37x LTM Revenue
and 26.9x LTM EBITDA.
Acquisition will provide Diligent the financial flexibility to continue executing on its long-term vision,
which can benefit both clients and employees.
Headquartered in New York, NY, Diligent Corporation develops and markets Diligent Boards, an online software
application worldwide. The Company’s Diligent Boardbooks application is a used board portal that allows board
members, management and administrative staff to produce, deliver, review and vote on board materials. The
Company provides SaaS and associated services, including securely hosting the clients’ data and customer service
for the application.
Nasdaq to acquire Boardvantage for $200M EV. Valuation was not disclosed.
Acquisition will complement Nasdaq’s focus on developing leading financial technology solutions and
delivering the most intuitive, streamlined decision making and collaboration tools for boards, executives
and enterprise management in the world.
Acquisition enables Boardvantage’s clients to gain access of Nasdaq's thought leadership program, which
includes governance best practice expertise from the Company's senior management and other
distinguished corporate governance leaders.
Headquartered in Menlo Park, CA, BoardVantage delivers paperless processes for board and leadership
communication. The Company offers MeetX, a platform that automates the dissemination of sensitive information
and captures meeting processes online. The Company’s platform simplifies online board book creation and
distribution with workflows and one-click support of updates and notifications; and offers purpose-built tools for
approving initiatives, e-signing agreements, participating in meetings remotely and securing messaging and
annotation sharing for one-on-one communication.
Source: S&P Capital IQ, Press Releases, Equity Research, Online Publications, Industry Research and Navidar Research. Note: EV = Enterprise Value (Equity Value + Debt + Minority Interest – Cash and Cash Equivalents) and LTM = Last Twelve Months.
15
Software & Internet Sector M&A Review (Cont.)
Big Data / Analytics / Business Intelligence
Oracle acquires AddThis for $175M EV. Valuation was not disclosed.
Acquisition boosts Oracle’s DaaS offering and further extends the value of Oracle’s data cloud in the
market.
Headquartered in McLean, VA, AddThis operates a social sharing and analytics platform for sharing online content.
The Company offers social tools and analytics that are used on various domains to distribute and track digital
content, such as Web pages, widgets and videos to social networks, bookmarking sites and blogs. The Company’s
platform enables users to see how the content is shared on social networks; track email shares, copied text, or URLs
that are pasted from browser address bars and register to receive real-time data on how social media is increasing
site traffic and what content the audience likes.
Guidewire Software to acquire EagleEye Analytics for $42M EV. Valuation was not disclosed.
Acquisition will enable Guidewire’s customers to apply predictive analytics for making better decisions
across the insurance lifecycle including data preparation, model building, operational deployment,
performance monitoring and analytic feedback.
Headquartered in Columbia, SC, EagleEye Analytics offers predictive analytics software and consulting services to
the property and casualty insurance enterprises in the United States, Canada and internationally. The Company
offers Talon Analysis Studio, a software-as-a-service predictive analytics model-building platform for data-loading
and analysis runs. The Company also offers Talon Management Studio, a tool that provides a lens through which
nonanalytic staff can grasp, implement and manage technical results and real-time scoring service that helps to make
decisions providing a three-digit directional score.
Source: S&P Capital IQ, Press Releases, Equity Research, Online Publications, Industry Research and Navidar Research.
Note: EV = Enterprise Value (Equity Value + Debt + Minority Interest – Cash and Cash Equivalents) and LTM = Last Twelve Months.
16
Software & Internet Sector M&A Review (Cont.)
IT Infrastructure Management / Network Management / Security
Cisco Systems to acquire Jasper Technologies for $1.4B EV. Valuation was not disclosed.
Acquisition will enable Cisco to offer a complete IoT solution that is interoperable across devices and
works with IoT service providers, application developers and an ecosystem of partners.
Acquisition allows Cisco to build upon the Jasper IoT service platform and add new IoT services such as
enterprise Wi-Fi, security for connected devices and advanced analytics to better manage device usage.
Headquartered in Santa Clara, CA, Jasper Technologies provides a cloud-based Internet of Things platform that
enables various companies to launch, manage and monetize IoT services on a global scale. The Company offers
Control Center that enables businesses to accelerate IoT services across the globe; provide automated, real-time
visibility and control over their networked devices and services, and optimize and automate every stage of IoT
service lifecycle.
Fireeye acquired iSIGHT Partners for $268M EV. Valuation was not disclosed.
Acquisition boosts Fireeye’s cyber intelligence offerings for governments and businesses.
Deal enables Fireeye to enrich adversary insights and enhance the relevance, timeliness and quality of the
ThreatScape intelligence.
Acquisition allows FireEye to leverage iSIGHT intelligence across security product portfolio and extend
their service offerings.
Headquartered in Dallas, TX, iSIGHT provides cyber threat intelligence solutions to the public sector and
commercial entities in the United States and internationally. The Company offers solutions focused on cyber threats
from primarily financially motivated actors and enables organizations to integrate the cyber threat intelligence with
their security technologies and processes.
Cisco acquired CliQr Technologies for $260M EV. Valuation was not disclosed.
Acquisition enables Cisco to focus on products beyond its proprietary software, hardware and toward a
broader range of computing needs.
Combination with CliQr's price comparison tool offers customers to pick through instance configurations
within the various cloud environments and determine costs before their deployment.
Headquartered in San Jose, CA, CliQr Technologies develops a single platform for modeling, deploying and
managing applications across physical, virtual and cloud environments. The Company offers CliQr CloudCenter, an
application-defined management platform that provides infrastructure resources and deploys application components
and data across datacenter, private and public cloud environments. The Company also provides solutions for
application migration, IaaS, capacity augmentation, DevOps automation and service providers.
Source: S&P Capital IQ, Press Releases, Equity Research, Online Publications, Industry Research and Navidar Research.
Note: EV = Enterprise Value (Equity Value + Debt + Minority Interest – Cash and Cash Equivalents) and LTM = Last Twelve Months.
17
Software & Internet Sector M&A Review (Cont.)
IT Infrastructure Management / Network Management / Security
Infoblox acquired Digital Footprints for $45M EV. Valuation was not disclosed.
Acquisition enables Infoblox to become a first enterprise-grade DDI vendor that combines contextual
network data with federated threat intelligence and a dedicated threat research team to provide context-
aware security using infrastructure that customers already have in place.
Deal provides Infoblox with new security features that addresses the growing intelligence needs to help
protect network security.
Headquartered in Tacoma, WA, Digital Footprints International, doing business as Internet Identity, provides
security solutions for detecting, diagnosing, and mitigating internet threats that include phishing, malware attacks,
and domain name system (DNS) hijacking for enterprises. The Company provides business-critical solutions that
secure and protect the integrity of a Company's Internet presence for brand abuse and data loss.
Distil Networks acquired ScrapeSentry for $10M EV. Valuation was not disclosed.
Acquisition adds expert team of ScrapeSentry to Distill Networks workforce, which will provide real-time
threat monitoring, analysis, investigation and response along with post incident to ensure a rapid
response to malicious bot attacks representing a new generation of threats that make up ~60% of all web
traffic.
Headquartered in Boston, MA, ScrapeSentry develops and provides anti-scraping solutions to protect sites from the
loss of intellectual property and data theft. The Company offers its anti-scraping services based on a technology
platform and 24/7 services delivered from the Sentor security operations center, which include monitoring, analysis,
investigation, blocking policy development, enforcement and support.
Source: S&P Capital IQ, Press Releases, Equity Research, Online Publications, Industry Research and Navidar Research. Note: EV = Enterprise Value (Equity Value + Debt + Minority Interest – Cash and Cash Equivalents) and LTM = Last Twelve Months.
18
Software & Internet Sector M&A Review (Cont.)
Other Nice System to acquire Nexidia for $135M EV. Valuation was not disclosed.
Acquisition to enhance Nice System’s analytics offering and also uplift their mission to deliver the power
of customer data and insight beyond the contact center.
Deal provides immediate value realization based on a full range of delivery models including SaaS and
managed analytics.
Headquartered in Atlanta, GA, Nexidia develops phonetic-based technology solutions for audio and video search.
The Company offers Enterprise Speech Intelligence that enables users to visualize various volumes of audio analysis
results, identify trends, correlate data and listen to relevant conversations to support analysis; Forensic Search that
delivers ad-hoc and drill-down capability for the legal and regulatory community and Developer Edition that
provides content creators and aggregators with the ability to deliver media search capabilities to their consumers
through the web.
Examworks acquired ABI Document Support Services for $62M EV. Valuation was not disclosed.
Acquisition enables Examworks to streamline medical record management workflow and provide
independent medical review services by delivering complete, accurate and accessible case files.
Combination helps Examworks to automate workflow processes to accommodate the industry’s
increasing demands.
Headquartered in Redlands, CA, EDCO Group doing business as ABI Document Support Services, provides record
retrieval services and technology for the legal and insurance industries in the United States and internationally. The
Company offers records retrieval, processing, copying and delivery services and eSummary, a record summarization
tool for organizing, analyzing and summarizing records.
Unchained Labs acquired Freeslate for $25M EV. Valuation was not disclosed.
Acquisition allows Unchained Labs to add more biologics focused tools in its portfolio.
Acquisition enables Unchained Labs to leverage Freeslate experience of partnering with Biopharma and
knowledge of helping researchers overcome common drug development bottlenecks through configurable
automation solutions.
Headquartered in Sunnyvale, CA, FreeSlate designs, develops and deploys integrated workflows for research and
development labs. The Company also provides technology development, proof of concept, and managed research
services. The Company serves a range of industries, including pharmaceuticals, energy, chemicals and consumer
products.
Source: S&P Capital IQ, Press Releases, Equity Research, Online Publications, Industry Research and Navidar Research. Note: EV = Enterprise Value (Equity Value + Debt + Minority Interest – Cash and Cash Equivalents) and LTM = Last Twelve Months.
19
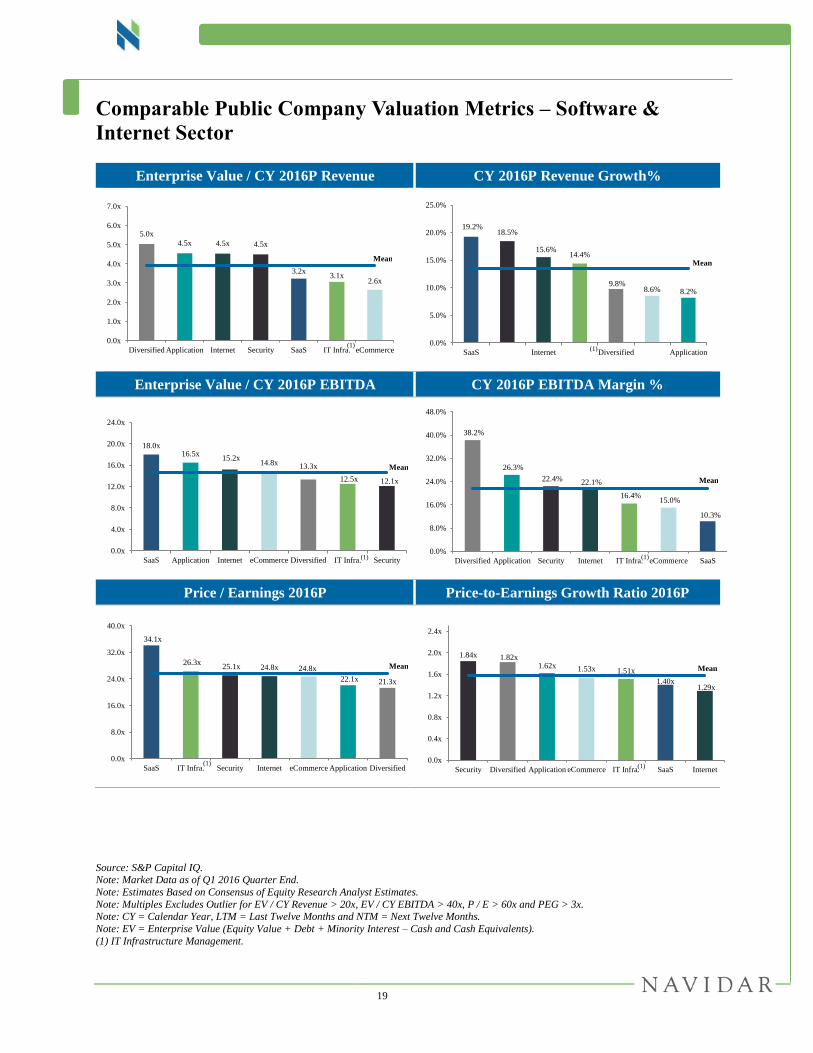
Comparable Public Company Valuation Metrics – Software &
Internet Sector
Enterprise Value / CY 2016P Revenue CY 2016P Revenue Growth%
Enterprise Value / CY 2016P EBITDA CY 2016P EBITDA Margin %
Price / Earnings 2016P Price-to-Earnings Growth Ratio 2016P
Source: S&P Capital IQ. Note: Market Data as of Q1 2016 Quarter End.
Note: Estimates Based on Consensus of Equity Research Analyst Estimates.
Note: Multiples Excludes Outlier for EV / CY Revenue > 20x, EV / CY EBITDA > 40x, P / E > 60x and PEG > 3x. Note: CY = Calendar Year, LTM = Last Twelve Months and NTM = Next Twelve Months.
Note: EV = Enterprise Value (Equity Value + Debt + Minority Interest – Cash and Cash Equivalents).
(1) IT Infrastructure Management.
5.0x
4.5x 4.5x 4.5x
3.2x3.1x
2.6x
0.0x
1.0x
2.0x
3.0x
4.0x
5.0x
6.0x
7.0x
Diversified Application Internet Security SaaS IT Infra. eCommerce(1)
19.2%18.5%
15.6%14.4%
9.8%8.6% 8.2%
0.0%
5.0%
10.0%
15.0%
20.0%
25.0%
SaaS Internet Diversified Application(1)
18.0x16.5x
15.2x14.8x 13.3x
12.5x 12.1x
0.0x
4.0x
8.0x
12.0x
16.0x
20.0x
24.0x
SaaS Application Internet eCommerce Diversified IT Infra. Security(1)
38.2%
26.3%
22.4% 22.1%
16.4%15.0%
10.3%
0.0%
8.0%
16.0%
24.0%
32.0%
40.0%
48.0%
Diversified Application Security Internet IT Infra. eCommerce SaaS(1)
34.1x
26.3x25.1x 24.8x 24.8x
22.1x 21.3x
0.0x
8.0x
16.0x
24.0x
32.0x
40.0x
SaaS IT Infra. Security Internet eCommerce Application Diversified(1)
1.84x 1.82x1.62x 1.53x 1.51x
1.40x1.29x
0.0x
0.4x
0.8x
1.2x
1.6x
2.0x
2.4x
Security Diversified Application eCommerce IT Infra. SaaS Internet(1)
Mean
Mean
Mean Mean
Mean
Mean

20
Comparable Public Company Valuation Metrics – Software &
Internet Sector (Cont.)
LTM Gross Margin % 5-Year Net Income Growth %
LTM Sales & Marketing Expense as a % of Revenue LTM R&D Expense as a % of Revenue
Source: S&P Capital IQ. Note: Market Data as of Q1 2016 Quarter End.
Note: Estimates Based on Consensus of Equity Research Analyst Estimates.
Note: CY = Calendar Year, LTM = Last Twelve Months and NTM = Next Twelve Months. (1) IT Infrastructure Management.
79.2%77.9%
74.8%
68.9%
68.6%66.6%
58.0%
55.0%
60.0%
65.0%
70.0%
75.0%
80.0%
85.0%
IT Infra. Security Application Diversified Internet SaaS eCommerce(1)
25.2%24.4%
20.5%
17.8%
17.5%15.5%
12.3%
5.0%
10.0%
15.0%
20.0%
25.0%
30.0%
SaaS Internet eCommerce Security IT Infra. Application Diversified(1)
44.2%
39.2%37.9%
30.2%
26.6%
23.8%
19.4%
14.0%
19.0%
24.0%
29.0%
34.0%
39.0%
44.0%
49.0%
IT Infra. Security SaaS Internet eCommerce Application Diversified(1)
22.0%
19.8%
17.6%17.4% 17.2%
15.0%
9.7%
5.0%
10.0%
15.0%
20.0%
25.0%
IT Infra. Security SaaS Internet Application Diversified eCommerce(1)
LTM G&A Expense as a % of Revenue
17.4%
15.6%
12.8%12.1%
9.5%9.1%
5.6%
0.0%
4.0%
8.0%
12.0%
16.0%
20.0%
SaaS Internet IT Infra. Security eCommerce Application Diversified(1)
Mean
Mean
Mean
Mean
Mean
21
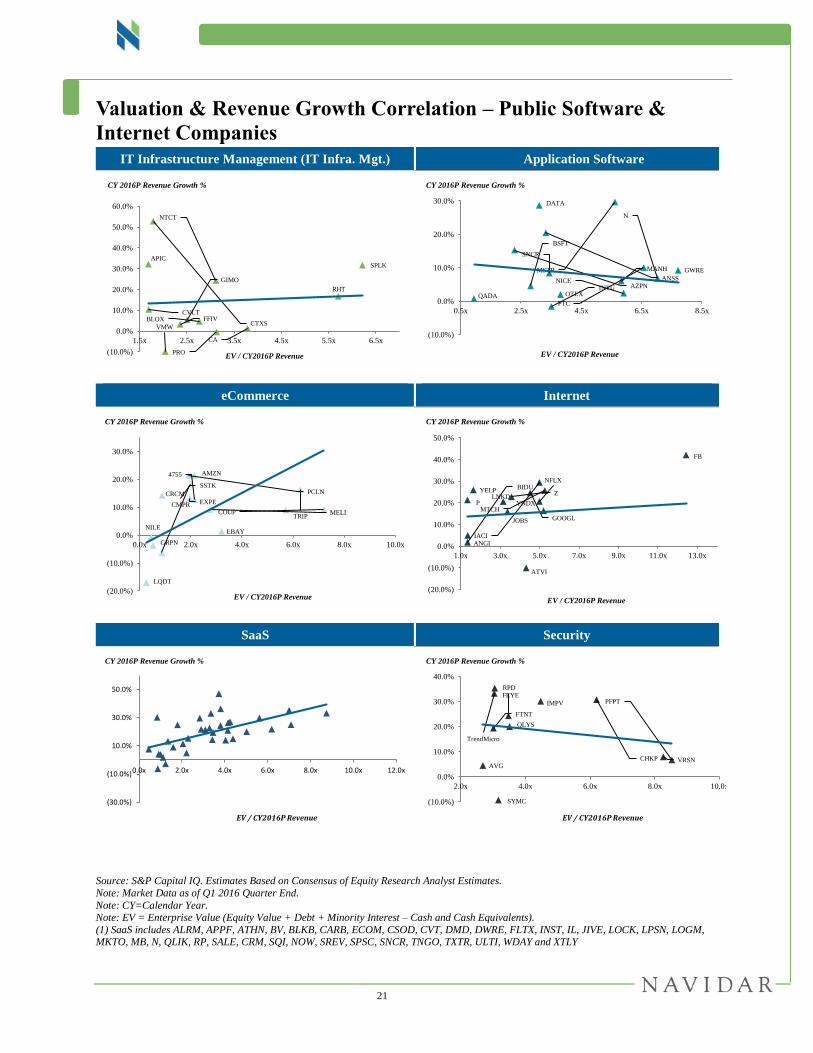
Valuation & Revenue Growth Correlation – Public Software &
Internet Companies
IT Infrastructure Management (IT Infra. Mgt.) Application Software
eCommerce Internet
SaaS Security
Source: S&P Capital IQ. Estimates Based on Consensus of Equity Research Analyst Estimates.
Note: Market Data as of Q1 2016 Quarter End.
Note: CY=Calendar Year. Note: EV = Enterprise Value (Equity Value + Debt + Minority Interest – Cash and Cash Equivalents).
(1) SaaS includes ALRM, APPF, ATHN, BV, BLKB, CARB, ECOM, CSOD, CVT, DMD, DWRE, FLTX, INST, IL, JIVE, LOCK, LPSN, LOGM, MKTO, MB, N, QLIK, RP, SALE, CRM, SQI, NOW, SREV, SPSC, SNCR, TNGO, TXTR, ULTI, WDAY and XTLY
APIC
CVLT
CTXSVMW
FFIV
GIMO
BLOX
NTCT
PRO
CA
RHT
SPLK
(10.0%)
0.0%
10.0%
20.0%
30.0%
40.0%
50.0%
60.0%
1.5x 2.5x 3.5x 4.5x 5.5x 6.5x
EV / CY2016P Revenue
CY 2016P Revenue Growth %
QADA
AZPN
BSFT
DATA
ANSS
SNCR
INTUOTEX
MSTR MANH
NICE
PTC
N
GWRE
(10.0%)
0.0%
10.0%
20.0%
30.0%
0.5x 2.5x 4.5x 6.5x 8.5x
EV / CY2016P Revenue
CY 2016P Revenue Growth %
AMZN
NILE
CRCM
EXPE
EBAY
4755
GRPN
LQDT
COUP MELI
PCLNSSTK
CMPR
TRIP
(20.0%)
(10.0%)
0.0%
10.0%
20.0%
30.0%
0.0x 2.0x 4.0x 6.0x 8.0x 10.0x
EV / CY2016P Revenue
CY 2016P Revenue Growth %
P
BIDU
ANGI
YELPLNKD
JOBS
Z
ATVI
GOOGL
NFLX
IACI
YNDXMTCH
FB
(20.0%)
(10.0%)
0.0%
10.0%
20.0%
30.0%
40.0%
50.0%
1.0x 3.0x 5.0x 7.0x 9.0x 11.0x 13.0x
EV / CY2016P Revenue
CY 2016P Revenue Growth %
(30.0%)
(10.0%)
10.0%
30.0%
50.0%
0.0x 2.0x 4.0x 6.0x 8.0x 10.0x 12.0x
EV / CY2016P Revenue
CY 2016P Revenue Growth %
AVG
FTNT
TrendMicro
FEYE
SYMC
RPD
QLYS
IMPV
CHKP VRSN
PFPT
(10.0%)
0.0%
10.0%
20.0%
30.0%
40.0%
2.0x 4.0x 6.0x 8.0x 10.0x
EV / CY2016P Revenue
CY 2016P Revenue Growth %
22
Appendix

23
Appendix – Comparable Public Company Analysis
Application – Valuation Metrics
Application – Operating Metrics
Source: S&P Capital IQ. Estimates Based on Consensus of Equity Research Analyst Estimates.
Note: Market Data as of Q1 2016 Quarter End. Note: Multiples Excludes Outlier for EV / CY Rev. > 20x, EV / CY EBITDA > 40x, P / E > 60x, and PEG > 3x.
Note: LTM = Last Twelve Months, CY = Calendar Year, PE = Price / Earnings Ratio, PEG = Price-to-Earnings Growth Ratio.
Note: EV = Enterprise Value (Equity Value + Debt + Minority Interest – Cash and Cash Equivalents).
($ in millions, except per share values)
EV / CY Revenue EV / CY EBITDA P / E PEG Ratio
2016P 2017P 2016P 2017P 2016P 2017P 2016P 2017P
Application
Ansys $89.46 91% 1.11x $7,865.1 ($784.6) $7,080.5 7.0x 6.5x 14.0x 12.9x 24.8x 22.7x 1.94x 1.78x
Aspen Technology 36.13 77% 1.24x 3,012.9 (200.6) 2,812.3 5.9x 5.6x 12.8x 11.2x 21.5x 19.1x 1.65x 1.47x
Autodesk 58.31 89% 1.40x 13,090.2 (763.2) 12,327.0 6.2x 5.2x NM NM NM NM NA NA
BroadSoft 40.35 98% 1.49x 1,177.9 (60.1) 1,117.8 3.3x 2.8x 14.9x 11.8x 19.9x 16.3x 1.33x 1.08x
Guidewire Software 54.48 84% 1.29x 3,925.5 (590.9) 3,334.6 7.7x 6.8x 39.8x 25.8x NM 56.2x NA 2.81x
Intuit 104.01 95% 1.31x 26,712.0 911.0 27,623.0 5.8x 5.3x 15.3x 13.2x 28.1x 23.1x 1.62x 1.33x
Manhattan Associates 56.87 73% 1.29x 4,151.4 (128.8) 4,022.7 6.6x 6.0x 19.5x 17.3x 33.3x 29.8x 2.22x 1.98x
MicroStrategy 179.72 79% 1.27x 2,049.7 (485.7) 1,564.1 2.8x 2.6x 8.2x 7.3x 18.2x 16.7x 1.74x 1.59x
NetSuite 68.49 67% 1.32x 5,478.1 (80.8) 5,397.3 5.6x 4.4x NM NM NM NM NA NA
NICE Systems 65.51 94% 1.19x 3,899.7 (425.1) 3,459.5 3.4x 3.2x 12.7x 11.6x 18.9x 17.3x 1.58x 1.44x
OpenText 51.80 89% 1.41x 6,274.5 841.8 7,116.8 3.8x 3.7x 10.5x 9.8x 14.1x 13.1x NM NM
PTC 33.16 78% 1.23x 3,797.9 421.3 4,219.2 3.5x 3.6x 13.0x 12.9x 18.7x 19.9x 1.21x 1.28x
QAD 21.25 74% 1.24x 387.6 (123.1) 264.5 0.9x 0.9x 10.6x 8.1x 31.7x 23.6x NM 2.36x
Sage Group 9.06 100% 1.35x 9,778.0 516.9 10,270.0 4.7x 4.4x 16.0x 14.9x 22.0x 21.6x 2.24x 2.20x
Synchronoss Technologies 32.34 62% 1.59x 1,436.1 29.4 1,526.9 2.3x 2.0x 6.9x 5.8x 13.8x 11.4x 0.66x 0.55x
Tableau Software 45.87 35% 1.25x 3,411.3 (795.9) 2,615.4 3.1x 2.5x 36.6x 19.4x NM NM NA NA
Mean 4.5x 4.1x 16.5x 13.0x 22.1x 22.4x 1.62x 1.66x
Median 4.3x 4.0x 13.5x 12.3x 20.7x 19.9x 1.64x 1.53x
Valuation Metrics
Share Price% of 52-
Week High
Current
Share Price
as a Multiple
of 52-Wk low
Equity Value Net DebtEnterprise
Value
($ in millions, except per share values) Operating Metrics
CY Rev. Growth GM CY EBITDA Margin 5-Yr NI
2016P 2017P LTM 2016P 2017P LTM LTM LTM Growth %
Application
Ansys $89.46 91% 1.11x $7,865.1 ($784.6) $7,080.5 6.8% 8.2% 88.5% 50.3% 50.5% 0.0% 17.9% 0.0% 12.8%
Aspen Technology 36.13 77% 1.24x 3,012.9 (200.6) 2,812.3 2.4% 6.3% 89.3% 46.1% 49.5% 19.8% 15.0% 11.2% 13.0%
Autodesk 58.31 89% 1.40x 13,090.2 (763.2) 12,327.0 (20.1%) 17.5% 85.2% (3.2%) 7.9% 40.6% 31.5% 11.7% 14.5%
BroadSoft 40.35 98% 1.49x 1,177.9 (60.1) 1,117.8 20.5% 17.8% 72.1% 22.3% 24.0% 30.1% 21.8% 14.6% 15.0%
Guidewire Software 54.48 84% 1.29x 3,925.5 (590.9) 3,334.6 9.2% 13.0% 62.8% 19.4% 26.4% 21.8% 25.8% 11.3% 20.0%
Intuit 104.01 95% 1.31x 26,712.0 911.0 27,623.0 6.1% 11.0% 84.0% 38.2% 39.7% 28.9% 18.8% 10.9% 17.3%
Manhattan Associates 56.87 73% 1.29x 4,151.4 (128.8) 4,022.7 10.1% 9.6% 57.7% 33.7% 34.6% 8.7% 9.7% 8.9% 15.0%
MicroStrategy 179.72 79% 1.27x 2,049.7 (485.7) 1,564.1 4.6% 7.4% 80.9% 34.6% 36.1% 28.0% 12.3% 15.2% 10.5%
NetSuite 68.49 67% 1.32x 5,478.1 (80.8) 5,397.3 29.7% 27.1% 66.9% 8.4% 9.2% 52.5% 18.3% 10.5% 23.5%
NICE Systems 65.51 94% 1.19x 3,899.7 (425.1) 3,459.5 8.4% 7.0% 67.2% 27.1% 27.7% 24.4% 13.9% 9.7% 12.0%
OpenText 51.80 89% 1.41x 6,274.5 841.8 7,116.8 2.0% 4.2% 72.5% 36.5% 37.3% 19.8% 10.8% 8.6% 4.1%
PTC 33.16 78% 1.23x 3,797.9 421.3 4,219.2 (1.5%) (2.0%) 73.6% 27.1% 27.8% 27.2% 18.4% 11.1% 15.5%
QAD 21.25 74% 1.24x 387.6 (123.1) 264.5 0.8% 4.9% 54.4% 8.9% 11.1% 23.9% 14.8% 11.8% 10.0%
Sage Group 9.06 100% 1.35x 9,778.0 516.9 10,270.0 NA 7.1% 94.0% 29.4% 29.4% 0.0% 0.0% 0.0% 9.8%
Synchronoss Technologies 32.34 62% 1.59x 1,436.1 29.4 1,526.9 15.3% 15.9% 58.7% 33.1% 34.0% 0.0% 15.8% 0.0% 21.0%
Tableau Software 45.87 35% 1.25x 3,411.3 (795.9) 2,615.4 28.7% 25.9% 88.7% 8.5% 12.7% 54.6% 31.2% 10.9% 33.4%
Mean 8.2% 11.3% 74.8% 26.3% 28.6% 23.8% 17.2% 9.1% 15.5%
Median 6.8% 8.9% 73.1% 28.2% 28.6% 24.2% 16.9% 10.9% 14.8%
Share Price% of 52-
Week High
Current
Share Price
as a Multiple
of 52-Wk low
Equity Value Net DebtEnterprise
Value
S&M Mgn.R&D Mgn.G&A Mgn.
24
Appendix – Comparable Public Company Analysis (Cont.)
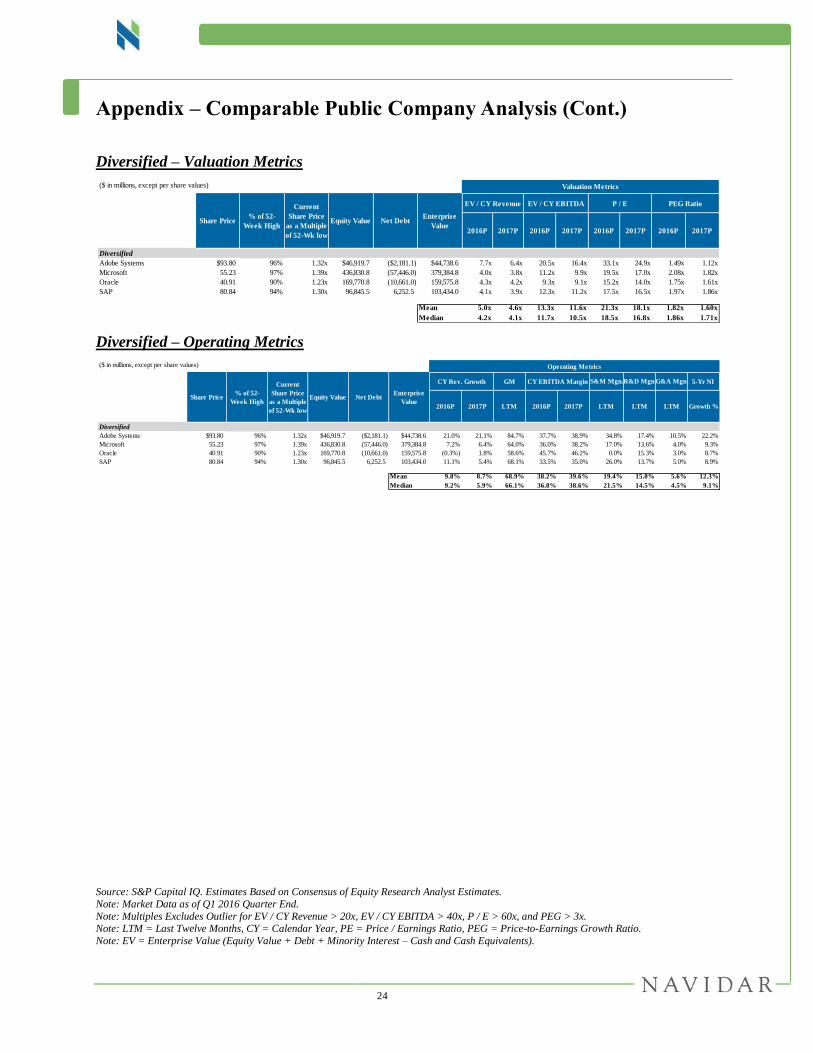
Diversified – Valuation Metrics
Diversified – Operating Metrics
Source: S&P Capital IQ. Estimates Based on Consensus of Equity Research Analyst Estimates.
Note: Market Data as of Q1 2016 Quarter End.
Note: Multiples Excludes Outlier for EV / CY Revenue > 20x, EV / CY EBITDA > 40x, P / E > 60x, and PEG > 3x. Note: LTM = Last Twelve Months, CY = Calendar Year, PE = Price / Earnings Ratio, PEG = Price-to-Earnings Growth Ratio.
Note: EV = Enterprise Value (Equity Value + Debt + Minority Interest – Cash and Cash Equivalents).
($ in millions, except per share values)
EV / CY Revenue EV / CY EBITDA P / E PEG Ratio
2016P 2017P 2016P 2017P 2016P 2017P 2016P 2017P
Diversified
Adobe Systems $93.80 96% 1.32x $46,919.7 ($2,181.1) $44,738.6 7.7x 6.4x 20.5x 16.4x 33.1x 24.9x 1.49x 1.12x
Microsoft 55.23 97% 1.39x 436,830.8 (57,446.0) 379,384.8 4.0x 3.8x 11.2x 9.9x 19.5x 17.0x 2.08x 1.82x
Oracle 40.91 90% 1.23x 169,770.8 (10,661.0) 159,575.8 4.3x 4.2x 9.3x 9.1x 15.2x 14.0x 1.75x 1.61x
SAP 80.84 94% 1.30x 96,845.5 6,252.5 103,434.0 4.1x 3.9x 12.3x 11.2x 17.5x 16.5x 1.97x 1.86x
Mean 5.0x 4.6x 13.3x 11.6x 21.3x 18.1x 1.82x 1.60x
Median 4.2x 4.1x 11.7x 10.5x 18.5x 16.8x 1.86x 1.71x
Valuation Metrics
Share Price% of 52-
Week High
Current
Share Price
as a Multiple
of 52-Wk low
Equity Value Net DebtEnterprise
Value
($ in millions, except per share values) Operating Metrics
CY Rev. Growth GM CY EBITDA Margin 5-Yr NI
2016P 2017P LTM 2016P 2017P LTM LTM LTM Growth %
Diversified
Adobe Systems $93.80 96% 1.32x $46,919.7 ($2,181.1) $44,738.6 21.0% 21.1% 84.7% 37.7% 38.9% 34.8% 17.4% 10.5% 22.2%
Microsoft 55.23 97% 1.39x 436,830.8 (57,446.0) 379,384.8 7.2% 6.4% 64.0% 36.0% 38.2% 17.0% 13.6% 4.0% 9.3%
Oracle 40.91 90% 1.23x 169,770.8 (10,661.0) 159,575.8 (0.3%) 1.8% 58.6% 45.7% 46.2% 0.0% 15.3% 3.0% 8.7%
SAP 80.84 94% 1.30x 96,845.5 6,252.5 103,434.0 11.1% 5.4% 68.1% 33.5% 35.0% 26.0% 13.7% 5.0% 8.9%
Mean 9.8% 8.7% 68.9% 38.2% 39.6% 19.4% 15.0% 5.6% 12.3%
Median 9.2% 5.9% 66.1% 36.8% 38.6% 21.5% 14.5% 4.5% 9.1%
Share Price% of 52-
Week High
Current
Share Price
as a Multiple
of 52-Wk low
Equity Value Net DebtEnterprise
Value
S&M Mgn.R&D Mgn.G&A Mgn.
25
Appendix – Comparable Public Company Analysis (Cont.)
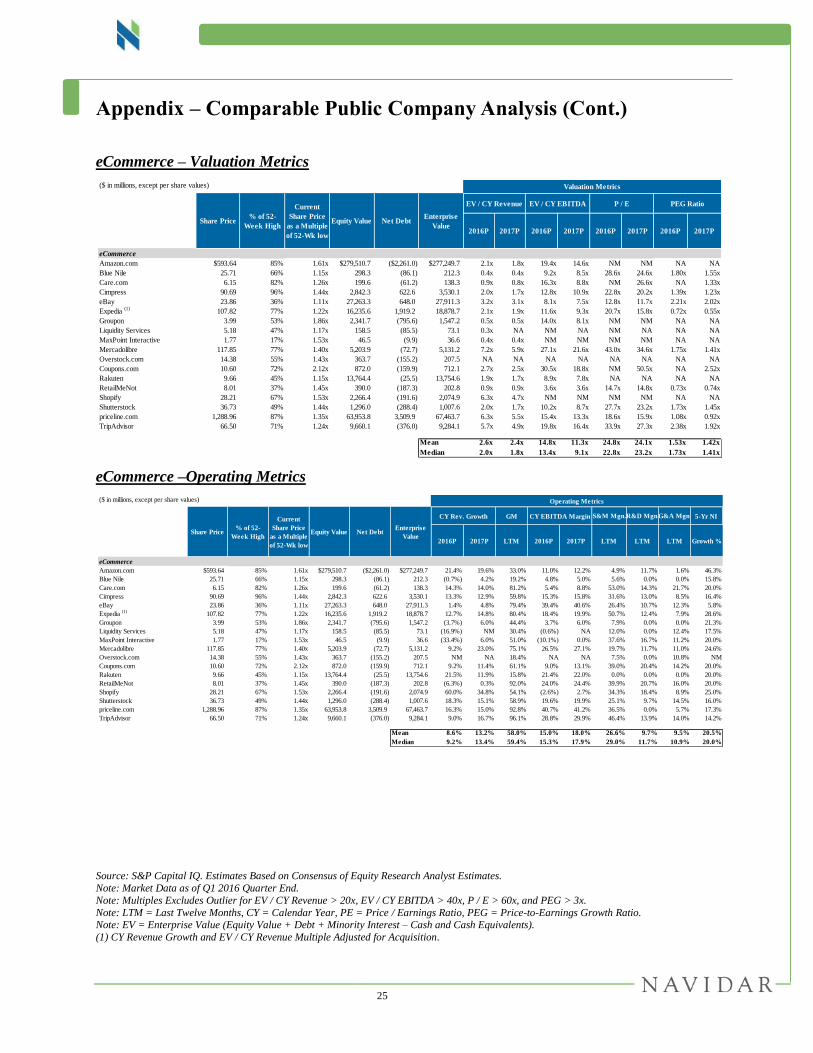
eCommerce – Valuation Metrics
eCommerce –Operating Metrics
Source: S&P Capital IQ. Estimates Based on Consensus of Equity Research Analyst Estimates.
Note: Market Data as of Q1 2016 Quarter End.
Note: Multiples Excludes Outlier for EV / CY Revenue > 20x, EV / CY EBITDA > 40x, P / E > 60x, and PEG > 3x.
Note: LTM = Last Twelve Months, CY = Calendar Year, PE = Price / Earnings Ratio, PEG = Price-to-Earnings Growth Ratio. Note: EV = Enterprise Value (Equity Value + Debt + Minority Interest – Cash and Cash Equivalents).
(1) CY Revenue Growth and EV / CY Revenue Multiple Adjusted for Acquisition.
($ in millions, except per share values)
EV / CY Revenue EV / CY EBITDA P / E PEG Ratio
2016P 2017P 2016P 2017P 2016P 2017P 2016P 2017P
eCommerce
Amazon.com $593.64 85% 1.61x $279,510.7 ($2,261.0) $277,249.7 2.1x 1.8x 19.4x 14.6x NM NM NA NA
Blue Nile 25.71 66% 1.15x 298.3 (86.1) 212.3 0.4x 0.4x 9.2x 8.5x 28.6x 24.6x 1.80x 1.55x
Care.com 6.15 82% 1.26x 199.6 (61.2) 138.3 0.9x 0.8x 16.3x 8.8x NM 26.6x NA 1.33x
Cimpress 90.69 96% 1.44x 2,842.3 622.6 3,530.1 2.0x 1.7x 12.8x 10.9x 22.8x 20.2x 1.39x 1.23x
eBay 23.86 36% 1.11x 27,263.3 648.0 27,911.3 3.2x 3.1x 8.1x 7.5x 12.8x 11.7x 2.21x 2.02x
Expedia (1)
107.82 77% 1.22x 16,235.6 1,919.2 18,878.7 2.1x 1.9x 11.6x 9.3x 20.7x 15.8x 0.72x 0.55x
Groupon 3.99 53% 1.86x 2,341.7 (795.6) 1,547.2 0.5x 0.5x 14.0x 8.1x NM NM NA NA
Liquidity Services 5.18 47% 1.17x 158.5 (85.5) 73.1 0.3x NA NM NA NM NA NA NA
MaxPoint Interactive 1.77 17% 1.53x 46.5 (9.9) 36.6 0.4x 0.4x NM NM NM NM NA NA
Mercadolibre 117.85 77% 1.40x 5,203.9 (72.7) 5,131.2 7.2x 5.9x 27.1x 21.6x 43.0x 34.6x 1.75x 1.41x
Overstock.com 14.38 55% 1.43x 363.7 (155.2) 207.5 NA NA NA NA NA NA NA NA
Coupons.com 10.60 72% 2.12x 872.0 (159.9) 712.1 2.7x 2.5x 30.5x 18.8x NM 50.5x NA 2.52x
Rakuten 9.66 45% 1.15x 13,764.4 (25.5) 13,754.6 1.9x 1.7x 8.9x 7.8x NA NA NA NA
RetailMeNot 8.01 37% 1.45x 390.0 (187.3) 202.8 0.9x 0.9x 3.6x 3.6x 14.7x 14.8x 0.73x 0.74x
Shopify 28.21 67% 1.53x 2,266.4 (191.6) 2,074.9 6.3x 4.7x NM NM NM NM NA NA
Shutterstock 36.73 49% 1.44x 1,296.0 (288.4) 1,007.6 2.0x 1.7x 10.2x 8.7x 27.7x 23.2x 1.73x 1.45x
priceline.com 1,288.96 87% 1.35x 63,953.8 3,509.9 67,463.7 6.3x 5.5x 15.4x 13.3x 18.6x 15.9x 1.08x 0.92x
TripAdvisor 66.50 71% 1.24x 9,660.1 (376.0) 9,284.1 5.7x 4.9x 19.8x 16.4x 33.9x 27.3x 2.38x 1.92x
Mean 2.6x 2.4x 14.8x 11.3x 24.8x 24.1x 1.53x 1.42x
Median 2.0x 1.8x 13.4x 9.1x 22.8x 23.2x 1.73x 1.41x
Valuation Metrics
Share Price% of 52-
Week High
Current
Share Price
as a Multiple
of 52-Wk low
Equity Value Net DebtEnterprise
Value
($ in millions, except per share values) Operating Metrics
CY Rev. Growth GM CY EBITDA Margin 5-Yr NI
2016P 2017P LTM 2016P 2017P LTM LTM LTM Growth %
eCommerce
Amazon.com $593.64 85% 1.61x $279,510.7 ($2,261.0) $277,249.7 21.4% 19.6% 33.0% 11.0% 12.2% 4.9% 11.7% 1.6% 46.3%
Blue Nile 25.71 66% 1.15x 298.3 (86.1) 212.3 (0.7%) 4.2% 19.2% 4.8% 5.0% 5.6% 0.0% 0.0% 15.8%
Care.com 6.15 82% 1.26x 199.6 (61.2) 138.3 14.3% 14.0% 81.2% 5.4% 8.8% 53.0% 14.3% 21.7% 20.0%
Cimpress 90.69 96% 1.44x 2,842.3 622.6 3,530.1 13.3% 12.9% 59.8% 15.3% 15.8% 31.6% 13.0% 8.5% 16.4%
eBay 23.86 36% 1.11x 27,263.3 648.0 27,911.3 1.4% 4.8% 79.4% 39.4% 40.6% 26.4% 10.7% 12.3% 5.8%
Expedia (1)
107.82 77% 1.22x 16,235.6 1,919.2 18,878.7 12.7% 14.8% 80.4% 18.4% 19.9% 50.7% 12.4% 7.9% 28.6%
Groupon 3.99 53% 1.86x 2,341.7 (795.6) 1,547.2 (3.7%) 6.0% 44.4% 3.7% 6.0% 7.9% 0.0% 0.0% 21.3%
Liquidity Services 5.18 47% 1.17x 158.5 (85.5) 73.1 (16.9%) NM 30.4% (0.6%) NA 12.0% 0.0% 12.4% 17.5%
MaxPoint Interactive 1.77 17% 1.53x 46.5 (9.9) 36.6 (33.4%) 6.0% 51.0% (10.1%) 0.0% 37.6% 16.7% 11.2% 20.0%
Mercadolibre 117.85 77% 1.40x 5,203.9 (72.7) 5,131.2 9.2% 23.0% 75.1% 26.5% 27.1% 19.7% 11.7% 11.0% 24.6%
Overstock.com 14.38 55% 1.43x 363.7 (155.2) 207.5 NM NA 18.4% NA NA 7.5% 0.0% 10.8% NM
Coupons.com 10.60 72% 2.12x 872.0 (159.9) 712.1 9.2% 11.4% 61.1% 9.0% 13.1% 39.0% 20.4% 14.2% 20.0%
Rakuten 9.66 45% 1.15x 13,764.4 (25.5) 13,754.6 21.5% 11.9% 15.8% 21.4% 22.0% 0.0% 0.0% 0.0% 20.0%
RetailMeNot 8.01 37% 1.45x 390.0 (187.3) 202.8 (6.3%) 0.3% 92.0% 24.0% 24.4% 39.9% 20.7% 16.0% 20.0%
Shopify 28.21 67% 1.53x 2,266.4 (191.6) 2,074.9 60.0% 34.8% 54.1% (2.6%) 2.7% 34.3% 18.4% 8.9% 25.0%
Shutterstock 36.73 49% 1.44x 1,296.0 (288.4) 1,007.6 18.3% 15.1% 58.9% 19.6% 19.9% 25.1% 9.7% 14.5% 16.0%
priceline.com 1,288.96 87% 1.35x 63,953.8 3,509.9 67,463.7 16.3% 15.0% 92.8% 40.7% 41.2% 36.5% 0.0% 5.7% 17.3%
TripAdvisor 66.50 71% 1.24x 9,660.1 (376.0) 9,284.1 9.0% 16.7% 96.1% 28.8% 29.9% 46.4% 13.9% 14.0% 14.2%
Mean 8.6% 13.2% 58.0% 15.0% 18.0% 26.6% 9.7% 9.5% 20.5%
Median 9.2% 13.4% 59.4% 15.3% 17.9% 29.0% 11.7% 10.9% 20.0%
Share Price% of 52-
Week High
Current
Share Price
as a Multiple
of 52-Wk low
Equity Value Net DebtEnterprise
Value
S&M Mgn.R&D Mgn.G&A Mgn.
26
Appendix – Comparable Public Company Analysis (Cont.)
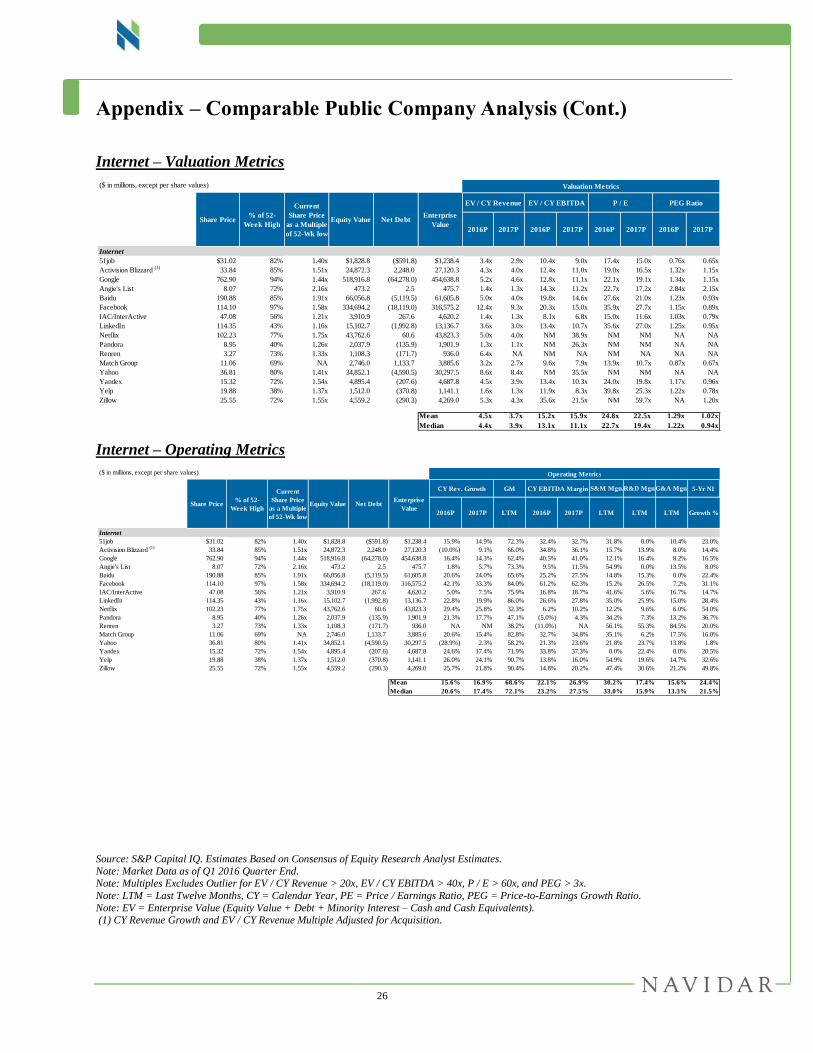
Internet – Valuation Metrics
Internet – Operating Metrics
Source: S&P Capital IQ. Estimates Based on Consensus of Equity Research Analyst Estimates.
Note: Market Data as of Q1 2016 Quarter End. Note: Multiples Excludes Outlier for EV / CY Revenue > 20x, EV / CY EBITDA > 40x, P / E > 60x, and PEG > 3x.
Note: LTM = Last Twelve Months, CY = Calendar Year, PE = Price / Earnings Ratio, PEG = Price-to-Earnings Growth Ratio.
Note: EV = Enterprise Value (Equity Value + Debt + Minority Interest – Cash and Cash Equivalents). (1) CY Revenue Growth and EV / CY Revenue Multiple Adjusted for Acquisition.
($ in millions, except per share values)
EV / CY Revenue EV / CY EBITDA P / E PEG Ratio
2016P 2017P 2016P 2017P 2016P 2017P 2016P 2017P
Internet
51job $31.02 82% 1.40x $1,828.8 ($591.8) $1,238.4 3.4x 2.9x 10.4x 9.0x 17.4x 15.0x 0.76x 0.65x
Activision Blizzard (1)
33.84 85% 1.51x 24,872.3 2,248.0 27,120.3 4.3x 4.0x 12.4x 11.0x 19.0x 16.5x 1.32x 1.15x
Google 762.90 94% 1.44x 518,916.8 (64,278.0) 454,638.8 5.2x 4.6x 12.8x 11.1x 22.1x 19.1x 1.34x 1.15x
Angie's List 8.07 72% 2.16x 473.2 2.5 475.7 1.4x 1.3x 14.3x 11.2x 22.7x 17.2x 2.84x 2.15x
Baidu 190.88 85% 1.91x 66,056.8 (5,119.5) 61,605.8 5.0x 4.0x 19.8x 14.6x 27.6x 21.0x 1.23x 0.93x
Facebook 114.10 97% 1.58x 334,694.2 (18,119.0) 316,575.2 12.4x 9.3x 20.3x 15.0x 35.9x 27.7x 1.15x 0.89x
IAC/InterActive 47.08 56% 1.21x 3,910.9 267.6 4,620.2 1.4x 1.3x 8.1x 6.8x 15.0x 11.6x 1.03x 0.79x
LinkedIn 114.35 43% 1.16x 15,102.7 (1,992.8) 13,136.7 3.6x 3.0x 13.4x 10.7x 35.6x 27.0x 1.25x 0.95x
Netflix 102.23 77% 1.75x 43,762.6 60.6 43,823.3 5.0x 4.0x NM 38.9x NM NM NA NA
Pandora 8.95 40% 1.26x 2,037.9 (135.9) 1,901.9 1.3x 1.1x NM 26.3x NM NM NA NA
Renren 3.27 73% 1.33x 1,108.3 (171.7) 936.0 6.4x NA NM NA NM NA NA NA
Match Group 11.06 69% NA 2,746.0 1,133.7 3,885.6 3.2x 2.7x 9.6x 7.9x 13.9x 10.7x 0.87x 0.67x
Yahoo 36.81 80% 1.41x 34,852.1 (4,590.5) 30,297.5 8.6x 8.4x NM 35.5x NM NM NA NA
Yandex 15.32 72% 1.54x 4,895.4 (207.6) 4,687.8 4.5x 3.9x 13.4x 10.3x 24.0x 19.8x 1.17x 0.96x
Yelp 19.88 38% 1.37x 1,512.0 (370.8) 1,141.1 1.6x 1.3x 11.9x 8.3x 39.8x 25.3x 1.22x 0.78x
Zillow 25.55 72% 1.55x 4,559.2 (290.3) 4,269.0 5.3x 4.3x 35.6x 21.5x NM 59.7x NA 1.20x
Mean 4.5x 3.7x 15.2x 15.9x 24.8x 22.5x 1.29x 1.02x
Median 4.4x 3.9x 13.1x 11.1x 22.7x 19.4x 1.22x 0.94x
Valuation Metrics
Share Price% of 52-
Week High
Current
Share Price
as a Multiple
of 52-Wk low
Equity Value Net DebtEnterprise
Value
($ in millions, except per share values) Operating Metrics
CY Rev. Growth GM CY EBITDA Margin 5-Yr NI
2016P 2017P LTM 2016P 2017P LTM LTM LTM Growth %
Internet
51job $31.02 82% 1.40x $1,828.8 ($591.8) $1,238.4 15.9% 14.9% 72.3% 32.4% 32.7% 31.8% 0.0% 10.4% 23.0%
Activision Blizzard (1)
33.84 85% 1.51x 24,872.3 2,248.0 27,120.3 (10.0%) 9.1% 66.0% 34.8% 36.1% 15.7% 13.9% 8.0% 14.4%
Google 762.90 94% 1.44x 518,916.8 (64,278.0) 454,638.8 16.4% 14.3% 62.4% 40.5% 41.0% 12.1% 16.4% 8.2% 16.5%
Angie's List 8.07 72% 2.16x 473.2 2.5 475.7 1.8% 5.7% 73.3% 9.5% 11.5% 54.9% 0.0% 13.5% 8.0%
Baidu 190.88 85% 1.91x 66,056.8 (5,119.5) 61,605.8 20.6% 24.0% 65.6% 25.2% 27.5% 14.8% 15.3% 0.0% 22.4%
Facebook 114.10 97% 1.58x 334,694.2 (18,119.0) 316,575.2 42.1% 33.3% 84.0% 61.2% 62.3% 15.2% 26.5% 7.2% 31.1%
IAC/InterActive 47.08 56% 1.21x 3,910.9 267.6 4,620.2 5.0% 7.5% 75.9% 16.8% 18.7% 41.6% 5.6% 16.7% 14.7%
LinkedIn 114.35 43% 1.16x 15,102.7 (1,992.8) 13,136.7 22.8% 19.9% 86.0% 26.6% 27.8% 35.0% 25.9% 15.0% 28.4%
Netflix 102.23 77% 1.75x 43,762.6 60.6 43,823.3 29.4% 25.8% 32.3% 6.2% 10.2% 12.2% 9.6% 6.0% 54.0%
Pandora 8.95 40% 1.26x 2,037.9 (135.9) 1,901.9 21.3% 17.7% 47.1% (5.0%) 4.3% 34.2% 7.3% 13.2% 36.7%
Renren 3.27 73% 1.33x 1,108.3 (171.7) 936.0 NA NM 38.2% (11.0%) NA 56.1% 55.3% 84.5% 20.0%
Match Group 11.06 69% NA 2,746.0 1,133.7 3,885.6 20.6% 15.4% 82.8% 32.7% 34.8% 35.1% 6.2% 17.5% 16.0%
Yahoo 36.81 80% 1.41x 34,852.1 (4,590.5) 30,297.5 (28.9%) 2.3% 58.2% 21.3% 23.6% 21.8% 23.7% 13.8% 1.8%
Yandex 15.32 72% 1.54x 4,895.4 (207.6) 4,687.8 24.6% 17.4% 71.9% 33.8% 37.3% 0.0% 22.4% 0.0% 20.5%
Yelp 19.88 38% 1.37x 1,512.0 (370.8) 1,141.1 26.0% 24.1% 90.7% 13.8% 16.0% 54.9% 19.6% 14.7% 32.6%
Zillow 25.55 72% 1.55x 4,559.2 (290.3) 4,269.0 25.7% 21.8% 90.4% 14.8% 20.2% 47.4% 30.6% 21.2% 49.8%
Mean 15.6% 16.9% 68.6% 22.1% 26.9% 30.2% 17.4% 15.6% 24.4%
Median 20.6% 17.4% 72.1% 23.2% 27.5% 33.0% 15.9% 13.3% 21.5%
Share Price% of 52-
Week High
Current
Share Price
as a Multiple
of 52-Wk low
Equity Value Net DebtEnterprise
Value
S&M Mgn.R&D Mgn.G&A Mgn.
27
Appendix – Comparable Public Company Analysis (Cont.)
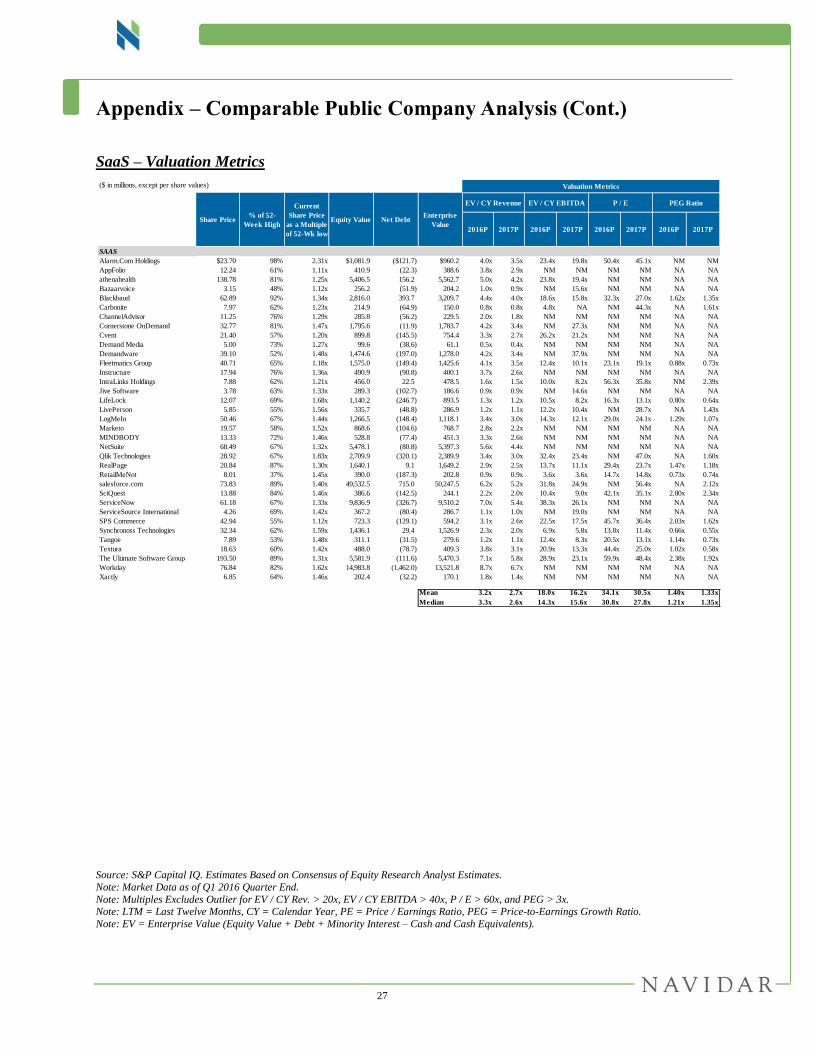
SaaS – Valuation Metrics
Source: S&P Capital IQ. Estimates Based on Consensus of Equity Research Analyst Estimates.
Note: Market Data as of Q1 2016 Quarter End.
Note: Multiples Excludes Outlier for EV / CY Rev. > 20x, EV / CY EBITDA > 40x, P / E > 60x, and PEG > 3x. Note: LTM = Last Twelve Months, CY = Calendar Year, PE = Price / Earnings Ratio, PEG = Price-to-Earnings Growth Ratio.
Note: EV = Enterprise Value (Equity Value + Debt + Minority Interest – Cash and Cash Equivalents).
($ in millions, except per share values)
EV / CY Revenue EV / CY EBITDA P / E PEG Ratio
2016P 2017P 2016P 2017P 2016P 2017P 2016P 2017P
SAAS
Alarm.Com Holdings $23.70 98% 2.31x $1,081.9 ($121.7) $960.2 4.0x 3.5x 23.4x 19.8x 50.4x 45.1x NM NM
AppFolio 12.24 61% 1.11x 410.9 (22.3) 388.6 3.8x 2.9x NM NM NM NM NA NA
athenahealth 138.78 81% 1.25x 5,406.5 156.2 5,562.7 5.0x 4.2x 23.8x 19.4x NM NM NA NA
Bazaarvoice 3.15 48% 1.12x 256.2 (51.9) 204.2 1.0x 0.9x NM 15.6x NM NM NA NA
Blackbaud 62.89 92% 1.34x 2,816.0 393.7 3,209.7 4.4x 4.0x 18.6x 15.8x 32.3x 27.0x 1.62x 1.35x
Carbonite 7.97 62% 1.23x 214.9 (64.9) 150.0 0.8x 0.8x 4.8x NA NM 44.3x NA 1.61x
ChannelAdvisor 11.25 76% 1.29x 285.8 (56.2) 229.5 2.0x 1.8x NM NM NM NM NA NA
Cornerstone OnDemand 32.77 81% 1.47x 1,795.6 (11.9) 1,783.7 4.2x 3.4x NM 27.3x NM NM NA NA
Cvent 21.40 57% 1.20x 899.8 (145.5) 754.4 3.3x 2.7x 26.2x 21.2x NM NM NA NA
Demand Media 5.00 73% 1.27x 99.6 (38.6) 61.1 0.5x 0.4x NM NM NM NM NA NA
Demandware 39.10 52% 1.48x 1,474.6 (197.0) 1,278.0 4.2x 3.4x NM 37.9x NM NM NA NA
Fleetmatics Group 40.71 65% 1.18x 1,575.0 (149.4) 1,425.6 4.1x 3.5x 12.4x 10.1x 23.1x 19.1x 0.88x 0.73x
Instructure 17.94 76% 1.36x 490.9 (90.8) 400.1 3.7x 2.6x NM NM NM NM NA NA
IntraLinks Holdings 7.88 62% 1.21x 456.0 22.5 478.5 1.6x 1.5x 10.0x 8.2x 56.3x 35.8x NM 2.39x
Jive Software 3.78 63% 1.33x 289.3 (102.7) 186.6 0.9x 0.9x NM 14.6x NM NM NA NA
LifeLock 12.07 69% 1.68x 1,140.2 (246.7) 893.5 1.3x 1.2x 10.5x 8.2x 16.3x 13.1x 0.80x 0.64x
LivePerson 5.85 55% 1.56x 335.7 (48.8) 286.9 1.2x 1.1x 12.2x 10.4x NM 28.7x NA 1.43x
LogMeIn 50.46 67% 1.44x 1,266.5 (148.4) 1,118.1 3.4x 3.0x 14.3x 12.1x 29.0x 24.1x 1.29x 1.07x
Marketo 19.57 58% 1.52x 868.6 (104.6) 768.7 2.8x 2.2x NM NM NM NM NA NA
MINDBODY 13.33 72% 1.46x 528.8 (77.4) 451.3 3.3x 2.6x NM NM NM NM NA NA
NetSuite 68.49 67% 1.32x 5,478.1 (80.8) 5,397.3 5.6x 4.4x NM NM NM NM NA NA
Qlik Technologies 28.92 67% 1.83x 2,709.9 (320.1) 2,389.9 3.4x 3.0x 32.4x 23.4x NM 47.0x NA 1.60x
RealPage 20.84 87% 1.30x 1,640.1 9.1 1,649.2 2.9x 2.5x 13.7x 11.1x 29.4x 23.7x 1.47x 1.18x
RetailMeNot 8.01 37% 1.45x 390.0 (187.3) 202.8 0.9x 0.9x 3.6x 3.6x 14.7x 14.8x 0.73x 0.74x
salesforce.com 73.83 89% 1.40x 49,532.5 715.0 50,247.5 6.2x 5.2x 31.8x 24.9x NM 56.4x NA 2.12x
SciQuest 13.88 84% 1.46x 386.6 (142.5) 244.1 2.2x 2.0x 10.4x 9.0x 42.1x 35.1x 2.80x 2.34x
ServiceNow 61.18 67% 1.33x 9,836.9 (326.7) 9,510.2 7.0x 5.4x 38.3x 26.1x NM NM NA NA
ServiceSource International 4.26 69% 1.42x 367.2 (80.4) 286.7 1.1x 1.0x NM 19.0x NM NM NA NA
SPS Commerce 42.94 55% 1.12x 723.3 (129.1) 594.2 3.1x 2.6x 22.5x 17.5x 45.7x 36.4x 2.03x 1.62x
Synchronoss Technologies 32.34 62% 1.59x 1,436.1 29.4 1,526.9 2.3x 2.0x 6.9x 5.8x 13.8x 11.4x 0.66x 0.55x
Tangoe 7.89 53% 1.48x 311.1 (31.5) 279.6 1.2x 1.1x 12.4x 8.3x 20.5x 13.1x 1.14x 0.73x
Textura 18.63 60% 1.42x 488.0 (78.7) 409.3 3.8x 3.1x 20.9x 13.3x 44.4x 25.0x 1.02x 0.58x
The Ultimate Software Group 193.50 89% 1.31x 5,581.9 (111.6) 5,470.3 7.1x 5.8x 28.9x 23.1x 59.9x 48.4x 2.38x 1.92x
Workday 76.84 82% 1.62x 14,983.8 (1,462.0) 13,521.8 8.7x 6.7x NM NM NM NM NA NA
Xactly 6.85 64% 1.46x 202.4 (32.2) 170.1 1.8x 1.4x NM NM NM NM NA NA
Mean 3.2x 2.7x 18.0x 16.2x 34.1x 30.5x 1.40x 1.33x
Median 3.3x 2.6x 14.3x 15.6x 30.8x 27.8x 1.21x 1.35x
Valuation Metrics
Share Price% of 52-
Week High
Current
Share Price
as a Multiple
of 52-Wk low
Equity Value Net DebtEnterprise
Value

28
Appendix – Comparable Public Company Analysis (Cont.)
SaaS – Operating Metrics
Source: S&P Capital IQ. Estimates Based on Consensus of Equity Research Analyst Estimates.
Note: Market Data as of Q1 2016 Quarter End.
Note: Multiples Excludes Outlier for EV / CY Rev. > 20x, EV / CY EBITDA > 40x, P / E > 60x, and PEG > 3x.
Note: LTM = Last Twelve Months, CY = Calendar Year, PE = Price / Earnings Ratio, PEG = Price-to-Earnings Growth Ratio. Note: EV = Enterprise Value (Equity Value + Debt + Minority Interest – Cash and Cash Equivalents).
($ in millions, except per share values) Operating Metrics
CY Rev. Growth GM CY EBITDA Margin 5-Yr NI
2016P 2017P LTM 2016P 2017P LTM LTM LTM Growth %
SAAS
Alarm.Com Holdings $23.70 98% 2.31x $1,081.9 ($121.7) $960.2 13.9% 14.5% 63.0% 17.3% 17.8% 15.4% 19.1% 11.2% 14.1%
AppFolio 12.24 61% 1.11x 410.9 (22.3) 388.6 36.2% 33.2% 54.8% (4.7%) 1.7% 34.8% 12.7% 18.7% 30.0%
athenahealth 138.78 81% 1.25x 5,406.5 156.2 5,562.7 19.9% 19.6% 60.4% 21.1% 21.6% 24.9% 10.2% 15.6% 24.3%
Bazaarvoice 3.15 48% 1.12x 256.2 (51.9) 204.2 3.9% 6.1% 61.6% 1.6% 6.0% 36.6% 20.8% 16.0% NM
Blackbaud 62.89 92% 1.34x 2,816.0 393.7 3,209.7 14.9% 9.4% 52.5% 23.6% 25.3% 19.4% 13.3% 11.0% 20.0%
Carbonite 7.97 62% 1.23x 214.9 (64.9) 150.0 30.1% 2.4% 71.6% 17.5% NA 39.3% 20.6% 27.3% 27.5%
ChannelAdvisor 11.25 76% 1.29x 285.8 (56.2) 229.5 11.3% 15.6% 79.3% 1.9% 3.9% 51.6% 16.0% 22.2% 25.0%
Cornerstone OnDemand 32.77 81% 1.47x 1,795.6 (11.9) 1,783.7 26.5% 23.7% 67.7% 8.6% 12.3% 61.0% 12.1% 14.7% 20.0%
Cvent 21.40 57% 1.20x 899.8 (145.5) 754.4 22.5% 21.9% 68.2% 12.5% 12.7% 41.5% 11.7% 18.4% NM
Demand Media 5.00 73% 1.27x 99.6 (38.6) 61.1 7.6% 13.6% 44.1% (4.2%) (1.4%) 16.1% 18.4% 30.1% NM
Demandware 39.10 52% 1.48x 1,474.6 (197.0) 1,278.0 26.9% 26.2% 71.6% 8.2% 8.9% 42.5% 27.5% 19.4% 38.5%
Fleetmatics Group 40.71 65% 1.18x 1,575.0 (149.4) 1,425.6 20.9% 17.8% 74.3% 33.5% 34.7% 34.0% 7.5% 18.9% 26.1%
Instructure 17.94 76% 1.36x 490.9 (90.8) 400.1 46.8% 43.4% 67.1% (45.8%) (24.1%) 73.0% 33.0% 30.3% 40.0%
IntraLinks Holdings 7.88 62% 1.21x 456.0 22.5 478.5 9.0% 9.4% 72.5% 15.9% 17.8% 44.9% 9.3% 26.6% 15.0%
Jive Software 3.78 63% 1.33x 289.3 (102.7) 186.6 4.1% 4.0% 63.1% 1.9% 6.0% 40.2% 27.0% 13.6% NM
LifeLock 12.07 69% 1.68x 1,140.2 (246.7) 893.5 13.2% 14.5% 76.6% 12.9% 14.4% 46.5% 11.8% 12.3% 20.4%
LivePerson 5.85 55% 1.56x 335.7 (48.8) 286.9 (2.8%) 8.2% 70.6% 10.1% 11.0% 39.6% 16.3% 13.9% 20.0%
LogMeIn 50.46 67% 1.44x 1,266.5 (148.4) 1,118.1 19.3% 15.3% 86.9% 24.1% 24.7% 51.2% 15.7% 11.7% 22.5%
Marketo 19.57 58% 1.52x 868.6 (104.6) 768.7 29.6% 26.5% 65.6% (2.7%) 1.7% 61.5% 18.6% 18.1% 21.2%
MINDBODY 13.33 72% 1.46x 528.8 (77.4) 451.3 33.0% 28.4% 63.3% (11.7%) (1.3%) 45.7% 22.7% 29.0% NM
NetSuite 68.49 67% 1.32x 5,478.1 (80.8) 5,397.3 29.7% 27.1% 66.9% 8.4% 9.2% 52.5% 18.3% 10.5% 23.5%
Qlik Technologies 28.92 67% 1.83x 2,709.9 (320.1) 2,389.9 14.2% 14.2% 85.2% 10.6% 12.8% 56.7% 12.2% 18.2% 29.4%
RealPage 20.84 87% 1.30x 1,640.1 9.1 1,649.2 21.7% 15.1% 57.6% 21.2% 22.7% 26.3% 14.4% 14.8% 20.0%
RetailMeNot 8.01 37% 1.45x 390.0 (187.3) 202.8 (6.3%) 0.3% 92.0% 24.0% 24.4% 39.9% 20.7% 16.0% 20.0%
salesforce.com 73.83 89% 1.40x 49,532.5 715.0 50,247.5 21.8% 19.8% 75.2% 19.5% 20.8% 48.6% 14.2% 11.2% 26.6%
SciQuest 13.88 84% 1.46x 386.6 (142.5) 244.1 4.9% 9.4% 68.1% 21.3% 22.3% 25.6% 25.9% 11.7% 15.0%
ServiceNow 61.18 67% 1.33x 9,836.9 (326.7) 9,510.2 35.1% 30.0% 67.2% 18.3% 20.7% 49.6% 21.6% 12.6% 41.2%
ServiceSource International 4.26 69% 1.42x 367.2 (80.4) 286.7 1.7% 9.3% 32.1% 1.7% 5.4% 17.5% 6.5% 18.4% NM
SPS Commerce 42.94 55% 1.12x 723.3 (129.1) 594.2 21.4% 18.8% 68.4% 13.7% 14.9% 34.9% 11.3% 15.7% 22.5%
Synchronoss Technologies 32.34 62% 1.59x 1,436.1 29.4 1,526.9 15.3% 15.9% 58.7% 33.1% 34.0% 0.0% 15.8% 0.0% 21.0%
Tangoe 7.89 53% 1.48x 311.1 (31.5) 279.6 NA 8.3% 54.1% 9.4% 12.9% 19.2% 11.8% 16.0% 18.0%
Textura 18.63 60% 1.42x 488.0 (78.7) 409.3 24.4% 21.5% 82.4% 18.1% 23.5% 24.2% 23.5% 42.3% 43.3%
The Ultimate Software Group 193.50 89% 1.31x 5,581.9 (111.6) 5,470.3 24.9% 21.6% 61.4% 24.5% 25.3% 27.5% 15.2% 11.8% 25.2%
Workday 76.84 82% 1.62x 14,983.8 (1,462.0) 13,521.8 33.1% 31.0% 67.8% 8.5% 11.6% 37.3% 40.4% 12.8% 41.9%
Xactly 6.85 64% 1.46x 202.4 (32.2) 170.1 24.8% 24.5% 58.7% (11.7%) (6.4%) 45.9% 20.6% 19.1% 20.0%
Mean 19.2% 17.7% 66.6% 10.3% 13.2% 37.9% 17.6% 17.4% 25.2%
Median 21.1% 15.9% 67.2% 12.5% 12.8% 39.6% 16.0% 16.0% 22.5%
Share Price% of 52-
Week High
Current
Share Price
as a Multiple
of 52-Wk low
Equity Value Net DebtEnterprise
Value
S&M Mgn.R&D Mgn.G&A Mgn.
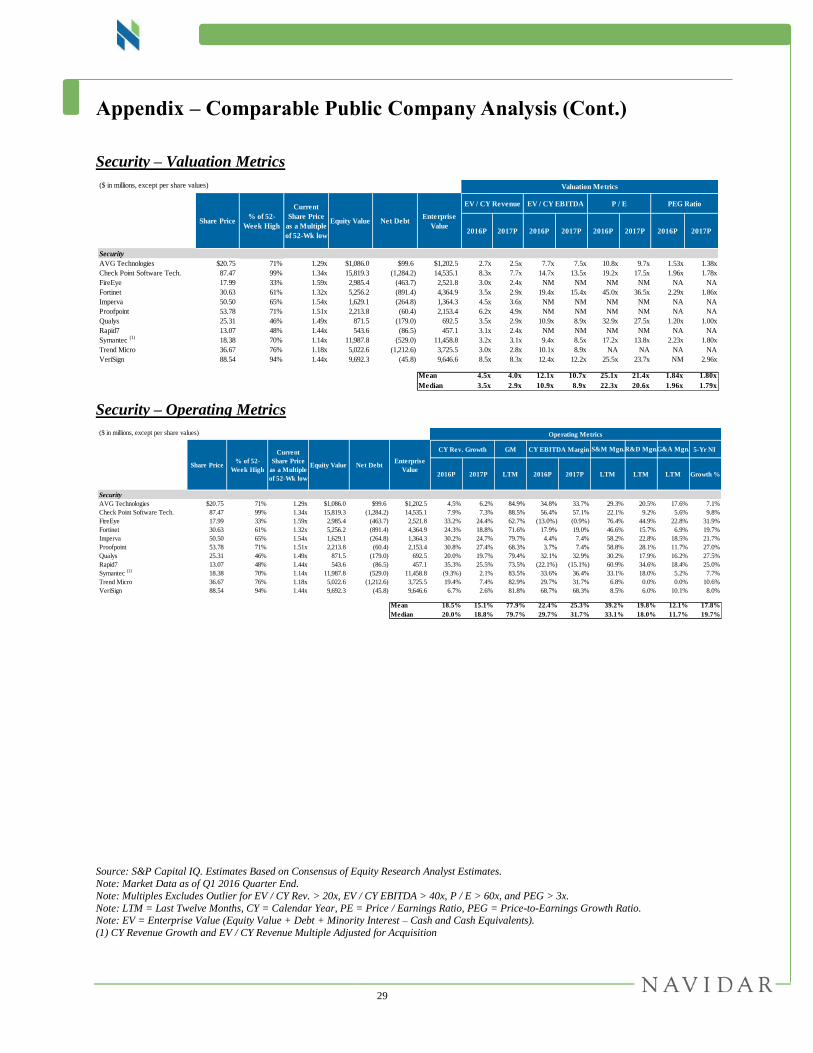
29
Appendix – Comparable Public Company Analysis (Cont.)
Security – Valuation Metrics
Security – Operating Metrics
Source: S&P Capital IQ. Estimates Based on Consensus of Equity Research Analyst Estimates.
Note: Market Data as of Q1 2016 Quarter End.
Note: Multiples Excludes Outlier for EV / CY Rev. > 20x, EV / CY EBITDA > 40x, P / E > 60x, and PEG > 3x.
Note: LTM = Last Twelve Months, CY = Calendar Year, PE = Price / Earnings Ratio, PEG = Price-to-Earnings Growth Ratio. Note: EV = Enterprise Value (Equity Value + Debt + Minority Interest – Cash and Cash Equivalents).
(1) CY Revenue Growth and EV / CY Revenue Multiple Adjusted for Acquisition
($ in millions, except per share values)
EV / CY Revenue EV / CY EBITDA P / E PEG Ratio
2016P 2017P 2016P 2017P 2016P 2017P 2016P 2017P
Security
AVG Technologies $20.75 71% 1.29x $1,086.0 $99.6 $1,202.5 2.7x 2.5x 7.7x 7.5x 10.8x 9.7x 1.53x 1.38x
Check Point Software Tech. 87.47 99% 1.34x 15,819.3 (1,284.2) 14,535.1 8.3x 7.7x 14.7x 13.5x 19.2x 17.5x 1.96x 1.78x
FireEye 17.99 33% 1.59x 2,985.4 (463.7) 2,521.8 3.0x 2.4x NM NM NM NM NA NA
Fortinet 30.63 61% 1.32x 5,256.2 (891.4) 4,364.9 3.5x 2.9x 19.4x 15.4x 45.0x 36.5x 2.29x 1.86x
Imperva 50.50 65% 1.54x 1,629.1 (264.8) 1,364.3 4.5x 3.6x NM NM NM NM NA NA
Proofpoint 53.78 71% 1.51x 2,213.8 (60.4) 2,153.4 6.2x 4.9x NM NM NM NM NA NA
Qualys 25.31 46% 1.49x 871.5 (179.0) 692.5 3.5x 2.9x 10.9x 8.9x 32.9x 27.5x 1.20x 1.00x
Rapid7 13.07 48% 1.44x 543.6 (86.5) 457.1 3.1x 2.4x NM NM NM NM NA NA
Symantec (1)
18.38 70% 1.14x 11,987.8 (529.0) 11,458.8 3.2x 3.1x 9.4x 8.5x 17.2x 13.8x 2.23x 1.80x
Trend Micro 36.67 76% 1.18x 5,022.6 (1,212.6) 3,725.5 3.0x 2.8x 10.1x 8.9x NA NA NA NA
VeriSign 88.54 94% 1.44x 9,692.3 (45.8) 9,646.6 8.5x 8.3x 12.4x 12.2x 25.5x 23.7x NM 2.96x
Mean 4.5x 4.0x 12.1x 10.7x 25.1x 21.4x 1.84x 1.80x
Median 3.5x 2.9x 10.9x 8.9x 22.3x 20.6x 1.96x 1.79x
Valuation Metrics
Share Price% of 52-
Week High
Current
Share Price
as a Multiple
of 52-Wk low
Equity Value Net DebtEnterprise
Value
($ in millions, except per share values) Operating Metrics
CY Rev. Growth GM CY EBITDA Margin 5-Yr NI
2016P 2017P LTM 2016P 2017P LTM LTM LTM Growth %
Security
AVG Technologies $20.75 71% 1.29x $1,086.0 $99.6 $1,202.5 4.5% 6.2% 84.9% 34.8% 33.7% 29.3% 20.5% 17.6% 7.1%
Check Point Software Tech. 87.47 99% 1.34x 15,819.3 (1,284.2) 14,535.1 7.9% 7.3% 88.5% 56.4% 57.1% 22.1% 9.2% 5.6% 9.8%
FireEye 17.99 33% 1.59x 2,985.4 (463.7) 2,521.8 33.2% 24.4% 62.7% (13.0%) (0.9%) 76.4% 44.9% 22.8% 31.9%
Fortinet 30.63 61% 1.32x 5,256.2 (891.4) 4,364.9 24.3% 18.8% 71.6% 17.9% 19.0% 46.6% 15.7% 6.9% 19.7%
Imperva 50.50 65% 1.54x 1,629.1 (264.8) 1,364.3 30.2% 24.7% 79.7% 4.4% 7.4% 58.2% 22.8% 18.5% 21.7%
Proofpoint 53.78 71% 1.51x 2,213.8 (60.4) 2,153.4 30.8% 27.4% 68.3% 3.7% 7.4% 58.8% 28.1% 11.7% 27.0%
Qualys 25.31 46% 1.49x 871.5 (179.0) 692.5 20.0% 19.7% 79.4% 32.1% 32.9% 30.2% 17.9% 16.2% 27.5%
Rapid7 13.07 48% 1.44x 543.6 (86.5) 457.1 35.3% 25.5% 73.5% (22.1%) (15.1%) 60.9% 34.6% 18.4% 25.0%
Symantec (1)
18.38 70% 1.14x 11,987.8 (529.0) 11,458.8 (9.3%) 2.1% 83.5% 33.6% 36.4% 33.1% 18.0% 5.2% 7.7%
Trend Micro 36.67 76% 1.18x 5,022.6 (1,212.6) 3,725.5 19.4% 7.4% 82.9% 29.7% 31.7% 6.8% 0.0% 0.0% 10.6%
VeriSign 88.54 94% 1.44x 9,692.3 (45.8) 9,646.6 6.7% 2.6% 81.8% 68.7% 68.3% 8.5% 6.0% 10.1% 8.0%
Mean 18.5% 15.1% 77.9% 22.4% 25.3% 39.2% 19.8% 12.1% 17.8%
Median 20.0% 18.8% 79.7% 29.7% 31.7% 33.1% 18.0% 11.7% 19.7%
Share Price% of 52-
Week High
Current
Share Price
as a Multiple
of 52-Wk low
Equity Value Net DebtEnterprise
Value
S&M Mgn.R&D Mgn.G&A Mgn.

30
Appendix – Comparable Public Company Analysis (Cont.)
IT Infrastructure Management – Valuation Metrics
IT Infrastructure Management – Operating Metrics
Source: S&P Capital IQ. Estimates Based on Consensus of Equity Research Analyst Estimates.
Note: Market Data as of Q1 2016 Quarter End.
Note: Multiples Excludes Outlier for EV / CY Rev. > 20x, EV / CY EBITDA > 40x, P / E > 60x, and PEG > 3x. Note: LTM = Last Twelve Months, CY = Calendar Year, PE = Price / Earnings Ratio, PEG = Price-to-Earnings Growth Ratio.
Note: EV = Enterprise Value (Equity Value + Debt + Minority Interest – Cash and Cash Equivalents).
($ in millions, except per share values)
EV / CY Revenue EV / CY EBITDA P / E PEG Ratio
2016P 2017P 2016P 2017P 2016P 2017P 2016P 2017P
IT Infrastructure Management
Apigee $8.31 41% 1.62x $247.6 ($71.2) $176.4 1.7x 1.3x NM NM NM NM NA NA
CA Technologies 30.79 95% 1.22x 12,832.1 (250.0) 12,582.1 3.1x 3.1x 8.1x 8.0x 12.5x 11.8x 1.25x 1.18x
Citrix Systems 78.58 93% 1.29x 12,099.7 453.6 12,553.4 3.8x 3.6x 11.6x 10.4x 16.7x 14.9x 1.04x 0.93x
CommVault Systems 43.17 90% 1.47x 1,949.8 (401.1) 1,548.7 2.5x 2.3x 19.3x 14.9x 51.7x 39.5x 2.35x 1.80x
F5 Networks 105.85 78% 1.23x 6,421.8 (791.5) 5,630.3 2.8x 2.6x 7.1x 6.5x 15.0x 13.7x 1.27x 1.16x
Gigamon 31.02 89% 1.64x 1,068.7 (210.2) 858.5 3.1x 2.7x 13.4x 10.9x 31.3x 25.4x 1.30x 1.06x
Infoblox 17.10 61% 1.29x 989.2 (327.2) 662.0 1.7x 1.4x 18.1x 10.0x 48.9x 25.1x 2.44x 1.26x
NetScout Systems 22.97 50% 1.22x 2,264.2 (108.3) 2,155.9 1.8x 1.6x 6.4x 5.3x 12.6x 10.4x 0.88x 0.72x
PROS Holdings 11.79 43% 1.31x 357.5 (47.9) 309.6 2.0x 1.9x NM NM NM NM NA NA
Red Hat 74.51 88% 1.25x 13,607.4 (485.0) 13,122.4 5.7x 5.0x 22.1x 18.7x 35.5x 29.7x 2.22x 1.86x
Splunk 48.93 64% 1.64x 6,477.2 (1,009.0) 5,468.2 6.2x 4.8x NM NM NM NM NA NA
Vmware 52.31 56% 1.21x 22,158.0 (6,009.0) 16,153.0 2.4x 2.2x 6.4x 6.5x 12.7x 12.0x 0.85x 0.80x
Mean 3.1x 2.7x 12.5x 10.1x 26.3x 20.3x 1.51x 1.19x
Median 2.6x 2.4x 11.6x 10.0x 16.7x 14.9x 1.27x 1.16x
Valuation Metrics
Share Price% of 52-
Week High
Current
Share Price
as a Multiple
of 52-Wk low
Equity Value Net DebtEnterprise
Value
($ in millions, except per share values) Operating Metrics
CY Rev. Growth GM CY EBITDA Margin 5-Yr NI
2016P 2017P LTM 2016P 2017P LTM LTM LTM Growth %
IT Infrastructure Management
Apigee $8.31 41% 1.62x $247.6 ($71.2) $176.4 32.1% 30.2% 68.0% (25.5%) (13.9%) 62.2% 42.9% 19.4% NM
CA Technologies 30.79 95% 1.22x 12,832.1 (250.0) 12,582.1 (0.4%) 2.3% 85.4% 38.5% 38.3% 25.2% 14.0% 9.5% 10.0%
Citrix Systems 78.58 93% 1.29x 12,099.7 453.6 12,553.4 1.3% 4.2% 85.2% 32.6% 34.8% 36.5% 17.2% 10.3% 16.0%
CommVault Systems 43.17 90% 1.47x 1,949.8 (401.1) 1,548.7 5.5% 8.7% 85.9% 13.0% 15.4% 59.5% 11.5% 13.5% 22.0%
F5 Networks 105.85 78% 1.23x 6,421.8 (791.5) 5,630.3 4.7% 7.3% 82.6% 39.0% 39.7% 31.4% 15.8% 7.1% 11.8%
Gigamon 31.02 89% 1.64x 1,068.7 (210.2) 858.5 24.3% 16.1% 79.4% 23.3% 24.6% 39.4% 22.3% 12.4% 24.0%
Infoblox 17.10 61% 1.29x 989.2 (327.2) 662.0 10.5% 20.4% 79.2% 9.3% 14.0% 49.9% 19.8% 11.5% 20.0%
NetScout Systems 22.97 50% 1.22x 2,264.2 (108.3) 2,155.9 52.9% 9.2% 68.2% 28.1% 31.0% 30.5% 21.2% 10.7% 14.3%
PROS Holdings 11.79 43% 1.31x 357.5 (47.9) 309.6 (9.8%) 4.9% 63.5% (30.5%) (12.2%) 44.1% 27.8% 22.9% 15.0%
Red Hat 74.51 88% 1.25x 13,607.4 (485.0) 13,122.4 16.7% 15.2% 84.9% 25.8% 26.5% 41.4% 20.1% 9.4% 16.0%
Splunk 48.93 64% 1.64x 6,477.2 (1,009.0) 5,468.2 31.7% 28.5% 82.9% 6.9% 8.7% 75.6% 32.2% 17.9% 28.7%
Vmware 52.31 56% 1.21x 22,158.0 (6,009.0) 16,153.0 3.3% 5.0% 84.7% 36.6% 34.6% 34.1% 19.6% 9.3% 14.9%
Mean 14.4% 12.7% 79.2% 16.4% 20.1% 44.2% 22.0% 12.8% 17.5%
Median 8.0% 9.0% 82.8% 24.5% 25.6% 40.4% 20.0% 11.1% 16.0%
Share Price% of 52-
Week High
Current
Share Price
as a Multiple
of 52-Wk low
Equity Value Net DebtEnterprise
Value
S&M Mgn.R&D Mgn.G&A Mgn.
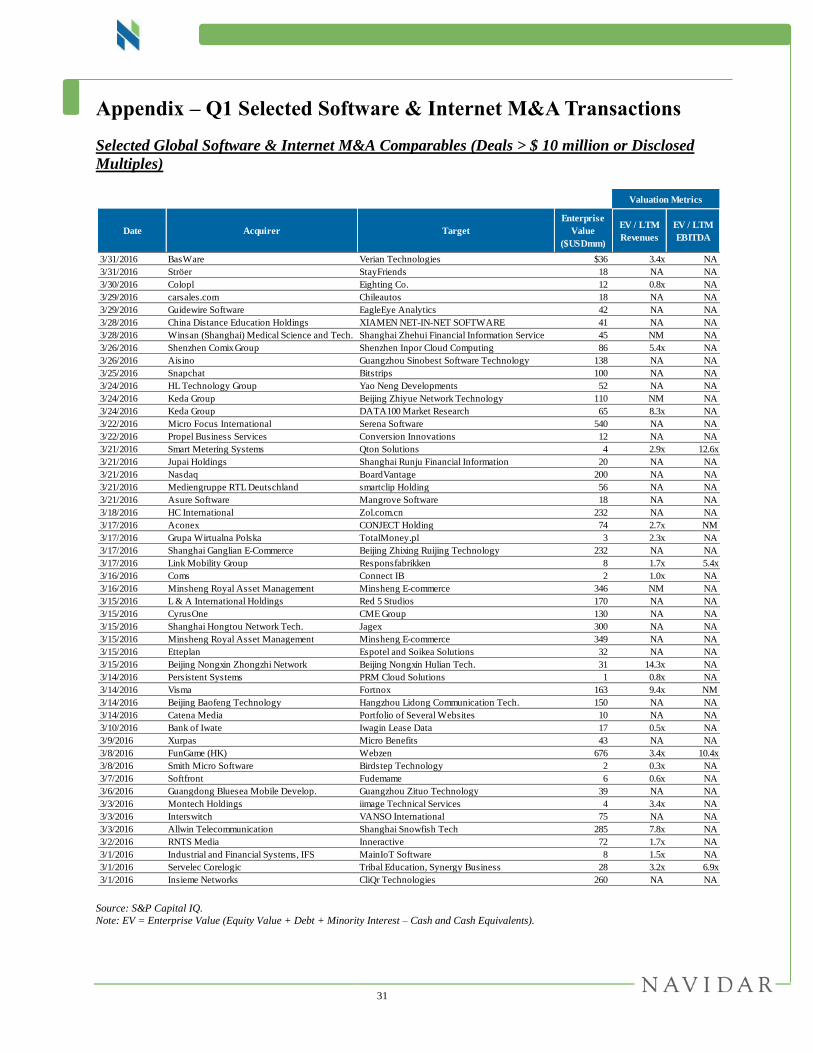
31
Appendix – Q1 Selected Software & Internet M&A Transactions
Selected Global Software & Internet M&A Comparables (Deals > $ 10 million or Disclosed
Multiples)
Source: S&P Capital IQ.
Note: EV = Enterprise Value (Equity Value + Debt + Minority Interest – Cash and Cash Equivalents).
Valuation Metrics
Date Acquirer Target
Enterprise
Value
($USDmm)
EV / LTM
Revenues
EV / LTM
EBITDA
3/31/2016 BasWare Verian Technologies $36 3.4x NA
3/31/2016 Ströer StayFriends 18 NA NA
3/30/2016 Colopl Eighting Co. 12 0.8x NA
3/29/2016 carsales.com Chileautos 18 NA NA
3/29/2016 Guidewire Software EagleEye Analytics 42 NA NA
3/28/2016 China Distance Education Holdings XIAMEN NET-IN-NET SOFTWARE 41 NA NA
3/28/2016 Winsan (Shanghai) Medical Science and Tech. Shanghai Zhehui Financial Information Service 45 NM NA
3/26/2016 Shenzhen Comix Group Shenzhen Inpor Cloud Computing 86 5.4x NA
3/26/2016 Aisino Guangzhou Sinobest Software Technology 138 NA NA
3/25/2016 Snapchat Bitstrips 100 NA NA
3/24/2016 HL Technology Group Yao Neng Developments 52 NA NA
3/24/2016 Keda Group Beijing Zhiyue Network Technology 110 NM NA
3/24/2016 Keda Group DATA100 Market Research 65 8.3x NA
3/22/2016 Micro Focus International Serena Software 540 NA NA
3/22/2016 Propel Business Services Conversion Innovations 12 NA NA
3/21/2016 Smart Metering Systems Qton Solutions 4 2.9x 12.6x
3/21/2016 Jupai Holdings Shanghai Runju Financial Information 20 NA NA
3/21/2016 Nasdaq BoardVantage 200 NA NA
3/21/2016 Mediengruppe RTL Deutschland smartclip Holding 56 NA NA
3/21/2016 Asure Software Mangrove Software 18 NA NA
3/18/2016 HC International Zol.com.cn 232 NA NA
3/17/2016 Aconex CONJECT Holding 74 2.7x NM
3/17/2016 Grupa Wirtualna Polska TotalMoney.pl 3 2.3x NA
3/17/2016 Shanghai Ganglian E-Commerce Beijing Zhixing Ruijing Technology 232 NA NA
3/17/2016 Link Mobility Group Responsfabrikken 8 1.7x 5.4x
3/16/2016 Coms Connect IB 2 1.0x NA
3/16/2016 Minsheng Royal Asset Management Minsheng E-commerce 346 NM NA
3/15/2016 L & A International Holdings Red 5 Studios 170 NA NA
3/15/2016 CyrusOne CME Group 130 NA NA
3/15/2016 Shanghai Hongtou Network Tech. Jagex 300 NA NA
3/15/2016 Minsheng Royal Asset Management Minsheng E-commerce 349 NA NA
3/15/2016 Etteplan Espotel and Soikea Solutions 32 NA NA
3/15/2016 Beijing Nongxin Zhongzhi Network Beijing Nongxin Hulian Tech. 31 14.3x NA
3/14/2016 Persistent Systems PRM Cloud Solutions 1 0.8x NA
3/14/2016 Visma Fortnox 163 9.4x NM
3/14/2016 Beijing Baofeng Technology Hangzhou Lidong Communication Tech. 150 NA NA
3/14/2016 Catena Media Portfolio of Several Websites 10 NA NA
3/10/2016 Bank of Iwate Iwagin Lease Data 17 0.5x NA
3/9/2016 Xurpas Micro Benefits 43 NA NA
3/8/2016 FunGame (HK) Webzen 676 3.4x 10.4x
3/8/2016 Smith Micro Software Birdstep Technology 2 0.3x NA
3/7/2016 Softfront Fudemame 6 0.6x NA
3/6/2016 Guangdong Bluesea Mobile Develop. Guangzhou Zituo Technology 39 NA NA
3/3/2016 Montech Holdings iimage Technical Services 4 3.4x NA
3/3/2016 Interswitch VANSO International 75 NA NA
3/3/2016 Allwin Telecommunication Shanghai Snowfish Tech 285 7.8x NA
3/2/2016 RNTS Media Inneractive 72 1.7x NA
3/1/2016 Industrial and Financial Systems, IFS MainIoT Software 8 1.5x NA
3/1/2016 Servelec Corelogic Tribal Education, Synergy Business 28 3.2x 6.9x
3/1/2016 Insieme Networks CliQr Technologies 260 NA NA
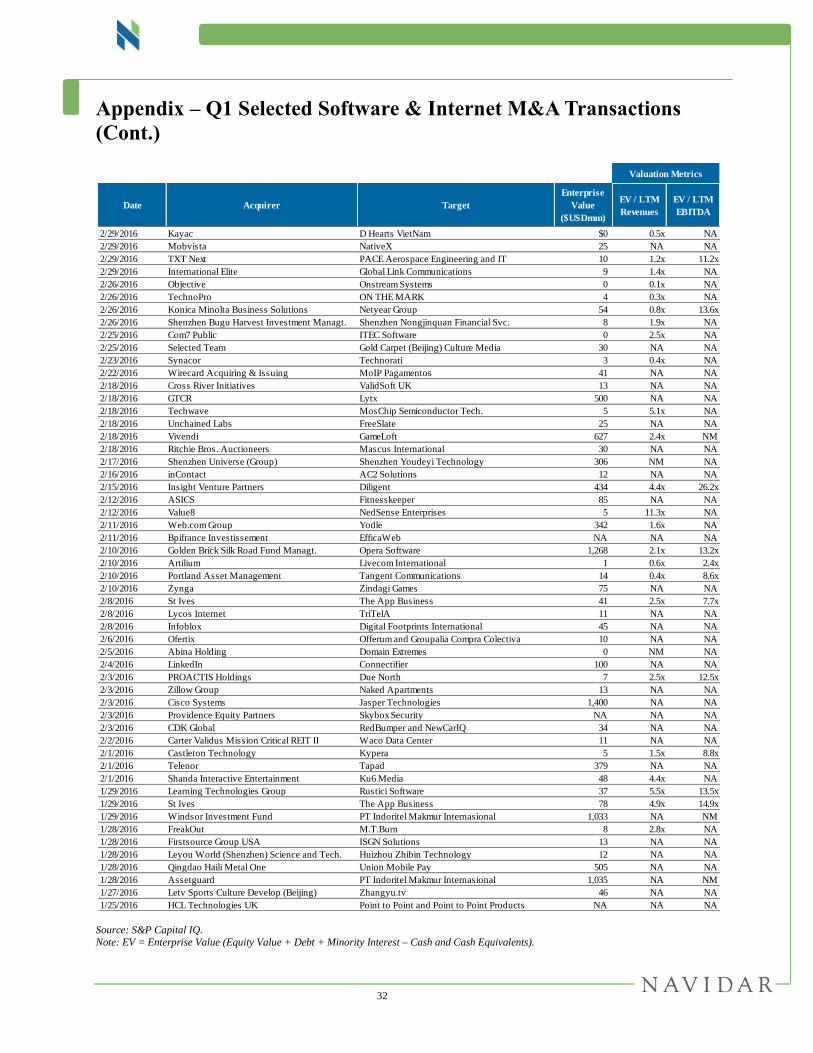
32
Appendix – Q1 Selected Software & Internet M&A Transactions
(Cont.)
Source: S&P Capital IQ.
Note: EV = Enterprise Value (Equity Value + Debt + Minority Interest – Cash and Cash Equivalents).
Valuation Metrics
Date Acquirer Target
Enterprise
Value
($USDmm)
EV / LTM
Revenues
EV / LTM
EBITDA
2/29/2016 Kayac D Hearts VietNam $0 0.5x NA
2/29/2016 Mobvista NativeX 25 NA NA
2/29/2016 TXT Next PACE Aerospace Engineering and IT 10 1.2x 11.2x
2/29/2016 International Elite Global Link Communications 9 1.4x NA
2/26/2016 Objective Onstream Systems 0 0.1x NA
2/26/2016 TechnoPro ON THE MARK 4 0.3x NA
2/26/2016 Konica Minolta Business Solutions Netyear Group 54 0.8x 13.6x
2/26/2016 Shenzhen Bugu Harvest Investment Managt. Shenzhen Nongjinquan Financial Svc. 8 1.9x NA
2/25/2016 Com7 Public ITEC Software 0 2.5x NA
2/25/2016 Selected Team Gold Carpet (Beijing) Culture Media 30 NA NA
2/23/2016 Synacor Technorati 3 0.4x NA
2/22/2016 Wirecard Acquiring & Issuing MoIP Pagamentos 41 NA NA
2/18/2016 Cross River Initiatives ValidSoft UK 13 NA NA
2/18/2016 GTCR Lytx 500 NA NA
2/18/2016 Techwave MosChip Semiconductor Tech. 5 5.1x NA
2/18/2016 Unchained Labs FreeSlate 25 NA NA
2/18/2016 Vivendi GameLoft 627 2.4x NM
2/18/2016 Ritchie Bros. Auctioneers Mascus International 30 NA NA
2/17/2016 Shenzhen Universe (Group) Shenzhen Youdeyi Technology 306 NM NA
2/16/2016 inContact AC2 Solutions 12 NA NA
2/15/2016 Insight Venture Partners Diligent 434 4.4x 26.2x
2/12/2016 ASICS Fitnesskeeper 85 NA NA
2/12/2016 Value8 NedSense Enterprises 5 11.3x NA
2/11/2016 Web.com Group Yodle 342 1.6x NA
2/11/2016 Bpifrance Investissement EfficaWeb NA NA NA
2/10/2016 Golden Brick Silk Road Fund Managt. Opera Software 1,268 2.1x 13.2x
2/10/2016 Artilium Livecom International 1 0.6x 2.4x
2/10/2016 Portland Asset Management Tangent Communications 14 0.4x 8.6x
2/10/2016 Zynga Zindagi Games 75 NA NA
2/8/2016 St Ives The App Business 41 2.5x 7.7x
2/8/2016 Lycos Internet TriTelA 11 NA NA
2/8/2016 Infoblox Digital Footprints International 45 NA NA
2/6/2016 Ofertix Offerum and Groupalia Compra Colectiva 10 NA NA
2/5/2016 Abina Holding Domain Extremes 0 NM NA
2/4/2016 LinkedIn Connectifier 100 NA NA
2/3/2016 PROACTIS Holdings Due North 7 2.5x 12.5x
2/3/2016 Zillow Group Naked Apartments 13 NA NA
2/3/2016 Cisco Systems Jasper Technologies 1,400 NA NA
2/3/2016 Providence Equity Partners Skybox Security NA NA NA
2/3/2016 CDK Global RedBumper and NewCarIQ 34 NA NA
2/2/2016 Carter Validus Mission Critical REIT II Waco Data Center 11 NA NA
2/1/2016 Castleton Technology Kypera 5 1.5x 8.8x
2/1/2016 Telenor Tapad 379 NA NA
2/1/2016 Shanda Interactive Entertainment Ku6 Media 48 4.4x NA
1/29/2016 Learning Technologies Group Rustici Software 37 5.5x 13.5x
1/29/2016 St Ives The App Business 78 4.9x 14.9x
1/29/2016 Windsor Investment Fund PT Indoritel Makmur Internasional 1,033 NA NM
1/28/2016 FreakOut M.T.Burn 8 2.8x NA
1/28/2016 Firstsource Group USA ISGN Solutions 13 NA NA
1/28/2016 Leyou World (Shenzhen) Science and Tech. Huizhou Zhibin Technology 12 NA NA
1/28/2016 Qingdao Haili Metal One Union Mobile Pay 505 NA NA
1/28/2016 Assetguard PT Indoritel Makmur Internasional 1,035 NA NM
1/27/2016 Letv Sports Culture Develop (Beijing) Zhangyu.tv 46 NA NA
1/25/2016 HCL Technologies UK Point to Point and Point to Point Products NA NA NA
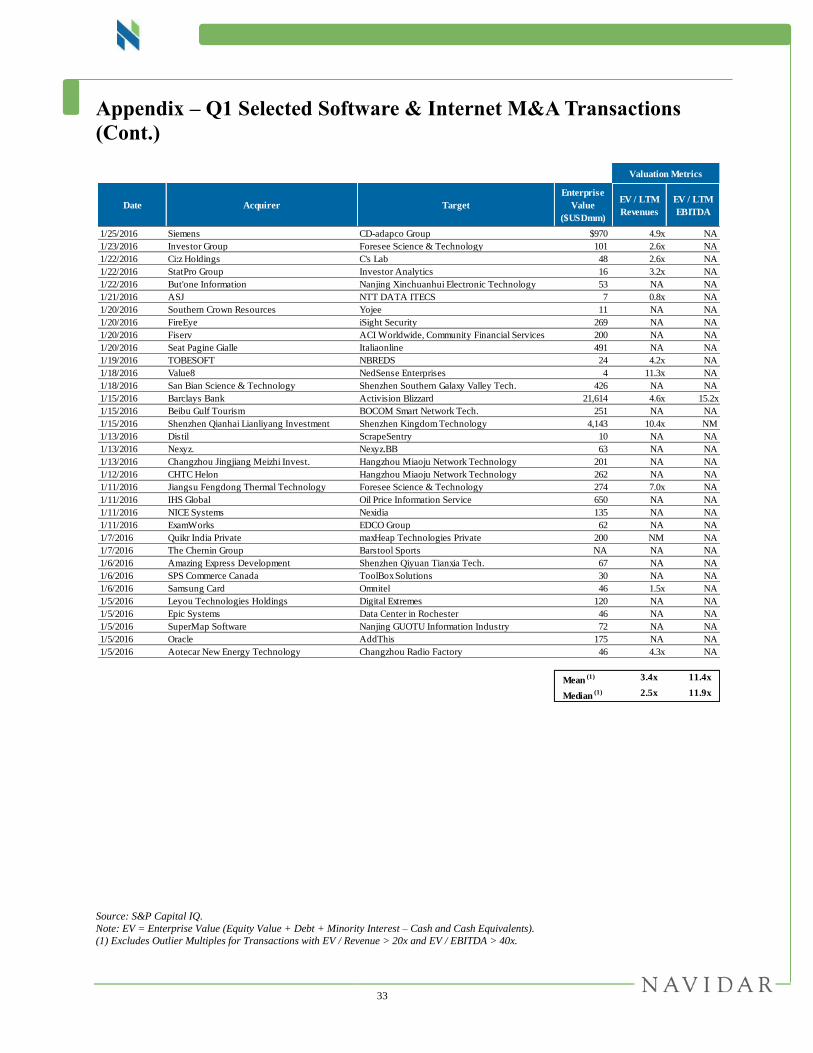
33
Appendix – Q1 Selected Software & Internet M&A Transactions
(Cont.)
Source: S&P Capital IQ.
Note: EV = Enterprise Value (Equity Value + Debt + Minority Interest – Cash and Cash Equivalents).
(1) Excludes Outlier Multiples for Transactions with EV / Revenue > 20x and EV / EBITDA > 40x.
Valuation Metrics
Date Acquirer Target
Enterprise
Value
($USDmm)
EV / LTM
Revenues
EV / LTM
EBITDA
1/25/2016 Siemens CD-adapco Group $970 4.9x NA
1/23/2016 Investor Group Foresee Science & Technology 101 2.6x NA
1/22/2016 Ci:z Holdings C's Lab 48 2.6x NA
1/22/2016 StatPro Group Investor Analytics 16 3.2x NA
1/22/2016 But'one Information Nanjing Xinchuanhui Electronic Technology 53 NA NA
1/21/2016 ASJ NTT DATA ITECS 7 0.8x NA
1/20/2016 Southern Crown Resources Yojee 11 NA NA
1/20/2016 FireEye iSight Security 269 NA NA
1/20/2016 Fiserv ACI Worldwide, Community Financial Services 200 NA NA
1/20/2016 Seat Pagine Gialle Italiaonline 491 NA NA
1/19/2016 TOBESOFT NBREDS 24 4.2x NA
1/18/2016 Value8 NedSense Enterprises 4 11.3x NA
1/18/2016 San Bian Science & Technology Shenzhen Southern Galaxy Valley Tech. 426 NA NA
1/15/2016 Barclays Bank Activision Blizzard 21,614 4.6x 15.2x
1/15/2016 Beibu Gulf Tourism BOCOM Smart Network Tech. 251 NA NA
1/15/2016 Shenzhen Qianhai Lianliyang Investment Shenzhen Kingdom Technology 4,143 10.4x NM
1/13/2016 Distil ScrapeSentry 10 NA NA
1/13/2016 Nexyz. Nexyz.BB 63 NA NA
1/13/2016 Changzhou Jingjiang Meizhi Invest. Hangzhou Miaoju Network Technology 201 NA NA
1/12/2016 CHTC Helon Hangzhou Miaoju Network Technology 262 NA NA
1/11/2016 Jiangsu Fengdong Thermal Technology Foresee Science & Technology 274 7.0x NA
1/11/2016 IHS Global Oil Price Information Service 650 NA NA
1/11/2016 NICE Systems Nexidia 135 NA NA
1/11/2016 ExamWorks EDCO Group 62 NA NA
1/7/2016 Quikr India Private maxHeap Technologies Private 200 NM NA
1/7/2016 The Chernin Group Barstool Sports NA NA NA
1/6/2016 Amazing Express Development Shenzhen Qiyuan Tianxia Tech. 67 NA NA
1/6/2016 SPS Commerce Canada ToolBox Solutions 30 NA NA
1/6/2016 Samsung Card Omnitel 46 1.5x NA
1/5/2016 Leyou Technologies Holdings Digital Extremes 120 NA NA
1/5/2016 Epic Systems Data Center in Rochester 46 NA NA
1/5/2016 SuperMap Software Nanjing GUOTU Information Industry 72 NA NA
1/5/2016 Oracle AddThis 175 NA NA
1/5/2016 Aotecar New Energy Technology Changzhou Radio Factory 46 4.3x NA
Mean (1) 3.4x 11.4x
Median (1) 2.5x 11.9x
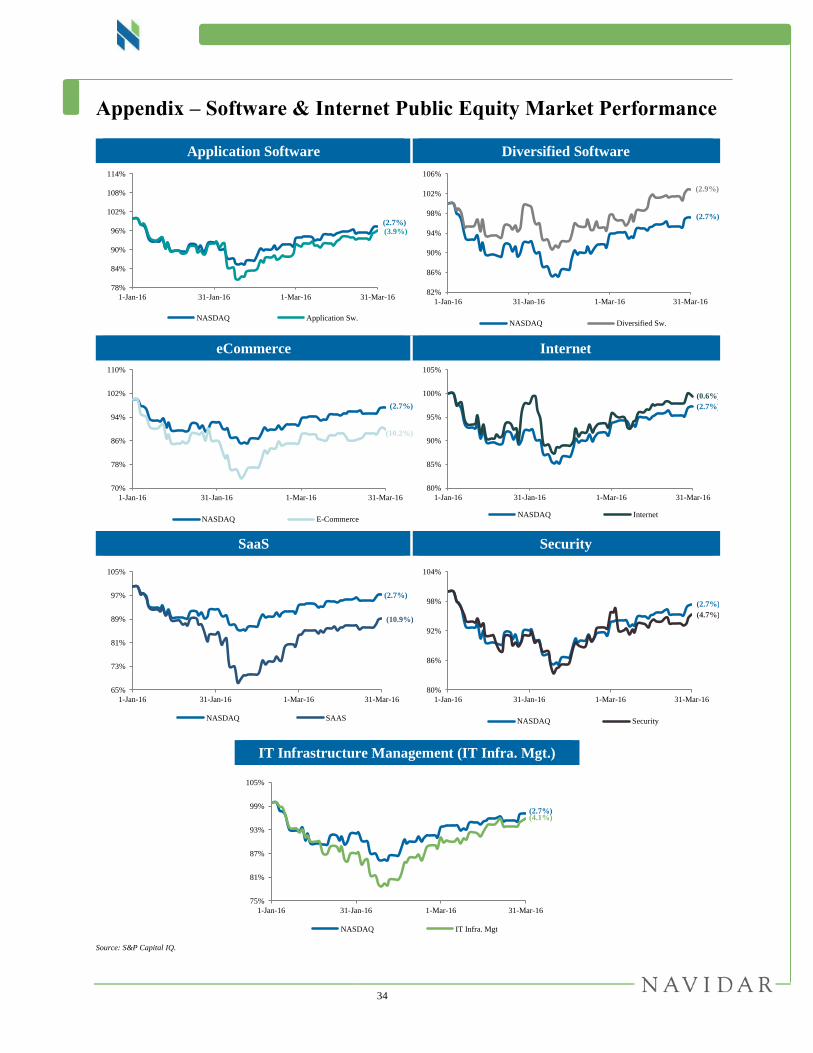
34
Appendix – Software & Internet Public Equity Market Performance
Application Software Diversified Software
eCommerce Internet
SaaS Security
Source: S&P Capital IQ.
78%
84%
90%
96%
102%
108%
114%
1-Jan-16 31-Jan-16 1-Mar-16 31-Mar-16
NASDAQ Application Sw.
(2.7%)(3.9%)
82%
86%
90%
94%
98%
102%
106%
1-Jan-16 31-Jan-16 1-Mar-16 31-Mar-16
NASDAQ Diversified Sw.
(2.9%)
(2.7%)
70%
78%
86%
94%
102%
110%
1-Jan-16 31-Jan-16 1-Mar-16 31-Mar-16
NASDAQ E-Commerce
(10.2%)
(2.7%)
80%
85%
90%
95%
100%
105%
1-Jan-16 31-Jan-16 1-Mar-16 31-Mar-16
NASDAQ Internet
(0.6%)
(2.7%)
65%
73%
81%
89%
97%
105%
1-Jan-16 31-Jan-16 1-Mar-16 31-Mar-16
NASDAQ SAAS
(10.9%)
(2.7%)
80%
86%
92%
98%
104%
1-Jan-16 31-Jan-16 1-Mar-16 31-Mar-16
NASDAQ Security
(4.7%)
(2.7%)
IT Infrastructure Management (IT Infra. Mgt.)
75%
81%
87%
93%
99%
105%
1-Jan-16 31-Jan-16 1-Mar-16 31-Mar-16
NASDAQ IT Infra. Mgt
(4.1%)(2.7%)
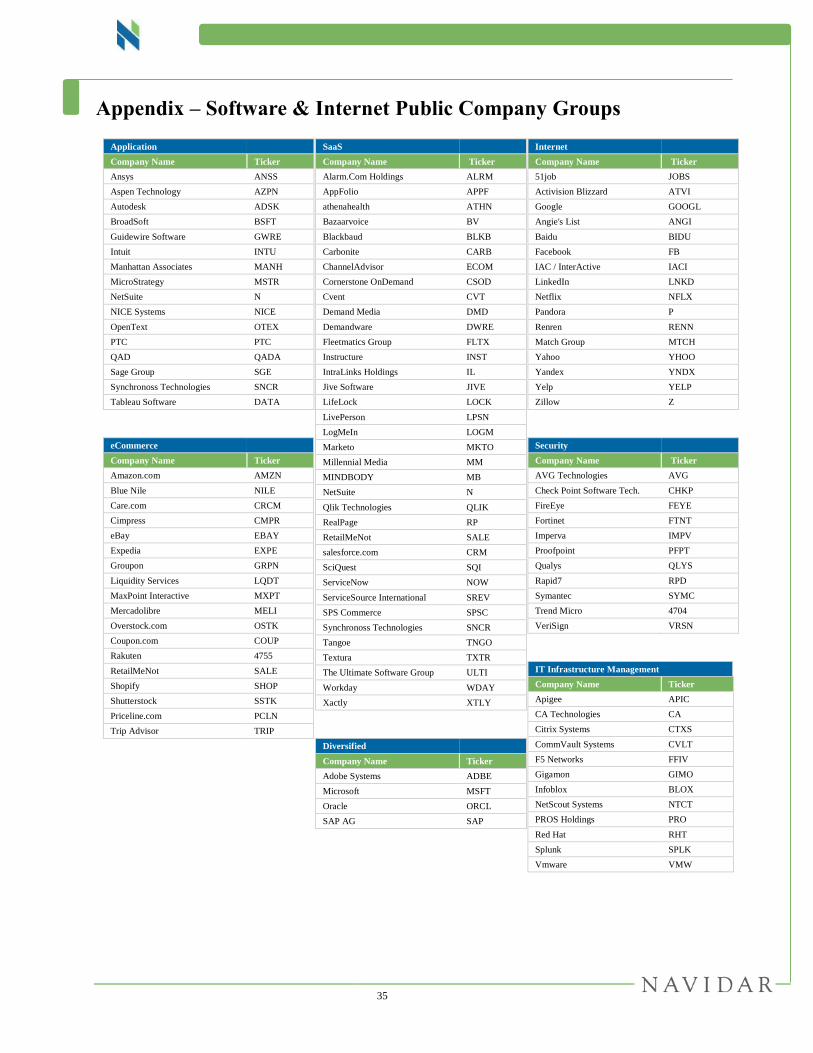
35
Appendix – Software & Internet Public Company Groups
Application
Company Name Ticker
Ansys ANSS
Aspen Technology AZPN
Autodesk ADSK
BroadSoft BSFT
Guidewire Software GWRE
Intuit INTU
Manhattan Associates MANH
MicroStrategy MSTR
NetSuite N
NICE Systems NICE
OpenText OTEX
PTC PTC
QAD QADA
Sage Group SGE
Synchronoss Technologies SNCR
Tableau Software DATA
eCommerce
Company Name Ticker
Amazon.com AMZN
Blue Nile NILE
Care.com CRCM
Cimpress CMPR
eBay EBAY
Expedia EXPE
Groupon GRPN
Liquidity Services LQDT
MaxPoint Interactive MXPT
Mercadolibre MELI
Overstock.com OSTK
Coupon.com COUP
Rakuten 4755
RetailMeNot SALE
Shopify SHOP
Shutterstock SSTK
Priceline.com PCLN
Trip Advisor TRIP
SaaS
Company Name Ticker
Alarm.Com Holdings ALRM
AppFolio APPF
athenahealth ATHN
Bazaarvoice BV
Blackbaud BLKB
Carbonite CARB
ChannelAdvisor ECOM
Cornerstone OnDemand CSOD
Cvent CVT
Demand Media DMD
Demandware DWRE
Fleetmatics Group FLTX
Instructure INST
IntraLinks Holdings IL
Jive Software JIVE
LifeLock LOCK
LivePerson LPSN
LogMeIn LOGM
Marketo MKTO
Millennial Media MM
MINDBODY MB
NetSuite N
Qlik Technologies QLIK
RealPage RP
RetailMeNot SALE
salesforce.com CRM
SciQuest SQI
ServiceNow NOW
ServiceSource International SREV
SPS Commerce SPSC
Synchronoss Technologies SNCR
Tangoe TNGO
Textura TXTR
The Ultimate Software Group ULTI
Workday WDAY
Xactly XTLY
Diversified
Company Name Ticker
Adobe Systems ADBE
Microsoft MSFT
Oracle ORCL
SAP AG SAP
Internet
Company Name Ticker
51job JOBS
Activision Blizzard ATVI
Google GOOGL
Angie's List ANGI
Baidu BIDU
Facebook FB
IAC / InterActive IACI
LinkedIn LNKD
Netflix NFLX
Pandora P
Renren RENN
Match Group MTCH
Yahoo YHOO
Yandex YNDX
Yelp YELP
Zillow Z
Security
Company Name Ticker
AVG Technologies AVG
Check Point Software Tech. CHKP
FireEye FEYE
Fortinet FTNT
Imperva IMPV
Proofpoint PFPT
Qualys QLYS
Rapid7 RPD
Symantec SYMC
Trend Micro 4704
VeriSign VRSN
IT Infrastructure Management
Company Name Ticker
Apigee APIC
CA Technologies CA
Citrix Systems CTXS
CommVault Systems CVLT
F5 Networks FFIV
Gigamon GIMO
Infoblox BLOX
NetScout Systems NTCT
PROS Holdings PRO
Red Hat RHT
Splunk SPLK
Vmware VMW

36
Disclaimer
This Quarterly Report (the “Quarterly”) has been prepared solely for informational purposes and may not be used or
relied upon for any purpose other than as specifically contemplated by a written agreement with us.
This Quarterly is not intended to provide the sole basis for evaluating, and should not be considered a
recommendation with respect to, any transaction or other matter. This Quarterly does not constitute an offer, or the
solicitation of an offer, to buy or sell any securities or other financial product, to participate in any transaction or to
provide any investment banking or other services, and should not be deemed to be a commitment or undertaking of
any kind on the part of Navidar Holdco LLC (“Navidar”) or any of its affiliates to underwrite, place or purchase any
securities or to provide any debt or equity financing or to participate in any transaction, or a recommendation to buy
or sell any securities, to make any investment or to participate in any transaction or trading strategy.
Although the information contained in this Quarterly has been obtained or compiled from sources deemed reliable,
neither Navidar nor any of the Company affiliates make any representation or warranty, express or implied, as to the
accuracy or completeness of the information contained herein and nothing contained herein is, or shall be relied
upon as, a promise or representation whether as to the past, present or future performance. The information set forth
herein may include estimates and / or involve significant elements of subjective judgment and analysis. No
representations are made as to the accuracy of such estimates or that all assumptions relating to such estimates have
been considered or stated or that such estimates will be realized. The information contained herein does not purport
to contain all of the information that may be required to evaluate a participation in any transaction and any recipient
hereof should conduct its own independent analysis of the data referred to herein. We assume no obligation to
update or otherwise revise these materials.
Navidar and its affiliates do not provide legal, tax or accounting advice. Prior to making any investment or
participating in any transaction, you should consult, to the extent necessary, your own independent legal, tax,
accounting and other professional advisors to ensure that any transaction or investment is suitable for you in the
light of your financial capacity and objectives.