sign ups today
DESCRIPTION
Ski Trip - Mount Stowe, VT Sat., Mar. 18 from 5:30 AM - 4:30 PM $65.00/person ($20.00/person ski rental) Blue Man Group - Boston Playhouse Fri., Mar. 24 at 7:00 PM and Sat., Mar. 25 at 4:00 PM Free Guest Speaker Panel – SM 105 Mon., Mar. 20, 7:00 PM - 9:00 PM Free. SIGN UPS TODAY. - PowerPoint PPT PresentationTRANSCRIPT
Ski Trip - Mount Stowe, VT Sat., Mar. 18 from 5:30 AM - 4:30 PM
$65.00/person ($20.00/person ski rental)
Blue Man Group - Boston PlayhouseFri., Mar. 24 at 7:00 PM and
Sat., Mar. 25 at 4:00 PMFree
Guest Speaker Panel – SM 105Mon., Mar. 20, 7:00 PM - 9:00 PM
Free
SIGN UPS TODAY
Quality Management
Boston University School of Management
Professor Peter Arnold
What is Quality?
The ability of a product or service to consistently meet or exceed customer
expectations.
The Customer Internal and External
Customer Requirements
Customer Satisfaction
Conflict between Heterogeneous Customer Populations
The CustomerWho are the customers of the Boston
University School of Management?
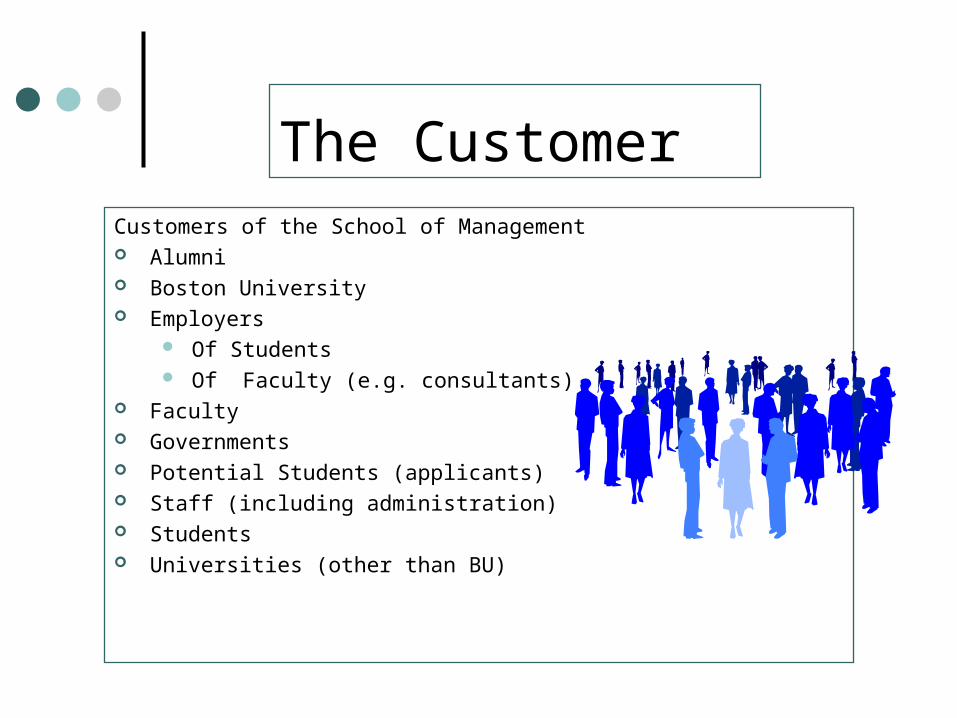
The CustomerCustomers of the School of Management Alumni Boston University Employers
Of Students Of Faculty (e.g. consultants)
Faculty Governments Potential Students (applicants) Staff (including administration) Students Universities (other than BU)
The Customer
What are the requirements of the student customers at BU SMG?
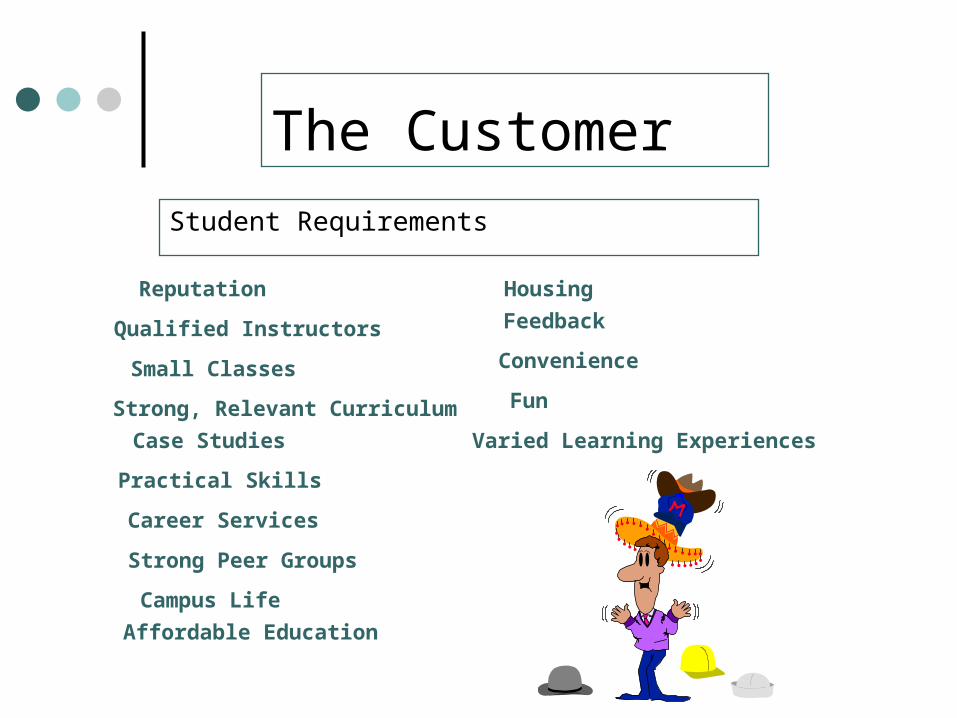
The CustomerStudent Requirements
Reputation
Qualified Instructors
Small Classes
Strong, Relevant Curriculum
Case Studies
Practical Skills
Career Services
Strong Peer Groups
Campus Life
Affordable Education
Housing
Feedback
Convenience
Fun
Varied Learning Experiences
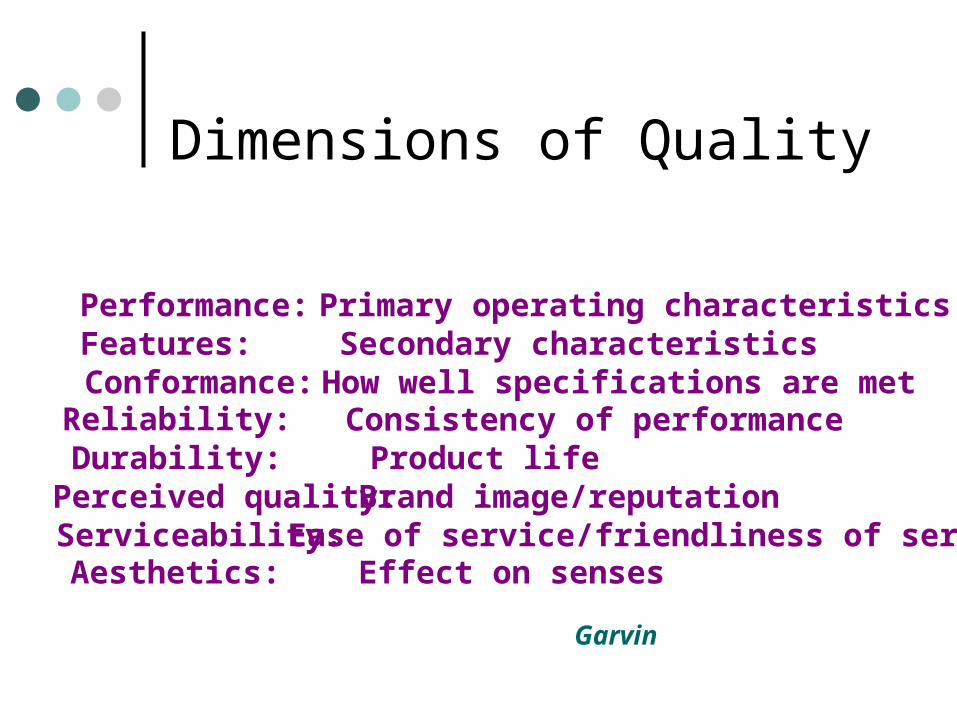
Dimensions of Quality
Performance: Primary operating characteristicsSecondary characteristicsHow well specifications are metConsistency of performanceProduct lifeBrand image/reputationEase of service/friendliness of serverEffect on senses
Features:Conformance:Reliability:Durability:Perceived quality:Serviceability:Aesthetics:
Garvin
Managing Quality
If Quality improvement is about any one thing it is about variance reduction.
Variation is a term used to describe deviation from the expected. High variation or variability creates
great uncertainty in outcome.
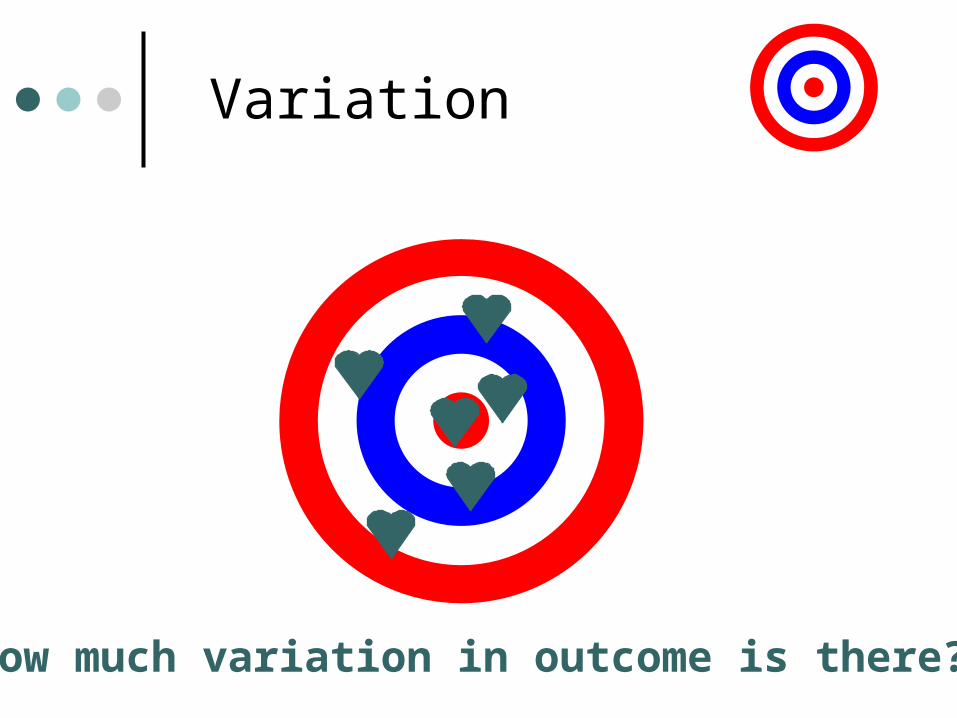
Variation
How much variation in outcome is there?
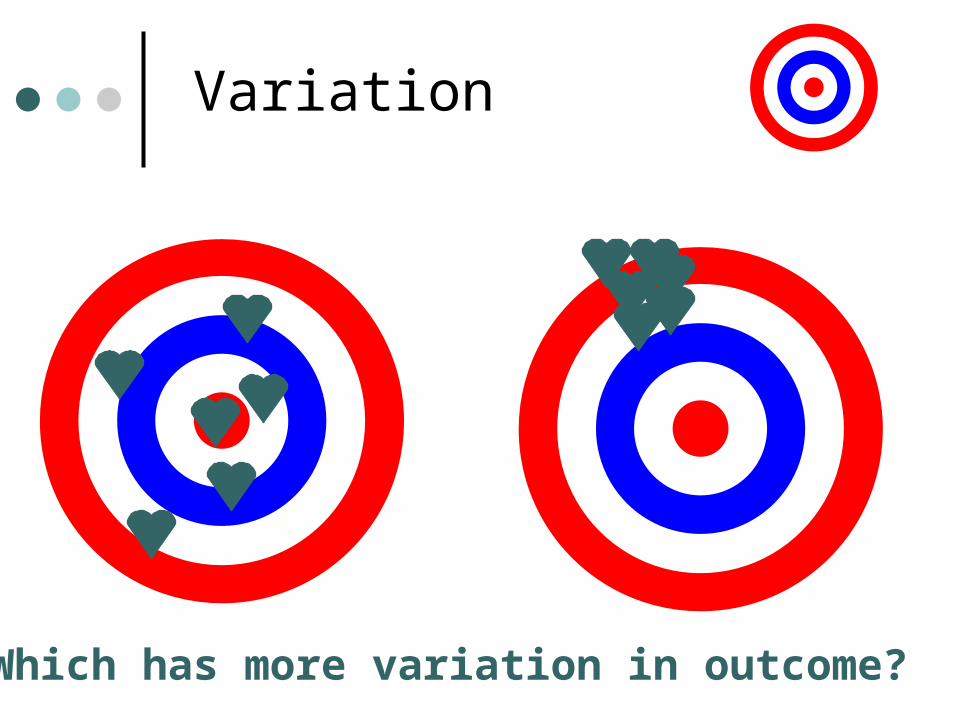
Variation
Which has more variation in outcome?
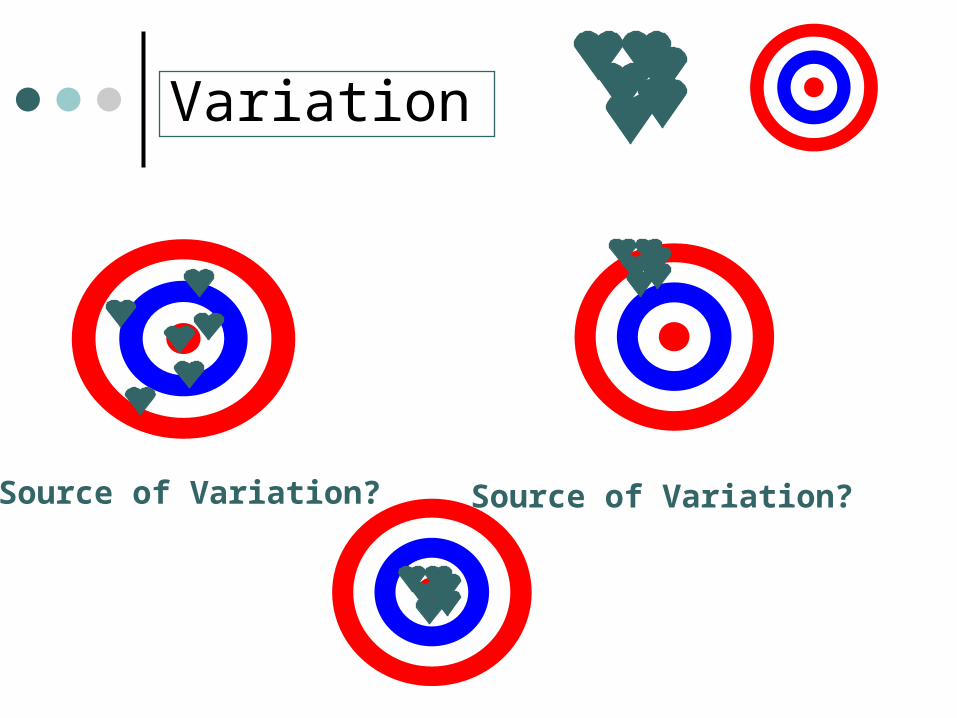
Variation
Source of Variation? Source of Variation?
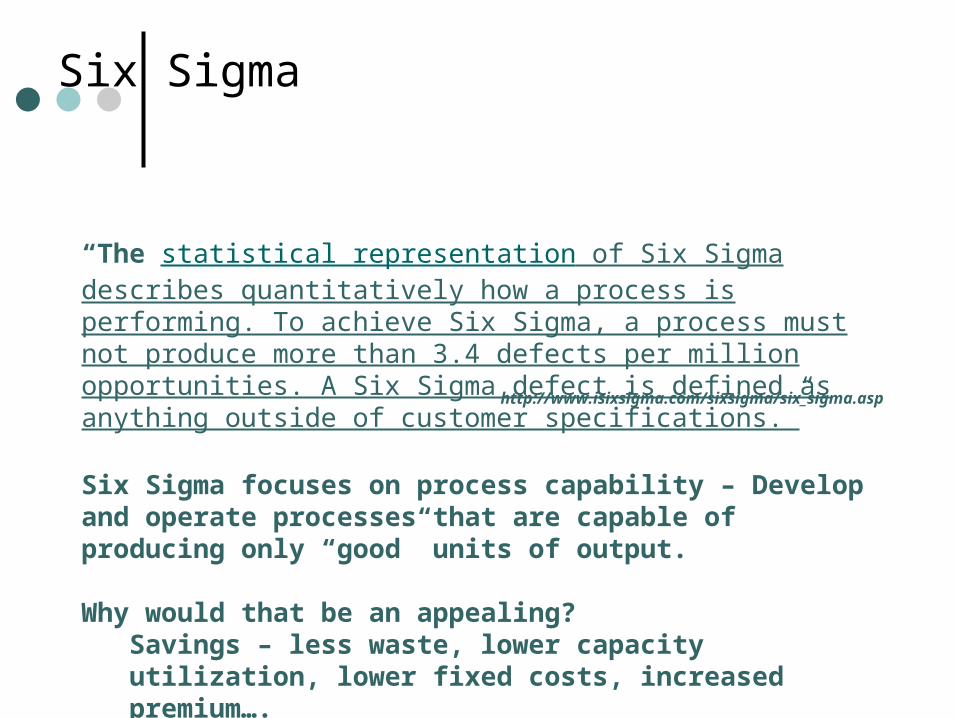
Six Sigma
“The statistical representation of Six Sigma describes quantitatively how a process is performing. To achieve Six Sigma, a process must not produce more than 3.4 defects per million opportunities. A Six Sigma defect is defined as anything outside of customer specifications.”
http://www.isixsigma.com/sixsigma/six_sigma.asp
Six Sigma focuses on process capability – Develop and operate processes that are capable of producing only “good” units of output.
Why would that be an appealing?Savings – less waste, lower capacity utilization, lower fixed costs, increased premium….
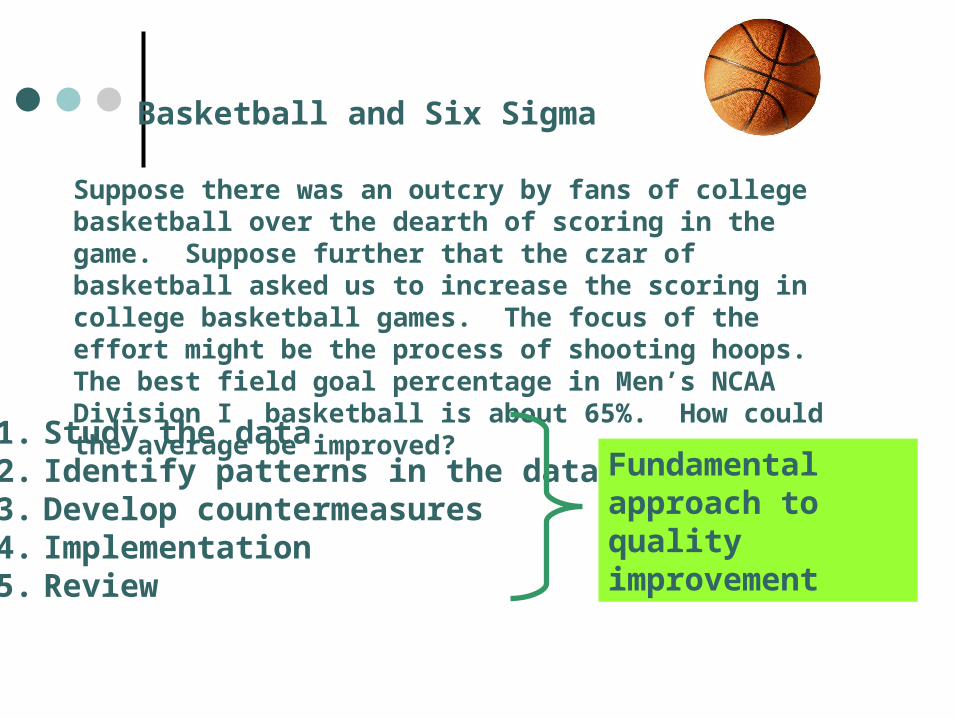
Basketball and Six Sigma
Suppose there was an outcry by fans of college basketball over the dearth of scoring in the game. Suppose further that the czar of basketball asked us to increase the scoring in college basketball games. The focus of the effort might be the process of shooting hoops. The best field goal percentage in Men’s NCAA Division I basketball is about 65%. How could the average be improved?
1. Study the data2. Identify patterns in the data3. Develop countermeasures4. Implementation5. Review
Fundamental approach toquality improvement
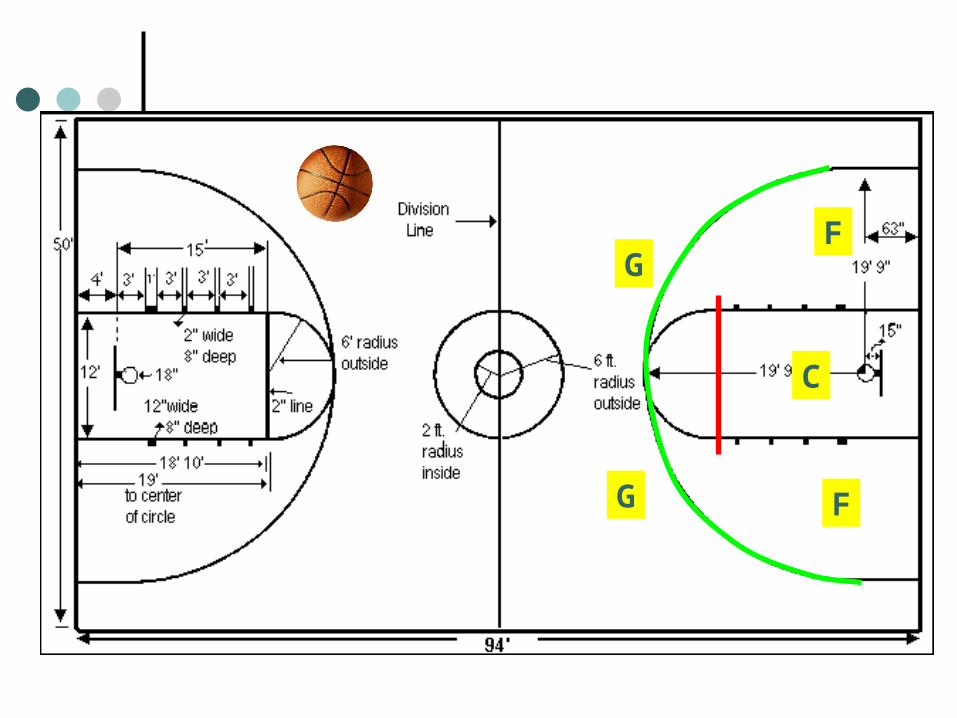
F
G
G
C
F
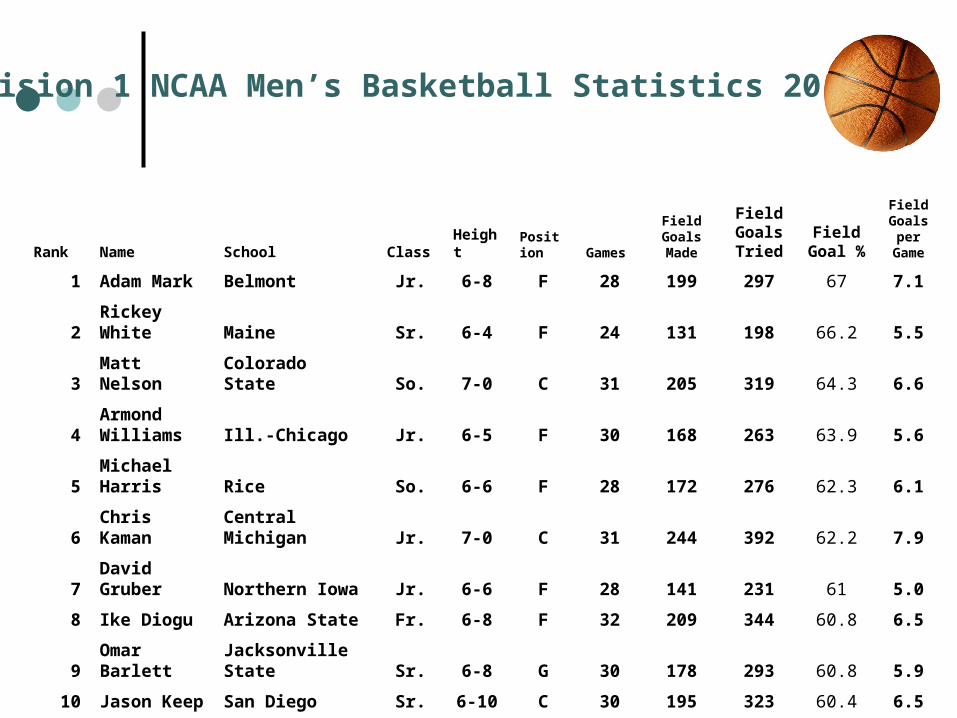
Rank Name School Class Height Position Games
Field Goals Made
Field Goals Tried
Field Goal %
Field Goals
per Game
1 Adam Mark Belmont Jr. 6-8 F 28 199 297 67 7.1
2 Rickey White Maine Sr. 6-4 F 24 131 198 66.2 5.5
3 Matt Nelson Colorado State So. 7-0 C 31 205 319 64.3 6.6
4Armond Williams Ill.-Chicago Jr. 6-5 F 30 168 263 63.9 5.6
5Michael Harris Rice So. 6-6 F 28 172 276 62.3 6.1
6 Chris Kaman Central Michigan Jr. 7-0 C 31 244 392 62.2 7.9
7 David Gruber Northern Iowa Jr. 6-6 F 28 141 231 61 5.0
8 Ike Diogu Arizona State Fr. 6-8 F 32 209 344 60.8 6.5
9 Omar Barlett Jacksonville State Sr. 6-8 G 30 178 293 60.8 5.9
10 Jason Keep San Diego Sr. 6-10 C 30 195 323 60.4 6.5
Division 1 NCAA Men’s Basketball Statistics 2002-3ncaa.org
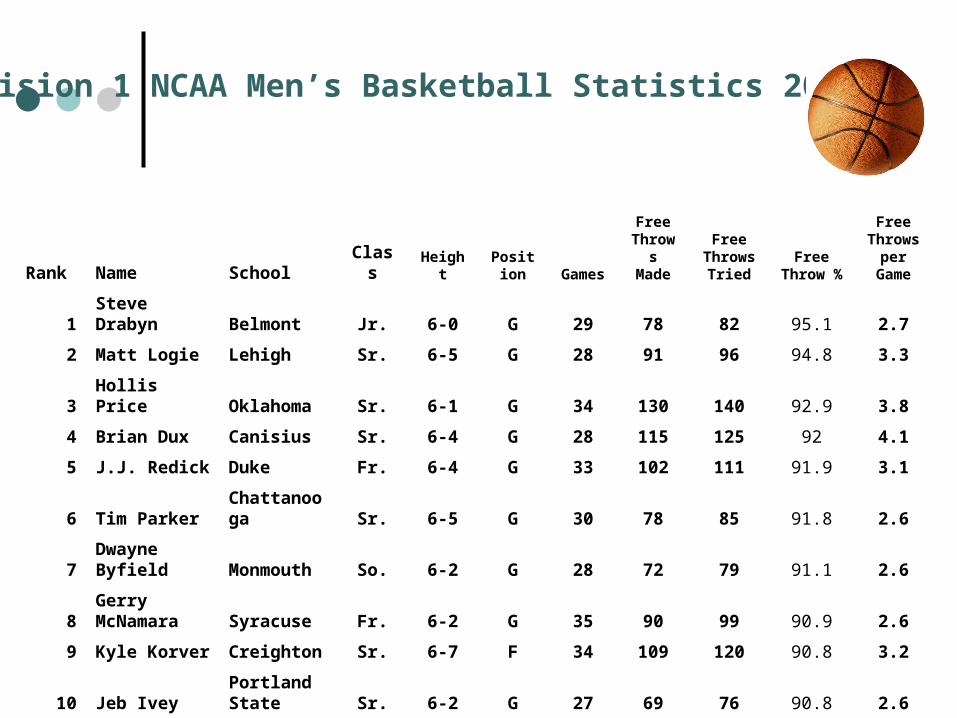
Division 1 NCAA Men’s Basketball Statistics 2002-3ncaa.org
Rank Name School Class Height Position Games
Free Throws Made
Free Throws Tried
Free Throw %
Free Throws
per Game
1 Steve Drabyn Belmont Jr. 6-0 G 29 78 82 95.1 2.7
2 Matt Logie Lehigh Sr. 6-5 G 28 91 96 94.8 3.3
3 Hollis Price Oklahoma Sr. 6-1 G 34 130 140 92.9 3.8
4 Brian Dux Canisius Sr. 6-4 G 28 115 125 92 4.1
5 J.J. Redick Duke Fr. 6-4 G 33 102 111 91.9 3.1
6 Tim Parker Chattanooga Sr. 6-5 G 30 78 85 91.8 2.6
7Dwayne Byfield Monmouth So. 6-2 G 28 72 79 91.1 2.6
8Gerry McNamara Syracuse Fr. 6-2 G 35 90 99 90.9 2.6
9 Kyle Korver Creighton Sr. 6-7 F 34 109 120 90.8 3.2
10 Jeb IveyPortland State Sr. 6-2 G 27 69 76 90.8 2.6
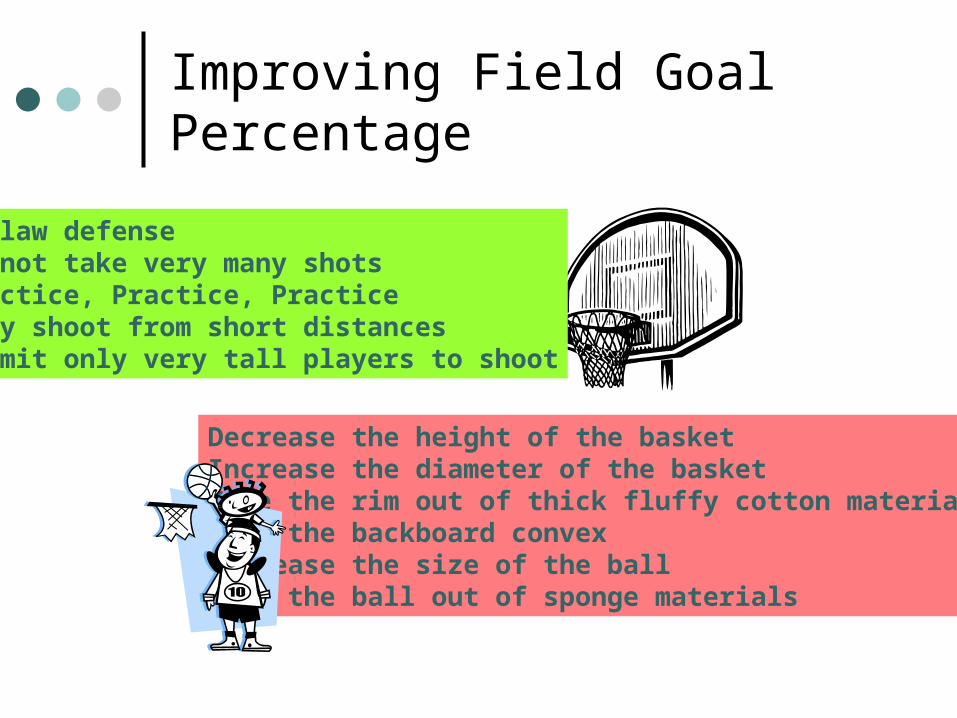
Improving Field Goal Percentage
Outlaw defenseDo not take very many shotsPractice, Practice, Practice Only shoot from short distancesPermit only very tall players to shoot
Decrease the height of the basketIncrease the diameter of the basketMake the rim out of thick fluffy cotton materialMake the backboard convexDecrease the size of the ballMake the ball out of sponge materials
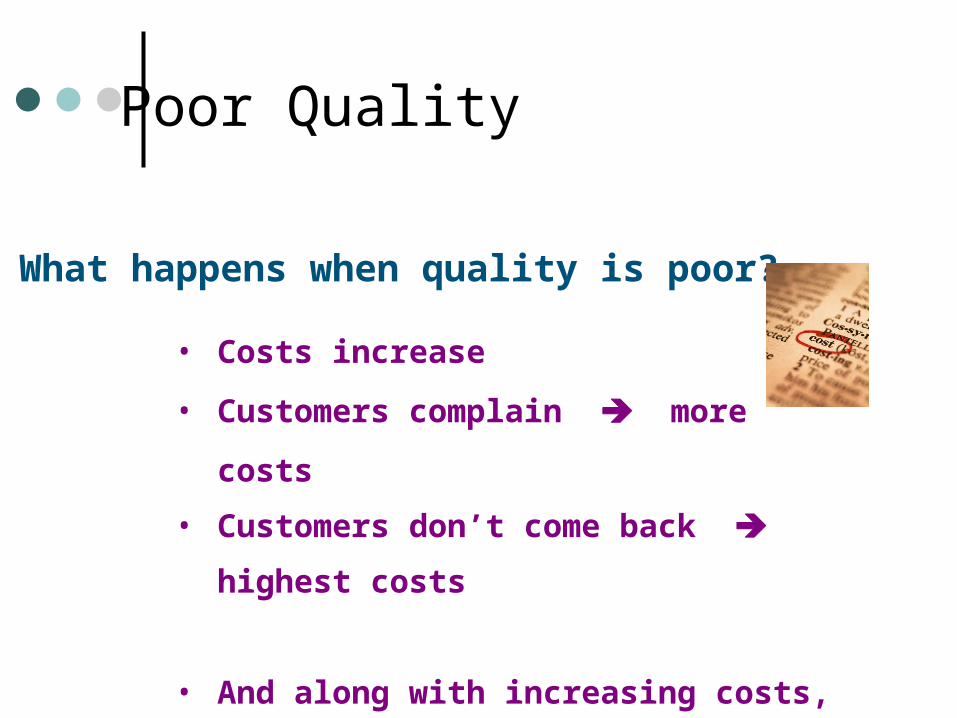
Poor Quality
What happens when quality is poor?
• Costs increase
• Customers complain more costs
• Customers don’t come back highest costs
• And along with increasing costs, you have
fewer goods or services to sell.
Cost of Quality
• Conceptual Framework
• Not Always Totally Quantifiable
• Useful for Attention Getting
• Useful as a Mechanism for Keeping Score
• Consistency of Measurement
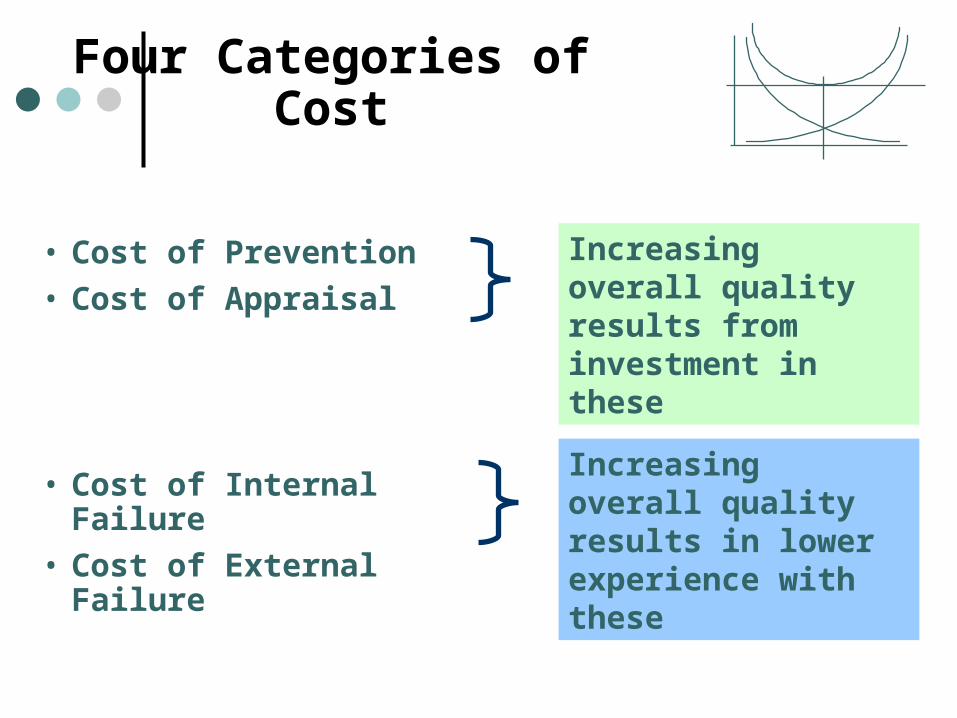
Four Categories of Cost
• Cost of Prevention
• Cost of Appraisal
• Cost of Internal Failure
• Cost of External Failure
Increasing overall quality results from investment in these
Increasing overall quality results in lower experience with these
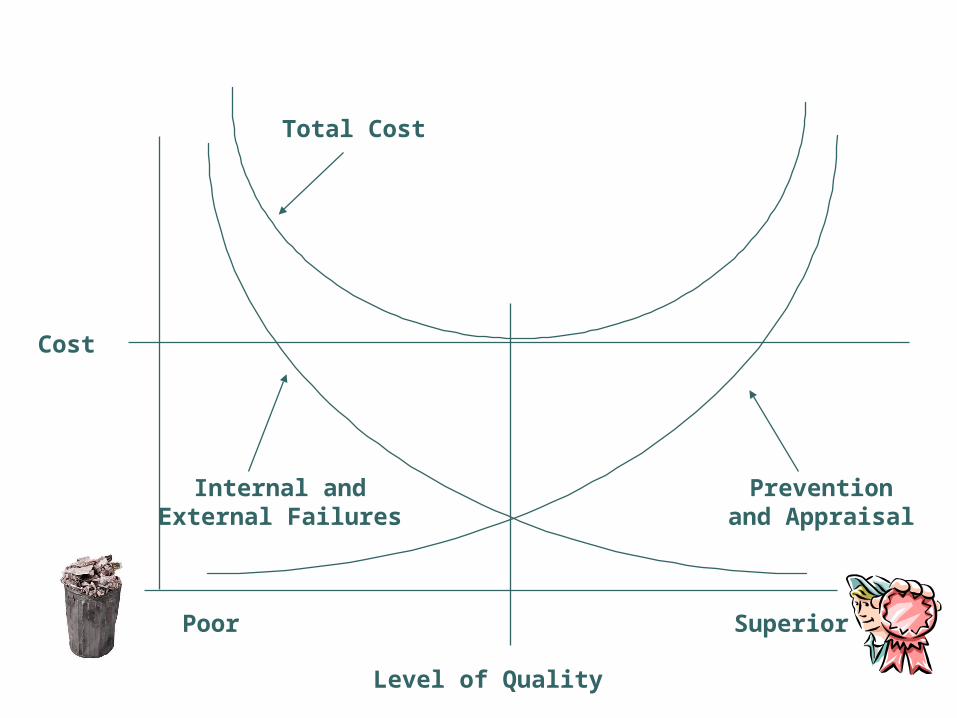
Level of Quality
Poor Superior
Cost
Internal andExternal Failures
Preventionand Appraisal
Total Cost
Cost of Prevention
• Quality Planning
• Design (Prototyping, Field Testing)
• Education and Training
• Process Control
• Information reporting
• Quality Improvement Programs, Quality Improvement Teams (QIPs and QITs)
• Supplier Involvement
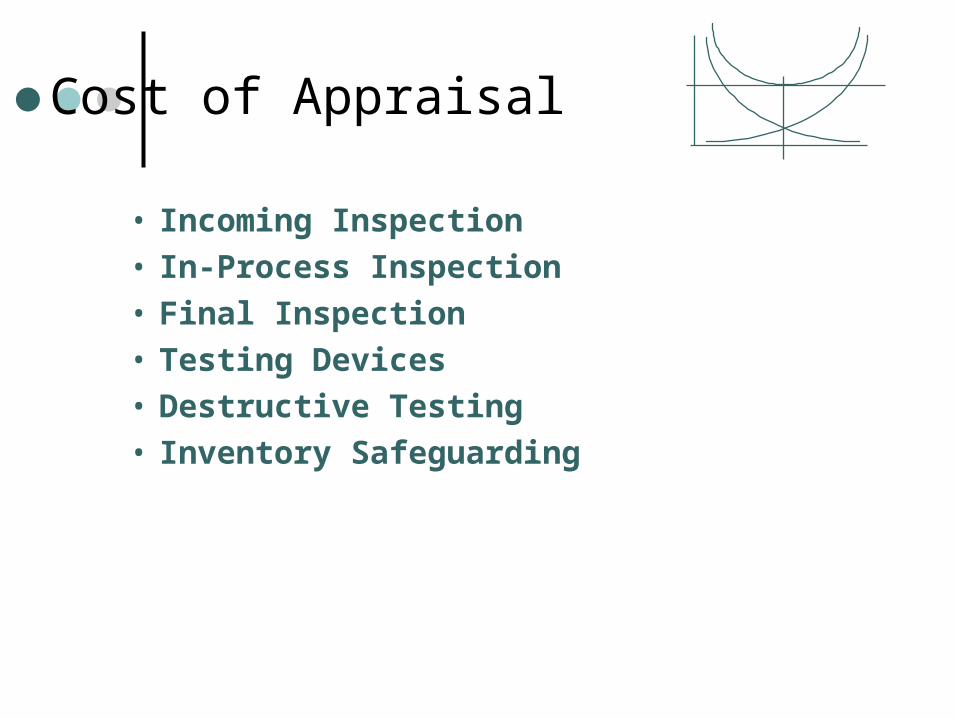
• Incoming Inspection
• In-Process Inspection
• Final Inspection
• Testing Devices
• Destructive Testing
• Inventory Safeguarding
Cost of Appraisal
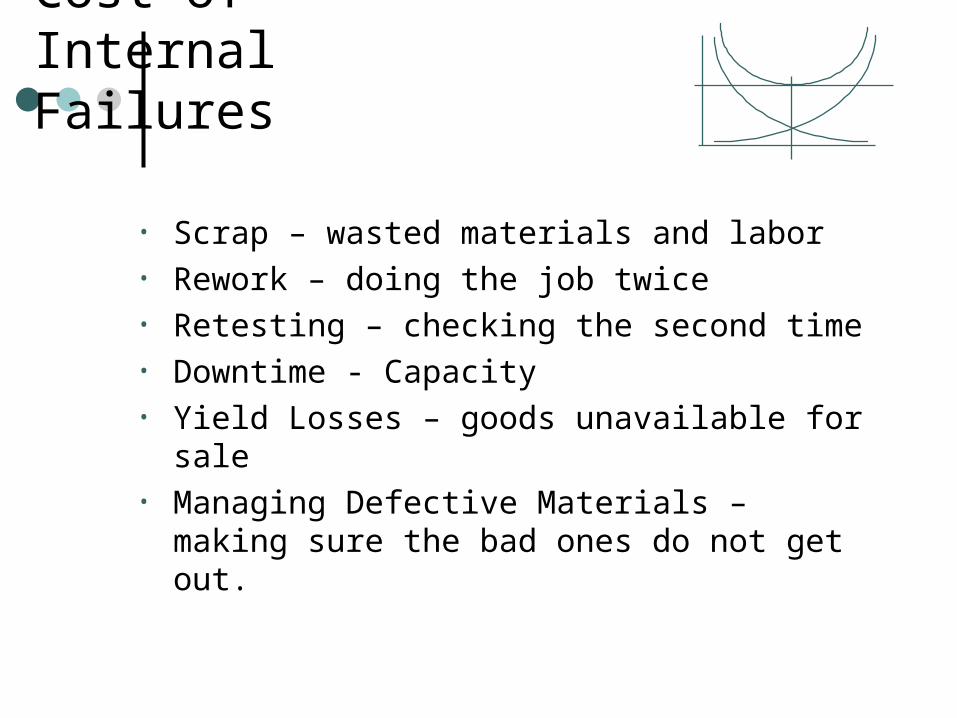
Cost of Internal Failures
• Scrap – wasted materials and labor• Rework – doing the job twice• Retesting – checking the second time• Downtime - Capacity• Yield Losses – goods unavailable for sale• Managing Defective Materials – making sure the
bad ones do not get out.
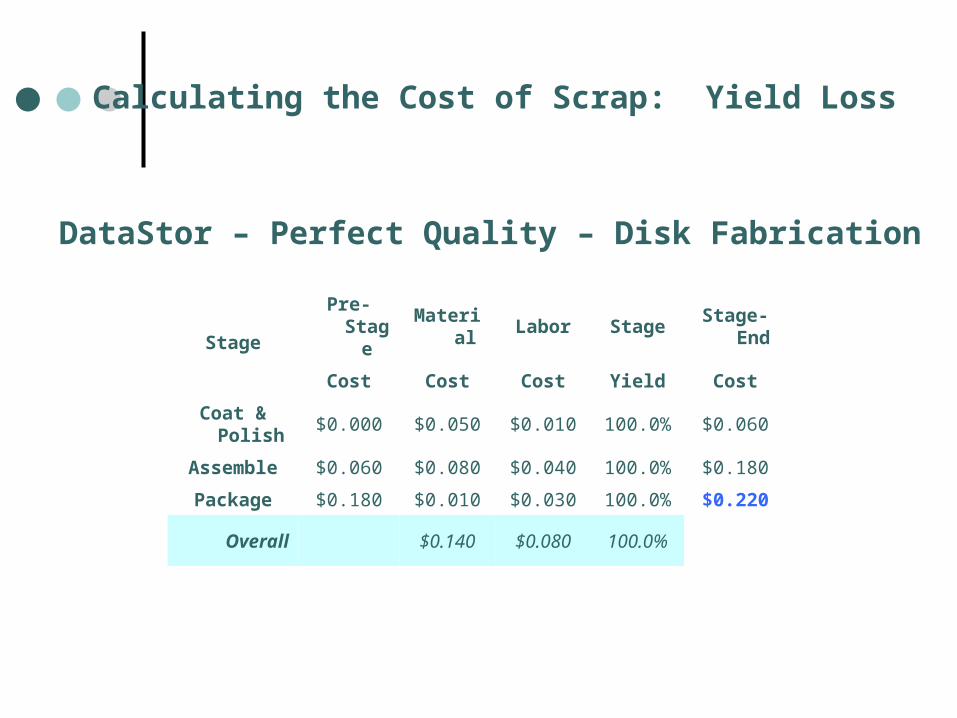
StagePre-Stage Material Labor Stage Stage-End
Cost Cost Cost Yield Cost
Coat & Polish
$0.000 $0.050 $0.010 100.0% $0.060
Assemble $0.060 $0.080 $0.040 100.0% $0.180
Package $0.180 $0.010 $0.030 100.0% $0.220
Overall $0.140 $0.080 100.0%
Calculating the Cost of Scrap: Yield Loss
DataStor – Perfect Quality – Disk Fabrication
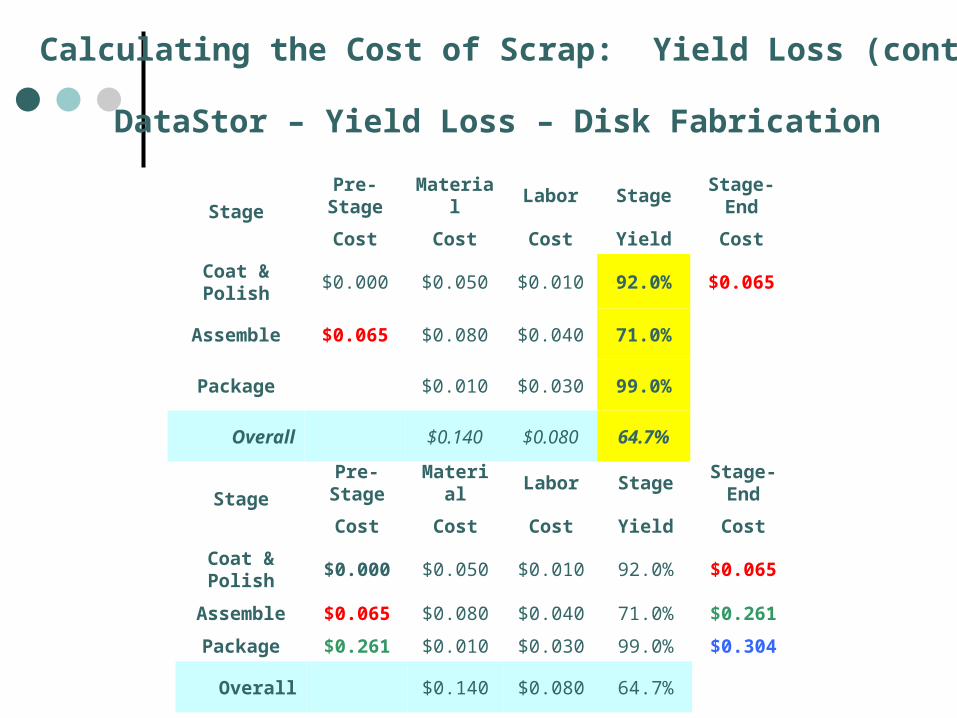
Calculating the Cost of Scrap: Yield Loss (cont.)
DataStor – Yield Loss – Disk Fabrication
StagePre-Stage Material Labor Stage Stage-End
Cost Cost Cost Yield Cost
Coat & Polish
$0.000 $0.050 $0.010 92.0% $0.065
Assemble $0.065 $0.080 $0.040 71.0% $0.261
Package $0.261 $0.010 $0.030 99.0% $0.304
Overall $0.140 $0.080 64.7%
StagePre-Stage Material Labor Stage Stage-End
Cost Cost Cost Yield Cost
Coat & Polish $0.000 $0.050 $0.010 92.0% $0.065
Assemble $0.065 $0.080 $0.040 71.0%
Package $0.010 $0.030 99.0%
Overall $0.140 $0.080 64.7%
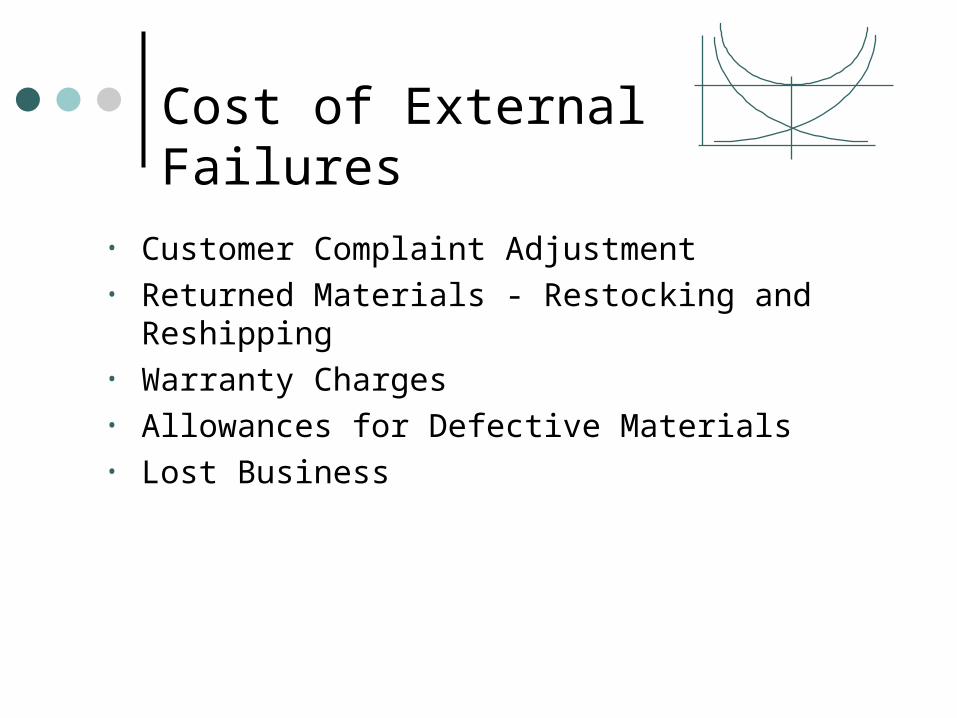
Cost of External Failures• Customer Complaint Adjustment• Returned Materials - Restocking and Reshipping• Warranty Charges• Allowances for Defective Materials• Lost Business
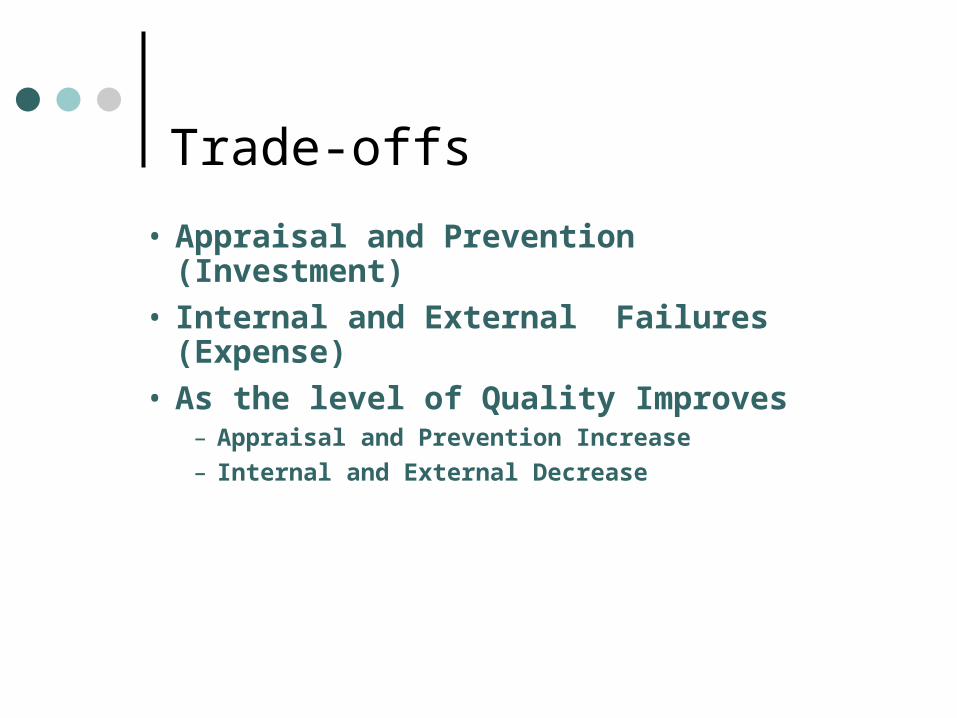
• Appraisal and Prevention (Investment)
• Internal and External Failures (Expense)
• As the level of Quality Improves– Appraisal and Prevention Increase
– Internal and External Decrease
Trade-offs
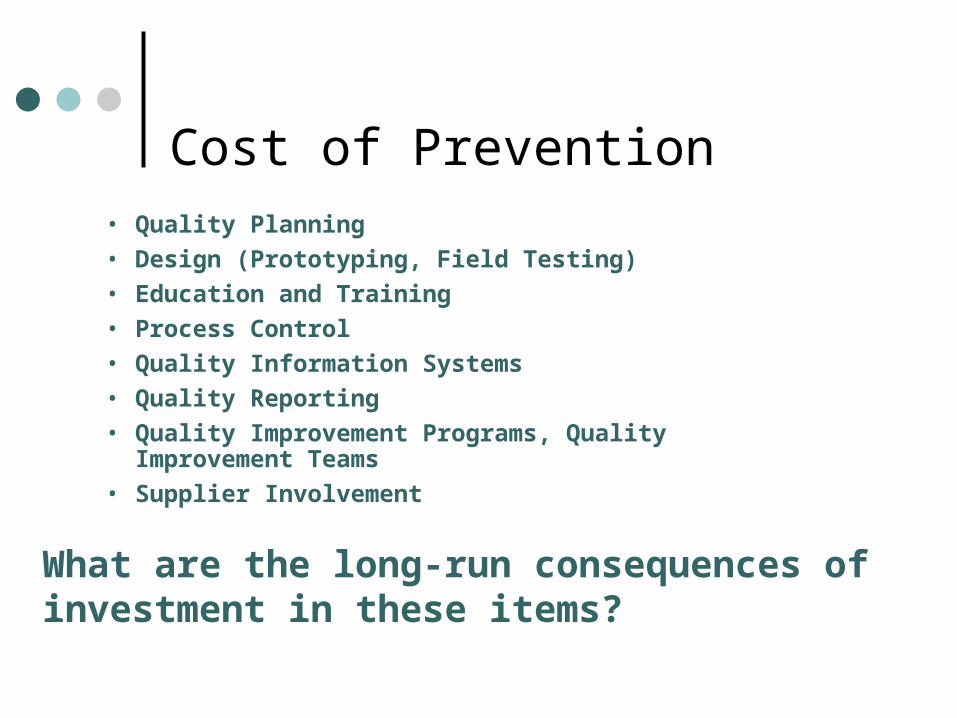
• Quality Planning
• Design (Prototyping, Field Testing)
• Education and Training
• Process Control
• Quality Information Systems
• Quality Reporting
• Quality Improvement Programs, Quality Improvement Teams
• Supplier Involvement
What are the long-run consequences of investment in these items?
Cost of Prevention
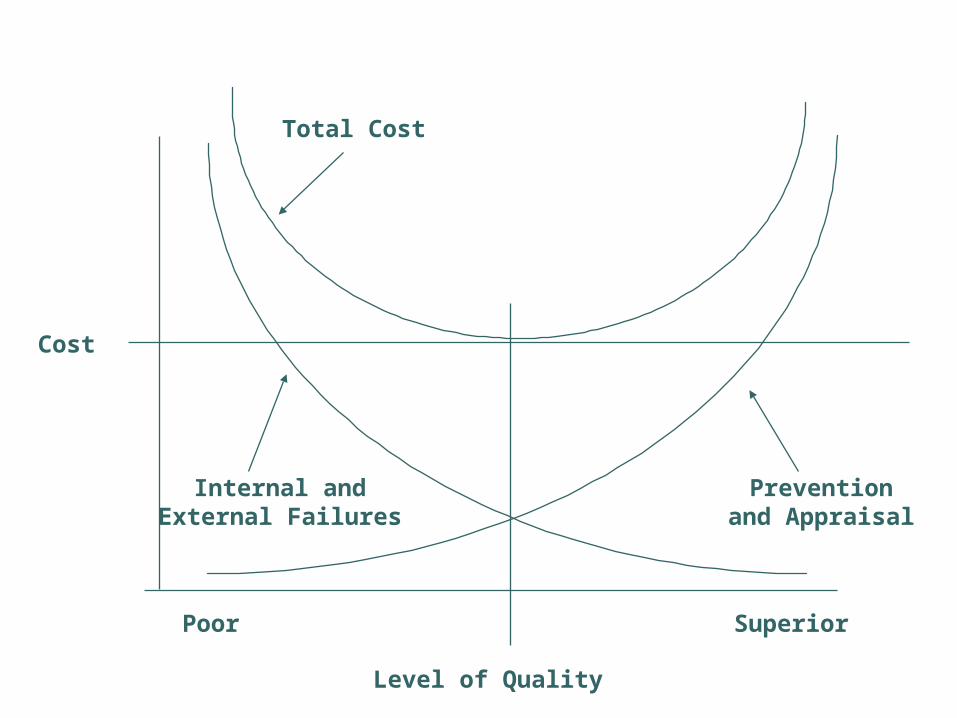
Level of Quality
Poor Superior
Cost
Internal andExternal Failures
Preventionand Appraisal
Total Cost