september 17, 2021 ms. marlene h. dortch secretary federal
TRANSCRIPT

September 17, 2021 BY ELECTRONIC FILING Ms. Marlene H. Dortch Secretary Federal Communications Commission 45 L Street NE Washington, DC 20554
Re: Notice of Proposed Rulemaking (NPRM) on FM Broadcast Booster Stations, MB Docket No. 20-401, RM-11854; Modernization of Media Initiative, MB Docket No. 17-105
Dear Ms. Dortch: Covington & Burling LLP is pleased to share the results of extensive testing of FM radio geo-targeting technology by Roberson and Associates, LLC (“Roberson”).1 The attached technical report assesses the performance and end-user experience from the deployment of one type of such technology -- called ZoneCastingTM -- created by GeoBroadcast Solutions. Roberson conducted this research in partnership with KSJO(FM) (San Jose, CA) in July-August 2021. The attached report shows that geo-targeting technology works with both analog and HD radio systems and does not affect the performance of the EAS system. Further, the report shows that the transition areas between zones -- which are entirely within the control of the broadcaster -- can be designed and programmed to take up a miniscule portion of a station’s service area and be infrequent, transitory, unobjectionable, and in most cases unobservable to the listener. As has been explained in the above-captioned proceeding, many types of media such as online content companies, cable companies, and TV broadcasters use advanced technology to deliver geo-targeted content to their audience. The radio broadcast industry historically has not been able to deliver geo-targeted content to its audience. Geo-targeting broadcast technology creates local zones out of an FM and FM+HD broadcast coverage area to enable unique, targeted programming and advertising for listeners in the zone during short periods (e.g., 3 minutes per hour) and are designed to not impact the listener experience. The zones are created using
1 Roberson and Associates, LLC, is a recognized authority on services in the areas of radio frequency (RF) spectrum management, RF measurement and analysis, strategy development, and technology management. Together, the organization has over 1,400 years of high technology management and technical leadership experience with a strong telecommunications focus.

2
carefully located booster transmitters and appropriately designed antennas to overlay a stronger, geographically localized signal in the targeted region.
The attached report analyzes a geo-targeted broadcast demonstration system Roberson deployed in the KSJO(FM) broadcaster coverage area using ZoneCasting technology. A local broadcast zone was created while minimizing transition areas. Transition areas are geographic regions where the power of the localized zone signal is similar to the power of the Main FM broadcast signal, and they can be designed to be located in mostly unpopulated areas. Brief transitions may also occur for listeners in automobiles entering and leaving the zone during the time-limited local broadcast events.
Using this demonstration system, Roberson conducted drive tests in real world environments using a commercial grade deployment, with primary focus on traversal of the zone transition region. Detailed data was collected on the FM and HD signal performance (e.g., multipath parameter) and audio/video quality. Over 31 hours of received audio and almost 11 hours of video content was recorded over multiple weeks of measurement studies for further analysis and review. The zone transition region was traversed over 60 times at variable speeds and at various times of day using several vehicle makes/models.
In this report, Roberson structured their research findings to assess: (1) disruption to the listener experience in FM transition zones; (2) the performance of HD systems in transition zones; (3) impacts on the consumer experience shown by variations in the received audio or metadata display performance of the system; (4) the quality of geo-targeted content for the listener experience; and (5) the operation of the emergency alert system (EAS) geo-targeting override. These research parameters were defined by questions and points of criticism raised by commenters in the above-captioned proceeding. Below, we provide a brief summary of how Roberson’s research was conducted and the report’s key findings.
1. Research Conditions and Methodology KSJO currently operates two transmitters, the main transmitter covering the region from an elevated site south of San Jose and a low power booster that covers the northern area of the broadcast zone from an elevated site. The two coverage areas are separated by a largely unpopulated mountain range. Both zones carry hybrid FM, HD1 and HD2 programming. To conduct this test, Roberson drove measurement vehicles over the zone transition region. These vehicles included models from different manufacturers which were outfitted with the equipment to measure received signal and audio/video/Metadata quality for the FM and HD Radio signals. Roberson’s research was conducted primarily while driving on Interstate 680, a major highway that connects the two listening areas. The drive tests were followed by the analysis of over 31 hours of received audio and almost 11 hours of video content that was recorded over the multiple weeks of measurement studies. The zone transition region was traversed over 60 times at variable speeds and at various times of day using several vehicle makes/models, with 32 randomly selected for transition length measurements.

3
The conditions for the drive tests in this demonstration system were: (1) entering a zone when geo-targeted broadcast is active; (2) exiting a zone while a geo-targeted broadcast is active; (3) confining a drive route in the known interior of a zone region. Each of these conditions was designed to assess particular parameters of interest, as described below.
2. Key Findings and Conclusions Based on their research, Roberson concluded that geo-targeted content is not likely to create any material disturbance in the listener experience. We further detail the report’s key findings below:
• Listeners in FM transition zones experienced no material change. One metric used to assess the degradation of the listener experience in transition zones was the multipath threshold, which measures the reception of multiple versions of a desired signal, which are often caused by environmental processes, such as reflections off nearby buildings or terrain. In the case of geo-targeted transmissions, there are two signals (both desired by the broadcaster) being combined at the receive antenna as a zone transition occurs. Based on Roberson’s experience with the drive tests, advice from experts in the field and lab testing, they defined the multipath threshold for degraded audio quality at 20%. Roberson found that background environmental multipath events exceeding this threshold were far more numerous than zone transition multipath events. In fact, several zone transition multipath events did not exceed this threshold. Thus, the introduction of limited zone transitions will not materially alter a listener’s existing expectation of audio quality. Transitions zones occupy a miniscule portion of the territory served by geo-
targeted content. Roberson also measured the distance of the transition zone when traveling on a linear path perpendicular to the transition boundary and found that the mean distance of the transition zone is 50.2 meters, with a 25.4 meter standard deviation, an insignificant distance in consideration of the total length of 621,000 meters of road that could be traversed by a listener in the broadcast coverage area. Moreover, as in the KSJO coverage area, transition zones are frequently designed to fall in unpopulated areas without roads.

4
Signal was stable inside the transition zones. Finally, Roberson assessed the signal instability in transition zones, based on concerns that there could be areas in which it is possible to move for long distances along a zone transition boundary, thus creating the conditions for regular and objectionable signal instability (i.e., “frequent switches between different audio programs, as determined by the FM receiver’s capture effect”).2 After Roberson’s extensive field tests in which they experienced over 60 geo-targeting broadcast transitions, they did not hear the signal instability of concern occur even once.
• Listener experience of HD systems in transition zones. The HD1 listening experience
demonstrated almost instantaneous transitions between zones without noticeable audio degradation. Although Roberson observed short audio dropouts in the HD2 transition zone, they believe that the duration of dropout can be reduced through the use of synchronized exporters.
• Consumer experience shown by variations in the received audio or metadata display performance of the system. Roberson observed no evidence that zone transitions cause noticeable variation in the received metadata display performance. They tested this issue by observing images of the entertainment system screens of different vehicles captured on a GoPro camera while traversing transition zones. Furthermore, they observed no evidence that the make, model, or installation of a particular receiver causes noticeable variation in the received audio performance.
• Quality of geo-targeted content for the listener experience. The research demonstrates that the geo-targeted zone created by the boosters significantly improved coverage and signal quality within a zone. Moreover, the demo system is “a credible instance of an actual commercial deployment” and used both live traffic reports and real commercial broadcast content.
• Operation of the EAS geo-targeting override. The research confirms that geo-targeted broadcasting will not affect the performance of the EAS system. Roberson tested this issue through simultaneous reception of identical EAS tones at two locations, using separate measurement systems in two separate vehicles.
2 Commenters on the GeoBroadcast NPRM have utilized the term interference to describe events associated with a geo-targeted broadcast zone transition event. While this term may be intended to describe potential user response to the transition, it is not appropriate to this scenario in which a single broadcaster is managing a multipath scenario. The FCC defines interference as “the effect of unwanted energy . . . upon reception in a radiocommunications system.” 47 C.F.R. § 2.1. There is no unwanted energy in this context. Both signals are by definition wanted -- it is the same radio broadcaster deploying both, in order to improve coverage and create geo-targeted content. The report therefore discusses the behavior of the received signal associated with a geo-targeted broadcast zone transition event in terms of “signal stability” as opposed to “interference.”

5
Roberson’s research demonstrates that FM radio geo-targeting technology can be deployed on both analog and HD radio systems and without affecting the performance of the EAS system. Further, it shows that transition zones are wholly within the control of the broadcaster, and can be designed and programmed so as not to have material impact to the listener experience (other than the benefits to listeners of geo-targeted programming detailed in this docket). We hope that this report is responsive to the questions raised by commenters in this proceeding.
Sincerely, _______________________ Gerard J. Waldron Partner, Covington & Burling LLP
Attachment cc: Albert Shuldiner, James Bradshaw, Holly Saurer, Ben Arden, Diane Holland, and Adam
Cassady
/s/

Roberson and Associates, LLC
Technology and Management Consultants
Roberson and Associates, LLC
KSJO DEMONSTRATION SYSTEM
GEO-TARGETED FM/HD BROADCAST TECHNICAL REPORT
This report delivers a summary of key technical measurements and associated analysis information on the performance of the geo-targeted broadcast demonstration system deployed in collaboration with the KSJO commercial FM radio station. Additional technical information necessary to understand the context for this demonstration system’s performance is also provided.
Prepared for: GeoBroadcast Solutions
Date: 17 September 2021
Version: 1.0
Roberson and Associates, LLC
Contributors: R. Addi, M. Birchler, J. Grosspietsch, E. Porrett, D. Roberson & K. Zdunek

KSJO TECHNICAL REPORT | 17 SEPTEMBER 2021 | VERSION 0.99
2 Roberson and Associates, LLC
EXECUTIVE SUMMARY Many media such as online content companies, cable companies, and TV broadcasters use advanced technology to deliver geo-targeted content to their audience. The radio broadcast industry historically has not been able to deliver geo-targeted content to its audience. Geo-targeting broadcast technology creates local zones out of an FM and FM+HD broadcast coverage area to enable unique, targeted programming and advertising for listeners in the zone during short periods (e.g., 3 minutes per hour) and are designed to not impact the listener experience. The zones are created using carefully located booster transmitters and appropriately designed antennas to overlay a stronger, geographically localized signal in the targeted region.
The basis for this report is a geo-targeted broadcast demonstration system that has been deployed in the KSJO (San Jose, CA) broadcaster coverage area using ZoneCastingTM technology created by GeoBroadcast Solutions. A local broadcast zone was created while minimizing transition areas. Transition areas are geographic regions where the power of the localized zone signal is similar to the power of the Main FM broadcast signal, and they can be designed to be located in mostly unpopulated areas. Brief transitions may also occur for listeners in automobiles entering and leaving the zone during the time-limited local broadcast events. These transition areas are designed and programmed to be infrequent, transitory, unobjectionable and in most cases unobservable.
This demonstration system allowed drive tests to be conducted in real world environments using a commercial grade deployment, with primary focus on traversal of the zone transition region. Detailed data was collected on the FM and HD signal performance (e.g., multipath parameter) and audio/video quality. Over 31 hours of received audio and almost 11 hours of video content was recorded over multiple weeks of measurement studies for further analysis and review. The zone transition region was traversed over 60 times at variable speeds and at various times of day using several vehicle makes/models, with 32 randomly selected for transition length measurements.
This report shares the data collected for this demonstration system, provides technical and as appropriate, experiential assessments, discusses the implications for geo-targeted broadcast viability, addresses various questions raised in FCC NPRM Filings and in private meetings, and proposes next steps concerning identified issues. Key conclusions include:
• General Transition (see Section 4.1 for detailed results) o Our measurement results using the Nomad measurement device’s multipath
parameter, a useful indicator of disruption to a listener’s experience, indicate a mean analog FM zone transition distance of 50.2 meters with a 25.4-meter standard deviation. This distance of 50 meters is insignificant when compared to the total
length of roads within the zone, i.e., 621,000 meters, that could be traversed by a listener.
o The area over which this analog FM zone transition occurs is highly stable as is the general received signal behavior.
o The zone transition boundary was designed to cut perpendicularly across Interstate 680, resulting in a highly controlled, small transition region. The balance of this boundary was designed to fall on unpopulated areas without roads.

KSJO TECHNICAL REPORT | 17 SEPTEMBER 2021 | VERSION 0.99
3 Roberson and Associates, LLC
o In driving over 60 geo-targeting broadcast transitions, the observer team did not detect signal instability due to multiple FM capture events occur.
• HD Performance (see Section 4.2 for detailed results) o The overall zone transition listening experience for HD1 was very good, with
almost instantaneous transitions without noticeable audio degradation. o The HD2 transition zone experience revealed short audio dropouts, as expected
due partially to the current use of unsynchronized HD Exporters for HD2, 3 and 4 programming. It is anticipated that the duration of this dropout can be reduced through use of synchronized exporters.
o Over weeks of testing, there was no evidence of any behavior that could be remotely described as a “dead zone.”
• Consumer Experience (see Section 4.3 for detailed results) o Based on extensive GoPro visual data, there was no evidence that zone transitions
cause noticeable variation in received Metadata display performance. o Based on numerous vehicles used to traverse the zone transition region, there was
no evidence that receiver make/model/installation variations cause noticeable variation in received audio performance.
• Commercial Deployment and Coverage (see Section 4.4 for detailed results) o In both key design areas (i.e., minimized transition region and improved zone
coverage) the demo system is “a credible instance of an actual commercial deployment.”
o Both live traffic reports and real commercial advertisements were included in the broadcast content, thus meeting the requirement.
o We assessed general zone coverage, with results clearly indicating that: The geo-targeting zone created by the boosters significantly improves
coverage within the zone. Neither the mountain pass nor the zone interior is "terrain-shielded" in the
sense of having no usable broadcast signal.
• Emergency Alert System (EAS) (see Section 4.5 for detailed results) o Operation of the KSJO EAS geo-targeting override was tested simultaneously in
two locations to ensure that the EAS broadcast controls function properly. o The simultaneous reception of identical EAS tones at these two locations confirms
that geo-targeted broadcasting will not affect performance of the EAS system.
Commenters on the GeoBroadcast NPRM have utilized the term interference to describe events associated with a geo-targeted broadcast zone transition event. While this term may be intended to describe potential user response to the transition, it is not appropriate to this scenario in which a single broadcaster is managing main and zone transmission sources which may have different content (see Section 3.2). We therefore discuss the behavior of the received signal associated with a geo-targeted broadcast zone transition event in terms of “signal stability” as opposed to “interference.”

KSJO TECHNICAL REPORT | 17 SEPTEMBER 2021 | VERSION 0.99
4 Roberson and Associates, LLC
Table of Contents
EXECUTIVE SUMMARY ........................................................................................................... 2
1 BACKGROUND ..................................................................................................................... 7 1.1 DEMONSTRATION SYSTEM ................................................................................................... 7 1.1.1 PURPOSE AND GOALS .......................................................................................................... 7 1.1.2 DEMO APPROACH ................................................................................................................ 9 1.2 SUCCESS CRITERIA ............................................................................................................. 11 1.2.1 BACKGROUND ON CONTRIBUTORS ................................................................................... 11 1.2.2 GENERAL TRANSITION ...................................................................................................... 12 1.2.3 HD PERFORMANCE............................................................................................................ 13 1.2.4 CONSUMER EXPERIENCE ................................................................................................... 13 1.2.5 COMMERCIAL DEPLOYMENT AND COVERAGE .................................................................. 14 1.2.6 EMERGENCY ALERT SYSTEM (EAS) ................................................................................. 15
2 DATA COLLECTION ......................................................................................................... 16 2.1 EQUIPMENT ......................................................................................................................... 16 2.2 MEASUREMENT PARAMETERS ........................................................................................... 16 2.2.1 FM ..................................................................................................................................... 17 2.2.2 HD1 AND HD2 .................................................................................................................. 17 2.2.3 COMMERCIAL RECEIVER AUDIO RECORDINGS ................................................................. 17 2.2.4 AUDIO/VIDEO RECORDINGS .............................................................................................. 17 2.2.5 PRACTICAL CONSIDERATIONS........................................................................................... 18
3 KEY PERFORMANCE EVALUATION ISSUES ............................................................. 18 3.1 TRANSITION ZONE SIZE ..................................................................................................... 18 3.1.1 MULTIPATH PARAMETER FOR FM TRANSITION REGION SIZE ASSESSMENT .................... 18 3.1.1.1 Commercial Receiver Audio Quality ............................................................................. 19 3.1.1.2 Relative Distance from Transition Zone Mid-Point ....................................................... 19 3.1.1.3 Surrounding Environmental Multipath Events .............................................................. 19 3.1.2 HD RADIO TRANSITION REGION SIZE ASSESSMENT......................................................... 19 3.1.3 ZONE TRANSITION REGION SIZE ESTIMATION METHODOLOGY ....................................... 20 3.2 “INTERFERENCE” IN A DUAL CONTENT, GEO-TARGETED CONTEXT............................. 21
4 RESULTS .............................................................................................................................. 22 4.1 GENERAL TRANSITION ....................................................................................................... 22 4.1.1 DEMO TEST ENVIRONMENT .............................................................................................. 22 4.1.2 ANALOG FM TRANSITION REGION SIZE ........................................................................... 22 4.1.2.1 Baseline Data ................................................................................................................. 22 4.1.2.2 Assessment ..................................................................................................................... 25 4.1.3 TRANSITION REGION SIGNAL STABILITY .......................................................................... 27 4.1.4 MOBILE TEST ENVIRONMENT ........................................................................................... 28 4.2 HD PERFORMANCE ............................................................................................................. 28 4.2.1 HD RADIO TRANSITIONS ................................................................................................... 28 4.2.1.1 HD1 Transition .............................................................................................................. 28 4.2.1.2 HD2 Transition .............................................................................................................. 29 4.2.2 HD “DEAD ZONES” ........................................................................................................... 29
KSJO TECHNICAL REPORT | 17 SEPTEMBER 2021 | VERSION 0.99
5 Roberson and Associates, LLC
4.2.2.1 General Comments ......................................................................................................... 29 4.2.2.2 Design Considerations ................................................................................................... 30 4.3 CONSUMER EXPERIENCE ................................................................................................... 30 4.3.1 METADATA ........................................................................................................................ 30 4.3.2 MULTIPLE COMMERCIAL RECEIVERS ............................................................................... 32 4.4 COMMERCIAL DEPLOYMENT AND COVERAGE................................................................. 32 4.4.1 COMMERCIAL DEPLOYMENT AND CONTENT .................................................................... 32 4.4.2 COMMERCIAL COVERAGE ................................................................................................. 32 4.5 EMERGENCY ALERT SYSTEM (EAS) ................................................................................. 34
5 CONCLUSIONS ................................................................................................................... 36 5.1 SUCCESS CRITERIA ASSESSMENT ...................................................................................... 36 5.1.1 GENERAL TRANSITION ...................................................................................................... 36 5.1.2 HD PERFORMANCE............................................................................................................ 36 5.1.3 CONSUMER EXPERIENCE ................................................................................................... 37 5.1.4 COMMERCIAL DEPLOYMENT AND COVERAGE .................................................................. 37 5.1.5 EMERGENCY ALERT SYSTEM (EAS) ................................................................................. 37 5.2 OVERALL TECHNICAL VIABILITY ASSESSMENT .............................................................. 38
REFERENCES ............................................................................................................................ 39
A. KEY CONTRIBUTOR BIOS .............................................................................................. 40
B. “SUCCESS CRITERIA” SOURCES .................................................................................. 42
C. DATA COLLECTION CAMPAIGNS ................................................................................ 43
D. DEMO AND DATA COLLECTION DETAILS ................................................................ 44

KSJO TECHNICAL REPORT | 17 SEPTEMBER 2021 | VERSION 0.99
6 Roberson and Associates, LLC
Figures FIGURE 1. SAN FRANCISCO BAY AREA GEOGRAPHIC FEATURES ............................................................................................ 7 FIGURE 2. KSJO COVERAGE AND SAN FRANCISCO-OAKLAND-SAN JOSE DMA ................................................................... 8 FIGURE 3. KSJO DEMONSTRATION SYSTEM OVERVIEW ........................................................................................................ 10 FIGURE 4. SIMPLIFIED DIAGRAM OF DRIVE TESTS ................................................................................................................. 11 FIGURE 5. SUCCESS CRITERIA: GENERAL TRANSITION .......................................................................................................... 12 FIGURE 6. SUCCESS CRITERIA: HD PERFORMANCE ................................................................................................................ 13 FIGURE 7. SUCCESS CRITERIA: CONSUMER EXPERIENCE ....................................................................................................... 14 FIGURE 8. SUCCESS CRITERIA: COMMERCIAL DEPLOYMENT AND COVERAGE .................................................................... 14 FIGURE 9. SUCCESS CRITERIA: EAS ........................................................................................................................................... 15 FIGURE 10. ZONE TRANSITION REGION SIZE METHODOLOGY EXAMPLE ........................................................................... 20 FIGURE 11. NOMAD MULTIPATH DATA ..................................................................................................................................... 21 FIGURE 12. START (GREEN) / STOP (RED) TRANSITION EVENT MARKERS CONNECTED BY BLUE LINES .................. 23 FIGURE 13. ZONE ROAD LENGTH ESTIMATION POLYGON ..................................................................................................... 25 FIGURE 14. ANALOG FM TRANSITION FAMILY OF MULTIPATH CURVES ............................................................................ 27 FIGURE 15. EXAMPLE HD2 AUDIO TRACE DURING ZONECASTING TRANSITION................................................................ 29 FIGURE 16. BACK-TO-BACK, HIGH FRONT-TO-BACK RATIO ANTENNAS AT FM2-FM3 BOOSTER SITE ..................... 30 FIGURE 17. ENTERTAINMENT SYSTEM SCREEN IN MAIN SIGNAL AREA ............................................................................. 31 FIGURE 18. ENTERTAINMENT SYSTEM SCREEN IN TRANSITION AREA ............................................................................... 31 FIGURE 19. ENTERTAINMENT SYSTEM SCREEN AFTER UPDATE OF ARTIST EXPERIENCE IMAGE ................................. 31 FIGURE 20. KSJO ZONE COVERAGE ........................................................................................................................................... 33 FIGURE 21. KSJO RSSI DATA WITH AND WITHOUT ACTIVE BOOSTERS ........................................................................... 34 FIGURE 22. EAS PROGRAMMING BLOCK DIAGRAM ................................................................................................................ 34 FIGURE 23. EAS ALERT TONE AUDIO DATA WITH GEO-TARGETED BROADCASTING ...................................................... 35 FIGURE 24. TOW DUAL-BOOSTER LOCATION ........................................................................................................................ 44 FIGURE 25. FM2 (LEFT) AND FM3 (RIGHT) BOOSTER ANTENNAS .................................................................................... 45 FIGURE 26. VIEW TOWARDS THE NE FROM FM2 SITE SHOWING I-680. ......................................................................... 45 FIGURE 27. VIEW TOWARDS FREMONT ON I-680 FROM SOUTHWEST EDGE OF THE HILL. ........................................... 46 FIGURE 28. PHOTOGRAPH OF GOPRO MOUNT AND CAMERA WITH MEDIA MOD ............................................................. 46
Tables TABLE 1. VEHICLE TEST AND MEASUREMENT SYSTEM EQUIPMENT LIST .......................................................................... 16 TABLE 2. FM MEASUREMENTS ................................................................................................................................................... 17 TABLE 3. HD1 AND HD2 MEASUREMENTS ............................................................................................................................. 17 TABLE 4. ANALOG FM TRANSITION REGION SIZE RESULTS ................................................................................................. 24 TABLE 5. ZONE ROAD LENGTHS ................................................................................................................................................. 26 TABLE 6. COMMERCIAL RADIOS TESTED .................................................................................................................................. 32 TABLE 7. DATA COLLECTION CAMPAIGN TRIPS....................................................................................................................... 43 TABLE 8. DATA COLLECTION STATISTICS ................................................................................................................................. 43

KSJO TECHNICAL REPORT | 17 SEPTEMBER 2021 | VERSION 0.99
7 Roberson and Associates, LLC
1 BACKGROUND
1.1 Demonstration System
1.1.1 Purpose and Goals The KSJO demonstration system is intended to show how geo-targeted broadcasting can deliver significant value to broadcasters, advertisers, emergency alert systems and distinct communities with more relevant programming and information. For example, a zone can be designed to serve a specific geographically localized community with relevant traffic and weather information, or with community relevant language and/or culturally specific content. Two broadcasters have previously deployed geo-targeted demonstration systems using ZoneCastingTM technology1, with KSJO being the third and most recent and likely best documented demonstration to date. The region in which the testing took place is shown in the Google Maps plot of Figure 1. Note that the Pleasanton-Livermore region in the upper right is partially shadowed by mountains from transmitters serving San Jose.
Figure 1. San Francisco Bay Area Geographic Features
KSJO is licensed to operate FM broadcasts in San Jose, California and currently operates two transmitters. The first is the Main 32 kW transmitter that covers the San Jose region from an elevated site south of San Jose. The second transmitter is a low power booster that covers the
1 (1) Lazer Spots, LLC, Bustos Media of Utah License, LLC, KDUT(FM) and (2) Alpha Media Licensee LLC Partnership, WIIL Channel: 236B 95.1 MHz Union Grove, WI.

KSJO TECHNICAL REPORT | 17 SEPTEMBER 2021 | VERSION 0.99
8 Roberson and Associates, LLC
Pleasanton-Livermore area from an elevated site west of Pleasanton. Figure 2 shows the KSJO coverage area prior to installation of the geo-targeting boosters within context of the San Francisco-Oakland-San Jose Designated Market Area (DMA).
Figure 2. KSJO Coverage and San Francisco-Oakland-San Jose DMA
The two coverage areas are separated by a largely unpopulated mountain range. Interstate 680 is the major highway that connects these two listening areas. A zone has been created by modifying the existing Pleasanton booster and adding two additional transmitters along Interstate 680 in the mountain pass. These additional boosters operate under a temporary Experiment Authorization from the FCC. The transition zone intersects Interstate 680 near the Sheridan Road overpass. Both the Pleasanton zone and the San Jose Main signals carry hybrid FM, HD1 and HD2 programming focusing on a Bollywood music format.
Several questions have been raised by stakeholders and commenters associated with the FCC NPRM [1] relating to GeoBroadcast’s geo-targeted broadcasting proposal (see Section 1.2). The following areas have been identified as being addressable by this demonstration system with a particular focus on the performance of the system in the transition zone:
• General Transition
• HD Performance
• Consumer Experience
• Commercial Deployment and Coverage

KSJO TECHNICAL REPORT | 17 SEPTEMBER 2021 | VERSION 0.99
9 Roberson and Associates, LLC
• Emergency Alert System (EAS)
The purpose of this demonstration is to generate and assess the technical data necessary to address many of these concerns. The specific goals of the demonstration measurements are to:
• Collect FM and HD Radio measurements and received audio/video samples while entering or exiting zones during geo-targeted broadcast events
• Collect FM and HD Radio measurements and record received audio/video samples within a zone
• Allow interested parties to listen to geo-targeted broadcast content and experience transitions between Main and zone programming in a real-world deployment based on commercial equipment
• Support mobile and stationary data collection.
1.1.2 Demo Approach The KSJO demo system has been built by first improving coverage in the Mission Pass area2 along Interstate 680 between San Jose and Pleasanton. One new transmitter has been deployed along I-680 to provide additional coverage towards Pleasanton using a directional antenna. The existing Pleasanton-Livermore booster also has been upgraded. These two transmitters were used to transmit geo-targeted programming into the Pleasanton-Livermore area (see Appendix D for additional details).
A second additional transmitter has been deployed at the same Interstate 680 site to minimize the extent of the transition region with a directional antenna pointing away from Pleasanton. The use of back-to-back antennas with large front-to-back ratios ensures that the transition zone is small.
With the FCC’s Experimental Authority to originate FM booster content, geo-targeted broadcasting was installed using these boosters to create the zone coverage area.
Figure 3 shows a geographic overview of the demo system coverage areas. Note that this system consists of a Main coverage zone (zone 1, green-shaded) provided by the broadcaster and supplemental I-680 transmitter and the geo-targeted broadcast zone (zone 2, blue-shaded) provided by the booster and the additional I-680 transmitter.
2 Mission Pass is a gap in the hills of the Mount Hamilton Range in Alameda County, California. It lies to the northeast of Mission San José, in Fremont, and leads from there into the Sunol Valley. Its elevation is 659 feet (201 m) above sea level. Today, Interstate 680 traverses this pass.

KSJO TECHNICAL REPORT | 17 SEPTEMBER 2021 | VERSION 0.99
10 Roberson and Associates, LLC
Figure 3. KSJO Demonstration System Overview3
A measurement vehicle was outfitted with the equipment described below to measure received signal and audio/video/Metadata quality for the FM and HD Radio signals. Numerous vehicles were driven along Interstate 680 and within the zone to collect measurements. The vehicle also was parked or driven within the zone and transition area to collect measurements. Vehicles from different manufacturers were used to enable the observation of any differences in received audio quality attributable to different commercial receivers.
The Octave Nomad system was used to collect MP3 audio and detailed measurements of the received FM HD signals for this measurement campaign, and its software was configured to collect detailed information about the received FM and HD signal quality (see Section 2).
Drive route types were selected to enable the three test conditions shown in Figure 4.
3 The contour line is the 60 dBu Longley-Rice FCC contour. The area coverage was calculated using 39 dBu for monophonic FM.

KSJO TECHNICAL REPORT | 17 SEPTEMBER 2021 | VERSION 0.99
11 Roberson and Associates, LLC
Figure 4. Simplified Diagram of Drive Tests
The conditions for the drive tests are:
1. Enter a zone when geo-targeted broadcast is active. The parameters of interest are the duration of the transition between the Main signal and the zone signal while driving, and the perceived and measured audio/video/Metadata quality before, during, and after passing through the transition zone.
2. Exit a zone while a geo-targeted broadcast is active. Here the parameters of interest are the duration of the transition between the zone signal and the Main signal while driving, and the perceived and measured audio/video/Metadata quality before, during, and after passing through the transition zone.
3. Confined drive route in the known interior of the zone region. Here the parameters of interest are the audio quality during the turn-On and turn-Off of the geo-targeted broadcast transmission.
1.2 Success Criteria Coverage of key “success criteria” items as identified by key stakeholders and commentors has been a primary driver for demo design and measurements.
1.2.1 Background on Contributors The following sections contain a roster of selected “success criteria” derived from Comments and Reply Comments to the NPRM seeking FM booster rule changes that would authorize FM radio geo-targeting [1]. Additional success criteria are included from a meeting between Roberson and Associates and the CTOs of four major FM broadcasting companies (see Appendix B for details). The purpose is to ensure that the field demonstration data for geo-targeted broadcasts sufficiently

KSJO TECHNICAL REPORT | 17 SEPTEMBER 2021 | VERSION 0.99
12 Roberson and Associates, LLC
cover the key requirements raised by the NPRM process. The following sources were utilized to generate the “success criteria” roster (additional details can be found in Appendix B).
• Four FM Broadcast Network CTOs
• National Association of Broadcasters Comments [2]
• Joint Comments [3]
• National Association of Broadcasters Reply Comments [4]
• Joint Reply Comments [5]
• Xperi Comments and private communications [6]
The following sections contain the selected “success criteria” technical items that are addressable using this demo system along with our current assessment of coverage.
1.2.2 General Transition These criteria deal with the general case of transition between broadcast coverage areas.
Figure 5. Success Criteria: General Transition

KSJO TECHNICAL REPORT | 17 SEPTEMBER 2021 | VERSION 0.99
13 Roberson and Associates, LLC
Note that the transition region assessed for this demonstration system did not traverse suburban or urban areas. Also, due to the nature of the geographic zone only a single transition area was designed and assessed.
1.2.3 HD Performance These criteria deal with the case of transition between broadcast coverage areas within specific context of HD Radio service.
Figure 6. Success Criteria: HD Performance
This demonstration system includes HD1 and HD2. Based on discussions with Xperi personnel, HD3 and HD4 are expected to behave in the same manner as HD2. No FM translators were used in the system.
1.2.4 Consumer Experience Here we have grouped together two criteria “resolution types” (i.e., Metadata4 and Consumer Receiver) that fall under the umbrella of consumer experience issues.
4 For example, song titles and artist information.

KSJO TECHNICAL REPORT | 17 SEPTEMBER 2021 | VERSION 0.99
14 Roberson and Associates, LLC
Figure 7. Success Criteria: Consumer Experience
Note that these items contain a mixture of technical and business issues.
1.2.5 Commercial Deployment and Coverage We are interpreting ID#s 44 and 45 to include data collection within the zone as well as in the transition region.
Figure 8. Success Criteria: Commercial Deployment and Coverage

KSJO TECHNICAL REPORT | 17 SEPTEMBER 2021 | VERSION 0.99
15 Roberson and Associates, LLC
1.2.6 Emergency Alert System (EAS) The Emergency Alert System (EAS) is described by the Federal Communications Commission (FCC) as follows.5
The Emergency Alert System (EAS) is a national public warning system commonly used by state and local authorities to deliver important emergency information, such as weather and AMBER alerts, to affected communities. EAS participants – radio and television broadcasters, cable systems, satellite radio and television providers, and wireline video providers – deliver local alerts on a voluntary basis, but they are required to provide the capability for the President to address the public during a national emergency.
The Federal Emergency Management Agency (FEMA), the FCC, and the National Oceanic and Atmospheric Administration's National Weather Service (NWS) work collaboratively to maintain the EAS and Wireless Emergency Alerts, which are the two main components of the national public warning system and enable authorities at all levels of government to send urgent emergency information to the public.
FEMA is responsible for any national-level activation, tests, and exercises of the EAS.
The FCC's role includes establishing technical standards for EAS participants, procedures for EAS participants to follow in the event the system is activated, and testing protocols for EAS participants.
Alerts are created by authorized federal, state, and local authorities. The FCC does not create or transmit EAS alerts.
The majority of EAS alerts originate from the National Weather Service in response to severe weather events, but an increasing number of state, local, territorial, and tribal authorities also send alerts. In addition, the NOAA Weather Radio All Hazards network, the only federally sponsored radio transmission of warning information to the public, is part of the EAS.
As the EAS is crucial to public safety it is important that the deployment of a geo-targeted broadcast system has no effect on the reliability or accuracy of EAS alerts.
Figure 9. Success Criteria: EAS
5 See https://www.fcc.gov/emergency-alert-system

KSJO TECHNICAL REPORT | 17 SEPTEMBER 2021 | VERSION 0.99
16 Roberson and Associates, LLC
2 DATA COLLECTION
2.1 Equipment The primary equipment set used to record the quality and characteristics of the zone and Main broadcast signals is listed below.
Name/Model Description
Octave Nomad with 2 Inovonics Sofia 568 receivers 4-way splitter, BU353-S4 GPS receiver, and Signal Hound spectrum analyzer
FM HD Radio receiver and analyzer. Saves location tagged and time stamped measurements, power spectrum measurements, and audio MP3 files. Note that the Sofia receiver is designed to monitor received raw FM and HD signal characteristics. Commercial receivers are designed to deliver best possible audio quality.
GoPro Hero 8 Cameras with Media Mod
Cameras primarily used to capture dashboard radio video and audio
Vehicle in-dash entertainment system FM / HD Listening radio receiver FM HD Receiver, Kenwood KDC-BT758HD
Second receiver to supply audio to audio recorders
Zoom H4n and Zoom H1N Audio recorders Antenna, filter, LNA, signal splitter FM band antenna
RF distribution of measurement signals
Adapters, connectors, cables, speaker to line-out adapter, USB cables
RF and audio interconnections, USB power for GoPro cameras, H1N recorder
250 Watt True Sine Inverter 12V to 120VAC Inverter for Nomad 100 Watt Inverter 12V to 120VAC inverter for Nomad laptop computer
Table 1. Vehicle Test and Measurement System Equipment List
2.2 Measurement Parameters An Octave Communications Nomad measurement unit was used to collect MP3 audio and detailed measurements of the received FM HD signals. The Nomad unit was comprised of 2 Inovonics Sofia 568 FM HD monitor receivers, a Signal Hound spectrum Analyzer, a GlobalSat BU353-S4 GPS receiver, and a laptop running Nomad software.
The first Sofia 568 was set up to receive FM and HD1 and record audio in split mode. That is, one stereo channel was set to be the output of the FM receiver and the other stereo channel was set to be the output of the HD1 receiver. The second Sofia 568 was configured to receive and record HD2. HD2 audio output was recorded during the measurements.
The Nomad software runs on a laptop and connects to the receivers, spectrum analyzer, and GPS receiver over a USB-Ethernet link. Two inverters were used to power the Nomad measurement system. The first inverter powered the Nomad equipment, and the second inverter powered the laptop.

KSJO TECHNICAL REPORT | 17 SEPTEMBER 2021 | VERSION 0.99
17 Roberson and Associates, LLC
The 568 monitor receivers save data to csv files that are analyzed after completion of testing. During drive tests audio samples and measurements are saved and the location is recorded. The measurements are time-stamped and location-stamped (latitude and longitude). The temporal duration and length in meters of transition zones and signal mute events is characterized by post-processing the measurements.
2.2.1 FM FM major signal parameters are recorded by the Nomad. FM measurements include the following items.
Measurement Name Measurement Description
Multipath (%) FM analog signal multipath causes frequency dependent fading across the FM channel and the relation between the two signals is measured
RSSI (dBuV) Reception level at the receiver input SNR (dB) Signal-to-Noise Ratio
Table 2. FM Measurements
2.2.2 HD1 and HD2 HD1 and HD2 major measurements include the following items.
HD Measurement Name HD Measurement Description
HD Acquired Indication the presence of an HD Radio signal was successfully detected.
HD Digital Audio Acquired Indicates that the received HD Radio signal quality was high enough for the HD Radio receiver to successfully demodulate audio signals.
Cd/No The ratio of the HD Radio signal power to noise power density.
Table 3. HD1 and HD2 Measurements
2.2.3 Commercial Receiver Audio Recordings We recorded audio from a commercial FM HD receiver. It was suggested by interested parties that the same model HD receiver as was used in the NPR Labs IBOC testing be used for geo-broadcasting demonstration measurements. A Kenwood KD758 was purchased for this purpose. The Kenwood radio antenna input was connected to an available port on the 4-way RF splitter in the Nomad measurement unit. The front left and right RCA audio outputs were connected via an adapter cable to the 3.5 mm stereo input of either a Zoom H1N or H4N audio recorder.
2.2.4 Audio/Video Recordings We recorded the audio and entertainment system display screens from commercial OEM FM HD receivers. GoPro cameras were used to record both audio and video from the dashboard radios. A headrest mount was used to hold the GoPro cameras (see Appendix D, Figure 28 for additional details). The GoPro cameras were mounted inside a GoPro Media Mod unit to take advantage of

KSJO TECHNICAL REPORT | 17 SEPTEMBER 2021 | VERSION 0.99
18 Roberson and Associates, LLC
the forward-facing stereo microphones of the Media Mod. USB power was supplied from the vehicle USB ports or 12V power USB adapter. The recordings were made in Linear mode with a resolution of 1080P and either 24 or 30 frames per second. The Zoom was set to maximum (2X). The GoPro internal GPS receiver was enabled, and the time was set to the local time.
2.2.5 Practical Considerations Careful scheduling of the audio/video recordings is necessary since the geo-targeted signals are enabled for short time segments. Recordings have been made for each of the different selected drive routes. The audio/video recordings are coordinated with the geo-targeted transmissions so that at least 30 seconds of audio/video is recorded before entering and after leaving a transition zone. This allows for unexpected delays in arriving at the zone boundary due to traffic and to ensure that the transition is fully recorded.
In addition to driving through transition zones, in-zone listening demonstrations and audio/video recordings of both FM and HD signals have been made. The purpose of these recordings is to observe the receiver audio/video transition behavior from boosted Main (i.e., FM3, see Appendix D), signal and the zone signal. The FM or HD receiver must capture or re-synchronize to the zone signal when it is turned on. When the zone signal is turned off the FM or HD receiver must re-capture or re-synchronize back to the Main signal. Audio/video recordings are stored to allow for post-test listening/viewing and analysis.
3 KEY PERFORMANCE EVALUATION ISSUES Two issues central to correct assessment and interpretation of results are here discussed in detail.
3.1 Transition Zone Size The purpose of the transition zone analysis is to determine the size of the transition zone and to access the signal stability where reception switches between the Main broadcast signal and the geo-targeted signal. The RF propagation software provides numerous measurement parameters which are candidates upon which to base this measurement process.
3.1.1 Multipath Parameter for FM Transition Region Size Assessment We have assessed the native RF parameters used by the Octave Nomad device for their utility in measuring geo-targeted broadcast transition events. Although a few parameters have utility in this domain, the multipath6 measurement is clearly the most reliable and useful (see Appendix E).
The reason for this conclusion is that the multipath parameter is designed to measure the reception of multiple versions of a desired signal. In the typical multipath case these multiple received signals
6 Italicized text refers to a measurement parameter, nonitalicized refers to a physical process.
KSJO TECHNICAL REPORT | 17 SEPTEMBER 2021 | VERSION 0.99
19 Roberson and Associates, LLC
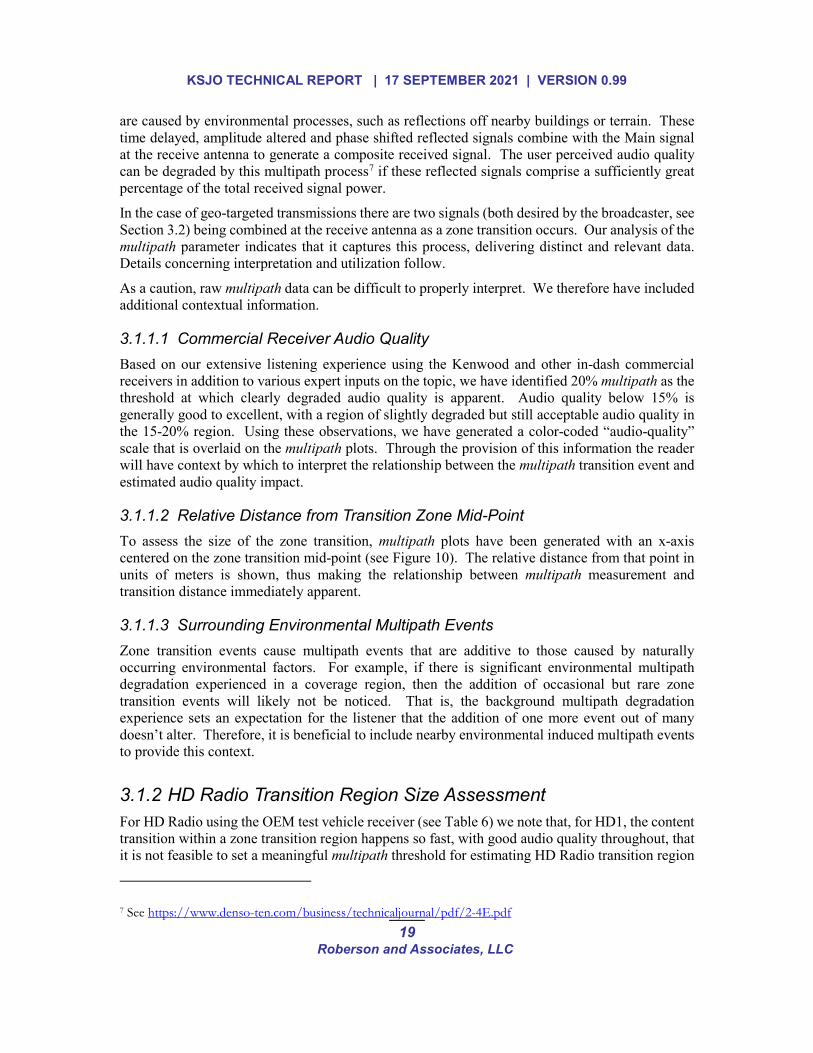
are caused by environmental processes, such as reflections off nearby buildings or terrain. These time delayed, amplitude altered and phase shifted reflected signals combine with the Main signal at the receive antenna to generate a composite received signal. The user perceived audio quality can be degraded by this multipath process7 if these reflected signals comprise a sufficiently great percentage of the total received signal power.
In the case of geo-targeted transmissions there are two signals (both desired by the broadcaster, see Section 3.2) being combined at the receive antenna as a zone transition occurs. Our analysis of the multipath parameter indicates that it captures this process, delivering distinct and relevant data. Details concerning interpretation and utilization follow.
As a caution, raw multipath data can be difficult to properly interpret. We therefore have included additional contextual information.
3.1.1.1 Commercial Receiver Audio Quality Based on our extensive listening experience using the Kenwood and other in-dash commercial receivers in addition to various expert inputs on the topic, we have identified 20% multipath as the threshold at which clearly degraded audio quality is apparent. Audio quality below 15% is generally good to excellent, with a region of slightly degraded but still acceptable audio quality in the 15-20% region. Using these observations, we have generated a color-coded “audio-quality” scale that is overlaid on the multipath plots. Through the provision of this information the reader will have context by which to interpret the relationship between the multipath transition event and estimated audio quality impact.
3.1.1.2 Relative Distance from Transition Zone Mid-Point To assess the size of the zone transition, multipath plots have been generated with an x-axis centered on the zone transition mid-point (see Figure 10). The relative distance from that point in units of meters is shown, thus making the relationship between multipath measurement and transition distance immediately apparent.
3.1.1.3 Surrounding Environmental Multipath Events Zone transition events cause multipath events that are additive to those caused by naturally occurring environmental factors. For example, if there is significant environmental multipath degradation experienced in a coverage region, then the addition of occasional but rare zone transition events will likely not be noticed. That is, the background multipath degradation experience sets an expectation for the listener that the addition of one more event out of many doesn’t alter. Therefore, it is beneficial to include nearby environmental induced multipath events to provide this context.
3.1.2 HD Radio Transition Region Size Assessment For HD Radio using the OEM test vehicle receiver (see Table 6) we note that, for HD1, the content transition within a zone transition region happens so fast, with good audio quality throughout, that it is not feasible to set a meaningful multipath threshold for estimating HD Radio transition region
7 See https://www.denso-ten.com/business/technicaljournal/pdf/2-4E.pdf

KSJO TECHNICAL REPORT | 17 SEPTEMBER 2021 | VERSION 0.99
20 Roberson and Associates, LLC
size. This is because there is no discernable relationship between the multipath value and perceived audio quality. The HD1 transition size is at least an order of magnitude smaller than that for analog FM and is, in effect, instantaneous and therefore unmeasurable given the available multipath data (see Section 4.2.1.1).
3.1.3 Zone Transition Region Size Estimation Methodology The figure below shows the key stylized characteristics of the zone transition region size estimation methodology. Based on the above-described listening experience we have defined the multipath threshold for degraded audio quality at 20%. Note that the color-coding scale enables interpretation of the multipath curve within the context of listener perceived audio quality. In this stylized example the transition size is approximately 40 meters. The HD1 transition region size is indicated as so small that it is essentially unmeasurable, and is therefore not measurable using the 20% multipath threshold used for analog FM.
Figure 10. Zone Transition Region Size Methodology Example
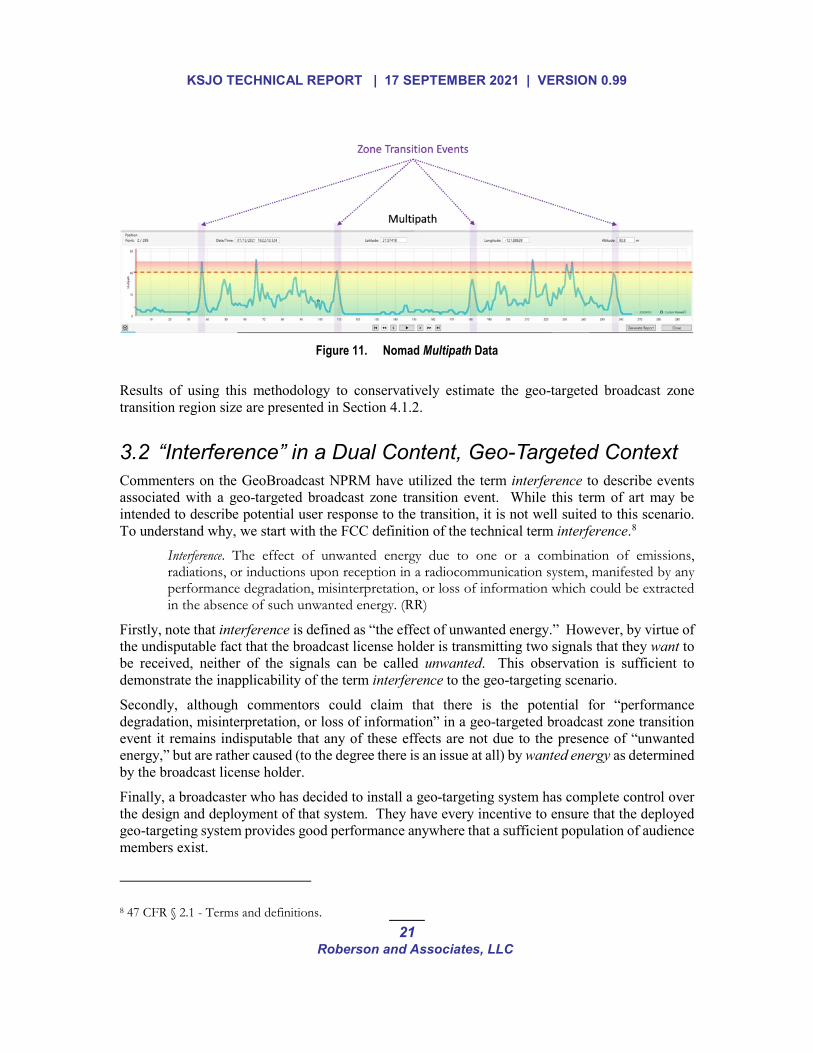
An example of actual multipath data collected over multiple drives through the transition region is shown in Figure 11. The zone transition region was traversed four times. These four transition events are highlighted with translucent purple rectangles. Note that:
1. The background environmental multipath events are far more numerous and are often at greater magnitude than the zone transition events. Thus, a listener will develop an expectation of degraded audio quality that the addition of an occasional zone transition will not significantly alter.
2. With the audio quality color code overlaid on the multipath plot the context by which to interpret the relationship between multipath and estimated audio quality impact is provided.
3. A red dashed line indicates the 20% multipath threshold. Note that some of the zone transition multipath events don’t exceed this threshold.
KSJO TECHNICAL REPORT | 17 SEPTEMBER 2021 | VERSION 0.99
21 Roberson and Associates, LLC
Figure 11. Nomad Multipath Data
Results of using this methodology to conservatively estimate the geo-targeted broadcast zone transition region size are presented in Section 4.1.2.
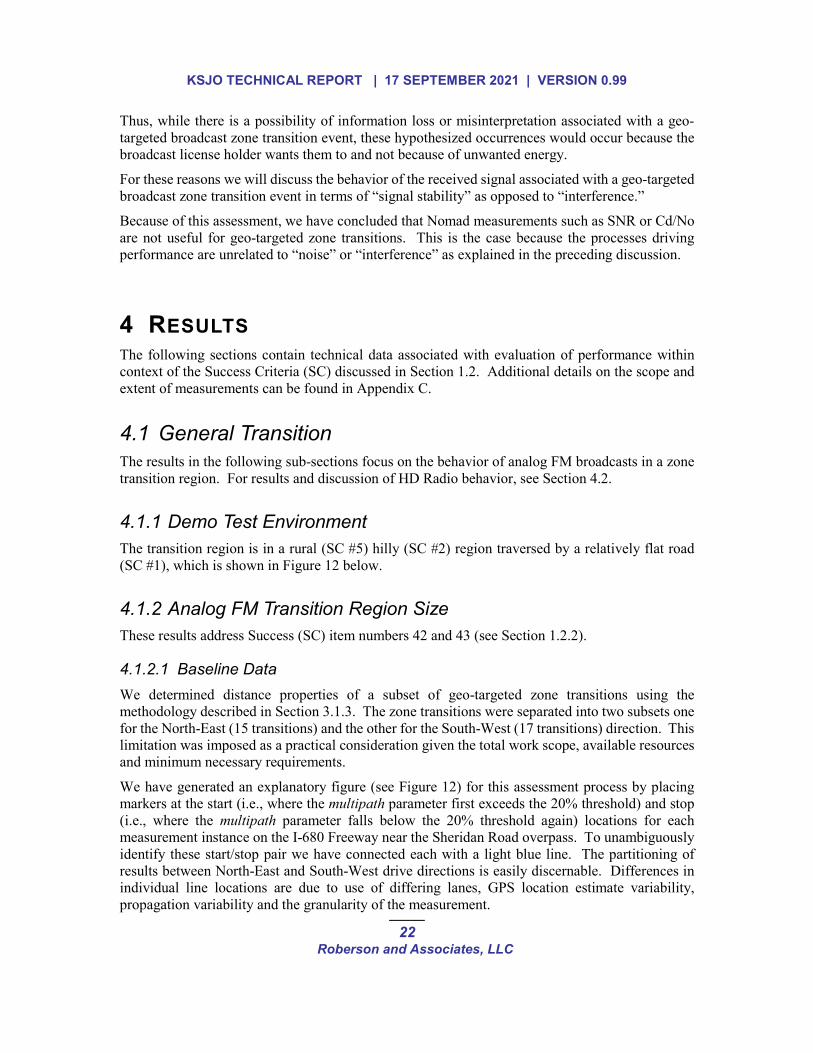
3.2 “Interference” in a Dual Content, Geo-Targeted Context Commenters on the GeoBroadcast NPRM have utilized the term interference to describe events associated with a geo-targeted broadcast zone transition event. While this term of art may be intended to describe potential user response to the transition, it is not well suited to this scenario. To understand why, we start with the FCC definition of the technical term interference.8
Interference. The effect of unwanted energy due to one or a combination of emissions, radiations, or inductions upon reception in a radiocommunication system, manifested by any performance degradation, misinterpretation, or loss of information which could be extracted in the absence of such unwanted energy. (RR)
Firstly, note that interference is defined as “the effect of unwanted energy.” However, by virtue of the undisputable fact that the broadcast license holder is transmitting two signals that they want to be received, neither of the signals can be called unwanted. This observation is sufficient to demonstrate the inapplicability of the term interference to the geo-targeting scenario.
Secondly, although commentors could claim that there is the potential for “performance degradation, misinterpretation, or loss of information” in a geo-targeted broadcast zone transition event it remains indisputable that any of these effects are not due to the presence of “unwanted energy,” but are rather caused (to the degree there is an issue at all) by wanted energy as determined by the broadcast license holder.
Finally, a broadcaster who has decided to install a geo-targeting system has complete control over the design and deployment of that system. They have every incentive to ensure that the deployed geo-targeting system provides good performance anywhere that a sufficient population of audience members exist.
8 47 CFR § 2.1 - Terms and definitions.
KSJO TECHNICAL REPORT | 17 SEPTEMBER 2021 | VERSION 0.99
22 Roberson and Associates, LLC
Thus, while there is a possibility of information loss or misinterpretation associated with a geo-targeted broadcast zone transition event, these hypothesized occurrences would occur because the broadcast license holder wants them to and not because of unwanted energy.
For these reasons we will discuss the behavior of the received signal associated with a geo-targeted broadcast zone transition event in terms of “signal stability” as opposed to “interference.”
Because of this assessment, we have concluded that Nomad measurements such as SNR or Cd/No are not useful for geo-targeted zone transitions. This is the case because the processes driving performance are unrelated to “noise” or “interference” as explained in the preceding discussion.
4 RESULTS The following sections contain technical data associated with evaluation of performance within context of the Success Criteria (SC) discussed in Section 1.2. Additional details on the scope and extent of measurements can be found in Appendix C.
4.1 General Transition The results in the following sub-sections focus on the behavior of analog FM broadcasts in a zone transition region. For results and discussion of HD Radio behavior, see Section 4.2.
4.1.1 Demo Test Environment The transition region is in a rural (SC #5) hilly (SC #2) region traversed by a relatively flat road (SC #1), which is shown in Figure 12 below.
4.1.2 Analog FM Transition Region Size These results address Success (SC) item numbers 42 and 43 (see Section 1.2.2).
4.1.2.1 Baseline Data We determined distance properties of a subset of geo-targeted zone transitions using the methodology described in Section 3.1.3. The zone transitions were separated into two subsets one for the North-East (15 transitions) and the other for the South-West (17 transitions) direction. This limitation was imposed as a practical consideration given the total work scope, available resources and minimum necessary requirements.
We have generated an explanatory figure (see Figure 12) for this assessment process by placing markers at the start (i.e., where the multipath parameter first exceeds the 20% threshold) and stop (i.e., where the multipath parameter falls below the 20% threshold again) locations for each measurement instance on the I-680 Freeway near the Sheridan Road overpass. To unambiguously identify these start/stop pair we have connected each with a light blue line. The partitioning of results between North-East and South-West drive directions is easily discernable. Differences in individual line locations are due to use of differing lanes, GPS location estimate variability, propagation variability and the granularity of the measurement.

KSJO TECHNICAL REPORT | 17 SEPTEMBER 2021 | VERSION 0.99
23 Roberson and Associates, LLC
Figure 12. Start (Green) / Stop (Red) Transition Event Markers Connected by Blue Lines
The results of this transition region size assessment are shown in Table 4.

KSJO TECHNICAL REPORT | 17 SEPTEMBER 2021 | VERSION 0.99
24 Roberson and Associates, LLC
Table 4. Analog FM9 Transition Region Size Results
Note that 32 zone transition length measurements have been made resulting in a Mean of 50.2 meters and a Standard Deviation of 25.4 meters. The two measurements resulting in a zero distance 9 Recall from Section 3.1.2 that the HD1 transition was found to be unrelated to multipath measurements and so short in time as to be essentially unmeasurable. Thus, these results pertain only to analog FM only transition cases (see Section 3.1.3 for methodology description).

KSJO TECHNICAL REPORT | 17 SEPTEMBER 2021 | VERSION 0.99
25 Roberson and Associates, LLC
(see ID #s 1 and 20) occurred because the multipath parameter did not exceed the 20% threshold value (therefore, the N/A Lat/Lon).
4.1.2.2 Assessment
4.1.2.2.1 Transition Region Length Compared to Zone Linear Road Length
One means of placing a mean 50.2 m length transition region in perspective is to compare this value with the linear length of all roads within the zone.
The overall length of roads in the Pleasanton area was determined using a query of the OpenStreetMap database using the overpass API interface.10 First, a polygon was defined that approximates the Pleasanton geo-targeted zone (see Figure 3). The polygon is shown in Figure 13.
Figure 13. Zone Road Length Estimation Polygon
A program was written to upload the polygon description to the overpass server using the Python osm_road_length library.11 The overpass site queries the Open StreetMap database and calculates road lengths. The estimated road lengths that are returned are shown in the following table. Note that for divided highways the tool returns length for each highway direction.
10 https://overpass-api.de 11 https://github.com/JoaoCarabetta/osm-road-length

KSJO TECHNICAL REPORT | 17 SEPTEMBER 2021 | VERSION 0.99
26 Roberson and Associates, LLC
Type Length (km)
Highway 132 Highway Link 70 Primary 61 Secondary 358 TOTAL 621
Table 5. Zone Road Lengths
The resulting estimated road length is 621,000 meters. Thus, the ratio of the transition region to zone road length is 100.4 meters12 divided by 621,000 meters, or approximately one part in six-thousand (the actual ratio is 0.01617%).
4.1.2.2.2 Transition Time
Another rough contextual metric is the time a vehicle will be in the mean 50.2 m length transition zone as a function of speed. For example, at 60 mph (open road) a vehicle will traverse 50.2 m in approximately 1.9 seconds, and at 10 mph (traffic jam) 11.2 seconds. Note that both of these times are small compared to the maximum 180 seconds per hour of geo-targeted broadcast content.
4.1.2.2.3 Multipath Threshold Sensitivity
In order to assess the sensitivity to multipath threshold we determined the mean and standard deviation of the zone transition size if a 15% multipath threshold (rather than the 20% threshold) were used as the criteria. Thus, the 32 zone transition size measurements of Table 4 have been recalculated using the 15% threshold resulting in a Mean of 104.9 meters and a Standard Deviation of 31.3 meters.
The 15% multipath threshold Mean zone transition size increased by 109% from the 20% multipath threshold result. The Standard Deviation of the zone transition size increased by a little over 23%.
Thus, even if an extremely conservative multipath threshold of 15% were used, this would result in a zone transition size that remains inconsequential compared to the overall zone road length (i.e., 0.0339%, or approximately 1 part in 3,000).
4.1.2.2.4 Multipath Family of Curves
We have generated zone transition multipath plots with an x-axis centered on the zone transition mid-point. The relative distance from that point in units of meters is shown, thus making the relationship between multipath measurement and transition distance immediately apparent. A family of plots has been generated showing the multipath curves from Table 4. No “smoothing” is utilized, so breakpoints in the plot line segments indicate the position of data points (markers were excluded to reduce the level of clutter in this complex plot). Thus, the following figure shows the Nomad (Sofia 568) multipath measurements centered on each 20% region for the drives through the transition zone.
12 That is, 50.2 meters times two, for the two directions of the transition region on I-680.

KSJO TECHNICAL REPORT | 17 SEPTEMBER 2021 | VERSION 0.99
27 Roberson and Associates, LLC
Figure 14. Analog FM Transition Family of Multipath Curves
Note that while this plot displays a significant amount of similarity in general shape and extent for the various multipath signals as they pass through the transition region, there is significant variability in the peak value with a corresponding variability in the distance over which the peak exceeds the 20% threshold (if this threshold is exceeded at all).
Note also that two translucent rectangles are included that show the extent of the Mean Zone transition size for the 20% (blue, see Section 4.1.2) and 15% (yellow, see Section 4.1.2.2.3) multipath threshold cases.
4.1.3 Transition Region Signal Stability These results address SC item number 25. The concern raised appears to be that there could be areas in which it is possible to move for long distances along a zone transition boundary, thus creating the conditions for regular and objectionable signal instability (i.e., “frequent switches between different audio programs, as determined by the FM receiver’s capture effect”).
While this scenario is theoretically possible, its occurrence depends on significant system design errors that enable sustained travel on a zone boundary. In actual practice a radio broadcaster has

KSJO TECHNICAL REPORT | 17 SEPTEMBER 2021 | VERSION 0.99
28 Roberson and Associates, LLC
the incentive and ability to design transition boundaries that fall in unpopulated areas, on a body of water or perpendicular to roads and highways. It is our expectation that a broadcaster would never approve any design that places their audience’s listening experience at risk.
Regarding the KSJO design, the zone transition boundary was designed to cut perpendicularly across Interstate 680, resulting in a highly controlled, small distance transition region (see Section 4.1.2). The balance of this boundary was designed to fall on unpopulated areas without roads.
Finally, after our extensive field tests in which we experienced over 60 geo-targeting broadcast transitions, we did not hear the signal instability of concern occur even once. Clearly this result can’t prove that this issue couldn’t occur in a poorly designed geo-targeting system, but it certainly is a practical demonstration that a system can be designed and deployed to prevent such an issue.
4.1.4 Mobile Test Environment Although numerous general concerns were raised in SC item number 31, the specific, highest priority issue was that “The FCC must gather significantly more data on ZoneCasting in a mobile environment before moving forward.” The data collected and analyzed for this report was dominantly obtained in a mobile environment that included variability in speed, road traversed, vehicle make/model and time of day, among others.
4.2 HD Performance
4.2.1 HD Radio Transitions The demo system enabled zone transitions using both HD1 and HD2 radio signals, thus meeting the requirement of SC item numbers 9 and 13.
4.2.1.1 HD1 Transition
4.2.1.1.1 General Comments
For HD1, the transition within a zone transition region happens so fast, with good audio quality throughout, that it was not feasible to set a multipath threshold for estimating HD Radio transition region size (see Section 3.1.2 and Section 3.1.3, Figure 10). This is because there is no discernable relationship between the multipath value and perceived audio quality. The HD1 transition size is at least an order of magnitude smaller than that for analog FM and is, in effect, instantaneous and therefore unmeasurable.
4.2.1.1.2 Technical Narrative
Listening to zone transitions when the vehicle radio was set to HD1 mode was different from listening when the vehicle radio was set to FM. The typical sequence of events while listening to HD1 were:
1. Entering the transition zone, the radio’s Yellow HD indicator was “on”
2. After a few seconds the Yellow HD indicator turned “off”
3. Shortly thereafter the HD indication turned “on” again.

KSJO TECHNICAL REPORT | 17 SEPTEMBER 2021 | VERSION 0.99
29 Roberson and Associates, LLC
The HD audio buffer continued to output audio through the transition zone, falling back to the FM blend mode when the HD quality fell too low. Thus, the HD1 and FM signals behaved as a redundant (i.e., FM and HD) system, providing good quality audio throughout the transition.
4.2.1.2 HD2 Transition The multicast audio channels HD2, HD3, and HD4 are delivered as digital partitions of the overall HD broadcast. The effect of impairment of the HD broadcast affects all three of these HD multicast audio channels in the same manner. Therefore, measurements of HD2 behavior is representative of HD3 and HD4 as well.
These three multicast audio channels do not have a redundant analog FM audio channel to blend back to in the case of impairment of the HD signal. The figure below shows a typical monaural audio trace of HD2 during a geo-targeting transition. The peak multipath was recorded at the 1:34 timestamp. Note that the HD2 audio is unavailable for a brief period after passing through the transition zone. The duration recorded here was about 7 seconds.
Figure 15. Example HD2 audio trace during ZoneCasting transition.
One of the causes of the 7 second loss of audio during a transition from one booster to another is the time needed to reacquire the HD2 signal and to resynchronize the audio data stream. The geo-targeting system uses two independent HD modulators or “Exporters” that are not synchronized. Efforts are underway to develop means to synchronize HD Exporters that could reduce the duration of HD2 signal loss.
4.2.2 HD “Dead Zones” These results address SC item number 28 (see Figure 6).
4.2.2.1 General Comments The hypothesis under test during the data collection campaign was that the geo-targeted zone could “cause the digital signal to disappear completely in areas where the Main FM signal and the FM booster signal effectively cancel each other out, creating digital ‘dead’ zones.” Over weeks of testing in which the zone transition region was traversed many dozens of times (including stationary data collection events within the transition zone) as well as multiple trips through the zone interior, we never experienced any behavior that could be remotely described as a “dead zone.” It is very difficult to prove a negative, but while the absence of occurrence cannot disprove the hypothesis,

KSJO TECHNICAL REPORT | 17 SEPTEMBER 2021 | VERSION 0.99
30 Roberson and Associates, LLC
it certainly does indicate that it is not certain, or even likely, to occur. Moreover, we are not aware of any study or other analysis positing the existence of dead zones in a geo-targeted environment. However, we will continue to collect and assess data in any future demonstration systems that is relevant to this hypothesis.
4.2.2.2 Design Considerations One concern raised about geo-targeting was that the presence of overlapping RF broadcasts would create large “dead zones” where HD reception would be impossible. Simply placing a booster transmitter without paying sufficient engineering attention to the comparable signal levels from other transmitters could cause areas where reception is impaired, but as noted above, broadcasters have the ability and incentive to design any system to avoid those circumstances.
Geo-targeting system design involves performing detailed propagation simulations to minimize the size of transition regions, to precisely locate the transition regions, and to tailor the shape of the transition regions so that they fall on unpopulated areas.
For example, back-to-back antennas were used for the FM2 and FM3 boosters along Interstate 680 as seen below to create a sharp confined transition region. The antennas were carefully selected to have large front-to-back ratios to minimize signal overlap. They were also rotated to minimize cross coupling.
Figure 16. Back-to-Back, High Front-to-Back Ratio Antennas at FM2-FM3 Booster Site
4.3 Consumer Experience
4.3.1 Metadata These results address SC numbers 15 and 16. We have collected GoPro video files for the zone transitions across numerous vehicles. Based on this data, we have no evidence that zone transitions cause noticeable variation in received Metadata display performance.
The following images show the changes in metadata observed when passing into the geo-targeted zone. The first image is the vehicle entertainment system screen just before reaching the transition zone. Note that the Artist Experience image promotes the callsign for the station in the area where the main signal is present.

KSJO TECHNICAL REPORT | 17 SEPTEMBER 2021 | VERSION 0.99
31 Roberson and Associates, LLC
Figure 17. Entertainment System Screen in Main Signal Area
The next image shows the entertainment system screen after the transition zone. Although the HD logo is no longer showing the text and Artist Experience image are still present. These will continue to be displayed.
Figure 18. Entertainment System Screen in Transition Area
Finally, after a delay of about one minute the Artist Experience image is updated with the custom geo-targeted area image. Note the barcode which is specific to the geo-targeted region.
Figure 19. Entertainment System Screen After Update of Artist Experience Image

KSJO TECHNICAL REPORT | 17 SEPTEMBER 2021 | VERSION 0.99
32 Roberson and Associates, LLC
4.3.2 Multiple Commercial Receivers These results address SC numbers 22 and 26. In order to assess performance of various commercial receiver make/models we rented numerous vehicle makes/models to traverse the zone transition region. The automobiles used and the likely OEM receivers are captured in Table 5.
Vehicle Make/Model Likely OEM Receiver Make Test Dates
Honda Passport Denso June 30 – July 1 Toyota Highlander Denso July 13 – 14 Cadillac XT6 Denso July 13 – 14 Volvo S90 Mitsubishi July 13 – 14 BMW X3 Harmon Entertainment Systems or Alpine July 20 – 22 Infinity QX60 Clarion August 4 – 5 BMW X4 Harmon Entertainment Systems or Alpine August 4 – 5 N/A Kenwood Commercial Receiver used in all
vehicles All data collection dates, separate from vehicle
Table 6. Commercial Radios Tested
We have collected GoPro audio/video files for the zone transitions across these numerous vehicles as well as for the external Kenwood commercial receiver. Based on this direct experience and later listening, we have no evidence that these make/model/installation variations cause noticeable variation in received audio performance.
4.4 Commercial Deployment and Coverage
4.4.1 Commercial Deployment and Content SC item number 11 requires that the “Demo scenario must be a credible instance of an actual commercial deployment.” The demo system was designed to provide a zone transition region that is minimized in distance and listening impact just as would be the case for a commercial-level deployment. In addition, the demo system was designed to significantly improve the coverage and therefore the consumer listening experience within the geo-targeted zone. Thus, in both key design areas the demo system is “a credible instance of an actual commercial deployment.”
SC item number 12 requires that “Content must include traffic reports and advertisements.” Both live traffic reports and commercial advertisements were included in the broadcast content, thus meeting this requirement.
4.4.2 Commercial Coverage These results address SC numbers 41, 44, 45. We utilized the audio and FM / HD measurement data to assess coverage of the zone by the deployed system. The interior roads of the zone were traversed with signal and audio data collection enabled. This allowed general coverage and
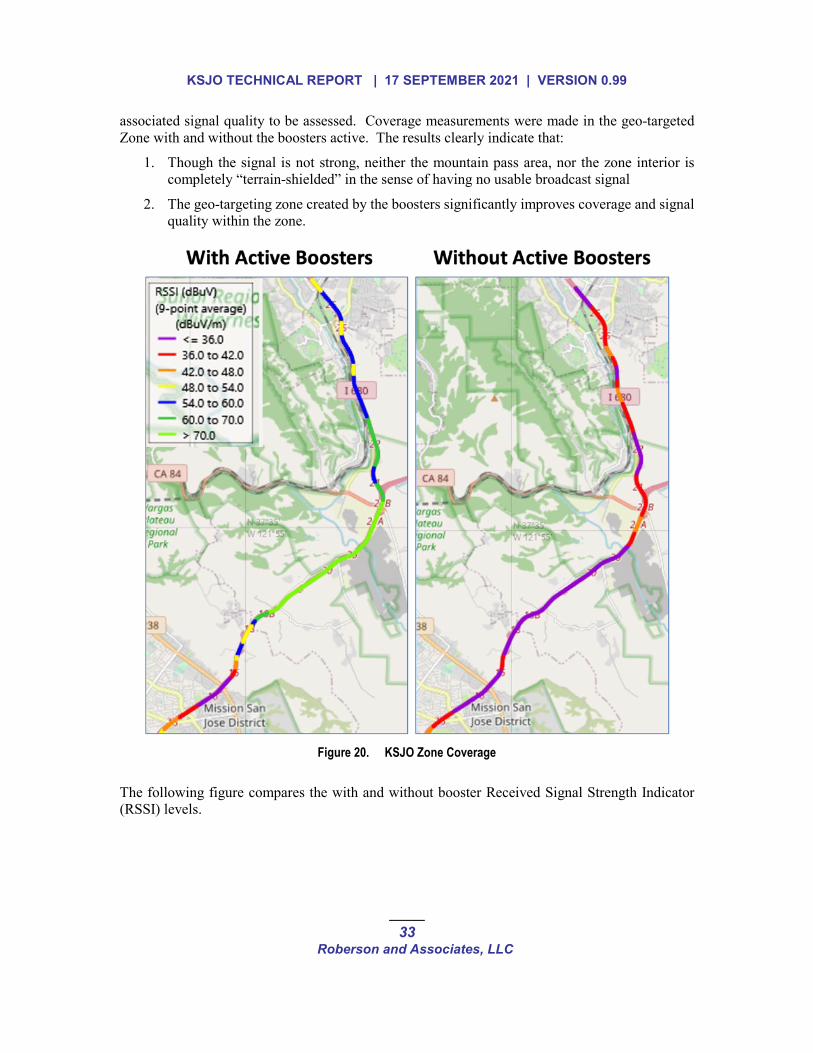
KSJO TECHNICAL REPORT | 17 SEPTEMBER 2021 | VERSION 0.99
33 Roberson and Associates, LLC
associated signal quality to be assessed. Coverage measurements were made in the geo-targeted Zone with and without the boosters active. The results clearly indicate that:
1. Though the signal is not strong, neither the mountain pass area, nor the zone interior is completely “terrain-shielded” in the sense of having no usable broadcast signal
2. The geo-targeting zone created by the boosters significantly improves coverage and signal quality within the zone.
Figure 20. KSJO Zone Coverage
The following figure compares the with and without booster Received Signal Strength Indicator (RSSI) levels.
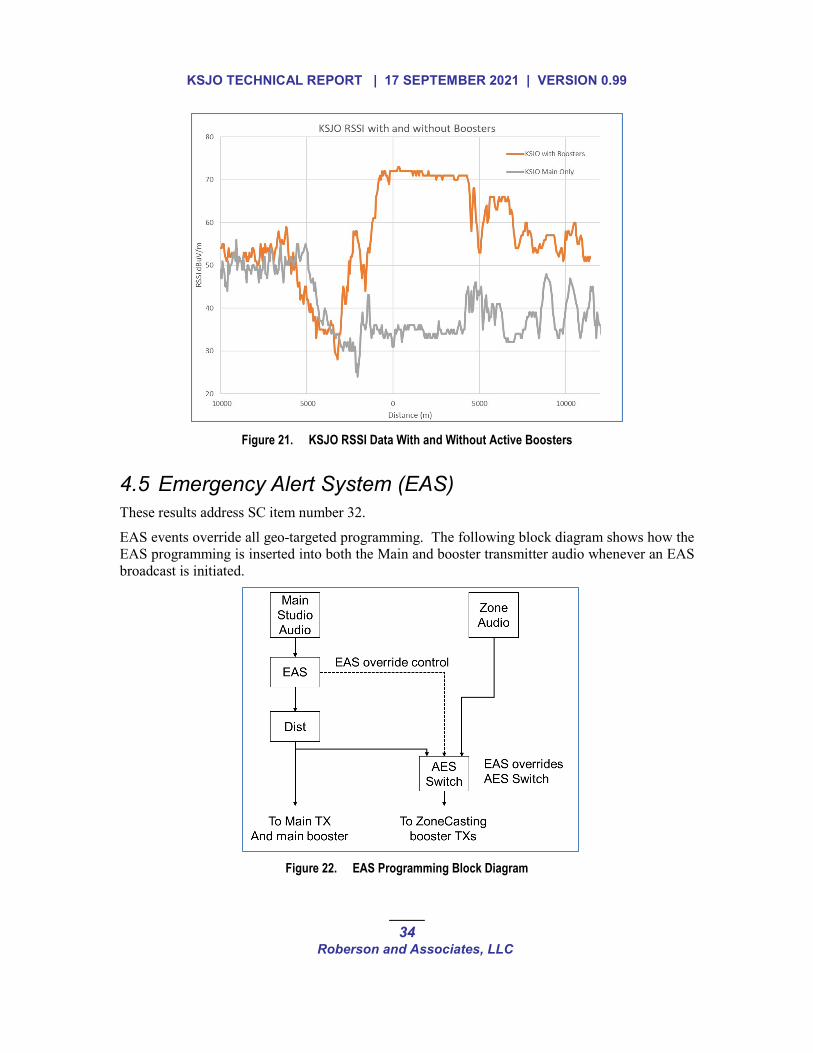
KSJO TECHNICAL REPORT | 17 SEPTEMBER 2021 | VERSION 0.99
34 Roberson and Associates, LLC
Figure 21. KSJO RSSI Data With and Without Active Boosters
4.5 Emergency Alert System (EAS) These results address SC item number 32.
EAS events override all geo-targeted programming. The following block diagram shows how the EAS programming is inserted into both the Main and booster transmitter audio whenever an EAS broadcast is initiated.
Figure 22. EAS Programming Block Diagram

KSJO TECHNICAL REPORT | 17 SEPTEMBER 2021 | VERSION 0.99
35 Roberson and Associates, LLC
The signal path for the Main transmitter includes an EAS programming system and an AES audio splitter that provides a replica of the Main audio to the AES switch. When the booster transmitters are not in geo-targeted broadcast mode the AES switch selects Main audio for the booster transmitters. When the booster transmitters are in geo-targeted mode the zone audio is selected by the AES switch. Whenever EAS broadcasts are initiated, the Main audio is replaced with EAS programming. The same control that initiates the EAS broadcast also overrides the AES switch control so that the only the EAS broadcasting is selected for the booster transmitters. The control line is shown as the dashed line in the diagram.
Operation of the KSJO EAS geo-targeting override was tested simultaneously in two locations to ensure that the EAS broadcast controls function properly. The received audio from the Main transmitter was recorded on the Kenwood receiver located in a parking lot in Fremont. The received audio from the FM2 booster was recorded on another Kenwood receiver on the side of a road just off the Andrade Road exit from Interstate 680. The EAS broadcast consisted of the standard EAS tones. There was no additional voice EAS message broadcast. The results are shown below. The upper trace shows the monaural audio recorded from the Main transmitter.
Figure 23. EAS Alert Tone Audio Data with Geo-Targeted Broadcasting
The simultaneous reception of identical EAS tones at these two locations (using two separate measurement systems in two separate vehicles) confirms that geo-targeted broadcasting will not affect performance of the EAS system.

KSJO TECHNICAL REPORT | 17 SEPTEMBER 2021 | VERSION 0.99
36 Roberson and Associates, LLC
5 CONCLUSIONS Our following conclusions are organized within the Success Criteria categories of Section 1.2.
5.1 Success Criteria Assessment The deployment, data collected and analysis of the KSJO demonstration system was designed to address key stakeholder issues and questions raised in discussions and within the NPRM process. The specific issues (i.e., the Success Criteria) addressed are identified and discussed in Section 1.2. The test results discussed in Section 4 are organized within context of these Success Criteria. We therefore are also organizing our conclusions along these same lines.
5.1.1 General Transition The primary technical issue raised by commentors is the size of the zone transition region in a commercial grade designed and deployed geo-targeted broadcast zone. For this system the transition region was designed to cross Interstate 680 perpendicular to the road near the Sheridan Road overpass (see Figure 12). Interstate 680 is relatively flat in this area and is surrounded by hilly terrain. Extensive mobile environment data was collected.
Our data and analysis indicate that a properly designed zone transition can deliver a highly compact region -- a tiny portion of KSJO’s service area -- over which any degraded analog FM audio will be experienced. Our measured results indicate a mean zone transition length of 50.2 meters with a 25.4-meter standard deviation (see Table 4). This distance is insignificant when compared to the total length of roads within the zone (i.e., 621,000 m). We have also demonstrated that the area over which this zone transition occurs is highly stable (see Figure 12) as is the general received signal behavior (see Figure 14).
Regarding the concern that there could be areas in which it is possible to move for long distances along a zone transition boundary, the design of this specific zone has demonstrated that zone transition boundaries can be designed to fall in unpopulated areas or perpendicular to roads and highways. After our extensive field tests in which we experienced over 60 geo-targeting broadcast transitions, we did not hear the signal instability of concern occur even once. Clearly this result can’t prove the negative that this issue couldn’t occur in a poorly designed geo-targeting system, but it certainly is a practical demonstration that a system can be designed to prevent such an issue. Finally, no sensible broadcaster would accept delivery of a geo-targeting system that behaves in this manner.
5.1.2 HD Performance Listening to zone transitions when the vehicle radio was set to HD1 mode was different from listening when the vehicle radio was set to FM. For HD1, the transition within a zone transition region happens so fast, with good audio quality throughout, that it is not feasible to set a multipath threshold for estimating HD Radio transition region size. The HD1 and FM signals behave as a “selection diversity” system, providing good quality audio throughout the transition. The overall zone transition listening experience for HD1 was very good, with almost instantaneous transitions without noticeable audio degradation.
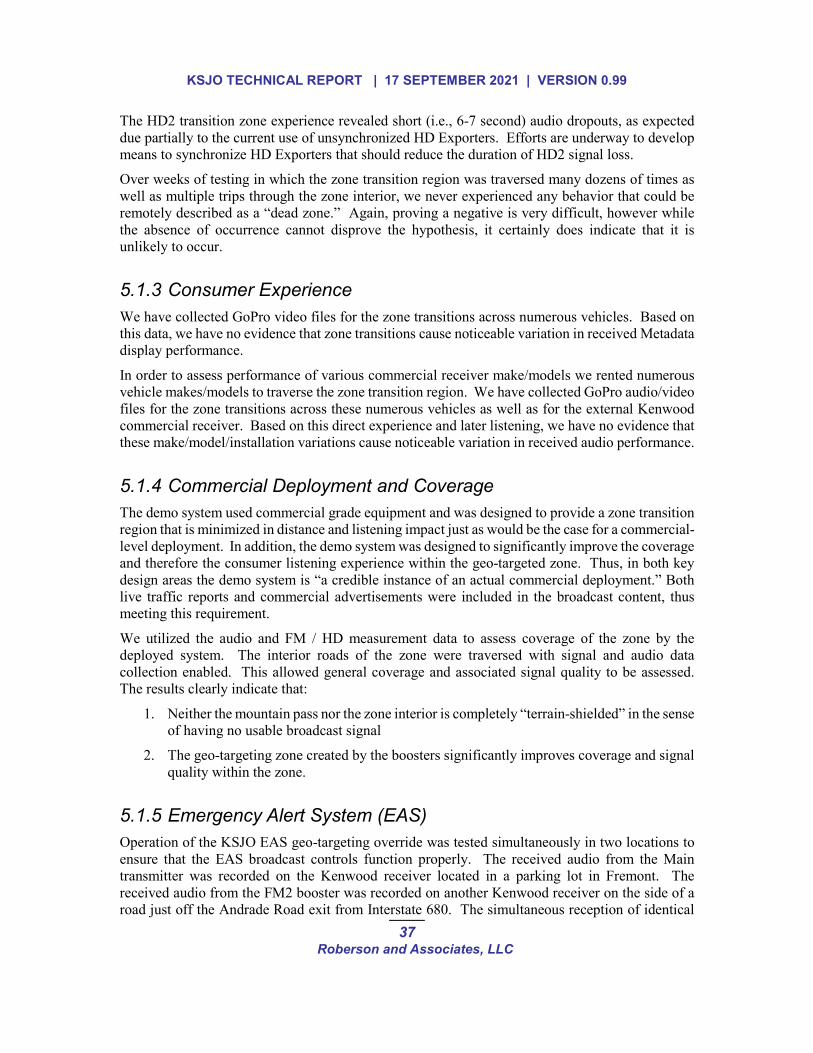
KSJO TECHNICAL REPORT | 17 SEPTEMBER 2021 | VERSION 0.99
37 Roberson and Associates, LLC
The HD2 transition zone experience revealed short (i.e., 6-7 second) audio dropouts, as expected due partially to the current use of unsynchronized HD Exporters. Efforts are underway to develop means to synchronize HD Exporters that should reduce the duration of HD2 signal loss.
Over weeks of testing in which the zone transition region was traversed many dozens of times as well as multiple trips through the zone interior, we never experienced any behavior that could be remotely described as a “dead zone.” Again, proving a negative is very difficult, however while the absence of occurrence cannot disprove the hypothesis, it certainly does indicate that it is unlikely to occur.
5.1.3 Consumer Experience We have collected GoPro video files for the zone transitions across numerous vehicles. Based on this data, we have no evidence that zone transitions cause noticeable variation in received Metadata display performance.
In order to assess performance of various commercial receiver make/models we rented numerous vehicle makes/models to traverse the zone transition region. We have collected GoPro audio/video files for the zone transitions across these numerous vehicles as well as for the external Kenwood commercial receiver. Based on this direct experience and later listening, we have no evidence that these make/model/installation variations cause noticeable variation in received audio performance.
5.1.4 Commercial Deployment and Coverage The demo system used commercial grade equipment and was designed to provide a zone transition region that is minimized in distance and listening impact just as would be the case for a commercial-level deployment. In addition, the demo system was designed to significantly improve the coverage and therefore the consumer listening experience within the geo-targeted zone. Thus, in both key design areas the demo system is “a credible instance of an actual commercial deployment.” Both live traffic reports and commercial advertisements were included in the broadcast content, thus meeting this requirement.
We utilized the audio and FM / HD measurement data to assess coverage of the zone by the deployed system. The interior roads of the zone were traversed with signal and audio data collection enabled. This allowed general coverage and associated signal quality to be assessed. The results clearly indicate that:
1. Neither the mountain pass nor the zone interior is completely “terrain-shielded” in the sense of having no usable broadcast signal
2. The geo-targeting zone created by the boosters significantly improves coverage and signal quality within the zone.
5.1.5 Emergency Alert System (EAS) Operation of the KSJO EAS geo-targeting override was tested simultaneously in two locations to ensure that the EAS broadcast controls function properly. The received audio from the Main transmitter was recorded on the Kenwood receiver located in a parking lot in Fremont. The received audio from the FM2 booster was recorded on another Kenwood receiver on the side of a road just off the Andrade Road exit from Interstate 680. The simultaneous reception of identical

KSJO TECHNICAL REPORT | 17 SEPTEMBER 2021 | VERSION 0.99
38 Roberson and Associates, LLC
EAS tones at these two locations confirms that geo-targeted broadcasting will not affect performance of the EAS system.
5.2 Overall Technical Viability Assessment Having made numerous careful measurements and having assessed the results of these measurements in considerable depth, it is our conclusion that the geo-targeted broadcast system provides both a practical and highly beneficial capability. It is therefore our studied opinion that there is no technical reason that the geo-position zone broadcasting petition before the FCC should not be approved.
KSJO TECHNICAL REPORT | 17 SEPTEMBER 2021 | VERSION 0.99
39 Roberson and Associates, LLC
REFERENCES [1] Amendment of Section 74.1231(i) of the Commission’s Rules on FM Broadcast Booster
Stations, MB Dockets 20-401 and 17-105 (December 1, 2020), https://ecfsapi.fcc.gov/file/1202219000352/FCC-20-166A1.pdf .
[2] Amendment of Section 74.1231(i) of the Commission’s Rules on FM Broadcast Booster Stations, MB Dockets 20-401 and 17-105, Comments of the National Association of Broadcasters (February 10, 2021), https://ecfsapi.fcc.gov/file/1021036085158/NAB Comments NPRM Booster Program Origination 2-10-21.pdf .
[3] Amendment of Section 74.1231(i) of the Commission’s Rules on FM Broadcast Booster Stations, MB Dockets 20-401 and 17-105, Comments of Beasley Media Group, LLC; Cumulus Media New Holdings Inc.; Entercom Communications Corp.; iHeart Communications, Inc.; New York Public Radio and Salem Media Group, Inc. (February 10, 2021), https://ecfsapi.fcc.gov/file/1021075999676/Joint Comments on Amendment of 74.1231 FM Broadcast Booster Stations 2_10_2021 Final.pdf .
[4] Amendment of Section 74.1231(i) of the Commission’s Rules on FM Broadcast Booster Stations, MB Dockets 20-401 and 17-105, Reply Comments of the National Association of Broadcasters (March 12, 2021), https://ecfsapi.fcc.gov/file/1031266523188/GBS Reply Comments 3.12.21.pdf .
[5] Amendment of Section 74.1231(i) of the Commission’s Rules on FM Broadcast Booster Stations, MB Dockets 20-401 and 17-105, Reply Comments of Beasley Media Group, LLC; Cumulus Media New Holdings Inc.; Entercom Communications Corp.; iHeart Communications, Inc.; New York Public Radio and Salem Media Group, Inc. (March 12, 2021), https://ecfsapi.fcc.gov/file/10313261266426/Joint Reply Comments on Amendment of 74.1231 FM Broadcast Booster Stations Final.pdf.
[6] Amendment of Section 74.1231(i) of the Commission’s Rules on FM Broadcast Booster Stations, MB Dockets 20-401 and 17-105, Comments of Xperi Holding Corporation (February 10, 2021), https://ecfsapi.fcc.gov/file/1021091599267/Xperi ZoneCasting NPRM Comments (Final).pdf .
KSJO TECHNICAL REPORT | 17 SEPTEMBER 2021 | VERSION 0.99
40 Roberson and Associates, LLC
A. KEY CONTRIBUTOR BIOS Dennis Roberson, President and CEO Mr. Roberson is the Founder, President, Chief Executive Officer, and Member of Roberson and Associates, LLC and has over 40 years of industry experience. In parallel with this role, he serves as a Research Professor in Computer Science at Illinois Institute of Technology where he has been an active researcher in the wireless networking arena, a co-founder of IIT’s Wireless Network and Communications Research Center (WiNCom), and a co-founder of the Intellectual Property Management and Markets Program. His wireless research has focused on dynamic spectrum access networks, spectrum measurement systems and spectrum management, and wireless interference and its mitigation, all of which are important to the Roberson and Associates mission.
Previously, he served as Vice Provost for Research at Illinois Institute of Technology. Prior to IIT, Mr. Roberson was Executive Vice President and Chief Technology Officer at Motorola. He had an extensive corporate career, which included major business and technology responsibilities at IBM, Digital Equipment Corporation (DEC, now part of HPE), AT&T, and NCR. He has several issued and pending patents. He has been involved with a wide variety of technology, cultural, educational, and youth organizations, including service as Chair of the Federal Communications Commission Technical Advisory Council, and membership on both the Commerce Spectrum Management Advisory Committee and the Board of the Marconi Society. Mr. Roberson serves on the governing and/or advisory boards of several exciting technology-based companies. He is a frequent speaker at universities, companies, technical workshops, and conferences around the globe.
Mr. Roberson holds Bachelor of Science degrees in Electrical Engineering and in Physics from Washington State University and a Master of Science in Electrical Engineering from Stanford University.
Mark Birchler, Senior Principal Investigator Mr. Birchler joined Roberson and Associates in 2011. He led the deployment of long-term spectrum observatory systems, supported FCC policy development, and provided consultation on dynamic spectrum access coexistence issues. Mr. Birchler has led programs relating to technology and standards associated with DoD/commercial spectrum sharing in the 3.5 GHz and AWS-3 bands, and DARPA spectrum situational awareness. In addition, he has led numerous projects for commercial wireless companies and a cellular operator.
In his 27-year career at Motorola Mr. Birchler contributed to 23 issued patents and led a wireless research department in Motorola Labs.
Mr. Birchler received his Bachelor of Science in Electrical Engineering degree from the University of Minnesota and his Master of Science in Electrical Engineering from Illinois Institute of Technology.
Dr. John Grosspietsch, Principal Engineer III Dr. Grosspietsch joined Roberson and Associates in 2014 and has 32 years’ experience in the industry. He focuses on spectrum compatibility measurement and analysis.

KSJO TECHNICAL REPORT | 17 SEPTEMBER 2021 | VERSION 0.99
41 Roberson and Associates, LLC
Previously, Dr. Grosspietsch was responsible for migrating a legacy Electronic Health Record application to a cloud computing environment. He was a Fellow of the Technical Staff at Motorola Solutions, where he managed research projects in advanced communications systems technologies for mission critical and Smart Grid applications in the Enterprise Mobility Solutions Research Group. He also led a variety of research projects in Software Defined Radio and Cognitive Radio technologies at Motorola Labs.
Dr. Grosspietsch earned a Bachelor of Science in Electrical Engineering, a Master of Science in Electrical Engineering, and a Ph.D. in Electrical Engineering, all from Illinois Institute of Technology.
KSJO TECHNICAL REPORT | 17 SEPTEMBER 2021 | VERSION 0.99
42 Roberson and Associates, LLC
B. “SUCCESS CRITERIA” SOURCES The following information provides details on the “Success Criteria” sources introduced in Section 1.2.1.
Four Broadcast CTOs: These criteria were communicated to Roberson and Associates (RAA) in a meeting on June 15, 2020 with CTOs from the top four FM broadcasting networks. The FM broadcast network CTOs in attendance were: Mike Cooney (BBGI-Beasley), John Kennedy (Audacy), Jeff Littlejohn (iHeart Media) and Conrad Trautmann (Cumulus).
National Association of Broadcasters Comments [2]: The business issues raised in Section II were not included. Items identified in Section III were included. Information from Sections I and IV were also not utilized as they are likely repeats from the document body sections.
Joint Comments [3]: This joint group includes: Beasley Media Group, LLC; Cumulus Media New Holdings Inc.; Entercom Communications Corp (now Audacy).; iHeart Communications, Inc.; New York Public Radio and Salem Media Group, Inc. Due to the length and complexity of this document items were limited to the enumerated information from Section IV and the bulleted information from Section V. Note that the bulleted information from Section V is a subset of the questions posed in the original FCC NPRM document that the commentors believe to be of high priority. This limitation was imposed under the assumption that these sections are reasonable summaries of the detailed discussion that precedes them.
National Association of Broadcasters Reply Comments [4]: Technical issues were primarily selected for inclusion.
Joint Reply Comments [5]: This joint group includes: Beasley Media Group, LLC; Cumulus Media New Holdings Inc.; Entercom Communications Corp (now Audacy).; iHeart Communications, Inc.; New York Public Radio and Salem Media Group, Inc This document highlights concerns and issues raised by Xperi, which is a key stakeholder in HD Radio technology. Therefore, it is these issues and concerns that were selected.
Xperi Comments [6]: Issues in addition to those quoted by the Joint Reply group from Xperi were selected from this document.

KSJO TECHNICAL REPORT | 17 SEPTEMBER 2021 | VERSION 0.99
43 Roberson and Associates, LLC
C. DATA COLLECTION CAMPAIGNS Data was collected during four visits to Fremont California. The data collected is summarized in the table below.
Campaign Dates Campaign Description
June 30 – July 1 Long commercials and music Main transmitter only data along I-680
July 13 – July 14 EAS audio and dashboard video Geo-targeted broadcast with same and different content
July 20 – July 22 Audio, video, and Nomad data for short commercials Main area and zone area traffic reports
August 4 – August 5 Audio and dashboard video of zone traffic reports Nomad data for KSJO and KBAY along I-680
Table 7. Data Collection Campaign Trips
Audio files, video files, and measurement data were collected during four visits to the KSJO coverage area. The summary of the data collected is shown below. The MP3 files were saved by the Nomad measurement software for two Inovonics Sofia 568 receivers. The first receiver saved received FM and HD1 in split-mode. The second receiver saved recordings of received HD2 audio.
The MP4 files were video files saved from the GoPro cameras used to record the vehicle dashboard.
The WAV files were saved from the ZOOM H1N and H4N audio recorders connected to Kenwood FM HD receivers.
Data Type Number Files Total Recording Length H:M:S
GB
Audio mp3 files from Nomad Test Equipment
188 21:31:13 1.24
Video mp4 files from GoPro dashboard cameras
139 10:52:30 233.7
Audio wav files recorded from Kenwood FM receivers
92 9:37:49 6.48
Table 8. Data Collection Statistics
Each day after the completion of measurements the audio, video, and data files were copied to an SSD drive. Scripts were run on the original SD Card file directories for the video and audio data to save the file creation and file modification timestamps for later used. A test log was also created that included the time, the measurement type, and the filenames of the audio, video, and the Nomad Campaign name. The files were also backed up onto a second SSD drive.

KSJO TECHNICAL REPORT | 17 SEPTEMBER 2021 | VERSION 0.99
44 Roberson and Associates, LLC
D. DEMO AND DATA COLLECTION DETAILS Booster Sites The goal of the KSJO demonstration (see Section 1.1.2) was to improve the coverage along Interstate 680 through Mission Pass and create a geo-targeted zone to serve the Pleasanton-Livermore area. Two booster transmitters were constructed on a Tower-on-Wheels (TOW) for deployment along I-680. The two transmitters were deployed neat the top of a hill West of Highway 689 near the Sheridan Road exit. The map below shows the deployment location.
Figure 24. TOW Dual-Booster Location
The two booster antennas were mounted back-to-back and each rotated by 45 degrees from vertical so that they are rotated 90 degrees relative to each other. The antennas were aligned parallel with I-680.
The following figure shows a photograph of the FM2 booster antenna on the left and FM3 booster antenna on the right. The view is towards the East with I-680 behind and down the hill from the hilltop site.

KSJO TECHNICAL REPORT | 17 SEPTEMBER 2021 | VERSION 0.99
45 Roberson and Associates, LLC
Figure 25. FM2 (left) and FM3 (right) Booster Antennas
The first transmitter exciter (FM2) had a power output of 300W and was connected to an antenna that pointed Northeast towards Pleasanton.
Figure 26. View Towards the NE from FM2 Site Showing I-680.
The second transmitter exciter (FM3, which is the boosted Main transmitter) had a power output of 75W and was connected to the antenna pointed Southwest towards Fremont. The line-of-sight path from the FM3 antenna towards I-680 was partially blocked by the hilly terrain. The photograph below shows the view towards Fremont from the Southeast edge of the hilltop. The Sheridan Road bridge over I-680 is partially visible on the left side.

KSJO TECHNICAL REPORT | 17 SEPTEMBER 2021 | VERSION 0.99
46 Roberson and Associates, LLC
Figure 27. View Towards Fremont on I-680 from Southwest Edge of the Hill.
The difference in elevation between the Tower-on-Wheels hilltop site and the nearest point along I-680 was estimated to be nearly 200 feet.
Vehicle GoPro The following figure shows a photograph of one GoPro vehicle installation. Recall that this system (see Section 2.2.4) was used to collect audio/video data from a variety of FM/HD receiver make/models. This was accomplished by renting a significant number of test vehicles.
Figure 28. Photograph of GoPro Mount and Camera with Media Mod