evolution of access technologies - prodnet. · federal communications commission washington, d.c....
TRANSCRIPT
Federal Communications Commission Washington, D.C. 20554
Ms. Marlene Dortch Secretary Federal Communications Commission 445 1ih Street, SW Washington, DC 20554
April 12, 2013
Re: Technology Transitions Policy Task Force, GN Docket No. 13-5; Connect America Fund, WC Docket No. 10-90; High-Cost Universal Service Support, WC Docket No. 05-337
Dear Ms. Dortch:
On Monday, March 18, 2013, the Technology Transitions Policy Task Force (Task Force) held its first workshop in a planned series of workshops to analyze technology transitions and their implications for modernizing Commission policy. 1 The workshop solicited data and analysis on the following topics: the technological capability of wireless and wireline (copper, fiber and coax) technologies today and in the future, the adoption and use of various technologies across the diverse demographics of our nation, and the timing of the technological transition for different wireline and wireless networks as well as drivers for the timing of the technology transition. With this letter, the attached presentations are submitted into the docket for the above-captioned proceedings.
Re. s;;~t~itted, /
~~ ,/\//--Claude Aiken ./ cj -Attorney Office of General Counsel Federal Communications Commission
Enclosure
1 See FCC Announces First Technology Transitions Policy Task Force Workshop, GN Docket No. 13-5, Public Notice, DA 13-192 (rei. Feb. 12, 2013); FCC Provides Panelist Information for the First Technology Transitions Policy Task Force Workshop, GN Docket No. 13-5, Public Notice, DA 13-432 (rei. March 14, 2013); FCC Provides Additional Details Regarding the First Technology Transitions Policy Task Force Workshop, GN Docket No. 13-5, Public Notice, DA 13-383 (rei. March 11, 2013).

COPYRIGHT © 2011 ALCATEL-LUCENT. ALL RIGHTS RESERVED.
1
David Eckard – CTO Fixed Networks DivisionMarch 18th, 2013
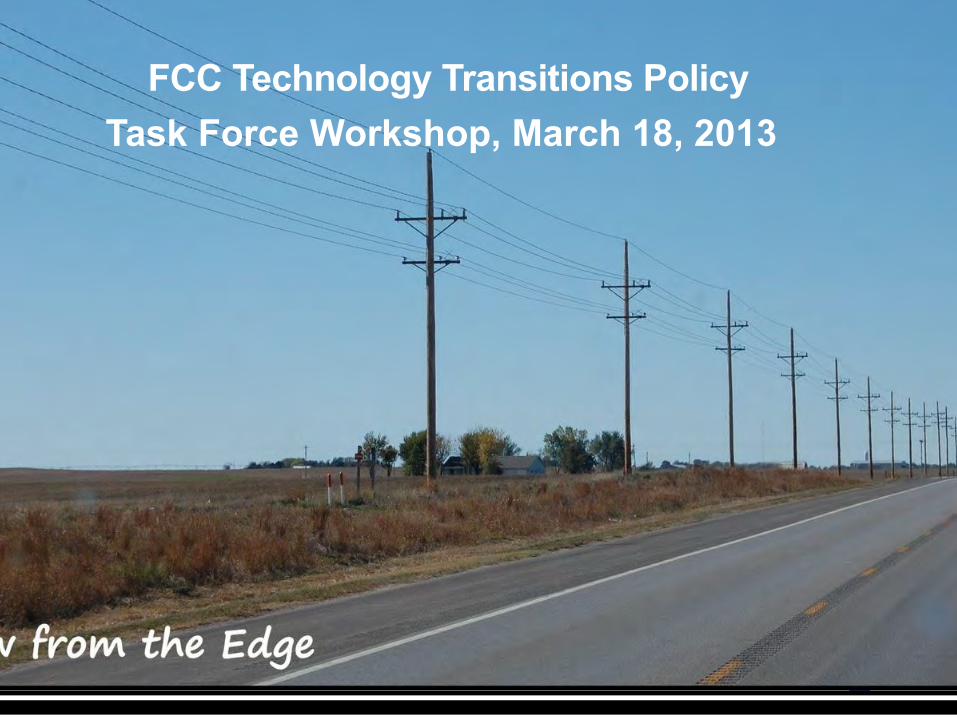
Evolution of Access TechnologiesFCC Technology Transitions Policy Task Force Workshop

COPYRIGHT © 2011 ALCATEL-LUCENT. ALL RIGHTS RESERVED.
GOVERNMENTS RECOGNIZE THE VALUE OF BROADBAND…AND ENCOURAGING THE EXECUTION
Socio-economic benefits:
• Job creation• Close the Digital Divide• Location Independence• Productivity
Cost savings:• Health• Education• Transportation• Energy Conservation
Connecting America100M for 100M by 2020
Brazil Plano Nacional90M BB users by 2014
EU Digital AgendaBB for all and100M for 50% HH by 2020
China 12th 5-year planFTTH (CT:100M for 100M by 2015
India National BackboneBB for 90% by 2013Rp 4.5B
Australia NBN100M for 90% by 2020, 43B A$
3
COPYRIGHT © 2011 ALCATEL-LUCENT. ALL RIGHTS RESERVED.
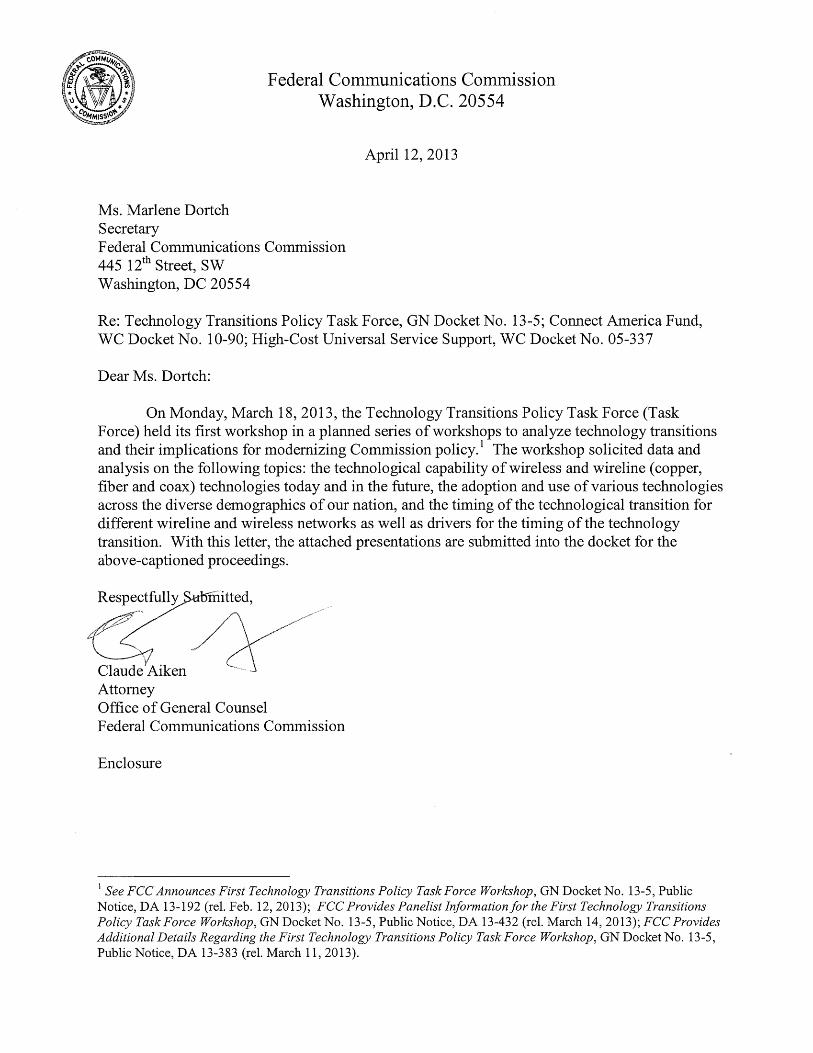
Can vectored VDSL2 meet future bandwidth demand?
Add 2-pair bonding:
~2x speed
Longerdistance
0
20
40
60
80
100
120
0 200 400 600 800 1000 1200Distance (meters)
Bandwidth Supply:
VDSL2 vectoring1 pair
or
Service vs Coverage for representative NAR FTTN Serving Area
TIME
Measured Performance of Vectoring
0%
10%
20%
30%
40%
50%
60%
70%
80%
90%
100%
20 30 40 50 60 70 80 90 100
Percen
t of H
omes
Bit Rate (Mbps)
Bonded VectoredVDSL2Bonded VDSL2
Vectored VDSL2
VDLS2
Bit R
ate (M
bps)

4
COPYRIGHT © 2011 ALCATEL-LUCENT. ALL RIGHTS RESERVED.
• Don’t Count Copper Out- Incremental upgrade to FTTN with
vectoring can achieve the throughputtargets
- Use bonding and small remote nodesto reach remaining subscribers
- Beyond vectoring and bonding,loops will be getting shorter andshorter to support even higherbandwidths (>>100Mbps)
- Operators will need to deploy remotes deeper into the network- CAPEX Investments
- Remote Powering
- Manage Operational Overhead
- Then for >>100 Mbps does fiber not make more sense?
• Passive Optical Networks offers the greatest flexibility - Reduction in OPEX and Maintenance
- Differentiated bandwidth - Support for high peak bandwidth on demand
- Longevity – deploy a network for our children and their children’s generations
- Reuse of fiber plant - support for different networks on the same fiber
Meeting the National Broadband PlanCAPEX per subscriber (35% take rate)
0
5
10
15
20
ADSL/CO FTTN192 lines
FTTN-Vectoring192 lines
FTTdp-48 FTTdp-16G.fast
FTTH
Home EquipmentHome ConnectionCivil Works & CablesCabinets/POPsSplittersEquipment
Incremental Upgrade
Deep Fiber>> 100 Mbps

5
COPYRIGHT © 2011 ALCATEL-LUCENT. ALL RIGHTS RESERVED.
Fiber Enables New Markets and Services Leveraging the Fixed Network Assets
SMALL CELL BACKHAUL
RESIDENTIAL FTTH
BUSINESS SERVICES
FTTB ANDREMOTE NODEBACKHAUL
2.5G/2.5G TWDM2.5G/1.25G GPON
10G/2.5G XG-PON110G/10G TWDM
Not all challenges are technical … some are organizational and operational
Reuse the Civil Investment - ODN
OLT
ONU
ONU
ONU
ONU

6
COPYRIGHT © 2011 ALCATEL-LUCENT. ALL RIGHTS RESERVED.
http://www2.alcatel-lucent.com/techzine/is-symmetrical-bandwidth-a-myth-or-a-must
http://www2.alcatel-lucent.com/techzine/vdsl2-vectoring-delivers-on-its-promise
http://www2.alcatel-lucent.com/techzine/boosting-vdsl2-bit-rates-with-vectoring
Further Reading
1 © 2013 Calix – Proprietary and Confidential
FCC Technology Transitions Policy Task Force Workshop, March 18, 2013
2 © 2013 Calix – Proprietary and Confidential
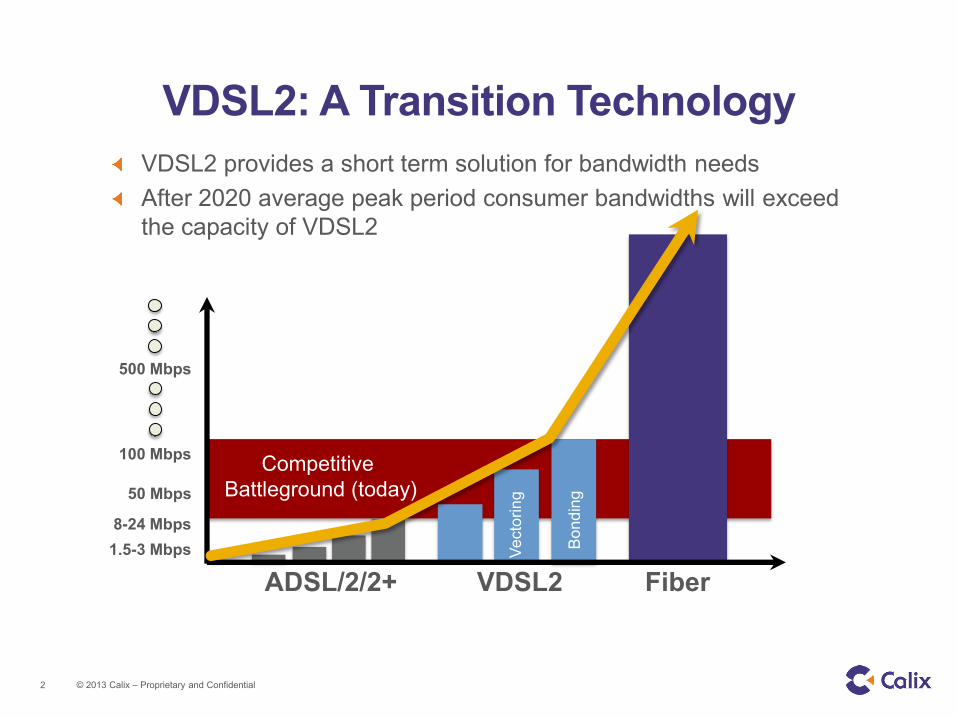
VDSL2: A Transition Technology VDSL2 provides a short term solution for bandwidth needs After 2020 average peak period consumer bandwidths will exceed the capacity of VDSL2
VDSL2 Fiber ADSL/2/2+ 1.5-3 Mbps 8-24 Mbps
50 Mbps
100 Mbps
500 Mbps
Bon
ding
Vect
orin
g
Competitive Battleground (today)

3 © 2013 Calix – Proprietary and Confidential
Defining Five Key Technologies
ADSL2+-DSL technology commonly used in the U.S. today
VDSL2-Next generation DSL technology in the process of being deployed in much of the U.S. VDSL2 products automatically fall back to ADSL2+ when that technology has superior performance
Bonding-Utilizing 2 or more pairs of copper to increase bandwidth or the loop length of a given bandwidth. Bonding can be done on both ADSL2+ and VDSL2 technologies
Vectoring-A signal processing technology that reduces the impact of noise in VDSL2 system
FTTH-Fiber-to-the-Home utilizes either passive (PON) or active (Pt-to-pt Gigabit Ethernet) to bring bandwidth directly to the customer premises
4 © 2013 Calix – Proprietary and Confidential
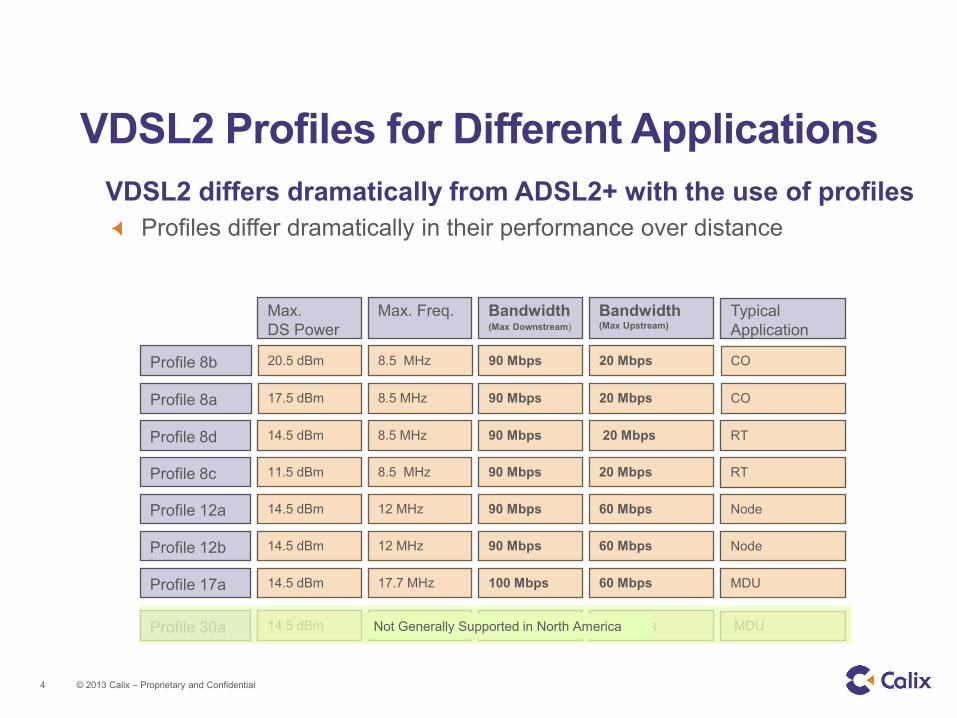
VDSL2 Profiles for Different Applications VDSL2 differs dramatically from ADSL2+ with the use of profiles
Profiles differ dramatically in their performance over distance
Profile 8c
Profile 12a
Profile 12b
Profile 17a
Profile 30a
Max. DS Power
Max. Freq.
11.5 dBm 8.5 MHz 90 Mbps 20 Mbps
14.5 dBm 12 MHz 90 Mbps 60 Mbps
14.5 dBm 12 MHz 90 Mbps 60 Mbps
14.5 dBm 17.7 MHz 100 Mbps 60 Mbps
14.5 dBm 30 MHz 100 Mbps 100 Mbps
Bandwidth (Max Downstream)
Bandwidth (Max Upstream)
RT
Node
Node
MDU
MDU
Typical Application
Profile 8a 17.5 dBm 8.5 MHz 90 Mbps 20 Mbps CO
Profile 8b 20.5 dBm 8.5 MHz 90 Mbps 20 Mbps CO
Profile 8d 14.5 dBm 8.5 MHz 90 Mbps 20 Mbps RT
Not Generally Supported in North America

5 © 2013 Calix – Proprietary and Confidential
DSL Performance and Bonding B
andw
idth
(Mbp
s)
-
10
20
30
40
50
60
70
80
90
100
110
0k 1k 2k 3k 4k 5k 6k 7k 8k 9k 10k 11k 12k 13k 14k 15k 16k 17k 18k
VDSL2 2-PrVDSL2 1-PrADSL2 2-PrADSL2 1-Pr
Loop Length in Kft (26 gauge wire, no disturbers)

6 © 2013 Calix – Proprietary and Confidential
0
10
20
30
40
50
60
70
80
90
100
300 600 900 1200 1600 2000 2400 2800 3200 3600 4000
VDSL2 Performance
Ban
dwid
th (M
bps)
Loop Length (ft)
0
10
20
30
40
50
60
70
80
90
100
300 600 900 1200 1600 2000 2400 2800 3200 3600 40000
10
20
30
40
50
60
70
80
90
100
300 600 900 1200 1600 2000 2400 2800 3200 3600 4000
24 pairs - vectored
24 pairs – no vectoring
Single pair – no disturbers

7 © 2013 Calix – Proprietary and Confidential
0
10
20
30
40
50
60
70
80
90
100
300 600 900 1200 1600 2000 2400 2800 3200 3600 4000
VDSL2 Take Rate Impact on Vectoring B
andw
idth
(Mbp
s)
Loop Length (ft)
Vectoring eliminated
loss: ~20 Mbps
VDSL2 only binders offer the best performance improvements
Vectoring eliminated
loss: ~40 Mbps Vectoring eliminated loss:
~30 Mbps
no vectoring, 24 loops
unit-level vectoring
Standard VDSL2:
~25 Mbps
Standard VDSL2:
~45 Mbps Standard VDSL2:
~35 Mbps

8 © 2013 Calix – Proprietary and Confidential
VDSL2 Applications
Greenfield (1-3 kft) New deployments…but these can justify FTTH
Short copper loops so bandwidth is optimized Vectoring good to ~3kft
1-3 kft

9 © 2013 Calix – Proprietary and Confidential
VDSL2 Applications Brownfield (up to 7 kft)
Deployments often served from existing cabinets
Density designed to serve high subscriber counts, or subscribers geographically dispersed (multiple binders)
Mix of short and long loops
Vectoring of no benefit between 3-9 kft
Opportunities to improve bandwidth
Bonding on loops longer than 3Kft
Shorten copper loops by extending fiber
9 kft
Vectoring from a cabinet only provides benefits on short brownfield loops
1-3 kft
Bonding opportunity for loops >3 kft
1-3 kft
1-3 kft
1-3 kft
1-3 kft
10 © 2013 Calix – Proprietary and Confidential
VDSL2 Deployment Challenges VDSL2 is a beneficial technology…but faces real-world deployment challenges
Age of copper plant – may require maintenance upgrade Old splices, bad pairs, water, etc.
Interferers and ADSL2+ loops reduce benefit of vectoring May require labor intensive binder grooming, plant and record management
Little benefit on longer loops Bandwidths fall to ADSL2+ and below levels
Bonding yields rate and reach benefits if pairs are available Pairs are not plentiful enough in many areas to allow for wide use of bonding

11 © 2013 Calix – Proprietary and Confidential
Optimal Technology 2013-2018 VDSL2 short loop lengths (up to 9 kft) satisfy denser areas FTTH loop lengths of over 20 miles are optimal for less dense areas Wireless and satellite become optimal as housing densities make FTTH less viable economically
Urban Suburban/ Rural Towns
Rural 10-100 subs per sq/mile
Rural 2-10 subs per sq/mile
Rural Less than 2 subs per sq/mile
Greenfield or Rebuild
FTTH or VDSL2 w/vectoring
FTTH or VDSL2 w/vectoring
FTTH Wireless Satellite
Brownfield VDSL2 VDSL2 ADSL2+ Wireless Satellite
12 © 2013 Calix – Proprietary and Confidential
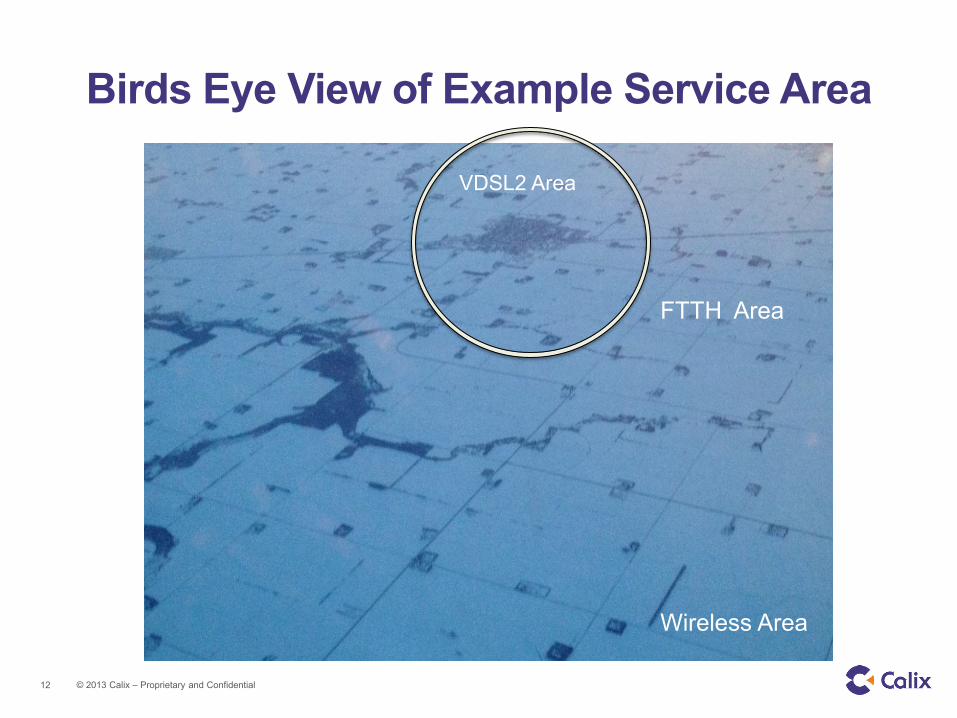
Birds Eye View of Example Service Area
VDSL2 Area
FTTH Area
Wireless Area

From Wireline to Wireless Broadband
Prof. Dina Katabi
Director of the MIT Center for Wireless Networks and Mobile Computing (Wireless@MIT)
http://wireless.csail.mit.edu

Can Wireless Replace Wireline Broadband,
Particularly in Rural Areas?
• Technologically can deliver high-capacity to
communities with no wireline connectivity
–3G or 4G alone will not do
–Need to deploy innovative technologies

High-Capacity Technologies
• Get the best out of the spectrum you have
– Interference Alignment
– Distributed MIMO -- MegaMIMO
• Dynamic spectrum sharing
– GHz realtime low-cost spectrum sensing

Rural Communities at Cells’ Edge
Bad service; Multiple interferers!
What if many base stations coordinate and act as a powerful distributed MegaMIMO
base station?

MegaMIMO: Distributed MIMO
User 1
Internet
User 2 User 3 User 10
…
10 BSs on same band 10x higher throughput
MegaMIMO enables BSs to act as a huge MIMO
transmitter with sum of antennas

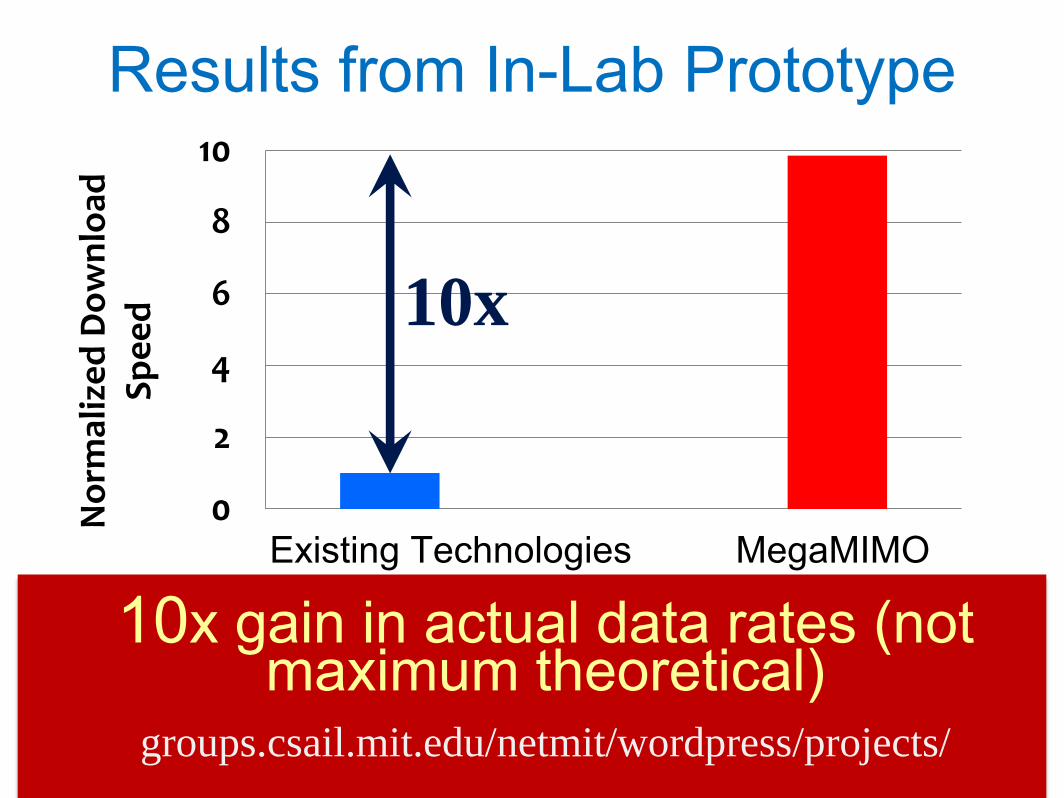
Testbed of Software Radios
0
2
4
6
8
10
No
rmal
ize
d D
ow
nlo
ad
Sp
ee
d
Existing Technologies MegaMIMO
Results from In-Lab Prototype
10x
10x gain in actual data rates (not maximum theoretical)
groups.csail.mit.edu/netmit/wordpress/projects/

GHz Realtime Low-Cost Spectrum Sensing
• Today, can’t capture very wide spectrum in
realtime
• Sequential scanning of tens of MHz
Can easily miss radar signals

Idea: Leverage Sparsity
Sparse recovery show that one can acquire sparse signals using sub-Nyquist sampling
Seattle January 7, 2013 (Microsoft Spectrum observatory)
Sparse FFT Winner of TR10, 2012 (Technology Review); Featured in
IEEE Spectrum, Discover magazine, BBC radio, Slashdot, … http://groups.csail.mit.edu/netmit/sFFT/
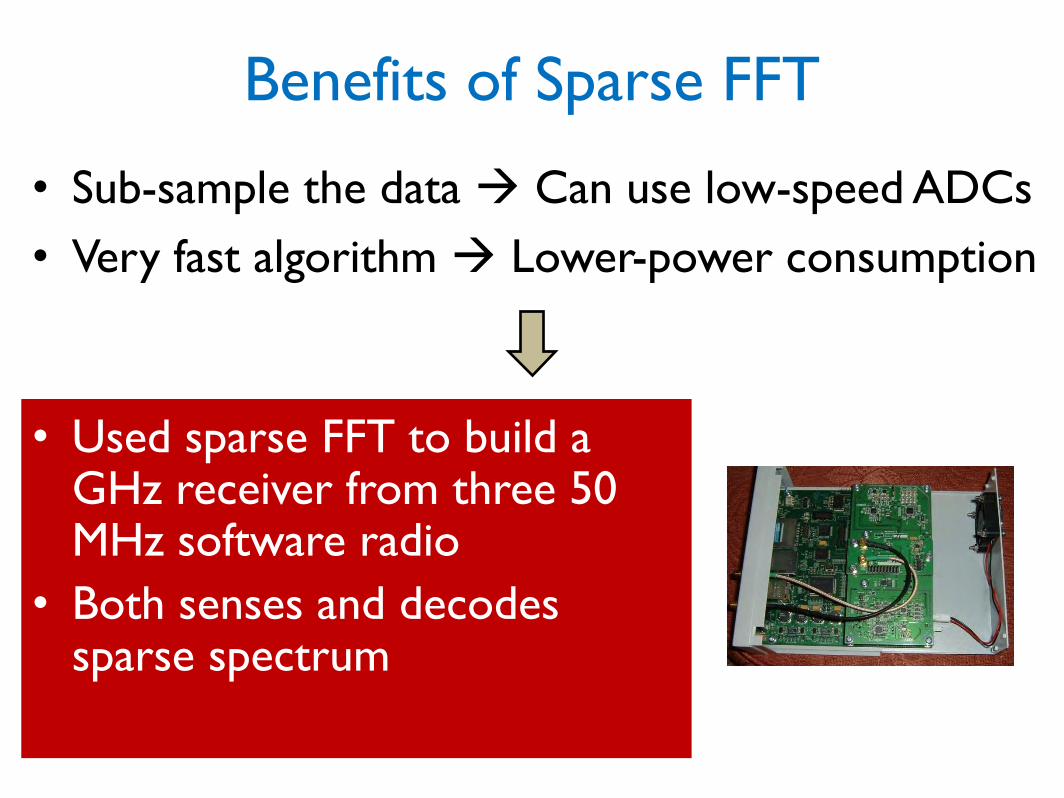
Benefits of Sparse FFT
• Sub-sample the data Can use low-speed ADCs
• Very fast algorithm Lower-power consumption
• Used sparse FFT to build a GHz receiver from three 50 MHz software radio
• Both senses and decodes sparse spectrum

Realtime GHz Spectrum Sensing
Cambridge, MA January 18 2013
sFFT enables realtime low-cost GHz sensing and decoding
Wireless Technology Transition
Mung Chiang
Princeton University EDGE Lab

Technology Transition > Technology
Phasing out is even more challenging than rolling out
Is the technology backward compatible? Is the benefit incrementally deployable? Is the cost incentive compatible?
Human cost Equipment cost Spectrum cost

From Harmonization to Scale
Lowered Fixed Cost/Prince
Affordable Product
Increased Production Large Market/Revenue
More Investment on Production
Need enough incentive certainty and clear expected return to start the cycle

LTE Today
LTE is great because: Efficiency (b/s/Hz): Higher speed Architecture (IP): Simpler and faster Harmonization
What about: Fixed wireless: rural and urban dense Copper: help with small cell backhaul
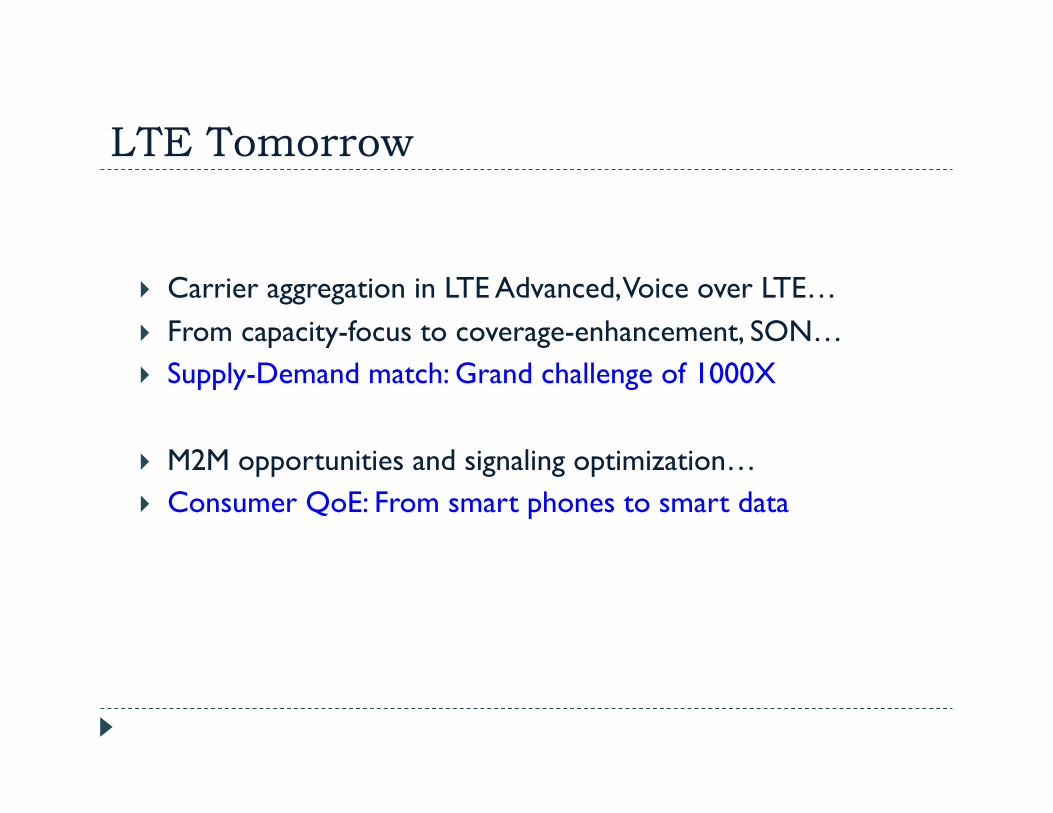
LTE Tomorrow
Carrier aggregation in LTE Advanced, Voice over LTE… From capacity-focus to coverage-enhancement, SON… Supply-Demand match: Grand challenge of 1000X
M2M opportunities and signaling optimization… Consumer QoE: From smart phones to smart data

Supply: Smaller

Supply: Denser

Supply: “Wilder”
Unlicensed Licensed, Planned Licensed, Unplanned
Core Network
Con
trol
Pla
ne
Dat
a Pl
ane
Internet
RNS (eNodeB)
Wi-Fi AP
HNS (SeGW, HNB-GW,
HomeNodeB)

Demand: Smart Data-Pricing (SDP)
Smarter sharing on “demand side” Application-layer, end-user-driven, tiered sharing & reuse “5G”:
user experience personalization app economics pipe-content divide
MTA – Princeton trial in rural Alaska
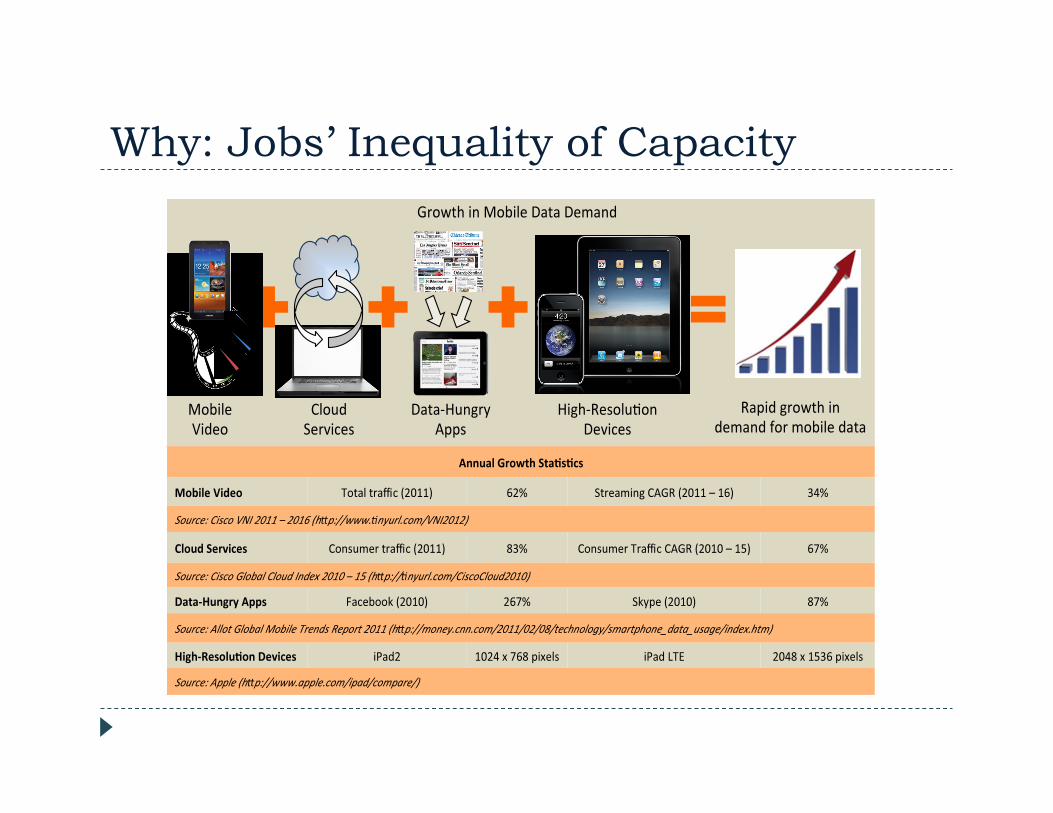
Why: Jobs’ Inequality of Capacity

Waste and Opportunity in “Time”
Volume
Time Elas-city
Streaming
videos, Gaming
Tex3ng, Weathe
r, Finance
Email, Social Networ
k updates
Cloud
So@ware Downloads
Movies & Mul3media downloads,
P2P
Opportuni-es
Peak-average discrepancy
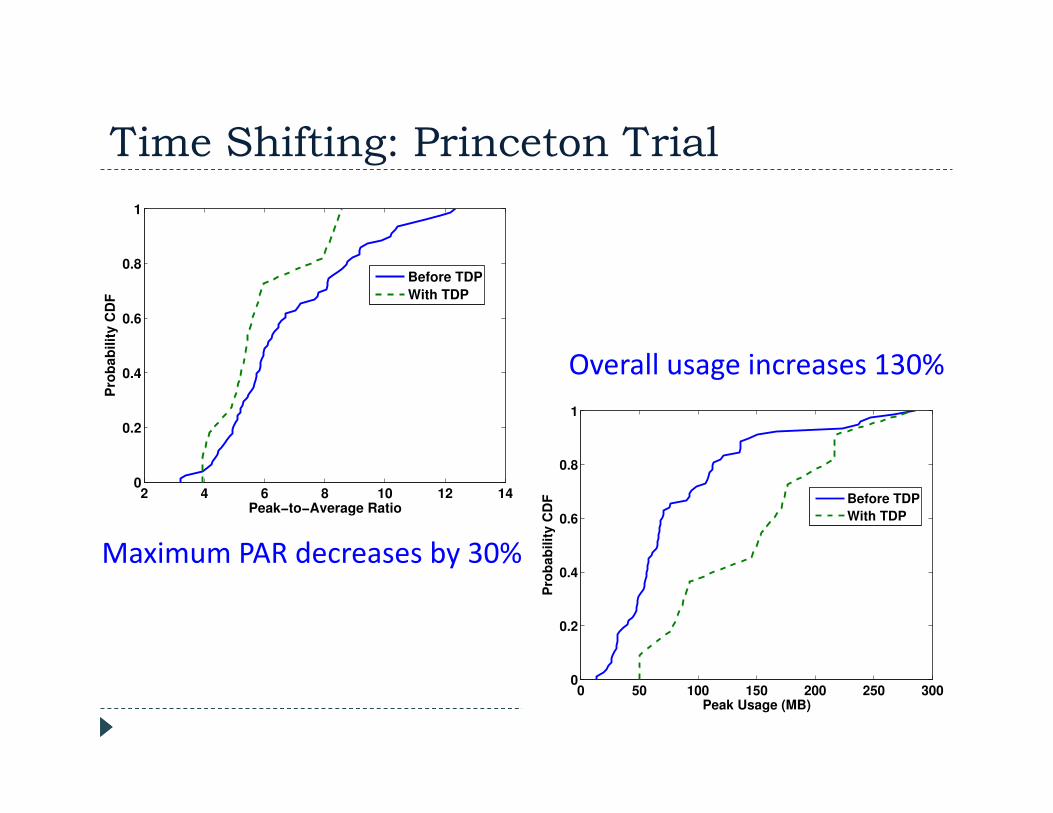
Time Shifting: Princeton Trial
Maximum PAR decreases by 30%
Overall usage increases 130%

What’s More: “Flashy” Whitespace
Wait for less congested (and lower priced) 3me

Paradigm Shift
Stop (just) counting bytes and start living with QoE Recognize and leverage heterogeneity of apps and networks
Win – Win – Win Consumers: more choices and lower $/GB Carriers: lower cost and higher revenue Content/App providers: more engaged eyeballs
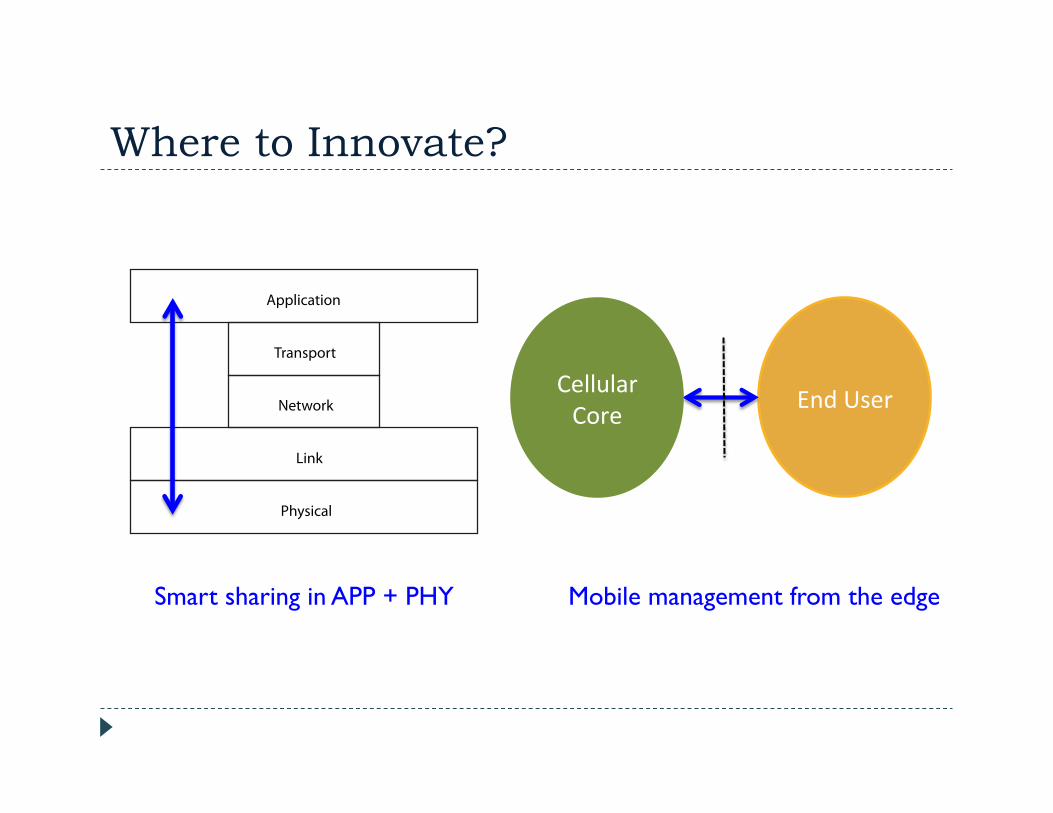
Where to Innovate?
Application
Transport
Network
Link
Physical
End User Cellular Core
Mobile management from the edge Smart sharing in APP + PHY

By the Users, Of the Users, For the Users
DataWiz App

Thank you
chiangm @ princeton.edu
http://scenic.princeton.edu

© Cable Television Laboratories, Inc. 2013. All Rights Reserved.
© Cable Television Laboratories, Inc. 2013. All Rights Reserved.
Cable Technology
Overview -
FCC Technology
Transitions Policy
Task Force Workshop Ralph W. Brown, CTO March 18, 2013
© Cable Television Laboratories, Inc. 2013. All Rights Reserved.
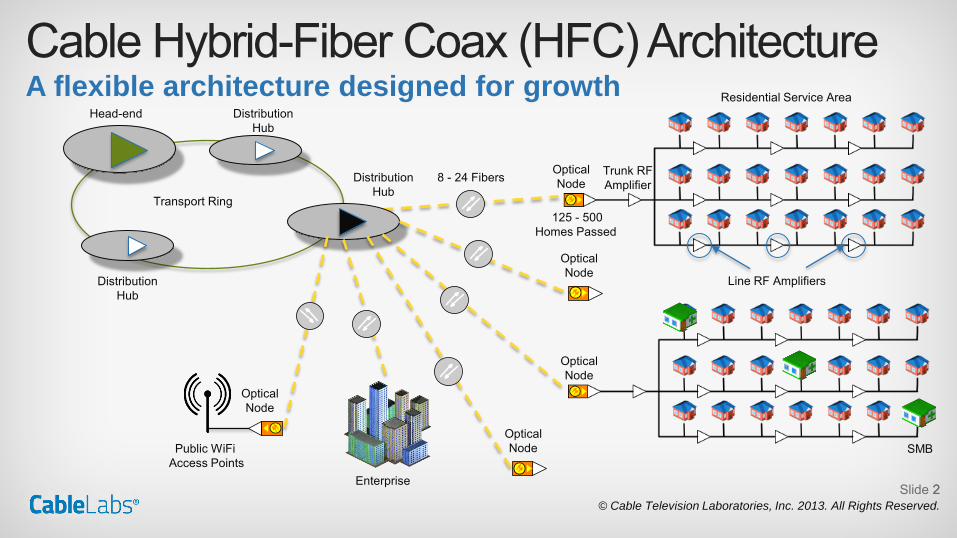
Cable Hybrid-Fiber Coax (HFC) Architecture A flexible architecture designed for growth
2
Line RF Amplifiers
Trunk RF Amplifier
Optical Node
Transport Ring
Head-end Distribution Hub
Distribution Hub
Distribution Hub
8 - 24 Fibers
Optical Node
Optical Node
Enterprise
SMB
Residential Service Area
Optical Node Public WiFi
Access Points
Optical Node
125 - 500 Homes Passed
Slide 2

© Cable Television Laboratories, Inc. 2013. All Rights Reserved.
Cable Hybrid-Fiber Coax (HFC) Architecture
• HFC enables evolution from analog linear TV services only to: • Analog and digital linear TV services (both SD and HD) • Switched digital TV services (e.g. VoD and SDV) • Broadband Internet access services • VoIP telephony services • Home security services • Managed IP cable services
• Cable operators have also deployed over 120,000 public WiFi access points
• Cable operators also provide services to small, medium and large businesses
A flexible architecture designed for growth
Slide 3

© Cable Television Laboratories, Inc. 2013. All Rights Reserved.
Diversity of Cable Systems
• Key HFC characteristics impacting network capacity that vary: – Cable system spectrum typically is 750 or 860 MHz, but may
vary from as low as 450 MHz to as much as 1 GHz – Typical node segment size is less than 500 HHP, but may be as
high as 1,000 HHP – Number of amplifiers in cascade from zero to 5 or 6
• Each cable operator must assess how to optimize the deployed HFC network (segment nodes, upgrade network to expand frequency limits, reduce or eliminate analog channels, etc.)
Not all cable systems are the same
Slide 4
© Cable Television Laboratories, Inc. 2013. All Rights Reserved.
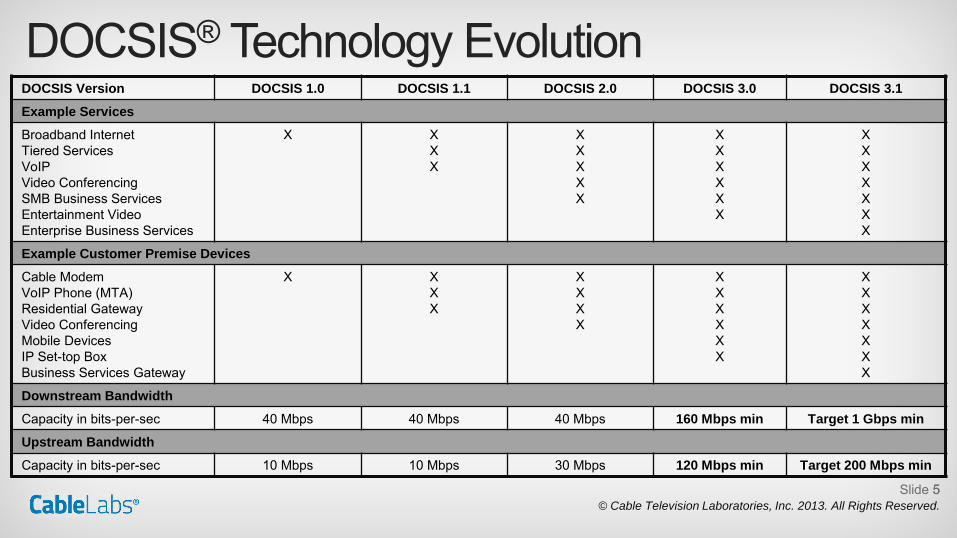
DOCSIS® Technology Evolution
5
DOCSIS Version DOCSIS 1.0 DOCSIS 1.1 DOCSIS 2.0 DOCSIS 3.0 DOCSIS 3.1
Example Services
Broadband Internet Tiered Services VoIP Video Conferencing SMB Business Services Entertainment Video Enterprise Business Services
X X X X
X X X X X
X X X X X X
X X X X X X X
Example Customer Premise Devices
Cable Modem VoIP Phone (MTA) Residential Gateway Video Conferencing Mobile Devices IP Set-top Box Business Services Gateway
X X X X
X X X X
X X X X X X
X X X X X X X
Downstream Bandwidth
Capacity in bits-per-sec 40 Mbps 40 Mbps 40 Mbps 160 Mbps min Target 1 Gbps min
Upstream Bandwidth
Capacity in bits-per-sec 10 Mbps 10 Mbps 30 Mbps 120 Mbps min Target 200 Mbps min
Slide 5

© Cable Television Laboratories, Inc. 2013. All Rights Reserved.
DOCSIS 3.1 Technology
• What’s new in DOCSIS 3.1? – More efficient modulation and FEC (OFDM, OFDMA, LDPC) – Enables new downstream and upstream spectrum allocations – Extensive re-use of DOCSIS 3.0 concepts – Energy efficient operation through traffic-load based duty cycle
• Backward compatibility with earlier versions – DOCSIS 3.1 cable modems can be upgraded before head-end
and can coexist with older versions (1.1, 2.0, and 3.0) • DOCSIS 3.1 specifications to be issued later this year
Cable continues to invest
Slide 6

© Cable Television Laboratories, Inc. 2013. All Rights Reserved.
Summary
• Cable is investing in delivering the best broadband experience possible
• DOCSIS 3.1 is the latest in the series that has evolved to meet anticipated future demand and facilitate new applications – It can cost-effectively scale to multi-gigabit speeds – It can work in and further optimize existing HFC plant – It defines options for new spectrum usage – It uses the latest modulation and FEC technologies
Evolving Cable Technology
Slide 7

© 2011 Levine, Blaszak, Block & Boothby, LLP. All rights reserved.
Andrew M. Brown
Usage and Adoption:
What do Enterprise
Customers Actually Buy?
Technology Transitions Policy Task Force Workshop
Washington, DC March 18, 2013

The Services that Large Enterprise
Customers Buy Today
Data Services • MPLS is the standard for interstate and int’l networks
Class of Service (esp. critical for voice carried on the data network)
• Access (DS1/DS3 and higher; Data Rings/SONET; Ethernet; ISDN PRI)
• “Best Efforts” Internet access
Voice • Local, LD, International minutes
• Toll Free and associated features
• Migrating toward convergence: SIP Trunking is how enterprises buy Interconnected VoIP
Wireless
Dark Fiber and DWDM
Managed Services
Hosted Services
Cloud Computing, Applications and Application Development
Unified Communications/Fixed Mobile Convergence
2 © 2011 Levine, Blaszak, Block & Boothby, LLP. All rights reserved.
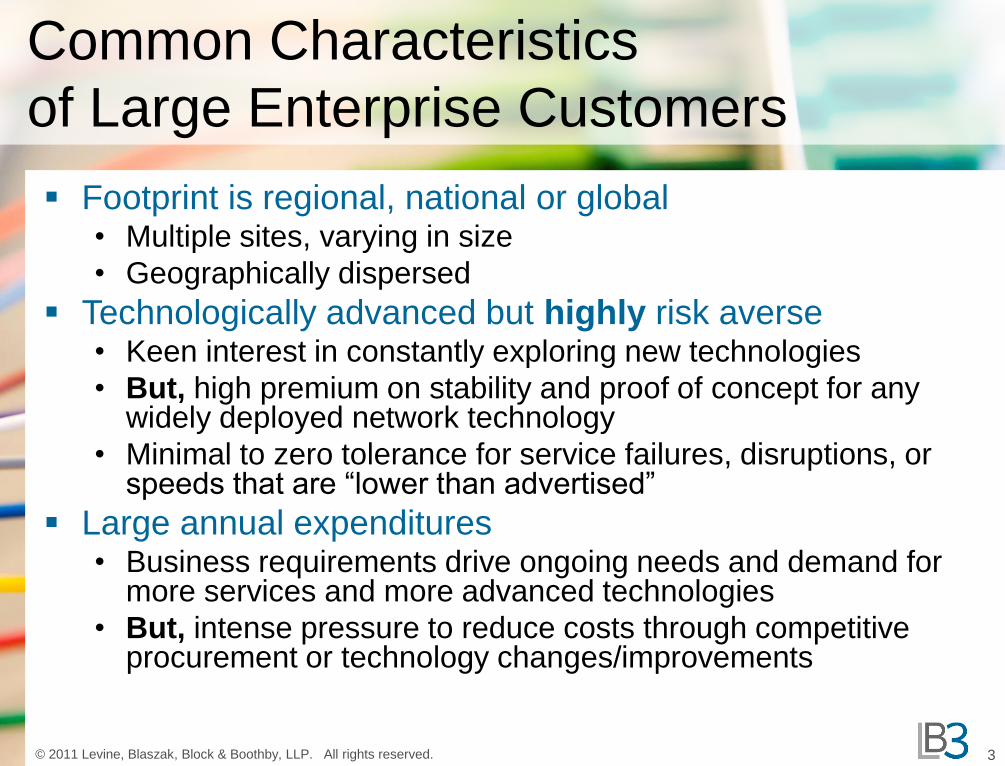
Common Characteristics
of Large Enterprise Customers
Footprint is regional, national or global • Multiple sites, varying in size
• Geographically dispersed
Technologically advanced but highly risk averse • Keen interest in constantly exploring new technologies
• But, high premium on stability and proof of concept for any widely deployed network technology
• Minimal to zero tolerance for service failures, disruptions, or speeds that are “lower than advertised”
Large annual expenditures • Business requirements drive ongoing needs and demand for
more services and more advanced technologies
• But, intense pressure to reduce costs through competitive procurement or technology changes/improvements
3 © 2011 Levine, Blaszak, Block & Boothby, LLP. All rights reserved.

Beyond Products and Technology
Businesses buy more than products or
technologies
• Account support/sales teams
• Support for complex billing
• Service Level Agreements/minimum service
requirements
• New technology usually requires new internal
support model
4 © 2011 Levine, Blaszak, Block & Boothby, LLP. All rights reserved. www.lb3law.com

Trends that don’t apply to the
Enterprise Market
“Cutting the Cord”
Intermodal competition/substitution due to
issues of:
• Availability
• Reliability
• Scalability
• Complexity
5 © 2011 Levine, Blaszak, Block & Boothby, LLP. All rights reserved. www.lb3law.com

Trends that do apply to the Enterprise
Market
Convergence of voice/data
Network based services and apps
Growth of wireless
And, possibly, “consumerization” of services
and pricing
6 © 2011 Levine, Blaszak, Block & Boothby, LLP. All rights reserved. www.lb3law.com

Christopher Baker
AARP Public Policy Institute
March 18, 2013
Telecommunications
Services and Older
Adults
Presentation to the FCC Technology Transitions Task Force

Wireline only households by age (2011 CDC-NHIS)
2.6%
4.9%
9.9%
17.6%
37.4%
0% 10% 20% 30% 40% 50%
<30
30-49
50-64
65-74
75+

Households with wireline and wireless by age (2011 CDC-NHIS)
22.8%
51.6%
65.6%
68.8%
55.9%
0% 20% 40% 60% 80%
<30
30-49
50-64
65-74
75+

Households with wireline by age (2011 CDC-NHIS)
25.5%
56.5%
75.5%
86.4%
93.2%
0% 20% 40% 60% 80% 100%
<30
30-49
50-64
65-74
75+
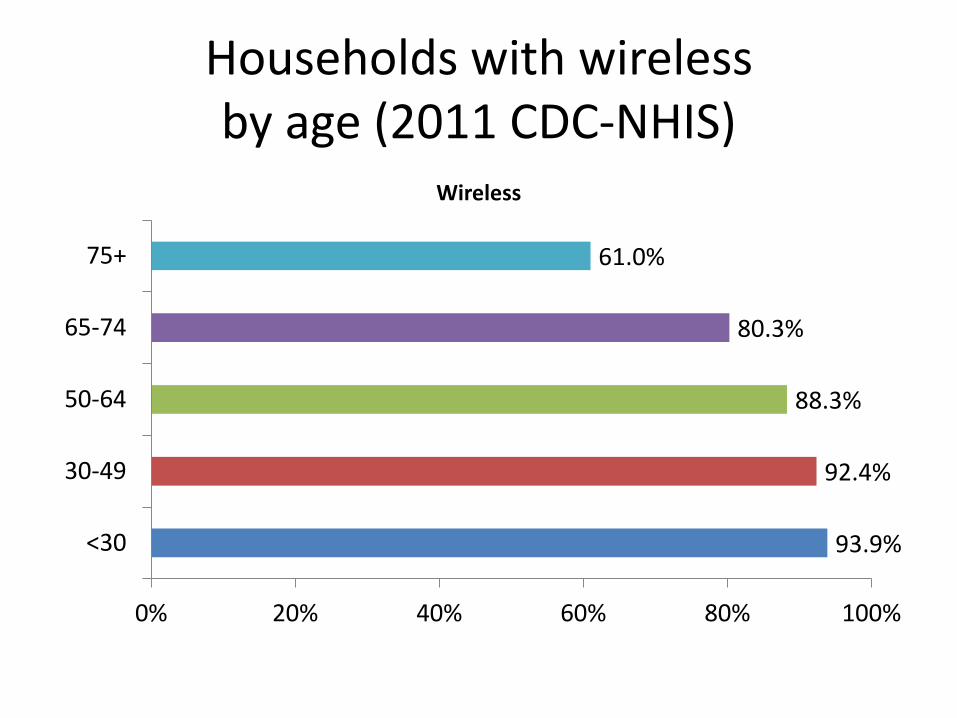
Households with wireless by age (2011 CDC-NHIS)
93.9%
92.4%
88.3%
80.3%
61.0%
0% 20% 40% 60% 80% 100%
<30
30-49
50-64
65-74
75+
Wireless

Percentage change in telephone expenditures by age (2006-2011)
7.6% 8.0% 9.7%
18.4%
14.3%
19.2% 17.2%
0%
5%
10%
15%
20%
25%
Under 25years
25-34years
35-44years
45-54years
55-64years
65-74years
75 yearsand older
Bureau of Labor Statistics, Consumer Expenditure Survey, 2006-2011.

Continuing value of wireline voice services
Mobile phone problems (2012 Pew Internet survey)
• Cell owners experience dropped calls:
– 72% say at least occasionally
– 32% say at least a few times a week or more frequently than that.
• 77% of cell internet users say they experience slow download speeds.
– 46% of these users face slow speeds weekly or more frequently.
Reliable, high-quality voice service inside the home
Unmetered local calling

High-speed Internet at home, by age
19%
39%
50%
62%
69%
77%
0%
20%
40%
60%
80%
100%
2008 2012
65+ 50-64 30-49
Source: Pew Internet & American Life Project Surveys, April 2008 and April 2012.

Quality matters
Satisfaction with performance and reliability (on a 1,000-point scale):
• DSL customers: 650
• cable modem customers: 672
• fiber-to-the-home: 725 – JD Power 2012 U.S. Residential Internet Service Provider Satisfaction Study

Universally available, affordable and reliable
communications services are as essential as ever for older adults.
Aging in place Older adults overwhelmingly state that it is very important to have services available that allow them to age in place in their own homes for as long as possible (AARP). Caregiver support One in four older workers (age 45-64) are family caregivers. And the role of family caregivers has dramatically expanded to include performing medical/nursing tasks of the kind and complexity once provided only in hospitals (AARP). Health preservation and monitoring Falls are the leading cause of injury death for older Americans. One-third of Americans aged 65+ falls each year. (Center for Disease Control) Greater opportunities to participate in society Increasing opportunities online for paid work, continuing education, and volunteering

Growing share of Americans age 65+
(US Census Bureau)
• 1960 – One in 11 Americans
• 2010 – One in eight Americans
• 2030 – One in five Americans

Communications Technology Use in Communities of Color
A Presentation to the FCC Technology Transitions Task Force
Jessica J. González, Esq.
National Hispanic Media Coalition
March 18, 2013

- Pew Hispanic Center - Pew Internet - FCC Reports - NTIA Reports - U.S. Census - Asian American Justice Center - Center for Rural Strategies - Joint Center for Political & Economic Studies -T. Morris & S. Meinrath, New Media Study - Free Press Analysis of US National Health Interview Data - News media - Constituents
Data Sources

•308.7 million total people in the U.S. as of 2010 •Over 1/3 are people of color:
•16.3% Latino/Hispanic •12.6% Black or African American •4.8% Asian American •.9% American Indian or Alaskan Native
•Rural areas are declining in their proportions of non-Latino whites, and are increasingly Latino, Asian American, African American and Native American
Basic Stats About People of Color
3

The Digital Divide Lives
•While not reflected here, significant disparities can exist among the sub-groups that make up a racial or ethnic category. FCC and NTIA data are gathered from English-only respondents. •Chart comes from NTIA’s Digital Nation, 2011. Note that there are disparities between the way the FCC and NTIA count broadband adoption and how other researchers have counted it.

Data Can Be Misleading • Some data sets are gathered in English only, some in Spanish too, and none
are collected outside of those two languages. • Many data sets do not provide racial and ethnic breakdowns; others that do
often leave out Native Americans and Asian Americans. • There is not much available data on landline phone use by people of color. • We need to exercise caution when using this data to identify and analyze
trends, otherwise the most vulnerable portions of communities of color may be overlooked.

Trends of the Unconnected
Chart comes from NTIA’s Digital Nation, 2011.

U.S. Territories – Home Broadband Starved
• 4.1 million people live in U.S. territories – nearly 4 million of them are in Puerto Rico alone
• 54% do not have broadband access at threshold speeds as defined by the FCC
• 85.2% people in rural parts of U.S. territories are without access
• % of people without broadband access: 78.6 in America Samoa; 100 in Northern Mariana Islands; 54.3 in Guam; 51.6% in Puerto Rico; 100 in U.S. Virgin Islands
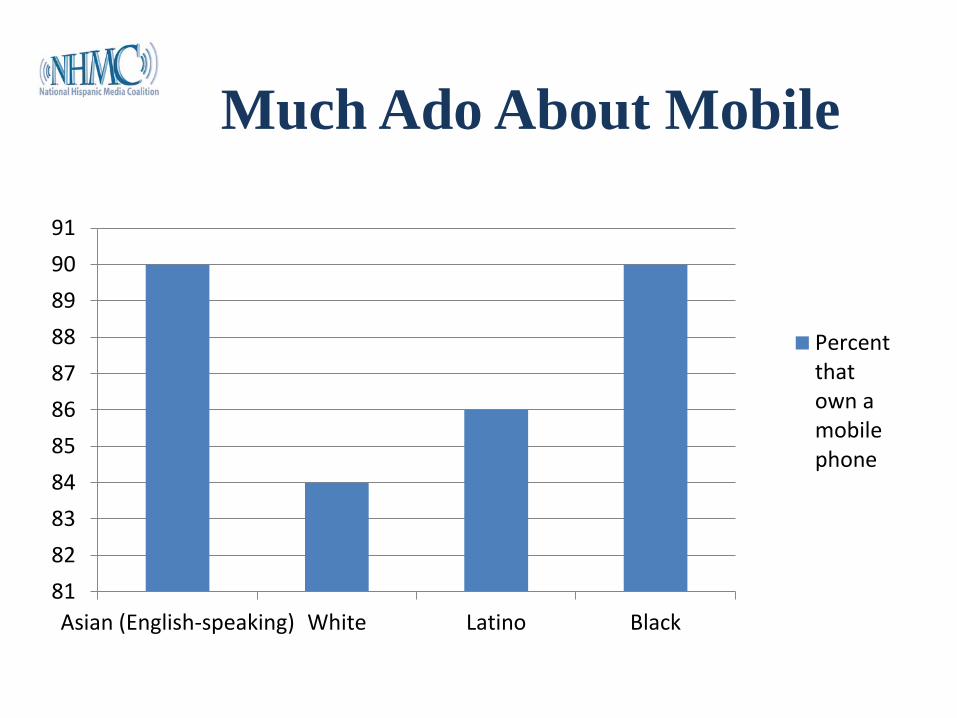
Much Ado About Mobile
8182838485868788899091
Asian (English-speaking) White Latino Black
Percentthatown amobilephone

Much Ado About Mobile • About 34% of U.S. people do not have landlines and are in “cell-phone only”
households. – 47% of Latinos – 38% of African Americans – 30% of whites
• At the same time, low income families (to which many people of color belong) are also more likely to rely on fixed line voice services or dial up internet access. • Many people of color in rural areas rely on landline phones only because they do not have access to wireless services.
• 14.5 million households in rural areas lack broadband access • Landline users in rural areas are starting to experience problems with call completion to
wireless and VOIP connections. • Today in 2013, some people of color in rural areas still do not even have access to landline telephone service.

Much Ado About Mobile
01020304050607080
Percent that own a Smart phone
Own aSmartphone
Much Ado About Mobile
0
10
20
30
40
50
60
70
80
White Latino Black
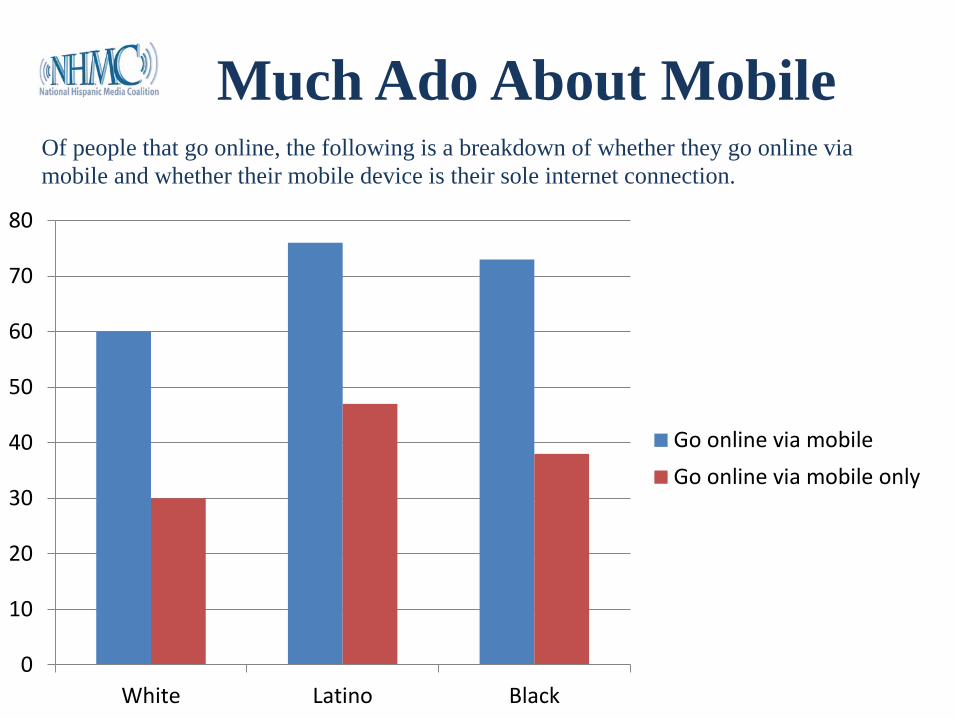
Go online via mobileGo online via mobile only
Of people that go online, the following is a breakdown of whether they go online via mobile and whether their mobile device is their sole internet connection.

Mobile As Only Internet Onramp
0
5
10
15
20
White Latino (English-speaking) Black
Mobile only internet users are more likely to be poor and more likely to be black or Latino.

Mobile Is Not A Substitute for Home Broadband Connections
• Insufficient for: – Homework needs – Registering for classes or government services – Applying for jobs, financial aid, etc. – Online shopping and selling – Developing computer literacy skills – Civic engagement
• Obstacles include: data caps; mobile devices often do not have easy access to the entire internet (only about ¼ of US companies have enabled easy access); slower speeds; not universally available, especially in rural areas; cost • Notably, mobile is arguably not a good substitute for landline telephones either based on mobile outages following recent devastating storms in the mid-Atlantic and Northeast.
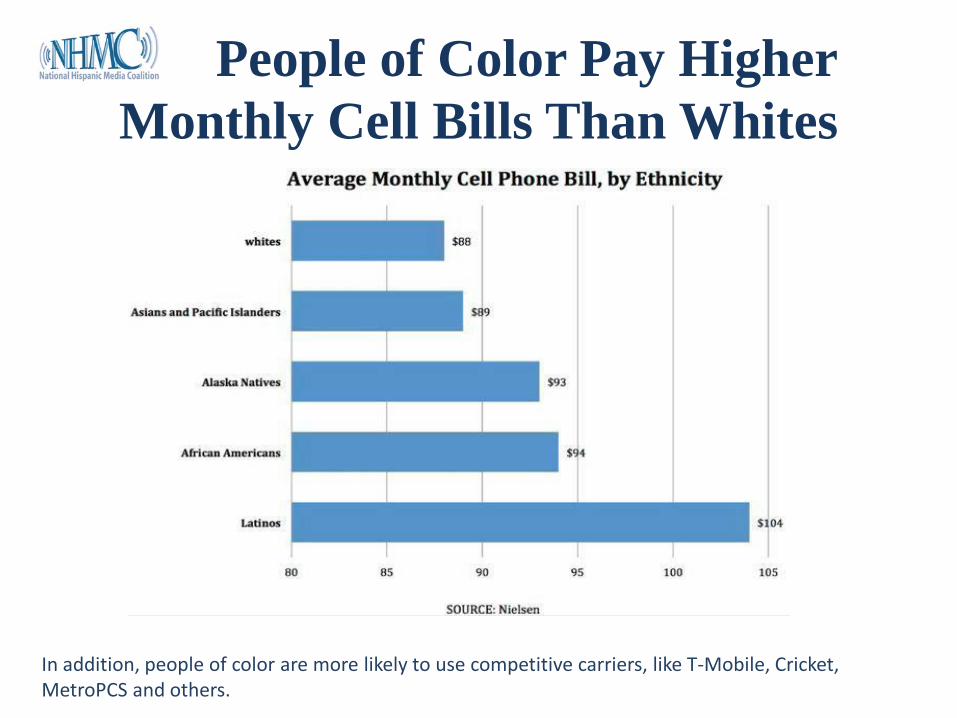
People of Color Pay Higher Monthly Cell Bills Than Whites
In addition, people of color are more likely to use competitive carriers, like T-Mobile, Cricket, MetroPCS and others.

Trends of the Unconnected
In looking across various data sets pertaining to various technologies, there are certain traits that the least connected people of color often share: - Poor - Born outside the U.S. - Older - Non-English dominant - Rural resident - Less education -Tribal resident - U.S. territory resident - Disabled


The Technologies Americans
Use to Communicate
John B. Horrigan, PhD
Joint Center for Political & Economic Studies
March 2013
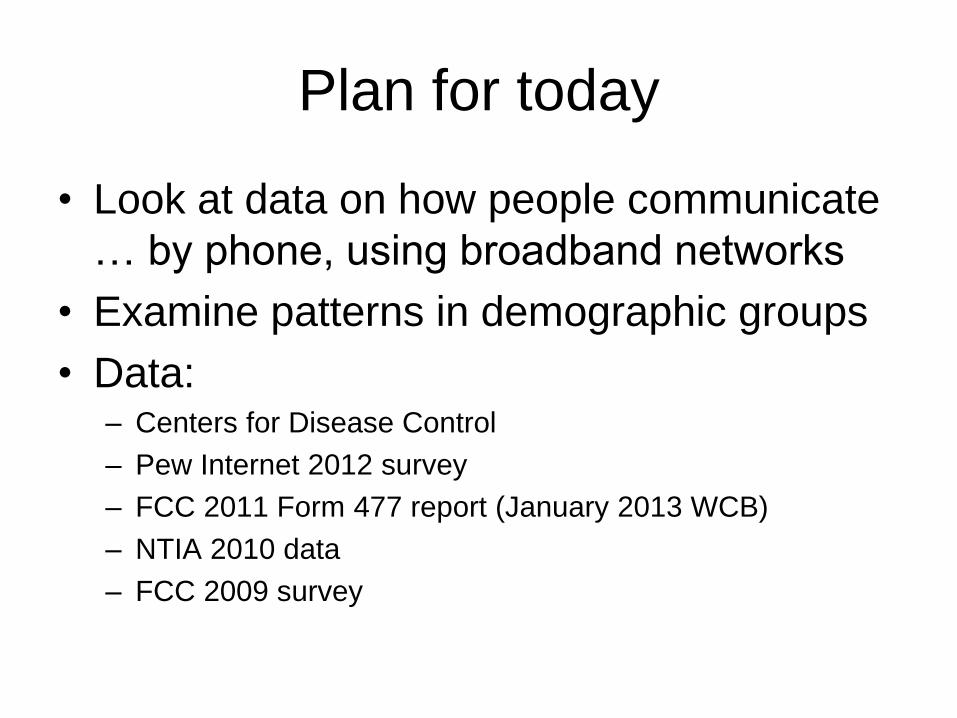
Plan for today
• Look at data on how people communicate
… by phone, using broadband networks
• Examine patterns in demographic groups
• Data: – Centers for Disease Control
– Pew Internet 2012 survey
– FCC 2011 Form 477 report (January 2013 WCB)
– NTIA 2010 data
– FCC 2009 survey

High level overview of tech usage trends I (business & residential)
• Mobile subscriptions:
– 261m in 2008 298m in 2011
• Interconnected VoIP
– 21.7m in 2008 36.7m in 2011
• Retail switched access lines:
– 141m in 2008 107m in 2011

High level overview of tech usage trends II (among individuals)
Cell Phone Internet Use Broadband
at home
Smartphone
1998 37% 36% n/a n/a
2000 53 50 3 n/a
2003 65 61 16 n/a
2006 73 70 42 n/a
2009 82 74 63 17
2012 88 81 66 45

Wireline at home (End-user switched access & VoIP, residential, FCC 2011)
• 83m lines in 2011 vs 97.8m in 2008
– 37.2% VoIP in 2011 vs 20.1% in 2008
• 86% of residential VoIP is non-ILEC in 2011
End User Switched
Access Lines
(in millions)
VoIP Subscriptions
(in millions)
Dec 2008 78.2 19.7
June 2009 73.1 20.3
Dec 2009 68.6 22.8
June 2010 64.5 25.0
Dec 2010 60.0 27.0
June 2011 56.0 28.6
Dec 2011 52.1 30.9

Trends in “Cell Only” Households
(Centers for Disease Control data)

How Americans make phone calls (CDC Jan 2012 data for households)
• 52.5% have landline and wireless
– 58.5% in 2008
• 9.4% have landline only
– 20.6% in 2008
• 35.8% are cell phone only
– 17.5% in 2008
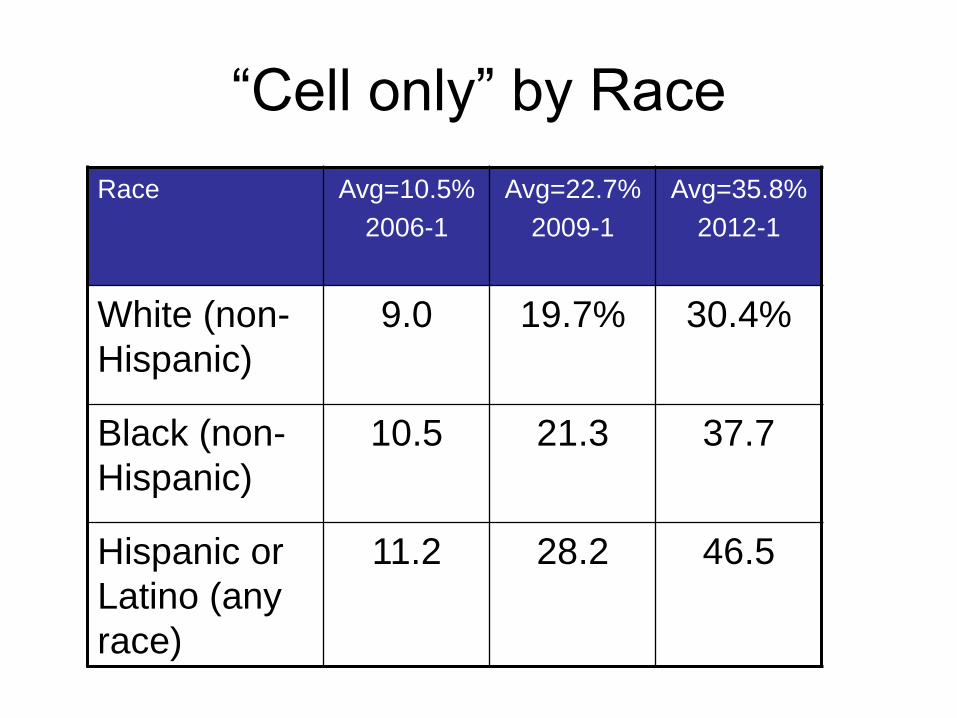
“Cell only” by Race
Race Avg=10.5%
2006-1
Avg=22.7%
2009-1
Avg=35.8%
2012-1
White (non-
Hispanic)
9.0 19.7% 30.4%
Black (non-
Hispanic)
10.5 21.3 37.7
Hispanic or
Latino (any
race)
11.2 28.2 46.5

“Cell only” by Age
Age Avg=10.5%
2006-1
Avg=22.7%
2009-1
Avg=35.8%
2012-1
18-24 years 22.6% 37.6% 49.5%
25-29 years 22.3 45.8 60.1
30-34 years 12.1 33.5 55.1
35-44 years 8.2 21.5 39.1
45-64 years 5.3 12.8 25.8
65 and over 1.3 5.4 10.5
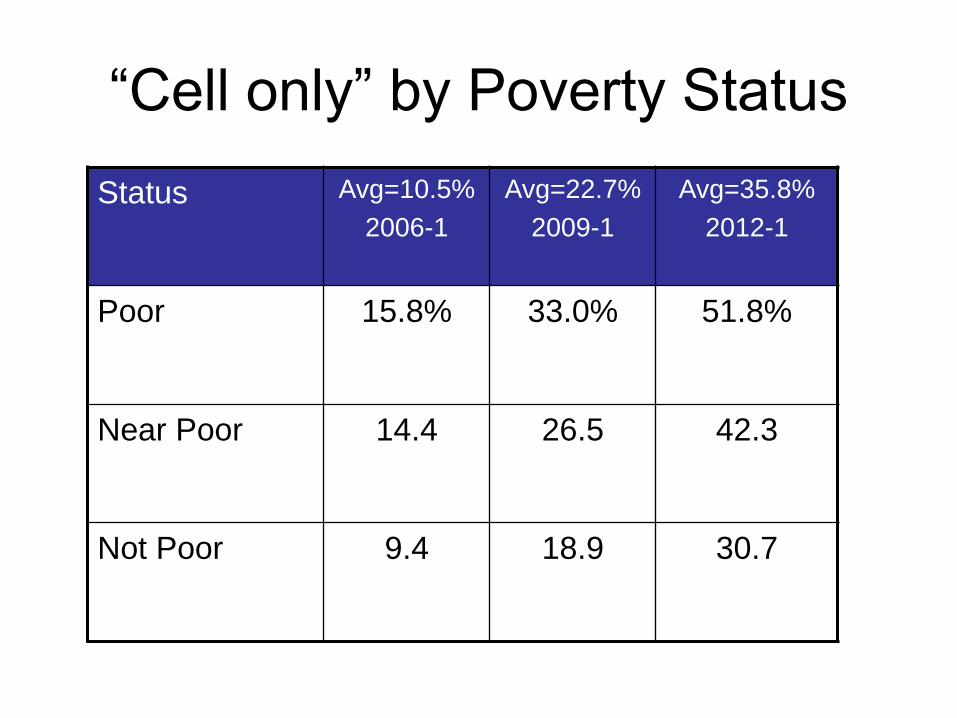
“Cell only” by Poverty Status
Status Avg=10.5%
2006-1
Avg=22.7%
2009-1
Avg=35.8%
2012-1
Poor 15.8% 33.0% 51.8%
Near Poor 14.4 26.5 42.3
Not Poor 9.4 18.9 30.7

Broadband Adoption Overview (NTIA 2010 Data)
• 68% of homes have broadband
• Connection types (% of all households): – 32% cable modem
– 23% DSL
– 9% Internet use outside the home
– 6% mobile broadband only or with other internet services
– 3% fiber optics
– 3% dial-up
– 2% satellite
– 2% other broadband
– 20% non-Internet users

Broadband: Urban v. Rural (NTIA 2010 Data)
• 70.3% urban households with broadband
• 60.2% of rural households with broadband
Urban
Connection Type
Rural
Connection Type
Cable modem 35% 19%
DSL 23 27
Outside the home 9 11
Mobile only 7 6
Satellite 1 3
Other 2 1
Dial-up 2 5
Non-Internet HH 18 28

Overview: Device & Service Use I (All Adults – Pew 2012 data)
88%
65%
46%
14% 14%
0%
20%
40%
60%
80%
100%
2012
Cell Phone
Broadband
Smartphone
E-Reader
Tablet
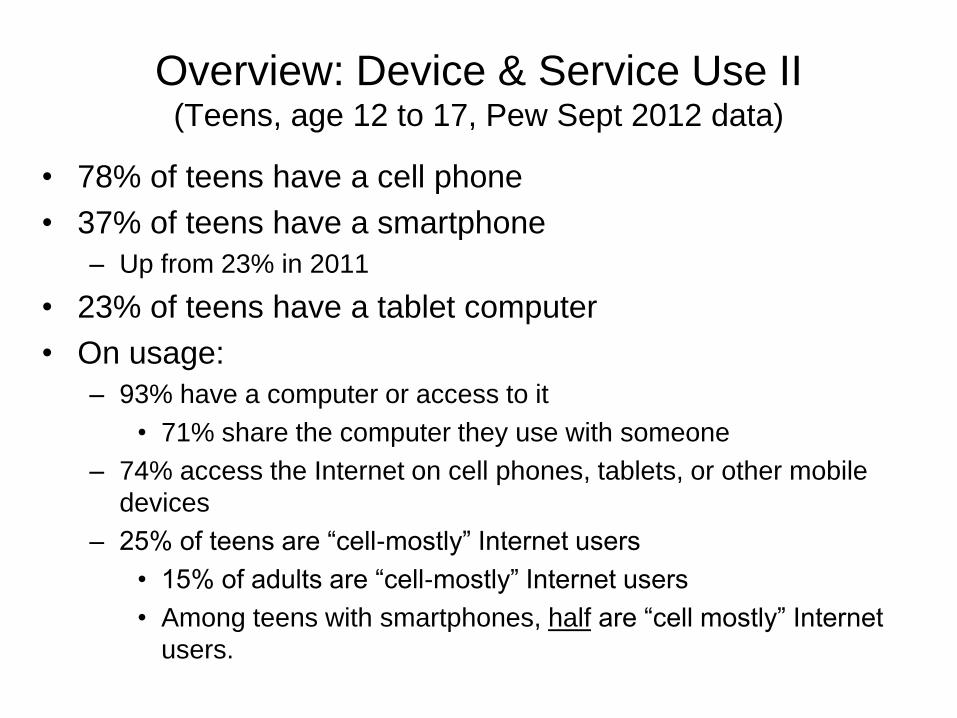
Overview: Device & Service Use II (Teens, age 12 to 17, Pew Sept 2012 data)
• 78% of teens have a cell phone
• 37% of teens have a smartphone
– Up from 23% in 2011
• 23% of teens have a tablet computer
• On usage:
– 93% have a computer or access to it
• 71% share the computer they use with someone
– 74% access the Internet on cell phones, tablets, or other mobile
devices
– 25% of teens are “cell-mostly” Internet users
• 15% of adults are “cell-mostly” Internet users
• Among teens with smartphones, half are “cell mostly” Internet
users.

Rural: Services
80%
87% 89%
53%
70%65%
34%
46%
50%
0%
20%
40%
60%
80%
100%
Cell phone Broadband Smartphone
Rural
Suburban
Urban

Rural: Devices
12%
14%15%
12%
16%14%
0%
2%
4%
6%
8%
10%
12%
14%
16%
18%
20%
E-reader Tablet
Rural
Suburban
Urban

Age: Services
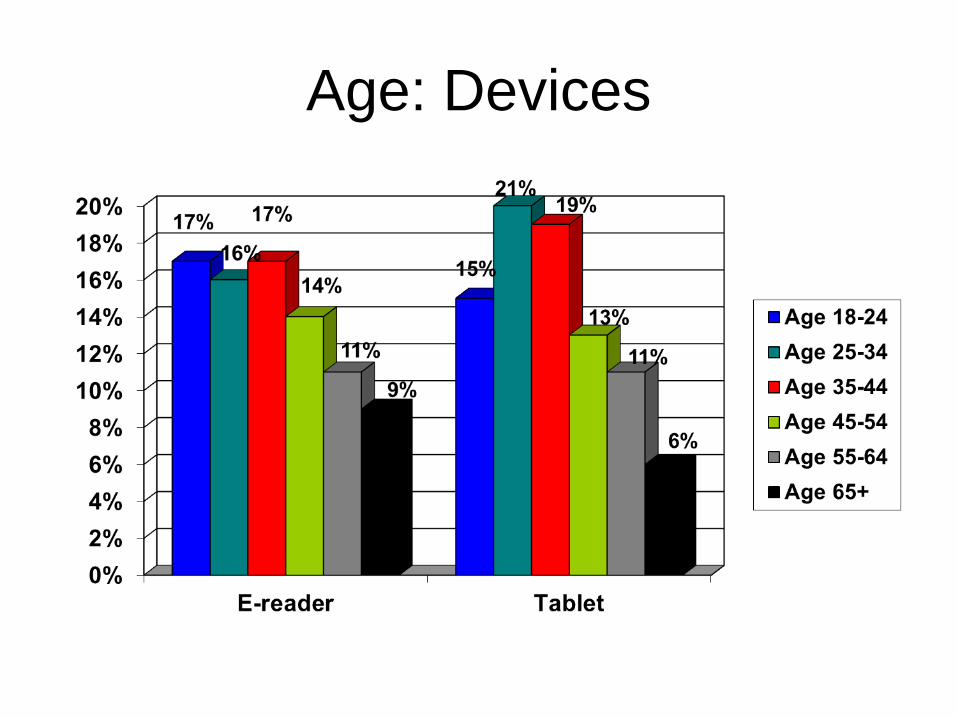
Age: Devices

By Race: Services
87%88% 88%
69%
57%
45% 45%49% 49%
0%
20%
40%
60%
80%
100%
Cell phone Broadband Smartphone
Whites
Blacks
Hispanics

By Race: Devices
15%
9%
11%
14%
15%
13%
0%
2%
4%
6%
8%
10%
12%
14%
16%
18%
20%
E-reader Tablet
Whites
Blacks
Hispanics

People with Disabilities (2009 FCC Survey)
74%
42%
18%
86%
65%
30%
0%
20%
40%
60%
80%
100%
People with Disability All
Cell Phone
Broadband
Smartphone

Broadband at home by Disability Status
(NTIA 2010)
• 37.5% of all people with disabilities have
broadband at home
Type of Disability % using broadband
at home
Difficulty dressing/bathing 27.9%
Deaf/difficulty hearing 36.5
Blind/difficulty seeing 30.7
Difficulty doing errands 27.8
Difficulty walking or climbing
stairs
33.7
Difficulty
concentrating/remembering
35.3

What about the relationship between
Smartphones & Broadband? (Pew Feb 2012 data)
• For those with broadband at home: – 83% have a Smartphone
– 19% have an e-reader
– 21% have a tablet
• For those without broadband at home: – 8% have a Smartphone
– 4% have an e-reader
– 2% have a tablet
• For blacks without broadband at home: – 13% have a Smartphone
• For Hispanics without broadband at home: – 19% have a Smartphone
• For seniors without broadband at home: – 4% have a Smartphone
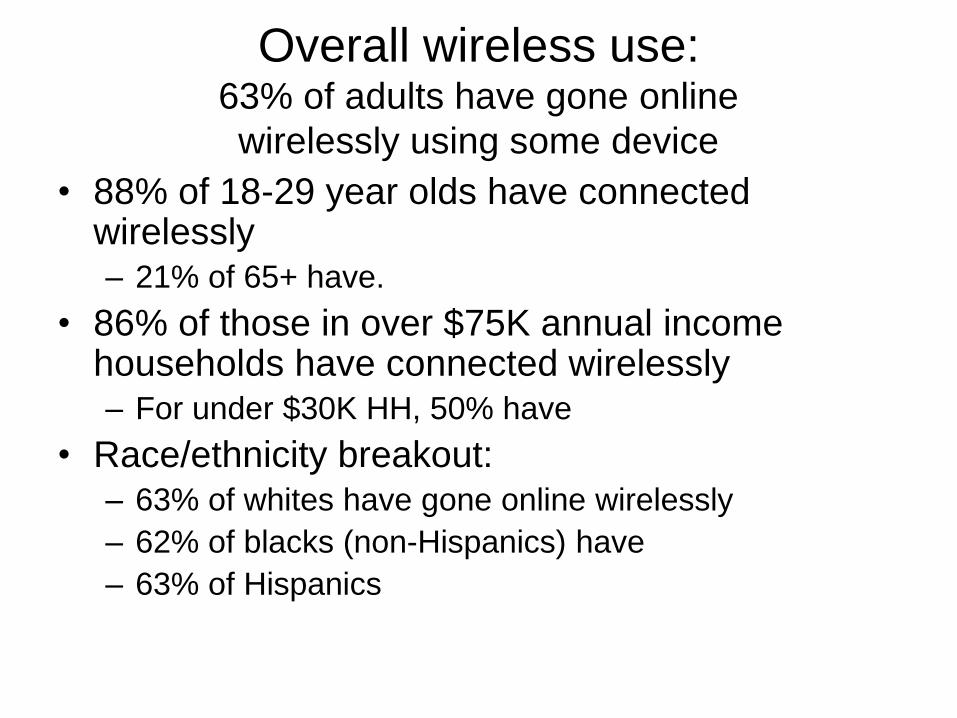
Overall wireless use: 63% of adults have gone online
wirelessly using some device
• 88% of 18-29 year olds have connected wirelessly – 21% of 65+ have.
• 86% of those in over $75K annual income households have connected wirelessly – For under $30K HH, 50% have
• Race/ethnicity breakout: – 63% of whites have gone online wirelessly
– 62% of blacks (non-Hispanics) have
– 63% of Hispanics
Rural Broadband Internet Subscriptions
Peter Stenberg
Economic Research Service
Presented at the Federal Communication Commission Technology Transitions Workshop,
March 18, 2013.
The views expressed are those of the author and do not necessarily reflect the views of the Economic
Research Service or the U.S. Department of Agriculture

Introduction
• Internet has become widely, but not universally,
available
• Not all, voluntarily or involuntarily, choose to use

Internet subscriptions, including broadband, increased
dramatically
36%
64%
73%
23%
47%
62%
5%
54%
70%
2%
36%
57%
0%
10%
20%
30%
40%
50%
60%
70%
80%
90%
100%
2000 2001 2002 2003 2004 2005 2006 2007 2008 2009 2010
Pe
rce
nt
of
all h
ou
seh
old
s
Year
Fig. 1 Households with Internet Subscriptions, 2000-2010
Urban HH with Internet access
Rural HH with Internet access
Urban HH with broadband access
Rural HH with broadband access
HH means households.
Source: ERS using Census data.

Broadband subscription rates across the country vary
greatly across the country
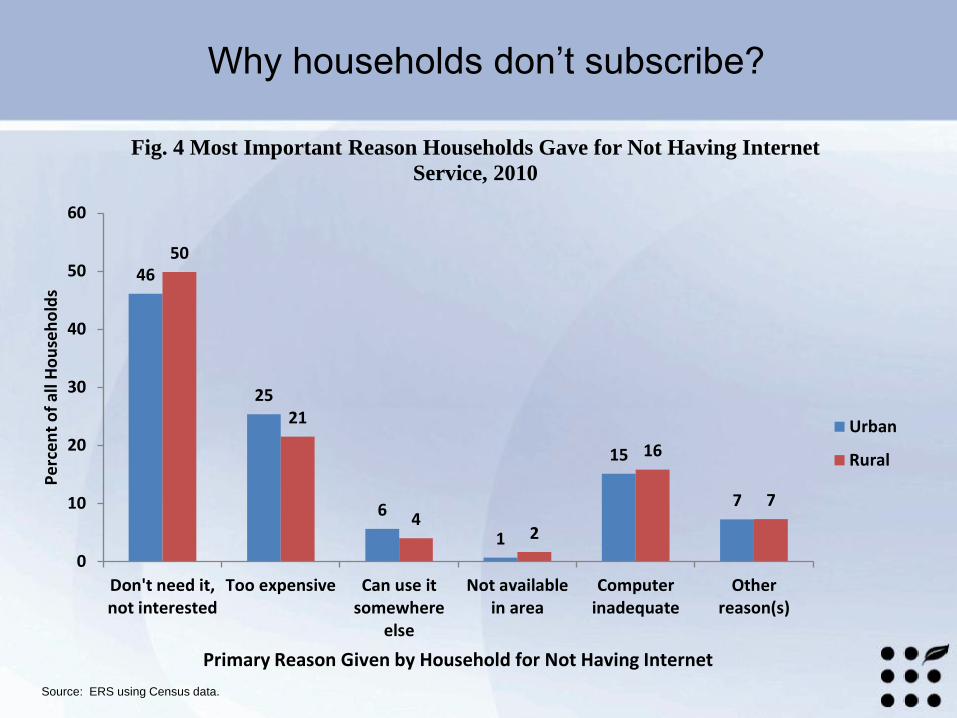
Why households don’t subscribe?
Source: ERS using Census data.
46
25
6
1
15
7
50
21
42
16
7
0
10
20
30
40
50
60
Don't need it,not interested
Too expensive Can use itsomewhere
else
Not availablein area
Computerinadequate
Otherreason(s)
Pe
rce
nt
of
all H
ou
seh
old
s
Primary Reason Given by Household for Not Having Internet
Fig. 4 Most Important Reason Households Gave for Not Having Internet
Service, 2010
Urban
Rural

Rural and urban households similar across
income levels
4345
5156
60
6771
7982
8790
94 95
32
39
4447
5560
71
77 7883
8790 90
20
30
40
50
60
70
80
90
100
Pe
rce
nt
of
All
Ho
use
ho
lds
Household Income (dollars)
Figure 5: Rural and Urban Housesholds with In-home Internet Access Using any Technology, by Income, 2010
Urban
Rural
Source: ERS using Bureau of the Census CPS.
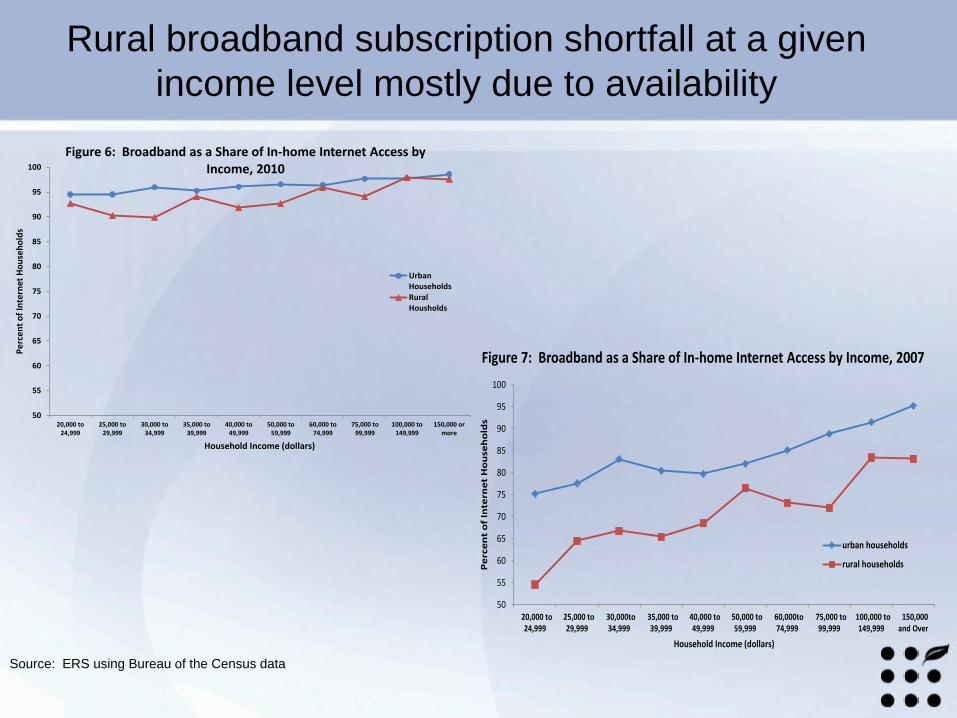
Rural broadband subscription shortfall at a given
income level mostly due to availability
Source: ERS using Bureau of the Census data
50
55
60
65
70
75
80
85
90
95
100
20,000 to24,999
25,000 to29,999
30,000 to34,999
35,000 to39,999
40,000 to49,999
50,000 to59,999
60,000 to74,999
75,000 to99,999
100,000 to149,999
150,000 ormore
Pe
rcen
t o
f In
tern
et H
ou
seh
old
s
Household Income (dollars)
Figure 6: Broadband as a Share of In-home Internet Access by Income, 2010
UrbanHouseholds
RuralHousholds
50
55
60
65
70
75
80
85
90
95
100
20,000 to24,999
25,000 to29,999
30,000to34,999
35,000 to39,999
40,000 to49,999
50,000 to59,999
60,000to74,999
75,000 to99,999
100,000 to149,999
150,000and Over
Pe
rce
nt
of
Inte
rne
t H
ou
seh
old
s
Household Income (dollars)
Figure 7: Broadband as a Share of In-home Internet Access by Income, 2007
urban households
rural households

Summary and further findings
• Rapid broadband rollout, but not universal.
• Sharp differences in subscription rates across the country.
• Credence to the common hypothesis that people do choose to use broadband if given the option.
• The preponderance of DSL service for farms indicates both the mostly rural location of most farms as well as Internet users finding satellite a less desirable option.

Technology Transitions Policy Task Force Workshop John Civiletto
March 18th, 2013

Feature Growth
Product Capabilities
New Verticals
Capabilities Technology Evolution
Lifecycle
Capacity Demand
Consumer Behavior
Shifting Habits
Drivers for Network Architecture
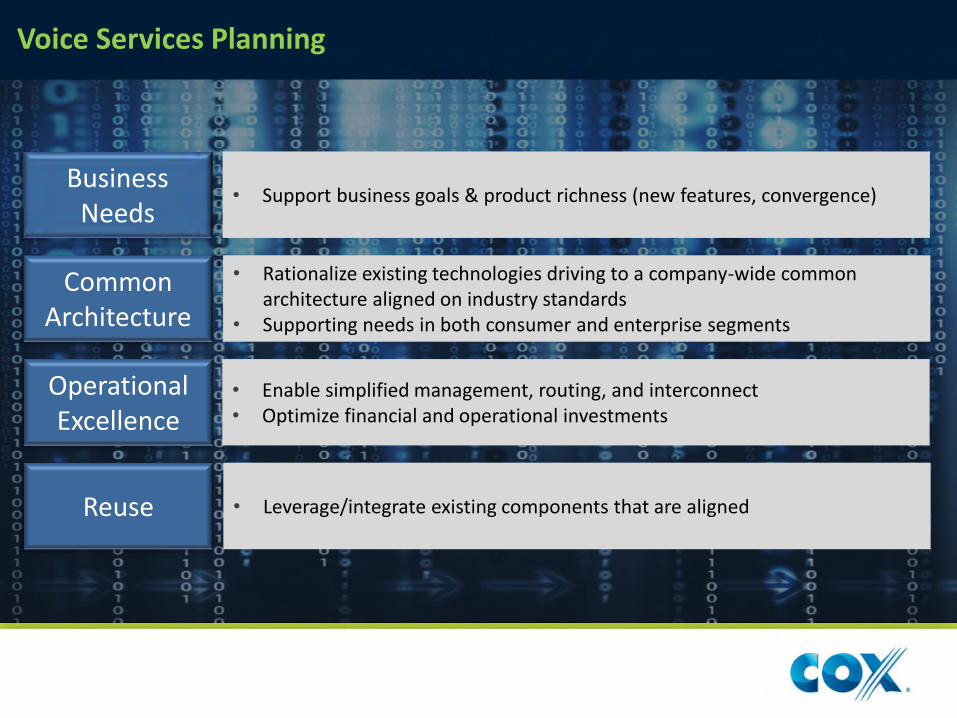
Voice Services Planning
• Rationalize existing technologies driving to a company-wide common architecture aligned on industry standards
• Supporting needs in both consumer and enterprise segments
Common Architecture
• Support business goals & product richness (new features, convergence) Business
Needs
• Enable simplified management, routing, and interconnect • Optimize financial and operational investments
Operational Excellence
• Leverage/integrate existing components that are aligned Reuse

Video Services Planning
• Consistent and compelling user experiences • Highly personalized with search and recommendations • Enable consumer devices with new navigation capabilities
Experience
• Expanding ability to aggregate linear and off-line content sources Content
• In-home and mobile consumption of content • Enabling Consumer Electronics devices over DLNA Premium Video services Portability
• Scalable and agile – built on reusable components • Seamless delivery over legacy or broadband Convergence

Network Technology Planning
• Converged IP infrastructure with focus on enabling very dense high capacity links (100Gb/s launched) in backbone and metro architectures
Transport Growth
• Architecting the network to enable delivery of consumer services from key strategic locations
Centralized Services
• Continued evolution of DOCSIS technologies • Extending existing HFC architecture
Access Technologies
• Transparent connectivity for the widest range of devices • Enhanced tools to help consumers manage quality of experience
In Home Networks

Thank You

1 1
The 1000X mobile capacity challenge
Matt Grob, Chief Technology Officer March 18, 2013

2
Wireless-only is becoming the norm Percentage of American homes with only wireless telephones continues to grow
5%
20%
36%
Jan-Jun 2004 Jan-Jun 2008 Jan-Jun 2012
Source: CDC/NCHS, National Health Interview Survey

3
~2x from 2010–2011*
Mobile data traffic growth
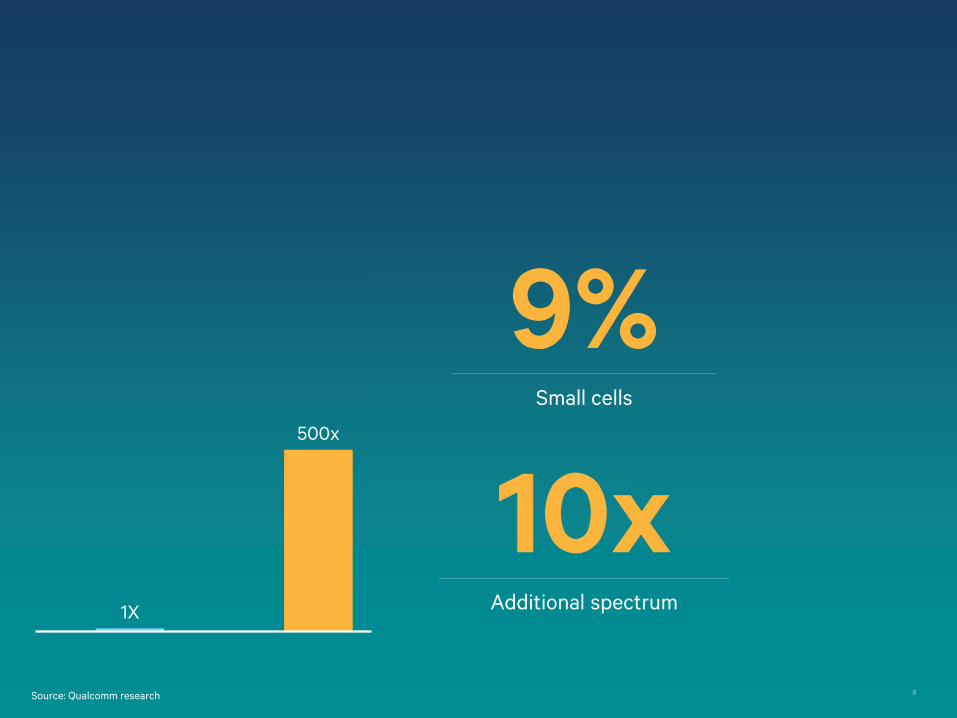
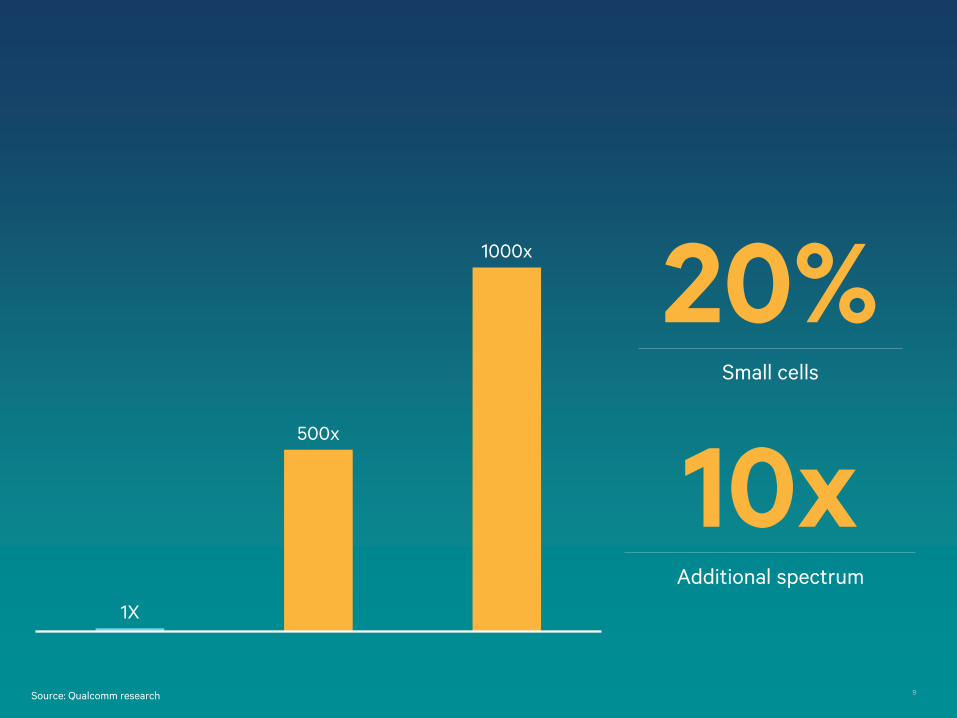
Network efficiency Small cells More spectrum
Source: Cisco, Feb ‘11
Global data traffic growth
1000x data traffic growth
Preparing for

4
Continuous 3G/4G evolution
Extreme densification with small cells
LTE broadcast Device-to-device communications
The future of wireless networks

5
Accessing spectrum resources
Licensed
spectrum
auctions
Authorized
shared
access
Unlicensed
6
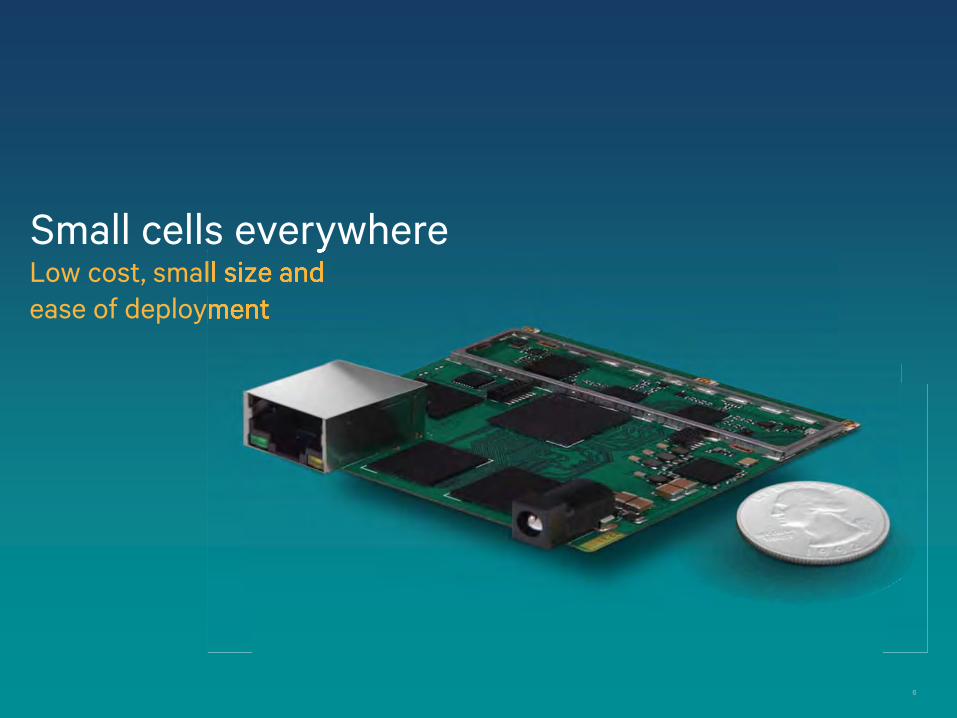
Small cells everywhere Low cost, small size and ease of deployment
Small cells everywhere Low cost, small size and ease of deployment

7
Tests show indoor small cells providing coverage outside
Source: Qualcomm Research; shows actual measured received pilot strength for small cell deployment; -115dBm results in ~700kpbs for Rel-7 5MHz in thermal noise limited case; points with RSCP less than -115dBm is not shown on the plots
Signal strength [dBm]
-55 to -65*
-65 to -75
-75 to -85
-85 to -95
-95 to -105
-105 to -115
Household small cell penetration
~7%
Excellent performance
Very good performance
Acceptable performance -105 to -
~70000kbps~700kbps
8
1X
500x
1000x
Source: Qualcomm research
9% Small cells
10x Additional spectrum
9
1X
500x
1000x
20% Small cells
10x Additional spectrum
Source: Qualcomm research

10
For more information on Qualcomm, visit us at:
www.qualcomm.com & www.qualcomm.com/blog
Qualcomm is a trademark of Qualcomm Incorporated, registered in the United States and other countries.
Other products and brand names may be trademarks or registered trademarks of their respective owners
Thank you Follow us on:

Our Mission To be the leader in providing communications services to residential and business customers in our markets
.
Frontier Communications: Building the Broadband Future
in Rural America Presented By: Michael Golob, Senior Vice President, Engineering & Technology Date: March 18, 2013
1

Our Mission To be the leader in providing communications services to residential and business customers in our markets
Company Overview
NY
PA
WV
NC
SC
TN
GA AL MS
FL
OH IN
MI
MN
WI
IA
IL
NE
MT
ID
UT
OR
CA
NV
AZ NM
WA
West Region
East Region
Central Region
National Region
2
Customers: 3.17 million
States: 27
Regions: 4
Employees: 14,700
100% US-based
S&P 500/NASDAQ: FTR
Profile: primarily rural

Our Mission To be the leader in providing communications services to residential and business customers in our markets
Frontier Network Modernization Plan
3
• Build a converged network capable of delivering all services – Data, voice, and video can transit the same pipe with appropriate priorities
being applied/provisioned – Goal is to maximize the bandwidth utilization of the network and provide a
quality experience for the customer – We are investing in a standard network architecture capable of rapidly
deploying new products and services across Frontier’s footprint • Continue to deploy fiber deeper into the network – Fiber to the
DSLAM or fiber to the curb • A Total Cost of Ownership (TCO) model drives network
decisions • Must proactively manage network traffic • Leverage existing plant and equipment to optimize return-on-
investment– retain copper in the last mile in rural markets

Our Mission To be the leader in providing communications services to residential and business customers in our markets
4
Remote DSLAM (DSL Access Multiplexer / Integrated
Splitter – within existing or adjunct
cabinet)
Copper Loop / DSL and POTS
DSL
BRAS (Broadband Access Server /
Internet Router)
‘Internet’ / Frontier CORE
Internet (Internet Service Provider
Connection)
Copper / Fiber Transport
(ATM Data Uplink)
BRAS Uplink
ATM Switch(s) (DSLAM Aggregation at C.O.
DSLAM and ATM Switch)
POTSService
ADSL ModemHSI Service
POTS
Filter
Outside Plant
Central Office
Class V (TDM Switch)
Existing POTS (Copper Plant)
SONET Transport
‘PSTN’
Remote DSLAM (DSL Access Multiplexer / Integrated
Splitter – within existing or adjunct
cabinet)
Copper Loop / DSL and POTS
DSL
Internet (Internet Service Provider
Connection)
Fiber Transport
(IP Data Uplink)
IP Fiber Uplink
IP Aggregation (DSLAM Aggregation at C.O.)
POTSService
ADSL ModemHSI Service
POTS
Filter
Outside Plant
Central Office ‘PSTN’
VOIP Gateway
SIP Edge Router / NGB
IP Fiber Uplink
‘Internet’ / Frontier CORE

Our Mission To be the leader in providing communications services to residential and business customers in our markets
Impacts of Maintaining Dual IP/TDM Networks
• Dual Back Office Support – Provisioning Systems – Separate Equipment Management Systems
• Dual Staffing, Skills & Training – Engineering – NOCs – Provisioning – Field Techs
• Vendor Maintenance / Older Equipment is No Longer Supported • Equipment Sparing
5

XO Network Evolution Overview
Randolph C. Nicklas
CTO & SVP Engineering
XO Communications

Copyright 2012. XO Communications, LLC. All rights reserved. XO, the XO design logo, and all related marks are registered trademarks of XO Communications. 2
About XO Communications
• Leading nationwide provider of data and IP services
• Comprehensive portfolio of communications, managed network and IT infrastructure services
• Headquartered in Herndon, VA • More than 3,100 employees • Annual revenues of more than $1.5B
• Focus on business, large enterprise and wholesale customers
• Customers include more than 50% of the Fortune 500
• Leading brands across major industries • Major cable, content, mobile wireless and
domestic/global telecommunications companies
Large Enterprise SMB Mid-Market Wholesale
Our Customers
Copyright 2012. XO Communications, LLC. All rights reserved. XO, the XO design logo, and all related marks are registered trademarks of XO Communications. 3
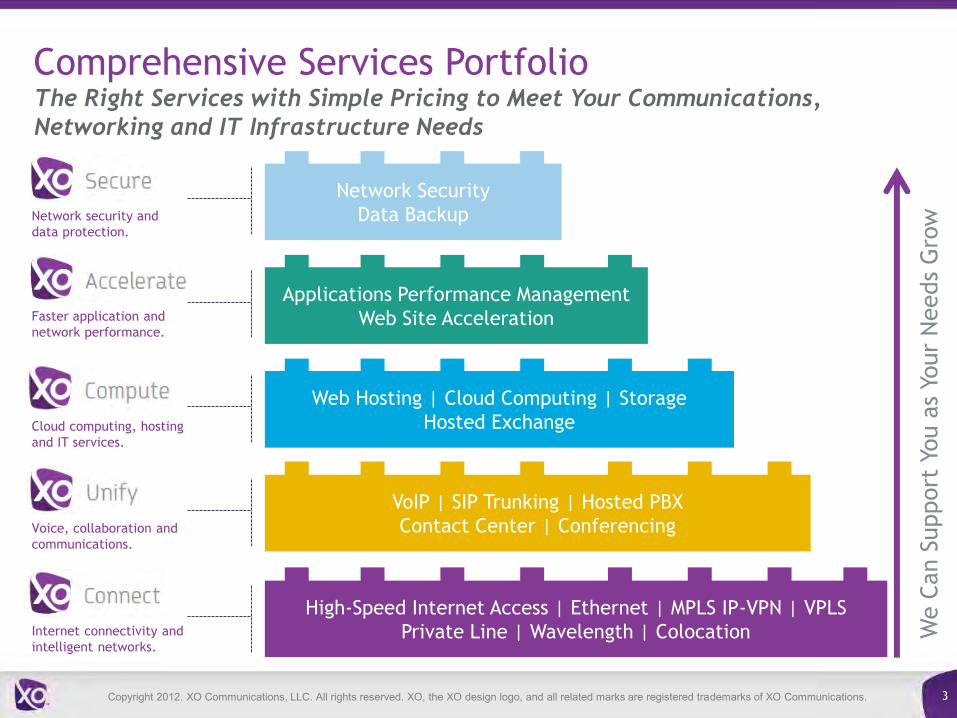
High-Speed Internet Access | Ethernet | MPLS IP-VPN | VPLS
Private Line | Wavelength | Colocation
VoIP | SIP Trunking | Hosted PBX
Contact Center | Conferencing
Internet connectivity and
intelligent networks.
Voice, collaboration and
communications.
Cloud computing, hosting
and IT services.
Faster application and
network performance.
Network security and
data protection.
Web Hosting | Cloud Computing | Storage
Hosted Exchange
Applications Performance Management
Web Site Acceleration
Network Security
Data Backup
We C
an S
upport
You a
s Yo
ur
Needs
Gro
w
Comprehensive Services Portfolio The Right Services with Simple Pricing to Meet Your Communications,
Networking and IT Infrastructure Needs

Copyright 2012. XO Communications, LLC. All rights reserved. XO, the XO design logo, and all related marks are registered trademarks of XO Communications. 4
The XO Network
Extensive Coverage • 85 major metropolitan markets
across United States • Global service delivery to 50+
countries on 5 continents • 3,300 on-net buildings • Ethernet access to hundreds of
thousands business locations
Robust Assets • Tier 1 IP network • Built using advanced IP and optical
technology from Ciena, Cisco, Infinera and Juniper Networks
• 19,000 route mile inter-city miles • 1 million metro fiber miles • 1,000+ colocation facilities • Fixed wireless spectrum in 80 major
metropolitan markets
One of the Industry’s Largest and Most Advanced IP Networks
Copyright 2012. XO Communications, LLC. All rights reserved. XO, the XO design logo, and all related marks are registered trademarks of XO Communications. 5
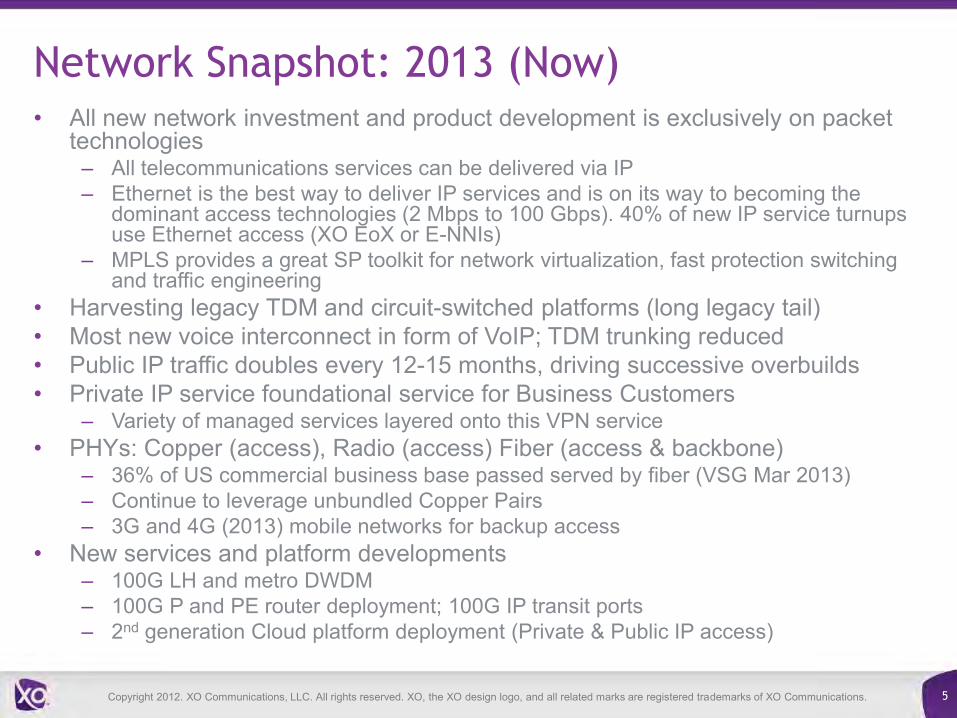
Network Snapshot: 2013 (Now) • All new network investment and product development is exclusively on packet
technologies – All telecommunications services can be delivered via IP – Ethernet is the best way to deliver IP services and is on its way to becoming the
dominant access technologies (2 Mbps to 100 Gbps). 40% of new IP service turnups use Ethernet access (XO EoX or E-NNIs)
– MPLS provides a great SP toolkit for network virtualization, fast protection switching and traffic engineering
• Harvesting legacy TDM and circuit-switched platforms (long legacy tail) • Most new voice interconnect in form of VoIP; TDM trunking reduced • Public IP traffic doubles every 12-15 months, driving successive overbuilds • Private IP service foundational service for Business Customers
– Variety of managed services layered onto this VPN service • PHYs: Copper (access), Radio (access) Fiber (access & backbone)
– 36% of US commercial business base passed served by fiber (VSG Mar 2013) – Continue to leverage unbundled Copper Pairs – 3G and 4G (2013) mobile networks for backup access
• New services and platform developments – 100G LH and metro DWDM – 100G P and PE router deployment; 100G IP transit ports – 2nd generation Cloud platform deployment (Private & Public IP access)
Copyright 2012. XO Communications, LLC. All rights reserved. XO, the XO design logo, and all related marks are registered trademarks of XO Communications. 6
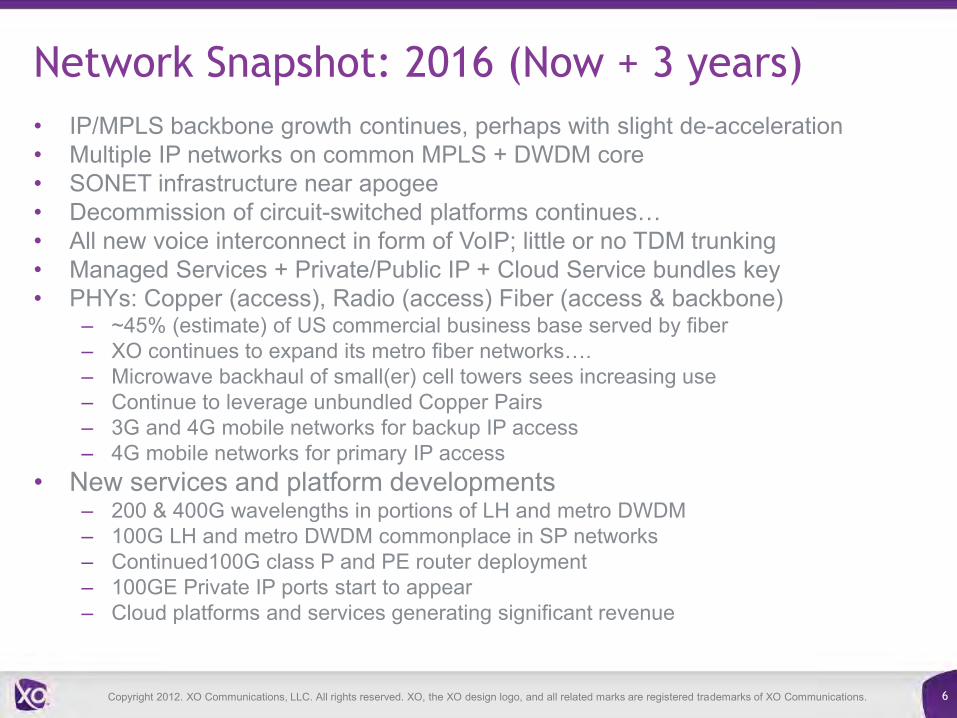
Network Snapshot: 2016 (Now + 3 years)
• IP/MPLS backbone growth continues, perhaps with slight de-acceleration • Multiple IP networks on common MPLS + DWDM core • SONET infrastructure near apogee • Decommission of circuit-switched platforms continues… • All new voice interconnect in form of VoIP; little or no TDM trunking • Managed Services + Private/Public IP + Cloud Service bundles key • PHYs: Copper (access), Radio (access) Fiber (access & backbone)
– ~45% (estimate) of US commercial business base served by fiber – XO continues to expand its metro fiber networks…. – Microwave backhaul of small(er) cell towers sees increasing use – Continue to leverage unbundled Copper Pairs – 3G and 4G mobile networks for backup IP access – 4G mobile networks for primary IP access
• New services and platform developments – 200 & 400G wavelengths in portions of LH and metro DWDM – 100G LH and metro DWDM commonplace in SP networks – Continued100G class P and PE router deployment – 100GE Private IP ports start to appear – Cloud platforms and services generating significant revenue
Copyright 2012. XO Communications, LLC. All rights reserved. XO, the XO design logo, and all related marks are registered trademarks of XO Communications. 7
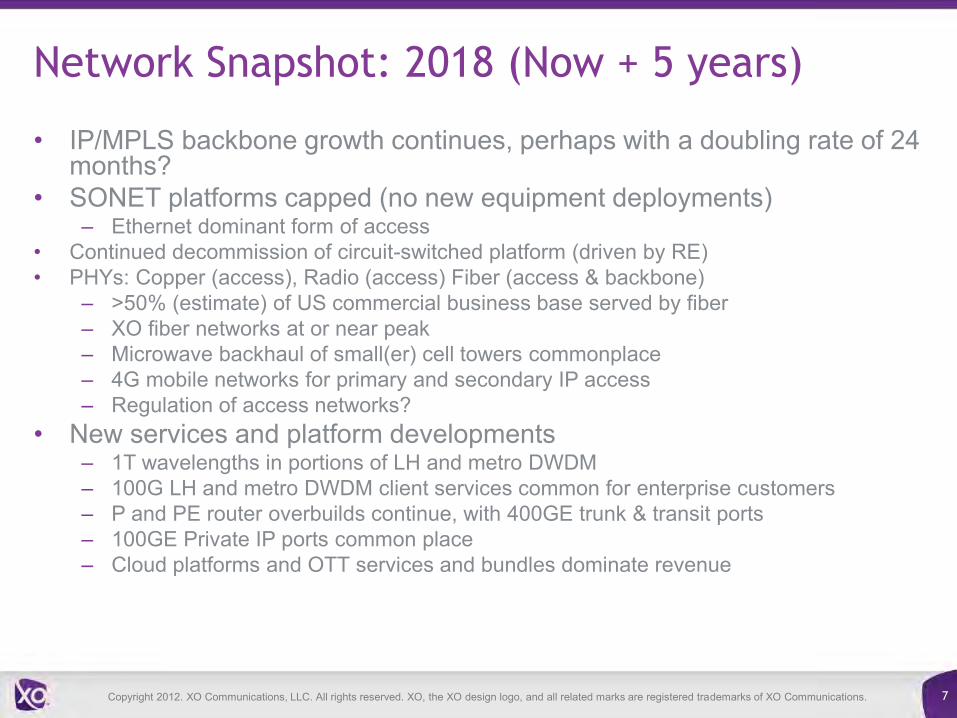
Network Snapshot: 2018 (Now + 5 years)
• IP/MPLS backbone growth continues, perhaps with a doubling rate of 24 months?
• SONET platforms capped (no new equipment deployments) – Ethernet dominant form of access
• Continued decommission of circuit-switched platform (driven by RE) • PHYs: Copper (access), Radio (access) Fiber (access & backbone)
– >50% (estimate) of US commercial business base served by fiber – XO fiber networks at or near peak – Microwave backhaul of small(er) cell towers commonplace – 4G mobile networks for primary and secondary IP access – Regulation of access networks?
• New services and platform developments – 1T wavelengths in portions of LH and metro DWDM – 100G LH and metro DWDM client services common for enterprise customers – P and PE router overbuilds continue, with 400GE trunk & transit ports – 100GE Private IP ports common place – Cloud platforms and OTT services and bundles dominate revenue

Copyright 2012. XO Communications, LLC. All rights reserved. XO, the XO design logo, and all related marks are registered trademarks of XO Communications. 8
Network Snapshot: 2020 (Now + 7 years)
• IP/MPLS backbone capacities near steady-state – Everything is well connected! – At least for ~90-95% of the population…..
• SONET platforms being decommissioned • ILEC wire centers winking out in top 100 MSAs • XO circuit-switches eliminated • PHYs: Copper (access), Radio (access) Fiber (access &
backbone) – 55-65% (estimate) of US commercial business base served by fiber – Microwave and mobile RANs principle access alternatives to fiber
• New services and platform developments – New services??? All we know is they will be over a set of
interconnected and sophisticated packet networks, with IP still the fundamental lingua franca
– Emphasis on improvements in reliability and cost basis never-ending

FCC TECHNOLOGY TRANSITION TASK FORCE PANEL
MARCH 18, 2013 TOM MAGUIRE – SVP VERIZON

2
The Realities of Life in Telecom
• Consumers have more choices than ever in how to communicate and now choose from a wide range of services, devices and networks. – Large numbers of customers have already moved to cable or
telco’s next generation networks for their communication needs. – With 105% wireless penetration it is clear that communications is
no longer limited to talking – Cord Cutters now, “Cord Nevers” on the horizon
• The traditional copper network is limited in its ability to satisfy customers’ growing demands – Bandwidth capacity and speed is the future
• The traditional copper network is aging and has inherent limitations despite our infrastructure improvement programs – Metal + water + oxygen = service disruptions

3
Bandwidth Utilization X
box
Live
laun
ch 1
1/02
Initi
al F
aceb
ook
laun
ch 2
/04
Skyp
e pu
blic
bet
a la
unch
4/0
3
3M H
SI o
ffere
d 9/
04
Wor
ld o
f War
craf
t lau
nche
s in
US
11/0
4 Yo
uTub
e la
unch
2/0
5
Wor
ld o
f War
craf
t hits
1M
US
subs
7/0
5
XBO
X 3
60 la
unch
11/
05
HSI
hits
5M
sub
s 1/
06
Twitt
er la
unch
3/0
6
Amaz
on v
ideo
ser
vice
laun
ch 9
/06
Face
book
fully
ope
ns to
pub
lic 9
/06
YouT
ube
boug
ht b
y G
oogl
e 11
/06
iPho
ne la
unch
6/0
7 Fi
OS
hits
1M
sub
s 6/
07
7M H
SI la
unch
12/
07
Net
flix
unlim
ited
stre
amin
g 1/
08
1M F
iOS
vide
o su
bs 1
/08
Hul
u la
unch
3/0
8
Firs
t And
roid
pho
ne 1
0/08
FiO
S 15
M, 2
5M, 3
5M o
ffers
6/0
9
iPad
laun
ch 4
/10
15M
HSI
offe
ring
8/10
150M
FiO
S o
fferin
g 11
/10
Goo
gle+
laun
ch 0
6/11
FiO
S hi
ts 5
M s
ubs
3/12
FiO
S Q
uant
um
5M iP
hone
5s
sold
on
intro
duct
ory
wee
kend
9/1
2 3M
iPad
Min
is s
old
on in
trodu
ctor
y w
eeke
nd 1
1/12
Customer demand continues to grow
4
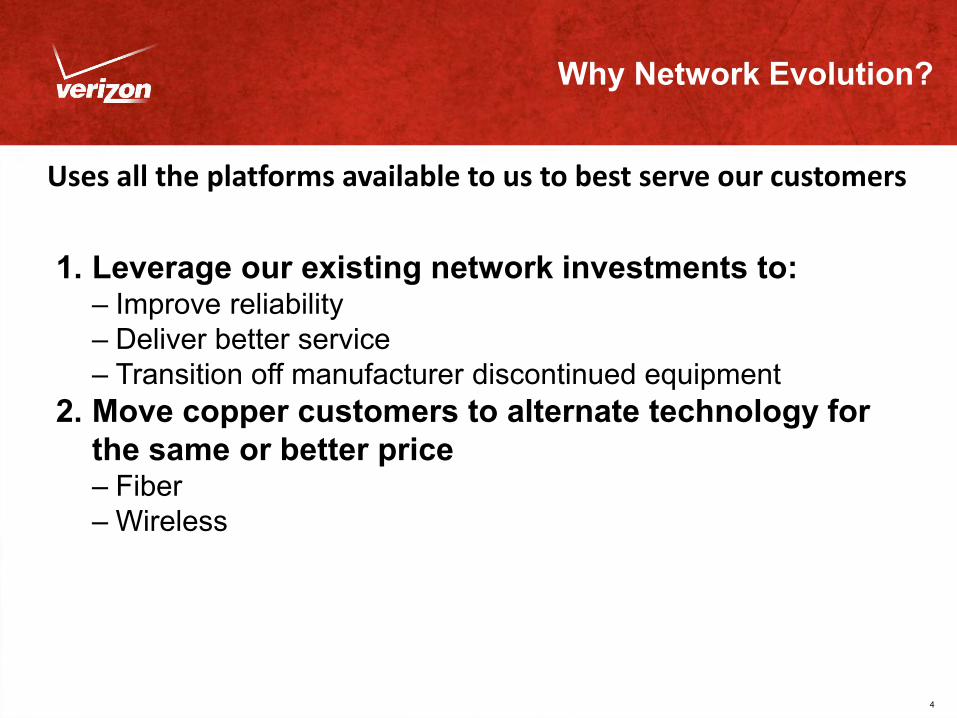
Why Network Evolution?
1. Leverage our existing network investments to: – Improve reliability – Deliver better service – Transition off manufacturer discontinued equipment
2. Move copper customers to alternate technology for the same or better price – Fiber – Wireless
Uses all the platforms available to us to best serve our customers