ms. marlene h. dortch - federal communications … · ms. marlene h. dortch february 24, 2016 page...
TRANSCRIPT

Ms. Marlene H. DortchFebruary 24, 2016 Page 2
2015, the testing also addresses how GPS devices perform in terms of locational accuracy given the reduced operating parameters agreed to by the company in the context of those agreements, and as embodied in the license modification applications filed on December 31, 2015.5
On January 11, 2016, Ligado representatives met with Commission staff andrepresentatives from the Department of Transportation (“DOT”), Department of Defense, and the National Telecommunications and Information Administration to discuss the settlement agreements referenced above, the license modification applications, and the need for prompt Commission issuance of a public notice on these and related issues.6 During that meeting, aquestion was raised by one of the Executive Branch representatives whether the operational limitations contained in the agreement reached by Garmin and Ligado were in fact protective of Garmin’s consumers. The undersigned responded that while the RAA testing and analysis of all the subject GPS devices was not completely finished, the results for Garmin devices were sufficiently complete that (a) they showed that the tested Garmin devices performed at the same accuracy level in the presence of LTE operating at the stipulated power levels as without; and (b) RAA was in a position to present those results in a briefing to the Executive Branch officials at RAA’s testing facility.
The attached presentation, with an accompanying explanation by the RAA team, was provided to representatives of the Department of Transportation, Department of Defense, and NTIA in a meeting at AT4 Technologies, the lab in Herndon, VA that conducted the tests, on February 5, 2016. As shown in the attached presentation, the testing results demonstrate
The Garmin and non-Garmin general navigation devices tested showed no degradation in performance at the operating levels contained in the settlement agreements and reflected in the license modification applications;7
Smartphones tested showed no degradation, and in fact have become more resilient over time;8 and
4 See Letter from Gerard J. Waldron to Marlene H. Dortch, RM-11681; IB Docket No. 12-340; IB Docket No. 11-109; IBFS File Nos. SES-MOD-20151231-00981, SAT-MOD-20151231-00090, and SAT-MOD-20151231-00091(filed Feb. 3, 2016).5 Letter from Gerard J. Waldron to Marlene H. Dortch, IB Docket No. 12-340; IB Docket No. 11-109; IBFS File Nos. SAT-MOD-20120928-00160; SAT-MOD-20120928-00161; SES-MOD-20121001-00872 (filed Dec. 31, 2015). 6 Letter from Gerard J. Waldron to Marlene H. Dortch, IB Docket No. 12-340; IB Docket No. 11-109; IBFS File Nos. SAT-MOD-20120928-00160; SAT-MOD-20120928-00161; SES-MOD-20121001-00872; SES-MOD-20151231-00981; SAT-MOD-20151231-00090; SAT-MOD-20151231-00091 (filed Jan. 13, 2016). 7 Roberson and Associates, LLC, GPS and Adjacent Band Co-Existence Study, 4, 16–27 (Feb. 5, 2016). 8 Id. at 28–30.

Ms. Marlene H. DortchFebruary 24, 2016 Page 3
More fundamentally, the metric the DoT has proposed to use in its testing of adjacent bands—a 1 dB rise in the carrier to noise ratio (the “1 dB proposal”)—is fatally flawed because it does not accurately predict impact of adjacent band signals on GPS device positioning performance. Indeed, the testing demonstrated that average carrier to noise ratio value reported by the receiver (averaged over all GPS satellites) showed small, random variations that can exceed 1dB in the absence of adjacent band signals.9
The purpose of the attached presentation was to address the question raised by an Executive Branch representative whether the limits agreed to by Garmin do, in fact, protect users of Garmin equipment. The presentation also shows that the relationship between 1 dB and GPS devices not delivering promised results to consumers is what statisticians call “stochastic”—which is to say, there is no correlation between 1 dB and GPS performance and instead the results are marked by randomness. Clearly, as the RAA testing demonstrates, this stochastic relationship means that a 1 dB metric cannot be a guide for a worthwhile study.
Preliminary results from other testing are consistent with these results for Garmin devices, and the RAA testing and analysis is entering the final phase. We are also using this opportunity to provide an updated version of RAA’s GPS Sensitivity Measurement Plan, the test plan that was used in connection with the testing results discussed herein. We expect to share the complete results and analysis from the testing as necessary and appropriate.
9 Id. at 5, 31–32.

Ms. Marlene H. DortchFebruary 24, 2016 Page 4
Please direct any questions to the undersigned.
Sincerely,
/s/Gerard J. Waldron Gerard J. Waldron
Michael Beder Counsel to Ligado Networks LLC cc:
Phil VerveerEdward SmithLouis PeraertzJoanna Thomas Travis LitmanJessica AlmondErin McGrathBrendan CarrMindel De La TorrePaul MurrayKarl KensingerBob Nelson Jon WilkinsCharles MathiasJulius Knapp Ron Repasi Jon Chambers Jennifer Tatel
Attachment
1
Febr
uary
5, 2
016
GPS
and
Adja
cent
Ban
d Co
-Exi
sten
ce S
tudy
: Ill
ustr
atio
n of
Met
hod
and
Sele
cted
Res
ults
2
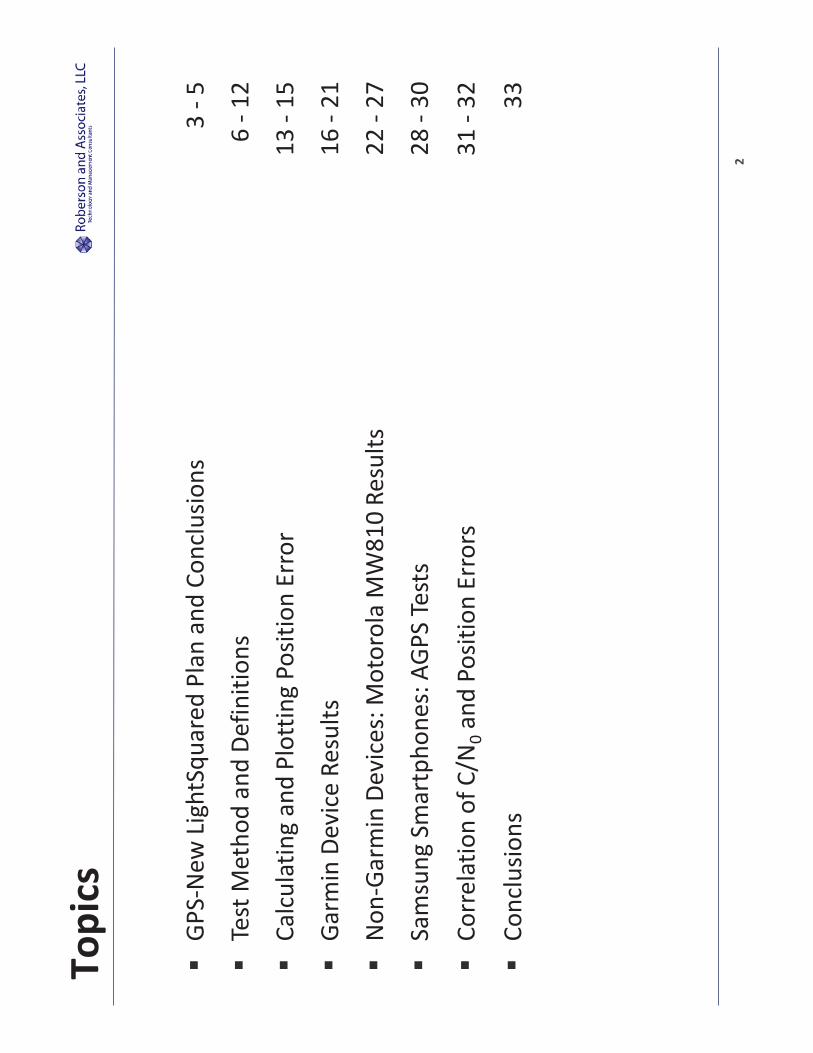
Topi
cs
GPS-
New
Lig
htSq
uare
d Pl
an a
nd C
oncl
usio
ns
3 - 5
Test
Met
hod
and
Defin
ition
s 6
- 12
Calc
ulat
ing
and
Plot
ting
Posit
ion
Erro
r 13
- 15
Garm
in D
evic
e Re
sults
16
- 21
Non
-Gar
min
Dev
ices
: Mot
orol
a M
W81
0 Re
sults
22
- 27
Sam
sung
Sm
artp
hone
s: A
GPS
Test
s 28
- 30
Corr
elat
ion
of C
/N0 a
nd P
ositi
on E
rror
s 31
- 32
Conc
lusio
ns
33


5
Conc
lusi
ons:
Pla
n’s I
mpa
ct C
an b
e Te
sted
; 1 d
B C/
N0 n
ot p
redi
ctiv
e
–RA
A su
cces
sful
ly te
sted
GPS
use
r per
form
ance
met
rics f
or fo
ur
10M
Hz b
ands
•
1526
-153
6 M
Hz, 1
627.
5-16
37.5
MHz
, 164
6.5-
1656
.5 M
Hz, a
nd 1
670-
1680
MHz
–GP
S-N
ew L
ight
Squa
red
Plan
’s sig
nal l
evel
s do
not a
ffect
GPS
us
er p
erfo
rman
ce m
etric
s for
sele
cted
Gar
min
, Mot
orol
a, a
nd
Sam
sung
dev
ices
–Th
e Pl
an p
rovi
des s
uffic
ient
lim
its to
adj
acen
t ban
d sig
nals
to
assu
re G
PS re
ceiv
er p
erfo
rman
ce
–1
dB C
/N0 d
egra
datio
n do
es n
ot p
redi
ct im
pact
of a
djac
ent
band
sign
als o
n GP
S de
vice
pos
ition
ing
perfo
rman
ce
6
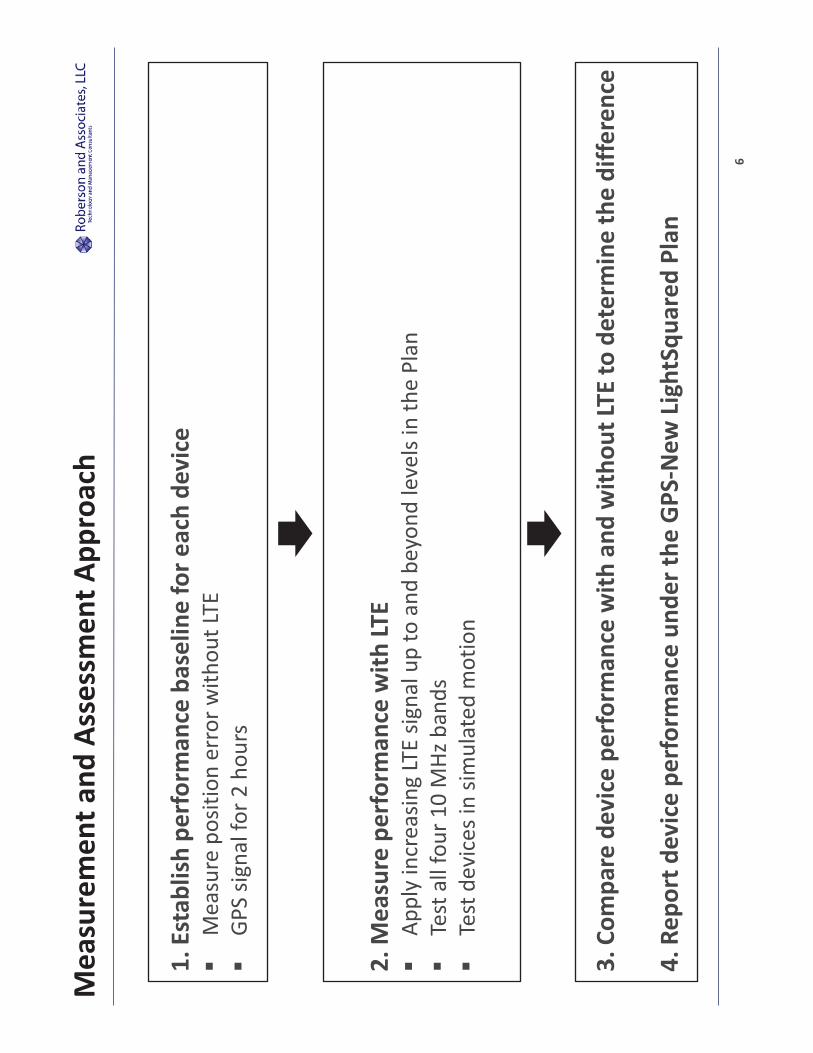
Mea
sure
men
t and
Ass
essm
ent A
ppro
ach
1. E
stab
lish
perf
orm
ance
bas
elin
e fo
r eac
h de
vice
M
easu
re p
ositi
on e
rror
with
out L
TE
GPS
signa
l for
2 h
ours
2. M
easu
re p
erfo
rman
ce w
ith LT
E Ap
ply
incr
easin
g LT
E sig
nal u
p to
and
bey
ond
leve
ls in
the
Plan
Te
st a
ll fo
ur 1
0 M
Hz b
ands
Te
st d
evic
es in
sim
ulat
ed m
otio
n
3. C
ompa
re d
evic
e pe
rfor
man
ce w
ith a
nd w
ithou
t LTE
to d
eter
min
e th
e di
ffere
nce
4. R
epor
t dev
ice
perf
orm
ance
und
er th
e GP
S-N
ew L
ight
Squa
red
Plan

7
Defin
ition
s and
Ter
min
olog
y (1
of 3
)
Tran
smitt
ed o
r rec
eive
d po
wer
can
be
mea
sure
d in
dBW
or d
Bm
dB
W (d
ecib
el re
fere
nced
to 1
Wat
t)
0 dB
W =
1 W
att
32 d
BW =
158
5 W
atts
42
dBW
= 1
5848
Wat
ts
-7 d
BW =
0.2
Wat
ts
dBm
(dec
ibel
refe
renc
ed to
1 m
illiW
att)
0
dBm
= 1
mW
23
dBm
= 0
.2 W
att
-19
dBm
= 1
.3 X
10-5
Wat
ts
8
Defin
ition
s and
Ter
min
olog
y (2
of 3
)
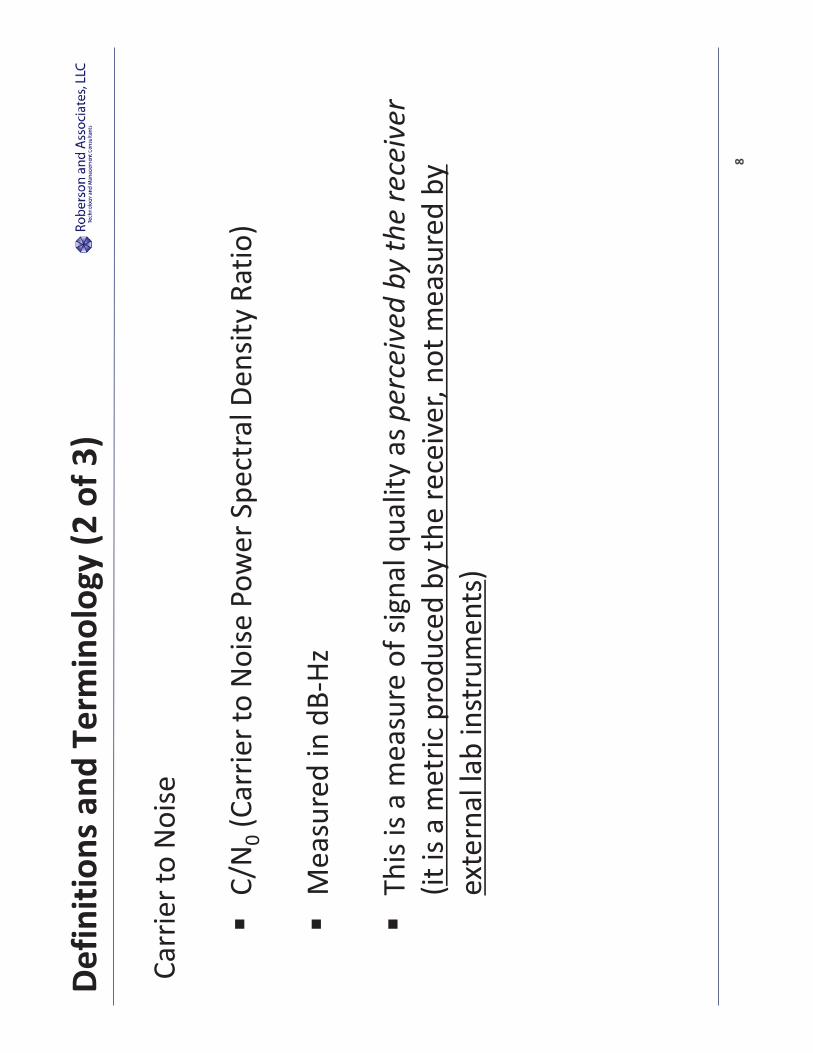
Carr
ier t
o N
oise
C/N
0 (Ca
rrie
r to
Noi
se P
ower
Spe
ctra
l Den
sity
Ratio
) M
easu
red
in d
B-Hz
Th
is is
a m
easu
re o
f sig
nal q
ualit
y as
per
ceiv
ed b
y th
e re
ceiv
er
(it is
a m
etric
pro
duce
d by
the
rece
iver
, not
mea
sure
d by
ex
tern
al la
b in
stru
men
ts)
9
Defin
ition
s and
Ter
min
olog
y (3
of 3
)
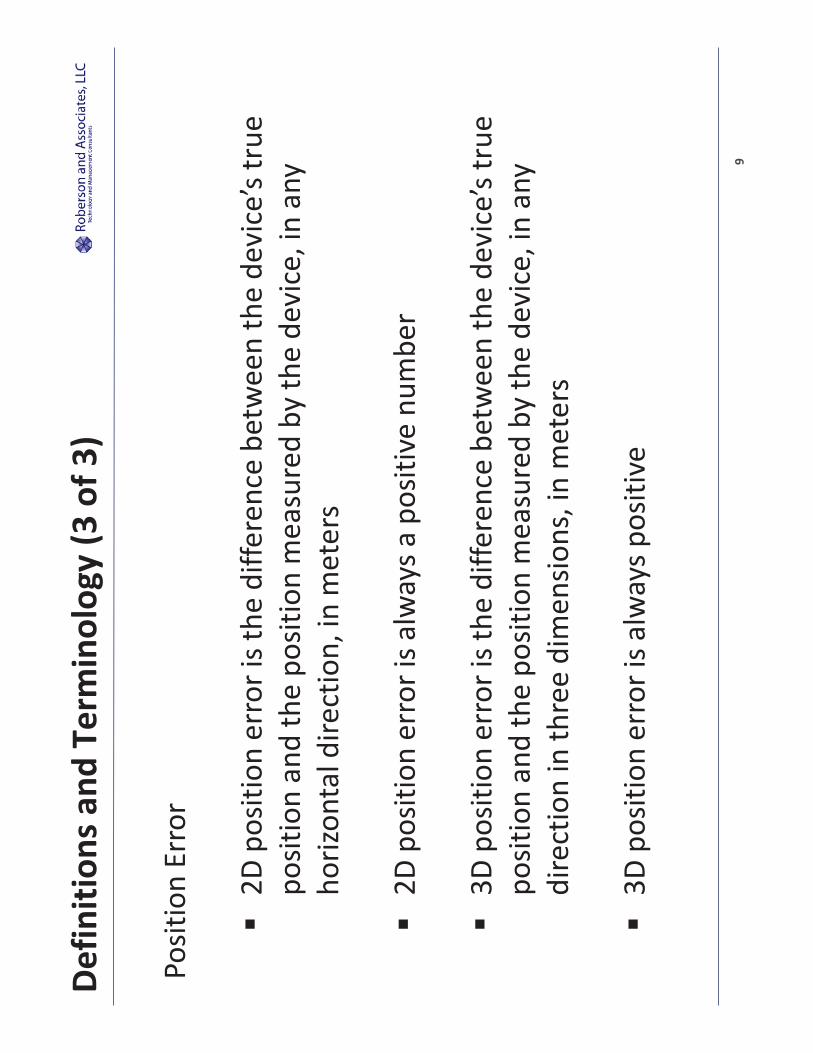
Posit
ion
Erro
r
2D p
ositi
on e
rror
is th
e di
ffere
nce
betw
een
the
devi
ce’s
true
po
sitio
n an
d th
e po
sitio
n m
easu
red
by th
e de
vice
, in
any
horiz
onta
l dire
ctio
n, in
met
ers
2D p
ositi
on e
rror
is a
lway
s a p
ositi
ve n
umbe
r 3D
pos
ition
err
or is
the
diffe
renc
e be
twee
n th
e de
vice
’s tr
ue
posit
ion
and
the
posit
ion
mea
sure
d by
the
devi
ce, i
n an
y di
rect
ion
in th
ree
dim
ensio
ns, i
n m
eter
s 3D
pos
ition
err
or is
alw
ays p
ositi
ve


15
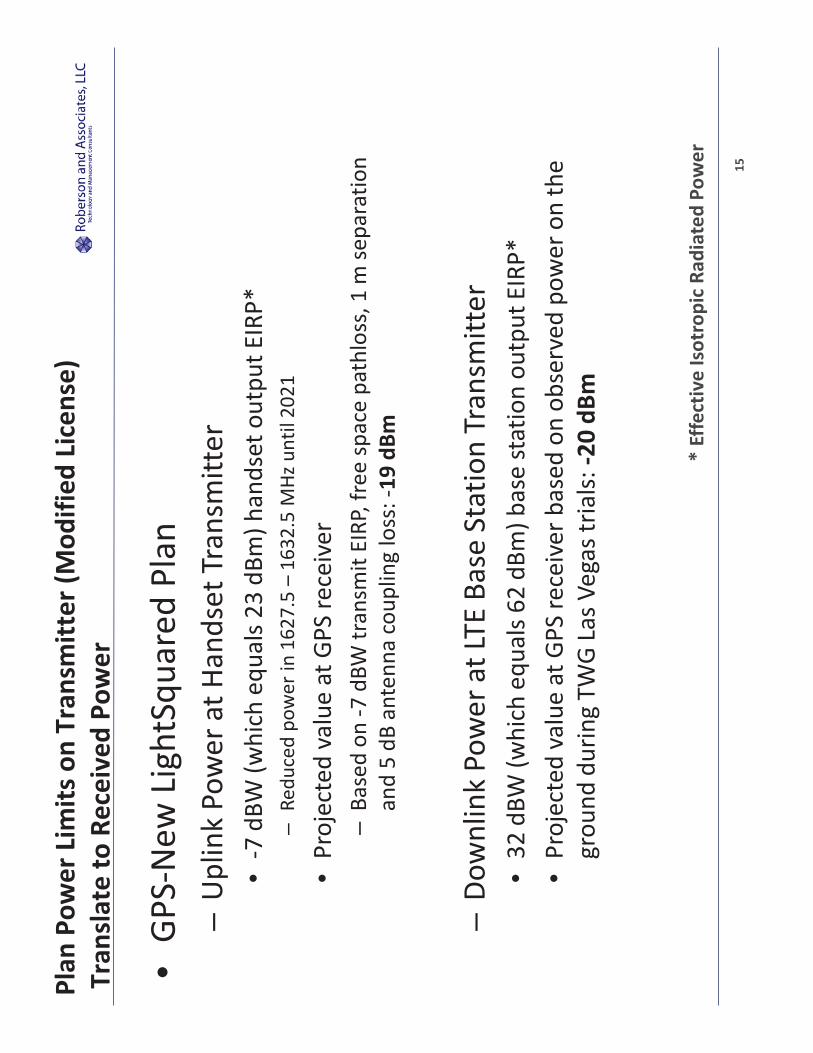
Plan
Pow
er L
imits
on
Tran
smitt
er (M
odifi
ed L
icen
se)
Tra
nsla
te to
Rec
eive
d Po
wer
•GP
S-N
ew L
ight
Squa
red
Plan
–
Upl
ink
Pow
er a
t Han
dset
Tra
nsm
itter
•
-7 d
BW (w
hich
equ
als 2
3 dB
m) h
ands
et o
utpu
t EIR
P*
–Re
duce
d po
wer
in 1
627.
5 –
1632
.5 M
Hz u
ntil
2021
•Pr
ojec
ted
valu
e at
GPS
rece
iver
–
Base
d on
-7 d
BW tr
ansm
it EI
RP, f
ree
spac
e pa
thlo
ss, 1
m se
para
tion
and
5 dB
ant
enna
cou
plin
g lo
ss: -
19 d
Bm
–Do
wnl
ink
Pow
er a
t LTE
Bas
e St
atio
n Tr
ansm
itter
•
32 d
BW (w
hich
equ
als 6
2 dB
m) b
ase
stat
ion
outp
ut E
IRP*
•
Proj
ecte
d va
lue
at G
PS re
ceiv
er b
ased
on
obse
rved
pow
er o
n th
e gr
ound
dur
ing
TWG
Las V
egas
tria
ls: -2
0 dB
m
*
Effe
ctiv
e Is
otro
pic
Radi
ated
Pow
er
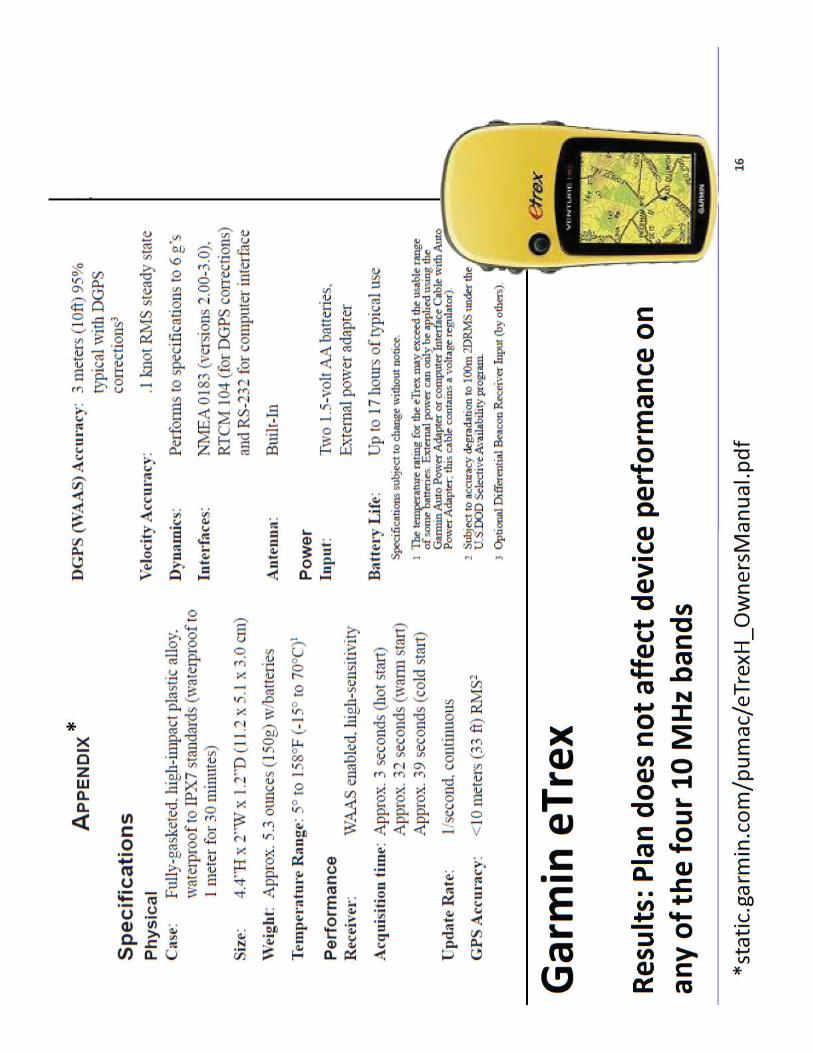


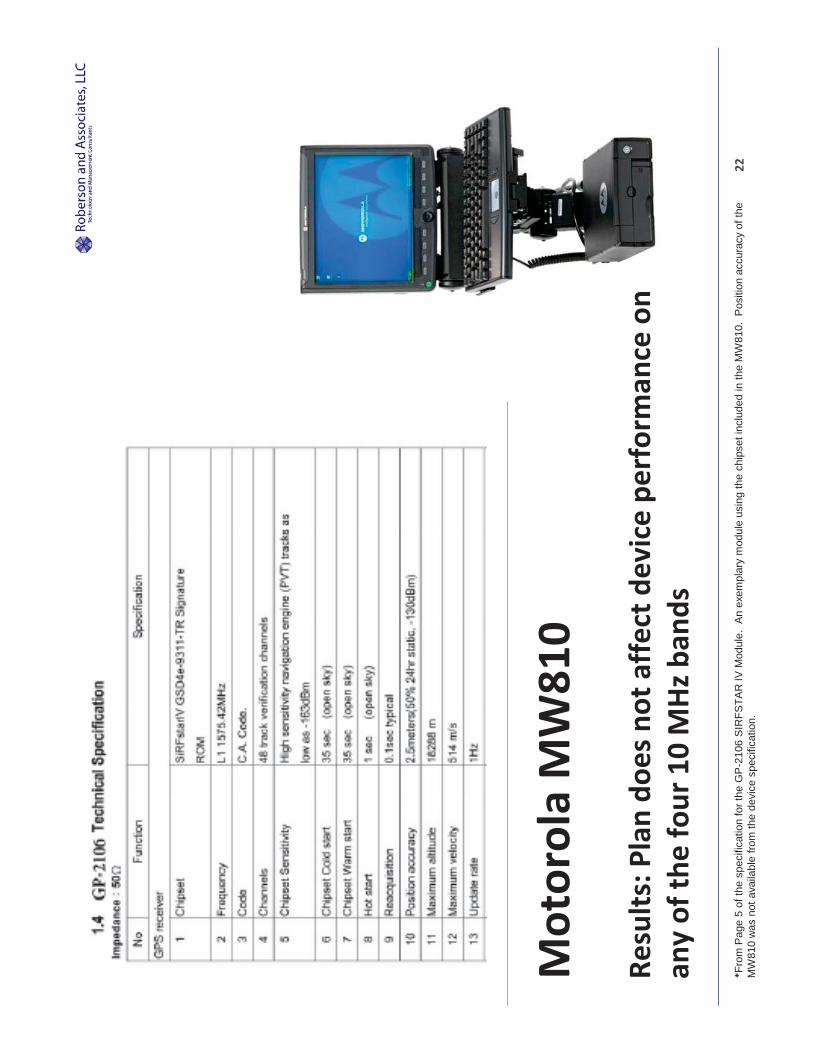
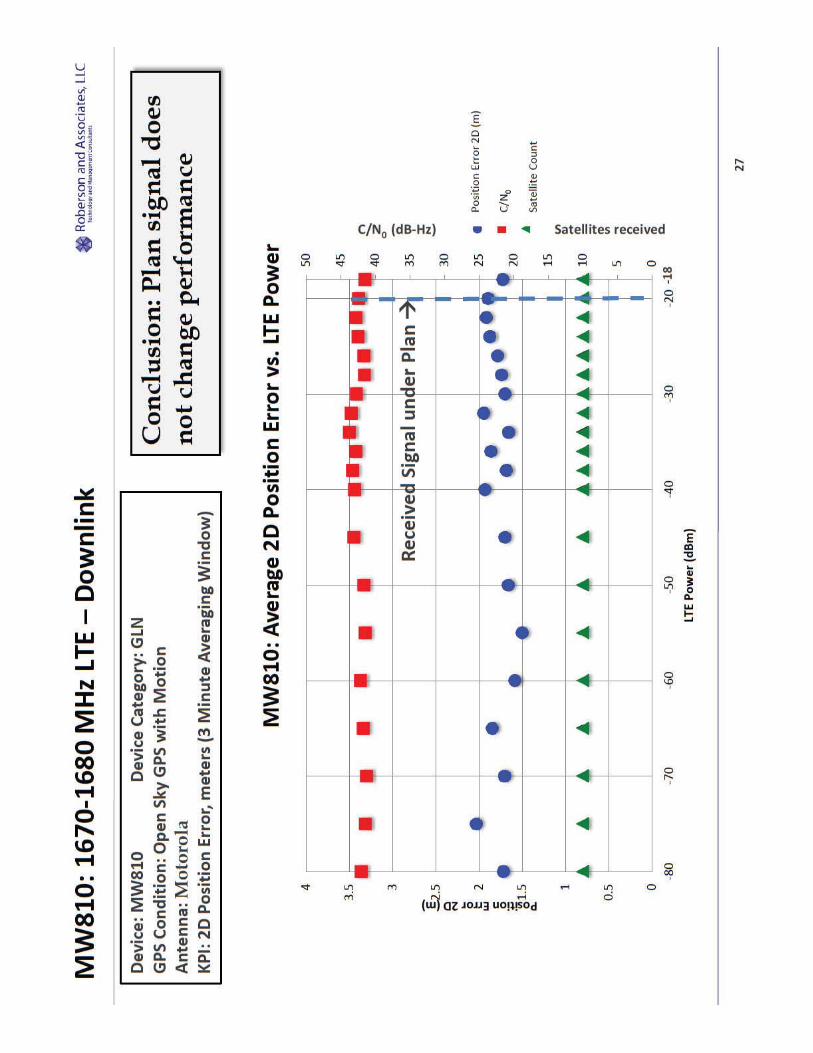
22
Mot
orol
a M
W81
0 Re
sults
: Pla
n do
es n
ot a
ffect
dev
ice
perf
orm
ance
on
any
of th
e fo
ur 1
0 M
Hz b
ands
e
on
*Fro
m P
age
5 of
the
spec
ifica
tion
for t
he G
P-2
106
SIR
FSTA
R IV
Mod
ule.
An
exem
plar
y m
odul
e us
ing
the
chip
set i
nclu
ded
in th
e M
W81
0. P
ositi
on a
ccur
acy
of th
e M
W81
0 w
as n
ot a
vaila
ble
from
the
devi
ce s
peci
ficat
ion.


31
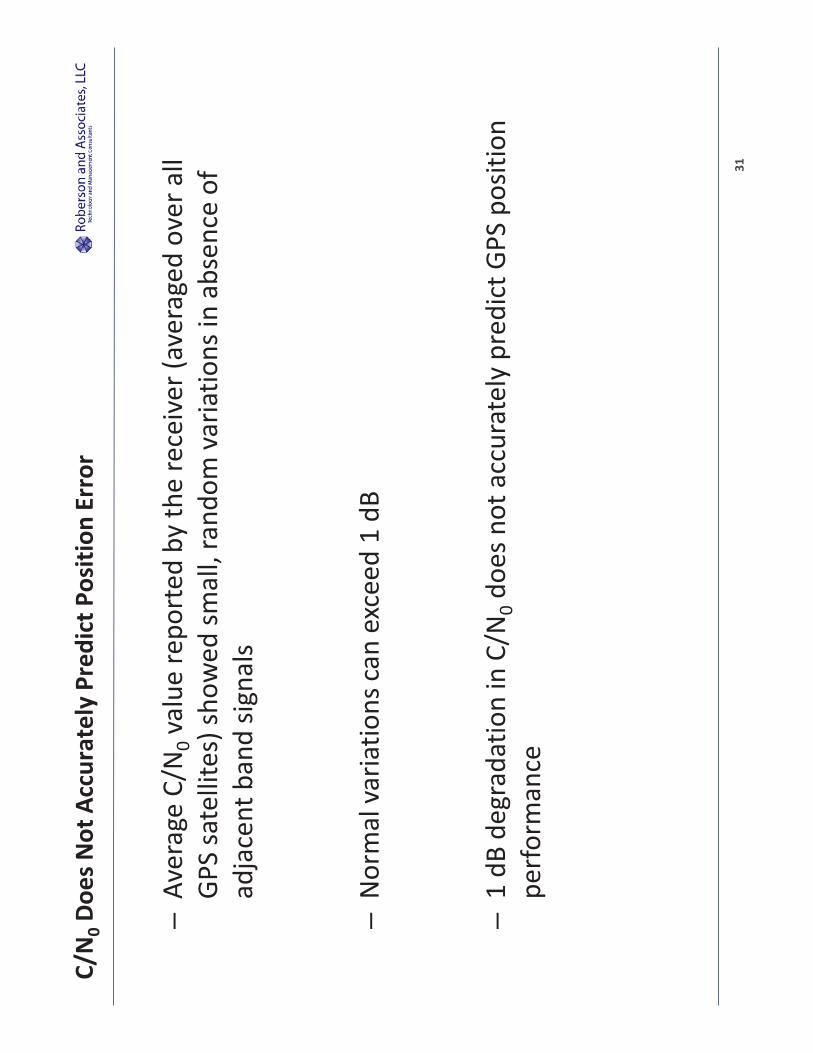
C/N
0 Doe
s Not
Acc
urat
ely
Pred
ict P
ositi
on E
rror
–Av
erag
e C/
N0 v
alue
repo
rted
by
the
rece
iver
(ave
rage
d ov
er a
ll GP
S sa
telli
tes)
show
ed sm
all,
rand
om v
aria
tions
in a
bsen
ce o
f ad
jace
nt b
and
signa
ls
–N
orm
al v
aria
tions
can
exce
ed 1
dB
–
1 dB
deg
rada
tion
in C
/N0 d
oes n
ot a
ccur
atel
y pr
edic
t GPS
pos
ition
pe
rform
ance


33
Conc
lusi
ons:
Pla
n’s I
mpa
ct C
an b
e Te
sted
; 1 d
B C/
N0 n
ot p
redi
ctiv
e
–RA
A su
cces
sful
ly te
sted
GPS
use
r per
form
ance
met
rics f
or fo
ur
10 M
Hz b
ands
•
1526
-153
6 M
Hz, 1
627.
5-16
37.5
MHz
, 164
6.5-
1656
.5 M
Hz, a
nd 1
670-
1680
MHz
–GP
S-N
ew L
ight
Squa
red
Plan
’s sig
nal l
evel
s do
not a
ffect
GPS
us
er p
erfo
rman
ce m
etric
s for
sele
cted
Gar
min
, Mot
orol
a, a
nd
Sam
sung
dev
ices
–Th
e Pl
an p
rovi
des s
uffic
ient
lim
its to
adj
acen
t ban
d sig
nals
to
assu
re G
PS re
ceiv
er p
erfo
rman
ce
–1
dB C
/N0 d
egra
datio
n do
es n
ot p
redi
ct im
pact
of a
djac
ent
band
sign
als o
n GP
S de
vice
pos
ition
ing
perfo
rman
ce
Roberson and Associates, LLC Technology and Management Consultants
Roberson and Associates, LLC Proprietary.
GPS SENSITIVITY MEASUREMENT PLAN
FEBRUARY 16, 2016
V1.6
1 MEASUREMENT PLAN EXECUTIVE SUMMARY ........................................................ 2 1.1 PURPOSE ................................................................................................................................ 2 1.2 DELIVERABLES ...................................................................................................................... 2 2 KPI MEASUREMENT PLAN ............................................................................................... 2 2.1 KEY PERFORMANCE INDICATORS (KPIS) FOR CELLULAR GPS DEVICES ....................... 2 2.2 KEY PERFORMANCE INDICATORS (KPIS) FOR GENERAL NAVIGATION AND HIGH PRECISION ...................................................................................................................................... 5 2.3 GPS DEVICE LIST ................................................................................................................. 6 2.4 ANTENNAS ............................................................................................................................. 7 2.5 RADIATED MEASUREMENTS ................................................................................................. 7 2.6 DEPENDENCIES AND ASSUMPTIONS ..................................................................................... 9 2.7 EQUIPMENT LIST ................................................................................................................. 12 2.8 CALIBRATION AND PRETEST .............................................................................................. 12 3 KPI MEASUREMENT PROCEDURE .............................................................................. 13 3.1 MEASUREMENT SEQUENCE ................................................................................................ 13 3.2 HIGH PRECISION MEASUREMENTS .................................................................................... 15 3.3 CELLULAR DEVICE MEASUREMENTS ................................................................................ 19 3.4 GENERAL NAVIGATION DEVICE MEASUREMENTS ........................................................... 21 4 TIME TO FIRST FIX (TTFF) AND GPS RE-ACQUISITION TESTING ..................... 22 5 ANALYSIS ............................................................................................................................ 23 5.1 STATISTICAL ANALYSIS ...................................................................................................... 24 6 CHANGE HISTORY ............................................................................................................ 24
Roberson and Associates, LLC
2 Roberson and Associates, LLC Proprietary
1 MEASUREMENT PLAN EXECUTIVE SUMMARY
1.1 Purpose The purpose of the GPS receiver measurement project is to collect supporting data to establish the impact on Key Performance Indicators (KPIs) that a GPS device user may experience when L-band LTE downlink and uplink signals are present. Signal to noise ratios in the form of reported C/N0 values and other GPS receiver data will also be collected. Emphasis is on real world expected LTE signal levels.
1.2 Deliverables For each device in each category the main deliverables are detailed records of the KPI statisticsobserved as a function of LTE signal levels at the input to the GPS device. A determination is made of the received power levels in adjacent bands versus observed changes in KPI statistics without any pass/fail determination.
2 KPI MEASUREMENT PLAN
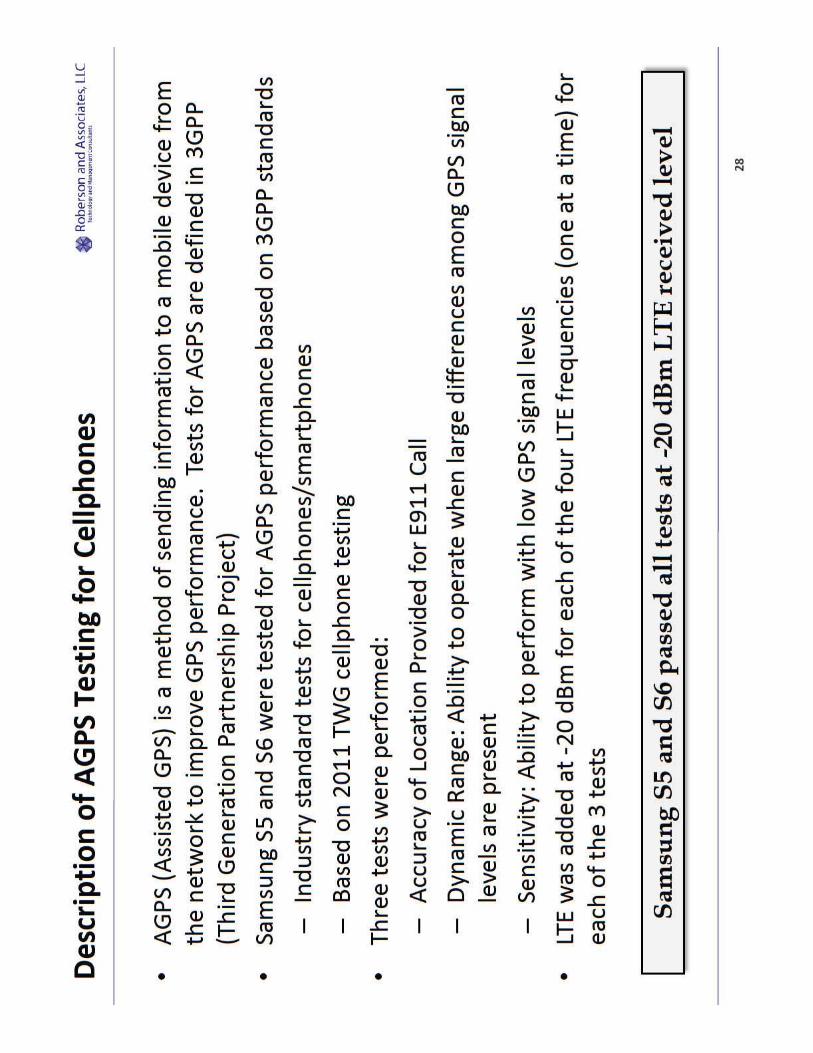
2.1 Key Performance Indicators (KPIs) for Cellular GPS Devices
Cellular GPS devices will be tested using radiated signals as per the TWG devised test plans for Accuracy [TWG Report, Sections 3.2.9.2.2 and 3.2.9.2.3] and Sensitivity [TWG Report, Section 3.2.9.2.1]. In addition, 3GPP Dynamic Range tests will be performed. These 3GPP tests are found in 3GPP Specification TS 37.571-1 for UTRAN and E-UTRAN based systems. The Sensitivity test is described in section 7.1, the Accuracy test is described in section 7.2, and the Dynamic Range test is described in section 7.3 of 3GPP TS 37.571-1.
The three figures below are taken from TS 37-571-1 summarize the performance requirements and test conditions for the three KPIs described above.

Roberson and Associates, LLC
3 Roberson and Associates, LLC Proprietary
Figure 1 3GPP Sensitivity KPI and test conditions from TS 37.571-1
Figure 2 3GPP Accuracy KPI and test setup from TS 37.571-1

Roberson and Associates, LLC
4 Roberson and Associates, LLC Proprietary
Figure 3 3GPP Dynamic Range from TS 37.571-1
Roberson and Associates, LLC
5 Roberson and Associates, LLC Proprietary
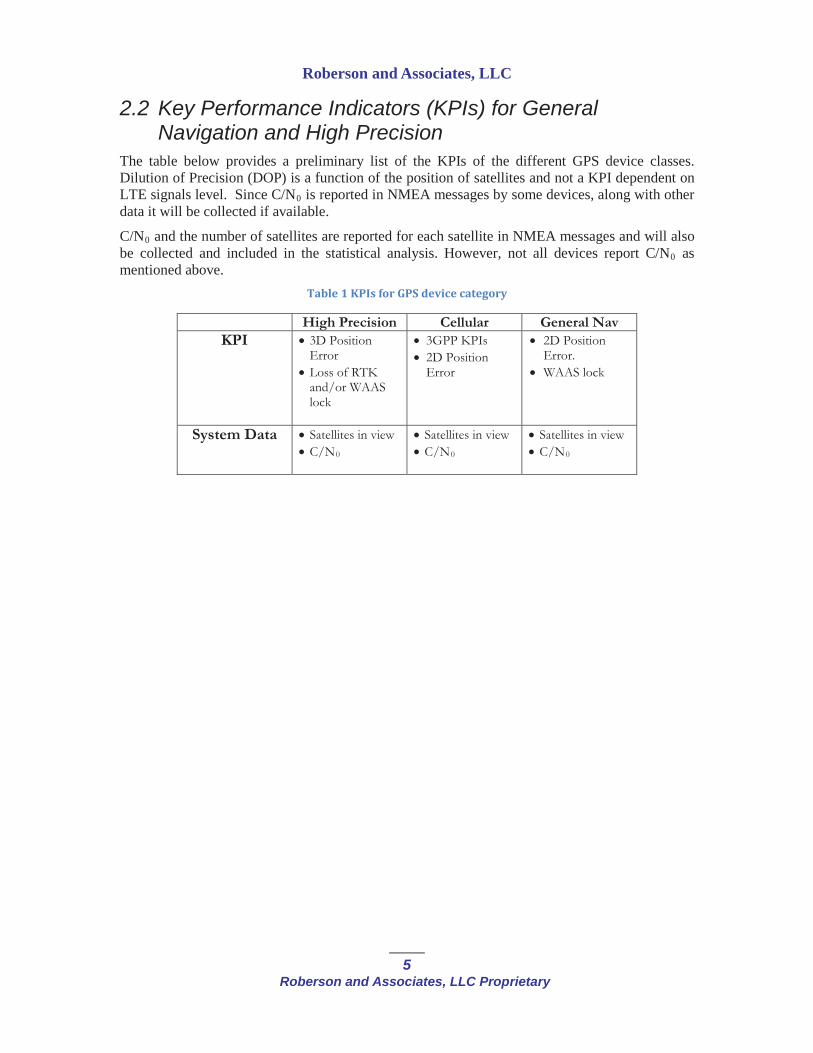
2.2 Key Performance Indicators (KPIs) for General Navigation and High Precision
The table below provides a preliminary list of the KPIs of the different GPS device classes. Dilution of Precision (DOP) is a function of the position of satellites and not a KPI dependent on LTE signals level. Since C/N0 is reported in NMEA messages by some devices, along with other data it will be collected if available.
C/N0 and the number of satellites are reported for each satellite in NMEA messages and will also be collected and included in the statistical analysis. However, not all devices report C/N0 asmentioned above.
Table 1 KPIs for GPS device category
High Precision Cellular General Nav KPI 3D Position
Error Loss of RTK and/or WAAS lock
3GPP KPIs 2D Position Error
2D Position Error. WAAS lock
System Data Satellites in view C/N0
Satellites in view C/N0
Satellites in view C/N0


Roberson and Associates, LLC
8 Roberson and Associates, LLC Proprietary
Figure 4 Simplified radiated GPS KPI measurement schematic. MSS augmented High Precision receivers will use live sky GPS+Augmentation signals.
Knowledge of GPS receiver antenna gain patterns (azimuth, elevation, and polarization) will be required if it is necessary to project the received power levels back to emitter antennas in use case analyses. To avoid taking radiated measurements at multiple incidence angles on the antenna, devices will be tested at one angle measured in the laboratory, and, in the use case analyses, adjusted for the angles of arrival called for by specific use cases. The 3D antenna pattern data from the equipment manufacturers will be required for this purpose, absent which, realistic assumptions will be made. Note that the laboratory set up will not try to emulate the actual angles of arrival of the LTE and GPS signals – they will be set up with convenient angles of arrival that produce strong responses from the GPS antenna.
Note also that the GPS signals from different satellites will be combined and radiated as one composite signal towards the GPS receiver, most likely with an angle of arrival corresponding to the antenna’s boresight. The LTE signal will likewise be radiated with an angle of arrival within +/- 450 of boresight. In the use case analyses, the received powers of LTE signals will be adjusted by the difference in an antenna gain between the angle of arrival used in the laboratory and that called for by a specific use case.
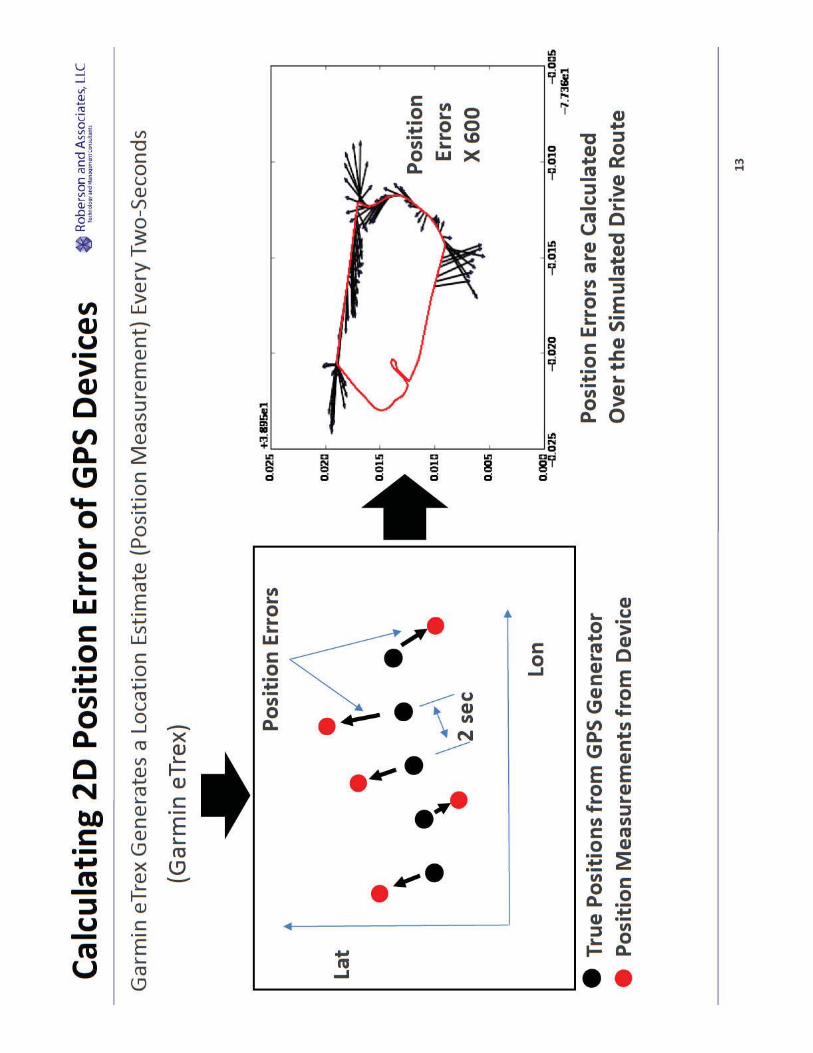
2.5.1.1 Motion TestingGeneral Navigation devices will be tested with motion. This means that the GPS simulator will use an NMEA file recorded during a short drive around a loop. During GPS sensitivity testing the latitudes and longitudes from the NMEA file along with the start date and time of the simulation are used to calculated satellite positions and therefore the received GPS signals.

Roberson and Associates, LLC
9 Roberson and Associates, LLC Proprietary
Figure 5 Google Earth view of motion testing drive route. The route was driven in the clockwise direction.
2.5.1.2 Static TestingStatic testing is the condition where the GPS simulator generates GPS signals corresponding to those that a GPS receiver at a fixed location would receive. The GPS device is not moving.
2.5.1.3 Live SkyLive sky testing will be used for High Precision devices that are augmented with real time correction signals. The reason is that the current ionospheric conditions must be present in the received GPS signals for the correction signals to be accurate. A high quality GPS antenna will be installed on the roof of the building where the RF anechoic chamber is located. The GPS signal will be amplified and connect to the GPS source antenna in the chamber to produce the “Live Sky” signal.
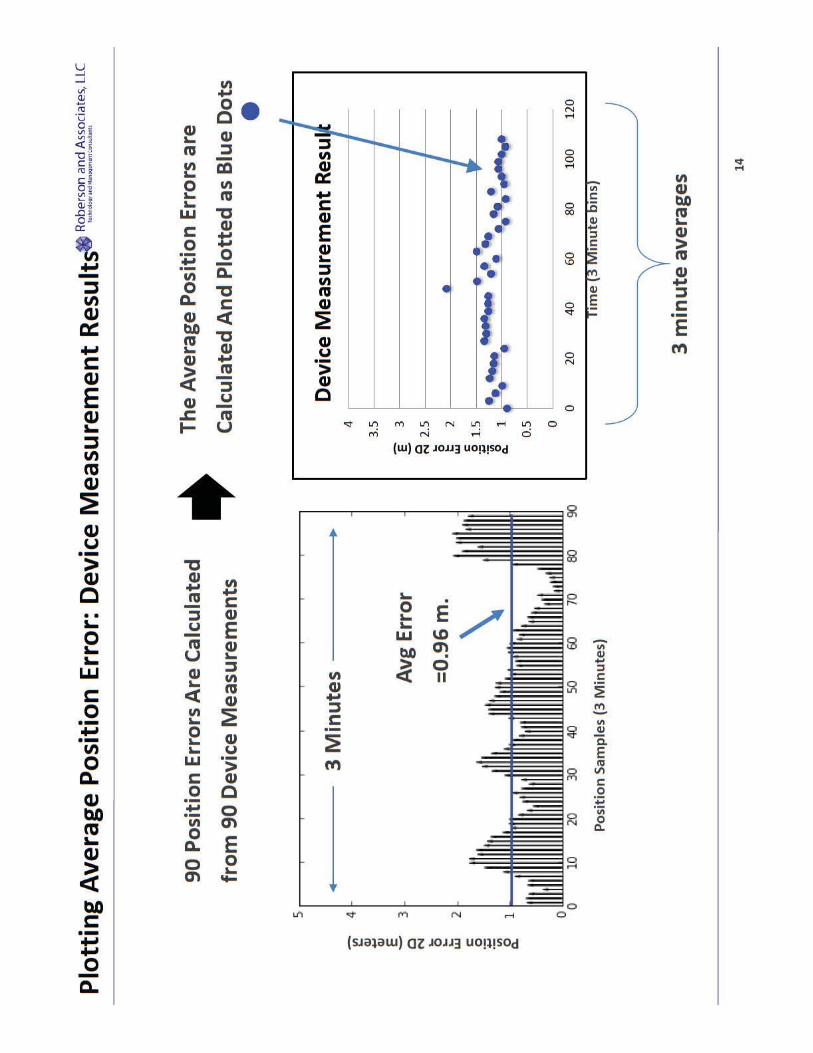
2.6 Dependencies and AssumptionsThe post measurement analysis of the data involves comparison of the measured received estimated positions (for navigation receivers) and time with the true values. The basic process is to compare true position and time with received values measured by the device. 2D and 3D mean position errors, both calculated over 3 minute observation periods, as well as C/N0 values reported by the GPS receiver and averaged over all satellites, will be recorded as functions of LTE downlink and uplink signal levels at the receiver. Additional analysis outside the scope of this document will be performed to assess the impact to the user of KPI degradation in real life scenarios.
Analyzing test results with motion testing will be based on matching GPS timestamps of the recorded simulator output and the device being tested and comparing the 2D or 3D positions at each timestamp.

Roberson and Associates, LLC
10Roberson and Associates, LLC Proprietary
2.6.1 LTE Signals and BandsOnly the full 10 MHz bandwidth version of LTE signals will be used in the measurements. Downlink LTE signals will be assumed to be supporting many devices and have all LTE resource blocks assigned.
Uplink LTE signals will be representative of high data rate, with all resources blocks assignedand the device transmitting at the maximum EIRP of 23 dBm. The high data rate case is the extreme worst case since this represents transmitting on the most resource blocks over time. Lower data rates will be experienced in the field as well as lower radiated power, since many of the resource blocks are not being used, and a base station will rarely if ever assign 100% of the resources to a single device.
The bands for the LTE signals to be used in the KPI measurements are shown below: Only 10 MHz bandwidth LTE signals will be used.
LTE Direction LTE Band LTE Throughput (Simulated)
Downlink 1526-1536 MHz Max. Throughput
Downlink 1670-1680 Max. Throughput
Uplink 1627.5-1637.5 Max. Throughput
Uplink 1646.5-1656.5 Max. Throughput
2.6.2 LTE Uplink Signal Generation OOBE Noise FloorThe uplink LTE signals will simulate the entire output power spectrum that is the maximum that can be transmitted from an LTE device. The OOBE EIRP Emission limit for the handheld LTE devices is -105 dBW/MHz from 1559 MHz to 1608 MHz. The tests will emulate the LTE devices emitting OOBE at representative levels..
The LTE uplink has a maximum power of +23 dBm over a 10 MHz bandwidth. The noise floor should not exceed -105 dBW/MHz referenced to the inband level. These are EIRP values.
The schematic shows a wideband white noise generator output combined with the LTE uplink signal to produce a test signal with the power spectral density shown above. The power spectral density (PSD) of the added white noise represents Ligado’s current commitment of uplink OOBE, projected from a Ligado device to a GPS receiver at a standoff distance of 1 m and assuming a net antenna coupling loss of 5 dB,
Table 2 shows the conversion from -105dBW/MHz at the transmitter to OOBE power received at the device under test.
Table 2 Basis of OOBE PSD applied to the GPS device under test

Roberson and Associates, LLC
11Roberson and Associates, LLC Proprietary
-105 dBW/MHz OOBE limit of Ligado LTE Devices
-165 dBW/Hz - 60dB Convert MHz to Hz
-135 dBm/Hz +30dB Convert dBW to dBm
-171.4 dBm/Hz -36.4 dB Path loss 1m separation
-176.5 dBm/Hz -5 dB Antenna Coupling
-176.5 dBm/Hz Power at the GPS Device Under Test
Figure 6 Schematic for producing LTE uplink OOBE noise -176.5 dBm/Hz at the GPS receiver
2.6.3 GPS ConditionThe GPS signal condition is shown below and will be simulated during static and motion testing depending on the device type.
Condition Number GPS Level WAAS Levels
Open Sky 8+ satellites -130 dBm -128.5 dBm
The combinations of GPS signal condition and device dynamics used in testing are summarized in the table below.

Roberson and Associates, LLC
12Roberson and Associates, LLC Proprietary
GPS Signal Condition GPS Device Condition
Open Sky Static Simulator
Open Sky Motion Simulator
Live Sky Live Sky (antenna mounted on roof of testing lab)
2.6.4 GPS ImpairmentsNo GPS impairments are added to the simulations.
2.7 Equipment List The list below includes the equipment that is needed for measuring the sensitivity of GPS KPIs to LTE signal levels
1. Spirent or other GPS Test Set capable of introducing WAAS signals, and capable of playing back recorded NMEA motion files
2. MSS Augmentation signal sources
3. RTK Augmentation message generation and RF, WiFi, or Ethernet RTK signal source
4. LTE Signal Generator
5. RF Amplifiers
6. RF Attenuators
7. RF Signal Combiners, isolators, couplers
8. LTE TX OOBE Filters
9. LTE TX and GPS TX Antennas
10. GPS RX Antennas
11. GPS RX Filters
2.8 Calibration and Pretest Prior to collecting detailed KPI data the devices need to be characterized for their basic performance levels to ensure the devices are operating properly. It is also vital to understand the intrinsic random variations in KPIs that the GPS system produces under “no-interference” conditions. This involves applying a GPS constellation signal at a fixed, known level to each device and recording the reported C/N0 for each device. No adjacent band signal will be present during these measurements.
Prior to data collection it is important to verify that the thermal noise floor has not been increased and that no spurious intermodulation signal produced by interactions between the GPS and LTE signal generators.

Roberson and Associates, LLC
13Roberson and Associates, LLC Proprietary
3 KPI MEASUREMENT PROCEDURE
3.1 Measurement Sequence The basic sequence to measure the changes in KPIs as a function of LTE signal level is shown below. The approach is to apply LTE signal and increase the level in small steps and capturing statistically valid KPI data sets at each step. A baseline set of KPI data without the LTE signal will also be collected during the GPS-only phase. The duration of the GPS-only phase is 2 hours. The reason is to capture both the short-term random position variations as well as the long-term position variations caused by changes in the satellite constellation which modify the composition of satellites used to calculate position.
The GPS simulator will, in addition to standard L1 band C/A GPS signals, provide WAAS augmentation signals when the test receiver is WAAS capable. In the case of non-MSS-augmented High Precision receivers, the augmentation signal will be provided by an IP network connection; in the case of MSS augmented High Precision receivers, the augmentation and GPS signals will be received by a wideband antenna, amplified and re-radiated in the RF chamber if feasible. Receivers using augmentation signals may be able to remove a large part of these errors but non-augmented receives (including High Precision receivers operated in Autonomous mode) will experience a baseline rms error, as they do in real life operation, that will be present in the absence of LTE signals. The KPI statistics will show the impact of the LTE signals on the baseline error.
Figure 7 Generic GPS KPI measurement sequence
The pseudo-code description for the MEASURE_KPI_SET() sequence is given below. The parameter TRECORD must be long enough to capture a large enough set of KPI measurements
Roberson and Associates, LLC
14Roberson and Associates, LLC Proprietary
so that statistically valid KPI averages and standard deviations can be calculated. TRECORD may be as long as one minute or more for devices reporting KPI values at a low rate. Power GPS deviceApply GPS signalWait for the GPS receiver to enter the fix-found stateRecord baseline GPS NMEA signal parameters, and KPI values for
2 Hours. Apply LTE signal, and OOBE signal if in an uplink band, at a
signal level of -80 dBm.Loop from -80 dBm until LTE level reaches -10 dBm. record GPS NMEA signal parameters and KPI values for 3
minutes. increase LTE level by (coarse 5 dB steps up to -40 dBm and
then fine 2 dB steps) Remove LTE Signal
Roberson and Associates, LLC
15Roberson and Associates, LLC Proprietary
3.2 High Precision Measurements
3.2.1 Situation: High Precision LocationHigh Precision GPS receivers may have wider RF front end bandwidths than other GPS devices.
This may be motivated by a need to receive an MSS augmentation signal in the adjacent 1525-1559 MHz MSS band and to share the RF front end circuitry between the MSS augmentation signal receiver and the GPS receiver. Others use augmentation signals in the UHF and other bands and do not need to have such wide passbands.
3.2.2 GoalsFirst, characterize the performance of the High Precision receivers and antennas in the target list. Second, for receivers where the antenna and receiver are not integrated into one unit, determine ifthe use of known high immunity antennas can improve adjacent band compatibility. Test and compare the performance of high precision receivers which use antennas which limit the receive bandwidth to the GNSS band.
3.2.3 Plan Measure representative high precision GPS receivers, capture and store KPI data as a function of LTE signal strength.
Repeat the measurement with a high interference immunity antenna.
3.2.4 Analysis: Compare true position with received values. Plot RMS 3D location errors, satellite count, and C/N0 vs. LTE signal levels for each test frequency, with and without high immunity antennas present. Record the availability of augmentation signal vs. signal level.
3.2.5 AssumptionsMSS augmentation signals and RTK augmentation signals can be generated and supplied to the GPS device under test.
Access is available to 3D location error data.
3.2.6 Measurement Test SequencePseudo-code for static measurement of high performance GPS receivers is given below for static testingFor each GPS condition (Open Static, Live Sky)For each downlink frequency band (1531, 1675)
MEASURE_KPI_SET()For each uplink frequency band (1631, 1651)
MEASURE_KPI_SET()
Roberson and Associates, LLC
16Roberson and Associates, LLC Proprietary
Enable Augmentation Signals Setup test for Live Sky GPS conditionFor each downlink frequency band (1531, 1675)MEASURE_KPI_SET()
For each uplink frequency band (1631, 1651) MEASURE_KPI_SET()
3.2.7 Potential Issues: Augmentation SignalsCertain augmentation signals will likely require cooperation from the manufacturers. GPS signal constellation generators may be able to produce some augmentations signals. Providing an augmentation signal may require a second base unit in addition to the unit being tested.
Roberson and Associates, LLC
17Roberson and Associates, LLC Proprietary
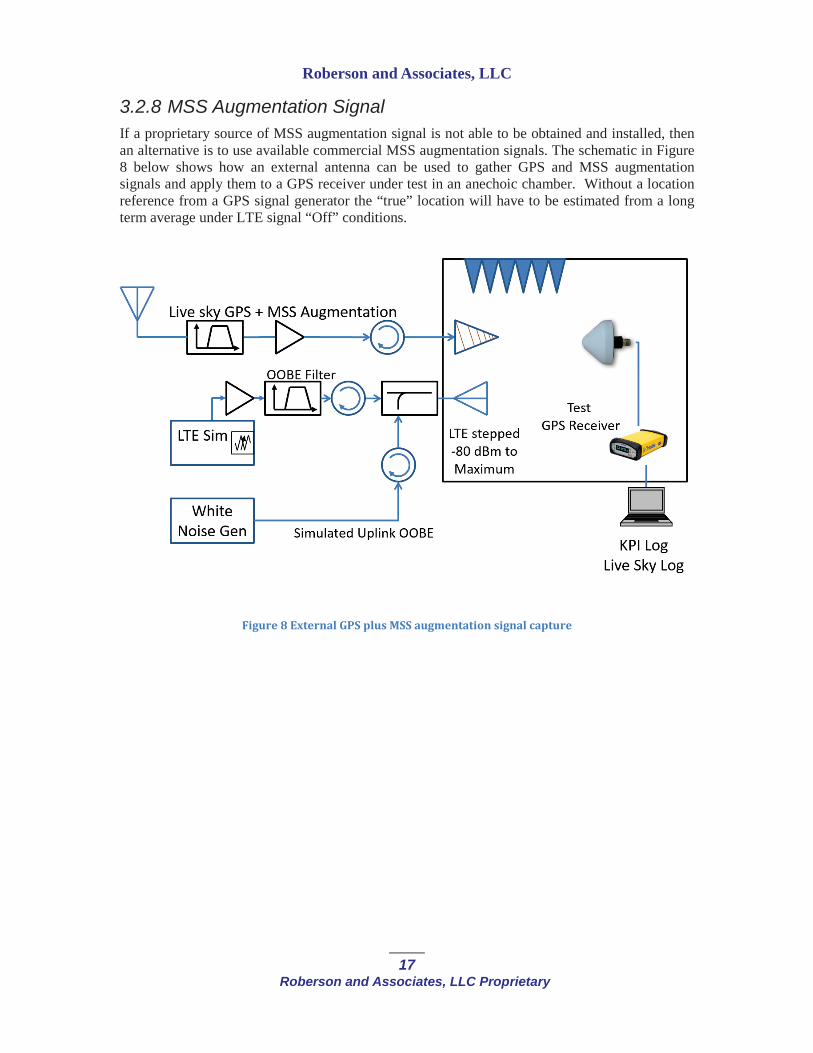
3.2.8 MSS Augmentation SignalIf a proprietary source of MSS augmentation signal is not able to be obtained and installed, then an alternative is to use available commercial MSS augmentation signals. The schematic in Figure 8 below shows how an external antenna can be used to gather GPS and MSS augmentation signals and apply them to a GPS receiver under test in an anechoic chamber. Without a location reference from a GPS signal generator the “true” location will have to be estimated from a long term average under LTE signal “Off” conditions.
Figure 8 External GPS plus MSS augmentation signal capture

Roberson and Associates, LLC
18Roberson and Associates, LLC Proprietary
3.2.9 RTK Augmentation SignalCommercial and public RTK correction data is available from many sources. There are statewide networks and commercial networks that make RTK correction data available over cellular internet connections. The schematic below shows a system for gathering commercial cellular RTK correction data from a cellular or other wireless data network for application to the GPS receiver under test.
An alternative would be to use commercial internet (IP network) based RTK services as shown in Figure 9 below.
Figure 9 Insertion of commercial RTK into test chamber
Roberson and Associates, LLC
19Roberson and Associates, LLC Proprietary
3.3 Cellular Device Measurements
3.3.1 Cellular Device SituationCellular devices and smart phones have rapid replacement cycles. Smart-phones are very commonly used for mapping, location, and navigation relying on embedded GPS receivers as well as network provided location information. Bestselling devices in the latter half of 2015, the time of these measurements, were not available or marketed in 2011. GLONASS capability is now included in high volume GPS chipsets and this capability may have resulted in different RF front end filter characteristics for the embedded GNSS receiver in Cellular devices.
3.3.2 Desired GoalsCharacterize the performance of the latest, high sales volume cellular devices to update the performance baseline.
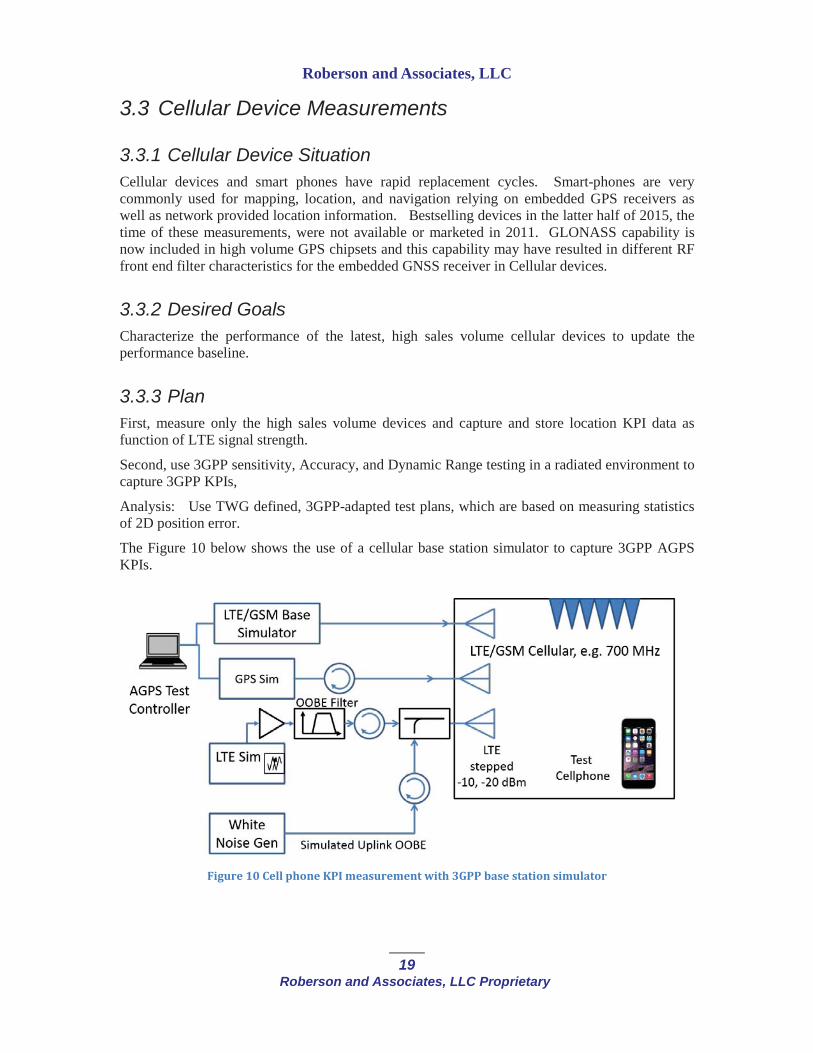
3.3.3 Plan First, measure only the high sales volume devices and capture and store location KPI data as function of LTE signal strength.
Second, use 3GPP sensitivity, Accuracy, and Dynamic Range testing in a radiated environment to capture 3GPP KPIs,
Analysis: Use TWG defined, 3GPP-adapted test plans, which are based on measuring statistics of 2D position error.
The Figure 10 below shows the use of a cellular base station simulator to capture 3GPP AGPS KPIs.
Figure 10 Cell phone KPI measurement with 3GPP base station simulator

Roberson and Associates, LLC
20Roberson and Associates, LLC Proprietary
3.3.4 AssumptionsReception of signals from other GNSS constellations will not be tested.
Access to KPIs or NMEA sequences is available and exportable to an external logging system.
3.3.5 AGPS KPI Measurement SequenceThe three AGPS tests listed in Section 2.1 are implemented as functions in an AGPS test controller. This controller controls the output of the GPS simulator while querying the cellular device for information about its current state and position.
3.3.6 Position Error KPI Measurement SequenceA pseudo-code description of the cellular device measurement sequence is listed below for position error KPI measurements. For each GPS condition (Motion Open) For each downlink frequency band (1531, 1675)MEASURE_KPI_SET()
For each uplink frequency band (1632, 1651) MEASURE_KPI_SET()
Calculate KPI averages and standard deviations for each LTE level
Roberson and Associates, LLC
21Roberson and Associates, LLC Proprietary
3.4 General Navigation Device Measurements
3.4.1 General Navigation SituationThe present tests will limit the maximum received LTE power to -10 dBm. Desired Goals
Characterize the KPI performance of the latest, high sales volume general navigation GPS devices.
3.4.2 Plan Measure high sales volume devices and capture and store detailed KPI data as function of LTE signal strength.
3.4.3 AssumptionsAccess to KPIs or NMEA sequences is available and exportable to an external logging system.
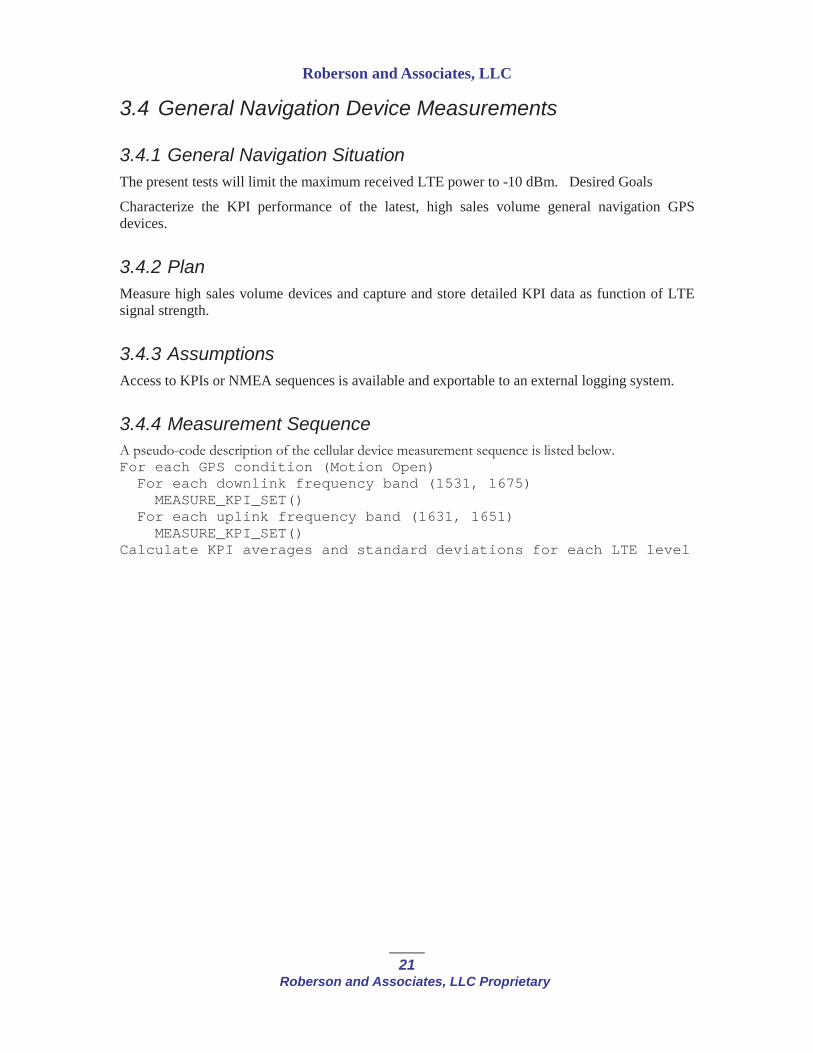
3.4.4 Measurement SequenceA pseudo-code description of the cellular device measurement sequence is listed below. For each GPS condition (Motion Open)For each downlink frequency band (1531, 1675)MEASURE_KPI_SET()
For each uplink frequency band (1631, 1651) MEASURE_KPI_SET()
Calculate KPI averages and standard deviations for each LTE level
Roberson and Associates, LLC
22Roberson and Associates, LLC Proprietary
4 TIME TO FIRST FIX (TTFF) AND GPS RE-ACQUISITION TESTING
Time to First Fix is an important KPI for users who transition in and out of GPS coverage and simultaneously in and out of LTE coverage. For example, a public safety user exiting a building could be exposed to a strong LTE signal at the same time the GPS receiver in his two-way radiois re-acquiring GPS signals. The presence of strong adjacent band signals may increase the TTFF. TTFF is tested under warm-start conditions which refer to how much information the GPS receiver already possesses about the satellites and the GPS system time.
The goal of re-acquisition testing is to determine and quantify differences in GPS re-acquisition time as a function of the presence of LTE adjacent band signals and the absence of these signals. The LTE signal levels will be selected to fall in a range above and below the level where significant position errors were observed. The reason for this is to conserve test time in part because TTFF may take several minutes in cold-start mode.
Re-acquisition refers to the situation where lock is lost and the GPS receiver tracking loops need to re-lock onto the GPs signal. If the outage is brief then re-acquiring satellite lock is also rapid.
To test re-acquisition the LTE signal needs to be applied at the level where loss of lock was observed.
4.1.1 AssumptionsAccess to a lock indicator is available to be able to determine when the GPS receiver has achieved lock.
4.1.2 TTFF PlanApply GPS signal only for 15 minutes to allow the device to load an updated almanac and lock to current (simulated) GPS time. Apply the LTE signal. Remove the GPS signal for at least a minute and then re-enable the GPS signal. Record the time until LOCK is indicated. Repeat the cycle of removing and re-enabling the GPS signal at least 5 times.
Calculate average TTFF vs. LTE power for a small set of LTE powers. The figure below illustrates the re-acquisition measurement sequence.
Roberson and Associates, LLC
23Roberson and Associates, LLC Proprietary
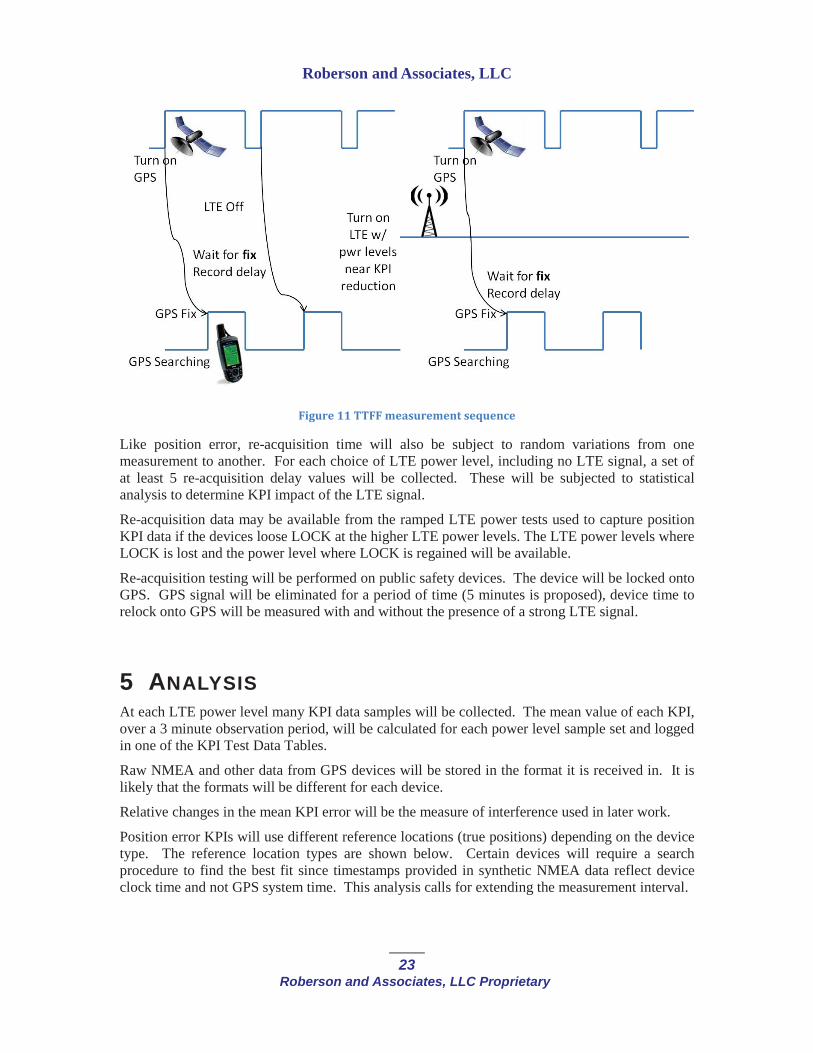
Figure 11 TTFF measurement sequence
Like position error, re-acquisition time will also be subject to random variations from one measurement to another. For each choice of LTE power level, including no LTE signal, a set of at least 5 re-acquisition delay values will be collected. These will be subjected to statistical analysis to determine KPI impact of the LTE signal.
Re-acquisition data may be available from the ramped LTE power tests used to capture position KPI data if the devices loose LOCK at the higher LTE power levels. The LTE power levels where LOCK is lost and the power level where LOCK is regained will be available.
Re-acquisition testing will be performed on public safety devices. The device will be locked onto GPS. GPS signal will be eliminated for a period of time (5 minutes is proposed), device time to relock onto GPS will be measured with and without the presence of a strong LTE signal.
5 ANALYSIS At each LTE power level many KPI data samples will be collected. The mean value of each KPI,over a 3 minute observation period, will be calculated for each power level sample set and logged in one of the KPI Test Data Tables.
Raw NMEA and other data from GPS devices will be stored in the format it is received in. It is likely that the formats will be different for each device.
Relative changes in the mean KPI error will be the measure of interference used in later work.
Position error KPIs will use different reference locations (true positions) depending on the device type. The reference location types are shown below. Certain devices will require a search procedure to find the best fit since timestamps provided in synthetic NMEA data reflect device clock time and not GPS system time. This analysis calls for extending the measurement interval.

Roberson and Associates, LLC
24Roberson and Associates, LLC Proprietary
GPS Condition Location Reference Static Static Simulator Reference Motion GPS Simulator Output Log Live Sky R9 Average AGPS GPS Simulator Internal
5.1 Statistical AnalysisIn order to translate the KPI vs. LTE signal level statistics collected in the measurements to a probability of GPS functionality impairment, analysis beyond device measurements is needed to determine the likelihood, frequency, and expected duration that a user will experience LTE levels that cause an increase in KPI standard deviation. Data is available from previous adjacent band compatibility testing, as well as from existing LTE networks that can be used to develop a statistical model for LTE signal levels experienced by GPS receivers under different LTE deployment plans. Comparison of these statistics and scenarios with the KPI sensitivities to LTE signal strength will produce an assessment of how often and how much the presence of the LTE network will impact user functionality.
6 CHANGE HISTORYVersion Date Description
V0.6 June 25, 2015 Preliminary Draft
V0.8 July 22, 2015 Added detail regarding 3GPP specific tests for cell phones
Updated Device List
Updated KPI Table
Updated GPS Impairments table
Added detail for pretest scenario: added un-impaired GPSpretest
V1.0 July 27,2015 Version 1.0
V1.1 August 24, 2015 Updates to warm start TTFF section in response to NPSTC.Updates to certified aviation section
V1.2 Sept. 28, 2015 Add WAAS testing
added note to test at higher LTE power in response to NPSTC.
Added re-acquisition test in response to NPSTC.
Updated testing diagrams.
Updated OOBE description

Roberson and Associates, LLC
25Roberson and Associates, LLC Proprietary
V1.5 February 5, 2016 Updated to reflect final test procedures
Updated device list. Certain devices could not be made to export KPI data. Aviation devices were removed.
Single ramp-up LTE signal level and GPS only intervals detailed..
Added detail regarding re-acquisition testing.