rwanda’s performance against mdgs. presentation outline 1 introduction rwanda’s performance...
TRANSCRIPT

Rwanda’s Performance against MDGs

Presentation Outline
2
Introduction
Rwanda’s Performance against MDGs (Status at a Glance and Key Drivers)

Introduction
3
The Millennium Development Goals (MDGs) are a set of eight interdependent goals aimed at reducing poverty and improving the quality of life, particularly of the rural poor, and represent a global partnership resulting from the Millennium Declaration at the UN’s Millennium summit of 2000.
193 United Nations member states and at least 23 international organizations agreed to achieve these goals by the year 2015.
The MDGs are internationally considered as benchmarks of the progress a country is making towards sustainable development.

4
Progress against MDGs

5
MDG 1: Eradicate Extreme Poverty & Hunger

Poverty levels are reducing….
6

With Food Security, malnutrition is being eradicated…
7

On track to eradicate extreme poverty and hunger
8
Status at a Glance
Indicator 2000 2005/6 2010/11 2015 Target Status
Poverty Head Count (%) 60.4 56.7 44.9 30.2 On track
Extreme Poverty Incidence 40.0 35.8 24.1 -
Prevalence of under 5 malnutrition (% Under weight)
24.3 18.0 11.4 14.5 Done
Child Malnutrition (% of under five children stunted)
42.6 51.0 43 (census 2012)
24.5 On track
Child Malnutrition (% of under five children wasted)
6.8 5.0 2.8 2 On track

MDG1: Eradicate Extreme Poverty & Hunger
Key Drivers
Pro Poor Programmes like;
The one-cow per poor family (Girinka)
Crop Intensification Program (CIP) that contributed to increased agriculture productivity
The Vision 2020 Umurenge (VUP) flagship program
Cup of milk per child and School feeding program.
The Ubudehe program that allows the community to be part of the solution to reduce their poverty

10
MDG 2: Achieve Universal Primary Education

MDG 2: Achieve Universal Primary Education
11
Status at a Glance
Indicator 2000 2005/6 2010/11 2015 Target
Status
Net enrollment (%) 72.6 86.6 96.6 (2013) 100 On track
Completion Rate in Primary
22.0 51.7 78.6 100 On track
Literacy rate of 15-24 year olds, women & men
- 60.1/71.5
64.7/75.7
100 On track
Key Driver;
Fee-free education up to the first 9 years of school with 6 of those years being primary schooling years. Now extended to cover 12 years of basic schooling, thereby including the entire secondary school cycle.

12
MDG 3: Promote Gender Equality and Empower Women

MDG3: Promote Gender Equality and Empower Women
13
Status at a Glance
Indicator 2000 2005/6 2010/11 2015 Target Status
Girls to boys ratio in primary
1.00 1.03 1.03 1.00 Done
Girls to boys ratio in secondary
0.51 0.81 0.93 1.00 On track
Proportion of seats held by women in national parliament (%)
26.0 48.8 64 (2013) 50 Done
Gender gap in literacy (15-24 Yrs)
- 0.99 1.02 1.00 Done
MDG 3: Promote Gender Equality and Empower Women
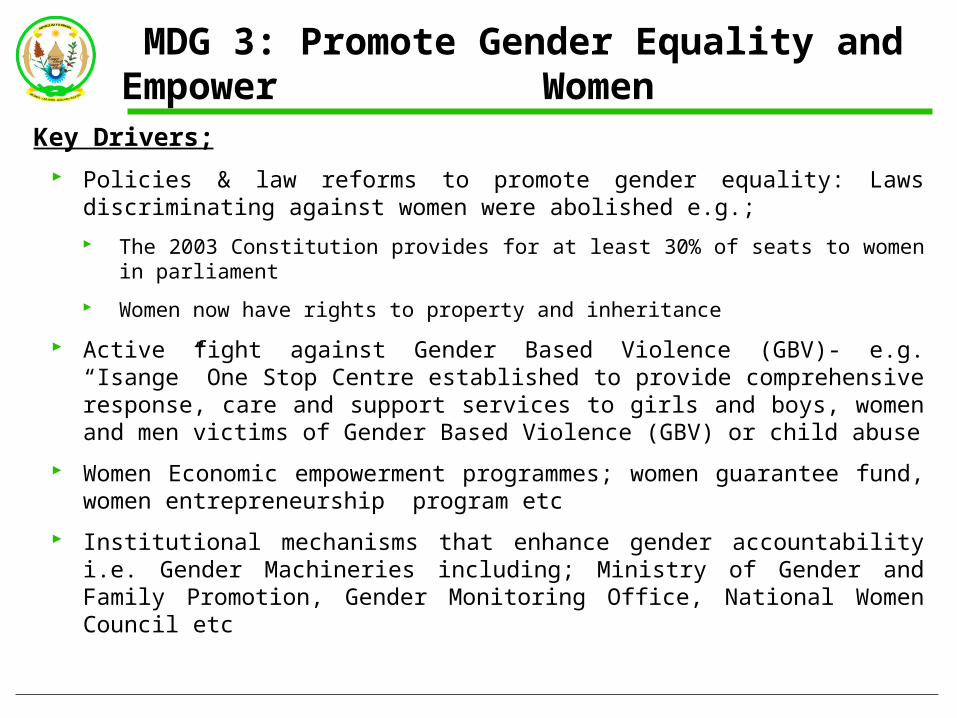
Key Drivers;
Policies & law reforms to promote gender equality: Laws discriminating against women were abolished e.g.;
The 2003 Constitution provides for at least 30% of seats to women in parliament
Women now have rights to property and inheritance
Active fight against Gender Based Violence (GBV)- e.g. “Isange” One Stop Centre established to provide comprehensive response, care and support services to girls and boys, women and men victims of Gender Based Violence (GBV) or child abuse
Women Economic empowerment programmes; women guarantee fund, women entrepreneurship program etc
Institutional mechanisms that enhance gender accountability i.e. Gender Machineries including; Ministry of Gender and Family Promotion, Gender Monitoring Office, National Women Council etc
15
MDGs 4 & 5: Reduce Child Mortality & Improve Maternal Health

MDGs 4 and 5: A Healthier Population
Maternal Mortality Under-Five Mortality

MDG 4 Reduce child mortality
17
Status at a Glance
Indicator 2000 2005/06 2010/11 Target 2015
Status
Infant mortality rate (per 1000 births)
107 86 50 28 On track
Under five mortality 196.0 152 76 50 On track
Proportion of one year old Children immunized against measles
87.0 85.6 95 100 On track

MDG 5 Improve Maternal Health
18
Status at a Glance
Indicator 2000 2005/06 2010/11 Target 2015
Status
Maternal Mortality Ratio (Deaths per 100,000 live births)
1071 750 476 268 On track
Proportion of births attended by skilled health personnel
31 39 69 - -
Contraceptive prevalence rate
4.3 16.3 45.1 - -
Unmet need for family planning
17.7 37.9 18.9 - -
Adolescent birth rate (% total live birth)
4.3 16.3 45.1 - -
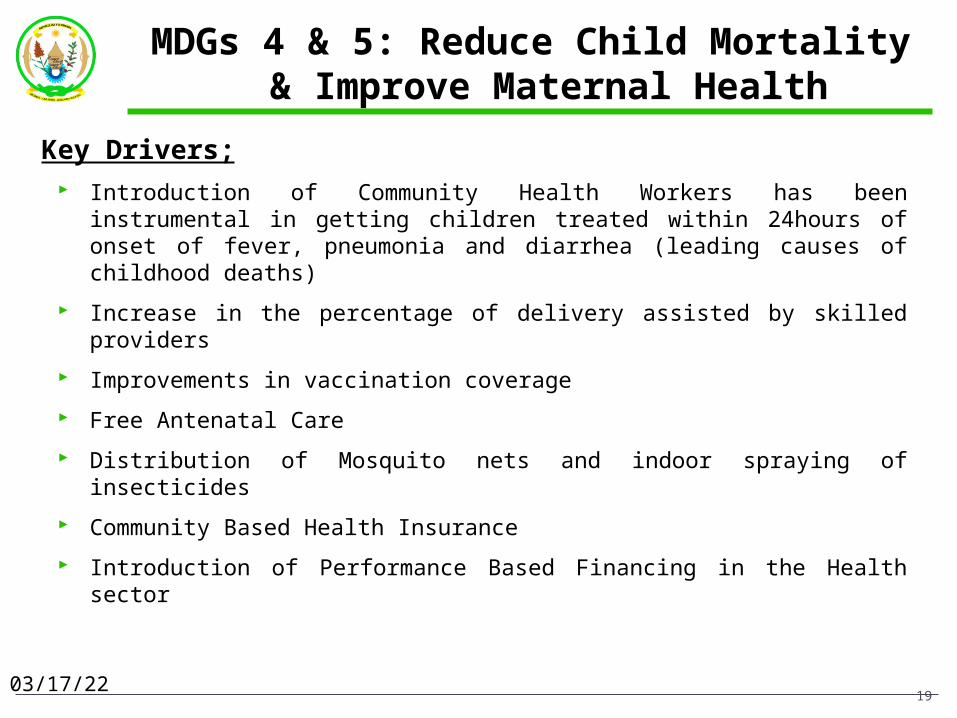
MDGs 4 & 5: Reduce Child Mortality & Improve Maternal Health
19
Key Drivers; Introduction of Community Health Workers has been instrumental in
getting children treated within 24hours of onset of fever, pneumonia and diarrhea (leading causes of childhood deaths)
Increase in the percentage of delivery assisted by skilled providers
Improvements in vaccination coverage
Free Antenatal Care
Distribution of Mosquito nets and indoor spraying of insecticides
Community Based Health Insurance
Introduction of Performance Based Financing in the Health sector
04/18/23
20
MDG 6: HIV / AIDS, Malaria & Other Diseases

MDG 6: HIV/AIDS, Malaria & other Diseases
21
Status at a Glance
Indicator 2000 2005/6 2010/11 2015 Target
Status
HIV prevalence in population aged 15-24 (%)
- 1.0 1.0 - -
Condom use at last high risk sex
Male 50.3 40.9 27.5 - -
Female 14.7 19.7 28.5 - -
Proportion of population aged 15-24 years with comprehensive correct knowledge of HIV/AIDS
Male - 53.6 47.4 - -Female - 50.9 52.6 - -
Ratio of school attendance of orphans to school attendance of non-orphans aged 10-14 years
0.80 0.92 0.91 - -

MDG 6: HIV/AIDS, Malaria & other Diseases
22
Status at a Glance
Indicator 2000 2005/6 2010/11 2015 Target
Status
Proportion of children under 5 sleeping under insecticide-treated bed nets
5.0 59.7 69.6 -
Proportion of children under 5 with fever who are treated with appropriate anti malaria
12.6 12.3 13.9 -
TB-related mortality per 100,000 persons
6 6 5 -
04/18/23

Mother-to-Child HIV Transmission Rate at 6 Weeks, 2005 -2010
23
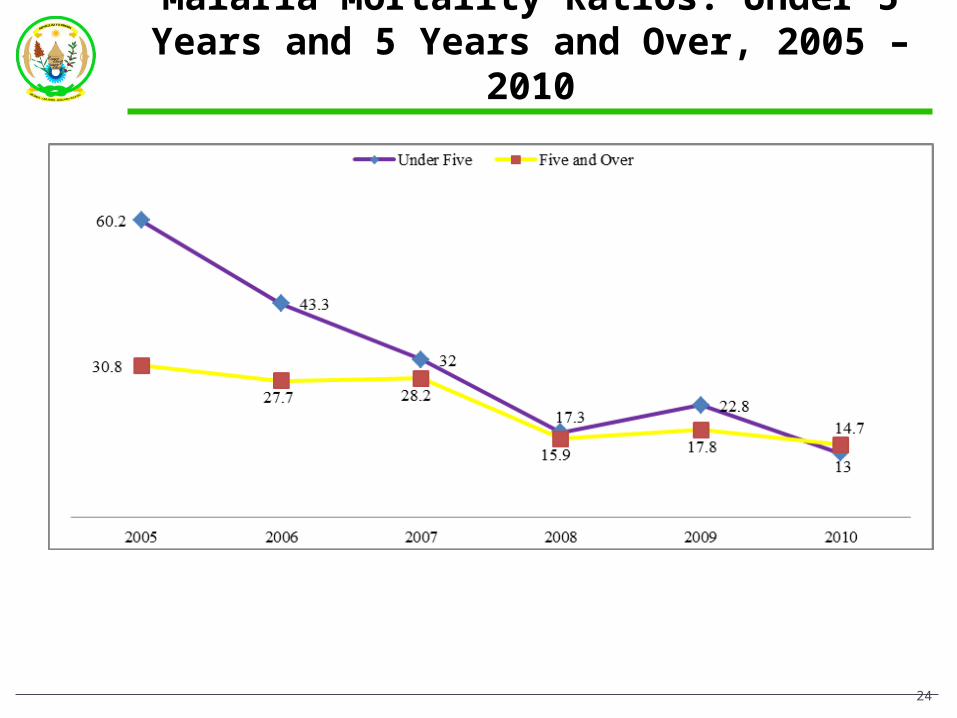
Malaria Mortality Ratios: Under 5 Years and 5 Years and Over, 2005 – 2010
24

MDG 6: HIV/AIDS, Malaria & other Diseases
Key Drivers; Access to ARVs increased to reach universal access (covered under
Mutuelles health insurance scheme)
Pregnant women and children under 5 getting free treated bed nets.
Prevention of Mother to Child transmission
Voluntary HIV Testing and Counseling Services

26
MDG 7: Ensure Environmental Sustainability

MDG 7: Environment Sustainability
27
Status at a Glance
Indicator 2000 2005/6 2010/11 2015 Target
Status
Land area covered by forests (%)
12.4 20 24.5 (2014)
25 On track
Terrestrial area protected (%) - 8 10.1 10 Done
Co2 emission per capita - 0.557 0.89 -
Proportion of population using an improved drinking water source
64.1 70.3 74.2 82.0 On track
Proportion of population using an improved sanitation facility
51.5 58.5 74.5 - -
04/18/23

MDG 7: Environment Sustainability
Key Drivers; Establishment of institutions to closely monitor & champion
environment protection e.g. Rwanda Environment Management Authority
Passing of laws determining the use and management of land
Preserving wetlands and forests
Banning of non-biodegradable plastic bags
Protection of river banks and lake shores
Tree plantation programs

29
MDG 8: Develop a Global Partnership for Development

MDG 8: Global Partnership for Development
30
Status at a Glance
Indicator 2000 2005/6 2010/11 2015 Target
Status
Debt Service as a percentage of export goods and services
- 8.0 10.13 10.0 Done
Mobile cellular subscriptions per 100 inhabitants
- - 65 (2014) - -
04/18/23
MDG 8: Global Partnership for Development
31
Key Drivers;
Rwanda is a member of;
Key regional and international organizations: e.g. the AU, EAC, COMESA ,CEPGL and Commonwealth.
Has international trade agreements such as those with the EU and USA.
Built partnerships with development partners to enhance mutual accountability
Doing Business Reforms
Leveraging ICT to unblock the country’s landlockedness e.g.;
Rwanda signed an MOU with Korea Telecom (KT) in 2013 to deploy a high-speed (4G LTE ) broadband network to cover 95 per cent of the population in three years.
Liberalization of mobile telecommunication industry

THANK YOU