efficiency of mineral processing in rwanda’s artisanal and
TRANSCRIPT

Effi ciency of Mineral Processing in Rwanda’s Artisanal and Small-Scale Mining Sector Quantitative Comparison of Traditional Techniques and Basic Mechanized Procedures
Imprint
Commissioned by: Bundesanstalt für Geowissenschaften und Rohstoffe(Federal Institute for Geosciences and Natural Resources)Stilleweg 230655 HannoverGermany
Authors: Julian Heizmann (XtraCon Ltd & Co KG), Mirko Liebetrau (BGR)
Contributions from: Alain Joseph Ntenge, Léonard Ndagijimana, Alexis Kagaba (RNRA/GMD)
Contact: Mirko Liebetrau, Philip Schütte Bundesanstalt für Geowissenschaften und Rohstoffe Stilleweg 2 30655 Hannover [email protected]
Date: February 2017
ISBN: 978-3-943566-86-4 (PDF)
Cover Photographs: © Bundesanstalt für Geowissenschaften und Rohstoffe
Copyright: © 2017 Bundesanstalt für Geowissenschaften und Rohstoffe

Effi ciency of Mineral Processing in Rwanda’s Artisanal and Small-Scale Mining Sector Quantitative Comparison of Traditional Techniques and Basic Mechanized Procedures
By Julian Heizmann, Mirko Liebetrau
Kigali, February 2017

Efficiency of Mineral Processing in Rwanda’s Artisanal and Small-Scale Mining Sector
III
Efficiency of Mineral Processing in Rwanda’s Artisanal and Small-Scale Mining Sector – Quantitative Comparison of Traditional Techniques and Basic Mechanized Procedures Citation
Please cite this report as “Heizmann, J. & Liebetrau, M. (2017): Efficiency of Mineral Processing in
Rwanda’s Artisanal and Small-Scale Mining Sector – Quantitative Comparison of Traditional
Techniques and Basic Mechanized Procedures. ISBN 978-3-943566-85-7, Contract study for the
Federal Institute for Geosciences and Natural Resources (BGR).”
Published by Bundesanstalt für Geowissenschaften und Rohstoffe, 2017. All rights reserved. This
publication, or parts thereof, may not be reproduced in any form without the written permission of the
publisher.
Copyright © 2017 by Bundesanstalt für Geowissenschaften und Rohstoffe, Hannover, Germany.
Acknowledgements
Special acknowledgements are due to the miners and mine managers supporting sampling activities
for this study, as well as to Phoenix Metal Ltd., Kigali, for providing labor and the mechanic
processing facilities. Acknowledgements are also due to a range of interlocutors in Rwanda,
particularly those from the Rwandan government and the mining sector, who have spared both time
and effort to facilitate the study. This study was compiled for BGR as part of the Rwanda
implementation component of the German support program to the ICGLR implemented by BGR and
funded by the Federal Ministry for Economic Cooperation and Development (BMZ).
About this Report
Artisanal and small-scale mining in Rwanda often involves manual mineral processing techniques at
the mine site. It is commonly known that these traditional processing techniques tend to be inefficient
and, depending on the style of mineralization, may lead to loss of ore particles of economic interest
to the tailings or waste fractions. Usually, mineral concentrates are only upgraded to export grade
once the product reaches Kigali. At this stage, valuable ore components may have already been lost
due to inefficient processing at the mine level. The present study was commissioned by BGR in
partnership with the Rwanda Natural Resources Authority in order to evaluate the extent of this issue
at a pilot scale. The study sampled representative selection of Rwandan ASM operations (cassiterite,
coltan and wolframite) and quantifies the efficiency of both traditional mineral processing and
mechanized procedures. Further, the study evaluates and compares the economic impact of these
different processing approaches at the mine level.
About the BGR Module of the German Support Program to the ICGLR
The regional German support program to the International Conference on the Great Lakes Region
(ICGLR) is implemented both at the regional and at the national level of selected ICGLR member
states. As one of the key countries in the ICGLR process, BGR has supported Rwanda since 2011
in implementing the Regional Certification Mechanism and in formalizing the artisanal and small-
scale mining sector. BGR’s long-time project partner in Rwanda used to be the Rwanda Natural
Resources Authority which recently underwent organizational restructuring into the Rwanda Mines,
Petroleum and Gas Board. The BGR project runs until 2019; more information can be found at
www.bgr.bund.de/mineral-certification.

Efficiency of Mineral Processing in Rwanda’s Artisanal and Small-Scale Mining Sector
IV
Abbreviations 3T Tungsten (W), Tin (Sn), Tantalum (Ta) ores
Al Aluminum
As Arsenic
ASM Artisanal and Small-Scale Mining
BGR German Federal Institute for Geosciences and Natural Resources
Fe Iron
Fe2O3 Hematite
Fe3O4 Magnetite
FeWO4 Ferberite
G&A General and Administrative Expenses
GMD Geology and Mines Department
ICGLR International Conference on the Great Lakes Region
K Potassium
MLA Mineral Liberation Analysis
MnWO4 Hübnerite
NPV Net Present Value
ppm Parts per million (same as grams per ton)
QEMSCAN Quantitative Evaluation of Minerals by Scanning Electron Microscopy
RINR Regional Initiative Against the Illegal Exploitation of Natural Resources
RNRA Rwanda Natural Resources Authority
ROM Run of Mine
RWF Rwandan Franc (in this report: 1 USD = 781 RWF)
Si Silicon
SnO2 Cassiterite
Ta Tantalum
Ti Titanium
USD US Dollar

V
Glossary Alteration Transformation of a mineral’s chemical composition and physical properties
induced by weathering
Barren Rock Material of no or low economic value contained in the ROM which has to be separated from target minerals, also referred to as waste/waste material
Cleaner stage Reprocessing stage of a multi-stage process. Usually reprocessing of the concentrate fraction of a rougher stage
Comminution Comminution is the process of reducing the grain size of a particle for example by crushing or grinding
Concentrate Enriched product of processing, mostly heavy fraction of a final processing stage, containing a high grade of target minerals which allows for further beneficiation
d50 Refers to particle size distribution, specifically the mesh (diameter) where 50 % of the sample mass is passing the screen
Density/specific gravity particle mass divided by particle volume
Feed Ore which is treated in the processing
Grade/G Amount of target minerals in a sample in percent with regard to total sample mass
Intergrown ref. Interlocked
Interlocked Opposite of liberated particles. Interlocked grains are valuable mineral grains (target minerals) that are still connected to a matrix of uneconomic minerals (barren rock)
Liberation Liberated grains are those which only consist of a single mineral and are not connected to others
Magnetic susceptibility Measure of intensity of magnetic properties of the material Ore Naturally occurring rock composed of gangue and minerals
containing metals, which can be extracted economically
Recovery rate
Recovery rate is the amount of target minerals that is sorted to the concentrate fraction in percent of the total of target minerals contained in the feed. The fraction of target minerals not recovered in the concentrate is lost to the tailings.
Rougher stage First processing stage of multi-stage process. Usually to pre-concentrate a feed
Run of mine (ROM) Raw material (ore) that is produced in a mine, before any processing (upgrading) takes place.
Scavenger stage Reprocessing stage of a multi-stage process. Usually reprocessing of the waste fraction of a rougher stage
Slimes ultrafine particles that get suspended in water
Sorting Process of separation material by its physical properties (ref. to density sorting)
Tailings Waste material from the light fractions of the processing stages, containing not recovered target minerals
Target Minerals Minerals of economic value which are to be extracted from ore. For the purpose of this report, target minerals are cassiterite, wolframite and tantalite (coltan), the “3T” ores.
Timbering Supporting tunnels and other underground facilities with wooden pillars or other constructions from wood
Washing pan Conical vessel for density sorting
Efficiency of Mineral Processing in Rwanda’s Artisanal and Small-Scale Mining Sector

Efficiency of Mineral Processing in Rwanda’s Artisanal and Small-Scale Mining Sector
VI
Executive Summary Mineral exports provide a major share to the export revenues of Rwanda. In 2015, 55 % of forex
income generated by principal exports were related to mineral resources. While the sector is currently
pushing towards new prospects of different nature like gemstones and iron ore, the 3T (Tin, Tungsten
and Tantalum) minerals have been the most important products of Rwandan mining operations since
the 1930s. Ore concentrates of 3T minerals provided 79 % of total mineral exports from Rwanda in
2015. The Government therefore considers mining as one of the key sectors to drive economic
development and poverty reduction.
While there are few medium-scale mining operations, the major share of Rwanda’s total mineral
production is generated by artisanal and small scale mining (ASM) operations. These small
operations tend to use manual mining methods, with few or no mechanized mining equipment. This
labor-intensive approach provides significant employment for low-skilled workers and gives benefits
in terms of flexibility and applicability, considering challenges related to fluctuating mineral markets
and infrastructural conditions. However, this mining practice is also thought to be inefficient and
unstructured. Apart from deficits in geological knowledge about deposit size and the occurrence of
target minerals of economic interest, small-scale operations often do not monitor operational data
sufficiently, except for the quantities of produced and sold mineral concentrate. Acquiring sufficient
data in order to evaluate and improve single stages of the mine workflow can therefore be
challenging.
Apart from the ore deposit’s size and accessibility of the ore body, mineral processing is known to
be a major impact factor for the economic feasibility of mining operations. Even though a deposit
might contain good ore grades, it will not be considered feasible if the contained valuable minerals
cannot be separated from barren rock and gangue to produce a marketable mineral concentrate.
Hence, every professional mining operator includes a detailed test series and review of the planned
processing scheme in feasibility planning of a mining operation. For such industrial operations the
processing efficiency and recovery rate is therefore evaluated before the actual production starts.
Due to low financial investment and lack of management competence in certain key areas (such as
exploration and mine planning), ASM operations tend to lack substantial knowledge on the deposit
characteristics and the expected production capacities. A proven concept to optimize mineral
processing at the deposit scale is often not available, implying risks for losing target minerals of
economic interest in the process. Importantly, any theoretical mineral processing concept also needs
to consider practical and economic feasibility based on the individual mining operation. Making
uninformed investment decisions with regards to mineral processing equipment might otherwise
imply the risk for the investor to lose money.
This study is based on a concept developed by the Geology and Mines Department (GMD) of the
Rwanda Natural Resources Authority (RNRA) in partnership with the Federal Institute for
Geosciences and Natural Resources of Germany (BGR). The study’s objective is the quantitative
comparison of the efficiency and economic impact of both artisanal and basic mechanical mineral
processing procedures. The processing efficiency in terms of recovery rates, throughput and
operational expenditures of artisanal and mechanical processing procedures are assessed. Further
evaluation of cost effectiveness of the competing processing approaches is done based on a detailed
appraisal of operating data of three mine sites selected as case studies for this analysis. As part of
the study assignment, two RNRA counterparts received on-the-job training and were directly involved
in all sampling activities and processing tests overseen by the contracted consultant and BGR.

Efficiency of Mineral Processing in Rwanda’s Artisanal and Small-Scale Mining Sector
VII
The team participating in this research identified three representative ASM operations, which meet
different operation sizes and concepts, as well as the main ore types found in Rwanda. Two of the
selected mines are mining deposits of pegmatite-hosted mineralization, one producing a cassiterite
concentrate (Mine 1) and the other producing a mixed cassiterite and tantalite (coltan) concentrate
(Mine 2). The third mine produces a wolframite concentrate from hydrothermal mineralization in
quartz veins. Between 800 kg and 1,400 kg of bulk samples were taken from run of mine material
(ROM) of the three mines. Miners homogenized and split the bulks representatively into two sub-
samples each. For each mine one sub-sample was treated with artisanal processing measures while
the other sub-sample was processed at a mechanical plant. During the processing tests all
recoverable products of individual processing steps were sampled. The chemical and physical
analysis of these samples allowed for a thorough evaluation of the processing tests.
For all mines the properties of the sampled ROM were identified. It was found that the two pegmatite
ores, while showing slight differences in mineralogical composition, varied broadly in terms of their
grain-size distributions. Further, within the different grain size fractions, the target elements of
economic interest showed fundamental disparities in individual distribution. For mine 1 (cassiterite)
the target minerals were distributed mainly in medium-sized and coarse fractions of the ROM. In
contrast, the material of mine 2 (mixed Sn-Ta) showed an intense concentration of target minerals in
fine grain-sized fractions. For Mine 3 (wolframite), target elements were found to be mainly contained
in very coarse grain-size fractions.
Artisanal processing tests were performed according to the typical procedure of regular mining
operations. Density sorting was the major processing technique, as it is the most common
concentration approach for the targeted minerals. At the artisanal operations density sorting was
applied in washing pans (Mine 1 - cassiterite) and ground sluices. Mine 2 (mixed Sn-Ta) used a linear
ground sluice, formed as an artificial stream with multiple stages. Mine 3 (wolframite) implemented
density sorting in a circular ground-sluice and washing pans. These “traditional” processing
techniques were compared to a set of mechanical processing steps kept consistent for all three
mines. Density sorting in the mechanical processing schemes was applied by shaking tables and in
one case (mine 3 – wolframite) by a spiral concentrator as a pre-sorting stage. Additionally to the
density sorting measures, a magnetic separator was used to clean and separate the final products
of the mechanical tests. It should be emphasized that the employed mechanical processing approach
suffered from the density sorting equipment not being sufficiently adjustable. Therefore, the
mechanized processing tests are considered to give a basic indication, rather than optimized results.
The artisanal processing tests demonstrated no or little preparation of the ore (ROM) prior to density
sorting. The operational scheme of Mine 1 (cassiterite) included hand-picking of coarse tailings
followed by comminution of the grains which have been considered to be rich in target minerals. In
contrast, for the mechanical processing intensive preparation steps were applied prior to density
sorting. The ore material was screened with mesh sizes of 2 mm or 3 mm, depending on its
properties. Over-sized grains were comminuted by different measures. However, while such
preparation steps are necessary to properly operate mechanical processing equipment, they might
be negligible for artisanal processing techniques; but probably result in a decreased recovery rate.
The results of the processing tests showed different outcomes reflecting different mineralization
styles and ore characteristics. While artisanal and mechanical processing schemes both proved to
be efficient for the ROM of mine 1, recovery rates and concentrate grades achieved for mine 2 and
mine 3 can be considered as insufficient. However, in two out of three tested cases mechanical
processing outperformed artisanal processing. This is remarkable given that the artisanal processing
schemes have been used for the respective materials for a long time, while the mechanical
processing approach was a first and not optimized concept.

Efficiency of Mineral Processing in Rwanda’s Artisanal and Small-Scale Mining Sector
VIII
The gathered operational data in combination with the quantitative outcomes of the processing tests
were processed for economic case studies. Annual profit and net present value of individual mines
for ten years of operation were calculated in different market scenarios regarding pricing of the
produced minerals. For the mechanical processing, investments in different types of equipment was
simulated in order to evaluate the cost effectiveness of such investments.
The combined evaluation of raw material, processing schemes, operational data and financial
analysis allowed for an integrated interpretation of the findings. Apart from inefficiencies of the actual
processing tests, further implications on unfavorable surrounding conditions could be identified. The
basic results for the processing tests and economic calculations are shown in the table below. As
can be seen, in most cases, mechanical processing schemes led to higher concentrate grades and
profits than manual artisanal processing schemes.
Feed # Processing Ore Type Feed Grade Concentrate
Grade
Recovery rate
of target
mineral
Profit/
loss
[USD/a]
Mine 1 Artisanal
Cassiterite 2.17% SnO2
68.51% SnO2 60.10% SnO2 113,000
Mechanical 71.19% SnO2 72.84% SnO2 127,000
Mine 2
Artisanal Mixed
Sn-Ta
0.46% SnO2
0.20% Ta2O5
41.26% SnO2
9.90% Ta2O5
24.50% SnO2
13.40% Ta2O5 65,000
Mechanical 36.32% SnO2
10.20% Ta2O5
16.95% SnO2
10.97% Ta2O5 46,000
Mine 3 Artisanal
Wolframite 0.50% WO3
21.41% WO3 22.32% WO3 -12,000
Mechanical 34.07% WO3 26.02% WO3 -400
Annual profits and losses refer to calculations at the current (2015) mineral pricing scenario.
Results in the table show two notable features. First, for mine 2 artisanal processing was found to be
more efficient, leading to a higher profit for application of artisanal compared to mechanized
measures. When analyzing the properties of the ore of mine 2 it was found that the major share of
target minerals are contained in the fine grain size fractions. Even though mechanical processing
proved to be able to recover a larger share of the fine grained material, it was not able to outperform
the artisanal approach in this case. However, it is most likely that a detailed adjustment of operating
parameters (calibration) of the mechanical equipment would lead to a significant increase in
processing performance. The outcome of the mechanical processing tests should therefore be
considered as low-case scenarios. The second anomaly is the apparent lack of profitability of mine
3. The results show an investment in mechanical processing equipment would be beneficial, but still
not profitable with regards to the feasibility of the whole operation. Mine 3, being the smallest of the
sampled operations, had already reduced mining activity due to low profitability of the operation, prior
to the field work for this study. The mine’s negative profitability inferred from the above model
calculations can therefore be assumed to be accurate.

Efficiency of Mineral Processing in Rwanda’s Artisanal and Small-Scale Mining Sector
IX
Findings of this study include hands-on solutions as well as more sophisticated recommendations.
Small-scale miners should in any case apply comminution to coarse-grained ore particles instead of
considering them as waste. Chemical analysis demonstrated that coarse grains rejected by artisanal
miners due to their supposed low value and not containing significant target minerals still comprised
substantial amounts of ore target minerals. Other operations did not even process or evaluate coarse
grains, partly leaving major shares of the total contained target minerals unprocessed and
unrecovered and, hence, lost as “waste”.
As the table above indicates, two out of the three artisanal operations recovered far less than half of
the target minerals contained in the processed ore. Therefore, most target minerals are left in the
tailings of artisanal processing. It remains to be clarified whether target minerals are recoverable
from tailings by additional processing. However, in any case, the tailings as well as coarse-grained
waste material should be considered a potential asset and, therefore, be stored properly. A waste
management concept would allow reprocessing of prospective materials at a later stage, while
decreasing environmental impacts such as erosion and siltation of surface waters.
As the previous two points are giving advice on artisanal processing practices, mechanization of
mineral processing in Rwanda was found to be potentially beneficial to reduce losses in the
processing of ores. However, regarding the implementation of mechanical processing, various
challenges were found. Firstly, the infrastructural conditions on most ASM sites are not necessarily
suitable to put mechanical processing equipment in place. Apart from sufficient and steady electricity
and water supply, mechanical processing equipment is in need of a minimum amount of raw material
to be processed constantly. Especially smaller operations will be challenged to constantly deliver
sufficient amounts of ore feed. A solution to this problem might be a centralized processing plant,
which can be supplied with material from different mine sites to work continuously and cost efficient.
However, as is proven in this study, the evaluation and testing of a suitable processing scheme is
critical, prior to investing in processing equipment. Unfortunately, the number and availability of
analytical equipment as well as laboratory scale processing equipment is very limited in Rwanda. To
accelerate implementation of advanced processing equipment the accessibility of such equipment
needs to be improved. The establishment of a testing plant, including analytical equipment for
evaluating and fine-tuning the performance of different processing schemes, should therefore be
considered.
The availability of local testing and analytical equipment would further be beneficial for assessing
potential secondary deposits related to storage sites of artisanal waste and tailings. When planning
to reprocess waste material, detailed processing tests and chemical analysis should be applied in
combination with geological evaluation. There are already a number of such prospects in place.
Mining was introduced to Rwanda at the beginning of the 20th century. Since then, numerous small-
and medium-scale operations have produced tailings and waste, some of which have been stored
properly whereas others have been dumped unsystematically. There are already examples for
industrial reprocessing of waste sites implemented in Rwanda. Further understanding and unlocking
the mineral potential of historic mine waste and tailings could hence play an important role in
accentuating the mining sector’s economic development potential in Rwanda.

Efficiency of Mineral Processing in Rwanda’s Artisanal and Small-Scale Mining Sector
X
Table of Content
1. Introduction .................................................................................................................................... - 1 -
2. Features of Rwandan Geology and 3T Ore Deposits ........................................................... - 3 -
3. Methodology .................................................................................................................................. - 5 -
3.1 Limits of Data Acquisition and Test performance ........................................................... - 5 -
3.2 Mine Site Selection and Evaluation ................................................................................ - 7 -
3.3 Sampling and Sample Analysis .................................................................................... - 10 -
3.4 Artisanal Processing ..................................................................................................... - 11 -
3.5 Mechanical Processing Techniques ............................................................................. - 15 -
3.6 Economic analysis ........................................................................................................ - 21 -
4. Description or Raw Material Samples (ROM) ....................................................................... - 22 -
4.1 Grain Size Distribution .................................................................................................. - 22 -
4.2 Distribution of Target Minerals ...................................................................................... - 23 -
4.3 Composition of the Samples and Grain Properties ...................................................... - 25 -
5. Evaluation of Artisanal Processing Methods ....................................................................... - 28 -
5.1 Artisanal Processing at Mine 1/Cassiterite ............................................................... - 28 -
5.2 Artisanal Processing at Mine 2/Mixed Sn-Ta ............................................................ - 29 -
5.3 Artisanal Processing at Mine 3/Wolframite ............................................................... - 30 -
6. Evaluation of Mechanical Processing Tests ......................................................................... - 32 -
6.1 Mechanical Processing of ROM 1/Cassiterite .............................................................. - 33 -
6.2 Mechanical Processing of ROM 2/Mixed Sn-Ta ........................................................... - 35 -
6.3 Mechanical Processing of ROM 3/Wolframite .............................................................. - 36 -
7. Review of Mineral Processing Performance ......................................................................... - 37 -
7.1 Performance of Processing Tests ROM 1/Cassiterite .................................................. - 39 -
7.2 Performance of Processing Tests ROM 2/Mixed Sn-Ta .............................................. - 42 -
7.3 Performance of Processing Tests ROM 3/Wolframite .................................................. - 45 -
8. Economic Analysis .................................................................................................................... - 48 -
8.1 Profitability Mine 1/Cassiterite ...................................................................................... - 50 -
8.2 Profitability Mine 2/Mixed Sn-Ta ................................................................................... - 54 -
8.3 Profitability Mine 3/Wolframite ...................................................................................... - 57 -
9. Conclusions ................................................................................................................................. - 60 -
10. Recommendations ..................................................................................................................... - 64 -
References ........................................................................................................................................... - 66 -
Annex .................................................................................................................................................... - 70 -

Efficiency of Mineral Processing in Rwanda’s Artisanal and Small-Scale Mining Sector
- 1 -
1. Introduction
In 2015 mineral exports accounted for 55 % of the revenues for principal export from Rwanda. During
the very same year, minerals of the so called 3T group provided 79 % of these exports. The artisanal
and small-scale mining (ASM) sector in mostly rural areas generated a major share of the nation’s
mineral production. Therefore, a remarkable percentage of Rwanda’s foreign exchange income is
generated, and a major contribution to the national economy is done by ASM. Hence, with improved
mining practices and stability of this sector the employment rate can be increased, poverty reduced
and steady forex income generated for the Republic of Rwanda.
Small scale mining is characterized by low-tech and low-investment operations. Even though this
sector exists since ancient times, practices and protocols have changed little. Apart from a lack of
knowledge about geological features of the exploited deposits, mining practices are often
unstructured and exploitation concepts are missing. Furthermore, one of the main disadvantages
when it comes to developing ASM operations is the lack of operational data regarding production.
The monitoring of ASM operations done by the mine managers is often limited to the costs for labor
and the quantity of produced concentrates. For improving mining practices, additional monitoring and
data is necessary. For example, as long as there is no knowledge about the amount of ore which
has been processed, the efficiency of artisanal processing cannot be evaluated.
Focusing on improving mining practices in ASM, the Rwanda Natural Resources Authority / Geology
and Mines Department (RNRA/GMD) in cooperation with the Federal Institute for Geosciences and
Natural Resources of Germany (BGR) developed a concept to attempt a first evaluation of
processing efficiency in the national ASM sector. This research aims to gain further understanding
of ASM activities in the region to support the implementation of the Regional Initiative against the
Illegal Exploitation of Natural Resources (RINR) of the International Conference on the Great Lakes
Region (ICGLR). BGR is supporting the national Authorities of Rwanda in charge of Natural
Resources in their efforts to improve mining practices, implement Due Diligence measures and
formalize the ASM sector, since 2008. The cooperation started with the very first regulatory body of
the mining sector in Rwanda, the Rwanda Geology and Mines Authority (OGMR), and continued with
the development of the Geology and Mines Department (GMD). During this partnership several
studies have been conducted to assess the status and characteristics of the national ASM sector.1
The study at hand reports on the implementation of the latest concept developed by GMD and BGR.
It compares processing methods of ASM with basic mechanical processing techniques. The intention
to conduct this study is based on the assumption that artisanal processing measures are leaving
mentionable amounts of target minerals in artisanal tailings, mostly left to erosion. Therefore, it was
tested if mechanical processing measures are capable to decrease losses of target minerals during
the first mineral beneficiation steps. Additionally, potential financial gains from applying improved
processing equipment have been evaluated.
1 http://www.bgr.bund.de/EN/Themen/Min_rohstoffe/CTC/Mineral-Certification-Rwanda/Downloads/downloads_rw_node_en.html

Efficiency of Mineral Processing in Rwanda’s Artisanal and Small-Scale Mining Sector
- 2 -
In order to compare the efficiency of artisanal and mechanical processing methods, processing tests
have been carried out with both processing approaches. For the artisanal tests, the traditional
processing measures have been carried out on the ASM sited. Afterwards, basic mechanical
processing schemes have been applied to the run of mine material (ROM), sampled from the very
same production as for the artisanal tests. The potential set-up of mechanical equipment was
matched to be suitable for application in medium sized ASM operations. Therefore, rather than the
maximization of possible recovery rates, a decrease in losses of target minerals was sought.
To allow an integrated view, the study gives a basic introduction to the geological features of
Rwandan 3T deposits and the main minerals which are mined in ASM. As all test and sampling
campaigns aim to cover a representative share of the whole issue, selection of representative mine
sites was a major part of the preparations for this study. Apart from geological properties of potential
mine sites, operational data and production practices have been taken into account.
In order to generate a common understanding of reviewed processing measures, observed and
applied techniques will be introduced briefly to the reader in the methodology part of this study. To
further evaluate the performance of the processing tests, detailed knowledge of mineralogical and
physical properties of the processed material is necessary. Therefore, the processed material was
analyzed with chemical and physical methods to allow for a discussion of its properties and
characteristics. Following the findings of this discussion, the performance of the processing tests will
be presented and discussed.
The research closes in an economic analysis, based on the findings of the processing tests and
gathered operational data of the involved ASM operations. Calculations for this analysis considers
different processing approaches (artisanal and different mechanical set-ups) in different mineral
pricing scenarios to evaluate the economic feasibility of the operations and potential investments in
mechanical processing equipment.
The conclusive review of all tests, findings and calculation led to a number of implications for points
of improvement of the current practices. While some recommendations refer to the general situation
and facilities in the Rwandan ASM sector, others might be easy and quick to implement under current
surrounding conditions. Hence, this study provides a baseline to access points of further interest and
basic recommendation for improving mining practices and will hopefully proof to be beneficial to the
national ASM sector.

Efficiency of Mineral Processing in Rwanda’s Artisanal and Small-Scale Mining Sector
- 3 -
2. Features of Rwandan Geology and 3T Ore
Deposits
Rwanda is situated north east within the Kibara Belt which is evolved between two pre-
Mesoproterozoic domains: Firstly, the Archaean-Palaeoproterozoic Congo Craton to the West, and
secondly the Archaean-Palaeoproterozoic Tanzania Craton to the East and South. Recently, Tack
et al. subdivided the traditionally known Kibara Belt into two segments of the same age: the Karagwe-
Ankole Belt (KAB) (Rwanda, Burundi, Maniema and Kivu in the DRC) and the Kibara Belt (type area
Katanga region DRC). The two segments are separated by the palaeoproterozoic Rusizian terrane
which is an extension of the NW-SE trending Palaeoproterozoic Ubende Belt in Tanzania (Tack,
2010). Figure 1 shows a simplified sketch map.
The stated area is hosting a large
metallogenic province of numerous ore
deposits, e.g. such as Nb, Ta, Sn, W, Au.
Also, there are good signs indicating the
presence of base metals. The origin is
discussed either as granite related or as
metamorphogene.
The mentioned mineralization occurs in
different styles as primary granitic
pegmatite, quartz vein/ shear zone hosted
in different metasediments or sediment
related as secondary deposits (placers,
either alluvial, eluvial, or colluvial), and in
lateritic environments.
The basic ore geology of the Kibaran has
been summarized by W. Pohl (Pohl, 1987)
and re-evaluated by Biryabarema, Pohl
and Lehmann (Pohl et al., 2013) in three
types as follows.
Basic ore geology of the Kibaran Belt:
1. Pegmatite hosted tin and tantalum mineralization,
2. Hydrothermal tin and tungsten mineralization in quartz veins, and
3. Hydrothermal gold quartz vein and breccia related mineralization.
Figure 1: Sketch Map of the “Kibara Belt senso lato”,
showing the General NE–SW Extension of the Belt

Efficiency of Mineral Processing in Rwanda’s Artisanal and Small-Scale Mining Sector
- 4 -
Kibaran pegmatites were found to carry mainly Nb, Ta, Sn, Li, Rb, REE, Cs, and Be. Varlamoff
described in detail the pegmatites and their mineralogy in relation to the granite cupolas in Rwanda
(Varlamoff, 1972). Hydrothermal alteration and subsequent kaolinization is assumed to be the major
driver for these occurrences. In Rwanda, most economically important pegmatites can be classified
as LCT- type pegmatites (Li-Cs-Ta bearing).
The hydrothermal Sn- and W- quartz mineralization occurs in veins and veinlets forming stockworks
and vein fields. Positioning is clearly controlled by anticlines and domes which acted as anticlinal
fluid traps. Target mineral concentrations here tend to increase towards the contact zone of veins
and host rock. The major vein fields are found separated from the pegmatite districts. However, rare
transition zones of both mineralization were described, as well (Varlamoff, 1972). As a matter of fact,
the major tin districts (Tin Belt) are clearly separated from the tungsten districts (Tungsten Belt).
Mineralization of quartz veins do differ in size of mineralized crystals. Mostly, the thicker the vein, the
higher the chance for coarse grained minerals. However, for pegmatites associated properties could
be observed. Depending on the intensity of alteration and kaolinization, occurring target minerals
differ in size. A more intensely altered pegmatite tends to bear smaller grained barren rocks and
target minerals.
Cassiterite
Cassiterite (SnO2) is the world’s primary tin ore. Cassiterite has a yellow brownish to black color and
a light brown to light grey streak. It crystalizes tetragonal and fractures subconchoidal to uneven.
Cassiterite is brittle with a Mohs-scale hardness of 6-7. The main sorting criterion that will be used
within the test series is its high specific gravity of around 7 g/cm³. A secondary sorting criterion is the
nonmagnetic property of cassiterite, which allows separation from other ferro- or paramagnetic dense
minerals, notably tantalite. Tin is used mainly for the production of solder, tin plating as well as diverse
chemicals and pigments. The economic unit to determine the value of cassiterite concentrate is Sn.
Wolframite
Wolframite ((Fe, Mn)WO4) is an iron manganese tungstate mineral. It is a mixture of the minerals
ferberite (Fe2+-rich) and huebnerite (Mn2+-rich). Wolframite is monoclinic and has a dark gray to
brownish color with a reddish brown streak. Its fracture is uneven and rough. Hardness on the Mohs-
scale is between 4 and 4.5. Its specific gravity is 7 to 7.5 g/cm³ and represents the main sorting
criterion in the processing of wolframite ores. Tungsten is mostly used as an alloy for heavy duty
steels in construction or machines and tools. The economic unit to determine the value of wolframite
concentrate is WO3.
Tantalite / Coltan
Tantalite ((Fe, Mn)(Ta)2O6) has a dark brown to black color and a brownish-red to black streak. Its
Mohs-scale hardness is 6-6.5 and its specific gravity is >8 g/cm³. It fractures subconchoidal and is
orthorhombic. The main sorting criterion for tantalite is its high specific gravity. The low paramagnetic
properties of tantalite allows separating it from ferro- and nonmagnetic minerals such as cassiterite
(Okrusch & Matthes, 2009). Coltan is an informal trade name for minerals of the columbite-tantalite
series and additional Ta- and Nb-bearing minerals. Tantalite is usually the main Ta-bearing mineral.
Columbite ((Fe, Mn)Nb2O6) is the main Nb bearing mineral. Other Ta-bearing minerals included in
coltan in various proportions are microlite, wodginite and tapiolite. The economic unit to determine
the value of tantalite concentrate and term used in this study is Ta2O5.

Efficiency of Mineral Processing in Rwanda’s Artisanal and Small-Scale Mining Sector
- 5 -
3. Methodology
To evaluate potentials of applied and alternative processing practices one month of field work was
carried out in Rwanda. During this field work three ASM operations have been visited, their mineral
processing evaluated and mechanical processing applied to the very same run of mine (ROM) which
has been produced on the respective ASM sites. Furthermore, the collected sample material and
products of the processing tests have been analyzed chemically, physically and optically. This
chapter gives an overview of the methodology of these activities. To find a common understanding
of basic non-chemical processing techniques which are practiced or applicable in ASM, this study
also provides an introduction to such techniques. The descriptions consist of observations during the
field work and literature review in case of the mechanized processing techniques and equipment.
The field work was performed in cooperation with technical staff of the GMD on training purpose to
increase understanding of scientific field work and data collection practices. Therefore, at least two
GMD technicians were included actively in sampling, processing tests and collection of operating
data.
3.1 Limits of Data Acquisition and Test performance
The study at hand presents a first approach into investigating the status quo of the processing
capabilities of the ASM sector in Rwanda. It provides indications on how the current situation might
be improved, based on the acquired data. It has to be noted that only three out of about 280 active
ASM operations have been evaluated and only one sampling point per operation could be tested.
Additional tests for different types of deposits and different ores should be considered to gain a more
complete image of the current situation.
Mechanical processing tests have been conducted on shaking tables that could not be optimized for
processing of low grade ores. Those shaking tables did not provide sufficient adjustment options in
respect to the processed material. Up-to-date equipment provides such options. A few minor
improvements, for instance better water regulation and reduced amplitude and frequency of the
shaking tables, are very likeable to improve the measured performance in terms of concentrate grade
and recovery rate sharply. Results would probably be further improved if prescreening for the shaking
table would be applied wet and maybe with even more and therefore narrower grain size fractions.
The results of the mechanical processing tests can therefore be assumed as low case scenarios. As
mentioned in the title of the study this gives a comparison of basic mechanical processing techniques
and artisanal processing measures. An approach with modern processing equipment and detailed
adjustment would therefore most probably give even higher recovery rates.
Operational data of the sampled mining companies has been acquired by interviews with the
respective mine management during on-site visits. The given statements could seldom be verified
independently.

Efficiency of Mineral Processing in Rwanda’s Artisanal and Small-Scale Mining Sector
- 6 -
Recovery rates and economic feasibility
To value the relation between recovery rate and economic feasibility, it is mandatory to
understand that a recovery rate of 100 % is not achievable with any of today’s mining practices.
Also, it is not desirable, as investments and efforts which are necessary to achieve the highest
possible recovery rate tend to exceed the gains which are generated by the additional recovery
in comparison to a scenario with a lower recovery rate. In general, the reasonable investment
and efforts in processing increases with the value of the target mineral and therefore with the
additional gains generated by an increased recovery rate. For Gold, which is one of the most
valuable mineral resources, recovery rates of industrial operations might be as low as 80 %
(SrkConsulting, 2015) and can still be considered good practice. However, such recovery rates
will only be achieved with extensive effort and application of multiple processing techniques like
physical sorting and chemical leaching in different processing stages. For industrial iron ore
projects, recovery rates as low as 40 % (Micon, 2012) are common, depending on the deposit
type and which recovery rate is considered to be the most economic feasible one. Considering
sustainability it is of course eligible to recover the highest possible amount of a not-renewable
resource when exploiting it. Therefore, regardless of the actual performance of processing, waste
material and tailings containing target minerals should always be considered a potential asset.

Efficiency of Mineral Processing in Rwanda’s Artisanal and Small-Scale Mining Sector
- 7 -
3.2 Mine Site Selection and Evaluation
To evaluate suitable mine sites the updated national mine concession database was reviewed to
identify operations with a constant and sufficient production capacity. From the mines suiting this
criteria the type of mineralization, applied processing techniques and accessibility of the mines had
to be considered further. Therefore, a team of GMD and BGR staff visited 12 mine sites, collected
basic information and rated them. In hindsight, suitable mine sites have been identified by focusing
on specified criteria and a most broad variety of characteristics to represent the most common
deposit types and processing practices (Table 1).
Table 1: Characteristics and criteria for selecting suitable mine sites
Characteristics
Type of deposit
/mineralization
To give a representative overview, each of the most common deposit
types was covered speaking of one pegmatite hosted deposit with
cassiterite mineralization, one pegmatite hosted deposit with tantalite
mineralization, and one hydrothermal quartz vein deposit with tungsten
mineralization.
Applied
processing
technique
To give a representative overview, each of the most commonly practiced
artisanal processing technique was covered, speaking of panning, ground
sluicing and concrete sluicing.
Criteria
Accessibility The mine site had to be accessible by truck to transport bulk samples
Capacity Manpower and production of the mine had to be sufficient to provide 1.5 t
of bulk sample and process a share of it within two days
Infrastructure Access to water supply and electricity grid
Figure 2 shows indicated locations of the selected mine sites. As for the integrity of the assessed
operations, the report has anonymized the gathered data. This was done to ensure to not cause any
disadvantages of any sort to the cooperating companies. However, the selected mine sides were
chosen to represent an average of the Rwandan small scale sector. Apart from being able to produce
a certain amount of minerals, the properties of the three mines are varying broadly. The amount of
employees, access to infrastructure (electricity and water), corporate organization (privately owned
or cooperative) and of course performed processing technique differ.

Efficiency of Mineral Processing in Rwanda’s Artisanal and Small-Scale Mining Sector
- 8 -
Within this, one the main criteria was to cover the most common deposit types, in respect to their
occurrence in ASM operations. As most of the ASM operations are exploiting pegmatite hosted
deposits, two of the selected mines were producing out of such nature. Within those, one mine is
producing cassiterite and one mine is producing a mixed Sn-Ta concentrate of cassiterite and
tantalite. Also, the regarding pegmatites of these mines showed alteration of different intensity.
Further, as the second most common artisanal mined deposit type is quartz vein hosted, one more
mine of this kind was selected, which is producing wolframite.
For artisanal processing in Rwanda, it is assumed that the majority of operations does still use ground
sluices in combination with panning. The ground sluices do differ in properties and set up. Therefore
operations with different ground sluicing concepts have been selected, while one of the mines
processed exclusively with panning.
For the planned financial analysis, it was also worthwhile to gain insights in operations of different
size in terms of employees and composition of expenditure. Therefore the selected mine sites are
differing operational expenditures in terms of water and electricity supply, as well as personnel costs.
Table 2 shows the characteristics of the selected mine sites. As can be seen the characteristic vary
broadly. However, it has to be kept in mind that three mine sites are only giving little insights to the
whole ASM sector of Rwanda. The in-depth evaluation of the selected mines was performed to allow
implementations by data gathered in different operational scenarios.
Figure 2: Map of Rwanda with indicated locations of the selected mine sites (google maps)

Efficiency of Mineral Processing in Rwanda’s Artisanal and Small-Scale Mining Sector
- 9 -
Table 2: Selected mines sites and some of their characteristics
Mine site characteristics
Mine 1 Mine 2 Mine 3
Mineralization Pegmatite hosted cassiterite
Pegmatite hosted cassiterite and tantalite
Hydrothermal quartz vein hosted wolframite
Processing technique
Panning Ground sluicing (circuit) Ground sluicing (linear)
Capacity (pre-concentrate)
2-3 t/month 1.5-5 t/month Up to 1 t/month
Permanent staff /casual workers
350 / 30 8 / 42 6 / 9
Water supply With pump from well Well upside the hill Rain water and purchasing gallons
Energy supply Diesel generator Public power grid none
Active Tunnels 58 19 5
Water costs none none 150 RWF/gallon
Diesel / water consumption per day
20 l / not measured none / not measured none / 50 l
After selection of suitable mine sites, the actual field work was performed. A team consisting of the
consultant, two to three technical staff from GMD and the national representative of BGR visited the
selected mines sites. During this, focus was set on representative sampling and applying measures
of scientific field work.

Efficiency of Mineral Processing in Rwanda’s Artisanal and Small-Scale Mining Sector
- 10 -
3.3 Sampling and Sample Analysis
On each of the three ASM operations the team took a bulk sample of ROM out of the productive
tunnels or stock piles.2 The total sample mass was determined by weighing the bulk samples
gradually and measuring its humidity in hindsight. To retain two homogenous samples, workers
mixed (homogenized) the bulk samples multiple times with shovels on a flat surface. After this,
workers formed a pile or an elongate shape and split the samples by riffling or quartering (Figure 3).
For later processing tests,
splitting the samples to two
uneven subsamples was
necessary, as a higher sample
mass was needed for mechanic
processing tests than for the
artisanal processing. Therefore,
splitting and mixing of samples
was performed two more times,
after taking away half of the
representative sample of the
previous splitting. Applying this,
the team produced two
representative samples with a
mass ratio of about 3:1 of each
bulk sample.
For further analysis and sample
description, taking additional samples during and after the processing tests was mandatory. During
processing tests, samples were taken of all products of the individual processing stages in order to
determine processing performances of the applied processing techniques.
Grain size and Mineralogical Analysis
When the sample composition and/or distribution of target minerals was of special interest, for
example in the case of feed material, concentrate or waste, sieve analysis was applied on the
samples. This gave the opportunity to understand the mass distribution and properties of the different
grain-size fractions. Also, fractions of interest were analyzed optically with reflected and transmitted
light microscopy to identify target minerals and the state of intergrowth of target minerals and barren
rock3.
2 At some of the operations processing was not performed on a daily basis. Therefore, workers are producing in the tunnels for several days and store the
produced material in stock piles.
3 Material of no or low economic value contained in the ROM which has to be separated from target minerals, also referred to as waste/waste material
Figure 3: Workers are splitting the bulk samples
representatively after homogenization. Left: riffle splitting, half
of the sample goes to the right, the other half to the left; Right:
Quartering, by quartering the pile and combining the quarters
opposite to each other, two representative samples are formed

Efficiency of Mineral Processing in Rwanda’s Artisanal and Small-Scale Mining Sector
- 11 -
Geochemical Analysis
In total, 270 samples have been send to a certified laboratory for analysis. The samples have been
produced during the processing tests, as well as by sieve analysis of the ROM. The contracted
laboratory4 is accredited by ISO/IEC 17025:2005 for its analytical procedures and certified by ISO
9001:2008 for its quality management. Depending on the expected elements and the regarding
concentrations, different analytical techniques have been applied, such as Inductively Coupled
Plasma Atomic Emission Spectroscopy (ICP-AES, for the elements Al, As, Fe, K, Mn, Si, Sn, Ti, W)
and Inductively Coupled Plasma Mass Spectrometry (ICP-MS for the elements Nb, Sn, Ta, W). For
quality control of the measured concentrations, 22 blank samples and 20 standard samples have
been analyzed with the 270 product samples. Additionally Xtraccon Limited applied X-ray
fluorescence spectroscopy (XRF) to crosscheck the results.
3.4 Artisanal Processing
This chapter gives a brief description of observed artisanal processing techniques. It is not thought
to give a conclusive overview about practiced techniques in the whole sector, but gives a common
understanding of the processes which are evaluated in this study.
Panning
Panning is an artisanal processing method which sorts particles by their specific gravity. The washing
pan (black vessel Figure 4) is usually a conical vessel in which the material is filled and mixed with
water. The washing pan is moved in circles to gently agitate the material. When moved properly with
adequate speed in rotatory motion,
material with low specific gravity gets
spilled over the edge of the washing pan.
Material with higher specific gravity tends
to stay near the center of the pan. Panning
is usually performed in washing ponds that
are specifically build to reduce water
consumption and collect tailings for future
reprocessing. Washing pond sizes usually
vary between 1.50 m x 1.50 m and 2 m x
2 m, with depths of about 0.6 m. They may
be covered with plastic sheets and filled to
about 50 % with water. Panning has also
been observed to be performed using
barrels as washing ponds.
4 http://msa.a2bigs.com/
Figure 4: Panning process in prepared washing pond

Efficiency of Mineral Processing in Rwanda’s Artisanal and Small-Scale Mining Sector
- 12 -
Ground sluicing
Ground sluicing is a basic artisanal density sorting method, as can be seen in Figure 5, showing
circuit ground sluicing. One person [Figure 5 #1] feeds the material to a regulated water channel,
which was formed from soil and might be reinforced with sand bags. The second person [Figure 5 #2]
shovels the material up against the water stream. By this, the single grains of the feed are separated
based on differences in their mass densities. In this example, the water stream is supplied by a third
person [Figure 5 #3], who pours water from a basin into the channel. Once the ore is processed, the
sluice is cleaned and the concentrate removed by hand.
Figure 5: Circuit ground sluicing with material feeding (1), moving of the material in the opposite
direction of the water flow (2) and supply of the water stream (3)
Another type of ground sluice is shown in Figure 6 (linear ground sluice). The difference to the ground
sluice in Figure 5 is the absence of a recirculation concept of the water. Hence, a higher quantity of
water is consumed while processing. Usually, a natural spring is fed into the sluice via gravity or a
continuous flow of processing water is generated by pumps. This technique also allows to use more
than the usual two sorting stages. In Figure 6, first three stages of the ground sluice are shown. At
first the material gets fed on top of the stream [Figure 6 #1]. Then it passes through the first step and
is concentrated at the first stage [Figure 6 #2]. The light material that passed the first stage goes
down another step and gets concentrated again at the second stage [Figure 6 #3] and afterwards at
the lase stage [Figure 6 #4]. Like this, up to 10 stages or even more can be used. The concentrate
mass, grade and grain size usually decreases with increasing number of the stage. The material gets
scrubbed naturally by passing through the stream and little waterfalls (steps). Between each stage,
water velocity is adjusted by building dams with shovels, rice bags, stones, wheat or similar
accessories.

Efficiency of Mineral Processing in Rwanda’s Artisanal and Small-Scale Mining Sector
- 13 -
Figure 6: Linear ground sluicing. (1) Feeding of the ROM and water; (2) first concentration stage and
narrowing of water stream/reducing water mass and velocity with a shovel; (3) second concentration
stage; (4) possible third concentration stage.
Hand Picking
Hand picking is a visual evaluation of
single grains. It is commonly used on
coarse pieces of the processed
ROM, which cannot be processed
efficiently by panning or sluicing.
Every rock is evaluated visually and
its density estimated manually. The
efficiency of this process depends
on the experience of the performing
miner. He decides whether the rock
might contain valuable minerals or is
to be treated as waste. A picture of
the visual evaluation of the rocks is
shown in Figure 7.
Figure 7: Visual evaluation and handpicking of coarse rocks
after panning

Efficiency of Mineral Processing in Rwanda’s Artisanal and Small-Scale Mining Sector
- 14 -
Air Classification/Tap and Blow/Winnowing
After the drying of the concentrate,
artisanal air classification (Figure
8) might be used as the final
concentration step. Applicability of
this technique depends on the
grain size of the concentrate. It is
only suitable for relatively low
grain sized pre-concentrates. For
artisanal air classification (or
winnowing) the material is
repeatedly thrown in the air with
the pan and caught again (Tap).
Light particles accumulate at the
edge of the material cone and can
be carefully blown away (blow) by
the worker as visualized by the
blue arrows in Figure 8.
Throughput for the manual air
classification is estimated to be as
low as 30 kg/h.
Artisanal Magnetic separation
If the concentrate contains
magnetic impurities, a manual
magnet like the one shown in
Figure 9 is used for the final
processing step. By moving the
magnet along the concentrate
magnetic particles are attached
by magnetic force. By using a
separate vessel or a textile as
cover for the magnet, the
magnetic particles are then
manually removed. With this,
magnetic impurities, such as
hematite or alike minerals, are
separated from non-magnetic
cassiterite ore and paramagnetic
coltan ore.
Figure 8: Artisanal air classification (Tap & Blow). The blue
arrows are showing the air flow, created by the worker; the red
arrows are showing the movement of the pan.
Figure 9: Artisanal magnetic separation of a mixed concentrate
with manual magnet (red circle)

Efficiency of Mineral Processing in Rwanda’s Artisanal and Small-Scale Mining Sector
- 15 -
3.5 Mechanical Processing Techniques
This chapter gives a brief description of the potentially applicable mechanic processing techniques
in the ASM sector. However, equipment used for the processing tests were of basic standard, to
ensure representative testing. The used equipment cannot be considered as up to date or high end
machines, while the following gives an introduction in common standards of mechanical processing
equipment.
Screening
Screening separates grain-collectives into separated fractions of specific grain size compositions. By
screening grains are separated depending on the size of the particles. A porous screen bottom allows
grains that are smaller than its meshes to pass through, while grains with a bigger size are remaining
on top of the screen. There are multiples reasons to screen a feed before processing.
Table 3: Benefits of applying screening measures prior to processing
To Prevent coarse grains from getting into processing machines which do not have the
capacity to handle coarse grains and might take damage !
To separate coarse grain sizes, which are not fully liberated in order to comminute and
therefore liberate them !
To create narrow grain size fractions to optimize efficiency of separation processes. Most
processing techniques proved to be more efficient when narrower grain size fractions are
used
!
Comminution
Comminution is a collective term for processes which reduces the grain sizes of a material. In mineral
processing comminution can also be referred to as crushing (for coarse material) and grinding (for
fine material). For materials which are not completely liberated at their original grain size,
comminution is highly recommended. The concept of interlocked or intergrown value particles within
a barren rock matrix can be
explained on base of Figure 10. On
the left side, a coarse particle that
consists of barren rock (yellow
parts) and value material (grey
parts) is shown. After comminution
there are usually three different kind
of particles, as can be seen in Figure
10. Those are pure barren rock,
remaining intergrown value material
(which has to be liberated to recover
contained target minerals) and pure
liberated value material.
Figure 10: Schematic drawing of concept of intergrown and
liberated particles

Efficiency of Mineral Processing in Rwanda’s Artisanal and Small-Scale Mining Sector
- 16 -
Comminution may further be necessary when
the original grain size exceeds the maximum
feed size for a specific process. Also, it is
used to produce the optimum grain size range
for a specific separation process. In this case,
comminution is combined with classification.
For example, a screen can be applied before
comminution to relieve the grinder or crusher
and separate the coarse fraction. Only the
coarse fraction will then be fed to the crusher
or grinder. All particles that are already fine
enough are bypassed (Figure 11, scenario 1).
This is also possible as a cycle, in which the
comminution product is screened again to
make sure all particle sizes were decreased
to a specific measure. In this case, the coarse
screening product is then recirculated to the
crusher/mill until all grains are smaller than
the meshes of the screen (Figure 11, scenario
2).
Comminution Before applying comminution to large quantities of material it is critical to evaluate the process. There is a risk of overgrinding the material. In this case, the grain size is decreased below the size which is suitable to perform the planned processing technique. In some cases, the material can even become too fine to be processed by density sorting, so the valuable elements cannot be recovered without chemical treatment.
Figure 11: Different scenarios for applying
comminution

Efficiency of Mineral Processing in Rwanda’s Artisanal and Small-Scale Mining Sector
- 17 -
Spiral Concentrator
Spiral concentrators are commonly used for
density separation of particles smaller than 1 mm.
The feed material is mixed with water to produce
so called liquid pulp. The pulp gets fed onto the
spiral and runs downwards in three to five circles,
depending on the type of spiral. Due to their inertia
heavy particles accumulate on the inside of the
spiral while lighter particles are pushed to the edge
of the spiral (Figure 12).
In the spiral two streams can be identified which
occur more or less rectangular to the main stream
which runs down in the middle of the spiral. A
second stream is located at the bottom of the spiral
directing to the inside and a third stream flows on
top of the pulp directing to the outside of the spiral
(Figure 13). Because of centrifugal forces the
thickness of the pulp stream is rather low on the
inside (2-3 mm), while it is rather turbulent and high
on the outside (7-16 mm) (Schubert, 1989).
In the inner side of the spiral, there are so called splitters collecting particles with a higher density.
The splitters are manually or automatically adjusted to split right between the heavy and the light
fraction. The separated fraction which was collected by the splitters runs towards the middle of the
spiral and gets recovered. The border of the two fractions is usually not a clear cut, as coarser
particles of higher density overlap with smaller particles of lower density. Therefore, most spirals
have the option to create a third, middling fraction between heavy and light material, which might be
recirculated to gain additional concentrate. Also, the feed should consist of grains which are more or
less the same size, to increase the efficiency of this process. Comminution and screening should be
used before feeding a spiral, to produce a narrow variation of grain sizes.
Figure 12: Spiral concentrator fed with liquid pulp.
Figure 13: Schematic drawing of
flow directions inside a spiral
concentrator. Lower stream (2)
directing to the inside of the
spiral and top stream (1)
directing to the outside of the
spiral. (Schubert, 1989)

Efficiency of Mineral Processing in Rwanda’s Artisanal and Small-Scale Mining Sector
- 18 -
Shaking Table
Shaking tables are widely used in mineral processing by density separation. For a good result, it is
recommended to use particles smaller than 2 mm for this process (Schubert, 1989). The principle of
a shaking table can be seen on the schematic drawing in Figure 14.
shaking direction
light
feed
middlings
heavy
Water hoses
Slimes
increasing particle density
cross flow water
Figure 14: Schematic drawing of the principle of operation of a shaking table.
Shaking tables are consisting of a plate with riffles that is inclined with the lower edge in opposite of
the feed side. An engine moves the plate back and forth. Frequency and amplitude of this movement
can be adjusted. Cross-flow Water is fed onto the table from water hoses, from which the intensity
can be adjusted, as well. This water stream creates flow energy across the table, which leads slimes
(very small and low density particles) to be suspended from the table, following the water flow (#3
Figure 15). Light particles flow rather to the light and middling section of the table (#1 Figure 15),
whereas heavy particles are less affected by the water flow and therefore follow the shaking direction
of the table (#2 Figure 15).
Generally, apart from slimes, small particles move further lengthwise than coarser particles of the
same density. This can lead to overlapping of coarse dense and small light particles. To avoid this
effect, it is crucial to create a narrow grain size fraction5, before feeding the shaking table. For using
shaking tables efficiently a proper calibration is mandatory. Also, the whole plate should be
moistened by water and stay moistened during the whole process. In general, there are a few options
to adjust the shaking table in respect to the feed (Table 4).
5 For example, instead of feeding one grain size fraction 0-2 mm, two grain size fractions, 0-<1 mm and >1-2 mm, could be fed, by
separating the 0-2 mm fraction by a 1 mm screen before feeding the table.

Efficiency of Mineral Processing in Rwanda’s Artisanal and Small-Scale Mining Sector
- 19 -
Table 4: Aspects to consider in order to optimize shaking table performance
Inclination of the plate !
Intensity of the cross water flow !
Frequency and amplitude of the shaking movement !
Amount of feed that is fed onto the plate !
Width of captured concentrate flow !
If these parameters are adjusted correctly and the feed is of the right grain size the streams of slimes,
light/middling fraction and concentrate are flowing separately from each other along the plate (Figure
15). The size of the gap between the slimes and the heavy fraction might differ. Therefore, the
capturing of the concentrate is the last crucial adjustment. This is usually done with a slide plate or
cone, which can be moved to different positions, to recover different amounts of the heavy fraction
(Schubert, 1989). The adjustment of a shaking table needs some experience. With multiple attempts
a proper adjustment might even be performed by trial and error.
Figure 15: Modern shaking table with separated flows of middling fraction (1), heavy fraction (2) and
light/slimes fraction (3)

Efficiency of Mineral Processing in Rwanda’s Artisanal and Small-Scale Mining Sector
- 20 -
Magnetic Separation
Sorting criteria of magnetic separators is the magnetic susceptibility of the sorted material. Magnetic
particles can be separated from nonmagnetic particles, as well as particles with a certain differences
in magnetic susceptibility from each other.6 For example, separation of high magnetic magnetite from
low magnetic coltan and nonmagnetic cassiterite can be performed. In Figure 16 a magnetic
separator with variable magnetic forces and multiple sorting stages is shown. This concept allows to
produce five different products. Depending on the feed, the first product has very high magnetic
properties, like iron or magnetite (#2 in Figure 16). The second product has ferromagnetic properties
and therefore might be a medium magnetic product, like magnetite or hematite (#3 in Figure 16). The
third and fourth product are low magnetic minerals like tantalite or wolframite (paramagnetic, #4 in
Figure 16). The last product is the nonmagnetic fraction, which includes all minerals that do not show
any magnetic susceptibility (#5 in Figure 16). When using a magnetic separator basic knowledge of
the magnetic properties of the processed material is needed. Also, magnetic separators should not
be fed with too much feed at once, in respect to their specific throughput capacity.
Figure 16: Magnetic separator with multiple electromagnets of variable magnetic intensity. The feed
section is at (1) where the material is put on a vibratory feeder. At (2) the high magnetic fraction is
separated by a low energy magnetic field. At (3) another high magnetic fraction is separated. At (4)
low magnetic materials are removed and at (5) nonmagnetic material remains.
6 The intensity of the attraction to magnets depends on the physical properties and chemical composition of the grains or minerals.

Efficiency of Mineral Processing in Rwanda’s Artisanal and Small-Scale Mining Sector
- 21 -
3.6 Economic analysis
The economic analysis performed is based on the gathered operating data of the mine sites. After
taking samples at the sites, an interview with the mine management was carried out. By this, basic
data regarding the operations performance and costs have been collected. It is worth mentioning, all
given information are based on the knowledge and impressions of the mine management. Therefore,
in many cases it could not be double checked if given information was correct. However, exceptional
unlikely statements have been averaged or excluded. The survey included the aspects shown in
Table 5.
Table 5: Type of operational data gathered on-side
General Information Costs Mining Practice
Infrastructure Per worker Ore grade
Concession type Royalty Concentrate grade
Ore type Revenue tax Mine lifetime
Deposit type Land tax Number of tunnels
Mine sites Patent fee Production rate
Number of
workers/gender Environmental fee Mining method
Number of teams For fuel Transporting method
Number of workdays For water Processing technique
After field work and analysis of the processing tests, multiple calculations could be performed based
on a combination of this data and the observed processing performance of different processing
techniques. Also, based on concentrate prices of the last 10 years, three different pricing scenarios
(high, medium and low) were assumed. This approach allowed to give preceding calculations of
economic sustainability for different processing and investment scenarios as can be seen in
Chapter 8.

Efficiency of Mineral Processing in Rwanda’s Artisanal and Small-Scale Mining Sector
- 22 -
4. Description or Raw Material Samples (ROM)
In order to derive implications for processing performance and specific challenges or the processed
material, a detailed sample description and analysis is necessary. Therefore, the team took
representative sub-samples of each collected ROM. Due to the high mass of the bulk samples (Table
6) producing representative sub samples was challenging and has been achieved by multiple mixing
and splitting steps.
Table 6: Dry masses of bulk samples
Sample Total sample mass Mechanic Processing Artisanal Processing
Mine 1 852 kg 732 kg 220 kg
Mine 2 1413 kg 1065 kg 348 kg
Mine 3 1111 kg 857 kg 254 kg
By analyzing the sub-samples of the ROM as described in chapter 3.3, details about the
mineralogical composition, grain-size distribution and distribution of the target elements within the
different grain-size fractions could be learned. Which will be presented in the following. A more
detailed sample description can be found in chapters 1 to 3 in the annex.
4.1 Grain Size Distribution
Sieve analysis has been performed on all bulk samples. As to the different mineralogical background
of the sampled deposits, bulk samples are showing different grain size properties. As presented in
chapters 3.4 and 3.5 the different processing methods partly rely on the right grain-sized material to
work efficiently. Therefore, grain size distribution of the processed material has a major impact on
processing procedures. For example, when a feed shows a narrow distribution of grain sizes, it is
more likely to achieve a good recovery rate. On the other hand, when the feed contains a wide range
of different grain sizes, it might be necessary to apply multiple screening and comminution steps,
before sorting it.

Efficiency of Mineral Processing in Rwanda’s Artisanal and Small-Scale Mining Sector
- 23 -
Table 7 shows the basic grain size distribution properties of the sampled ROMs. The ROMs are
showing distinct varying grain-size distributions. While about 86 % of the ROM 1 is composed of
grain sizes between 63 µm and 20 mm, only 69 % of the ROM 2 lies in this range. For Mine 3 the
share of ROM in this grain-size fraction is even lower (about 60 %). With this, the samples represent
a broad range of grain-size compositions. The ROM of Mine 1 shows an average distribution on grain
sizes. While from the same deposit type, but in a different state of weathering, the ROM 2 can be
described as rather fine grained. In opposite to this, the ROM of Mine 3 shows a very broad variation
of grain sizes with high shares of it being coarser than 2 mm. As it is the only material from another
deposit type, a different grain-size distribution was expected. However, comparing the d50 of the
ROMs it becomes clear, the coarsest material was taken from mine 3 (d50 = 3 mm), while ROM 2
with a d50 of 250 µm is the finest material. Detailed graphs of the grain size distributions are included
in the annex.
Table 7: Basic grain size distribution properties of the sampled ROMs
Mine 1 / Cassiterite Mine 2 / Mixed Sn-Ta Mine 3 / Wolframite
Pegmatite weathered Pegmatite heavy weathered Quartz vein hosted
d50 at 2 mm d50 at 250 µm d50 at 3 mm
12 % of mass below 63 µm 30 % of mass below 63 µm 25 % of mass below 63 µm
3.5 % of mass above 20 mm >1 % of mass above 20 mm 15 % of mass above 20 mm
Fairly average distribution of
grain sizes with a
mentionable amount of fines
Grain distributions tends to
finer grain sizes
Wide range of grain sizes with
a big share of fines and a high
amount of coarse grains
Note: the d50 particle size distribution is used as an indicator to estimate the average grain size. d50
is the size where 50 % of the sample mass is passing the screen. This means at this mesh size (d50)
half of the material is coarser, and half is finer-grained than the indicated diameter.
4.2 Distribution of Target Minerals
To evaluate the processing efficiency, it is necessary to understand the distribution of target minerals
in the ROM, prior to any processing. Therefore, all grain-size fractions of the different feeds have
been analyzed chemically and the findings have been put into graphs. In Figure 17 multiple graphs
of the distributions and grades of the respective target minerals in the different grain-size fractions
can be seen. Here, the x-axis shows the grain-size fractions. Blue columns indicate the percentage
of target minerals contained in the respective fraction with regard to the total contained target
minerals in the ROM sample. This distribution is quantified at the primary y-axis. The red dots show
the target mineral grade in each fraction and are related to the secondary y-axis.

Efficiency of Mineral Processing in Rwanda’s Artisanal and Small-Scale Mining Sector
- 24 -
The ROM 1 (mine 1 - Figure 17) shows a
concentration of target minerals in the medium
sized fractions between 0.5 mm and 11.2 mm.
About 78 % of the total SnO2 is contained in the
grains of these fractions. 14 % of the target minerals
are found in the coarse fractions larger than
11.2 mm, while only 8 % are contained in the fine
fractions below 0.5 mm. Apart from a minor set-
back in the fraction between 11.2 mm and 20 mm,
the grade of SnO2 in the material increases with
increasing grain size. Therefore, the coarsest grains
above 20 mm in size showed the highest grade of
SnO2 in this ROM (4.35 %).
For the ROM 2 (mine 2 - Figure 17), with about 60 %
each, the largest share of target minerals (SnO2 as
well as Ta2O5) are contained in the fraction below
63 µm. For Ta2O5 additional 10 % are contained in
the fraction 63 to 125 µm. Further 20 % of the
Tantalum is contained in the fractions between
125 µm and 2 mm. Only about 5 % of the tantalite
containing particles is coarser than 2 mm. For SnO2
the distribution is alike, even though a slightly
increased content can be observed in the grain-size
fractions between 125 µm and 2 mm, were about
30 % of total SnO2 is contained. For both target
minerals the contents in the fractions above 2 mm
are as low as 4 % of total target minerals in the
sample. Also an anomaly has been found in the
fraction between 1 mm and 2 mm, where the grade
of Ta2O5 was slightly increased with 0.22 % and that
of SnO2 peaked with about 0.83 %.
For the ROM 3 (mine 3 - Figure 17) a way different
distribution of the target mineral was observed.
Here, most of the target mineral (about 85 %) was
found in fractions above 0.5 mm. The analysis
showed 10 % of the WO3 are comprised in the fine
grains below 63 µm. The fractions from 63 µm to
2000 µm combined contain about 15 % of the total
WO3. From 2-5 mm further 15 % are contained.
With this, the coarsest fractions above 5 mm are
containing 60 % of the target minerals. The highest
WO3 grade (9.6 % WO3) was found in the fraction 5-
11.2 mm. This fraction also contained the highest
total amount of WO3. In the fractions coarser than
20 mm the grade was about 8.5 %. It is noticeable that in the fraction between those two high grade
fractions from 11.2-20 mm the lowest WO3 grade (1 % WO3) was found. However, the grade tends
to increase with grain size, even though there are some variations in the medium grained fractions
and the mentioned anomaly between 11.2 mm and 20 mm.
Figure 17: Distribution and grades of the
respective target minerals in the grain-size
fractions
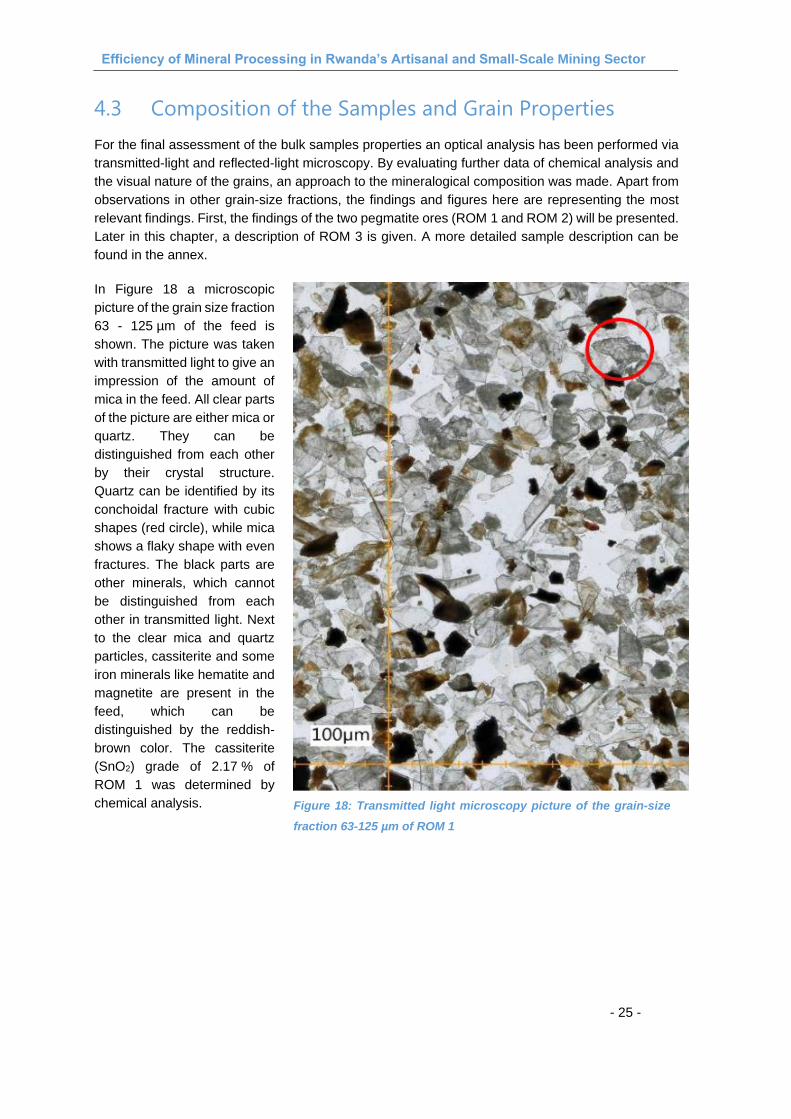
Efficiency of Mineral Processing in Rwanda’s Artisanal and Small-Scale Mining Sector
- 25 -
4.3 Composition of the Samples and Grain Properties
For the final assessment of the bulk samples properties an optical analysis has been performed via
transmitted-light and reflected-light microscopy. By evaluating further data of chemical analysis and
the visual nature of the grains, an approach to the mineralogical composition was made. Apart from
observations in other grain-size fractions, the findings and figures here are representing the most
relevant findings. First, the findings of the two pegmatite ores (ROM 1 and ROM 2) will be presented.
Later in this chapter, a description of ROM 3 is given. A more detailed sample description can be
found in the annex.
In Figure 18 a microscopic
picture of the grain size fraction
63 - 125 µm of the feed is
shown. The picture was taken
with transmitted light to give an
impression of the amount of
mica in the feed. All clear parts
of the picture are either mica or
quartz. They can be
distinguished from each other
by their crystal structure.
Quartz can be identified by its
conchoidal fracture with cubic
shapes (red circle), while mica
shows a flaky shape with even
fractures. The black parts are
other minerals, which cannot
be distinguished from each
other in transmitted light. Next
to the clear mica and quartz
particles, cassiterite and some
iron minerals like hematite and
magnetite are present in the
feed, which can be
distinguished by the reddish-
brown color. The cassiterite
(SnO2) grade of 2.17 % of
ROM 1 was determined by
chemical analysis.
Figure 18: Transmitted light microscopy picture of the grain-size
fraction 63-125 µm of ROM 1

Efficiency of Mineral Processing in Rwanda’s Artisanal and Small-Scale Mining Sector
- 26 -
Furthermore, concentrations of elements found were 4.5 % iron (Fe) which is mainly present in
magnetite (Fe3O4) and hematite (Fe2O3) complexes. About 15 % aluminum (Al) is present in the feed,
which in combination with about 6 % potassium (K) most likely as part of the mica. Mica was also
found to be the dominant mineral in the feed. About 20 % silicon (Si) contained in mica and quartz
as well as a minor amount of feldspar.
The feed does not contain as much mica as ROM 1. Nevertheless, the target mineral grade in ROM 2
visually seems to be lower. It has to be mentioned, that cassiterite and tantalite grains could not be
distinguished from each other by microscopy analysis. There is a high quantity of quartz and a
mentionable amount of feldspar present. A picture of the feed fraction between 125 and 250 µm is
shown in Figure 19.
Figure 19: Transmitted light microscopy picture of grain-size fraction 125-250 µm of ROM 2
Chemical analysis of ROM 2 confirmed
most of the visual findings. It shows a
mineralogical composition similar to
ROM 1. However, the grade of cassiterite
was 0.46 %, lower than that of ROM 1.
Amounts of magnetite and hematite were
lower, as well. The Fe grade was
measured to be 1.2 %. Also, the mica
contained was estimated to be lower than
that in ROM 1. While still 11 % of Al was
measured, the analysis showed a grade
of 1.5 % for K, which might be a result of
advanced alteration. With 28 % of silicon,
a higher amount of quartz can be
assumed than that found in ROM 1. The
grade of Ta2O5 was 0.199 %.
Figure 20: Picture of reflected-light microscopy of
the grain-size fraction 2 mm to 5 mm of ROM 2
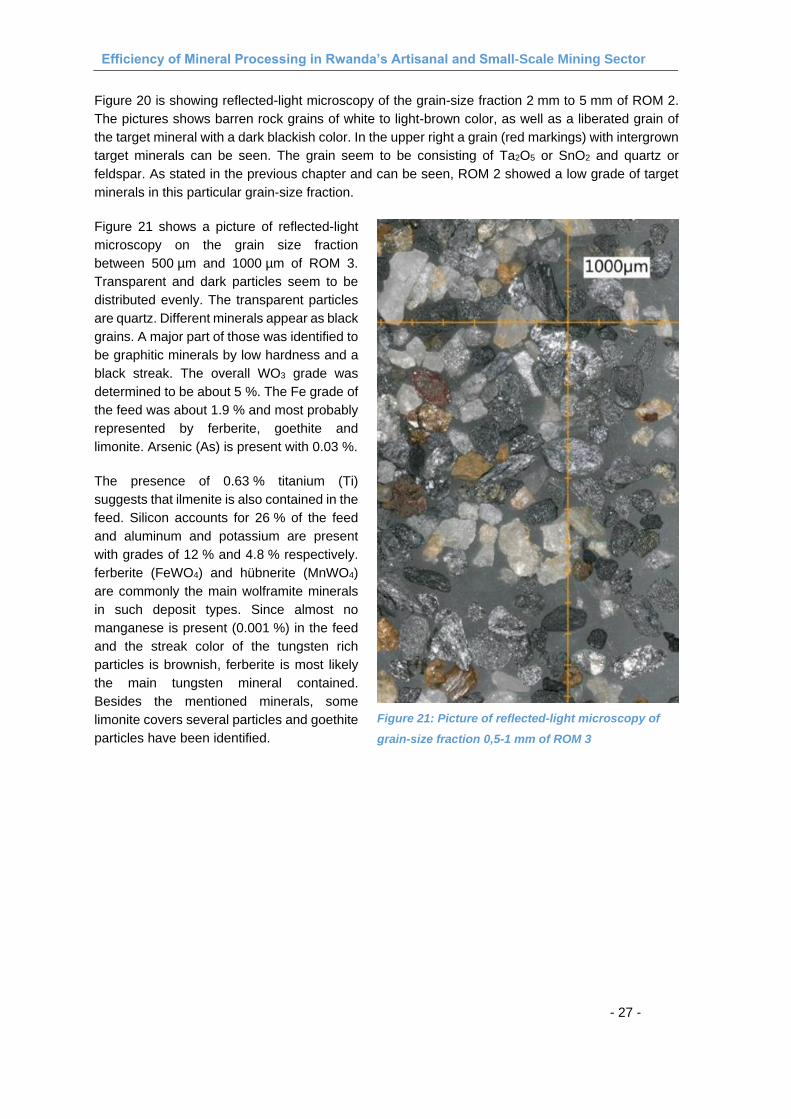
Efficiency of Mineral Processing in Rwanda’s Artisanal and Small-Scale Mining Sector
- 27 -
Figure 20 is showing reflected-light microscopy of the grain-size fraction 2 mm to 5 mm of ROM 2.
The pictures shows barren rock grains of white to light-brown color, as well as a liberated grain of
the target mineral with a dark blackish color. In the upper right a grain (red markings) with intergrown
target minerals can be seen. The grain seem to be consisting of Ta2O5 or SnO2 and quartz or
feldspar. As stated in the previous chapter and can be seen, ROM 2 showed a low grade of target
minerals in this particular grain-size fraction.
Figure 21 shows a picture of reflected-light
microscopy on the grain size fraction
between 500 µm and 1000 µm of ROM 3.
Transparent and dark particles seem to be
distributed evenly. The transparent particles
are quartz. Different minerals appear as black
grains. A major part of those was identified to
be graphitic minerals by low hardness and a
black streak. The overall WO3 grade was
determined to be about 5 %. The Fe grade of
the feed was about 1.9 % and most probably
represented by ferberite, goethite and
limonite. Arsenic (As) is present with 0.03 %.
The presence of 0.63 % titanium (Ti)
suggests that ilmenite is also contained in the
feed. Silicon accounts for 26 % of the feed
and aluminum and potassium are present
with grades of 12 % and 4.8 % respectively.
ferberite (FeWO4) and hübnerite (MnWO4)
are commonly the main wolframite minerals
in such deposit types. Since almost no
manganese is present (0.001 %) in the feed
and the streak color of the tungsten rich
particles is brownish, ferberite is most likely
the main tungsten mineral contained.
Besides the mentioned minerals, some
limonite covers several particles and goethite
particles have been identified.
Figure 21: Picture of reflected-light microscopy of
grain-size fraction 0,5-1 mm of ROM 3

Efficiency of Mineral Processing in Rwanda’s Artisanal and Small-Scale Mining Sector
- 28 -
5. Evaluation of Artisanal Processing Methods
The processing tests have been performed in the processing facilities of the sampled mine sites.
Preparation steps as well as the methodology of processing have been recorded in detail. This
chapter presents a brief introduction to the basic steps of the tests and their results. The miners of
the respective operations performed the processing as in their daily practice. The team of consultant,
GMD technicians and the local BGR representative took care of documentation and sampling during
the field tests. The feed masses can be found in Table 6, a more detailed description of the performed
processing tests is found in the annex (chapter 4 in the annex).
5.1 Artisanal Processing at Mine 1/Cassiterite
The processing scheme of mine 1 as shown in the
flow sheet in Figure 22. A more detailed flow-sheet
of the artisanal process is shown in the annex. In the
first stage, the ROM is washed in a washing-pan (#1,
see Figure 4) in a washing pond. While the light
fraction of this first step is dumped as waste, the
heavy fraction is sorted by hand picking (#2, see
Figure 7). The coarse grains which were found to
potentially contain target minerals are crushed and
sorted. In the second stage the crushed material is
washed with the rest of the heavy fraction from the
first stage. After this, the heavy fraction is dried and
then air classified (#3 see Figure 8). The tailings of
the air classification have been recovered for
reprocessing at a later point. During the tests the
washing pond was lined with a plastic canvas.
Therefore, the team recovered all tailings, except for
those from the air classification for later reprocessing
with mechanical measures.
For the artisanal processing at mine 1 another
observation has been made. The approach of panning in a washing pond gave the opportunity to
recover all side products from the different processing stages. When reviewing the concentrations in
the different products, it was found that the first panning stage of the artisanal processing removed
about 82 % of the mass of the processed material into the waste material, while recovering about
84 % of the contained target minerals in the heavy fraction (see annex). This ratio can be considered
as an efficient pre-sorting, leaving a heavy fraction for further processing with an SnO2 grade of about
11 % for further processing.
The final results of the artisanal processing of ROM 1 can be seen in Table 8. A recovery rate of
60.10 % has been achieved. The concentrate had a SnO2 grade of 86.98 % and can therefore be
estimated to be a high quality concentrate. However, close to 40 % of the target minerals remained
in the waste material. By further assessment it was found that most of these lost target minerals were
contained in the tailings of the washing stages. The fine tailings of panning stage 1 contained 16.23 %
of the total SnO2 in the feed.
Figure 22: Flow sheet of the artisanal
processing scheme of mine 1 (Cassiterite)

Efficiency of Mineral Processing in Rwanda’s Artisanal and Small-Scale Mining Sector
- 29 -
Additional 9.08 % were lost in the coarse tailings after the hand-picking and another 19.09 % has
been found to have remained in the tailings of panning stage 2. The enrichment factor was around
40. The whole process was estimated to be capable of a throughput of 200 to 250 kg of feed per
hour.
5.2 Artisanal Processing at Mine 2/Mixed Sn-Ta
As shown in Figure 23 the
processing scheme of Mine
2 uses three basic sorting
techniques. The first which
is a linear ground sluice
(#1) is therefore performed
in up to 10 stages
according the material
processed. For testing
purpose and due to the
limited amount of ROM the
ground sluice was worked
on three stages. For later
analysis, the heavy fraction
of stage 2 and 3 have been
combined, due to their low
mass. One miner feeds the
ROM directly into the first
stage of the ground sluice,
were another worker
shovels the material
against the water stream
(see Figure 6). Some of the heavy material is already captured in stage 1, while the rest follows the
light material in the water stream down to stage two, where the shoveling is repeated. This process
is continued until all ROM was fed into the sluice and no new material arrives at the last operating
stage. When the sluicing process is finished, the heavy fractions from the sluicing stages were then
collected and processed by panning (#2). While the light fraction of the panning stage is considered
as waste, the heavy fraction gets dried and air classified (#3). The light fraction of the air classification
was recovered for reprocessing, while the heavy fraction was considered as final concentrate.
Table 8: Artisanal processing results of ROM 1 (Cassiterite)
Figure 23: Flow sheet of the artisanal processing scheme of mine 2
(Mixed Sn-Ta)

Efficiency of Mineral Processing in Rwanda’s Artisanal and Small-Scale Mining Sector
- 30 -
The waste material of the sluicing process was lost with the processing water flow and therefore no
analysis of the artisanal waste could be carried out. During evaluation of the chemical analysis back-
calculation led to the losses of target minerals and the probable grade of the waste material.
However, as can be seen in Table 9 the artisanal concentrate showed a SnO2 grade of 41.26 %.
This grade has to be classified as a below average cassiterite concentrate, which is not suitable for
export. The recovery of SnO2 was 24.49 % which means that more than 75 % of the SnO2 was lost
in the waste. With increasing the grade from 0.46 % in the feed to 24.49 % SnO2 in the concentrate,
the enrichment factor was 50. For tantalite a recovery rate of only 13.35 % was calculated with a
grade of 9.92 % Ta2O5 in the concentrate, which is not suitable for the international market. As the
grade of Ta2O2 in the feed was only 0.19 %, the enrichment factor for Ta2O5 is 90 and can be
estimated as very high.
5.3 Artisanal Processing at Mine 3/Wolframite
As shown in Figure 24 the processing scheme
of mine 3 uses two basic sorting techniques. It
starts with circuit ground sluicing (#1 see Figure
5). The ground sluicing is only applied in one
stage. After this the heavy fraction of the
ground sluice was panned (#2, see Figure 4) in
a rougher7 and a scavenger stage8. In the first
panning stage a final concentrate is created
which gets dried and is then ready for sales.
Tailings of the first panning stage get
reprocessed in a second panning stage, where
a second concentrate is created. The light
tailings of the second panning stage are treated
as final tailings. As can be seen in Table 10 the
artisanal concentrate showed a grade of
21.41 % WO3. As the feed had a grade of
0.54 % WO3 and the concentrate summed up
to 0.52 % of the mass of the feed, recovery rate
in the concentrate was just 20.76 %.
7 Rougher stage is the first treatment of the material with one specific sorting technique
8 Scavenger stage is the retreatment of tailings of a rougher stage to improve recovery
ROM
Ground Sluicing
PanningStage 1
Drying
Final Concentrate
heavy
heavy
Tailings
light
light
PanningStage 2
Drying
heavy
Tailings light
Figure 24: Flow sheet of the artisanal processing
scheme of mine 3 (Wolframite)
Table 9: Artisanal processing results of ROM 2 (Mixed)

Efficiency of Mineral Processing in Rwanda’s Artisanal and Small-Scale Mining Sector
- 31 -
By this analysis it was assessed that 79.24 % of the target minerals remained in the waste of the
artisanal processing practice. However, as a circuit ground sluice was used, the waste material could
have easily been re-processed. In terms of this study and by information of the mine management it
has to be assumed that reprocessing is usually not performed. With a concentrate grade of 21.41 %
the enrichment factor for the target mineral was 40. Grade as well as enrichment factor can be
assumed to be below average. The grade of the concentrate is too low to be marketable.
Table 10: Artisanal processing results of ROM 3 (Wolframite)

Efficiency of Mineral Processing in Rwanda’s Artisanal and Small-Scale Mining Sector
- 32 -
6. Evaluation of Mechanical Processing Tests
The mechanical processing tests were performed in the processing facilities of Phoenix Metal
Limited9 in Kigali. As part of the preparation of the field work the BGR office in Rwanda contacted
several companies running processing plants in the country. While few of the companies have not
been willing to cooperate, three different processing plants could be visited. One of those was found
to not be functional and oversized for the planned processing tests. Another plant only provided some
equipment while lacking of suitable crushers, mills and a magnetic separator. The processing plant
at Phoenix Metal, however, provided a good basis for a complete processing set-up, including
preparation stages with different screen sizes and comminution machines, as well a multiple shaking
tables and magnetic separators. The equipment was mostly old and worn, but well maintained. Some
of the machines did not show any specification label and, therefore, have probably been constructed
for the application at Phoenix Metal, exclusively. However, the set-up options and machines at
Phoenix Metal Limited have been found to be the most suitable ones for the processing tests.
Additionally the advantage of location at the outskirts of Kigali left this processing plant to be the best
available option in terms of logistics.
Preparation steps as well as the methodology of processing have been recorded in detail. This
chapter presents a brief introduction to the basic steps of the tests and their results. The consultant
and the technical staff of GMD performed the tests with the given equipment. The feed masses can
be found in Table 6, a more detailed flow-sheets of the mechanical processing including grades and
recovery rates of most of the single processing steps can be found in annex (chapter 4 in the annex).
For all mechanical processing tests the preparation steps were kept consistent. After drying and
determining the dry weight, the samples were sieved with a mesh size of 2 mm. After the sieving,
two fractions, one coarser than 2 mm (> 2 mm) and one finer than 2 mm (< 2 mm), were available.
Consequently, but were processed separately. Hence, for the fraction > 2 mm additional preparation
steps, like further screening and comminuting, were necessary. However, the applied sorting
techniques were shaking tables and magnetic separator, while for one testing series a spiral was
used.
9 http://phoenix-metal.com/
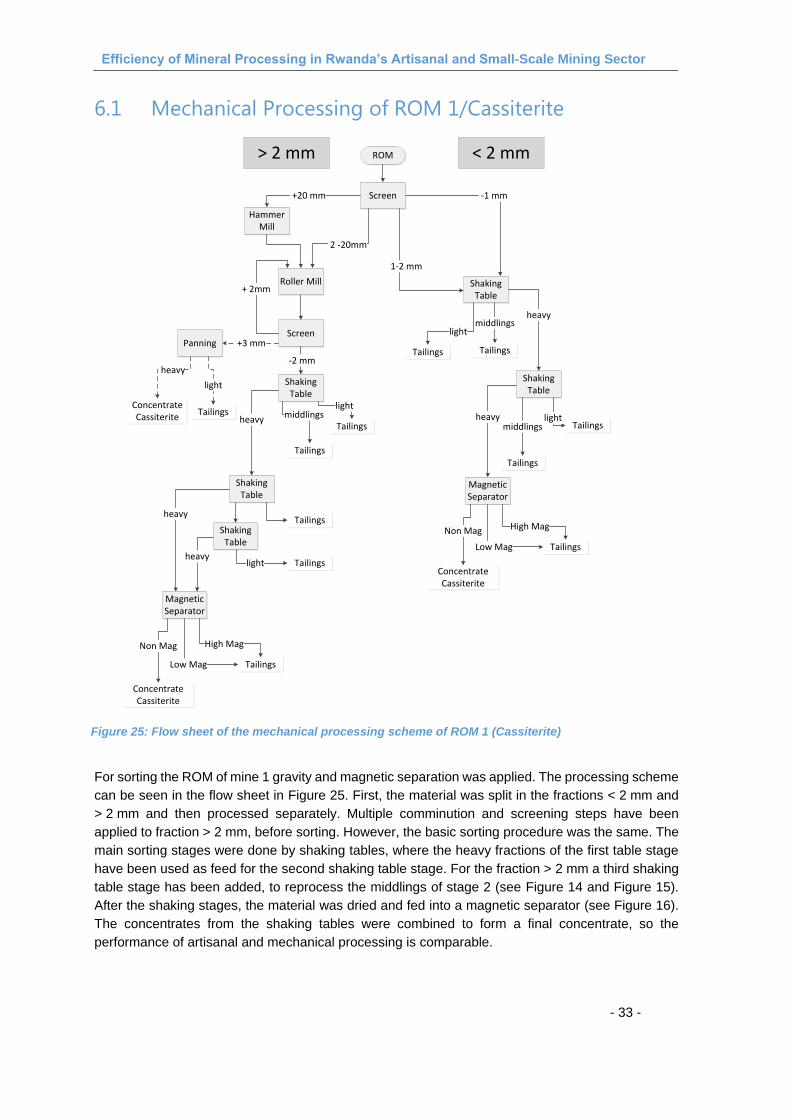
Efficiency of Mineral Processing in Rwanda’s Artisanal and Small-Scale Mining Sector
- 33 -
6.1 Mechanical Processing of ROM 1/Cassiterite
For sorting the ROM of mine 1 gravity and magnetic separation was applied. The processing scheme
can be seen in the flow sheet in Figure 25. First, the material was split in the fractions < 2 mm and
> 2 mm and then processed separately. Multiple comminution and screening steps have been
applied to fraction > 2 mm, before sorting. However, the basic sorting procedure was the same. The
main sorting stages were done by shaking tables, where the heavy fractions of the first table stage
have been used as feed for the second shaking table stage. For the fraction > 2 mm a third shaking
table stage has been added, to reprocess the middlings of stage 2 (see Figure 14 and Figure 15).
After the shaking stages, the material was dried and fed into a magnetic separator (see Figure 16).
The concentrates from the shaking tables were combined to form a final concentrate, so the
performance of artisanal and mechanical processing is comparable.
ROM
Screen
Shaking Table
1-2 mm
Roller Mill
Screen
+ 2mm
2 -20mm
Hammer Mill
+20 mm -1 mm
-2 mm
ConcentrateCassiterite
+3 mm
Shaking Table
Shaking Table
heavy middlingslight
Tailings
Tailings
heavyTailings
Magnetic Separator
TailingsTailings
middlingslight
Shaking Table
heavy
Tailings
Tailingsmiddlingslightheavy
Magnetic Separator
Low Mag
Non Mag High MagShaking Table
heavyTailingslight
ConcentrateCassiterite
Tailings
Low Mag
Non Mag High Mag
Tailings
ConcentrateCassiterite
< 2 mm> 2 mm
Panning
heavy
Tailings
light
Figure 25: Flow sheet of the mechanical processing scheme of ROM 1 (Cassiterite)

Efficiency of Mineral Processing in Rwanda’s Artisanal and Small-Scale Mining Sector
- 34 -
As can be seen in Table 11, the mechanical processing with all sorting measures achieved a
concentrate grade of 90.30 % of SnO2 with a recovery rate of 72.84 %. It has to be mentioned that
the recovery rate was slightly higher, without applying magnetic separation (recovery 74.76 %).
As a concentrate grade of 77.65 % is sufficient for export, in this scenario 25.24 % of the target
mineral remained in the waste. For application of magnetic separation it is remarkably easy to recover
the waste material easily and reprocess it with the next feed or processing step. With this, it is highly
likely that further processing tests would have led to a concentrate grade of over 90 % and a recovery
of about 75 %. The mechanical processing scheme showed to be capable of a throughput of at least
1 t of feed per hour.
For ROM 1 the mechanical processing has also been performed with recovered artisanal tailings
from the washing pond (Table 12). The recovered tailings had a total mass of 180 kg and a SnO2
grade of 0.6 %. With this, about 1 kg of pure SnO2 was still contained in the artisanal tailings. The
sorting measures basically followed the flow-sheet in Figure 25, with the difference being the material
was not split with a sieve of 2 mm but of 3 mm mesh size. The two produced fractions of < 3 mm and
> 3 mm were processed on three shaking table stages each and finally combined for magnetic
separation. This reprocessing test can be considered as successful, as an additional 740 g of
concentrate with a grade of 59.23 % SnO2 was produced. Here the same observation was made as
for the main mechanical processing test of Mine 1. By applying magnetic separation the concentrate
grade was increased but the recovery rate decreased.
Table 11: Mechanical processing results of ROM 1 (Cassiterite)
Table 12: Mechanical reprocessing results of artisanal tailings of mine 1 (Cassiterite)

Efficiency of Mineral Processing in Rwanda’s Artisanal and Small-Scale Mining Sector
- 35 -
6.2 Mechanical Processing of ROM 2/Mixed Sn-Ta
For sorting the ROM of mine 2 gravity
and magnetic separation was applied.
The processing scheme can be seen
in the flow sheet in Figure 26. Again,
the total sample was split in two
fractions using a screen of 2 mm
meshes. While the coarser fraction
was comminuted and screened further
before sorting, both fractions were
sorted in three stages using shaking
tables. From each shaking table, only
the heavy fraction was fed to the next
stage. After the third stage, the heavy
fractions were combined and fed to a
magnetic separator in order to clean
out ferro-magnetic impurities and
separate the contained tantalum and
cassiterite from each other.
Results of mechanical processing of
ROM 2 are shown in Table 13 and in
the annex. The final concentrate had a
Ta2O5 grade of about 10.2 % with a
recovery of almost 11 %. The
enrichment factor for SnO2 was as
high as 79. However, as to the low
grade of the feed, the SnO2 grade was
36.32 %, with a SnO2 recovery of
about 17 %. In the tailings fraction
0.18 % tantalite and 0.36 % SnO2 was
contained. With 83 % of the SnO2 and
89 % of the Ta2O5 remaining in the
waste, efficient recovery of the target minerals has not been achieved. As the waste material of the
artisanal processing tests for mine 2 (mixed Sn-Ta) could not be recovered due to the applied
processing technique (linear ground sluicing). Therefore mechanical reprocessing of the artisanal
waste material was not performed.
Table 13: Mechanical processing results of ROM 2 (Mixed Sn-Ta)
Figure 26: Flow sheet of the mechanical processing
scheme of ROM 2 (Mixed Sn-Ta)

Efficiency of Mineral Processing in Rwanda’s Artisanal and Small-Scale Mining Sector
- 36 -
6.3 Mechanical Processing of ROM 3/Wolframite
Figure 27: Flow sheet of the mechanical processing scheme of ROM 3 (Wolframite)
For sorting the ROM of mine 3 gravity separation was applied by shaking tables and a spiral. The
processing scheme can be seen in the flow sheet in Figure 27. As a first step, screening of the
material produced two fractions, again. In opposite to the previous tests, these fractions were split
again by screening. The fine material of these fractions was fed to a spiral, before sorting on two
shaking table stages. The spiral was applied to produce two further fractions with similar or more
alike physical properties to operate the shaking tables with a higher efficiency. However, the final
heavy products of the shaking tables was combined to form the final concentrate.
The results of the mechanical processing tests of ROM 3 are shown in Table 14. While the feed
grade was about 0.54 % WO3, the concentrate could be enriched by factor 63 to a grade of 35 %
WO3. The recovery rate was 26 %. In the tailings a grade of 0.4 % WO3 was determined. Taking this
into account the waste material
remained with a grade of 0.4 % WO3
and about 74 % of the total target
minerals. The recovered waste
material of the artisanal processing
test has been recovered but was
lost during the drying process.
Therefore mechanical reprocessing
tests with the artisanal waste
material could not be performed.
Table 14: Mechanical processing results of ROM 3 (Wolframite)

Efficiency of Mineral Processing in Rwanda’s Artisanal and Small-Scale Mining Sector
- 37 -
7. Review of Mineral Processing Performance
For further assessment of the performance of
the processing tests, all concentrates have
been analyzed by analytic screening and
geochemical analysis, as described in chapter
3.3. The findings of this analysis provided
information to assess the differences in
performance between artisanal and mechanical
processing, as well as the main points of losses
of target minerals. Figures in this chapter are
only examples representing the most relevant
finings.
In Figure 28 the grain-size distribution of
selected concentrates is shown. On the x-axis
the grain size is indicated in a logarithmic scale.
On the y-axis the cumulative percentage of the
total mass that is passing the screen at the
specific screen sizes is shown. The
concentrates are showing a more narrow
distribution than the ROM, where grains
occurred between 63 µm and 20mm.
More detailed, both concentrates of the
Wolframite feed are showing coarser grain
sizes than those of the mixed Sn-Ta feed. Also,
while in case of the material from Mine 1 (Mixed
Sn-Ta) concentrate 1 is slightly coarser grained
than concentrate 2, this difference is even more
obvious for the artisanal Wolframite
concentrates. This indicated, for the processing
scheme of mine 2 (Mixed Sn-Ta, ground sluice)
and 3 (Wolframite, ground sluice), the average
grain size of the products decrease with
advance in processing stages. However, as
mentioned in chapter 4.2, about 60 % of the
target minerals of Mine 2 (Mixed Sn-Ta) and
about 10 % of the target mineral of Mine 3
(Wolframite) were located in the grain sizes
below 63 µm (see chapter 4.2). This fraction is
more or less abundant in the ore concentrates.
Only the first artisanal concentrate and the
Mechanical concentrate of Mine 3 (Wolframite)
are showing small quantities of this fraction.
Figure 28: Grain size distribution of the
concentrates produced in the processing tests of
mine 2 (Mixed) and mine 3 (Wolframite)

Efficiency of Mineral Processing in Rwanda’s Artisanal and Small-Scale Mining Sector
- 38 -
This indicates that major losses of the target minerals have been suffered in the small grain-size
fraction below 63 µm. This gets even more obvious in Table 15, where the basic grain-size
distribution properties of the produced concentrates and sampled ROMs are show. As can be seen,
all of the concentrates are showing no or only little content of grains below the size of 63 µm. Even
though the mechanical concentrates of Mine 2 (Mixed Sn-Ta) and Mine 3 (Wolframite) managed to
recover small amounts of this fine fraction, it is obvious that neither artisanal, nor mechanical
processing was suitable to selectively process material with a grain-size of below 63 µm. When
looking at Figure 28 it becomes obvious that the curves for the mechanical concentrates are shoving
a steeper curve progression in the lower left than those for artisanal processing. This indicates that
in the mechanical concentrates a higher share of small grain-sizes is present.
Table 15: Basic grain size distribution properties of the produced concentrates and sampled ROMs
Mine 1 / Cassiterite Mine 2 / Mixed Sn-Ta Mine 3 / Wolframite
ROM d50 at 2 mm d50 at 250 µm d50 at 3 mm
Artisanal Conc. d50 at 2.3 mm d50 at 250 and 350 µm d50 at 400 µm and 4 mm
Mechanical Conc. d50 at 500 µm d50 at about 200 µm d50 at 450 µm
ROM 12 % < 63 µm 30 % < 63 µm 25 % < 63 µm
Artisanal Conc. 0 % < 63 µm 0 % < 63 µm 0 and 6 % < 63 µm
Mechanical Conc. 0 % < 63 µm 0 and 6 % < 63 µm 4.5 % < 63 µm
ROM 3.5 % > 20 mm >1 % > 20 mm 15 % > 20 mm
Artisanal Conc. 0 % < 20 mm 0 % < 20 mm 0 % < 20 mm
Mechanical Conc. 0 % < 20 mm 0 % < 20 mm 0 % < 20 mm
As can be seen in Table 15 and Figure 28, the coarsest grain size fraction which has been contained
in the ROMs is missing in the concentrates, as well. In the case of mechanical processing and the
artisanal processing at mine 1 (Cassiterite) this is due to the application of comminution. For Mine 2
(Mixed Sn-Ta) and Mine 3 (Wolframite) no comminution has been applied. This means for the last
two artisanal processing tests, the coarse grain size fractions, including the contained target minerals
have been lost. The amount of these losses will be presented more detailed below.

Efficiency of Mineral Processing in Rwanda’s Artisanal and Small-Scale Mining Sector
- 39 -
7.1 Performance of Processing Tests ROM 1/Cassiterite
Figure 29 shows the target mineral distribution
and grades of target minerals in the different
grain-size fractions of the sample material (ROM)
and the concentrates of the processing tests
(Artisanal/Mechanical) for mine 1 (cassiterite). It
has to be noted that grain size fractions are
defined differently for the concentrate as for the
ROM. The presented mechanical concentrates
are the heavy fraction of the final shaking table
stages for the processed fractions < 2mm
(Mechanical 1) and > 2mm (Mechanical 2). This
was done to evaluate the actual performances of
the density sorting, exclusively. However, as
discussed below, both concentrates are missing
most of the fine and coarse grain sizes.
As for the ROM the main share of target minerals
is contained in the medium sized fractions, this
observation is less critical than for the other two
sampled mines. By having a look at the grades of
the different grain size fractions in the artisanal
concentrate (Artisanal in Figure 29), it stands out
that all relevant fractions are showing a grade of
more than 80 % SnO2. On the other hand, the
grades in the mechanical concentrates are
varying from ca. 30 % and 80 %. This indicates
the artisanal processing recovered only very high
grade SnO2 particles, while leaving grains with
contained barren rock (intergrown) in the waste.
This of course increases the total concentrate
grade but decreases the recovery rate.
In contrast, the grades of the fractions of the first
mechanical concentrate (mechanical 1) is
showing stronger variations. This indicates that
intergrown grains or minor amounts of barren
rocks have been sorted into the heavy fractions.
However, even though this less selective sorting
resulted in a lower overall concentrate grade, a
higher recovery rate has been achieved. Also, as
can be seen in Figure 29, the recovery of target
minerals in the grain-size fraction between 63 µm
and 500 µm of mechanical processing is way
higher than that for artisanal processing This
might be due to a higher amount of target minerals
in that fraction is generated by comminution and
has therefore be assessed further.
Figure 29: Distribution and grade of target
minerals in the different grain-size fractions of
the sample material (ROM) and the produced
concentrates of mine 1 (Cassiterite)

Efficiency of Mineral Processing in Rwanda’s Artisanal and Small-Scale Mining Sector
- 40 -
For Mine 1 (Cassiterite) the artisanal waste material has been reprocessed with mechanical
measures. As shown in chapter 6.1 the reprocessing led to mentionable additional gains of
concentrate. More detailed, these experimental results clearly show that mechanical processing
techniques allow for improving recovery of artisanal processing methods. The concentrate mass of
artisanal processing was 3300 g with a SnO2 grade of 86.98 %. Another 740 g were recovered with
mechanical methods and a SnO2 grade of 59.23 %. This represents increase in product mass of over
20 %. The combined concentrate would still have a grade of 78.5 % SnO2 and therefore be a
marketable product. When assuming a yearly production of about 40 t/a, the increase of concentrate
mass by 20 % would account for further 8 t of 78.5 % SnO2 per year.
Table 16 shows the properties of the final concentrate of each test regarding mine 1 (cassiterite) are
shown. The masses of the concentrates do of course not relate to the percentages of other
properties, as in each processing test, other quantities of feed have been used (Table 6). Also, for
the mechanical reprocessing the feed had another grade than the ROM. For calculating the values
of “additional recovery” the recovery rate of the artisanal processing test have been taken as base
value. However, the two main tests are showing good recovery rates and product grades. This is
most probably due to the concentration of target minerals in the medium sized grain-size fractions,
as those can be processed more efficiently.
The results for the two main tests are showing a better performance for mechanical processing
compared to artisanal processing. While the artisanal processing has left about 40 % of the target
mineral in the waste, the mechanical process lost only about 28 % and hence recovered 12 % more
of the target minerals contained in the feed. Taken into account the performance of the artisanal
processing, mechanical processing showed to exceed its performance of recovery by 21 %.
Additionally, by reprocessing waste material from the artisanal processing test, about 19 % of the
lost target minerals of the artisanal process could be recovered, leading to an increase in
performance of the artisanal process of about 7 %. Taking into account both mechanical tests, the
recovery rate of the artisanal processing test was exceeded by 28.63 %. The main observations of
the test series of mine 1 (cassiterite) are shown in the box below.
Table 16: Performance of the processing tests by final concentrates of mine 1
(Cassiterite)

Efficiency of Mineral Processing in Rwanda’s Artisanal and Small-Scale Mining Sector
- 41 -
Main Findings Mine 1/Cassiterite:
- High performance in terms of grades and recovery of both mechanical and artisanal
processing due to the properties of ROM.
- Mechanical processing exceeds recovery of artisanal processing by 28.63 %.
- Fine grain size fractions could not be recovered with either processing measures.
- The artisanal sorting process was shown to be highly selective, only recovering high
grade material resulting in a high concentrate grade but a reduced recovery rate.
- In terms of capacity the mechanical process showed to be capable of a throughput
of about 1 t/h while the artisanal process has a capacity of a maximum of 250 kg
per hour.
- Potentially higher efficiency of mechanical processing for small grain sizes
(63 µm-500 µm)

Efficiency of Mineral Processing in Rwanda’s Artisanal and Small-Scale Mining Sector
- 42 -
7.2 Performance of Processing Tests ROM 2/Mixed Sn-Ta
Figure 30: Distribution and grade of target minerals in the different grain-size fractions of the sample
material (ROM) and the produced concentrates of mine 2 (Mixed Sn-Ta)
Figure 30 shows the target mineral distribution and grades of target minerals in the different grain-
size fractions of the sample material (ROM) and the concentrate of the processing tests
(Artisanal/Mechanical) for mine 2 (mixed Sn-Ta). Again grain size fractions are defined differently for
the concentrate as well as for the ROM. Distributions and grades shown for the artisanal process are
those of the combined concentrate of ground sluicing stages one and two. Distributions and grades
shown for the mechanical process are those of the final concentrate of the sieved ROM finer than
2 mm. While both concentrates of the mechanical processing showed alike distributions of grain-
sizes and grades, the concentrate of the ROM < 2 has been selected, as no comminutions was
applied to it and therefore the grades in the grain-size fractions have only be affected by sorting.
From Figure 30 it is obvious that most of the target minerals in the ROM have been contained in the
fine grain-size fractions below 63 µm. This fraction contains about 60 % of the total target minerals
in the ROM (chapter 4.2). In contrast, the main share of target minerals in the concentrates (artisanal
and mechanical) is found in the grain size-fractions 125 µm to 250 µm, or in one case in the fraction
250 µm to 500 µm. Therefore, the high amount of target minerals in the fraction below 63 µm was

Efficiency of Mineral Processing in Rwanda’s Artisanal and Small-Scale Mining Sector
- 43 -
lost during the sorting process.
Even though the concentrates tempt to consist of smaller grain with increased number of sorting
stages when linear ground sluicing is applied, it is highly unlikely that the fraction below 63 µm is
recoverable with this process. Grains of such small sizes tempt flow with the process water, even
with low stream velocity, instead of settling on the ground. Especially the usual practice of shoveling
the material against the water stream will lead to the small particles following the turbulent water
stream. Figure 30 shows again that the recovery of the mechanical product is proportionately higher
in the grain-size fractions between 63 µm and 500 µm than that for the artisanal concentrates. As no
comminution has been applied in the shown case for mechanical processing, a higher efficiency of
the applied mechanical sorting measures than that of the respective artisanal processing for fine
grained target minerals has been demonstrated.
However, both sorting attempts (artisanal and mechanical) have not been able to process the ROM
efficiently. As can be seen in the highest recovery rate achieved is that for SnO2 with artisanal
processing. Again, masses of the concentrates in Table 17 do not relate to the percentages of other
properties, as in each processing test, another quantity of feed has been used (Table 6). The
recovery of the artisanal processing test is 44 % higher than that of the mechanical processing. Even
though this is a large number, both recovery rates cannot be described as good results. About
75.59 % of the SnO2 was left in the waste while processing with a ground sluice. For Ta2O5 the
highest recovery rate was 13.35 %, again achieved with artisanal processing. The mechanical
processing only recovered 10.97 % of total Ta2O5 contained in the feed. Artisanal processing
therefore recovered 21.69 % more target mineral than the mechanical processing.
Summed up, both tests showed that the applied sorting schemes worked not efficient. In both cases
the majority of target minerals has been lost in the waste. This of course, is mainly due to the fact
that 60 % of the target minerals are contained in the grain-size fraction below 63 µm and are therefore
not recoverable by density sorting. However, about 40 % of the target minerals have been contained
in coarser grain-sizes, and could have been recovered.
It is reasonable to assume that the target minerals in the medium grain-sizes are not liberated and
therefore the difference in density between grains containing target mineral and grains of barren rock
was not sufficient to separate them by sorting. For this instance it might be considered to use even
more narrow grain size distributions when using the shaking table. Also the supply of process water
should be reduced to increase the potential of target mineral containing grains to be sorted to the
heavy fraction. If further liberation of the target mineral is sought, it has to be considered that
comminution always produces grains which are smaller than the targeted grain size, due to brittle
behavior of the minerals. Therefore, comminution might result in an additional share of target
minerals in not recoverable grain sizes. This is also the main problem that was faced in the test series
of mine 2 (mixed Sn-Ta). As particles of the grain size (<63 µm) are always very light, irrespectively
Table 17: Performance of the processing tests by final concentrates of mine 2 (Mixed)

Efficiency of Mineral Processing in Rwanda’s Artisanal and Small-Scale Mining Sector
- 44 -
their mineralogical composition, they tend to follow the water flow instead of settling on the ground.
Density sorting is therefore not the appropriate sorting method for this kind of grain size. Flotation or
leaching processes would be more suitable for such feeds.
These processes however are quite sophisticated, require advanced process management and also
advanced waste water treatment. Therefore, those methods are not considered to be a good solution
for ASM operations. The main findings of the tests series for mine 2 (mixed Sn-Ta) are shown in the
box below.
Main findings Mine 2/Mixed Cassiterite-Coltan:
- Low performance of mechanical and artisanal processing due to the properties of ROM.
- Artisanal processing exceeds recovery of mechanical processing by 21.69 % (Ta) to
44.48 % (Sn).
- Concentrates lost most of fine grain-size target minerals as they could not be recovered
with either processing measures.
- Higher recovery rates might be possible with vernier adjustment of shaking tables or
additional stages of ground sluicing but most likely without reaching overall satisfying
levels.
- Mechanical processing proved to be more efficient for fine grain sizes (63 µm-500 µm)
- In general, the processed ore material gives a challenge for density sorting measures.
Further testing of multiple sorting techniques and processing schemes is necessary.
Apart from chemical treatment advanced equipment like an upstream-classifier might be
considered for improvement of recovery rate and concentrate grade.

Efficiency of Mineral Processing in Rwanda’s Artisanal and Small-Scale Mining Sector
- 45 -
7.3 Performance of Processing Tests ROM 3/Wolframite
Figure 31 shows the target mineral
distribution and grades of target minerals in
the different grain-size fractions of the sample
material (ROM) and the concentrate of the
processing tests (Artisanal/Mechanical) for
mine 3 (wolframite). Again grain size fractions
are defined differently for the concentrate as
for the ROM. Distributions and grades shown
for the artisanal process are those of the
heavy fractions of the panning stages 1 and
2 (see chapter - 30 -0). Distributions and
grades shown for the mechanical process are
those of the combined final concentrate.
However, it can be seen that the distribution
and grades of the concentrates differ from
that in the ROM.
For the artisanal process no comminution has
been applied, therefore the main share of
WO3 was recovered in the coarse grain-size
fractions, as the distribution of the target
minerals was concentrated in the coarse
fractions of the ROM, as well. For the
mechanical processing all grains coarser
than 2 mm have been comminuted and are
therefore contained in the medium fractions
of the concentrate.
One of the first observations which sticks out
when looking at Figure 31 is probably the low
grade of most of the fractions shown for the
concentrate artisanal 2. Here, the light
fractions of the first panning stage have been
panned again, to recover left target minerals.
This approach showed to be not very
effective, as it produced only a small amount
of a low quality concentrate. Therefore, the
artisanal 1 concentrate might rather be
evaluated closer. Comparing the distributions
and grades of the mechanical concentrate
and that of artisanal 1, it can be found that the
mechanical process recovered a higher
share of its concentrate in the small grain
sizes. Similar observation have been done
before, so this can be seen as an additional
confirmation for the higher efficiency of mechanical processing measures.
Figure 31: Distribution and grade of target
minerals in the different grain-size fractions of the
sample material (ROM) and the produced
concentrates of mine 3 (Wolframite)

Efficiency of Mineral Processing in Rwanda’s Artisanal and Small-Scale Mining Sector
- 46 -
When evaluation the distribution in the concentrate artisanal 2 it might be assumed that a good
efficiency has been achieved for smaller grain-sizes as well. Looking more closely, the low grade of
the recovered fine grained fraction shows that there was no selective sorting performed. Further, the
mechanical concentrate shows higher overall grades of WO3 in the recovered fractions than the
artisanal concentrates. It can therefore be assumed that the mechanical sorting process worked
more selective than the artisanal processing. Most likely this is due to a higher amount intergrown
target minerals in the artisanal feed, while the ROM was liberated by comminution prior to mechanical
processing.
As can be seen in Table 18 both processing tests produced low quality concentrates. The highest
grade and recovery rate was achieved by mechanical processing. Here, a concentrate with a WO3
grade of 34.07 % and a recovery rate of 26.02 % has been produced. The recovery rate of the
mechanical processing is about 16 % higher than that for the artisanal process. However, both
concentrates are not marketable if not enriched further or blended with high quality concentrates.
Regarding the artisanal processing, the low performance is probably explainable with the lack
liberated target minerals and the high amount of target minerals in the large grain size fractions.
When evaluating the target mineral distribution of the ROM (Figure 31), it can be seen that about
75 % of the WO3 in the ROM is contained in the grain-size fractions coarser than 2 mm. As shown
in the beginning of chapter 7 the artisanal concentrates of mine 3 (wolframite) are not containing any
grains coarser than 2 mm and therefore did not recover any of the target minerals contained in the
richest grain-size fractions. Further, as the target minerals tend not to crystallize exclusively in coarse
grains their abundance in the coarse fractions of the ROM is most likely in an intergrown state. With
these findings it is highly recommended to apply comminutions before artisanal processing, as an
attempt to liberate the target minerals and recover those contained in the coarser grain-size fractions.
Even though the mechanical processing techniques do outperform the artisanal techniques, it is
highly likeable that the results could be increased sharply by adjustment of the shaking table
parameters. As the used equipment was lacking in options for adjustment, this assumption could not
be tested. However, it is obvious that the performance of the mechanical processing is poor.
Considering the distribution of target minerals in the grain-size fractions, it a larger share of those is
most probably recoverable. Further testing of mechanical processing techniques is recommended.
Table 18: Performance of the processing tests by final concentrates of mine 3
(Wolframite)

Efficiency of Mineral Processing in Rwanda’s Artisanal and Small-Scale Mining Sector
- 47 -
Main findings Mine 3/Wolframite:
- Low performance of mechanical and artisanal processing.
- Mechanical processing exceeds recovery of artisanal processing by 16.11 %.
- Comminution of coarse grains should be applied before processing with artisanal
measures.
- Possible higher recovery rates with vernier adjustment of shaking tables or
additional stages.
- Mechanical processing proved to be more efficient in fine grain sizes (63 µm-500 µm)

Efficiency of Mineral Processing in Rwanda’s Artisanal and Small-Scale Mining Sector
- 48 -
8. Economic Analysis
The following chapter presents the results of an economic analysis regarding the profitability of each
of the sampled mine operations. The calculations are representing the profitability of the operations
in different scenarios, including the investment in mechanical processing equipment. It has to be
noted that the representative nature of the results is limited as only three operations were taken into
account and only one feed sample was taken at each operation. As ore deposits are usually
heterogeneous, it is very likely that an additional feed sample from another tunnel of the same
operation would lead to slightly different test results. Also, the calculations are depending on the
information that was given during the interviews with mining company employees. Since not all
necessary data could be gathered during these interviews several assumptions were made. Where
necessary assumptions will be explained in footnotes.
The profitability analysis includes the comparison of the different processing techniques that were
tested for each feed. Within each case a low-price, a current-price, and a peak price for the produced
minerals was tested. In the low-price scenario the lowest average annual price within the last 10
years for the corresponding concentrate was assumed. In the current-price scenario the average
export prices from 2015 were assumed for the concentrates. In the peak-price scenario the highest
average annual price within the last 10 years for corresponding concentrates was used.
Additionally, to allow for a comparable results, the operational data details as shown in have been
assumed for each evaluated mine:
Table 19: Fixed operational data which has been assumed for the profitability analysis
Fixed operational data
Annual throughput 2,080 t (for 1t/h, 8h/d and 260d/y)
Evaluated timeframe 10 years
Maintenance costs 10 % of investment annually
Energy costs 0.15 $/kWh on grid, 0.29 $/kWh off grid10
Interest rate 15 %
Individual operational costs have been converted from RWF to USD11. General and Administrative
Expenses12 have been excluded, as such costs could not be evaluated in detail. The selling price of
minerals for the mining companies has been calculated by the three price scenarios (by export prices)
reduced by an exporter share of 16 %13.
Prices which are paid to Mining companies are further influenced by the product grade/quality. For
cassiterite export quality is assumed to be 64 % Sn in the concentrate. For wolframite 60 % WO3 is
the concentrate grade and for tantalite a grade of 26 % Ta2O5 is considered export quality. A bonus
10 Calculated from Diesel consumption generator: 0,26 l/kWh and diesel price of 1,10 $/l
11 Exchange rate: RWF 781 = USD 1
12 For example rent, insurance, utilities and managerial salaries
13 The exporters share is assumed to be 16 % of the export price, even though this is not true for every mineral it gives a good average. This
rate has been take out of the study by Estelle Levin Consulting (2014): Evaluation of Mining Revenue Streams and Due Diligence
Implementation Costs along Mineral Supply Chains in Rwanda. Contract Study for BGR & RNRA; ISBN 978-3-943566-18-5; available online
at: http://www.bgr.bund.de/EN/Themen/Min_rohstoffe/CTC/Downloads/rpt_mining_revenues_rwanda_en.pdf?__blob=publicationFile&v=4

Efficiency of Mineral Processing in Rwanda’s Artisanal and Small-Scale Mining Sector
- 49 -
was added to high quality concentrates, while low quality concentrate grades were charged with a
penalty14. Concentrate grades and recoveries, as well as market prices and production were held
constant over the period of 10 years. Grades and recoveries of each product were taken from the
test series described in chapters 5 and 6.
For theoretical investment in mechanical processing several purchases have been assumed. The
equipment list for mechanical processing is shown in Table 20. The list applies for all mechanical
processing tests. The calculations refer to these tests and therefore in the scenarios for mine 1 and
2 no spiral concentrator and for mine 2 no generator is included in the calculations. The mentioned
roller mill is a small model with a low throughput, which however is sufficient for the operation at
hand. The shaking tables are models from China, which might need some additional improvement
for optimization of the separation. Costs for those improvements are included in the maintenance
budget. All prizes have been found by desk study and prices for equipment which had been available
online.
Table 20: Equipment list for mechanical processing
Device $ per unit Units Throughput [t/h]
Consumption
Energy [kWh/t]
Water [m³/t]
Roller Mill 25,000 1 1 5 0
Double Decker Screen 10,000 1 10 0.3 0
Pump 3,000 1 3 0 15
Shaking Table 3,500 3 1 1 3
Generator 50kW 12,000 1 n/a n/a n/a
Magnetic Separator 10,000 1 10 0.5 0
Spiral concentrator 2,000 1 1.5 0 3
14 Bonuses and penalties were proportional to the reduced or increased concentrate grade compared to the usual export grade. This practice
was confirmed in interviews with local exporters. High quality concentrates are necessary to blend lower quality concentrates to exportable
material and therefore in demand. For average trading grades the above mentioned study was referred to (see 12).

Efficiency of Mineral Processing in Rwanda’s Artisanal and Small-Scale Mining Sector
- 50 -
8.1 Profitability Mine 1/Cassiterite
In Table 21 the profitability analysis for the artisanal process of mine 1 is shown. The received
concentrated price for the mining company is about 9 % lower than the export price in each scenario.
This is the result from a 16 % treatment fee which is charged by the exporter and a bonus since
concentrate grade was 4.5 % higher than export grade. Applying the results of the processing tests
with a processed feed of 2,080 t/y, a concentrate mass of 39.6 t was assumed.
Total annual revenues are varying between 149,248 USD in the low-price scenario to 501,820 USD
in the peak-price scenario. Total annual costs are calculated to vary between 72,046 USD and
226,942 USD. The main cost factor has been identified to be personnel costs.15 Water costs are not
taken into account, as water supply was said to be granted cost free at the operation of mine 1. With
the given parameters the operation would be profitable in all scenarios. Even for the low-price
scenario for cassiterite concentrates (4.14 $/kg), the operation would still achieve an annual profit of
about 50,000 USD.
In the second case for mine 1, whose data is shown in Table 1, it was assumed that some investment
has been made in order to improve profitability, regarding to the equipment listed in Table 20, all
machines have been purchased except for a magnetic separator and a spiral concentrator
(mechanical setup 1 as shown in Table 22). In this scenario the total investment sums up to about
60,500 USD and is depreciated over 7 years with an annual depreciation rate of about 8,643 USD.
The costs for mechanical processing (per kg) is slightly lower than it is for applying artisanal methods.
The operational profit however is slightly higher as the recovery was about 10 % higher (with slightly
lower concentrate grade) for the mechanical processing and therefore more concentrate is produced
out of the same feed mass. Due to depreciation of the machines the net profit within the first 7 years
is lower than when applying artisanal methods. This calculation does not take into account that the
mechanical process could decrease personnel costs, as probably higher qualified and therefore more
expensive personnel would be necessary to maintain and use the equipment. Also, transportation of
ROM and the actual mining process would remain the same with the same demand for workers.
The profitability analysis of the third case for mine 1 is shown in Table 23 (mechanical setup 2). The
only difference to the second case is the simulated purchase of a magnetic separator for the final
processing step. As this step slightly reduces recovery but greatly improves the concentrate grade
the results justify the investment of a magnetic separator of about 10,000 USD (ref. Table 20). By
applying mechanical processing with magnetic separation the average current price per kg for the
mining company could be improved by about 5 % to 8.49 $/kg. Furthermore about 6,500 kg
additional concentrate could be produced per year, which results in a total annual profit in the current
price scenario of about 128,000 USD. Compared to the 113,000 USD that are generated with
artisanal methods, this gives an improvement of about 13 %.
As has been shown in chapter 6.1 the artisanal processing bears the potential to gain additional
recovery by reprocessing the waste material from the artisanal processing.
15 For the case of Mine 1 personnel costs were assumed to be 40 % of the export price per kg, as it is an cooperative and workers are
paid by share, as stated by the mine management.

Efficiency of Mineral Processing in Rwanda’s Artisanal and Small-Scale Mining Sector
- 51 -
Table 21: Profitability analysis of artisanal operation of mine 1
Mine 1/Cassiterite - Artisanal Unit low current high
Export Price USD/kg 4.14 8.91 13.92
Price/kg for Mining Company USD/kg 3.77 8.11 12.67
Feed per year t 2,080 2,080 2,080
Concentrate per year kg 39,595 39,595 39,595
Total Revenue USD 149,248 321,208 501,820
Royalties USD 5,970 12,848 20,073
Net Proceeds USD 143,278 308,360 481,747
Total Personnel Costs USD 65,570 141,118 220,467
Total Energy Costs USD 5,490 5,490 5,490
Total Water Costs USD - - -
Total Fixed Costs USD 985 985 985
Total Costs USD 72,046 147,594 226,942
Operating Profit USD 71,233 160,766 254,805
Depreciation USD - - -
Profit b Tax USD 71,233 160,766 254,805
Tax USD 21,370 48,230 76,441
Net Income USD 49,863 112,536 178,363
Revenue per t feed USD/ton 71.75 154.43 241.26
Revenue per kg conc. USD/kg 3.77 8.11 12.67
Costs per t feed USD/ton 34.64 70.96 109.11
Costs per kg conc. USD/kg 1.82 3.73 5.73
Profit per t feed USD/ton 23.97 54.10 85.75
Profit per kg conc. USD/kg 1.26 2.84 4.50
Return USD
Interest rate % 15.00 15.00 15.00
NPV over 10 years USD 250,250 564,794 895,164
Total Invest USD - - -

Efficiency of Mineral Processing in Rwanda’s Artisanal and Small-Scale Mining Sector
- 52 -
Table 22: Profitability analysis of mechanical operation of mine 1, setup 1
Mine 1/Cassiterite – Mechanical 1 Unit low current high
Export Price USD/kg 4.14 8.91 13.92
Price/kg for Mining Company USD/kg 3.29 7.09 11.08
Feed per year t 2,080 2,080 2,080
Concentrate per year kg 55,173 55,173 55,173
Total Revenue USD 181,733 391,121 611,044
Royalties USD 7,269 15,645 24,442
Net Proceeds USD 174,464 375,476 586,602
Total Personnel Costs USD 91,366 196,636 307,202
Total Energy Costs USD 10,919 10,919 10,919
Total Water Costs USD - - -
Total Maintenance Costs 6,050 6,050 6,050
Total Fixed Costs 985 985 985
Total Costs USD 109,320 214,590 325,156
Operating Profit USD 65,143 160,886 261,446
Depreciation USD 8,643 8,643 8,643
Profit b Tax USD 56,500 152,243 252,803
Tax USD 16,950 45,673 75,841
Net Income USD 39,550 106,570 176,962
Revenue per t feed USD/ton 87.37 188.04 293.77
Revenue per kg conc. USD/kg 3.29 7.09 11.08
Costs per t feed USD/ton 52.56 103.17 156.33
Costs per kg conc. USD/kg 1.98 3.89 5.89
Profit per t feed USD/ton 19.01 51.24 85.08
Profit per kg conc. USD/kg 0.72 1.93 3.21
Return USD
Interest rate % 15.00 15.00 15.00
NPV over 10 years USD 187,036 523,393 876,675
Total Invest USD 60,500 60,500 60,500

Efficiency of Mineral Processing in Rwanda’s Artisanal and Small-Scale Mining Sector
- 53 -
Table 23: Profitability analysis of mechanical operation of mine 1, setup 2
Mine 1/Cassiterite – Mechanical 2 Unit low current high
Export Price USD/kg 4.14 8.91 13.92
Price/kg for Mining Company USD/kg 3.94 8.49 13.26
Feed per year t 2,080 2,080 2,080
Concentrate per year kg 46,176 46,176 46,176
Total Revenue USD 182,087 391,882 612,234
Royalties USD 7,283 15,675 24,489
Net Proceeds USD 174,803 376,207 587,744
Total Personnel Costs USD 76,467 164,570 257,106
Total Energy Costs USD 10,919 10,919 10,919
Total Water Costs USD - - -
Total Maintenance Costs 7,050 7,050 7,050
Total Fixed Costs 985 985 985
Total Costs USD 95,421 183,524 276,060
Operating Profit USD 79,382 192,683 311,684
Depreciation USD 10,071 10,071 10,071
Profit b Tax USD 69,311 182,611 301,613
Tax USD 20,793 54,783 90,484
Net Income USD 48,517 127,828 211,129
Revenue per t feed USD/ton 87.54 188.40 294.34
Revenue per kg conc. USD/kg 3.94 8.49 13.26
Costs per t feed USD/ton 45.88 88.23 132.72
Costs per kg conc. USD/kg 2.07 3.97 5.98
Profit per t feed USD/ton 23.33 61.46 101.50
Profit per kg conc. USD/kg 1.05 2.77 4.57
Return USD
Interest rate % 15.00 15.00 15.00
NPV over 10 years USD 230,146 628,187 1,046,255
Total Invest USD 70,500 70,500 70,500

Efficiency of Mineral Processing in Rwanda’s Artisanal and Small-Scale Mining Sector
- 54 -
8.2 Profitability Mine 2/Mixed Sn-Ta
In Table 24 and Table 25 the profitability analyses of artisanal and mechanical processing operation
of mine 2 are shown. The received concentrated prices for the mining company are more than 50 %
lower than the export price in each scenario. This is the result from a 16 % treatment fee which is
charged by the exporter and an additional fee because of the low concentrate grades. Energy costs
for mechanical processing were calculated with a price of 0.15 USD/kWh, as the operation is
connected to the local power grid. Personnel costs for mine 2 were assumed to be 77 $/m per worker,
as an average of the salaries for the different positions which have been stated by the mine
management. Investments for equipment are the same as assumed for mine 1, including all
machines stated in Table 20, except for a magnetic separator and a spiral concentrator.
Both assumed cases are profitable in all three scenarios. Artisanal processing however creates a
higher net profit (17,000 USD in low-price to 96,000 USD in peak-price scenario) than mechanical
processing (8,000 USD in low-price to 71,000 USD in peak-price scenario). This mainly results from
a higher recovery rate as well as a higher concentrate grade for the artisanal processing tests. As
discussed in chapter 7.2, the results of mechanical processing can most probably be improved by
adjusting parameters of the sorting aggregates. Additional tests with the ROM of mine 1 are
necessary to give a more suitable assumption for the applicability and cost efficiency of mechanical
processing in this case.

Efficiency of Mineral Processing in Rwanda’s Artisanal and Small-Scale Mining Sector
- 55 -
Table 24: Profitability analysis of artisanal operation of mine 2
Mine 2/Mixed Sn-Ta - Artisanal Unit low current high
Export Price Cassiterite USD/kg 4.14 8.91 13.92
Cassiterite Price/kg for Mining Company USD/kg 1.44 3.10 4.84
Export Price Coltan USD/kg 15.41 40.08 54.58
Coltan Price/kg for Mining Company USD/kg 6.93 18.04 24.56
Feed per year t 2,080 2,080 2,080
Cassiterite concentrate per year kg 5,683 5,683 5,683
Coltan concentrate per year kg 5,598 5,598 5,598
Total Revenue USD 47,006 118,585 165,017
Royalties USD 1,880 4,743 6,601
Net Proceeds USD 45,125 113,841 158,417
Total Personnel Costs USD 18,480 18,480 18,480
Total Energy Costs USD 1,843 1,843 1,843
Total Water Costs USD - - -
- - -
Total Fixed Costs USD 492.09 492.09 492.09
Total Costs USD 20,815 20,815 20,815
Operating Profit USD 24,310 93,026 137,602
Depreciation USD - - -
Profit b Tax USD 24,310 93,026 137,602
Tax USD 7,293 27,908 41,281
Net Income USD 17,017 65,118 96,321
Revenue per t feed USD/ton 22.60 57.01 79.34
Revenue per kg conc. USD/kg 8.27 20.87 29.04
Costs per t feed USD/ton 10.01 10.01 10.01
Costs per kg conc. USD/kg 3.66 3.66 3.66
Profit per t feed USD/ton 8.18 31.31 46.31
Profit per kg conc. USD/kg 2.99 11.46 16.95
Return USD
Interest rate % 15.00 15.00 15.00
NPV over 10 years USD 85,405 326,814 483,414

Efficiency of Mineral Processing in Rwanda’s Artisanal and Small-Scale Mining Sector
- 56 -
Table 25: Profitability analysis of mechanical operation of mine 2
Mine 2/Mixed Sn-Ta - Mechanical Unit low current high
Export Price Cassiterite USD/kg 4.14 8.91 13.92
Price/kg Cassiterite for Mining Company USD/kg 1.19 2.56 3.99
Export Price Coltan USD/kg 15.42 40.08 54.58
Price/kg Coltan for Mining Company USD/kg 7.21 18.74 25.52
Feed per year t 2,080 2,080 2,080
Cassiterite concentrate per year kg 4,517 4,517 4,517
Coltan concentrate per year kg 4,474 4,474 4,474
Total Revenue USD 37,619 95,382 132,205
Royalties USD 1,505 3,815 5,288
Net Proceeds USD 36,115 91,567 126,916
Total Personnel Costs USD 6,468 6,468 6,468
Total Energy Costs USD 2,808 2,808 2,808
Total Water Costs USD - - -
Total Maintenance Costs USD 6,050 6,050 6,050
Total Fixed Costs USD 492.09 492.09 492.09
Total Costs USD 15,818 15,818 15,818
Operating Profit USD 20,296 75,748 111,098
Depreciation USD 8,643 8,643 8,643
Profit b Tax USD 11,654 67,106 102,455
Tax USD 3,496 20,132 30,737
Net Income USD 8,158 46,974 71,719
Revenue per t feed USD/ton 18.09 45.86 63.56
Revenue per kg conc. USD/kg 8.33 21.12 29.27
Costs per t feed USD/ton 7.60 7.60 7.60
Costs per kg conc. USD/kg 3.50 3.50 3.50
Profit per t feed USD/ton 3.92 22.58 34.48
Profit per kg conc. USD/kg 1.81 10.40 15.88
Return USD
Interest rate % 15.00 15.00 15.00
NPV over 10 years USD 29,483 224,293 348,482
Total Invest USD 60,500 60,500 60,500

Efficiency of Mineral Processing in Rwanda’s Artisanal and Small-Scale Mining Sector
- 57 -
8.3 Profitability Mine 3/Wolframite
In Table 26 and Table 27 the profitability analyses of artisanal and mechanical processing operations
for mine 3 are shown. Assumptions for operation costs were mostly alike those in chapter 8.2.
The calculations showed that in case of artisanal processing the operation would only be profitable
in the peak-price scenario. It is also noticeable that costs for water are one of the major cost drivers
of the total production costs.16 The case calculations for artisanal processing is somewhat
questionable, as a throughput of 1 t/h was assumed. In reality however material is only processed
once a week, which means that annual production is less than was assumed for the case study. If
mining production could be increased to the desired amount of 1 t/h, mechanical processing could
be profitable.
In the given scenario (Table 27, current pricing) profits of mechanical processing are slightly
negative. There would be an annual loss of about 420 USD. Investment costs for equipment would
be 62,500 USD, but might be reduced to 60,500 USD if the spiral concentrator would be neglected.
Further cost reductions would be achieved by the reduction of water costs. By establishing a
connection to the local water grid or a more advanced rain-water recovery and storing system, annual
costs for water could be reduced and therefore the operation could be made profitable. In the peak-
price scenario the artisanal operation is slightly profitable with an annual profit of 648 USD. The
mechanical operation on the other hand would be profitable with an annual profit of 15,484 USD for
the same pricing scenario. Even though the calculated profits are not very high, it has to be noted
that applying mechanical processing would lead to significant higher income (or less loss), in two of
the three pricing scenarios.
The results of the profitability calculations seem not to be liable for an ongoing mining operation. It
has to be noted that the visited and sampled mine 3 (wolframite) has had already reduced its activities
due to the recent wolframite pricing and little profit which has been generated, prior to this study.
However, it might be the artisanal processing test was below average performance or the sampled
ROM was of exceptional low quality. Further data can be found in the corresponding in Table 26 and
Table 27.
16 Assumption that 50 % of the required water is collected from rain and is therefore free of charge. The other 50 % have to be bought at a price of 150 RWF per gallon, as stated by the mine management.

Efficiency of Mineral Processing in Rwanda’s Artisanal and Small-Scale Mining Sector
- 58 -
Table 26: Profitability analysis of artisanal operation of mine 3
Mine 3/Wolframite – Artisanal Unit low current high
Export Price Wolframite USD/kg 6.59 9.72 16.00
Wolframite Price/kg for Mining Company USD/kg 1.30 1.91 3.15
Feed per year t 2,080 2,080 2,080
Wolframite Concentrate per year kg 10,931 10,931 10,931
Total Revenue USD 14,190.59 20,930.59 34,453.64
Royalties USD 567.62 837.22 1,378.15
Net Proceeds USD 13,622.97 20,093.36 33,075.49
Total Personnel Costs USD 18,480.00 18,480.00 18,480.00
Total Energy Costs USD - - -
Total Water Costs USD 13,176.80 13,176.80 13,176.80
Total Maintenance Costs - - -
Total Fixed Costs 492.09 492.09 492.09
Total Costs USD 32,148.89 32,148.89 32,148.89
Operating Profit USD - 18,525.92 - 12,055.53 926.60
Depreciation USD - - -
Profit b Tax USD - 18,525.92 - 12,055.53 926.60
Tax USD - - 277.98
Net Income / Loss USD - 18,525.92 - 12,055.53 648.62
Revenue per t feed USD/ton 6.82 10.06 16.56
Revenue per kg conc. USD/kg 1.30 1.91 3.15
Costs per t feed USD/ton 15.46 15.46 15.46
Costs per kg conc. USD/kg 2.94 2.94 2.94
Profit per t feed USD/ton - 8.91 - 5.80 0.31
Profit per kg conc. USD/kg - 1.69 - 1.10 0.06
Return USD
Interest rate % 15.00 15.00 15.00
NPV over 10 years USD - 92,977 - 60,504 3,255
Total Invest USD - - -

Efficiency of Mineral Processing in Rwanda’s Artisanal and Small-Scale Mining Sector
- 59 -
Table 27: Profitability analysis of mechanical operation of mine 3
Mine 3/Wolframite – Mechanical Unit low current high
Export Price Wolframite USD/kg 6.59 9.72 16.00
Wolframite Price/kg for Mining Company USD/kg 2.69 3.96 6.52
Feed per year t 2,080 2,080 2,080
Wolframite Concentrate per year kg 9,170 9,170 9,170
Total Revenue USD 24,641.87 36,345.83 59,828.52
Royalties USD 985.67 1,453.83 2,393.14
Net Proceeds USD 23,656.20 34,891.99 57,435.38
Total Personnel Costs USD 6,468.00 6,468.00 6,468.00
Total Energy Costs USD - - -
Total Water Costs USD 13,176.80 13,176.80 13,176.80
Total Maintenance Costs 6,250.00 6,250.00 6,250.00
Total Fixed Costs 492.09 492.09 492.09
Total Costs USD 26,386.89 26,386.89 26,386.89
Operating Profit USD -2,730.69 8,505.10 31,048.49
Depreciation USD 8,928.57 8,928.57 8,928.57
Profit b Tax USD -11,659.27 423.47 22,119.92
Tax USD - - 6,635.98
Net Income / Loss USD -11,659.27 423.47 15,483.94
Revenue per t feed USD/ton 11.85 17.47 28.76
Revenue per kg conc. USD/kg 2.69 3.96 6.52
Costs per t feed USD/ton 12.69 2.88 12.69
Costs per kg conc. USD/kg 2.88 - 0.20 2.88
Profit per t feed USD/ton - 5.61 7.44
Profit per kg conc. USD/kg - 1.27 - 0.05 1.69
Return USD
Interest rate % 15.00 15.00 15.00
NPV over 10 years USD -68,052.55 -13,852.79 65,873.78
Total Invest USD 62,500.00 62,500.00 62,500.00

Efficiency of Mineral Processing in Rwanda’s Artisanal and Small-Scale Mining Sector
- 60 -
9. Conclusions
The review of the processing tests of this study indicates that the efficiency of both artisanal and
(basic) mechanical mineral processing is strongly influenced by the inherent mineralogical properties
of the processed ore. As such, processing options at a given mine site should be evaluated and
optimized on a case-by-case base. For example, both artisanal and mechanical processing worked
fine with the well-liberated, medium-sized ore representing the ROM at mine 1 of this study. In
contrast, at mine 2, the convergence of target minerals in the fine-grained fraction results in low
recovery rates and concentrate grades for both of the performed processing approaches (mechanical
and artisanal). In this case, the main factor to improve processing efficiency refers to the properties
of the processed material which therefore needs to be assessed in detail to adjust the processing
scheme. A suitable assessment of ore properties demands for a proper laboratory which is capable
of identifying the elemental and mineralogical composition of the material which is to be processed.
Further, to evaluate a suitable mechanical processing scheme, an experimental processing plant
with different equipment and options for combination of such is necessary.
The highest recovery rate achieved in the test series was about 73 % (mechanical processing of
pegmatite-hosted cassiterite ore, Mine 1). As the recovery rate in practical application cannot be
100 % but is limited by the investment in processing in proportion to the resulting increase in
recovery, this recovery rate can be assumed to be a good practice. However, most of the performed
tests showed low recovery rates between about 11 % and 25 %. With this, the main share of target
minerals remained in the waste material for the artisanal and mechanical processing tests of mixed
cassiterite-coltan and wolframite ore from Mine 2 and Mine 3, respectively.
It should be noted that a very basic mechanical processing approach was used for the tests in this
study. The recovery rate of mechanical processing could likely be increased beyond what was
achieved here through improving calibration of sorting equipment and additionally adapted
techniques. This would further impact on the economic evaluations presented as case studies for
the present report. For example, application of a jigging machine for pre-concentration of coarse
target minerals is likely to be a suitable technique. It could be used before the grain size fractions
>2 mm are comminuted and recover coarse material before the possibility of over-grinding by
comminution occurs to this fraction. Unfortunately, no jig was available for testing.
Nevertheless, while lacking of options for proper calibration of process water flow and inclination of
the shaking tables, mechanical processing still proved to work more efficiently than traditional
artisanal processing for smaller grain sizes between 0.63 µm and 500 µm. Further, it was found that
ASM operations tend to neglect target mineral concentrations in coarse grained material. It was
observed that artisanal miners sort coarse-grained fractions only by hand, in most cases leading to
a loss of target minerals. Comminution in order to liberate target minerals intergrown with gangue
material in coarse particles was only applied in one ASM operation. From all sampled ASM mines,
the latter operation also had the most efficient artisanal processing scheme in place in terms of
recovery and concentrate grade.
In Table 28 a selection of characteristic features of artisanal and mechanical processing are listed.
The main benefit of artisanal processing is its high flexibility. Since operations have very little
investment costs and personnel costs are the main cost driver, these operations can be extended
easily when demand (and mineral price) increases and can also be cut back or even put on hold
when demand decreases.

Efficiency of Mineral Processing in Rwanda’s Artisanal and Small-Scale Mining Sector
- 61 -
As mechanical processing is in need of financial investment, a specific operating time and a particular
degree of capacity utilization is necessary to ensure cost effectiveness. However, the processing
tests showed that mechanical processing was more efficient in most of the cases.
Table 28: Comparison of benefits of artisanal and mechanical processing techniques
Characteristics of
artisanal processing mechanical processing
Highly flexible (e.g. in response to
metal price fluctuations)
Low investment costs
Personnel costs are the main cost driver
Straightforward technique
Poor monitoring of performance
Low to no assessment of target mineral
distribution
Higher throughput achievable
Consistent
Adjustable
Higher efficiency in small grain sizes
than artisanal processing
Need for monitoring of performance
to asses cost-efficiency
Further benefits of mechanical processing are the consistency and the calibration of processes.
Water supply, amplitude and frequency of each shaking table can be adjusted in order to optimally
fit to the material that is processed.17 When operated correctly shaking tables usually outperform
manual processing methods and therefore increase recovery and/or grade of the concentrate. This
allows for a higher recovery of the deposits target minerals and eventually to a higher profitability of
the operation.
The use of magnetic separation as final processing step allows for production of two individual
concentrates (cassiterite and coltan) instead of one mixed Sn-Ta concentrate. This again leads to
higher concentrate grades as well as higher achievable prices for the mining company or cooperative
when selling concentrates locally. It should be noted, though, that concentrate upgrading to export
grade does take place in Rwanda in any case. The main question is where this upgrading takes
place. In the current practice of the mineral value chain in Rwanda, ASM operations are producing
pre-concentrates which are upgraded to export grade and blended by the local buyer, usually
comptoirs or exporters based out of Kigali. As such, improving concentrate grades already at the
mine level, rather than at the export stage, would represent a shift in national value addition along
the supply chain.
In terms of reducing losses of target minerals by artisanal processing, For ASM operators it might be
reasonable to sell higher amounts of low-grade pre-concentrate with a high recovery rate.18 Further
17Mechanical equipment rented for this study comprised of aged equipment. New equipment presently available for purchasing
should have more options for making detailed calibration.18
e.g. chapter 5.1 artisanal processing of mine 1 showing a recovery rate of 84 % after the first panning stage with a heavy fraction
consisting of 11 % SnO2
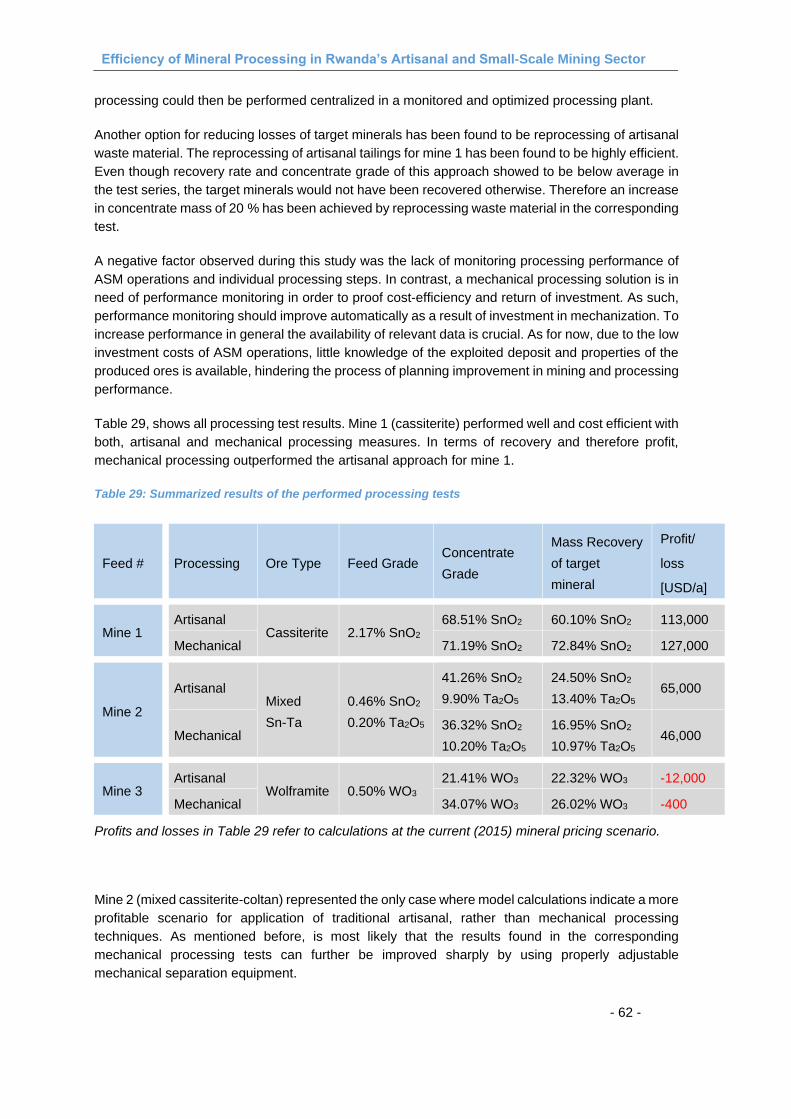
Efficiency of Mineral Processing in Rwanda’s Artisanal and Small-Scale Mining Sector
- 62 -
processing could then be performed centralized in a monitored and optimized processing plant.
Another option for reducing losses of target minerals has been found to be reprocessing of artisanal
waste material. The reprocessing of artisanal tailings for mine 1 has been found to be highly efficient.
Even though recovery rate and concentrate grade of this approach showed to be below average in
the test series, the target minerals would not have been recovered otherwise. Therefore an increase
in concentrate mass of 20 % has been achieved by reprocessing waste material in the corresponding
test.
A negative factor observed during this study was the lack of monitoring processing performance of
ASM operations and individual processing steps. In contrast, a mechanical processing solution is in
need of performance monitoring in order to proof cost-efficiency and return of investment. As such,
performance monitoring should improve automatically as a result of investment in mechanization. To
increase performance in general the availability of relevant data is crucial. As for now, due to the low
investment costs of ASM operations, little knowledge of the exploited deposit and properties of the
produced ores is available, hindering the process of planning improvement in mining and processing
performance.
Table 29, shows all processing test results. Mine 1 (cassiterite) performed well and cost efficient with
both, artisanal and mechanical processing measures. In terms of recovery and therefore profit,
mechanical processing outperformed the artisanal approach for mine 1.
Table 29: Summarized results of the performed processing tests
Feed # Processing Ore Type Feed Grade Concentrate
Grade
Mass Recovery
of target
mineral
Profit/
loss
[USD/a]
Mine 1 Artisanal
Cassiterite 2.17% SnO2
68.51% SnO2 60.10% SnO2 113,000
Mechanical 71.19% SnO2 72.84% SnO2 127,000
Mine 2
Artisanal Mixed
Sn-Ta
0.46% SnO2
0.20% Ta2O5
41.26% SnO2
9.90% Ta2O5
24.50% SnO2
13.40% Ta2O5 65,000
Mechanical 36.32% SnO2
10.20% Ta2O5
16.95% SnO2
10.97% Ta2O5 46,000
Mine 3 Artisanal
Wolframite 0.50% WO3
21.41% WO3 22.32% WO3 -12,000
Mechanical 34.07% WO3 26.02% WO3 -400
Profits and losses in Table 29 refer to calculations at the current (2015) mineral pricing scenario.
Mine 2 (mixed cassiterite-coltan) represented the only case where model calculations indicate a more
profitable scenario for application of traditional artisanal, rather than mechanical processing
techniques. As mentioned before, is most likely that the results found in the corresponding
mechanical processing tests can further be improved sharply by using properly adjustable
mechanical separation equipment.

Efficiency of Mineral Processing in Rwanda’s Artisanal and Small-Scale Mining Sector
- 63 -
The operation of mine 3 (wolframite) showed to not be profitable with the collected data under the
current pricing scenario in any of the tested cases. These negative findings could be caused by
misleading information collected during field work.
The profitability analysis showed, that the mechanical process is more profitable than the artisanal
way, for long term operation (>10 years of operation) of mine 3. It furthermore has to be stated that
in the current artisanal operation only a fraction of the assumed feed rate is processed meaning
losses would be much lower than indicated. Additionally, the service of casual workers and the
selective mining processes are providing a high flexibility level in terms of reacting to changing ore
grades or market prices. Those factors were not taken into account in the profitability analysis and
could result to profit in the actual operation.
For all mines the profitability analysis showed an increase in income over a long time period (> 10
years) of operations with mechanical processing. Additionally, mechanical processing potentially
decreases personnel costs as far as low-skilled labor is concerned (although replacing these jobs
with fewer, higher-skilled but better-paid positions might partly offset this effect). Personnel costs
have been found to be the main drivers of operational expenditures for artisanal operations. Further,
ore throughputs of 250-500 kg/h were recorded when teams of 5-7 persons treated a processing
feed using artisanal methods. In contrast, one single shaking table is able to handle at least 500-
1000 Kg/h (depending on the grain size of the feed) while it only needs 1-2 persons to operate it.
Therefore, mechanical processing is most likely to be applied beneficially for total operational profit,
especially when upscaling the mining activities. On the other hand, mechanization is not necessarily
an economic investment for small, isolated mines that fail to generate a regular ore throughput as
appropriate for the processing equipment to be employed.

Efficiency of Mineral Processing in Rwanda’s Artisanal and Small-Scale Mining Sector
- 64 -
10. Recommendations
In demonstrating the efficiency of artisanal processing techniques at different mines in Rwanda, the
study indicates that significant amounts of 3T minerals of economic interest can be inferred to be left
in tailings and waste of artisanal processing operations. Whether or not these target minerals are
currently recoverable by additional processing, the waste materials and tailings should be considered
as a potential asset. For reducing the risk for lost profits due to inefficient processing measure,
tailings of artisanal processing should be stored properly. A proper waste management concept
would allow reprocessing of prospective materials at a later stage, while decreasing environmental
impacts such as erosion, siltation of surface waters or heavy metal contamination of some water
bodies.
In Rwanda’s long history of 3T mining, there have been a number of attempts to realize the value of
old mine tailings through reprocessing. In some instances, such efforts have been economically
successful and have even been applied at an industrial scale. In other cases, sophisticated
processing plants were installed without economic and operational success. This study corroborates
these experiences in demonstrating the variability of run of mine ore and its implications for mineral
processing. It is therefore highly recommended to test the tailings of ASM operations for residual
contents of cassiterite, coltan and wolframite. As demonstrated in the examples of the reprocessing
of artisanal tailings of mine 1, the reprocessing can significantly increase the total recovery of the
processed ROM. Before applying these processes, however, a scoping study should confirm that
the tailings material at a given site has an acceptable grade, the valuable content occurs in a
recoverable grain-size range, and the overall ore quantity scales with the required feed for the
processing equipment. Mechanical processing is favorable for tailings reprocessing as it generally
allows for a higher throughput and additionally treats the material with sorting properties that have
not been applied before.
Before exploiting a deposit with advanced mining and processing techniques it is necessary to
obtain detailed information on the mineralogical properties of the ore and the size and geometry of
the ore body. During preparation of the field work for this study, the team was challenged to find
available and appropriately equipped processing plants and analytical equipment suitable for
controlling concentrate grades. Before investing in a processing plant, different mechanical
processing schemes should be tested to develop an optimized processing concept with
regards to the site-specific properties of the material to be processed. As long as there is no
testing facility with suitable equipment as well as know-how (qualified staff), only medium scale
operations with high investment potential and highly skilled employees will be able to accurately
assess the technical and economic feasibility of mechanical processing.
Tailings and Waste Management to Secure Future Assets
Reprocessing of Artisanal Waste and Tailings
Infrastructure for Assessment of Ore Properties and Optimized Processing

Efficiency of Mineral Processing in Rwanda’s Artisanal and Small-Scale Mining Sector
- 65 -
When performing artisanal processing, coarse feed fractions should be comminuted in any case.
Even if the visual inspection with the naked eye seems to indicate a relatively low potential, it is likely
that target minerals of economic interest are lodged in intergrown coarse particles. It is difficult or
impossible to distinguish intergrown target minerals without crushing of coarse-grained particles,
unless a hand lens or a microscope are available for experienced users. Comminution, even if done
manually, will reduce the risks of losing unliberated target minerals in those fractions. As shown in
test series for mine 3, large quantities of target minerals have been lost in the coarse grain-size
fractions. The corresponding ASM operation did not prove to be financially viable. This finding was
caused partly by the fact that most of the target minerals were lost to the coarse grain-size fractions
rejected during artisanal processing.
ASM operations are known to be underfunded. Further, skills and knowledge about operational
investments, monitoring of process efficiency and quality management tend to be low. When
stipulating improvement of processing practices and efficiency of production in ASM operations this
instance needs to be considered. Taking into account the share of profit along the value chain19, all
participating actors tend to profit analog from decreased target mineral losses or increased
production capacity. Individual support to ASM operators in evaluating the potential of implementing
mechanical processing in their operations should therefore be considered to serve the self-interest
for involved companies along the value chain. Also, mechanical processing can be assumed to be
the right approach when planning on upscaling operations. Whether such equipment is then added
to the artisanal mine site or provided in centralized processing facilities needs to be tested more
specifically in respect to the involved mining operations..
19Cook, R. & Mitchell, P. (2014): Evaluation of Mining Revenue Streams and Due Diligence Implementation Costs along Mineral Supply
Chains in Rwanda. Contract Study for BGR & RNRA; ISBN 978-3-943566-18-5; available online
at:http://www.bgr.bund.de/EN/Themen/Min_rohstoffe/CTC/Downloads/rpt_mining_revenues_rwanda_en.pdf?__blob=publicationFile&v=4
Comminution of Large Ore Particles to Improve Recovery
Support for Assessment of Potential Upscaling

Efficiency of Mineral Processing in Rwanda’s Artisanal and Small-Scale Mining Sector
- 66 -
References
Cook, R. & Mitchell, P. (2014), Evaluation of mining revenue streams and due diligence implementation costs along mineral supply chains in Rwanda. Contract study for BGR & RNRA; ISBN 978-3-943566-18-5, available online at www.bgr.bund.de/mineral-certification
Micon, I. (2012). Technical Report on a Prefeasibility Study on the Hopes Advanced Bay Iron Deposits. "Estimated life-of-mine iron weight recovery is 37.6 %, p. 12.
Pohl, W. (1987). Metallogeny of the northeastern Kibaran belt, Central Africa.
Pohl, W., Biryabarema, M. & Lehmann, B. (2013). Early Neoproterozoic rare metal (Sn, Ta, W) and gold metallogeny of the Central Africa Region: a review. Applied Earth Science122, 66-82
Schubert, e. a. (1989). Response of the Hadley circulation to convective forcing in ITCZ. SCI. 46.
SRK Consulting. (2015). Gold Bar Project Feasibility Study Eureka County, Nevada. In "Gold recovery of 78 % is projected for a throughput of 8,050 tons per day" (p. 1). Lakewood CO: McEwen Mining.
Tack, e. a. (2010). THE “KIBARAN BELT” OF CENTRAL AFRICA: WHAT’S IN A NAME.
Varlamoff, N. (1972). Central and West African rare-metal granitic pegmatites, related aplites, quartz veins and mineral deposits.Mineralium Deposita.

Efficiency of Mineral Processing in Rwanda’s Artisanal and Small-Scale Mining Sector
- 67 -
Figures Figure 1: Sketch Map of the “Kibara Belt senso lato”, showing the General NE–SW Extension of the Belt (Tack et.al. 2010) .......................................................................................................... - 3 - Figure 2: Map of Rwanda with indicated locations of the selected mine sites (google maps) ....... - 8 - Figure 3: Workers are splitting the bulk samples representatively after homogenization. Left: riffle splitting, half of the sample goes to the right, the other half to the left; Right: Quartering, by quartering the pile and combining the quarters opposite to each other, two representative samples are formed ...................................................................................................................... - 10 - Figure 4: Panning process in prepared washing pond ................................................................. - 11 - Figure 5: Circuit ground sluicing with material feeding (1), moving of the material in the opposite direction of the water flow (2) and supply of the water stream (3) ................................. - 12 - Figure 6: Linear ground sluicing. (1) Feeding of the ROM and water; (2) first concentration stage and narrowing of water stream/reducing water mass and velocity with a shovel; (3) second concentration stage; (4) possible third concentration stage. ........................................... - 13 - Figure 7: Visual evaluation and handpicking of coarse rocks after panning ................................ - 13 - Figure 8: Artisanal air classification (Tap & Blow). The blue arrows are showing the air flow, created by the worker; the red arrows are showing the movement of the pan. ........................... - 14 - Figure 9: Artisanal magnetic separation of a mixed concentrate with manual magnet (red circle) ............................................................................................................................................ - 14 - Figure 10: Schematic drawing of concept of intergrown and liberated particles .......................... - 15 - Figure 11: Different scenarios for applying comminution ............................................................. - 16 - Figure 12: Spiral concentrator fed with liquid pulp. ...................................................................... - 17 - Figure 13: Schematic drawing of flow directions inside a spiral concentrator. Lower stream (2) directing to the inside of the spiral and top stream (1) directing to the outside of the spiral. (Schubert, 1989) ........................................................................................................................... - 17 - Figure 14: Schematic drawing of the principle of operation of a shaking table. ........................... - 18 - Figure 15: Modern shaking table with separated flows of middling fraction (1), heavy fraction (2) and light/slimes fraction (3) ..................................................................................................... - 19 - Figure 16: Magnetic separator with multiple electromagnets of variable magnetic intensity. The feed section is at (1) where the material is put on a vibratory feeder. At (2) the high magnetic fraction is separated by a low energy magnetic field. At (3) another high magnetic fraction is separated. At (4) low magnetic materials are removed and at (5) nonmagnetic material remains. ........................................................................................................................................ - 20 - Figure 17: Distribution and grades of the respective target minerals in the grain-size fractions . - 24 - Figure 18: Transmitted light microscopy picture of the grain-size fraction 63-125 µm of ROM 1 ...................................................................................................................................................... - 25 - Figure 19: Transmitted light microscopy picture of grain-size fraction 125-250 µm of ROM 2 .... - 26 - Figure 20: Picture of reflected-light microscopy of the grain-size fraction 2 mm to 5 mm of ROM 2 .................................................................................................................................................... - 26 - Figure 21: Picture of reflected-light microscopy of grain-size fraction 0,5-1 mm of ROM 3 ......... - 27 - Figure 22: Flow sheet of the artisanal processing scheme of mine 1 (Cassiterite) ...................... - 28 - Figure 23: Flow sheet of the artisanal processing scheme of mine 2 (Mixed Sn-Ta) .................. - 29 - Figure 24: Flow sheet of the artisanal processing scheme of mine 3 (Wolframite) ..................... - 30 - Figure 25: Flow sheet of the mechanical processing scheme of ROM 1 (Cassiterite) ................ - 33 - Figure 26: Flow sheet of the mechanical processing scheme of ROM 2 (Mixed Sn-Ta) ............. - 35 - Figure 27: Flow sheet of the mechanical processing scheme of ROM 3 (Wolframite) ................ - 36 - Figure 28: Grain size distribution of the concentrates produced in the processing tests of mine 2 (Mixed) and mine 3 (Wolframite) ............................................................................................... - 37 - Figure 29: Distribution and grade of target minerals in the different grain-size fractions of the sample material (ROM) and the produced concentrates of mine 1 (Cassiterite) ......................... - 39 - Figure 30: Distribution and grade of target minerals in the different grain-size fractions of the sample material (ROM) and the produced concentrates of mine 2 (Mixed Sn-Ta) ...................... - 42 - Figure 31: Distribution and grade of target minerals in the different grain-size fractions of the sample material (ROM) and the produced concentrates of mine 3 (Wolframite) ......................... - 45 -

Efficiency of Mineral Processing in Rwanda’s Artisanal and Small-Scale Mining Sector
- 68 -
Tables Table 1: Characteristics and criteria for selecting suitable mine sites ........................................... - 7 - Table 2: Selected mines sites and some of their characteristics ................................................... - 9 - Table 3: Benefits of applying screening measures prior to processing ........................................ - 15 - Table 4: Aspects to consider in order to optimize shaking table performance ............................. - 19 - Table 5: Type of operational data gathered on-side .................................................................... - 21 - Table 6: Dry masses of bulk samples .......................................................................................... - 22 - Table 7: Basic grain size distribution properties of the sampled ROMs ....................................... - 23 - Table 8: Artisanal processing results of ROM 1 (Cassiterite) ...................................................... - 29 - Table 9: Artisanal processing results of ROM 2 (Mixed) .............................................................. - 30 - Table 10: Artisanal processing results of ROM 3 (Wolframite) .................................................... - 31 - Table 11: Mechanical processing results of ROM 1 (Cassiterite) ................................................ - 34 - Table 12: Mechanical reprocessing results of artisanal tailings of mine 1 (Cassiterite) .............. - 34 - Table 13: Mechanical processing results of ROM 2 (Mixed Sn-Ta) ............................................. - 35 - Table 14: Mechanical processing results of ROM 3 (Wolframite) ................................................ - 36 - Table 15: Basic grain size distribution properties of the produced concentrates and sampled ROMs ............................................................................................................................................ - 38 - Table 16: Performance of the processing tests by final concentrates of mine 1 (Cassiterite) ..... - 40 - Table 17: Performance of the processing tests by final concentrates of mine 2 (Mixed) ............ - 43 - Table 18: Performance of the processing tests by final concentrates of mine 3 (Wolframite) ..... - 46 - Table 19: Fixed operational data which has been assumed for the profitability analysis ............ - 48 - Table 20: Equipment list for mechanical processing .................................................................... - 49 - Table 21: Profitability analysis of artisanal operation of mine 1 ................................................... - 51 - Table 22: Profitability analysis of mechanical operation of mine 1, setup 1 ................................. - 52 - Table 23: Profitability analysis of mechanical operation of mine 1, setup 2 ................................. - 53 - Table 24: Profitability analysis of artisanal operation of mine 2 ................................................... - 55 - Table 25: Profitability analysis of mechanical operation of mine 2 .............................................. - 56 - Table 26: Profitability analysis of artisanal operation of mine 3 ................................................... - 58 - Table 27: Profitability analysis of mechanical operation of mine 3 .............................................. - 59 - Table 28: Comparison of benefits of artisanal and mechanical processing techniques .............. - 61 - Table 29: Summarized results of the performed processing tests ............................................... - 62 -

Annex

Efficiency of Mineral Processing in Rwanda’s Artisanal and Small-Scale Mining Sector
- 70 -
Annex All analytical data can be received upon request.
1. Sample Characterization Mine 1: The sample of Mine 1 was taken from a heavily weathered pegmatitic deposit. In Figure 1 the grain size distribution of the feed sample is shown. On the x-axis the grain size is indicated in logarithmic scale. On the y-axis the cumulative percentage of the total mass that is passing the screen at each grain size is shown. This will be consistent for all following grain size distributions as well. The d50 is at about 2 mm. Almost 12 % of the mass are below 63 µm and about 3.5 % are coarser than 20 mm.
Figure 1: Grain size distribution Mine 1
In Figure 2 a microscopic picture of the grain size fraction 63-125 µm of the feed is shown. The picture was taken with transmitted light to give an impression of the amount of mica in the feed. All clear parts of the picture are mica or quartz. They can be distinguished from each other by their crystal structure. Quartz can be identified by its conchoidal fracture with cubic shapes (red circle in Figure 2), while mica shows a flaky shape with even fractures. The black parts are other minerals, which cannot be distinguished from each other in transmitted light. Next to the clear mica and quartz particles, cassiterite and some iron minerals like hematite and magnetite are present in the feed.
0
10
20
30
40
50
60
70
80
90
100
10 100 1000 10000 100000
Pas
sin
g [%
]
Screen size [µm]

Efficiency of Mineral Processing in Rwanda’s Artisanal and Small-Scale Mining Sector
- 71 -
Figure 2: Transmitted light microscopic picture, Fraction 63-125 µm Mine 1
The cassiterite (SnO2) grade of Mine 1 was determined to be 2.17 % by chemical analysis. Further, elements in the feed are about 4.5 % iron (Fe) which is present mainly in magnetite (Fe3O4) and hematite (Fe2O3) complexes. About 15 % aluminum (Al) is present in the feed, which in combination with about 6 % potassium (K) most likely is part of the mica. Mica was also found to be the dominant mineral in the feed. About 20 % silicon (Si) are split between mica and quartz as well as some minor amounts of feldspar. The contained SnO2 is distributed over the grain size fractions as shown in Figure 3. The blue columns indicate the percentage of cassiterite in each fraction with regard to the total contained cassiterite and are related to the primary y-axis. The red dots show the cassiterite grade in each fraction and are related to the secondary y-axis. This scheme will be consistent for the following value material distributions.
About 70 % of the SnO2 is contained in the grain size fractions between 1 mm and 11.2 mm. Another 14 % is contained above 11.2 mm and about 8 % SnO2 are in the fraction between 0.5 and 1 mm. This leaves about 8 % Sn in the fractions below 0.5 mm.
Evaluation of the Sn-grade in each fraction shows that the fraction <63 µm has the lowest grade of 0.2 %. The SnO2-grade basically increases with increasing grain sizes between 63 µm and 11.2 mm where a grade of about 38 % was measured. In the fraction between 11.2 and 20 mm it drops back to 2.1 %. The maximum SnO2-grade was analyzed in the fraction above 20 mm, showing 4.2 % SnO2.

Efficiency of Mineral Processing in Rwanda’s Artisanal and Small-Scale Mining Sector
- 72 -
Figure 3: Cassiterite distribution over grain size fractions and grade of each grain size fraction of Mine 1
A visual analysis shows that in the fractions above 5 mm some interlocking of the cassiterite with barren rock exists. Anyways, major parts of the particles are liberated throughout all grain size fractions, setting up good conditions for density separation. The fact that most value material is contained in rather coarse grain sizes also is a good base for density separation. Particles smaller than 125 µm are especially difficult to recover by means of density sorting.
2. Sample Characterization Mine 2: The sample of Mine 2 was taken from a pegmatitic deposit with overlaying shale. The pegmatites in the deposit are intensively weathered. All feldspar has turned into kaolin. Only quartz has remained intact, due to its hardness. The grain size distribution of the sample in Figure 4 shows that the d50 is at about 250 µm. Almost 30 % of the mass are below 63 µm and only about 2.5 % are coarser than 20 mm. Compared to the samples Mine 1 and Feed 2, the grain size is rather low.
0,000,501,001,502,002,503,003,504,004,50
0
5
10
15
20
25
30
35
40
SnO
2G
rad
e [
%]
Am
ou
nt
of
SnO
2in f
ract
ion [
%]
Grain size Fraction [µm]
Cassiterite Distribution Cassiterite Grade

Efficiency of Mineral Processing in Rwanda’s Artisanal and Small-Scale Mining Sector
- 73 -
Figure 4: Grain size distribution Mine 2
The transmitted light microscopic picture in Figure 5 shows the grain size fraction between 125 µm and 250 µm of Mine 2. It is visible that, almost all particles are transparent. The transparent particles are mostly quartz and kaolinite. Further, minerals in the sample are several iron minerals. Magnetite and hematite complexes were identified as well as limonite and goethite. The target minerals are cassiterite and coltan.
Figure 5: Transmitted light microscopic picture, Fraction 125-250 µm Mine 2
The tantalite distribution over the grain size fractions of the feed in Figure 6 reveals that over 60 %
0
10
20
30
40
50
60
70
80
90
100
10 100 1000 10000 100000
Pas
sin
g [%
]
Screen size [µm]

Efficiency of Mineral Processing in Rwanda’s Artisanal and Small-Scale Mining Sector
- 74 -
of all contained tantalite is in the finest fraction below 63 µm. Further 10 % are contained in the fraction 63-125 µm. This is crucial information as it will be almost impossible to selectively recover those particles by simple means of density sorting. Further 20 % are contained in the fractions between 125 µm and 2000 µm. Only about 5 % of the tantalite is coarser than 2 mm.
The tantalite grade in each fraction looks similar to the distribution: Below 63 µm the grade is about 0.44 %. The fractions between 63 µm and 2000 µm have grades between 0.09 % and 0.23 %- Above 2 mm the grades vary between 0.01 % and 0.05 %.
Figure 6: Tantalite distribution over grain size fractions and grade of each grain size fraction of Mine 2
In Figure 7 the cassiterite distribution over the grain size fractions and the cassiterite grades in each fraction are shown. In the fraction below 63 µm 60 % of the total cassiterite is contained. In the fractions between 63 µm and 1000 µm 4.5 % and 6.7 % are contained in each fraction. Further 13 % are contained in the fraction between 1 mm and 2 mm. The remaining 4 % are above 2 mm.
With above 0.9 % the fraction between 1 mm and 2 mm has the highest cassiterite grade of all fractions followed by the fraction below 62 µm with about 0.75 %. The grades of the fractions between 63 mm and 1000 µm vary from 0.14 % to 0.33 %. Above 2 mm all fractions have cassiterite grades below 0.1 %.
The visual evaluation reveals that in the fractions above 500 µm several cassiterite and coltan particles are still interlocked in quartz matrixes. In order to further concentrate those particles, comminution will be necessary. Below 500 µm most particles seem to be liberated, however not many value particles could be found in the feed.
0,000,050,100,150,200,250,300,350,400,450,50
0
10
20
30
40
50
60
70
Ta2O
5G
rad
e [
%]
Am
ou
nt
of
Ta2O
5in f
ract
ion [
%]
Grain size Fraction [µm]
Tantalite Distribution Tantalite Grade

Efficiency of Mineral Processing in Rwanda’s Artisanal and Small-Scale Mining Sector
- 75 -
Figure 7: Cassiterite distribution over grain size fractions and grade of each grain size fraction of Mine 2
3. Sample Characterization Mine 3: Mine 3 was collected from various stockpiles. The corresponding deposit consists of quartz veins, out of which medium to coarse grained wolframite is mined. Figure 8 shows the grain size distribution of the feed. It is noticeable that about 25 % of the mass are below 63 µm and about 15 % are above 20 mm. The d50 is at about 3 mm which shows that Mine 3 is generally coarser than the other three feed samples.
Figure 8: Grain size distribution Mine 3
Figure 9 shows the reflected light microscopic picture of the grain size fraction between 500 µm and 1000 µm of Mine 3. Transparent and dark particles are about evenly distributed. The transparent particles are quartz. The darker particles are different minerals. A lot of graphitic minerals are present which can be identified by their soft structure and their black streak. Ferberite (FeWO4) seems to be the main wolframite mineral contained. It can be distinguished from
0,000,100,200,300,400,500,600,700,800,901,00
0
10
20
30
40
50
60
70
SnO
2G
rad
e [
%]
Am
ou
nt
of
SnO
2in f
ract
ion [
%]
Grain size Fraction [µm]
Cassiterite Distribution Cassiterite Grade
0
10
20
30
40
50
60
70
80
90
100
10 100 1000 10000 100000
Pas
sin
g [%
]
Screen size [µm]

Efficiency of Mineral Processing in Rwanda’s Artisanal and Small-Scale Mining Sector
- 76 -
hübnerite (MnWO4), which is the other main wolframite mineral, by its chemical formula and the color of the streak. Since almost no manganese is present in the feed and the streak color of the tungsten rich particles is brownish it is likely that ferberite is the main tungsten mineral. Besides the mentioned minerals, some limonite covers several particles and goethite particles were identified.
Figure 9: Reflected light microscopic picture of the grain size fraction between 500 µm and 1000 µm of Mine 3
The overall WO3 grade was determined to be about 5 %. The Fe grade of the feed was about 1.9 % and most probably splits between ferberite, goethite and limonite. Arsenic (As) is present with 0.03 %. The presence of 0.63 % titanium (Ti) suggests that ilmenite is also contained in the feed. Silicon accounts for 26 % of the feed and aluminum and potassium are present with grades of 12 % and 4.8 % respectively.
In Figure 10 the wolframite distribution over all grain size fractions and the wolframite grade in each fraction is shown. About 10 % WO3 are contained in the fraction below 63 µm. The fractions from 63 µm to 2000 µm combined contain about 15 % of the total WO3. From 2-5 mm further 15 % are contained. The remaining 60 % are contained in the fractions above 5 mm.
The highest WO3 grade (9.6 % WO3) was found in the fraction 5-11.2 mm. Above 20 mm the grade was about 8.5 %. It is noticeable that in the fraction between those two high grade fractions from 11.2-20 mm the lowest WO3 grade (1 % WO3)of all fractions was measured. The origin of

Efficiency of Mineral Processing in Rwanda’s Artisanal and Small-Scale Mining Sector
- 77 -
this anomaly could not be identified. In the fractions between 250 µm and 5000 µm the grade varies between 4.5 % and 6.9 %. Between 63 µm and 250 µm grades of about 3 % WO3 were determined. The WO3 grade below 63 µm is about 1.8 %.
Figure 10: Wolframite distribution over grain size fractions and grade of each grain size fraction of Mine 2
Due to the overall darkness of the particles it is hardly possible to visually determine the extent of liberation of the wolframite particles. Especially in the finer fractions below 500 µm particles seem to be widely liberated. Above 500 µm quartz still seems to be interlocked with wolframite.
0,00
0,20
0,40
0,60
0,80
1,00
1,20
0
5
10
15
20
25
30
35
WO
3G
rad
e [
%]
Am
ou
nt
of
WO
3in f
ract
ion [
%]
Grain size Fraction [µm]
Wolframite Distribution Wolframite Grade

Efficiency of Mineral Processing in Rwanda’s Artisanal and Small-Scale Mining Sector
- 78 -
4. Processing flow sheets with analytical results of the products
The following flow sheets are showing the processing schemes including the results of chemical analysis. Unfortunately not all products could be recovered, leaving some of the flow sheets incomplete or absent.
Figure 11: Flow-sheet of artisanal processing scheme of mine 1. The numbers underneath the process names indicate mass recovery (red number on the left) in percent, SnO2 grade (blue number in the middle) in percent and SnO2 recovery (blue number on the right) in percent. Reprocessing of Panning stage two indicates mechanical reprocessing.

Effic
ienc
y of
Min
eral
Pro
cess
ing
in R
wan
da’s
Art
isan
al a
nd S
mal
l-Sca
le M
inin
g Se
ctor
- 84
-
Fig
ure
12: F
low
-she
et o
f mec
han
ical
pro
cess
ing
test
s of
feed
frac
tion
<2
mm
of M
ine
1

Effic
ienc
y of
Min
eral
Pro
cess
ing
in R
wan
da’s
Art
isan
al a
nd S
mal
l-Sca
le M
inin
g Se
ctor
- 85
-
Fig
ure
13:
Flo
w-s
heet
of m
echa
nic
al p
roce
ssin
g te
sts
of fe
ed fr
actio
n >
2 m
m o
f Min
e 1

Effic
ienc
y of
Min
eral
Pro
cess
ing
in R
wan
da’s
Art
isan
al a
nd S
mal
l-Sca
le M
inin
g Se
ctor
- 86
-
Fig
ure
14:
Flo
w-s
heet
of m
echa
nic
al p
roce
ssin
g te
sts
of fe
ed fr
actio
n <
2 m
m o
f min
e 2

Effic
ienc
y of
Min
eral
Pro
cess
ing
in R
wan
da’s
Art
isan
al a
nd S
mal
l-Sca
le M
inin
g Se
ctor
- 87
-
F
igur
e 1
5: F
low
-she
et o
f mec
han
ical
pro
cess
ing
test
s of
feed
frac
tion
>2
mm
of m
ine
2
Sam
ple
Mas
s Re
c. [%
]Sn
O2
Gra
de
[%]
SnO
2R
ec. [
%]
Ham
me
r Mill
0,5
70
,05
2,4
40
,12
0,6
0
2-2
0 m
m F
ract
ion 9
,56
0,0
79
25
,84
0,1
56
8,2
6
Ro
ller M
ill /
Scre
en
0,0
81
0,1
38
,86
0,1
52
8,2
8
Shak
ing
Tab
le 6 M
idd
ling
0,1
80
,55
0,4
61
,26
0,4
6
Shak
ing
Tab
le 6 L
igh
t
0,0
30
,05
0,0
10
,06
0,0
0
Shak
ing
Tab
le 6
0,2
84
,31
5,7
01
1,8
36
,80
Scre
en
0,2
11
00
2-2
0 m
m>2
0 m
m
<20 m
m2
-20 m
m
<2 m
m
mid
dlin
gh
eavy
ligh
t
he
avy
mid
dlin
glig
ht
10
00
,49
10
0
Shak
ing
Tab
le 4 L
igh
t
18
,40
0,0
40
3,4
6
Shak
ing
Tab
le 4
0,0
81
0,1
3
Shak
ing
Tab
le 4 M
idd
ling
8,5
70
,02
0,8
1
Shak
ing
Tab
le 5
1,3
0,9
57
5,8
7
mid
dlin
gh
eav
ylig
ht
8,8
60
,15
28
,28
0,0
41
,50
0,0
20
,35
2,6
37
,01
Shak
ing
Tab
le 5 L
igh
t
0,7
30
,03
0,1
0
Shak
ing
Tab
le 5 M
idd
ling
0,2
90
,05
0,0
70
,08
0,1
20
,15
0,0
9
Ta2O
5G
rad
e [%
]Ta
2O
5 R
ec. [
%]
Co
nce
ntr
ate
2
0,0
81
4,3
95
,23
40
,12
6,3
4

Efficiency of Mineral Processing in Rwanda’s Artisanal and Small-Scale Mining Sector
- 88 -
Figure 16: Individual concentrate grades and recoveries of artisanal processing Concentrates 1 and 2 of mine 3

Effic
ienc
y of
Min
eral
Pro
cess
ing
in R
wan
da’s
Art
isan
al a
nd S
mal
l-Sca
le M
inin
g Se
ctor
- 89
- F
igur
e 1
7: F
low
-she
et o
f mec
han
ical
pro
cess
ing
test
s of
feed
frac
tion
<2
mm
of m
ine
4 (n
ot e
valu
ate
d in
the
stud
y)
Taili
ngs
0,0
03
0,1
79
0,0
10
,90
60
,02
Cas
site
rite C
on
cen
trat
e 1
0,0
31
,25
40
,61
14
,91
2,8
7
Co
ltan
Co
nce
ntr
ate
1
0,0
46
,26
53
,54
1,3
10
,29
Mag
net
ic S
epar
ato
r
0,6
23
,78
4,1
57
,28
3,1
8
Shak
ing
Tab
le 2 L
igh
t
0,1
90
,03
0,0
90
,10
80
,13
Shak
ing
Tab
le 2 M
idd
ling
0,5
60
,15
51
,38
0,2
88
1,0
2
Shak
ing
Tab
le 2
0,8
20
,43
5,6
3
Shak
ing
Tab
le 1
0,0
64
55
,53
Shak
ing
Tab
le 1 M
idd
ling
5,5
80
,02
82
,50
Shak
ing
Tab
le 1 L
igh
t 4
6,0
70
,06
24
5,4
1
mid
dlin
glig
ht
hea
vy
Scre
en
0,0
61
00
1-2 m
m F
ract
ion 1
6,2
70
,13
<1 m
m
<1 m
m F
ract
ion 1
8,1
40
,06
1-2 m
m
mid
dlin
gh
eavy
ligh
t
low m
agn
etic
no
n m
agh
igh m
ag
Sam
ple
Mas
s Rec
. [%
]Sn
O2
Gra
de
[%]
SnO
2R
ec. [
%]
10
00
,16
10
0
7,8
30
,05
2,5
03
7,2
60
,05
24
4,6
3
20
,64
0,0
65
2,4
6
Ta2O
5G
rad
e [%
]Ta
2O5 R
ec. [%
]
0,8
34
,33
0,0
58
2,0
60
,05
14
,25

Effic
ienc
y of
Min
eral
Pro
cess
ing
in R
wan
da’s
Art
isan
al a
nd S
mal
l-Sca
le M
inin
g Se
ctor
- 90
-
F
igur
e 1
8: F
low
-she
et o
f mec
han
ical
pro
cess
ing
test
s of
feed
frac
tion
>2
mm
of m
ine
4 (n
ot e
valu
ate
d in
the
stud
y)

Bundesanstalt für Geowissenschaften und RohstoffeStilleweg 230655 Hannover
ISBN: 978-3-943566-86-4 (PDF)