report on demonstrable progress - unfcccunfccc.int/resource/docs/dpr/lva1.pdf · the latest...
TRANSCRIPT
Report
of the Republic of Latvia
on Demonstrable Progress
under the Kyoto Protocol
to the United Nations
Framework Convention
on Climate Change
Report
of the Republic of Latvia
on Demonstrable Progress
under the Kyoto Protocol
to the United Nations
Framework Convention
on Climate Change

R E P O R T O F T H E R E P U B L I C O F L A T V I A O N D E M O N S T R A B L E P R O G R E S S U N D E R T H E K Y O T O P R O T O C O L T O T H E U N I T E D N A T I O N S F R A M E W O R K C O N V E N T I O N O N C L I M A T E C H A N G E
____________________________________________________________________________________________________________________________
1
Report of the Republic of Latvia
on Demonstrable Progress under the Kyoto Protocol to the
United Nations Framework Convention on Climate Change
Riga, 2006
R E P O R T O F T H E R E P U B L I C O F L A T V I A O N D E M O N S T R A B L E P R O G R E S S U N D E R T H E K Y O T O P R O T O C O L T O T H E U N I T E D N A T I O N S F R A M E W O R K C O N V E N T I O N O N C L I M A T E C H A N G E
____________________________________________________________________________________________________________________________
2
Contact information: Ministry of the Environment of the Republic of Latvia Climate and Renewable Energy Department Peldu Street 25, Riga, LV-1494, Latvia Telephone: +371 7026567 Facsimile: +371 7820442 E-mail: [email protected] Homepage: http://www.vidm.gov.lv Publisher: Ministry of Environment of the Republic of Latvia Printed: Apgāds Mantojums Ltd. Cover photo: Andris Soms Graphical art designer: Haralds Apinis
R E P O R T O F T H E R E P U B L I C O F L A T V I A O N D E M O N S T R A B L E P R O G R E S S U N D E R T H E K Y O T O P R O T O C O L T O T H E U N I T E D N A T I O N S F R A M E W O R K C O N V E N T I O N O N C L I M A T E C H A N G E
____________________________________________________________________________________________________________________________
3
CONTENTS
1. INTRODUCTION 5
2. NATIONAL POLICIES AND MEASURES 5
2.1 Policy-making process 5 2.1.1 Historical overview 5 2.1.2 Policy instruments 7 2.1.3 Institutions for the implementation of policies and measures 8
2.2 Sectoral policies and measures since 1990 8 2.2.1 Energy, including transport 9 2.2.2 Industrial processes 15 2.2.3 Solvent and other product use 17 2.2.4 Agriculture 17 2.2.5 Land-use change and forestry 19 2.2.6 Waste 20 2.2.7 Cross-sectoral policies and measures 21
3. TRENDS AND PROJECTIONS OF GREENHOUSE GAS EMISSIONS 24
3.1 Trends of greenhouse gas emissions since 1990 24 3.1.1 Energy, including transport 26 3.1.2 Industrial processes 29 3.1.3 Use of solvent and other product 31 3.1.4 Agriculture 32 3.1.5 Land-use change and forestry 34 3.1.6 Waste 35
3.2 Projections of greenhouse gas emmissions and CO2 removals in 2005 – 2020 37 3.2.1 Energy, including transport 38 3.2.2 Industrial processes 39 3.2.3 Solvent and other product use 40 3.2.4 Agriculture 41 3.2.5 Land-use change and forestry 42 3.2.6 Waste 43
3.3 Methodology of projection estimation 44
4. ASSESSMENT OF POLICIES AND MEASURES TO MEET THE EMISSION REDUCTION COMMITMENTS UNDER THE KYOTO PROTOCOL 44
5. PROGRESS IN MEETING OTHER COMMITMENTS 49
5.1 Improvements in greenhouse gas inventory 49 5.2 Measures to adapt to climate change 49 5.3 Technology accessibility and implementation 51 5.4 Co-operation in scientific research 51 5.5 Capacity building 52
LIST OF REFERENCES 54
R E P O R T O F T H E R E P U B L I C O F L A T V I A O N D E M O N S T R A B L E P R O G R E S S U N D E R T H E K Y O T O P R O T O C O L T O T H E U N I T E D N A T I O N S F R A M E W O R K C O N V E N T I O N O N C L I M A T E C H A N G E
____________________________________________________________________________________________________________________________
4
ABBREVIATIONS AND TRANSLATIONS
BAT Best Available Techniques CDM Clean Development Mechanism EU European Union GDP Gross Domestic Product GHG Greenhouse Gas IET International Emissions Trading IPCC Intergovernmental panel on climate change ISO International Organization for Standardization ISPA Instrument for Structural Policies for Pre-accession JI Jointly Implementation LEGMA Latvian Environment, Geology and Meteorology Agency LULUCF Land-use, Land-use Change and Forestry NA Not applicable NE Not estimated NO Not observed SAPARD Special Assistance Programme for Agriculture and Rural Development SCORE Supporting the Cooperative Organization of Rational Energy Use PHARE Poland and Hungary Action for the Restructuring of the Economy UN United Nations UNFCCC United Nations Framework Convention on climate change
CHEMICAL FORMULAS CH4 methane CO2 carbon dioxide HFC hydrofluorocarbons NMVOC non-methane volatile organic compounds N2O nitrous oxide NOx nitric oxide PFC perfluorocarbons SF6 sulphur hexafluoride SO2 sulphur dioxide
UNITS OF MEASUREMENT
kg kilogram (103 grams) t ton (106 grams) Gg gigagram (109 grams) km kilometer (103 meters) ha hectare (104 m2) MW megawatt TJ terajoule (1012 joules) PJ petajoule (1015 joules) EUR Euro LVL Lat

R E P O R T O F T H E R E P U B L I C O F L A T V I A O N D E M O N S T R A B L E P R O G R E S S U N D E R T H E K Y O T O P R O T O C O L T O T H E U N I T E D N A T I O N S F R A M E W O R K C O N V E N T I O N O N C L I M A T E C H A N G E
____________________________________________________________________________________________________________________________
5
1. INTRODUCTION
This report is prepared pursuant to Article 3(2) of the Kyoto Protocol to the United Nations Framework Convention on Climate Change, demonstrating progress achieved by Latvia to meet commitments under the Kyoto Protocol. In correspondence with the Decision 25/CP. 8 of the Conference of the Parties, national policies and measures are analysed for the period 1990 – 2003, reviewing the trends of direct greenhouse gas (GHG) emissions in the development and policy context of the particular economic sectors, as well as the amounts of GHG emissions are projected by 2020, considering the development scenarios “with measures” and “with additional measures”, and demonstrating how to meet the execution of commitments on greenhouse gas emission reduction1, as well as the information on the execution of other provisions of the Kyoto Protocol is provided in this report.
Latest GHG inventory data and projections are used in the development of this report as summarised in the “Climate change mitigation programme for 2005 – 2010”.
2. NATIONAL POLICIES AND MEASURES
The primary goal of the climate change mitigation policy in Latvia is to ensure that starting with 2008, the total amount of GHG emissions does not exceed 92% of 1990 level. It is to be achieved by implementing activities in the following climate change mitigation policy areas:
1) increase the share of renewable energy sources in the energy balance;
2) increase efficient and rational use of energy resources;
3) develop an environmentally friendly transport system;
4) promote the implementation of the best available techniques, environmentally friendly technologies and cleaner production;
5) promote the implementation of environmentally sound agricultural methods that reduce direct GHG emissions;
6) increase CO2 removals in forestry;
7) establish an up-to-date municipal waste management system, ensuring collection of biogas in municipal waste landfills;
8) participate in the scheme for GHG emission allowance trading within the European Community and the Kyoto Protocol flexibility mechanisms;
9) promote the implementation of environmental management systems.
Climate change policy in Latvia is based on UN and EU climate policy. Many EU-level legal acts have been adopted within the climate change policy framework of the EU; their requirements are binding for Latvia as well. Majority of the policy instruments and measures implemented in Latvia are similar to those of other EU member states.
2.1 Policy-making process
2.1.1 Historical overview
Historically, the coordination of Latvian legislation with the legislation of the EU started when the political and economical criteria for the member states were set in the political EU Council Forum in Copenhagen, 1993. In Luxembourg, 12 June 1995, Latvia signed the “Europe Agreement establishing an association between the European Communities and their
1 In total, Latvia has to reduce GHG emissions by 8% compared to the emission amount of 1990 level, pursuant to the Kyoto Protocol, ratified by it in 2002.
R E P O R T O F T H E R E P U B L I C O F L A T V I A O N D E M O N S T R A B L E P R O G R E S S U N D E R T H E K Y O T O P R O T O C O L T O T H E U N I T E D N A T I O N S F R A M E W O R K C O N V E N T I O N O N C L I M A T E C H A N G E
____________________________________________________________________________________________________________________________
6
Member States, of the one part, and the Republic of Latvia, of the other part” (Association Agreement) which can be regarded as the legal basis between the EU member states and Latvia in the process of pre-accession to the EU. This contract, signed between Latvia and the EU, anticipated gradually creating free trade of goods and providing successful political dialogue, aligning Latvia’s legislation with the EU legal norms (known as acquis communautaire) and promoting the co-operation in the areas of culture, prevention of illegitimate practices and many others.
Latvia had not developed special national climate change mitigation policy up to 1995. To a great extent climate change mitigation efforts were carried out through a combination of environmental protection policies and development strategies of individual economic sectors.
The First National Communication to the Convention (1995) was a serious attempt to summarise, evaluate and project the effectiveness of GHG emission reduction measures planned for the period 1990 – 2000. In 1998, the Second National Communication was developed under the United Nations Framework Convention on Climate Change. Pursuant to the requirements of the Intergovernmental Panel on Climate Change (IPCC), the inventory results of GHG emissions and removals for 1995 with amendments of 1990 results were provided, as well the projections of emissions up to 2020 and a description of climate change mitigation policy in Latvia. In 1997 – 1998, for the first time in Latvia the “Climate Change Mitigation Policy Plan” was developed. It was prepared on the basis of policy planning documents of different economic sectors. The main goals for climate change mitigation policy were defined as follows:
• climate policy has to provide sustainable development;
• climate policy has to be integrated in the strategic plans of all economic sectors, legislation and public awareness;
• climate policy has to promote the understanding of the necessity, opportunities and costs associated with the mitigation of global warming, as well as the consequences of inaction.
The “Sustainable Development Strategy for Latvia” (2002) alongside other climate change mitigation activities, stresses the need “to achieve a level of public awareness where the community recognises the necessity of global climate change mitigation and opportunities, anticipated cost, as well as long-term consequences if measures are not taken to reduce the amount of greenhouse gas emissions”.
To decrease the hazardous impact of global climate change and ensure Latvia’s contribution in the prevention of global climate change, several important objectives have been set in the “National Environmental Policy Plan 2004 – 2008” that would contribute to GHG emission reduction in Latvia:
1) as from 2008, the overall emissions of greenhouse gas in Latvia must not exceed 25 thousand gigagrams2 CO2 equivalent (25 mln tonnes) per year;
2) to decrease the primary energy consumption in Latvia by 25% per unit of GDP compared to 2000 level;
3) to increase the share of renewable energy resources by 6% of the total amount of energy production by 2006;
4) to develop a system, that would facilitate an effective participation of Latvia’s national institutions and enterprises in Joint Implementation Projects, International Emissions Trading and Clean Development Mechanism;
5) to assess the impact of global warming on ecosystems in Latvia, including coastal zone, evaluate the socio-economic effects of this impact and prepare proposals for adaptation measures;
2 1 gigagram (Gg) = 1 tonne

R E P O R T O F T H E R E P U B L I C O F L A T V I A O N D E M O N S T R A B L E P R O G R E S S U N D E R T H E K Y O T O P R O T O C O L T O T H E U N I T E D N A T I O N S F R A M E W O R K C O N V E N T I O N O N C L I M A T E C H A N G E
____________________________________________________________________________________________________________________________
7
6) to provide high quality information to inhabitants about the necessity to prevent adverse climate change and the implementation of planned measures in Latvia;
7) to establish and maintain a greenhouse gas registry;
8) to decrease methane emissions from waste dumpsites, landfills and waste water treatment plants;
9) to improve administrative capacities of environmental institutions to ensure the mitigation of adverse climate change impacts.
It was already forecasted in the Second National Communication, prepared in 1998, that the rapid economic development would create a gradual increase of emissions; therefore it is important to ensure that the scenario “with measures” is implemented.
Latvia developed the Third National Communication to the Convention in 2001, comprising information on the past GHG emissions and removals, projections in the context of policies and measures, as well as information about the national political structure, climate fluctuations in Latvia, features of economic development and development trends of individual economic sectors.
The climate change mitigation policy in Latvia is gaining higher priority in line with the common policy and concerns about climate change in the world and the European Union.
The latest document on the climate change mitigation policy is the “Climate Change Mitigation Programme for 2005 – 2010” and the goal of this programme to ensure the prevention of global climate change, implementing measures aimed at reducing GHG emissions and increasing CO2 removals, participating in the flexibility mechanisms under the Kyoto Protocol, attracting investment for projects reducing GHG emissions and supporting other economically feasible international co-operation to reduce GHG emissions.
2.1.2 Policy instruments
For the effective implementation of climate change mitigation policy and in order to achieve the GHG emissions reduction targets, a wide range of policy instruments is used in Latvia. Most commonly, direct regulation or the so called “command and control” instruments are used (environmental impact assessment procedures, licences, standards, restrictions and prohibitions); nonetheless, market-based incentives have an important impact as well (natural resources tax – since 1995, excise tax for energy resources, national support schemes for biofuel use, user’s charges – tariffs, financial instruments).
The Kyoto Protocol defines three international mechanisms with the help of which the Parties to the Kyoto Protocol can jointly implement their emissions reduction commitments: the Clean Development Mechanism (CDM), Joint Implementation (JI) and International Emissions Trading (IET). Latvia is also planning to participate in these mechanisms. Latvia has implemented the scheme for greenhouse gas emission allowance trading within European Community, established to promote reductions of GHG in a cost-effective and economically efficient manner.
The role of voluntary agreements (quality and environmental management systems, participation in packaging waste management programmes) and informative and educational measures is increasing as well.
Over 2004 – 2005, the reorganisation of the energy sector was implemented, liberalising the electricity and gas markets. This reorganisation together with the strengthening of the consumer rights protection, opens possibilities to introduce new policy instruments to facilitate the use of renewable energy resources (“green certificates”, “green procurement”) and strengthen the operation of the instruments currently employed (allowances for renewable energy generation, “green tariffs”) (for more details, see 2.2.7, “Cross-sectoral policies and measures”).

R E P O R T O F T H E R E P U B L I C O F L A T V I A O N D E M O N S T R A B L E P R O G R E S S U N D E R T H E K Y O T O P R O T O C O L T O T H E U N I T E D N A T I O N S F R A M E W O R K C O N V E N T I O N O N C L I M A T E C H A N G E
____________________________________________________________________________________________________________________________
8
2.1.3 Institutions for the implementation of policies and measures
The Ministry of Environment is the competent national institution for the coordination of the measures to ensure compliance with the requirements of the Convention and the Kyoto Protocol To ensure effective implementation of the climate change related legislation, linking it to facilitating the use of new and innovative technologies in the energy sector and increasing the share of renewable energy sources, the Climate and Renewable Energy Department has been operational in the Ministry of Environment since 2004. Besides, substantial reorganisation has been carried out in the institutions operating under the supervision of the Ministry of Environment.
Since 2005, all institutions performing supervision and control functions – the regional environmental boards, Marine Environmental Board and Environmental State Inspectorate, have been merged to establish the State Environmental Service. Also, the institutions involved in gathering and processing information related to environmental protection and sustainable development and responsible for environmental monitoring and information dissemination to the public – the Latvian Hydrometeorological Agency, Latvian Environmental Agency and State Geological Survey, have been merged, establishing the state agency Latvian Environment, Geology and Meteorology Agency (LEGMA).
Since 1 January 2005, the Environmental Impact Assessment State Bureau is renamed to Environment State Bureau, corresponding more closely with its functions. The Environment State Bureau performs the environmental impact assessment of planned activities and planning documents, implements the assignments related to the issuance of category A and B permits for polluting activities as defined in the Law “On Pollution”, reviews applications and complaints and takes decisions related to environmental protection according to the legal provisions. The Bureau also provides information to the community on its work in conformity with the national legal requirements and the Aarhus Convention “On Access to Information, Public Participation in Decision-making and Access to Justice in Environmental Matters”.
The climate change mitigation policy covers all sectors of the national economy, therefore policies and measures to reduce GHG emissions and increase CO2 removals, besides the Ministry of Environment have also been implemented by the following ministries and institutions: Ministry of Foreign Affairs, Ministry of Economics, Ministry of Agriculture, Ministry of Transport, Ministry of Education and Science, Ministry of Finance, Ministry of Regional Development and Local Government and State Agency “Housing Agency”.
The involvement of local municipalities, scientific institutions, universities and the community is also invaluable in the climate change mitigation process.
2.2 Sectoral policies and measures since 1990 Over the time period 1990 – 1995, the gross domestic product (GDP) in Latvia decreased by two times, but as of 1994, GDP stabilisation started. Moreover, in recent years rapid economic growth has been observed. For the time period 1999 – 2003, GDP has increased by almost one third – on average by 7.2% per year. The productivity has increased in almost all economic sectors, except monopoly sectors – supply of energy, gas and water.
Although the most rapid productivity increase has occurred in the manufacturing industry, its level still falls behind the indicators of several service sectors (dominating in Latvia during 1990 – 2005). For example, the productivity level in financial services is four times higher than in manufacturing industry and 3.3 times higher than on average in the national economy.
In the first half of 1990s, several important policy planning documents were developed that highlighted the development opportunities in the main economic sectors in the medium term: “National Programme of Macroeconomic Stabilisation” (1994), “Projection of Economic Development in Latvia” (1994), “Programme for Development of Energy Sector in Latvia” (1994), “National Programme of Road Transport Development” (elaborated under the framework of “National Programme of Transport Development” (1994)), “National Program
R E P O R T O F T H E R E P U B L I C O F L A T V I A O N D E M O N S T R A B L E P R O G R E S S U N D E R T H E K Y O T O P R O T O C O L T O T H E U N I T E D N A T I O N S F R A M E W O R K C O N V E N T I O N O N C L I M A T E C H A N G E
____________________________________________________________________________________________________________________________
9
on Forest Development” (1992), “Forestry Development Policy” (1994), “Concept for National Agricultural Strategy” (1994), “Concept for National Strategy in Industry” (1995) and others.
Currently, rapid economic growth is characteristic for Latvia. The low cost of labour, geographical situation and macroeconomic stability are the main factors contributing to foreign capital flow into Latvia. Cheap credit resources, being the main driving force of the economy, promote a rapid increase in domestic consumption.
Good development opportunities have been anticipated in the following sectors:
• sectors related to forest use;
• sectors of intensive workforce use (for example, textile industry, some sectors of machinery and equipment assembling, shipbuilding and repair);
• food industry, based on local resources, exporting most of the production;
• production of ecological clean products and development of non-traditional agricultural sectors;
• service sectors, due to increasing economic activity, improvement of infrastructure, more effective support for small enterprises and the demand for new types of services;
• transit services, with the absolute value continuing to rise, although the share of transit services is decreasing;
• tourism, with good development preconditions – geographical location, economic activity, landscape variety, diverse and unpolluted environment, cultural resources and specific historical heritage.
The “National Lisbon Program for Latvia for 2005 – 2008” has been adopted. It highlights five main directions for the economic policy to meet Lisbon goals in Latvia and to facilitate the development of the national economy and employment:
1) provision of macroeconomic stability;
2) motivation of knowledge and innovations;
3) formation of an environment that is favourable and attractive to investment and activities;
4) facilitation of employment;
5) improvement of education and know-how.
2.2.1 Energy, including transport
In 1990, legislative acts in energy sector were not yet effective enough to reduce CO2
emissions, although the draft law on natural resources tax offered several solutions of economic nature: trading of emission licences, CO2 tax levied as fuel excise-duty and integral fuel tax that would create favourable conditions to use natural gas as fuel.
Overall targets of Latvia’s energy policy were aimed at securing stable long-term energy services at as low as possible costs for consumers, paying attention to the environmental problems and finding a balance between costs and supply security. In the energy production and transformation sub-sector, the main condition in the context of climate policy was the effective use of energy resources and energy savings.
To implement the aforementioned, it was necessary to optimise electricity distribution in the power production industry and reduce losses in production cycles, to use up-to-date and efficient technologies, equipment and materials in places with technical and economical basis, reconstruct existing boiler houses and use their heating energy potential also for the production of electricity. In its turn, in thermal energy production – to improve the technical condition of existing heating systems and reduce losses of heat and water, improve pipeline distribution system, supply the systems and individual customers with calorimeters and

R E P O R T O F T H E R E P U B L I C O F L A T V I A O N D E M O N S T R A B L E P R O G R E S S U N D E R T H E K Y O T O P R O T O C O L T O T H E U N I T E D N A T I O N S F R A M E W O R K C O N V E N T I O N O N C L I M A T E C H A N G E
____________________________________________________________________________________________________________________________
10
regulation equipment and to use them consistently, saving thermal energy, develop the effective use and production of heat insulating materials in Latvia.
Wider use of local hydro resources and local biomass and peat and transition to alternative energy sources was another way of reducing CO2 emissions, moreover, with the reduction of N2O emissions, also the amount of CO2 and CH4 emissions is reduced. This was achieved by insulation of heating systems and installation of heat meters.
JSCs “Latvenergo”, “Latvijas gaze” (Latvia’s Gas) and “Latvijas Nafta” (Latvia’s Oil), assisted by the Swedish Company VATTENFALL and Finnish Company IMATRAN VOIMA OY, developed three programs of great importance in further development of Latvia’s energy sector:
• “Latvia’s Energy Development Program” that gives an overview of the energy sector, defines the strategy for energy supply and gives recommendations for investment in the energy sector;
• “Energy System Restructuring Program” (developed in the project PHARE 2) that defines legal and control framework in the energy sector and outlines the restructuring process for energy, oil and gas sectors;
• “Latvia’s Energy Saving Strategy” (developed in the project PHARE 3) that defines the measures of energy saving in all economic sectors.
In 1995, the only implemented policy measure to improve energy performance was the “Law on Entrepreneurship Regulation in the Energy Sector” (1995). In accordance with this law, the licensing of energy enterprises was started, including also the obligation to reduce energy losses. The Law also stated that the national energy transmission network has to buy electricity from small hydro power plants with capacity below 2 MW, and wind power stations at higher tariffs.
After 1995, the main policy objectives in Latvia’s energy sector that contributed to the reduction of CO2 emissions, were improvements in energy efficiency, maximal use of local and renewable energy resources, energy supply to the inhabitants and economic sectors in sufficient quantity at low prices, simultaneously providing the renovation and development of energy systems and reducing their impact on the environment.
In order to reduce fugitive emissions from fuels, the main policy in this sector has been targeting leakages of natural gas (CH4) from the pipeline systems. In 1990, it was stated that technical measures should be carried out: the Incukalns gas storage management should be improved (pumps, compressors etc.), regular supervision of the gas main and liquid gas storage tanks (replacing worn-out pipes, controlling pressure in the system, etc.). In 1995 – 2001, JSC “Latvijas Gaze” has already implemented and financed many measures to reduce methane emissions.
The development of the energy sector has been steered, using mechanisms that are included in the “Law on Energy” (1998), “Law on Electricity Market” (2005), “Law on State Aid to Commercial Activities” (2002), Laws “On Environmental Impact Assessment” (1998), “On Excise Tax” (2003), “On Natural Resources Tax” (1995) and “Law of Biofuel” (2005), as well as in several policy planning documents – “National Programme for the Energy Sector of Latvia” (1997), plan “Energy Policy in the Power Sector” (2001), “State Energy Efficiency Strategy” (2000), etc. In 2005, the development of a strategy on the use of renewable energy resources is anticipated.
Policy: Increase the share of renewable energy sources in the energy balance
Pursuant to the “Energy Law”, the Cabinet of Ministers (CM) with the help of special regulations annually determines the total amount of newly installed capacity and the share of each kind of power generation, if renewable energy resources are used for the production of electricity. The purchase prices of electricity (feed-in tariffs) differ and are defined in different levels of legislation.
R E P O R T O F T H E R E P U B L I C O F L A T V I A O N D E M O N S T R A B L E P R O G R E S S U N D E R T H E K Y O T O P R O T O C O L T O T H E U N I T E D N A T I O N S F R A M E W O R K C O N V E N T I O N O N C L I M A T E C H A N G E
____________________________________________________________________________________________________________________________
11
In order to facilitate and at the same time regulate the use of other renewable energy resources obtained from biomass, in 2005, the regulations of the Cabinet of Ministers on bio-oils were elaborated in accordance with the “Law on Biofuel”.
Cooperation between Latvia and Sweden (under the program “Energy Systems, Conserving Environment in Baltic States and Eastern Europe”) to promote fuel switch in boiler houses to use biomass (woodchip, sawdust, wood-processing waste) began in 1994. 18 projects were implemented by 1998.
By 2004, the Environmental Investment Fund had invested more than 2 million LVL in projects promoting the use of renewable energy resources (projects related to six small hydropower plants, one wind generator and 17 biomass combustion plants were financed).
The first projects introducing up-to-date woodchip technology in boiler houses in Latvia were implemented in Malpils (donation from the Danish government) and Balvi (within the Swedish Programme for an Environmentally Adapted Energy System in the Baltic Region and Eastern Europe – EAES).
Currently, there is one boiler house in Latvia, financially supported by the Danish Energy Agency where straw is used as fuel. 20 TJ of thermal energy is generated there annually, using 1.3 thousand tonnes of straw3.
Over the time period 2001 – 2004, a fuel-switch project financed by the UN Development Programme and Global Environment Fund was carried out in heat supply companies owned by municipalities, replacing imported fuel (heavy fuel oil, coal, natural gas) with local renewable energy resources – wood residues or other biomass. Many fuel-switch projects are related to the introduction of restrictions regarding the sulphur content of fuels. In addition to the installation of heat nodes and heat measuring equipment, repairs of heat mains, introduction of automatic heat consumption registration, as well as other technical improvements and informative measures, also reconstruction of boiler houses and replacement of boilers were carried out at the municipalities.
Currently, three biogas cogeneration plants are operational in Latvia with the total production capacity of 7.5 MW. The potential of biogas is estimated to be 121 million m3 per year, from which 2 PJ of energy could be obtained per year.
The “Energy Law” states that electricity that is produced in installations with capacity not exceeding 7 MW, using municipal waste or its by-products (biogas) and starting operation prior to 1 January 2008, for eight years from the beginning of operation of the installation is purchased for a price corresponding to the average tariff of electricity sale.
It should be noted that some problems still exist with the construction of small hydropower plants, on the one hand, and requirements to preserve fish resources and nature conservation, on the other hand. Restrictions to build hydropower plants and other mechanic obstacles on particular rivers or parts of rivers according to the “Fishery Law” are defined in the Regulations of the Cabinet of Ministers No. 27 of 15 January 2002 “Regulations on Rivers (Parts of Rivers) where Building and Restoration of Hydropower Plant Dams and Building of any Artificial Dams is Prohibited for Fish Conservation Purposes”.
The support for small hydropower plants is defined in the “Energy Law”, according to which, electricity from small hydropower plants with capacity not exceeding 2 MW, which have started operation prior to 1 January 2003, for eight years from the beginning of operation of the power plant is purchased for a price corresponding to double of the average tariff of electricity sale (currently 0.03435 LVL/kWh). After this period, the Public Utilities Commission determines the purchase price.
3 Renewable energy sources in Estonia, Latvia and Lithuania: strategy and policy targets, current experiences and future perspectives. Baltic Environmental Forum, Riga, 2003

R E P O R T O F T H E R E P U B L I C O F L A T V I A O N D E M O N S T R A B L E P R O G R E S S U N D E R T H E K Y O T O P R O T O C O L T O T H E U N I T E D N A T I O N S F R A M E W O R K C O N V E N T I O N O N C L I M A T E C H A N G E
____________________________________________________________________________________________________________________________
12
As of the beginning of 1990s, the use of wind energy in Latvia is re-established, overtaking the most progressive technological achievements. It was emphasised that in the renovation of the wind farms, special attention should be paid to bird migration paths and preservation of landscape. In 1995, 12 wind power stations were installed with the total capacity of 1.333 MW. At that time, the largest one was Ainazi wind power station with two turbines with 0.6 MW capacity each.
In 1999, under the UN Development Programme one of the largest studies of recent years regarding wind energy potential in Latvia was launched – the project “Baltic Regional Wind Energy Programme”.
Pursuant to the “Electricity Market Law”, in 2005 the Regulations of the Cabinet of Ministers No. 250 “Regulations on the total amount of capacity for installation in 2005 and specific amount for each type of electricity generation, if renewable energy resources are used for electricity generation” were adopted, and it is planned to develop regulations on the establishment of wind farms, regulating environmental requirements, procedure for connection to the grid and technical requirements.
Provisions for the use of solar energy in Latvia are included in the “Electricity Market Law” (2005).
In Latvia, solar energy for heating is used on sites in Aizkraukle, Bauska and Iecava; solar energy for electricity production is currently not used. The same electricity purchase regulations apply to electricity producers using solar energy, as those using wood.
The production and use of biofuel in Latvia is planned according to the programme “Production and Use of Biofuel in Latvia (2003 – 2010)”. The promotion of the use of biodiesel fuel in diesel engines, in the amount of 40% of the total consumption of diesel fuel used in agriculture, is stated as one of the priorities in this document. Measures to realise the priorities stated in the programme are described in the Action plan for the implementation of the programme, “The Law on Biofuel” and “The Programme of Agricultural Development for 2003”.
Currently, two biofuel production units are operating in Latvia with the total capacity of 5000 t biodiesel and 9600 t bioethanol per year.
Since 2005, the state provides direct support to biofuel manufacturers. Every year financially supported allowances for biodiesel fuel and bio-ethanol are determined. In 2005, the allowance was 11.4 million litres of bio-ethanol and 12.5 million litres of biodiesel. The amount of direct support was 170 LVL for 1000 litres of produced biodiesel and 140 LVL for 1000 litres of produced bio-ethanol in 2005.
In 2005, the Regulations of the Cabinet of Ministers No.712 of 13 September 2005 “The Order for allocation of state support for the production of minimal annual amount of biofuel and for determination of financially supported allowance for biofuel” and the Regulations of the Cabinet of Ministers No. 498 of 5 July. 2005 “The Order of Administration of turnover of fuel containing bio-products and the respective excise tax” were adopted.
Policy: Increase efficient and rational use of energy resources
One of the first real policy measures to improve the energy performance was the “Law on Entrepreneurship Regulation in the Energy Sector” (1995). In accordance with this law, the licensing of energy enterprises was started, including also the obligation to reduce energy losses (the law is no longer in force since the “Law on Energy” was adopted in 1998).
Latvia has ratified the European Energy Charter, which stresses that improvements in energy efficiency refer to all stages of the energy cycle, including the consumption of energy. In the area of energy audit, the two most significant EU directives are the Council Directive 93/76/EEC of 13 September 1993 to limit carbon dioxide emissions by improving energy
R E P O R T O F T H E R E P U B L I C O F L A T V I A O N D E M O N S T R A B L E P R O G R E S S U N D E R T H E K Y O T O P R O T O C O L T O T H E U N I T E D N A T I O N S F R A M E W O R K C O N V E N T I O N O N C L I M A T E C H A N G E
____________________________________________________________________________________________________________________________
13
efficiency (SAVE) and the Directive 2002/91/EC of the European Parliament and of the Council of 16 December 2002 on the energy performance of buildings.
To promote energy performance measures, the “National Energy Efficiency Strategy” has been developed and approved in 2000, the aim of which is to determine a set of energy efficiency measures to reduce the primary energy consumption in Latvia by 25% per unit of GDP by the year 2010.
If at least 75% of the power in the cogeneration plant is produced from renewable energy resources, then electricity is purchased for special tariffs depending on the installed capacity of the plant (less than 0.5 MW, 0.5–4 MW, higher than 4 MW – the price is determined by the Public Utilities Commission). These tariffs do not apply to the cogeneration plants that have received their licences before 16 January 2001. Currently, 36 cogeneration plants with the total installed capacity of 590 MW are operational in Latvia.
23 projects to increase energy efficiency in energy generation and transmission have been implemented in Latvia in 2000 – 2003, including 19 environmentally friendly heat supply projects where biomass, biofuel or biogas is used instead of fossil fuel, thermal energy distribution systems have been renovated, and new boiler-houses have been constructed.
With the adoption of the Regulations of the Cabinet of Ministers No. 125 of 2 March 2004 “On restriction of sulphur content in certain types of liquid fuel”, the use of high sulphur content fuel is forbidden as of 1 May 2004. The Ministry of Economics has developed a national programme “Improvement of Heat Supply Systems, Reducing the Sulphur Content of fuel” to attract funding from the EU structural funds to solve this problem. The support from the structural funds is available to the municipalities, businesses that provide public services, i.e., ensure the execution of the permanent functions of local authorities to organise public services to the residents and thermal energy users in the public sector pursuant to the “Law on Local Authorities” (1994). Data on municipalities where fuel with high sulphur content is used were collected in co-operation with the planning regional development councils and the Municipality Association, the estimated cost of implementing fuel-switch projects in these municipalities is 8 mln LVL.
The implementation of EU LIFE project (time period from 2004 to 2006) “Energy Certification in Construction pursuant to the Directive 2002/91/EC of 16 December 2002” has been started (total costs – 300 thousand LVL). In 2004, an energy performance project was implemented in Lielplatone elementary school, heat supply system reconstruction projects have been implemented in several municipalities (Cesvaine, Skaune, Vilaka, etc.).
Currently, a unified system is being developed in Latvia for the determination of the energy consumption of buildings and application of energy consumption standards to new and existing buildings, which are being reconstructed. A building certification system is being developed (energy audit of the buildings). A national energy certification for buildings is anticipated to be implemented from 2006.
In 1996, the SCORE program was launched in Latvia, Poland and Hungary in order to promote a more rational use of energy resources. In 1997, the main activity areas of the SCORE program were pilot projects, energy saving and institutional measures.
During the past ten years, also the “Project for the Development of Educational System” financed by the World Bank (aimed at reducing heat losses in buildings through renovation), pilot projects within the Dutch government programme “Energy Performance in Buildings of Latvia” and others.
The international program “Effective Lighting Initiative” is also implemented in Latvia to increase the efficiency of lighting of streets and buildings, including the organising of training programs.
With funding from the EU environmental financing programme LIFE III, two projects have been started: “Energy Labelling in Apartment Buildings” and “Development of Environmentally Friendly Ventilation Systems”.
R E P O R T O F T H E R E P U B L I C O F L A T V I A O N D E M O N S T R A B L E P R O G R E S S U N D E R T H E K Y O T O P R O T O C O L T O T H E U N I T E D N A T I O N S F R A M E W O R K C O N V E N T I O N O N C L I M A T E C H A N G E
____________________________________________________________________________________________________________________________
14
In 2004, the State Agency “Housing Agency” has carried out energy audit in 27 apartment buildings in Aizkraukle, Balvi, Bauska, Cesis, Daugavpils, Salacgriva, etc. within the long-term project “Housing Energy Performance”. The number of all energy audits carried out in Latvia is estimated in hundreds and successful examples of implemented energy performance projects in buildings can be found in different parts of Latvia.
Policy: Develop environmentally-friendly transport system
In the period 1990 – 1995, the main policy objectives in the transport system contributing to the reduction of transport emissions were the development of an up-to-date and ecologically clean production of vehicles and equipment, popularising environmentally friendly means of transport (electric, bicycles, etc.), restricting the use of individual transport in cities, developing public transport, raising the environmental awareness of drivers, improving national legislation by aligning it with the EU legislation, improving the system of taxes and penalties.
After 1995, the main objectives of the transport policy were ensuring a systematic development of effective transport system in order to meet the growing demand of the national economy and inhabitants for transportation services of satisfactory quality and in sufficient quantity with certain security, guarantees and reasonable prices.
As from 1998, the policy measures to reduce GHG emissions were aimed at improving public transport system, stricter control of the technical condition of vehicles, increasing the proportion of cars with smaller engines, using alternative fuels in road transport, limiting speed and raising drivers’ qualification.
Since 2000, the transport policy aimed to limit the use of cars in the cities. Thus, it was necessary to improve the public transport system in Riga and facilitate the development of bicycle transport. The transport infrastructure, vehicles and transportation practices do not meet the quality standards approved by other countries, as demonstrated by the deterioration of air quality in the cities and near highways and railroads.
One of the objectives set in the “Riga Traffic Concept for 1999 – 2003” is providing convenient, safe and integrated public transportation system to passengers, determining the public transport as a priority over other means of transportation in the central streets of the city. “Riga Public Transport Development Concept for 2005 – 2018” envisages the development of an integrated public transportation system, including further development of the electric transport network and introduction of low floor tram, integration of railroad transport in the common transportation network of the city, etc.
The lack of popularity of bicycle transport in Latvia and Riga is determined by changing weather conditions, comparatively short season of use (May – October), lack of the necessary infrastructure (bikeways, bicycle stands, etc.), as well as ambiguous attitude of the community.
In 2000, the “National Development Programme of Bicycle Transport for 1999 – 2015” was approved, thus creating the basis for the development of the bicycle transport as an alternative mode of transport. In 2000, the Riga City developed and approved the “Riga City Bicycle Transport Development Programme” that is directly related to the “Development Plan of Riga City” and “Riga City Environmental Strategy”. The development of cycling infrastructure is underway in Riga.
In order to reduce the emissions of indirect GHG (CO, NOx, NMVOC), the necessary policy was the introduction of such technological measures as the use of biofuel in the road transport, as well as stricter control of the technical condition of vehicles. In order to implement this policy, technical examination points were improved and labelling requirements for new cars were introduced.
Currently, the main CO2 emissions reduction policy objective is to develop environmentally friendly transport system. To achieve this, it is necessary to optimise the traffic flow in cities, promote and facilitate the use of public transport in Riga and develop cycling infrastructure.

R E P O R T O F T H E R E P U B L I C O F L A T V I A O N D E M O N S T R A B L E P R O G R E S S U N D E R T H E K Y O T O P R O T O C O L T O T H E U N I T E D N A T I O N S F R A M E W O R K C O N V E N T I O N O N C L I M A T E C H A N G E
____________________________________________________________________________________________________________________________
15
The potential to reduce emissions from transport depends on the enforcement of the requirements regarding the composition of exhaust fumes and is related to the adoption and implementation of the relevant EU legal acts in Latvia. Emissions reductions in the transport sector could be achieved by using well-targeted tax policy – customs duty on imported vehicles and excise duty on motor fuel. The development of biofuel production and increase of its share in the energy balance, as well as more stringent emission limits for large fuel terminals will also contribute to the reduction of emissions.
The main objectives and trends of the transport sector are defined by the following legislative acts and policy planning documents: National Programme of Transport Development for 2000 – 2006, the “Law On Excise Tax”, “National Programme for Bicycle Transport” and “Programme for Bicycle Transport Development in Riga”, “Riga Traffic Concept for 1999 – 2003”, “Riga Environmental Strategy for 2000 – 2010”. The most important policy planning projects are “Riga Development Plan for 2006 – 2018”, “Riga Historical Centre Preservation and Development Plan” and “Riga Public Transport System Development Concept for 2005 – 2018” which is part of the “Riga Traffic Concept for 2005 – 2018”.
The number of vehicles in Latvia is increasing rapidly – in the previous ten years the number of vehicles on average increased by 4–6% annually4; as a result the pollution caused by transportation is also increasing. Therefore the issue of a long-term agreement on the priority of railroad for passenger transportation has become topical, although at the same time residents are not offered adequate transportation services with other modes of transport. To look for solutions to the problem, “National Order Concept on Passenger Traffic over the Railroad” was approved in 2005. In this document, the national policy for the following 10 years is defined to secure the implementation of the objectives set in the “Strategy for Public Transport Development, 2005 – 2014”.
As of 1 May 2007 Latvia has to apply EU requirements for financing of the public transport that prohibit subsidies in this sector and require the compensation of loss incurred in passenger transportations, hence the issue of policies and investments on national and local level in this significant transportation system will have to be resolved.
The most important policy planning document in traffic improvement is “Riga Traffic Concept for 1999 – 2003” developed in 1999 and approved by the Riga City Council.
Optimisation of the traffic flow in cities has been approved as one of the measures eligible to receive financing from the Cohesion Fund (according to the Objective 1 Programme of the “Development Plan (Framework Document) for Latvia, 2004 – 2006”).
2.2.2 Industrial processes
Before 1990, industry was the leading economic sector in Latvia. In the period 1991 – 1995, transition to competitive market conditions created a crisis in industry, production volumes in enterprises significantly decreased, some of the companies were near to bankruptcy with uncertainties in the privatisation process and little interest to invest from foreign entrepreneurs. In 1995, the industrial output was about 36% of the 1990 level. Policy priorities in the industry sector were competitive production for local consumption and export, simultaneously reducing the adverse impacts on the environment. The low level of technological development in the sector was the key barrier to producing products of sufficient quality to sell in competitive markets.
In 1990, policy objectives in the manufacturing industry and construction were not different from those in the energy sector and they were the efficient use of energy resources and energy saving. Economical use of fossil fuel was necessary, its replacement with local fuel (renewable resources), the modernisation of technological communications, installation of heat meters and regulating equipment.
As from 1995, policy aimed mainly at reducing heat losses in buildings, improving energy performance, performing analysis of energy consumption patterns and implementation of 4 Source: Central Road Traffic Safety Department

R E P O R T O F T H E R E P U B L I C O F L A T V I A O N D E M O N S T R A B L E P R O G R E S S U N D E R T H E K Y O T O P R O T O C O L T O T H E U N I T E D N A T I O N S F R A M E W O R K C O N V E N T I O N O N C L I M A T E C H A N G E
____________________________________________________________________________________________________________________________
16
energy resources management system, including installation of heat, multi-tariff and gas meters, as well as energy use audits and analysis of production indicators in industrial and agricultural enterprises.
Since 2000, the priority policy objectives in the industrial sector were the improving the energy efficiency of industrial production, energy efficiency measures were implemented in the dairy production, bakeries and construction, measures were carried out to reduce heat losses in buildings.
Since the Law “On Pollution” (2001) entered into force, the environmental impact generated by industrial enterprises is regulated through the issuance of integrated pollution permits. Pursuant to this law, the best available techniques (BAT) and emission limit values are applicable to various degrees to category A and category B operations. The increasing stringency of environmental legislation to reduce environmental pollution stimulates enterprises to implement new, economically feasible high quality technologies and management systems – such as Good Manufacturing Practice (GMP), quality management systems ISO 9001 and ISO 14001.
Currently, the primary policy objective is to promote the implementation of the best available techniques and cleaner production methods in the industry sector.
Measures for the reduction of emissions from industry and prevent their increase with the growth of industry output volumes and construction of new industrial operations, can be divided into two groups: direct measures, carried out by industrial enterprises, and indirect measures to be carried out by state institutions, sector associations and non-governmental organisations. Actions to be carried out by the industrial enterprises are directly related to the improvement of technological processes, increasing production efficiency and reducing the amount of emissions (increase of the energy efficiency of technological processes and recycling of materials). The most appropriate measures are determined individually for each enterprise and to a great extent are related to the procedure for receiving category A and category B permits according to the provisions of the Law “On Pollution”.
As CO2 emissions in the production of mineral products and steel form as by-product and their amount depends on the chemical composition of raw materials, there are few economically feasible measures for the reduction of CO2 emissions per unit of production. Therefore, the GHG emissions reduction policy in the industrial sector is focused on the improvement of general operational practice.
Development trends of the industry sector are set in the following policy planning documents: “Strategy for the Development of Industry, 2004 – 2013”, “National Concept on Innovations” and “National Programme of Innovations, 2003 – 2006”.
The following medium term development objectives have been set for the industrial sector: integration in the single market of the EU, sector productivity increase, growth of the share of innovative technologies in the industrial structure, increase of annual export volumes, the dominance of output growth over the rates of environmental pollution and consumption of resources.
Several legislative documents regulating the circulation of products and equipment containing fluorinated greenhouse gases have been adopted in Latvia. Since 2005, special restrictions (leakage control and prevention, licensing rules, procedure for the certification of specialists) have been enforced with regard to handling fluorinated GHG that are used as refrigerants. Up to now, information on the locations where fluorinated GHG are used, the amounts, labelling, recovery, recycling, destruction and emissions has been quite fragmented and based on individual research.
Policy: Promote the implementation of best available techniques (BAT), environmentally friendly technologies and cleaner production
The implementation of BAT is closely linked to the permitting procedure for integrated pollution prevention and control. The concept of integrated permits appeared in Latvia’s
R E P O R T O F T H E R E P U B L I C O F L A T V I A O N D E M O N S T R A B L E P R O G R E S S U N D E R T H E K Y O T O P R O T O C O L T O T H E U N I T E D N A T I O N S F R A M E W O R K C O N V E N T I O N O N C L I M A T E C H A N G E
____________________________________________________________________________________________________________________________
17
environmental protection legislation with the transposition of EU environmental legislation, specifically – the Council Directive 96/61/EC of 24 September 1996 concerning integrated pollution prevention and control. Thus a transition to an integrated permitting system has continued since 2001, where three categories – A, B and C, depending on the type and amount of polluting activities, are identified. Approximately 113 companies in Latvia fall under the scope of the directive on integrated pollution prevention and control (category a operations).
Integrated permits in Latvia are issued according to the provisions stated in the “Law on Pollution” (2001) and Regulations of the Cabinet of Ministers No. 294 of 9 July 2002 “On application of category A, B and C polluting activities and permitting of A and B polluting activities”. They state that all a category operations have to receive integrated permits by 31 October 2007.
2.2.3 Solvent and other product use
Currently, there is no legislation in Latvia that would directly affect the reduction of GHG emissions in this sector. Existing legislation – “Law on chemical substances and chemical products” (1998) and the subordinate Regulations of the Cabinet of Ministers No. 466 of 22 October 2002 “Regulations on registration procedure and data base of chemical substances and chemical products”, Regulations of the Cabinet of Ministers No. 340 of 6 August 2002 “Procedure for Import, Declaration and Risk Assessment of New Chemical Substances”, Regulations of the Cabinet of Ministers of 12 March 2002 No. 117 “Regulations on Utilisation and Labelling Requirements for Equipment and Products Containing Certain Hazardous Chemical Substances and on the List of Environmentally Hazardous Goods” and also the “Law On Pollution” (2001) and the subordinate Regulations of the Cabinet of Ministers No. 319 of 23 July 2002 “Regulations on Inventory, Identification, Storage, Packing, Labelling and Registration of Shipments of Hazardous Waste“, Regulations of the Cabinet of Ministers No. 726 of 17 August 2004 “Environmental requirements for the chemical treatment (impregnation) of wood” and other regulations relating to activities with solvents and other products.
2.2.4 Agriculture
Until 1995, the most important policy document in the agriculture sector was the “Concept on State Strategy in Rural Areas” (1994). Priority measures to decrease CH4 emissions were the optimisation of the number of livestock according to the size of pastures, change of property forms in agriculture and improve manure management in private farms, ensuring timely application of manure to soils or storing it in appropriate conditions.
In order to reduce N2O emissions the use of nitrogen containing fertilisers was restricted to avoid over-fertilisation of soil. Other measures included those undertaken due to economic factors (mineral fertilizers became more expensive), technological activities (appropriate storage facilities for organic fertilisers, manure application directly into the soil), as well as legislation. After 1995, the “Law on Agriculture” (1996) and the subordinate Regulations of the Cabinet of Ministers, as well as several policy documents – “Concept on the Use of Agricultural Subsidies and Program Substantiation for 1998 – 2002” (1997), “Agriculture Development Concept” (1998), “Conditions for Good Agriculture Practice in Latvia” (University of Agriculture, 1999) were elaborated.
Over the period 1995 – 2000 the main agricultural policy targets aimed at ensuring the ability of the sector to integrate into the single EU market and to produce goods that meet the demands of the world market, competing with other countries’ products in quality and production costs. Priority measures to reduce CH4 emissions were the optimisation of ruminant breeding (including the optimisation of the livestock number and efficient use of feed) and appropriate storage of manure, also considering the production of biogas from the manure. Policy measures to implement these measures were the “Concept on the Use of Agricultural Subsidies and Program Substantiation for 1998 – 2002” and HELCOM 7/2 Recommendation concerning measures aimed at the reduction of discharges from agriculture.

R E P O R T O F T H E R E P U B L I C O F L A T V I A O N D E M O N S T R A B L E P R O G R E S S U N D E R T H E K Y O T O P R O T O C O L T O T H E U N I T E D N A T I O N S F R A M E W O R K C O N V E N T I O N O N C L I M A T E C H A N G E
____________________________________________________________________________________________________________________________
18
In order to reduce N2O emissions, the main measure was the development of science-based recommendations for optimal application of nitrogen-containing fertilisers to agricultural soils. Policy measures to achieve this objective were the “Concept on the Use of Agricultural Subsidies and Program Substantiation for 1998 – 2002”, the Council Directive 91/676/EEC of 12 December, 1991 concerning the protection of waters against pollution caused by nitrates from agricultural sources, HELCOM 9/3 Recommendation concerning measures aimed at the reduction of nutrient discharges from agriculture, HELCOM 13/9 Reduction of nitrogen, mainly nitrate, leaching from agricultural land.
Currently, the basis of agricultural policy and strategy are set in the “Law on Agricultural and Rural Development” (2004) and policy planning documents “On Agricultural Development in the Rural Areas of Latvia for 2003 – 2006”, including “Biological Agricultural Development Program for 2003 – 2006”, “Action Program for Especially Sensitive Territories” and others.
The key policy in the agriculture sector is to promote the implementation of environmentally sound agricultural methods that reduce direct GHG emissions. To implement this policy, the following measures are undertaken: improving and construction of manure storage facilities, sustainable use of agricultural resources, and development of environmentally friendly agriculture and promotion of Good Agricultural Practice.
The legal acts5 currently in force in Latvia include measures and requirements that promote the reduction of GHG emissions, for example, requirements to improve manure management facilities and animal rearing farms with more than 10 livestock, in the other territory of Latvia within a ten year period, etc.
The basis of the measures to reduce the emissions of ammonia, which are regulated by legal acts, are the Regulations of the Cabinet of Ministers No. 531 “On Water and Soil Protection Against Pollution Caused by Nitrates from Agricultural Activities” and “Manual on Especially Sensitive Territories Management Coordination” which are subordinated to the Law “On Pollution”. In order to fulfil the requirements of legislative acts in this field, Latvian agricultural and environmental protection specialists in cooperation with the specialists of Danish Agriculture Consultations Centre have developed “Good Agriculture Practice Conditions”.
Measures that have the potential to reduce emissions of ammonia are mainly related to the use of progressive methods suggested by GAP, for livestock feeding (rationing and controlling the amount of proteins), using closed facilities for the storage of organic and mineral fertilisers, and correct application of fertilisers to the soil taking into account the weather conditions. With the increase of the level of direct payments in agriculture (using EU structural funds), the implementation of all these measures can be improved considerably, providing a reduction of ammonia emissions in the order of 20% of the current levels.
2.2.5 Land-use change and forestry
Considering the demands of environmental protection, agricultural and forestry production, the following requirements have to be observed in forest management: existing forests have to be preserved and new forests have to be established near populated areas, particularly preserving existing forests near rivers, lakes and other reservoirs, the one-piece area of ploughed fields must not exceed 50 ha, every farm has to maintain or plant forests at least 10% of the total area of the farm, private forests have to be managed according to requirements specified by legislation.
The long-term objectives and principles of the forestry development strategy are stated in the “Latvian Forest Policy”, approved in 1998. The task of the forest policy is to balance community interests with the benefits of economic development, by creating favourable
5 Regulations of the Cabinet of Ministers of 18 December 2001 No. 531 ”On water and soil protection against pollution caused by nitrates from agricultural activities ”, Regulations of the Cabinet of Ministers of 27 July 2004 No. 628 ”Special environmental requirements for polluting activities in animal farms”, Regulations of the Cabinet of Ministers of 27 July 2004 No. 626 “Regulations on methods for the detection of odours from polluting activities and on the order for limiting the spread of these odours”
R E P O R T O F T H E R E P U B L I C O F L A T V I A O N D E M O N S T R A B L E P R O G R E S S U N D E R T H E K Y O T O P R O T O C O L T O T H E U N I T E D N A T I O N S F R A M E W O R K C O N V E N T I O N O N C L I M A T E C H A N G E
____________________________________________________________________________________________________________________________
19
conditions for economic development and, at the same time, preserving the ecological value and the capacity of the forests to perform social functions. The main principles of sustainable forest management are analysed in several programmes and projects developed in recent years, including the “National Program of Biological Diversity”, and their implementation is stated by the “Law on Forests” and subordinate legal acts.
In order to protect the land and its resources from degrading human activities, restrictions on the use of land are set in the “Law on Protected Belts” (1997). Restrictions on economic and other types of activities according to the preservation and protection needs of nature values that are characteristic to the respective territories, are also stated in the “Law On Specially Protected Areas” (1993) and the subordinate Regulations of the Cabinet of Ministers. In order to secure sustainable development of the state, taking into account the particularities and opportunities and, at the same time, aiming to reduce the disadvantaging differences in different parts of the country, the “Law on Regional Development” and the “Law on Territory Planning” were adopted in 2002. The regional policy of Latvia for the next ten years will be guided by the “Strategy for Regional Policy” (2004).
The mechanism of direct payments in Latvia, according to the common policy to support the development of agriculture also in less favourable territories of the EU member states, is described in the “Concept on Agriculture Direct Support Payments in 2005” (2004).
In 2003, a number of research projects were carried out within the scope of the project “Formulation of Strategic Goals for Forestry Sector and Human Resources Development in Strategic Planning” as part of the “National Programme on Latvian Forests and Related Sectors”.
Marshes, wetlands and lakes typical in Latvia, are as significant in climate stabilisation (preservation of hydrological regime) as forests. Accordingly, projects of large scale, financed by LIFE – Nature, are implemented in Latvia.
The comparatively unspoilt nature in Latvia is often mentioned as the most important national resource performing various functions. In order to secure the preservation of nature values, a system for the management of specially protected areas has been developed in Latvia. This system, incorporated in the NATURA 2000 network, covers 12.24% of the territory of Latvia. The majority of the specially protected areas in Latvia, is covered by forests – 49% and agricultural lands – 24%, then water – 12%, marshes – 14% and other biotopes – 1%.
The amount of emissions not related to changes in growing stocks of forest stands is comparatively small, therefore measures promoting CO2 removals have the greatest significance in the climate change mitigation context: sustainable management of forest and forest land, increase of forest stand productivity and afforestation of unmanaged agricultural land. These measures coincide with the goals defined in “Forest Policy”. Restrictions on conversion of forestland are also implemented.
The expected financial support available within the SAPARD Subprogramme 1.2 “Afforestation of Agricultural Lands”, amounts to more than 6 million EUR and can be used to cover 50% of implemented project costs; this will facilitate the afforestation of approximately 4 thousand ha of land. As a result of the implementation of this measure for the development of rural environment and diversity, providing a considerable increase in the value of abandoned agricultural land and wood resources, 2,405.95 ha of abandoned agricultural land have already been converted to forest land, of which 470 ha (in 51 units) were afforested with coniferous trees, 788 ha (in 51 units) – deciduous trees and 1,147 ha (in 81 units) – mixed species of trees. As a result of the afforestation activities, 183 agricultural units gained alternative source of income, simultaneously extending employment opportunities in rural areas.
2.2.6 Waste
Until 1990, Latvia was part of the Union of Soviet Socialist Republics where the environment and environmental resources were officially acknowledged as state property and considered

R E P O R T O F T H E R E P U B L I C O F L A T V I A O N D E M O N S T R A B L E P R O G R E S S U N D E R T H E K Y O T O P R O T O C O L T O T H E U N I T E D N A T I O N S F R A M E W O R K C O N V E N T I O N O N C L I M A T E C H A N G E
____________________________________________________________________________________________________________________________
20
as part of technological, economical or other cycles. Such an approach did not facilitate the compensation of damage incurred to nature. This moral and legal heritage could partially explain the poor waste management practices in Latvia.
In 1990, there is no framework law regulating the administration of waste management activities. The law “On Hazardous Waste” is in force, affecting only a fraction of waste, regulating the activities with hazardous waste and forbidding any import of hazardous waste. Latvia has joined the Basel Convention of 1989 “On the Control of Transboundary Movements of Hazardous Wastes and their Disposal”, regulating the transportation of hazardous waste across frontiers and forbidding any export of hazardous waste from developed countries to the countries with economies in transition, including Latvia. Waste is not sorted and different types of waste – municipal waste, sludge from industrial wastewater treatment plants, household waste, hospital waste, are deposited all together in dumpsites, disregarding any environmental protection rules. Information on the amount of toxic waste was studied but a database was not yet developed, household waste registration was very approximate, no environmental monitoring activities were carried out in landfill areas and CH4 discharged from dumpsites was not utilised. There were approximately 500 such dumpsites in Latvia.
Thus, to reduce the amount of CH4 emissions, the following priority measures were identified: reduction of the volume of waste, sorting and recovery of waste (recycling, establishment of safe and environmentally friendly disposal facilities, biological treatment, incineration), restoring of the old dumpsites.
As from 1995, the objective of waste management was the prevention of the deterioration of environmental quality, simultaneously facilitating the establishment of waste recycling system.
Measures undertaken in Latvia in the waste management sector were aimed at establishing a well-functioning system for waste sorting, recycling and biological processing by 2010. The following policy measures were used: “State Investment Program”, projects subsidised by the Environmental Protection Fund, “State Strategy for Solid Municipal Waste Management in Latvia”, municipal waste management projects, implementation of projects “800+” and “500”.
In 1997, work was started on the national strategy for municipal waste management with one of the main objectives – to reduce the negative impact of waste on environment. That was particularly urgent because more than 500 dumpsites operating in Latvia were inadequately planned and equipped, many of them were overloaded. In 1998, the government adopted the “Solid Municipal Waste Management Strategy for 1998 – 2010”. It aimed to improve the quality and availability of municipal waste management services and gradually reduce the number of existing dumpsites. On the basis of this strategy the investment program “500-” was prepared and launched in North Vidzeme. In the period 1998 – 2004, 176 dumpsites with the total area of 261 ha were restored in the period 1998 – 2004, that is, 33% of the total number of dumpsites. Nevertheless, in the territory of Latvia 28% of the waste dumpsites that were initially identified as not meeting environmental requirements, are still operational. Annually, on average about 4% of the identified dumpsite areas are restored.
In accordance with the “National Plan for Waste Management for 2003 – 2012”, several municipal waste management projects are being implemented, using funding from the Cohesion Fund (previously also ISPA resources). In 2005, the “National Plan for Waste Management for 2006 – 2012” has been developed (replacing the “National Plan for Waste Management for 2003 – 2012”) in conformity with the “Law on Waste Management” (2000), setting the following hierarchy of waste management priorities: prevention of waste generation, reduction of the volume and harmfulness of waste, recycling for material and energy recovery, safe and environmentally friendly disposal, close and restore existing dumpsites and establish new municipal waste landfills.
Essential instrument to promote the recycling of packaging waste is the application of an 80% natural resources tax refund of the amount payable for packaging to enterprises that participate in the voluntary programs of packaging waste management. Natural resources tax is also applied for waste disposal in municipal waste landfills.

R E P O R T O F T H E R E P U B L I C O F L A T V I A O N D E M O N S T R A B L E P R O G R E S S U N D E R T H E K Y O T O P R O T O C O L T O T H E U N I T E D N A T I O N S F R A M E W O R K C O N V E N T I O N O N C L I M A T E C H A N G E
____________________________________________________________________________________________________________________________
21
A network of stations for the collection of sorted municipal waste will be established in Latvia. As part of the ISPA programme, a municipal waste management project has been implemented in Liepaja District (including the establishment of energy cells and cogeneration plant and creation of 26 waste collection areas in all counties), solid municipal waste management project in Ventspils District (including recycling of paper and cardboard) and municipal waste management project in the North Vidzeme Region (including establishment of nine waste sorting places). In order to ensure the purity of raw materials supplied for recycling, waste management organisations launch different information campaigns to encourage separate collection of recyclable waste.
In 2003, the EU LIFE project “Recycling of municipal biodegradable organic waste” was launched.
A specific component in the waste stream is packaging waste. Currently, there are nine packaging management organisations in Latvia with more than 1,000 companies participating in their voluntary programmes of packaging waste management. The companies implement these programmes using the resources, received as a refund in the amount of 80% of the packaging-related part of natural resource tax payment.
Considering that the majority of biodegradable organic waste is still disposed of, unseparated from the main flow, in municipal waste landfills, thus generating CH4 in anaerobic degradation process, collection of biogas and its use in production of thermal energy or electricity has a considerable potential to reduce GHG emissions from the waste sector (see Chapter 2.2.1).
In 2004, the waste landfill “Getlini Eko” Ltd carried of the collection of waste gas and energy generation: 12.6 million m3 of biogas were collected, containing 6.5 million m3 or 4,654 tonnes of relatively pure methane6. In 2005, 163,244 Nm3 of biogas were collected in Grobini landfill and 1,007,533 Nm3 of biogas were collected in the waste landfill “Skede” and used for the production of 658,033 kWh of electricity.
2.2.7 Cross-sectoral policies and measures
In Latvia, climate change mitigation policy and measures, simultaneously applying to more than one sector, are also implemented.
Policy: Implement the EU GHG emission allowance trading scheme
Realising that it would be difficult for many EU member states to fulfil GHG emission reduction commitments stated in the Kyoto Protocol without joint EU domestic policy, the European Parliament and Council on 13 October 2003 adopted the Directive 2003/87/EC establishing a scheme for greenhouse gas emission allowance trading within the Community and amending Council Directive 96/61/EC.
Latvia has transposed the provisions of this directive in the national legislation and in the period 2005 – 2007, 91 installations are participating in the emission allowance trading scheme. 13,706,012 allowances will be emitted, including 1,572,037 allowances for installations that would start operation after 2005.
Latvia has allowed voluntary participation in the trading scheme of installations with smaller production capacity or output volumes than those stated in the directive.
Participation in the scheme for GHG emission allowance trading within the European Community provides valuable experience in emissions trading, and allows Latvia to prepare for successful participation in the international emissions trading mechanism under the Kyoto Protocol, starting with 2008.
6 Source: “Getlini Eko” Ltd
R E P O R T O F T H E R E P U B L I C O F L A T V I A O N D E M O N S T R A B L E P R O G R E S S U N D E R T H E K Y O T O P R O T O C O L T O T H E U N I T E D N A T I O N S F R A M E W O R K C O N V E N T I O N O N C L I M A T E C H A N G E
____________________________________________________________________________________________________________________________
22
Policy: Participate in the Kyoto Protocol flexibility mechanisms
Latvia as a Party to the the Kyoto Protocol of the United Nations Framework Convention on Climate Change, has the opportunity to participate in the flexibility mechanisms under the Kyoto Protocol: joint implementation (hereinafter – JI), clean development mechanism (hereinafter – CDM), and international emissions trading (hereinafter – IET), of which two – JI and IET – in Latvia can be used to attract additional financial resources. In 2005, the guidelines for Joint Implementation projects were developed, documentation was prepared for the Austrian JI/CDM program tender for biogas collection in Daugavpils food processing enterprise (total emission reduction potential is planned 15,000 t CO2 eq.) was prepared.
The Ministry of Environment in co-operation with the Ministry of Economics and the Ministry of Finance has developed the project “Concept on the participation of Latvia in International Emissions Trading”. The concept has been elaborated to ensure the decision-making on the issue of Latvia’s participation in the International Emissions Trading mechanism under the UN Framework Convention on Climate Change and its Kyoto Protocol. The overall objective of the concept is to promote global climate change mitigation efforts. Latvia’s participation in International Emissions Trading as of 2008 presents an opportunity to attract additional financial resources. In line with the objective of the international emissions trading mechanism as set in the Kyoto Protocol, it is essential to earmark the revenues from the participation in IET for measures that would further reduce GHG emissions or increase CO2 removals.
Due to considerable interest of investors to implement JI projects in Latvia7, “Concept on the Implementation of JI Projects under the Kyoto Protocol to the UN Framework Convention on Climate Change, 2002 – 2012” and “Joint Implementation Strategy as Defined in the Kyoto Protocol to the UN Framework Convention on Climate Change (2002 – 2012)” were adopted in 2002. A more detailed description is provided in the Fourth National Communication of the Republic of Latvia to UN Framework Convention on Climate Change.
Latvia has signed bilateral co-operation agreements in the climate change sector with Denmark (2003), Austria (2003), Germany (2003 and 2004), the Netherlands (2000) and Finland (2000). Latvia has also joined the agreement on “Establishment of the Testing Ground for Flexible Mechanisms of the Kyoto Protocol” in 2004, coordinated by the Ministry of Economics.
Currently, one JI is being implemented in Latvia – Liepaja municipal waste management project and other JI projects are planned in the near future – biogas collection in agricultural farms.
Policy: Promote the implementation of environmental and energy management systems
Trade and industry agency of Denmark has financed the programme “Environmental Management in Eastern Europe”, with the aim of improving the environmental management systems (EMAS and ISO 14001). Currently projects in food, pharmaceutical, chemical, metal production and manufacturing industries are implemented.
In 2003, the Baltic States and Poland initiated a new programme – “Green Industry”. The programme is financed by the Norwegian Ministry of Foreign Affairs and is managed by the Norwegian Energy-Efficiency Group (NEEG). The “Green Industry” programme combines the environmental management system with energy management in an integrated management system. 10 food industry enterprises, 6 universities, consultancy companies, cleaner production centres and energy-efficiency centres have already joined this programme.
In cooperation with the Finnish Environmental Institute, the Finnish Ministry of Environment has financed a project to improve the EMAS system in Latvia.
As the public procurement policy is one of the main components of the Common EU Monetary policy (as stated by the Council Directive 93/36/EEC of 14 June 1993 coordinating procedures for the award of public supply contracts that coordinates the procedure for the
7 27 JI pilot projects have already been implemented in Latvia reducing GHG emissions by 370 Gg CO2 -equivalent
R E P O R T O F T H E R E P U B L I C O F L A T V I A O N D E M O N S T R A B L E P R O G R E S S U N D E R T H E K Y O T O P R O T O C O L T O T H E U N I T E D N A T I O N S F R A M E W O R K C O N V E N T I O N O N C L I M A T E C H A N G E
____________________________________________________________________________________________________________________________
23
assignment of public supply contracts and facilitates the integration of environmental criteria in the public procurement), one of Latvia’s future priorities in the environmental sector is to facilitate wider inclusion of environmental considerations in the state and municipal procurement procedures (so called “Green Procurement”). The elaboration of the “Green Procurement” concept is anticipated in 2005.
Eco-Management and Audit Scheme (EMAS) registry has been set up in Latvia. The Latvian National Accreditation Bureau performs the accreditation of environmental verifiers and supervises their activities, has developed and maintains a register of environment verifiers.
Companies, whose activities result in the generation of packaging waste, are motivated to establish and finance systems for the management of this waste (facilities for separated collection of recyclable waste, sorting, and recycling) by providing refund of the natural resources tax payable for packaging. Currently, there are nine packaging waste management organisations in Latvia with more than 1,000 companies participating in their voluntary packaging waste management programmes.
For a more detailed description of cross-sectoral policies and measures see the Fourth National Communication of the Republic of Latvia to UN Framework Convention on Climate Change.

R E P O R T O F T H E R E P U B L I C O F L A T V I A O N D E M O N S T R A B L E P R O G R E S S U N D E R T H E K Y O T O P R O T O C O L T O T H E U N I T E D N A T I O N S F R A M E W O R K C O N V E N T I O N O N C L I M A T E C H A N G E
____________________________________________________________________________________________________________________________
24
3. TRENDS AND PROJECTIONS OF GREENHOUSE GAS EMISSIONS
3.1 Trends of greenhouse gas emissions since 1990 Corresponding to the structure of Latvian national economy (see Chapter 2.2 Sectoral policies and measures since 1990) the share of economic sectors in aggregate greenhouse gas emissions has also changed (Figure 3.1.1). Moreover, the decreasing use of heavy oil products and increasing use of natural gas and fuel wood have also had an impact on emissions structure. The share of fuel wood in total energy consumption is significant – above 25%.
Energy sector, including transport, was the main source of GHG emissions – 70% of total amount. The second most important source is agriculture with its share in the total GHG emissions having decreased from 20% in 1990 to 15% in 2003. In the third most important source of GHG emissions – the waste sector – emissions have increased from 3% of 1990 to 9% in 2003. Solvent and other product use constitutes about 3% in the total amount of GHG emissions (with an increasing trend).
Aggregate greenhouse gas emissions by sectors in 1990 – 2003, Gg CO2 eq.
-20 000
-15 000
-10 000
-5 000
0
5 000
10 000
15 000
20 000
25 000
1990 1991 1992 1993 1994 1995 1996 1997 1998 1999 2000 2001 2002 2003
Agriculture
Land-use change and forestry (LULUCF) Waste
Solvent and other product use
EnergyIndustrial processes
GHG emissions, including LULUCF
Figure 3.1.1 Source: Latvian Environment, Geology and Meteorology Agency Also in Latvia, carbon dioxide (CO2) is the most significant GHG affecting climate. In 2003, compared to 1990, CO2 emissions have decreased by 60%, or from 18,890.63 Gg CO2 eq. in 1990 to 7,427.44 Gg CO2 eq. in 2003 (Figure 3.1.2). Energy sector has been the main source of CO2 emissions in all of these years. In 2003, 72% of all CO2 emissions (including energy production and transmission – 23%) have been produced by fossil fuel combustion, 9% – by industrial processes and construction sectors, 25% – transport and 13% – other sectors (agriculture, forestry, etc.).
Although forests are abundant in Latvia, CO2 removals in land-use, land-use change and forestry sector have been slightly lower than GHG emissions produced in 1990 – 2003.

R E P O R T O F T H E R E P U B L I C O F L A T V I A O N D E M O N S T R A B L E P R O G R E S S U N D E R T H E K Y O T O P R O T O C O L T O T H E U N I T E D N A T I O N S F R A M E W O R K C O N V E N T I O N O N C L I M A T E C H A N G E
____________________________________________________________________________________________________________________________
25
-20 000
-17 500-15 000-12 500-10 000
-7 500
-5 000-2 500
02 500
5 0007 500
10 00012 50015 000
17 50020 000
1990 1991 1992 1993 1994 1995 1996 1997 1998 1999 2000 2001 2002 2003
Energy Industrial processes
Solvent and other product use Agriculture
Waste Land-use change and forestry
CO2 emissions by economic sectors in 1990 – 2003, Gg
Figure 3.1.2 Source: Latvian Environment, Geology and Meteorology Agency Emissions of the second most significant GHG – methane (CH4) – have decreased as well; if aggregate CH4 emissions in 1990 were 3,704.86 Gg CO2 eq. then in 2003 – only 1,904.59 Gg CO2 eq. (decrease by 49%) (Figure 3.1.3). If the share of CH4 emissions in the aggregate GHG emissions was 15% in 1990, then in 2003 – already 18%. The key sources of methane emissions in Latvia are municipal waste landfills and domestic animal enteric fermentation processes. Other significant sources of emissions are leakage from natural gas pipelines and combustion of biomass.
CH4 emissions by economic sectors in 1990 – 2003, Gg
Figure 3.1.3 Source: Latvian Environment, Geology and Meteorology Agency
0
20
40
60
80
1 0 0
1 2 0
1 4 0
1 6 0
1 8 0
1 99 0 1 9 9 1 19 9 2 1 99 3 19 9 4 1 99 5 1 9 96 19 9 7 1 99 8 1 9 99 20 0 0 2 0 01 2 0 0 2 20 0 3
E n e rg y In d u stria l p ro c e sse s
A g ric u ltu re So lve n t a n d o th e r p ro d u c t u se
W a ste La n d -u se c h a n g e a n d fo re stry
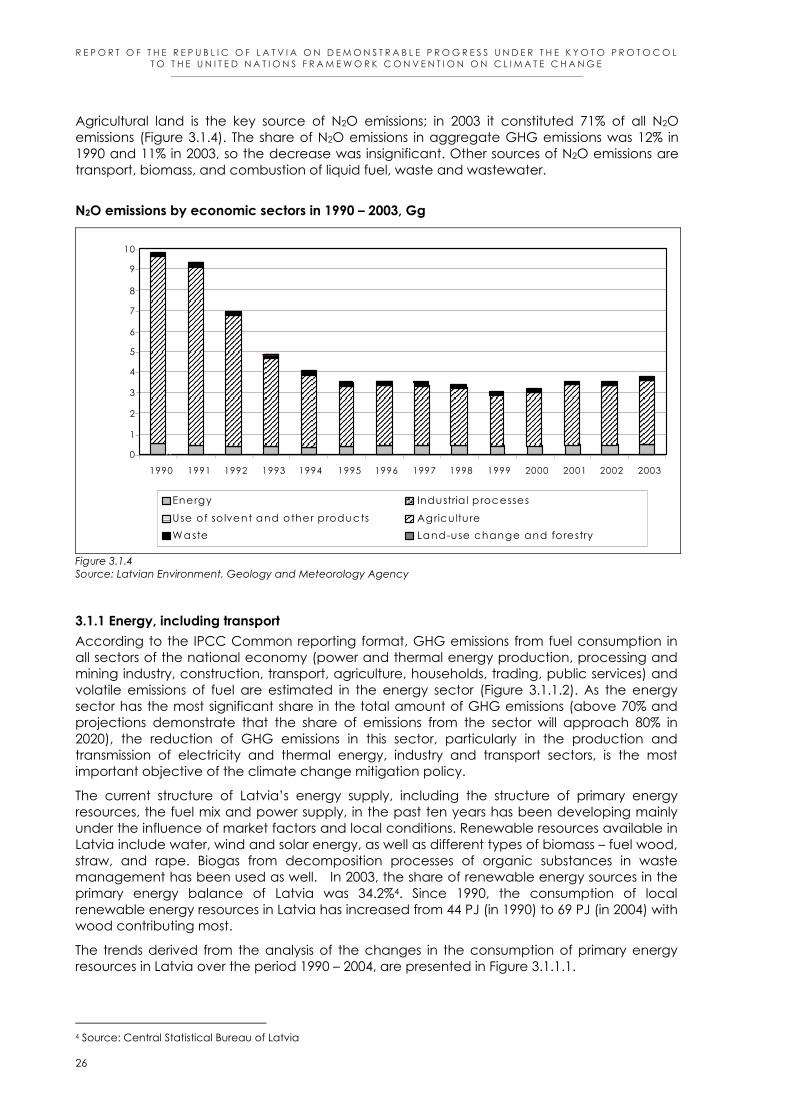
R E P O R T O F T H E R E P U B L I C O F L A T V I A O N D E M O N S T R A B L E P R O G R E S S U N D E R T H E K Y O T O P R O T O C O L T O T H E U N I T E D N A T I O N S F R A M E W O R K C O N V E N T I O N O N C L I M A T E C H A N G E
____________________________________________________________________________________________________________________________
26
Agricultural land is the key source of N2O emissions; in 2003 it constituted 71% of all N2O emissions (Figure 3.1.4). The share of N2O emissions in aggregate GHG emissions was 12% in 1990 and 11% in 2003, so the decrease was insignificant. Other sources of N2O emissions are transport, biomass, and combustion of liquid fuel, waste and wastewater.
N2O emissions by economic sectors in 1990 – 2003, Gg
0
1
2
3
4
5
6
7
8
9
10
1990 1991 1992 1993 1994 1995 1996 1997 1998 1999 2000 2001 2002 2003
Energy Industria l p rocesses
Use of so lvent and other products
Agricu lture Waste Land-use change and forestry
Figure 3.1.4 Source: Latvian Environment, Geology and Meteorology Agency
3.1.1 Energy, including transport According to the IPCC Common reporting format, GHG emissions from fuel consumption in all sectors of the national economy (power and thermal energy production, processing and mining industry, construction, transport, agriculture, households, trading, public services) and volatile emissions of fuel are estimated in the energy sector (Figure 3.1.1.2). As the energy sector has the most significant share in the total amount of GHG emissions (above 70% and projections demonstrate that the share of emissions from the sector will approach 80% in 2020), the reduction of GHG emissions in this sector, particularly in the production and transmission of electricity and thermal energy, industry and transport sectors, is the most important objective of the climate change mitigation policy.
The current structure of Latvia’s energy supply, including the structure of primary energy resources, the fuel mix and power supply, in the past ten years has been developing mainly under the influence of market factors and local conditions. Renewable resources available in Latvia include water, wind and solar energy, as well as different types of biomass – fuel wood, straw, and rape. Biogas from decomposition processes of organic substances in waste management has been used as well. In 2003, the share of renewable energy sources in the primary energy balance of Latvia was 34.2%4. Since 1990, the consumption of local renewable energy resources in Latvia has increased from 44 PJ (in 1990) to 69 PJ (in 2004) with wood contributing most.
The trends derived from the analysis of the changes in the consumption of primary energy resources in Latvia over the period 1990 – 2004, are presented in Figure 3.1.1.1.
4 Source: Central Statistical Bureau of Latvia

R E P O R T O F T H E R E P U B L I C O F L A T V I A O N D E M O N S T R A B L E P R O G R E S S U N D E R T H E K Y O T O P R O T O C O L T O T H E U N I T E D N A T I O N S F R A M E W O R K C O N V E N T I O N O N C L I M A T E C H A N G E
____________________________________________________________________________________________________________________________
27
Primary energy consumption by resource type in 1990 – 2004, PJ
61
28 26
3
43
2716
111
145
4
57
3
2815 11
62 58
0,090
30
60
90
120
150
Hea
vyfu
el o
il W
ood
Coa
l
Peat
Die
sel
Ga
solin
e
Oil p
rod
ucts
Hyd
ro e
nerg
ya
nd w
ind
ener
gy
Na
tura
l ga
s
1990
2004
Figure 3.1.1.1 Source: Central Statistical Bureau
It has to be noted that the share of biomass in the primary energy balance was around 29% (consumption – 12.5 PJ, potential – 9 million m3 or 63 PJ per year). In Latvia, the amount of biomass, from which it would be possible to obtain biogas, in 2004 comprised: manure – 5.8 million t, biodegradable municipal waste – 400 thousand t, animal origin waste – 34 thousand t, wastewater sludge – 180 thousand t (36 thousand t dry-weight), as well as biodegradable waste from public catering and food processing.
If in 1995 installed capacity of small hydropower plants was 1.85 MW, output – about 0.016 PJ or 0.11% of total energy produced in Latvia, then in 2000 the energy produced in small HPP reached 0.43% of the total energy output (currently, the potential is assessed as 0.18 PJ). In 2003, the total installed capacity of 150 small hydropower plants was 26.2 MW.
Although the current levels of consumption of biofuel are very low, they are increasing rapidly: in comparison to 2004, when 59 t of biodiesel fuel were produced, 36 t were consumed and 768 t of bioethanol were added to petrol, in 2005 already 629 t of biodiesel fuel were produced, 747 t – were consumed, however the consumption of bioethanol in petrol had decreased to 180 t9.
The amount of thermal energy produced by co-generation (in general and enterprise co-generation plants) is increasing every year: 23% in 1990, 34% in 1995, 45% in 2003 and 48% in 200410.
Figures 3.1.1.2 and 3.1.1.3 demonstrate that rapid emission reduction has occurred in the energy sector over the period 1990 – 2000. This is due to the restructuring of national economy and a decrease in the production volumes in industrial sectors, the fall of winter mean temperature, changes in the fuel mix and the implementation of energy efficiency measures. The “Energy Law” defines the use of environmentally sound, effective technologies. In 2000 the “State Energy Efficiency Strategy” was developed with the aim of determining a set of
9 Excise Goods Board data, State Revenue Service 10 Central Statistical Bureau data of Latvia
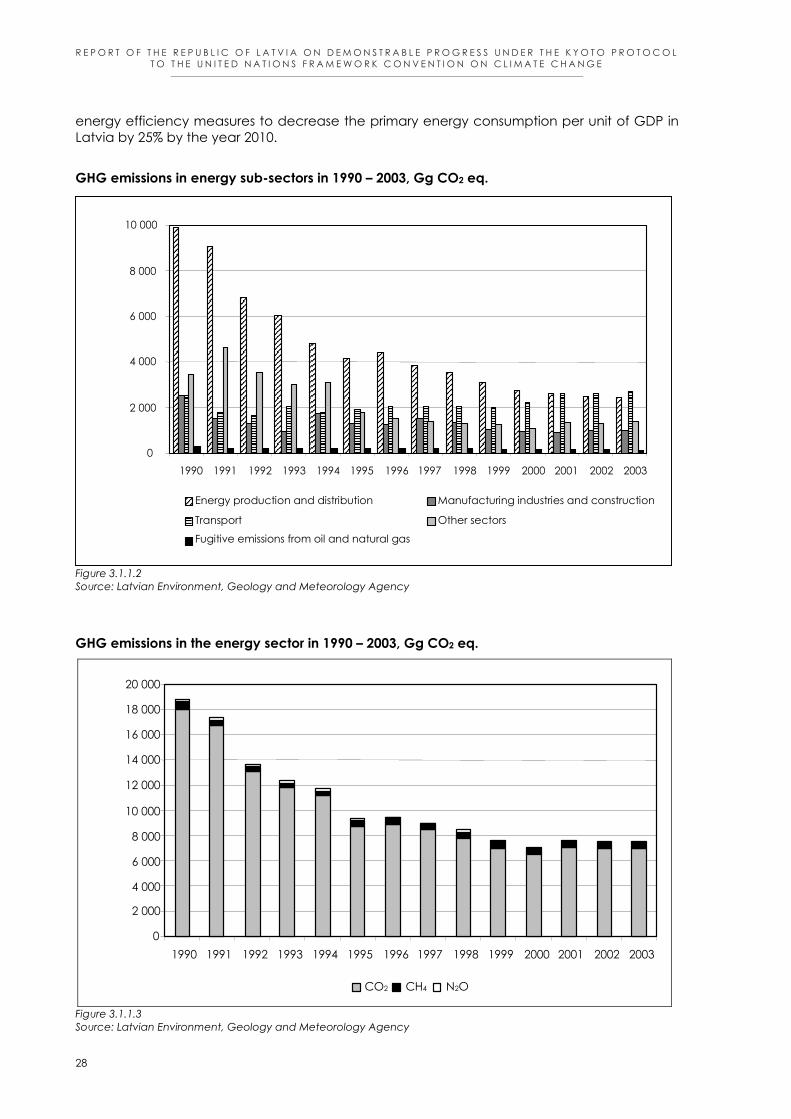
R E P O R T O F T H E R E P U B L I C O F L A T V I A O N D E M O N S T R A B L E P R O G R E S S U N D E R T H E K Y O T O P R O T O C O L T O T H E U N I T E D N A T I O N S F R A M E W O R K C O N V E N T I O N O N C L I M A T E C H A N G E
____________________________________________________________________________________________________________________________
28
energy efficiency measures to decrease the primary energy consumption per unit of GDP in Latvia by 25% by the year 2010.
GHG emissions in energy sub-sectors in 1990 – 2003, Gg CO2 eq.
Figure 3.1.1.2 Source: Latvian Environment, Geology and Meteorology Agency
GHG emissions in the energy sector in 1990 – 2003, Gg CO2 eq.
0
2 000
4 000
6 000
8 000
10 000
12 000
14 000
16 000
18 000
20 000
1990 1991 1992 1993 1994 1995 1996 1997 1998 1999 2000 2001 2002 2003
CO2 CH4 N2O
Figure 3.1.1.3 Source: Latvian Environment, Geology and Meteorology Agency
0
2 000
4 000
6 000
8 000
10 000
1990 1991 1992 1993 1994 1995 1996 1997 1998 1999 2000 2001 2002 2003
Energy production and distribution Manufacturing industries and construction
Transport Other sectors
Fugitive emissions from oil and natural gas
R E P O R T O F T H E R E P U B L I C O F L A T V I A O N D E M O N S T R A B L E P R O G R E S S U N D E R T H E K Y O T O P R O T O C O L T O T H E U N I T E D N A T I O N S F R A M E W O R K C O N V E N T I O N O N C L I M A T E C H A N G E
____________________________________________________________________________________________________________________________
29
The GDP share of the transport sector has been increasing since 2000 and in 2003 it was 11.5%. The demand for transportation services currently mostly depends on internal demand – 2/3, and 1/3 depends on external demand (mainly transit services; in 2003 they represented a 22.5% share in the transport sector).
In 2003, the amount of GHG emissions from the transport sector was 25.5%, moreover, it has not decreased considerably over these years; the amount of emissions has even increased in 2003 (Figure 3.1.1.2). That is due to the increase in the number of vehicles with combustion engine (cars, trucks and buses) in recent years, while the number of trolleybuses and trams has not changed, also the oil products reloading and distribution volumes have been increasing not in oil depots but in petrol stations.
The number of public transport passengers since 1990 has decreased almost three times but in recent years it has been increasing. In 2004, 395.4 million passengers used the public transport services, including 145.9 mln – city buses, 176.9 mln – city electric transport, 29.5 mln passengers – district route buses, 19.6 mln – long distance buses and 23.5 mln – local passenger trains. The number of passengers in local passenger train routes has also been gradually increasing.
3.1.2. Industrial processes
Although manufacturing industry from 1990 to 2004 was the second most important national economy sector in terms of value added, its share in the national economy is smaller than in most EU member states. Besides, all industry sectors have experienced a decrease in the production growth rates or, in some sectors, even reduced production volumes after joining the EU.
Food industry is the largest sector of Latvia’s manufacturing industry (constitutes almost ¼ of industrial value added). Approximately ¾ of food industry output is consumed in the local market and the rest is exported.
The second largest sector is wood processing, providing approximately one fifth of industrial value added. It is a sector with the most rapid growth over the time period 1990 – 2004 (output has increased by approximately 9,8% annually during the past three years).
If the construction volumes had been decreasing up to 1995, then after 1995 this sector has been developing rapidly and along with wood processing is one of the most dynamic sectors of Latvia’s national economy. Metal processing and engineering industries have also shown rapid growth.
According to the IPCC Common reporting format, only emissions that are not related to fuel consumption are estimated in the industrial processes sector, whereas emissions that originate from energy consumption in industrial enterprises are included in the energy sector (Figure 3.1.2.1).
In the industry sector, GHG emissions decreased considerably at the beginning of 1990s due to the decline in output volumes and restructuring of the sector to compete in open market conditions. Currently, the production volumes are increasing (Figure 3.1.2.2).
The share of GHG emissions generated in industrial processes in the total GHG balance has been insignificant – around 2%, although it has an increasing trend (Figure 3.1.2.3). In 2003, the share was 2.4 %, of which 75.3% were accounted for in the production of mineral products, 17.8% – in the process of metal production and 6.9% – from use of fluorinated GHG. Fluorinated GHG are not produced in Latvia and the amount of emissions originating from the use of products containing these gases, is comparatively small. However, there is a considerable number of equipment units and products used and maintained in Latvia. Some of the information on industrial output volumes is of restricted access, therefore only the total amount of GHG emissions from the sector can be presented. The most important GHG
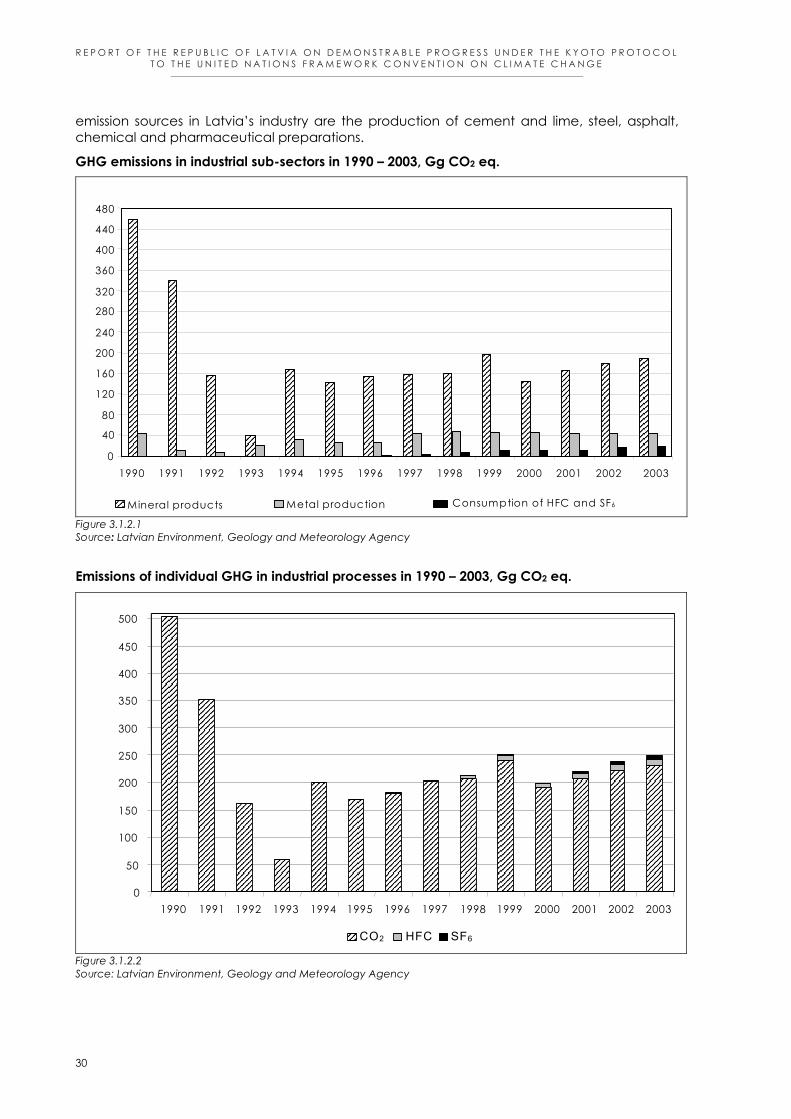
R E P O R T O F T H E R E P U B L I C O F L A T V I A O N D E M O N S T R A B L E P R O G R E S S U N D E R T H E K Y O T O P R O T O C O L T O T H E U N I T E D N A T I O N S F R A M E W O R K C O N V E N T I O N O N C L I M A T E C H A N G E
____________________________________________________________________________________________________________________________
30
emission sources in Latvia’s industry are the production of cement and lime, steel, asphalt, chemical and pharmaceutical preparations.
GHG emissions in industrial sub-sectors in 1990 – 2003, Gg CO2 eq.
0
40
80
120
160
200
240
280
320
360
400
440
480
1990 1991 1992 1993 1994 1995 1996 1997 1998 1999 2000 2001 2002 2003
Mineral products Metal production Consumption of HFC and SF6
Figure 3.1.2.1 Source: Latvian Environment, Geology and Meteorology Agency
Emissions of individual GHG in industrial processes in 1990 – 2003, Gg CO2 eq.
0
50
100
150
200
250
300
350
400
450
500
1990 1991 1992 1993 1994 1995 1996 1997 1998 1999 2000 2001 2002 2003
CO2 HFC SF6
Figure 3.1.2.2 Source: Latvian Environment, Geology and Meteorology Agency

R E P O R T O F T H E R E P U B L I C O F L A T V I A O N D E M O N S T R A B L E P R O G R E S S U N D E R T H E K Y O T O P R O T O C O L T O T H E U N I T E D N A T I O N S F R A M E W O R K C O N V E N T I O N O N C L I M A T E C H A N G E
____________________________________________________________________________________________________________________________
31
Fluorinated GHG emissions in 1995 – 2003 (no data for 1990 – 1994), Gg CO2 eq.
0
2
4
6
8
10
12
14
16
18
1995 1996 1997 1998 1999 2000 2001 2002 2003
HFC SF6
Figure 3.1.2.3 Source: Latvian Environment, Geology and Meteorology Agency
3.1.3 Use of solvent and other product
GHG emissions (CO2, N2O and NMVOC) created by the use of solvents and other products accounted for a small share – about 1% of the total amount of GHG emissions. The majority of these emissions originated from the production and use of paint and varnish (rapid growth), degreasing and dry cleaning, as well as printing processes, adhesives and household solvents. The emissions were reducing over the period 1990 – 1993, however after 1994 they have been growing constantly (in 2000, a small reduction due to a fall in production volumes in chemical industry, except for wood processing and metal production) (Figure 3.1.3.1). NMVOC emissions from the pharmaceutical industry are included in the IPCC Common reporting format under the sector “Chemical products, manufacture and processing” in the time period 1997 – 2003.
In 2003, 1.1% of the total GHG emissions were created by the use of solvents and other products, of which paint accounted for 73.9%, solvents used in households 12%, the remainder – from printing works, cleaning and N2O used in anaesthesia (data available since 1995).
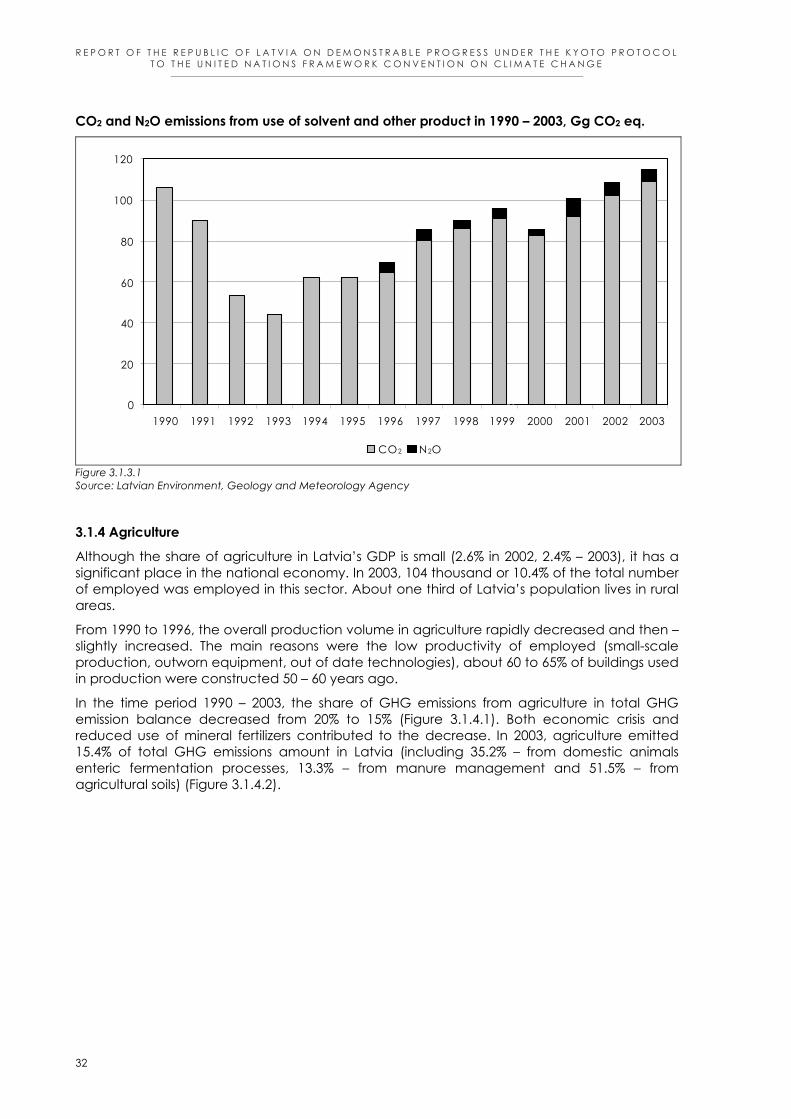
R E P O R T O F T H E R E P U B L I C O F L A T V I A O N D E M O N S T R A B L E P R O G R E S S U N D E R T H E K Y O T O P R O T O C O L T O T H E U N I T E D N A T I O N S F R A M E W O R K C O N V E N T I O N O N C L I M A T E C H A N G E
____________________________________________________________________________________________________________________________
32
CO2 and N2O emissions from use of solvent and other product in 1990 – 2003, Gg CO2 eq.
0
20
40
60
80
100
120
1990 1991 1992 1993 1994 1995 1996 1997 1998 1999 2000 2001 2002 2003
CO2 N2O
Figure 3.1.3.1 Source: Latvian Environment, Geology and Meteorology Agency
3.1.4 Agriculture
Although the share of agriculture in Latvia’s GDP is small (2.6% in 2002, 2.4% – 2003), it has a significant place in the national economy. In 2003, 104 thousand or 10.4% of the total number of employed was employed in this sector. About one third of Latvia’s population lives in rural areas.
From 1990 to 1996, the overall production volume in agriculture rapidly decreased and then – slightly increased. The main reasons were the low productivity of employed (small-scale production, outworn equipment, out of date technologies), about 60 to 65% of buildings used in production were constructed 50 – 60 years ago.
In the time period 1990 – 2003, the share of GHG emissions from agriculture in total GHG emission balance decreased from 20% to 15% (Figure 3.1.4.1). Both economic crisis and reduced use of mineral fertilizers contributed to the decrease. In 2003, agriculture emitted 15.4% of total GHG emissions amount in Latvia (including 35.2% – from domestic animals enteric fermentation processes, 13.3% – from manure management and 51.5% – from agricultural soils) (Figure 3.1.4.2).

R E P O R T O F T H E R E P U B L I C O F L A T V I A O N D E M O N S T R A B L E P R O G R E S S U N D E R T H E K Y O T O P R O T O C O L T O T H E U N I T E D N A T I O N S F R A M E W O R K C O N V E N T I O N O N C L I M A T E C H A N G E
____________________________________________________________________________________________________________________________
33
CH4 and N2O emissions from agriculture in 1990 – 2003, Gg CO2 eq.
0 500
1 000 1 500 2 000 2 500 3 000 3 500 4 000 4 500 5 000 5 500
1990 1991 1992 1993 1994 1995 1996 1997 1998 1999 2000 2001 2002 2003
CH4 N2O
Figure 3.1.4.1 Source: Latvian Environment, Geology and Meteorology Agency
GHG emissions in agricultural sub-sectors in 1990 – 2003, Gg CO2 eq.
0
500
1 000
1 500
2 000
2 500
3 000
1990 1991 1992 1993 1994 1995 1996 1997 1998 1999 2000 2001 2002 2003
Enteric fermentation Manure Management
Agricultural soils
Figure 3.1.4.2 Source: Latvian Environment, Geology and Meteorology Agency

R E P O R T O F T H E R E P U B L I C O F L A T V I A O N D E M O N S T R A B L E P R O G R E S S U N D E R T H E K Y O T O P R O T O C O L T O T H E U N I T E D N A T I O N S F R A M E W O R K C O N V E N T I O N O N C L I M A T E C H A N G E
____________________________________________________________________________________________________________________________
34
3.1.5 Land-use change and forestry
Latvia is one of the most densely forested countries in Europe – woodland occupies 45% of the national territory and on average the woodland per capita indicator is 4.5 times higher than the average in Europe. Forests are of great significance in the national economy of Latvia, providing also air purification from carbon dioxide and recreational value.
As a result of natural overgrowing of non-forest land and purposeful afforestation, Latvia’s total forestland area increases every year. However, in Latvia more anthropogenic GHG emissions are still emitted than removed (in 2003 77.8% of GHG emissions were removed or 8,187 GgCO2 equivalent less than was emitted). The GHG emission amount not related to changes in aggregate stocks of forest stands is insignificant – 1.1%.
Due to the Land Reform started in 1990, areas of agricultural land have decreased in recent years; by 2020 there could be about 580 thousand ha of naturally overgrown land. In 2002, the unmanaged agricultural land was 503 thousand ha, the land polluted with weeds – 182 thousand ha, the land overgrown with bushes – 50 thousand ha and wetlands – 113 thousand ha, which in total constituted 35.7% of all unmanaged agricultural land11. Purposeful afforestation of these areas would provide wood processing, pulp production and energy sectors with raw materials, as well as increase CO2 removals.
GHG emissions and CO2 removals from land-use change and forestry in 1990 – 2003, Gg CO2 eq.
-20000
-18000
-16000
-14000
-12000
-10000
-8000
-6000
-4000
-2000
0
1990
1991
1992
1993
1994
1995
1996
1997
1998
1999
2000
2001
2002
2003
mežaudžu krājas apjoma izmaiņas
Tiešās SEG emisijas un CO2 piesaiste, Gg CO2 ekv.
Figure 3.1.5.1 Source: Latvian Environment, Geology and Meteorology Agency
11 State Land Service data
Changes in forest stocks
Direct GHG emissions and CO2 removals

R E P O R T O F T H E R E P U B L I C O F L A T V I A O N D E M O N S T R A B L E P R O G R E S S U N D E R T H E K Y O T O P R O T O C O L T O T H E U N I T E D N A T I O N S F R A M E W O R K C O N V E N T I O N O N C L I M A T E C H A N G E
____________________________________________________________________________________________________________________________
35
CO2 emissions and removals from soils in 1990 – 2003, Gg
0
20
40
60
80
100
120
140
160
1990 1991 1992 1993 1994 1995 1996 1997 1998 1999 2000 2001 2002
Figure 3.1.5.2 Source: Latvian Environment, Geology and Meteorology Agency
3.1.6 Waste In Latvia, 57% of municipal waste (in total 1.056 mln tonnes or 453.1 kg per capita in 2003) is biodegradable. To comply with the requirements of EU environmental legislation12, the share of biodegradable waste deposited in landfills must not exceed 75% in 2010, 50% in 2013 and 35% in 2020 of the amount of biodegradable waste produced in 1995. Binding targets are set also for cardboard and paper packaging recovery – 56% in 2005 (53% recycling, 3% energy recovery), 67% in 2007 (59% recycling, 8% energy recovery).
The majority of collected municipal and other waste is still deposited in landfills and dumpsites without pre-treatment (approximately 40% of collected waste is deposited in the Getlini landfill in Riga district). Municipalities are responsible for the organization of waste management within their administrative territory. Collection and disposal of municipal waste in Latvia is mainly covered by commercial enterprises, of which 95% are owned by municipalities. Private commercial companies provide services to 50% of the inhabitants (in Riga, Liepaja, Jelgava and other cities).
In Latvia, biodegradable waste composting is very typical, usually done by the inhabitants of private houses. The compost prepared this way is mainly used as a soil fertilizer. Waste produced in food preparing process is used to feed livestock but this kind of practice is more common in households with a small number of livestock.
The share of GHG emissions generated by waste management in the national total GHG balance for 1990 - 2001 has increased from 822.60 Gg CO2 eq. in 1990 to 1,142.08 Gg CO2 eq. in 2001 but subsequently it has decreased due to improvements in the waste management system and strict legislation (Figures 3.1.6.1 and 3.1.6.2). In 2003, GHG emissions from the waste sector constituted 937.02 Gg CO2 eq.
12 European Parliament and Council Directive 1999/31/EC on the Landfill of waste and Directive 94/62/EC on Packaging and packaging waste

R E P O R T O F T H E R E P U B L I C O F L A T V I A O N D E M O N S T R A B L E P R O G R E S S U N D E R T H E K Y O T O P R O T O C O L T O T H E U N I T E D N A T I O N S F R A M E W O R K C O N V E N T I O N O N C L I M A T E C H A N G E
____________________________________________________________________________________________________________________________
36
Emissions of selected GHG from waste in 1990 – 2003, Gg CO2 eq.
0
200
400
600
800
1000
1200
1990 1991 1992 1993 1994 1995 1996 1997 1998 1999 2000 2001 2002 2003
CO2 CH4 N2O
Figure 3.1.6.1 Source: Latvian Environment, Geology and Meteorology Agency GHG emissions from waste sub-sectors in 1990 – 2003, Gg CO2 eq.
0
100
200
300
400
500
600
700
800
900
1990 1991 1992 1993 1994 1995 1996 1997 1998 1999 2000 2001 2002 2003
Solid waste Disposal on Land Wastewater handling Waste incineration
Figure 3.1.6.2 Source: Latvian Environment, Geology and Meteorology Agency
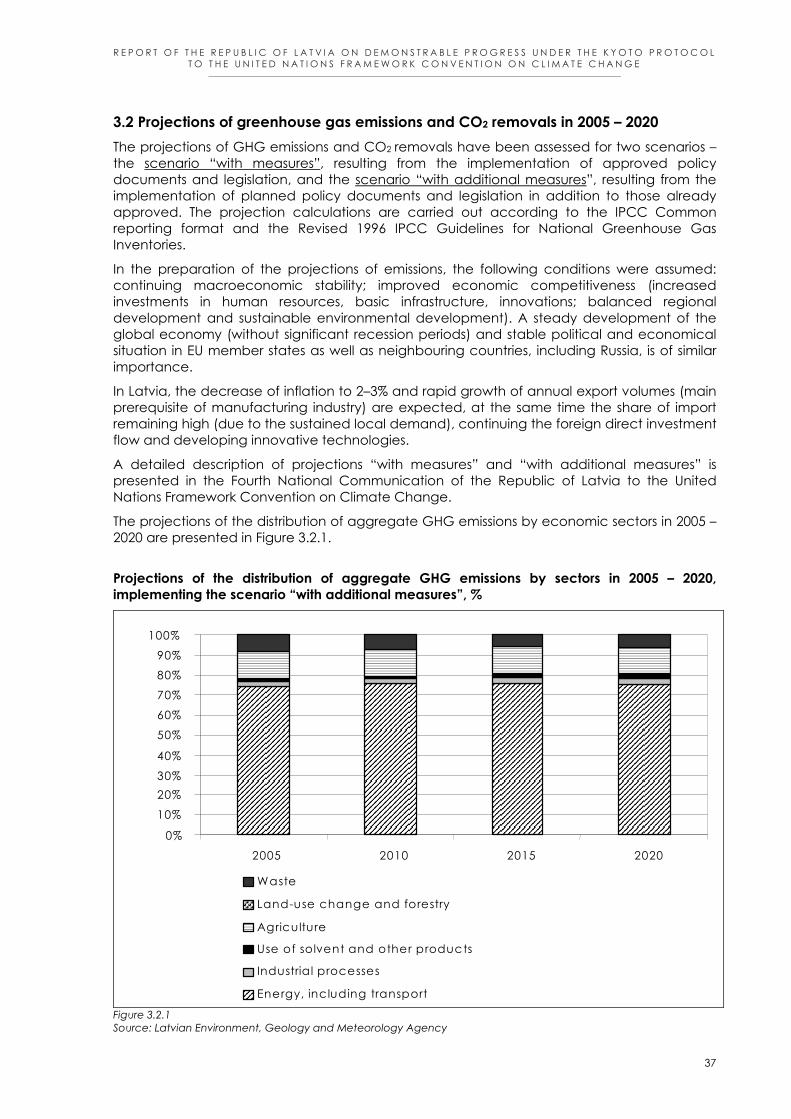
R E P O R T O F T H E R E P U B L I C O F L A T V I A O N D E M O N S T R A B L E P R O G R E S S U N D E R T H E K Y O T O P R O T O C O L T O T H E U N I T E D N A T I O N S F R A M E W O R K C O N V E N T I O N O N C L I M A T E C H A N G E
____________________________________________________________________________________________________________________________
37
3.2 Projections of greenhouse gas emissions and CO2 removals in 2005 – 2020 The projections of GHG emissions and CO2 removals have been assessed for two scenarios – the scenario “with measures”, resulting from the implementation of approved policy documents and legislation, and the scenario “with additional measures”, resulting from the implementation of planned policy documents and legislation in addition to those already approved. The projection calculations are carried out according to the IPCC Common reporting format and the Revised 1996 IPCC Guidelines for National Greenhouse Gas Inventories.
In the preparation of the projections of emissions, the following conditions were assumed: continuing macroeconomic stability; improved economic competitiveness (increased investments in human resources, basic infrastructure, innovations; balanced regional development and sustainable environmental development). A steady development of the global economy (without significant recession periods) and stable political and economical situation in EU member states as well as neighbouring countries, including Russia, is of similar importance.
In Latvia, the decrease of inflation to 2–3% and rapid growth of annual export volumes (main prerequisite of manufacturing industry) are expected, at the same time the share of import remaining high (due to the sustained local demand), continuing the foreign direct investment flow and developing innovative technologies.
A detailed description of projections “with measures” and “with additional measures” is presented in the Fourth National Communication of the Republic of Latvia to the United Nations Framework Convention on Climate Change.
The projections of the distribution of aggregate GHG emissions by economic sectors in 2005 – 2020 are presented in Figure 3.2.1.
Projections of the distribution of aggregate GHG emissions by sectors in 2005 – 2020, implementing the scenario “with additional measures”, %
0% 10% 20% 30% 40% 50% 60% 70% 80% 90%
100%
2005 2010 2015 2020
Waste
Land-use change and forestry
Agriculture
Use of solvent and other products
Industrial processes
Energy, including transport
Figure 3.2.1 Source: Latvian Environment, Geology and Meteorology Agency
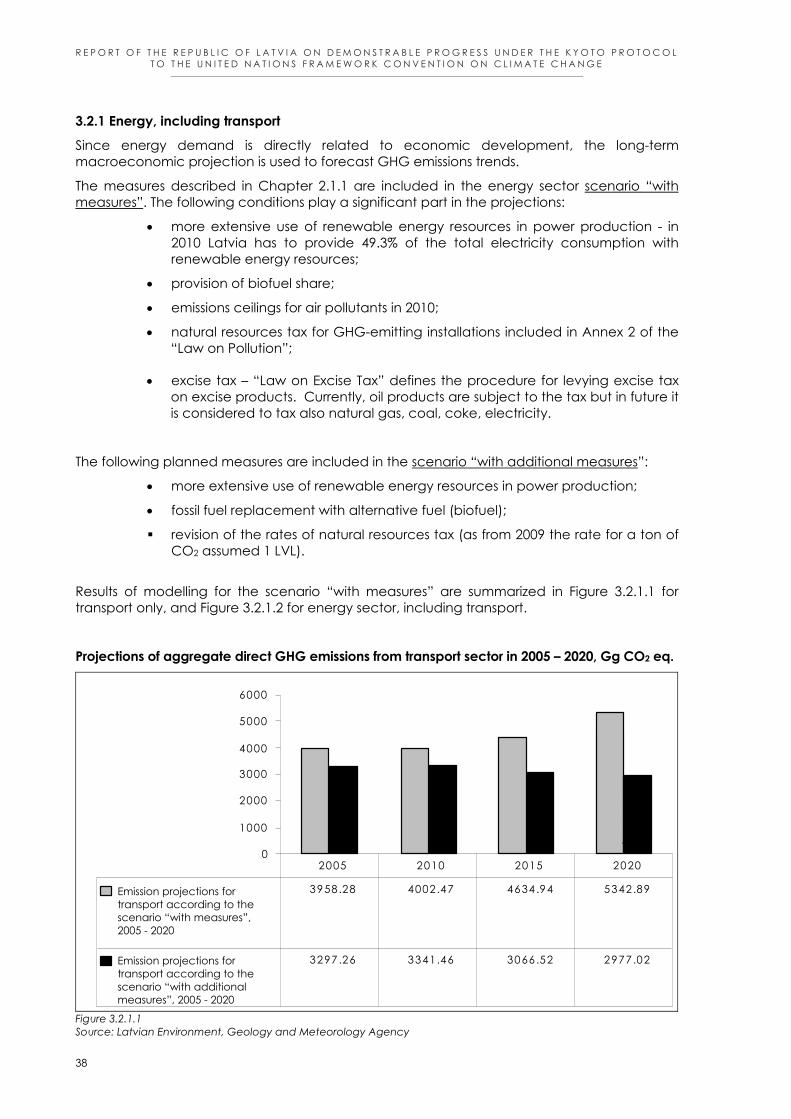
R E P O R T O F T H E R E P U B L I C O F L A T V I A O N D E M O N S T R A B L E P R O G R E S S U N D E R T H E K Y O T O P R O T O C O L T O T H E U N I T E D N A T I O N S F R A M E W O R K C O N V E N T I O N O N C L I M A T E C H A N G E
____________________________________________________________________________________________________________________________
38
3.2.1 Energy, including transport
Since energy demand is directly related to economic development, the long-term macroeconomic projection is used to forecast GHG emissions trends.
The measures described in Chapter 2.1.1 are included in the energy sector scenario “with measures”. The following conditions play a significant part in the projections:
• more extensive use of renewable energy resources in power production - in 2010 Latvia has to provide 49.3% of the total electricity consumption with renewable energy resources;
• provision of biofuel share;
• emissions ceilings for air pollutants in 2010;
• natural resources tax for GHG-emitting installations included in Annex 2 of the “Law on Pollution”;
• excise tax – “Law on Excise Tax” defines the procedure for levying excise tax on excise products. Currently, oil products are subject to the tax but in future it is considered to tax also natural gas, coal, coke, electricity.
The following planned measures are included in the scenario “with additional measures”:
• more extensive use of renewable energy resources in power production;
• fossil fuel replacement with alternative fuel (biofuel);
revision of the rates of natural resources tax (as from 2009 the rate for a ton of CO2 assumed 1 LVL).
Results of modelling for the scenario “with measures” are summarized in Figure 3.2.1.1 for transport only, and Figure 3.2.1.2 for energy sector, including transport.
Projections of aggregate direct GHG emissions from transport sector in 2005 – 2020, Gg CO2 eq.
0
1000
2000
3000
4000
5000
6000
3958.28 4002.47 4634.94 5342.89
3297.26 3341.46 3066.52 2977.02
2005 2010 2015 2020
Figure 3.2.1.1 Source: Latvian Environment, Geology and Meteorology Agency
Emission projections for transport according to the scenario “with measures”, 2005 - 2020
Emission projections for transport according to the scenario “with additional measures”, 2005 - 2020

R E P O R T O F T H E R E P U B L I C O F L A T V I A O N D E M O N S T R A B L E P R O G R E S S U N D E R T H E K Y O T O P R O T O C O L T O T H E U N I T E D N A T I O N S F R A M E W O R K C O N V E N T I O N O N C L I M A T E C H A N G E
____________________________________________________________________________________________________________________________
39
Projections of aggregate direct GHG emissions from energy, including transport, in 2005 – 2020, Gg CO2 eq.
0
2 000
4 000
6 000
8 000
10 000
12 000
14 000
9 401.83 10 542.41 11 593.08 13 112.81
8746.90 9833.81 10381.59 10591.60
2005 2010 2015 2020
Figure 3.2.1.2 Source: Latvian Environment, Geology and Meteorology Agency 3.2.2 Industrial processes
The emission projections for industrial processes are based on analysis of statistical data for the volumes of manufacturing output in the period 1990 – 2003, long-term macroeconomic projection, current and anticipated levels of foreign trade and trends regarding the expected production volumes.
Only the scenario “with measures” is considered because currently no new policies and legislation are planned that would affect the amount of GHG emissions in the industrial sector.
The projections of CO2, HFC un SF6 emissions are presented in Figure 3.2.2.1.
Emission projections for energy, including transport, according to the scenario “with measures”, 2005 - 2020
Emission projections for energy, including transport, according to the scenario “with additional measures”, 2005 - 2020

R E P O R T O F T H E R E P U B L I C O F L A T V I A O N D E M O N S T R A B L E P R O G R E S S U N D E R T H E K Y O T O P R O T O C O L T O T H E U N I T E D N A T I O N S F R A M E W O R K C O N V E N T I O N O N C L I M A T E C H A N G E
____________________________________________________________________________________________________________________________
40
Projections of CO2, HFC and SF6 emissions from industrial processes in 2005 – 2020, Gg CO2 eq.
372.64 355.28
334.61
278.76
0
50
100
150
200
250
300
350
400
2005 2010 2015 2020
Figure 3.2.2.1 Source: Latvian Environment, Geology and Meteorology Agency
3.2.3 Solvent and other product use
The emission projections from solvent and other product use is based on long-term macroeconomic projection and analysis of statistical data on production volumes, import and use of paint and varnish materials in the time period 1990 – 2003. The assumption that the present correlation between the construction volumes in Latvia and the production, import and use of paint and varnish materials will remain the same in the future, and that the present increasing trend in production volumes and import will continue, is important in projection estimations.
Considering the small share of GHG emissions from this sector in the total amount of GHG emissions, particular measures are not implemented and planned in this sector, therefore the emissions from solvent and other product use are projected only for the scenario “with measures” and the projections of CO2 and N2O emissions are presented in Figure 3.2.3.1.
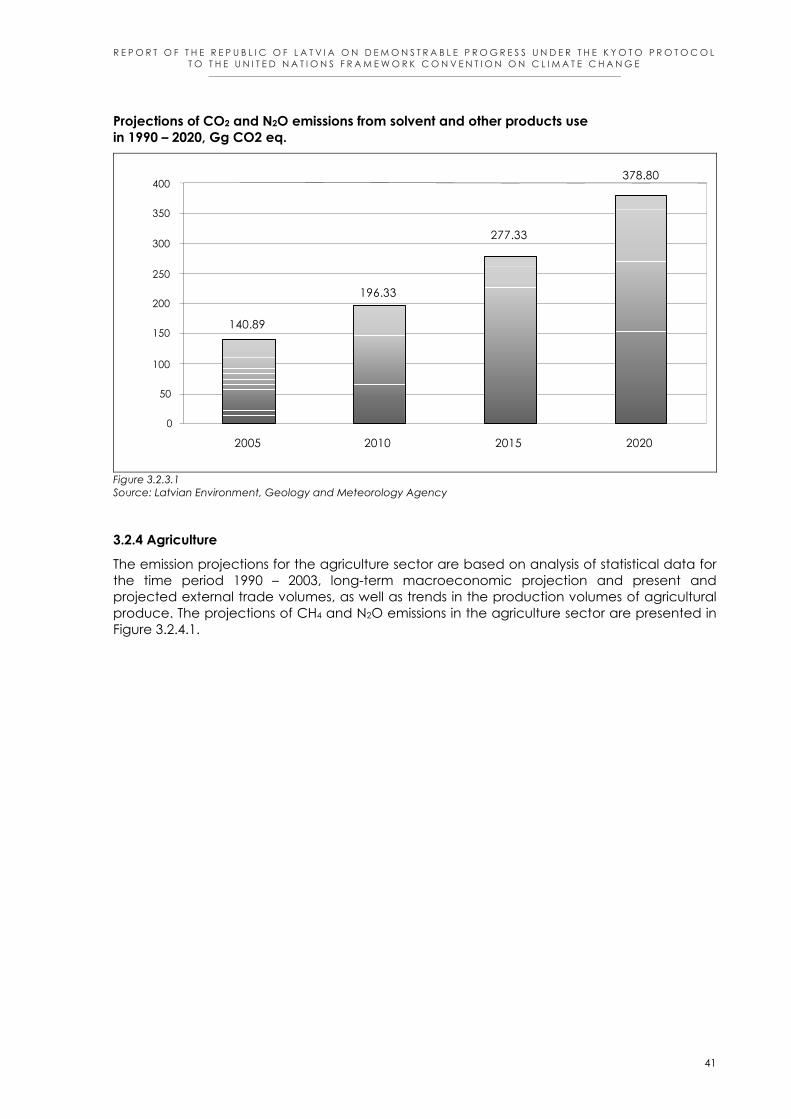
R E P O R T O F T H E R E P U B L I C O F L A T V I A O N D E M O N S T R A B L E P R O G R E S S U N D E R T H E K Y O T O P R O T O C O L T O T H E U N I T E D N A T I O N S F R A M E W O R K C O N V E N T I O N O N C L I M A T E C H A N G E
____________________________________________________________________________________________________________________________
41
Projections of CO2 and N2O emissions from solvent and other products use in 1990 – 2020, Gg CO2 eq.
140.89
196.33
277.33
378.80
0
50
100
150
200
250
300
350
400
2005 2010 2015 2020
Figure 3.2.3.1 Source: Latvian Environment, Geology and Meteorology Agency 3.2.4 Agriculture
The emission projections for the agriculture sector are based on analysis of statistical data for the time period 1990 – 2003, long-term macroeconomic projection and present and projected external trade volumes, as well as trends in the production volumes of agricultural produce. The projections of CH4 and N2O emissions in the agriculture sector are presented in Figure 3.2.4.1.

R E P O R T O F T H E R E P U B L I C O F L A T V I A O N D E M O N S T R A B L E P R O G R E S S U N D E R T H E K Y O T O P R O T O C O L T O T H E U N I T E D N A T I O N S F R A M E W O R K C O N V E N T I O N O N C L I M A T E C H A N G E
____________________________________________________________________________________________________________________________
42
Projections of CH4 and N2O emissions from agriculture in 1990 – 2020, Gg CO2 eq.
1657.46
1737.23
1803.281819.71
1607.23
1789.18
1721.44
1662.41
1500,00
1550,00
1600,00
1650,00
1700,00
1750,00
1800,00
1850,00
2005 2010 2015 2020 Emission projection from agriculture for scenario “with measures”, 2005 - 2020
Emission projection from agriculture for scenario “with additional measures”, 2005 - 2020
Figure 3.2.4.1 Source: Latvian Environment, Geology and Meteorology Agency 3.2.5 Land-use change and forestry
The following sources of information were used for the projection of the forestry sector development: database of the State Forest Service, data from the State Land Service, research and modules developed by experts for the “Latvian National Programme for the Development of Forestry and Related Sectors”, as well as assessments by specialists from the Ministry of Agriculture and other forestry experts.
The projections of direct GHG emissions and CO2 removals are presented in Table 3.2.5.1.

R E P O R T O F T H E R E P U B L I C O F L A T V I A O N D E M O N S T R A B L E P R O G R E S S U N D E R T H E K Y O T O P R O T O C O L T O T H E U N I T E D N A T I O N S F R A M E W O R K C O N V E N T I O N O N C L I M A T E C H A N G E
____________________________________________________________________________________________________________________________
43
Projections of aggregate direct GHG emissions from land-use, land-use change and forestry, 2005 – 2020, Gg CO2 eq.
-16,000 -14,000 -12,000 -10,000 -8,000 -6,000 -4,000 -2,000
0
Projection of direct GHG emissions and CO2 removals for scenario “with measures”, 2005 - 2020
-7,736.93 -8,323.54 -12,663.24 -13,141.60
-7,798.53 -8,210.61 -13,263.04 -13,875.50
2005 2010 2015 2020
Projection of direct GHG emissions and CO2 removals for scenario “with additional measures”, 2005 - 2020
Figure 3.2.5.1 Source: Latvian Environment, Geology and Meteorology Agency 3.2.6 Waste
The projection of emissions from the waste sector is based on analysis of statistical data for the time period 1990 – 2003 and long-term macroeconomic projection.
The recycling volumes are expected to increase as rapidly as in recent years. The factor that has the greatest impact on CH4 emissions in the waste sector is the collection of biogas from municipal waste landfills. In Latvia, the construction of 10–12 municipal waste landfills with installed biogas collection systems is planned. With increasing amounts of separated waste, waste recycling or export for recycling will increase as well.
The projections of CH4 and N2O emissions in the waste sector are presented in Figure 3.2.6.1.

R E P O R T O F T H E R E P U B L I C O F L A T V I A O N D E M O N S T R A B L E P R O G R E S S U N D E R T H E K Y O T O P R O T O C O L T O T H E U N I T E D N A T I O N S F R A M E W O R K C O N V E N T I O N O N C L I M A T E C H A N G E
____________________________________________________________________________________________________________________________
44
Projections of aggregate direct GHG emissions from waste in 2005 – 2020, Gg CO2 eq.
740 760 780 800 820 840 860 880 900 920 940 960
Emission projection from waste for scenario “with measures”, 2005 - 2020
913.46 933.02 822.98 902.33
913.46 924.32 809.75 883.04
2005 2010 2015 2020
Emission projection from waste for scenario “with additional measures”, 2005 - 2020
Figure 3.2.6.1 Source: Latvian Environment, Geology and Meteorology Agency
3.3 Methodology of projection estimation The IPCC Common reporting format was used for the projection calculations of GHG emissions and CO2 removals for scenarios “with measures” and “with additional measures”. Correspondingly, the amounts of GHG emissions and CO2 removals were projected for each sector, considering policies and measures described in Chapter 2.2.
A detailed description of the methodology for the projection calculations is presented in the Fourth National Communication of the Republic of Latvia to the United Nations Framework Convention on Climate Change.
4. ASSESSMENT OF POLICIES AND MEASURES TO MEET THE EMISSION REDUCTION COMMITMENTS UNDER THE KYOTO PROTOCOL
In accordance with the provisions of the Kyoto Protocol, the total GHG emissions in Latvia in the period 2008 – 2012 have to be reduced by 8% compared to 1990, thus the average annual GHG emissions in this period must not exceed 23,323 Gg CO2 eq. GHG emissions in the scenario “with measures” will decrease by 46% in 2010, compared to 1990 level and in the scenario “with additional measures” – by 49%; in 2020, these figures will be 35% and 45% respectively. That means that Latvia will be able to fulfil its international commitments to
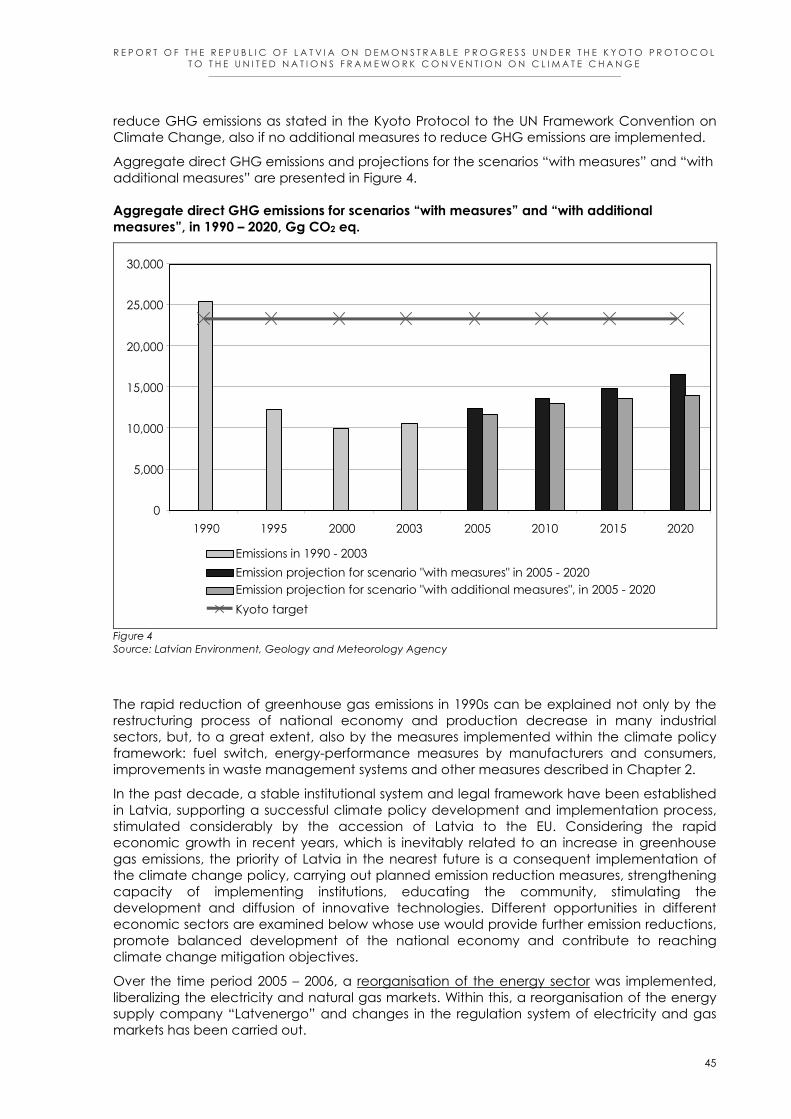
R E P O R T O F T H E R E P U B L I C O F L A T V I A O N D E M O N S T R A B L E P R O G R E S S U N D E R T H E K Y O T O P R O T O C O L T O T H E U N I T E D N A T I O N S F R A M E W O R K C O N V E N T I O N O N C L I M A T E C H A N G E
____________________________________________________________________________________________________________________________
45
reduce GHG emissions as stated in the Kyoto Protocol to the UN Framework Convention on Climate Change, also if no additional measures to reduce GHG emissions are implemented.
Aggregate direct GHG emissions and projections for the scenarios “with measures” and “with additional measures” are presented in Figure 4. Aggregate direct GHG emissions for scenarios “with measures” and “with additional measures”, in 1990 – 2020, Gg CO2 eq.
0
5,000
10,000
15,000
20,000
25,000
30,000
1990 1995 2000 2003 2005 2010 2015 2020
Emissions in 1990 - 2003 Emission projection for scenario "with measures" in 2005 - 2020 Emission projection for scenario "with additional measures", in 2005 - 2020Kyoto target
Figure 4 Source: Latvian Environment, Geology and Meteorology Agency
The rapid reduction of greenhouse gas emissions in 1990s can be explained not only by the restructuring process of national economy and production decrease in many industrial sectors, but, to a great extent, also by the measures implemented within the climate policy framework: fuel switch, energy-performance measures by manufacturers and consumers, improvements in waste management systems and other measures described in Chapter 2.
In the past decade, a stable institutional system and legal framework have been established in Latvia, supporting a successful climate policy development and implementation process, stimulated considerably by the accession of Latvia to the EU. Considering the rapid economic growth in recent years, which is inevitably related to an increase in greenhouse gas emissions, the priority of Latvia in the nearest future is a consequent implementation of the climate change policy, carrying out planned emission reduction measures, strengthening capacity of implementing institutions, educating the community, stimulating the development and diffusion of innovative technologies. Different opportunities in different economic sectors are examined below whose use would provide further emission reductions, promote balanced development of the national economy and contribute to reaching climate change mitigation objectives.
Over the time period 2005 – 2006, a reorganisation of the energy sector was implemented, liberalizing the electricity and natural gas markets. Within this, a reorganisation of the energy supply company “Latvenergo” and changes in the regulation system of electricity and gas markets has been carried out.

R E P O R T O F T H E R E P U B L I C O F L A T V I A O N D E M O N S T R A B L E P R O G R E S S U N D E R T H E K Y O T O P R O T O C O L T O T H E U N I T E D N A T I O N S F R A M E W O R K C O N V E N T I O N O N C L I M A T E C H A N G E
____________________________________________________________________________________________________________________________
46
In order to increase the share of renewable energy resources in the total energy balance, promote energy security, decrease national dependency on imported energy resources as well as reduce GHG emissions, Latvia has to ensure that the share of renewable energy resources reaches 49.3% of power production in the total energy consumption by 2010.
Considering the development rates of innovative technologies, the approbation of environmentally friendly technologies in the form of pilot projects should be considered in hydropower production. The construction of small hydropower plants has to be balanced with the preservation of fish resources and the nature protection requirements. Small hydropower plants can stimulate regional development and attract investments, particularly if they align with tourism and fishery development plans 13.
In order to proceed to develop a co-ordinated use of wind energy, it is necessary to gather and disseminate information about the territories where both climate and geographic conditions are favourable, the use of wind energy is economically feasible for power production and legal provisions do not restrict economic activities.
To facilitate the development of projects for solar energy use, it is necessary to disseminate the positive experience obtained during the implementation of pilot projects, as well as to collect and disseminate information about the potential sites where the use of solar energy would be feasible and develop mechanisms/instruments for the support of such projects.
Pursuant to the Directive 2003/30/EC of the European Parliament and of the Council of 8 May 2003 on the promotion of the use of biofuel or other renewable fuel for transport, by 31 December 2010 2% (in energy units) of the total consumption of petrol and diesel in the transport sector in Latvia has to be covered by biofuel, by 2020 the share of biofuel has to reach 5.75%. To achieve these goals, it would be necessary to produce and use at least 20 thousand tonnes of biofuel already in 2005 and at least 75 thousand tonnes in 2010, or this amount of biofuel has to be imported14. The Cabinet of Ministers has declared that agricultural raw materials produced in Latvia should be given the priority in the production of biofuel and the biofuel produced in Latvia should be given the priority in the use of biofuel. The maximum total area for growing rape in Latvia is approximately 180 thousand ha, which would supply raw materials for the production of 168 thousand t of biodiesel.
It is necessary to assess opportunities and preconditions for biofuel use in other sectors as well (public transport, inland water transport, forest management). The implementation of biofuel quality control system, promotion of information exchange and active research work in order to develop measures to reduce the production cost of biofuel are the issues to be solved in the nearest future.
The development of the biofuel production sector will benefit the state as a whole (GDP growth, employment opportunities in rural areas, improvement of environment quality), therefore national support is considered for implementation of these measures. Currently, the type and amount of support to promote biofuel production and use, and improve the competitiveness of biofuel with fossil fuel prices is still discussed.
Current support for the construction of combined heat and power generation plants is implemented with economic instruments – increased tariffs for electricity purchase and provision of financial resources, as well as informative instruments – information exchange, training and workshops.
It is necessary to ensure a more complete use of wood residues in heating, currently insufficiently developed due to disadvantageous economical conditions for the suppliers of wood residues15. Sawn timber production in Latvia continues to grow steadily and the production volumes in 2002 have increased more than 10 times compared to 1993.
In Latvia, like in other Central and Eastern European countries energy-efficiency is 2–5 times lower than in the EU-15 countries. About 70% of the total generated thermal energy is spent in 13 National Program of Biological Diversity, 2000 14 Action plan for the implementation of the programme, “The Bio-Fuel Production and Use in Latvia”, 2004 15 Renewable Resources Use Programme, final draft, PHARE, 2000

R E P O R T O F T H E R E P U B L I C O F L A T V I A O N D E M O N S T R A B L E P R O G R E S S U N D E R T H E K Y O T O P R O T O C O L T O T H E U N I T E D N A T I O N S F R A M E W O R K C O N V E N T I O N O N C L I M A T E C H A N G E
____________________________________________________________________________________________________________________________
47
residential and public buildings in Latvia. Western experience demonstrates that 70% of overall energy-efficiency potential can be achieved at the end-user level. Therefore one of the most perspective ways to reduce GHG emissions in Latvia is by improving energy-efficiency in housing and public buildings. To achieve better energy performance, the development of regulations is required in the area of energy audit and certification of buildings, thermal energy measurement, equipment standards etc. and state support is necessary to implement energy performance measures.
The competitiveness of the public transport can be secured by the price and quality of the provided service – speed, safety, regularity, frequency and convenience. The public transport has to be environmentally and user friendly. For example, the development of the electric public transportation network in Riga would reduce the amount of emissions of CO, CO2, nitrogen oxides and volatile organic compounds by 15–20% in the city centre. The implementation of the “Riga Traffic Concept for 1999 – 2003” has provided for the start of the renovation of the rolling stock, development of the infrastructure of the stops and passenger transportation.
The measures for GHG emission reduction in the industrial sector at the moment are mainly related to energy-efficiency of technological processes and material recycling. As CO2 emissions in the production of mineral products and steel are produced as a by-product and their amount depends on the chemical composition of raw materials, there are few economically feasible measures for the reduction of CO2 emissions per unit of production. Therefore, the GHG emissions reduction policy in the industrial sector is focused on the improvement of general operational practice.
In the “Strategy for the Development of Industry, 2004 – 2013” the sustainable development of industry sector is defined as a priority, to be promoted through information availability on BAT, principles and advantages of cleaner production, support for entrepreneurs in providing consultations, environmental audit, development of environmental action plans, as well as information on environmental management systems and good production practice implementation and possible financial resources. Integrative principles of BAT and cleaner production are adaptable in the industrial, energy and agricultural sectors.
The programme “Environmental Management in Eastern Europe” financed by Trade and Industry Agency of Denmark will be continued to further improve the environmental management systems, paying particular attention to the chemical industry (production of chemical reagents, pesticides and agrochemical preparations, paint, solvents, cleaning agents and synthetic fibre) and gradually involving companies from other industrial sectors.
Specific measures are not considered for the reduction of GHG emissions in agriculture, although implementation of general agricultural policy by carrying out environment protecting measures will also promote the implementation of climate change mitigation policy. It is possible to reduce N2O emissions from the use of organic fertilisers and agricultural land by improving the application of the fertilisers in the soil. Afforestation of unmanaged agricultural lands has a considerable potential to increase CO2 removals in agriculture – currently, the use of 42% of agricultural land is undecided, thus it is likely that the overgrowing of agricultural land with shrubs and trees will continue. It is estimated that as a result of afforestation of unmanaged agricultural land over the period 2000 – 2006, it is possible to increase CO2 removals by 300 Gg. The economic, social and ecological benefits of the measure can be assessed in more detail in the course of a full rotation period of forest stands, that is, within a period of 80–100 years.
National support should be provided for the owners of agricultural land and private forests. Without support payments for growing the forest, the landowners lack motivation to plant forests in unmanaged agricultural land. Likewise, the sustainable management of private forests and forest lands will be endangered, if investment will not be attracted for improvement of the economic, ecologic and social values of the forest. In small forest properties (on average 8 ha), it is considerably more difficult to implement sustainable forest management principles. Moreover, new forest owners lack knowledge in forest management and market economics. In the past ten years, 41–75% of the total annual growth is felled. The
R E P O R T O F T H E R E P U B L I C O F L A T V I A O N D E M O N S T R A B L E P R O G R E S S U N D E R T H E K Y O T O P R O T O C O L T O T H E U N I T E D N A T I O N S F R A M E W O R K C O N V E N T I O N O N C L I M A T E C H A N G E
____________________________________________________________________________________________________________________________
48
wood amount felled in private forests, mainly due to the poor economic situation in rural areas, is exceeding the amount of forest restoration several times. In order to preserve the availability of national sustainable resources, the forest regeneration in private forests has to be carried out every year in an area of 18 thousand ha and the cultivation of young forest stands – in an area of 43 thousand ha.
The sustainable management of forest and forest land, increase of forest stand productivity and afforestation of unmanaged agricultural land correspond to the goals defined in Forest Policy, and their implementation would allow to increase the share of forest land up to 48–52% of Latvia’s territory within the next 20–25 years and correspondingly increase CO2 removals. In the future, one of the priorities is the development of public awareness on the issues of sustainable forest management and promotion of the use of national forest and wood production.
Several methods have been used to increase forest stand productivity in forestry practice. Hydrotechnical melioration of wetlands and replacement of low value tree species with more valuable and productive ones has had a considerable impact. The forest regeneration, maintenance, and selection of reproductive material have also contributed. The forestry measures described above, as well as other measures have promoted the increase of average growing stock per hectare more than two times during the past century and this process has the trend to increase due to purposeful forestry management activities.
Due to the successful waste management policy (sorting and recycling of municipal waste, decreasing the share of biologically degradable waste in municipal waste landfills and dumpsites, restoration of waste dumpsites, biogas collection in waste landfills), the share of waste sector in the total GHG emissions will slightly decrease.

R E P O R T O F T H E R E P U B L I C O F L A T V I A O N D E M O N S T R A B L E P R O G R E S S U N D E R T H E K Y O T O P R O T O C O L T O T H E U N I T E D N A T I O N S F R A M E W O R K C O N V E N T I O N O N C L I M A T E C H A N G E
____________________________________________________________________________________________________________________________
49
5. PROGRESS IN MEETING OTHER COMMITMENTS
5.1 Improvements in greenhouse gas inventory Pursuant to the Convention, the Kyoto Protocol and EU requirements defined in normative acts, Latvia submits to the Convention Secretariat and the European Commission annual reports on anthropogenic GHG emissions and removals, and national inventory report, describing the calculation of GHG emissions and CO2 removals, the emission factors, activity data, assumptions and other information used in calculations. Pursuant to the Kyoto Protocol, as well as EU requirements defined in normative acts16, the national system for the preparation of annual inventory of GHG emissions and CO2 removals has been developed in Latvia (Figure 5.1.1). National system for the preparation of annual inventory of GHG emissions and CO2 removals
Figure 5.1.1.
Annual GHG inventory and CO2 removals and national inventory report are prepared by the Latvian Environment, Geology and Meteorology Agency – a subordinate institution to the Ministry of the Environment.
An integral part of the climate change mitigation policies and measures is the assessment of their potential to reduce GHG emissions and to increase CO2 removals. The quality of data projections and assessment of the impact of planned and implemented measures (activities) is the basis not only for Progress report on implementation of the Kyoto Protocol and national communications under the United Nations Framework Convention on Climate Change (UNFCCC), but also for demonstrating compliance with EU legal provisions. In order to ensure Latvia’s compliance with international commitments, the development of a national system for projections of GHG emissions and CO2 removals will be necessary in the future.
5.2 Measures to adapt to climate change In Latvia, the average annual temperature has increased by about 1ºC over the past 100 years. Analyses of long-term precipitation series testify that the total amount of precipitation
16 European Parliament and the Council Decision No. 280/2004/EC of 11 February 2004, concerning a mechanism for monitoring Community greenhouse gas emissions and for implementing the Kyoto Protocol
Ministry of Agriculture
Latvian Environment, Geology and Meteorology Agency
UNFCCC European Commission
Ministry of Transport Central Statistical Bureau
Annual greenhouse gas inventory National inventory report
Ministry of Environment
Sector experts
Surv
eilla
nce
Activity data Q
ualit
y co
ntro
l
LEGMA
R E P O R T O F T H E R E P U B L I C O F L A T V I A O N D E M O N S T R A B L E P R O G R E S S U N D E R T H E K Y O T O P R O T O C O L T O T H E U N I T E D N A T I O N S F R A M E W O R K C O N V E N T I O N O N C L I M A T E C H A N G E
____________________________________________________________________________________________________________________________
50
in Latvia has an increasing trend during the past 50 years. Phenological observations testify that the vegetation period in Latvia has increased on average by 8 days.
In the past 20–30 years, the force of devastating autumn and winter storms in Latvia (as observed also elsewhere in Europe and globally) is increasing and the drifts of wind born water mass in the coastal area are getting higher. At the same time, winters are getting warmer – without coastal ice in the shallow sea zone and freezing of soil. As a result, erosion of the coast increases. As 62% of the 496.5 km long coastal line (corresponding to 27% of the total border length) in Latvia is considered as an area of increased risk from erosion, every year the monitoring of the geological processes on the sea coast is carried out within the scope of the National Environmental Monitoring Program. The low sandy coasts with dunes (the Baltic Sea coast from Pape to Jurmalciems and around the furthest point on the western coast of Latvia) are most vulnerable to erosion.
About 2% of the total coastal line is occupied by coastal areas reinforced with hydro-technical constructions and port territories. Therefore one of the essential measures to minimise the adverse effects on the coastal processes leeward of piers (to decrease erosion of the coast) caused by ports, the external hydro-technical structures and navigation channels is the dumping of the ground regularly removed from port aquatoria and ship waterways in these shallow water zones (5–6 m).
It is worth noting that more than one million inhabitants constituting a little less than half of the total population live in a 5–10 km wide area along the coast of the Baltic Sea and the Gulf of Riga. It is important to protect the pre-dunes from trampling (especially in the summer) and construction. The “Law on Protected Belts” (1997) defines the principles for establishing a protected zone along the coast of the Baltic Sea and the Gulf of Riga – this belt is established to decrease the impact of pollution on the Baltic Sea, preserve forests for their protective function, avert the development of erosion process, protect the coastal landscape, ensure protection, preservation and sustainable long-term use of coastal nature resources and other important public territories, including those needed for leisure activities and tourism.
As the cultivation of forest is one of the most important measures on the global scale, and Latvia has always been rich in forests, the following measures can be considered to be of national importance:
• preservation of biological diversity and quality of forests (by preserving the regulation of climate and water regime and protecting soil from desiccation as well);
• afforestation of non-agricultural lands, thereby increasing CO2 removals;
• maximum rational use of wood and its products;
• improving the knowledge of forests owners, managers and general public on the issues of biological diversity of forests and the significance of forests in ecological improvement.
Latvia typically has a mosaic-type landscape formed as a result of the development of natural factors, land management and the community. The structure of land-use demonstrates that in 2003 45% of the land was covered by forests, 38% – by agricultural lands, 4% – by water, 4% – by marshes, 2% was taken up by roads, 2% – by shrubs and 4% – other.
The rate of afforestation in the future is projected according to the expected state support to afforestation of shrubbery and unmanaged agricultural land, whereby about 1000 ha of the new forest land are expected every year.
Aware of the vulnerability of Latvia to the expected climate change impacts in the Baltic Sea region (change of precipitation, temperature, river run-off and ice regime, vegetation period, increased frequency of severe storms and flooding, change of flora and fauna, etc.), a national adaptation programme will be elaborated.

R E P O R T O F T H E R E P U B L I C O F L A T V I A O N D E M O N S T R A B L E P R O G R E S S U N D E R T H E K Y O T O P R O T O C O L T O T H E U N I T E D N A T I O N S F R A M E W O R K C O N V E N T I O N O N C L I M A T E C H A N G E
____________________________________________________________________________________________________________________________
51
5.3 Technology accessibility and implementation Technology for the use of renewable resources in Latvia theoretically can be divided as follows:
• technologies for which production costs are higher than for those using fossil fuel (small and average boiler houses made in Latvia, not equipped with automatics, small hydropower plants built on already existent dams);
• technologies for which production costs are higher than for those using fossil fuel but which can become competitive if, for example, access to cheap credit resources is provided, tax reductions are applied for investment, energy is produced in regions that are not connected to energy supply infrastructure resulting in high fossil fuel transport costs (large wind turbines, biomass boiler houses equipped with automatics);
• technologies unable to compete with traditional technologies (photovoltaic elements, small wind turbines, small biogas plants, biomass co-generation plants) due to economic aspects.
In Latvia, comparatively few so-called greenfield projects have been implemented (particularly in manufacturing) – these are projects where foreign investors ensure the market penetration of new and modern technologies; even in the sectors where the implementation of such projects would have the greatest potential, it can be observed that only the part, which requires unqualified workers, is carried out. To ensure development of the national economic in the long-term, attracting foreign investment for the development of infrastructure and education has to be continued and other prerequisites have to be created to orient the activities of foreign investors towards investments in scientific research and development of new technologies. In Latvia, the number of local enterprises involved in the production of technologies for the use of renewable energy resources is still insufficient, and the lack of tax allowance system for import/export of technologies hampers the development.
Successful development of science and increasing levels of investment in new technologies will increase the role of applied technology sectors in the development of economy. Latvia has good perspectives to develop the high technology sectors in which there is already a good expertise basis and potential, for example, information technologies, new service sectors (logistics, commercial services and financial services), specific chemistry, pharmaceutical and material technology sub-sectors etc.
In order to increase the competitiveness of graduates in the labour market, it is planned to develop a set of normative measures within the framework of the “National Lisbon Program for Latvia for 2005 – 2008”, including purchasing of up-to-date technologies for research and training of students, in addition to the existing education model.
To promote the accessibility and use of best technologies in environmental protection, “Environmental Technology Action Programme” is currently under consideration.
5.4 Co-operation in scientific research The first systematic meteorological observations in the territory of Latvia started at the end of the 18th century (in 1795 in Riga), and permanent meteorological observation network was already established by the end of the 19th century. Data of these observations present valuable material for research on climate change in the territory of Latvia. Nowadays, meteorological observations of LEGMA are carried out in 63 observation stations, spread over the entire territory of Latvia. A complete set of meteorological observations is carried out in 22 of the stations operating in Latvia.

R E P O R T O F T H E R E P U B L I C O F L A T V I A O N D E M O N S T R A B L E P R O G R E S S U N D E R T H E K Y O T O P R O T O C O L T O T H E U N I T E D N A T I O N S F R A M E W O R K C O N V E N T I O N O N C L I M A T E C H A N G E
____________________________________________________________________________________________________________________________
52
In the near future, the monitoring of atmospheric conditions will be significantly improved. Doppler’s meteorological radar was installed and will start operation in 2005, providing precise and regularly updated information on physical characteristics and processes in the atmosphere also in the higher atmospheric layers. Since 1 January 2005 Latvia is an associate country of the European Meteorological Satellite Organization (EUMETSAT) which will promote the use of satellite technologies for atmospheric monitoring above the territory of Latvia.
In Latvia government funding is available for scientific research on the use of environmentally friendly, GHG emissions reducing and innovative technologies. The “National Innovation Programme for 2003 – 2006”, aimed to facilitate an increase in the national innovation capacity, and the “National Lisbon Programme of Latvia for 2005 – 2008”, stating that one of the priority tasks in scientific activities is the development of applied research of innovative technologies, were adopted in 2003. Latvian scientists and scientific institutes maintain and develop co-operation with foreign scientific research institutes within different co-operation programmes.
Research on technologies for the use of various alternative energy sources (biomass, solar, wind) and tentative technological solutions to increase energy performance, are carried out by several scientific research institutes and higher education establishments in Latvia: Institute of Physical Energetics of the Latvian Academy of Sciences, Institute of Solid-state Physics and Institute of Microbiology and Biotechnology of the University of Latvia, Riga Technical University, Latvia University of Agriculture. Every year Latvian Council of Science allocates funding for fundamental and applied research projects, thereby increasing support to scientific research on climate change impacts and adaptation.
5.5 Capacity building To ensure effective implementation of the climate change related legislation, linking it to facilitating the use of new and innovative technologies in the energy sector and increasing the share of renewable energy sources, the Climate and Renewable Energy Department has been operational in the Ministry of Environment since 2004. Besides, substantial reorganisation has been carried out in the institutions operating under the supervision of the Ministry of Environment.
The climate change mitigation policy covers all sectors of the national economy, therefore policies and measures to reduce GHG emissions and increase CO2 removals, besides the Ministry of Environment have also been implemented by the following ministries and institutions: Ministry of Foreign Affairs, Ministry of Economics, Ministry of Agriculture, Ministry of Transport, Ministry of Education and Science, Ministry of Finance, Ministry of Regional Development and Local Government and State Agency “Housing Agency”.
The involvement of local municipalities, scientific institutions, universities and the community is also invaluable in the climate change mitigation process.
The project “Latvian National Capacity Self Assessment in the areas of biological diversity, climate change and soil degradation” was implemented in co-operation with the Global Environment Facility in order to describe and analyse the present capacity of Latvia in the climate change area, analysing the positive experience and identifying institutional, social, administrative, organisational, legal, informative and technical barriers and identifying possible improvements and streamlining opportunities. It was based on studies of available literature, interviews and surveys.
Annual inventory on anthropogenic greenhouse gas emissions and removals is prepared by the Latvian Environment, geology and meteorology agency under the surveillance of the Ministry of Environment. Currently, GHG inventory is prepared in co-operation with the Central Statistical Bureau, Ministry of Economics, Ministry of Transport, Ministry of Agriculture, State Forest Service, State Land Service, Latvian Investment and Development Agency, private
R E P O R T O F T H E R E P U B L I C O F L A T V I A O N D E M O N S T R A B L E P R O G R E S S U N D E R T H E K Y O T O P R O T O C O L T O T H E U N I T E D N A T I O N S F R A M E W O R K C O N V E N T I O N O N C L I M A T E C H A N G E
____________________________________________________________________________________________________________________________
53
institutions and sector experts. Prior to the establishment in 2005 of the national system for assessment of GHG emissions and CO2 removals, the information necessary for inventory was requested on an annual basis.
Specially invited sector experts provide the quality control for the calculations of GHG emissions and CO2 removals as well as the national inventory report. The Ministry of Environment oversees the inventory and review preparation process. After the quality control, the results of GHG emissions and CO2 removals calculations and national inventory report are sent to the UNFCCC Secretariat and the European Commission.
R E P O R T O F T H E R E P U B L I C O F L A T V I A O N D E M O N S T R A B L E P R O G R E S S U N D E R T H E K Y O T O P R O T O C O L T O T H E U N I T E D N A T I O N S F R A M E W O R K C O N V E N T I O N O N C L I M A T E C H A N G E
____________________________________________________________________________________________________________________________
54
LIST OF REFERENCES
1. Āboliņa L. Priekšlikumi mežsaimniecības sektora rādītāju prognozēm 2005., 2010., 2015. un 2020. gadam scenārijam ar pasākumiem un scenārijam ar papildus pasākumiem. Rīga, 2004.
2. Bāra J. „Meža bioloģiskās daudzveidības sadaļas eksperta atskaite” – „Latvijas meža un saistīto nozaru nacionālā programmas” ietvaros realizētā projekta „Meža nozares stratēģisko mērķu formulēšana un cilvēkresursu attīstība stratēģiskajā plānošanā” 1. fāzes stāvokļa apraksts. Rīga, 2003.
3. Cakars I. Sadzīves atkritumu un emisiju, no to apglabāšanas. prognozes līdz 2020. gadam. Rīga, 2004.
4. Dubrovskis D. „Meža resursu stāvoklis un to apsaimniekošanas ietekmējošie faktori” – “Latvijas meža un saistīto nozaru nacionālā programmas” ietvaros realizētā projekta „Meža nozares stratēģisko mērķu formulēšana un cilvēkresursu attīstība stratēģiskajā plānošanā” 1. fāzes stāvokļa apraksts. Rīga, 2003.
5. Eberhards G. Jūra uzbrūk! Ko darīt? Latvijas Universitāte. Rīga, 2004. 6. Economic Development of Latvia. Ministry of Economics of the Republic of Latvia.
Riga, June 2005. 7. Enerģijas sektora ietekme uz ekonomikas attīstību un dzīves kvalitāti. Latvijas investīciju
un attīstības aģentūra. Rīga, 2005. 8. Finanšu resursi, finanšu ieguldījumi un aktivitātes tehnoloģiju nodošanā Klimata
pārmaiņas samazināšanas jomā Latvijā laika posmā no 2001. – 2005. gadam. SIA „Ekodoma”. Rīga, 2005.
9. Globālā klimata mainība un rīcības tās ietekmes samazināšanai Latvijā. Latvijas Universitātes Bioloģijas institūts. Salaspils, 2005.
10. Grīnfelds T. Prognozes par atsevišķu rūpniecības produkcijas veidu ražošanas apjomiem līdz 2020. gadam. Rīga, 2004.
11. Hirsh, R.M., Slack. A nonparametric trend test for seasonal data with serial dependence. Water Resour. Res., 1084, 20 (6), 727-732.
12. Izglītība, apmācība un sabiedrības vides apziņas veidošana klimata pārmaiņu samazināšanas jomā Latvijā laika posmā no 2001. – 2005. gadam. SIA „Ekodoma”. Rīga, 2005.
13. Key Figures 2003 – 2004. Towards a European Research Area Science, Technology and Innovation. European Commission Directorate-General for Research. 2003.
14. Klimata pārmaiņu samazināšanas programma 2005. – 2010. gadam. Rīga, 2005. 15. Kļaviņš M. Vides izglītības sistēmas kapacitātes analīze. LU Ģeogrāfijas fakultāte.
Rīga, 2004. 16. Koncepcija par lauksaimniecības tiešajiem atbalsta maksājumiem 2005. gadā.
Rīga, 2004. 17. Latvia’s National Inventory Report for 1990 – 2003, submitted under the United Nations
Convention on Climate Change. Riga, 2005. 18. Latvijas dzīvojamais fonds, 2003. LR Centrālā statistikas pārvalde. Rīga, 2004. 19. Latvijas ilgtspējīgas attīstības indikatoru pārskats 2004. Latvijas Vides aģentūra.
Rīga, 2004. 20. Latvijas nacionālā Lisabonas programma 2005. – 2008. gadam. Rīga, 2005. 21. Latvijas statistikas gadagrāmata 1995. LR Centrālā statistikas pārvalde. Rīga, 1995. 22. Latvijas statistikas gadagrāmata 2004. LR Centrālā statistikas pārvalde. Rīga, 2004. 23. Latvijas vides indikatoru pārskats 2001. Latvijas Vides aģentūra. Rīga, 2001.
R E P O R T O F T H E R E P U B L I C O F L A T V I A O N D E M O N S T R A B L E P R O G R E S S U N D E R T H E K Y O T O P R O T O C O L T O T H E U N I T E D N A T I O N S F R A M E W O R K C O N V E N T I O N O N C L I M A T E C H A N G E
____________________________________________________________________________________________________________________________
55
25. Nacionālā programma “Biodegvielas ražošana un pielietošana Latvijā 2003. – 2010. gadā”. Rīga, 2003.
26. National Communication of the Republic of Latvia under United Nations Framework Convention on Climate Change. Ministry of Environmental Protection and Regional Development of the Republic of Latvia. Riga, 2001.
27. Pamatnostādnes par lauksaimniecības attīstību Latvijas laukos 2003. – 2006. gadam. Rīga, 2004.
28. Pārskats par nevalstisko organizāciju sektoru Latvijā 2004. gads. Rīga, 2005. 29. Piņķe G. Makroekonomikas eksperta atskaite. Rīga, 2004. 30. Reķis J. Apvienotā atskaite par energoresursu patēriņu enerģētikā, ieskaitot transportu.
Rīga, 2004. 31. Renewable energy sources in Estonia, Latvia and Lithuania: strategy and policy
targets, current experiences and future perspectives. Baltic Environmental Forum. Riga, 2003.
32. Resursu patēriņa novērtējums. Latvijas vides aģentūra. Rīga, 2004. 33. Rīcības programma īpaši jutīgām teritorijām, uz kurām attiecas paaugstinātas prasības
ūdens un augsnes aizsardzībai no lauksaimnieciskās darbības izraisītā piesārņojuma ar nitrātiem. Rīga, 2004.
34. Second National Communication of the Republic of Latvia under United Nations Framework Convention on Climate Change. Ministry of Environmental Protection and Regional Development of the Republic of Latvia. Riga, 1998.
35. Sinkevičs G. Atskaite par darba uzdevuma lauksaimniecības sektora prognozēm 2005., 2010., 2015. un 2020. gadiem izpildi. Rīga, 2004.
36. Šmaliņš E. Siltumnīcefekta gāzu emisiju prognoze no ceļu transporta sektora 2010., 2015. un 2020. gadiem. Darba ziņojums. Rīga, 2004.
37. Third National Communication of the Republic of Latvia under United Nations Framework Convention on Climate Change. Ministry of Environmental Protection and Regional Development of the Republic of Latvia. Riga, 2001.
38. Transporta attīstības nacionālā programma (1996 – 2010). Rīga, 1995. 39. Vides aizsardzības infrastruktūras projektu katalogs 2004. LR Vides ministrija. Rīga, 2004. 40. Ziņojums par progresu Tautsaimniecības vienotās stratēģijas īstenošanā. LR Ekonomikas
ministrija. Rīga, 2005.
Internet addresses:
Ministry of Environment of the Republic of Latvia: http://www.vidm.gov.lv Ministry of Ecomonics of the Republic of Latvia: http://www.em.gov.lv Ministry of Finance of the Republic of Latvia: http://www.fm.gov.lv Central Road Safety Department: http://www.csdd.lv Latvian Environment, Geology and Meteorology Agency: http://www.lvgma.gov.lv