climate change mitigation technologies in europe...
TRANSCRIPT
United Nations Environment Programme
Climate change mitigation technologies in Europe – evidence from patent and economic data
Climate change mitigation technologies in Europe – evidence from patent and economic data
Cover
Solar, wind and biomass energy sources, Germany
The full report can be downloaded from:www.epo.org/climate-europe
This study has been conducted in co-operation with the Grantham Research Institute on Climate Change and the Environment at the London School of Economics and Political Science (http://www.lse.ac.uk/GranthamInstitute)
4 5
TABLE OF CONTENTS FOREWORD 08
EXECUTIVE SUMMARY 09
1INTRODUCTION 12
2THE EUROPEAN PATENT SYSTEM 16
2.1 Patent protection in Europe 18
2.2 Transparency and patent information 20
3DATA SOURCES AND METHODOLOGY 22
4EUROPE AS A GLOBAL CENTRE OF CCMT INVENTIVE ACTIVITY 30
4.1 Global trends 32
4.2 European inventive activities 32
4.2.1 Trends in European CCMT inventions 32
4.2.2 Europe compared to other major innovation centres 34
4.2.3 Inventive activity by technology 36
4.2.4 Specialisation in CCMTs 38
4.2.5 International cooperation in R&D 38
4.2.6 Top applicants for CCMT inventions 41
4.3 Inventive activity in individual European countries 42
4.3.1 Country comparison 42
4.3.2 Specialisation in CCMT inventions 45
4.3.3 Intra-European cooperation in R&D 47
5MARKETS FOR CLIMATE CHANGE MITIGATION TECHNOLOGIES 48
5.1 Evidence from patent data 50
5.1.1 Europe’s position as a market for CCMT inventions 50
5.1.2 Key European markets for CCMT inventions 51
5.1.3 Origin of CCMT patent applications filed in Europe 52
5.1.4 Markets for European CCMT inventions 52
5.2 Evidence from economic data 54
5.2.1 Worldwide trade and FDI in CCMTs 54
5.2.2 Europe’s partners in trade and FDI 57
5.2.3 Intra-European trade and FDI 59
5.3 Relationship between patenting activities, trade and FDI 62
6CLIMATE CHANGE POLICY IN THE EUROPEAN UNION 64
6.1 Literature review of the impact of climate change policies 66
6.2 Policy measures in the European Union and other key regions 67
6.3 Public R&D investment in CCMTs 70
7EUROPE’S CLEAN ENERGY POTENTIAL AND EXPLOITATION 74
7.1 An overview of Europe’s clean energy landscape 76
7.1.1 Biomass 76
7.1.2 Hydropower 79
7.1.3 Solar 80
7.1.4 Geothermal 84
7.1.5 Wind energy 85
7.2 Sub-regional distribution of clean energy resources 85
7.2.1 Northern Europe 85
7.2.2 Eastern Europe 86
7.2.3 Western Europe 86
7.2.4 Southern Europe 87
8KEY FINDINGS AND CONCLUSIONS 88
8.1 Key findings 90
8.2 Conclusions 92
ANNEXES 94
ABBREVIATIONS AND ACRONYMS 122
BIBLIOGRAPHY 123
DISCLAIMER 125
IMPRINT 126
6 7
LIST OF TABLES AND FIGURES
Figure 32 Balance of trade in CCMT goods by region 1995-2013 55
Figure 33 Average tariffs on European imports and exports of CCMT goods 1995-2013 56
Figure 34 Main destination countries of European exports of CCMT goods 1995-2013 57
Figure 35 Main sources of European imports of CCMT goods 1995-2013 57
Figure 36 FDI in CCMTs between Europe and rest of the world in 2012 58
Figure 37 Main European exporters of CCMT goods to other European countries 1995-2013 59
Figure 38 Main European importers of CCMT goods from other European countries 1995-2013 60
Figure 39 Balance of trade in CCMT goods between European countries 1995-2013 60
Figure 40 FDI in CCMTs between European countries in 2012 61
Figure 41 Relationship between patent filings and imports of CCMT goods 62
Figure 42 Relationship between patent filings and FDI in CCMTs 63
Figure 43 Post-Kyoto growth in worldwide CCMT inventions 1980-2011 (normalised to 1997 = 100) 67
Figure 44 Stringency of climate policy in the EU, Japan, Korea and the US 1995-2012 69
Figure 45 CO2 intensity of GDP in major innovation centres 1995-2012 69
Figure 46 CCMT inventions in Europe and CO2 intensity of GDP in the EU 1995-2010 70
Figure 47 CCMT inventions in Europe and stringency of climate policy in the EU 1995-2011 71
Figure 48 European public R&D spending on CCMTs 1980-2011 71
Figure 49 Public R&D spending on CCMTs in Europe, Japan, Korea and the US 1995-2011 72
Figure 50 European public R&D spending on CCMTs by technology 1995-2011 72
Figure 51 European public R&D spending on CCMTs by country 1995-2011 73
Figure 52 European CCMT inventions from public institutions by country 1995-2011 73
Figure 53 Total installed hydropower capacity for different HP plant sizes 80
Figure 54 Global horizontal irradiation in Europe 80
Figure 55 Evolution of global solar PV annual installed capacity 2000-2014 81
Figure 56 Main basins and geothermal resources of Europe 84
Table 1 Patent classification codes used in the study 25
Table 2 Description and harmonised system (HS) codes of low carbon goods considered in the study 28
Table 3 Top 5 European applicants in CCMT patenting 41
Table 4 Top 5 worldwide applicants in CCMT patenting 41
Table 5 Number of subsidiaries of CCMT companies by region in 2012 56
Table 6 Regional hydropower technical potential in 2009 79
Figure 1 “High-value” CCMT inventions in the major innovation centres 1995-2011 9
Figure 2 European share of global CCMT inventions 1995-2011 10
Figure 3 CCMT inventions and CO2 intensity of GDP in Europe 1995-2010 10
Figure 4 Worldwide trends in CCMT inventions 1995-2011 32
Figure 5 CCMT inventions worldwide by technology 1995-2011 33
Figure 6 CCMT inventions from European inventors 1995-2011 33
Figure 7 CCMT inventions in the major innovation centres 1995-2011 34
Figure 8 High-value CCMT inventions in the major innovation centres 1995-2011 34
Figure 9 Share of major innovation centres in worldwide CCMT inventions 1995-2011 35
Figure 10 Share of major innovation centres in worldwide high-value CCMT inventions 1995-2011 35
Figure 11 European CCMT inventions by technology 1995-2011 36
Figure 12 European inventions in clean energy technology (Y02E) 1995-2011 36
Figure 13 European inventions in CCMTs related to transportation (Y02T) 1995-2011 37
Figure 14 European share of global CCMT inventions 1995-2011 39
Figure 15 Relative technological advantage (RTA) of major innovation centres in CCMTs 1995-2011 39
Figure 16 CCMT inventions co-developed by European inven tors and inventors from other countries 1995-2011 40
Figure 17 European CCMT inventions by country 1995-2011 42
Figure 18 European inventions in renewable energy (Y02E10) by country 1995-2011 43
Figure 19 European inventions in road transportation (Y02T10) by country 1995-2011 43
Figure 20 European CCMT inventions per GDP by country 1995-2011 44
Figure 21 Relative technological advantage (RTA) in CCMTs by European country 1995-2011 45
Figure 22 CCMT inventions co-developed by European countries 1995-2011 46
Figure 23 Patent filings in CCMTs by region 1995-2011 50
Figure 24 Patent filings in photovoltaic energy (Y02E10/50) by region 1995-2011 50
Figure 25 Patent filings in wind energy (Y02E10/70) by region 1995-2011 51
Figure 26 Market coverage for granted CCMT patents in Europe 1995-2011 51
Figure 27 Origin of CCMT patent filings in Europe 1995-2011 52
Figure 28 Patent family size distribution of European CCMT inventions 1995-2011 53
Figure 29 Main patent filing destinations of European CCMT inventions 1995-2011 53
Figure 30 Main exporters of CCMT goods by region 1995-2013 54
Figure 31 Main importers of CCMT goods by region 1995-2013 55
8 9
FOREWORD “We must act now to slow the alarming pace of climate change and environmental degradation, which pose unprecedented threats to humanity” (United Nations Post-2015 Development Agenda).
Climate change is one of today's truly global challenges, affecting all aspects of socio-economic development in every region of the world. Limiting the emissions of greenhouse gases (GHG) while achieving the other 16 goals of the UN Post-2015 Development Agenda, which include eradicating hunger and poverty, and ensuring access to modern energy for all, is all the more challenging. The problem is further exacerbated by a constantly increasing world population, expected to reach 9 billion people by 2050, with an ever-larger emerging middle class, whose standards of living involve higher energy consumption.
The 21st Conference of Parties of the United Nations Framework Convention on Climate Change (UNFCCC) repre-sents a milestone in over 20 years of negotiations. The Parties aim to conclude an international legally binding agreement to replace the Kyoto Protocol of 1997, designed to limit GHG emissions in all signatory states.
Technology and innovation have a key role to play in meeting these requirements, as shown by the decision taken in Cancún in 2010 to establish the “Technology Mechanism” in support of innovation and global technology dissemination.
As an innovation support system for technology, the patent system contributes to this scenario. It is designed to promote innovation and the diffusion of new technology. Moreover, it is an extremely powerful tool for measuring innovation and disseminating information, ultimately con-tributing to a more transparent and balanced knowledge economy.
The European Patent Office (EPO) joined forces with the United Nations Environment Programme (UNEP) and the Inter national Centre for Trade and Sustainable Develop-ment (ICTSD) in 2009 to investigate the role of the patent system in climate change-related technologies and provide evidence to support an informed debate. A first study, on “Patents and clean energy technologies” (CETs), was pub-lished in 2010. This was followed by two EPO-UNEP studies with a regional focus on Africa and Latin America, in 2013 and 2014 respectively.
These studies were made possible through the development of the Y02/Y04S, a dedicated tagging scheme and searchable database for CETs. This has since been expanded to cover all significant climate change mitigation technologies (CCMTs) in energy, carbon capture, transport, buildings, waste, energy-intensive industries and smart grids. The scheme has also supported numerous climate-related research projects in academia and has facilitated public access to information on climate change-related technolo-gies through its user-friendly structure. Over 2.8 million patent documents and their technical disclosures are now readily available, worldwide and free of charge, via the internet, providing the world’s most comprehensive documentation of technological solutions relevant to climate change.
This most recent EPO-UNEP study focuses on Europe, link-ing patent trends with relevant economic data on invest-ments, trade and technology transfer in CCMTs. The report provides a clear and comprehensive picture of the contri-bution of Europe to CCMT development and dissemination. It is hoped that this wealth of data, some of which is published here for the first time, can provide useful input for a constructive policy debate on technology.
Summary
EXECUTIVE SUMMARY
In October 2014, the European Union committed to reduce greenhouse gas emissions by at least 40% by 2030 compared to 1990 levels. This represents a significant challenge, which can only be met through the development and deploy-ment of new climate change mitigation technologies (CCMTs).
The present study analyses the position of Europe in the global race to develop new CCMTs, using data on patent applications, trade in CCMT capital goods, foreign direct investment in CCMTs, climate change policy stringency, carbon emissions and public expenditure on CCMT research and development activities, to investigate inventive and associated economic activity in CCMTs in Europe.
The main source of data was the Worldwide Patent Statisti-cal Database (PATSTAT), developed by the European Patent Office (EPO). This publicly available database is the world’s largest repository of patent information, containing data on over 82 million patent applications. The EPO has developed a dedicated classification scheme for CCMTs (using the Y02 and Y04S tags) that makes it possible to analyse CCMT-related trends in inventive activity and in the global tech-nology market, and to provide evidence to support public and private decision-making.
At the global level, the last decades have seen a continuous expansion of inventive activity in climate change mitiga-tion technologies. The growth in CCMT inventions has been much faster than in other technologies, and CCMTs today
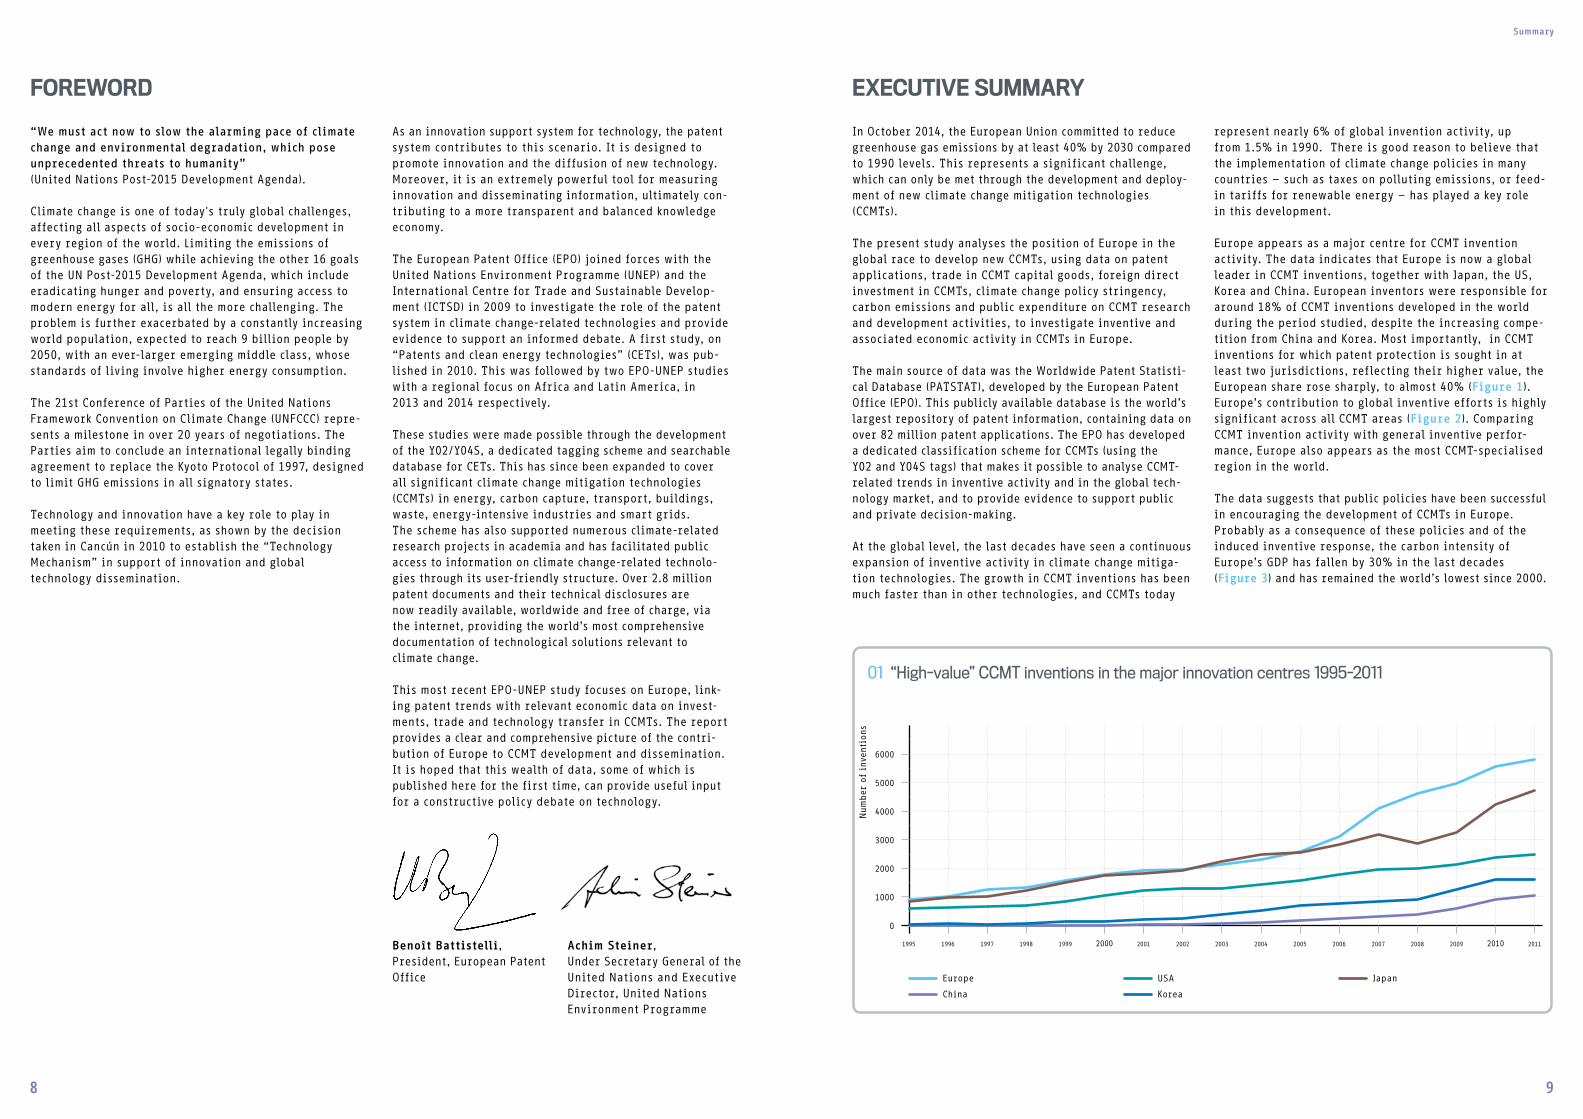
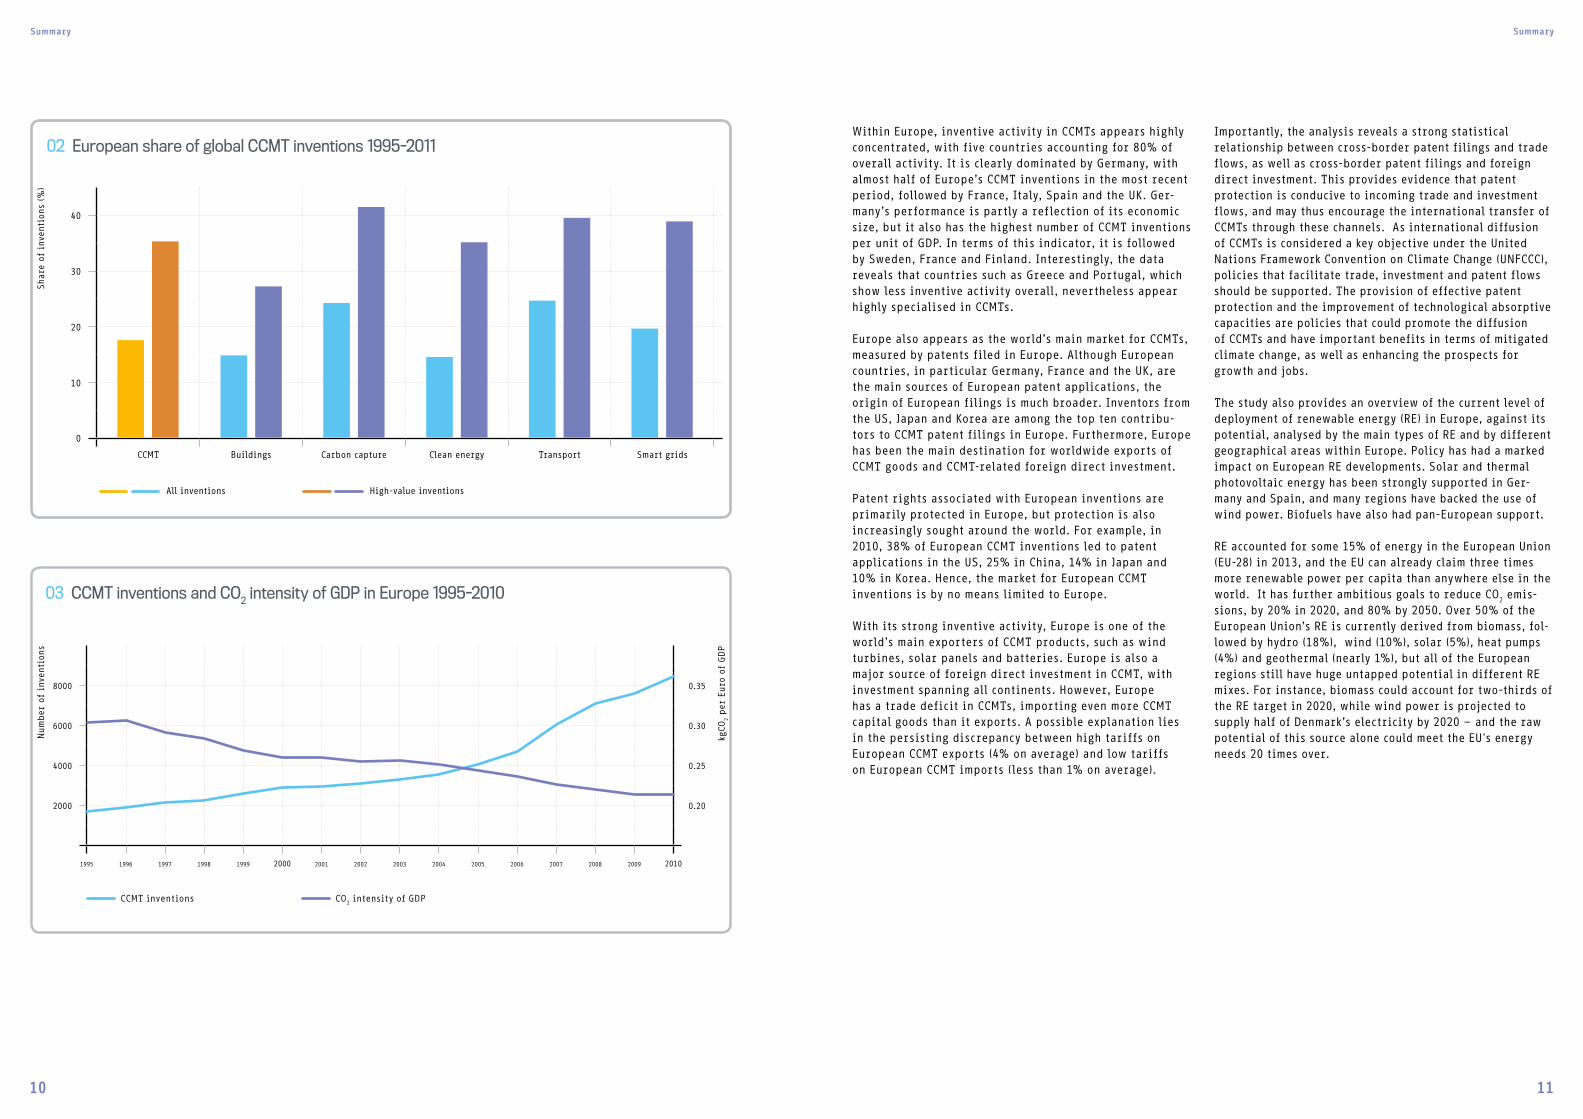
represent nearly 6% of global invention activity, up from 1.5% in 1990. There is good reason to believe that the implementation of climate change policies in many countries – such as taxes on polluting emissions, or feed-in tariffs for renewable energy – has played a key role in this development. Europe appears as a major centre for CCMT invention activity. The data indicates that Europe is now a global leader in CCMT inventions, together with Japan, the US, Korea and China. European inventors were responsible for around 18% of CCMT inventions developed in the world during the period studied, despite the increasing compe-tition from China and Korea. Most importantly, in CCMT inventions for which patent protection is sought in at least two jurisdictions, reflecting their higher value, the European share rose sharply, to almost 40% (Figure 1). Europe’s contribution to global inventive efforts is highly significant across all CCMT areas (Figure 2). Comparing CCMT invention activity with general inventive perfor-mance, Europe also appears as the most CCMT-specialised region in the world.
The data suggests that public policies have been successful in encouraging the development of CCMTs in Europe. Probably as a consequence of these policies and of the induced inventive response, the carbon intensity of Europe’s GDP has fallen by 30% in the last decades (Figure 3) and has remained the world’s lowest since 2000.
Benoît Battistelli, President, European Patent Office
Achim Steiner, Under Secretary General of the United Nations and Executive Director, United Nations Environment Programme
01 “High-value” CCMT inventions in the major innovation centres 1995-2011
6000
5000
4000
3000
2000
1000
0
Num
ber
of
inve
ntio
ns
1995 1996 1997 1998 1999 2000 2001 2002 2003 2004 2005 2006 2007 2008 2009 2010 2011
Europe
China
USA
Korea
Japan
10 11
Importantly, the analysis reveals a strong statistical relationship between cross-border patent filings and trade flows, as well as cross-border patent filings and foreign direct investment. This provides evidence that patent protection is conducive to incoming trade and investment flows, and may thus encourage the international transfer of CCMTs through these channels. As international diffusion of CCMTs is considered a key objective under the United Nations Framework Convention on Climate Change (UNFCCC), policies that facilitate trade, investment and patent flows should be supported. The provision of effective patent protection and the improvement of technological absorptive capacities are policies that could promote the diffusion of CCMTs and have important benefits in terms of mitigated climate change, as well as enhancing the prospects for growth and jobs.
The study also provides an overview of the current level of deployment of renewable energy (RE) in Europe, against its potential, analysed by the main types of RE and by different geographical areas within Europe. Policy has had a marked impact on European RE developments. Solar and thermal photovoltaic energy has been strongly supported in Ger-many and Spain, and many regions have backed the use of wind power. Biofuels have also had pan-European support.
RE accounted for some 15% of energy in the European Union (EU-28) in 2013, and the EU can already claim three times more renewable power per capita than anywhere else in the world. It has further ambitious goals to reduce CO
2 emis-sions, by 20% in 2020, and 80% by 2050. Over 50% of the European Union’s RE is currently derived from biomass, fol-lowed by hydro (18%), wind (10%), solar (5%), heat pumps (4%) and geothermal (nearly 1%), but all of the European regions still have huge untapped potential in different RE mixes. For instance, biomass could account for two-thirds of the RE target in 2020, while wind power is projected to supply half of Denmark’s electricity by 2020 – and the raw potential of this source alone could meet the EU's energy needs 20 times over.
Within Europe, inventive activity in CCMTs appears highly concentrated, with five countries accounting for 80% of overall activity. It is clearly dominated by Germany, with almost half of Europe’s CCMT inventions in the most recent period, followed by France, Italy, Spain and the UK. Ger-many’s performance is partly a reflection of its economic size, but it also has the highest number of CCMT inventions per unit of GDP. In terms of this indicator, it is followed by Sweden, France and Finland. Interestingly, the data reveals that countries such as Greece and Portugal, which show less inventive activity overall, nevertheless appear highly specialised in CCMTs.
Europe also appears as the world’s main market for CCMTs, measured by patents filed in Europe. Although European countries, in particular Germany, France and the UK, are the main sources of European patent applications, the origin of European filings is much broader. Inventors from the US, Japan and Korea are among the top ten contribu-tors to CCMT patent filings in Europe. Furthermore, Europe has been the main destination for worldwide exports of CCMT goods and CCMT-related foreign direct investment.
Patent rights associated with European inventions are primarily protected in Europe, but protection is also increasingly sought around the world. For example, in 2010, 38% of European CCMT inventions led to patent applications in the US, 25% in China, 14% in Japan and 10% in Korea. Hence, the market for European CCMT inventions is by no means limited to Europe.
With its strong inventive activity, Europe is one of the world’s main exporters of CCMT products, such as wind turbines, solar panels and batteries. Europe is also a major source of foreign direct investment in CCMT, with investment spanning all continents. However, Europe has a trade deficit in CCMTs, importing even more CCMT capital goods than it exports. A possible explanation lies in the persisting discrepancy between high tariffs on European CCMT exports (4% on average) and low tariffs on European CCMT imports (less than 1% on average).
SummarySummary
40
30
20
10
0
CCMT Buildings Carbon capture Clean energy Transport Smart grids
02 European share of global CCMT inventions 1995-2011
All inventions High-value inventions
Shar
e of
inv
enti
ons
(%)
03 CCMT inventions and CO2 intensity of GDP in Europe 1995-2010
Num
ber
of
inve
ntio
ns
1995 1996 1997 1998 1999 2000 2001 2002 2003 2004 2005 2006 2007 2008 2009 2010
CCMT inventions CO2 intensity of GDP
8000 0.35
6000 0.30
4000 0.25
2000 0.20
kgCO
2 per
Eur
o of
GDP

Hydroelectric power station, Wales, UK
Introduction Introduction
12 13
1INTRODUCTION
Introduction
14 15
Introduction
Context and background
In December 2015, government leaders from around the globe gathered in Paris for the 21st session of the Confer-ence of the Parties (COP 21) to the 1992 United Nations Framework Convention on Climate Change (UNFCCC), with the objective of concluding a legally binding international agreement aimed at limiting the average global tempera-ture increase to 2°C above pre-industrial levels. The reductions in greenhouse gas (GHG) emissions entailed by this goal pose a significant challenge. Achieving this tar-get while meeting growing global energy demands will require major changes in the technology used around the world. Technological developments are needed not only in energy generation and storage, but also in how energy, including in transport, buildings, industry and waste treatment, is used.
If the economic impact of this change is to remain accept-able, the cost of low-carbon technologies will have to be brought down, by breakthroughs emerging from research and innovation activities. This in turn depends on the allocation of resources. According to the last IPCC report, future investments in research, development and deploy-ment (RD&D) will be the determining factor for the cost of emission reduction policies (IPCC, 2014). Importantly, the diversity of energy uses, systems, resources and national contexts means that addressing climate change and other environmental issues will require innovation across the whole range of existing and potential clean technologies, as well as the development of solutions adapted to local situations. Innovation could reduce the cost of existing climate change mitigation technologies, such as wind tur-bines and electric cars, and enable them to be deployed on a large scale, while investment in fundamental research will help to advance the frontiers of technologies such as smart grids, energy storage, and carbon capture.
Massive reductions in global carbon emissions represent not only a challenge but also an immense opportunity for current and future owners of low-carbon technologies, which offer real potential for growth and employment. European companies are well positioned in this respect. The European Union (EU) has long been at the forefront of global action to reduce carbon emissions. For example, in October 2014, EU leaders adopted a commitment to reduce domestic GHG emissions by 40% in 2030 relative to 1990. In 2012, GHG emissions were already 19% lower than in 1990 (at 4.5 Gt CO
2eq) and the new target set in 2014 represents a significant further commitment.
Scope and objectives of this study
Given this background, the objective of this study is to analyse
– Europe’s position in the global development of new climate change mitigation technologies (CCMTs)
– Europe’s role in the dissemination of CCMTs, measured by patent and economic data, and
– the importance of European climate change policies in explaining Europe’s contribution to the global innovation and diffusion of CCMTs.
Development activity in this field is measured using patent data as a proxy for inventions in CCMTs. The EPO has developed a dedicated classification scheme (referred to as the Y02/Y04S tagging scheme1) to identify inventions related to climate change mitigation technologies. This makes it possible to analyse CCMT-related activity in Europe and compare it with developments in other key innovation regions in the world. Europe’s inventive performance is looked at from several angles, analysing trends in different climate change mitigation technologies, comparing the levels of specialisation in CCMT across countries and high-lighting to the importance of international collaboration between inventors.
Global dissemination of CCMTs from and to Europe is analysed using data on patent filings worldwide as well as on trade activities and foreign direct investment (FDI). The destination of patent filings is used to identify target markets for CCMT inventions. This makes it possible to identify the regions in which European inventions are pro-tected and to examine the origins of inventions that target Europe as a market. Since dissemination of CCMTs also occurs through trade and FDI, the flows in patent filings are complemen ted with statistics on the main importing and exporting countries of CCMT goods and on foreign investment by companies active in CCMT R&D. To investigate the role of patent protection in international diffusion of CCMTs, the relationship between cross-border patent filing trends and trade and foreign investment stocks is also analysed.
Finally, European policy relevant to the innovation and dissemination of CCMTs is reviewed. In addition, an analysis of the relationship between the trends in climate change policy stringency, carbon emissions, public ex pen-diture on CCMT research and development and Europe’s inventive activity is performed. This is complemented by a mapping of the EU’s renewable energy deployment and potential.
To the best of the authors’ knowledge, this is the first time that such a comprehensive dataset has been put together to investigate inventive and associated economic activity relating to climate change mitigation in Europe.
The study serves to inform policymakers, at the UNFCCC and in other international fora such as the World Trade Organization (WTO) and the associated TRIPS Council, and to provide evidence for the European representatives involved in these policy deliberations. It demonstrates how the EPO’s publicly available Worldwide Patent Statis-tical Database (PATSTAT) can be used to analyse technology trends, in this case pertaining to CCMTs in Europe, with data from over 82 million patent applications from nearly 100 patent filing authorities. Policymakers and business strategists interested in particular geographical areas and specific technologies can conduct similar analyses to provide evidence as a basis for future policy and strategic business decisions.
Previous studies
The first study looking at a wide array of CCMTs on a global scale based on patent data was the initial joint EPO-UNEP-ICTSD2 report on “Patents and clean energy technologies: bridging the gap between energy and policy”, published in 2010 and using the EPO’s PATSTAT services and its Y02/Y04S tagging scheme for CCMTs. The report found that the major-ity of CCMT patent filings in the period 1980-2009 origi-nated from six OECD countries: the US, Japan, Korea, France, Germany and the UK. This was closely followed by a paper by Dechezleprêtre et al. (2011), which also used PATSTAT to examine the dynamics, distribution, and international transfer of patented inventions in 13 climate change miti-gation technologies between 1978 and 2005. The authors also found that innovation in climate change technologies was highly concentrated in Japan, Germany, and the US (together accounting for 60% of total CCMT innovations globally), but that the innovation performance of certain emerging economies, particularly China and Russia, as well as Korea, was far from negligible. Their data suggested that, up to 1990, innovation had mostly been driven by energy prices. After 1990, environmental policies and cli-mate policies appeared to have induced more innovation, with the pace accelerating after the signing of the Kyoto Protocol in 1997.
With regard to technology transfer, Dechezleprêtre et al. found that, historically, international transfers of CCMTs had occurred mostly between developed countries. However, there appeared to be tremendous potential for transfers between developed and developing countries, as well as for exchanges among developing countries only, particularly since these countries may have developed inventions that are better tailored to their specific needs. This was con-firmed by a follow-up study by Glachant et al. (2013) and by another major review carried out by Hašci c et al. (2012). Several further studies have been conducted that describe innovation activity and/or international technology diffusion in CCMTs, but with a more restricted focus. For example, Johnstone et al. (2010) focus on renewable energy patents in the OECD.
The EPO and UNEP have conducted further analyses of CCMT development and transfer in Africa (2013) and Latin America (2014), indicating that there are very few CCMT patent filings in the majority of developing countries, but no study on Europe has been published so far. The above-mentioned studies by Dechezleprêtre et al. (2011), Glachant et al. (2013) and Hašci c et al. (2012) look at European countries individually but do not consider the overall contribution of Europe as a region to CCMT development and transfer.
Structure of the report
Chapter 2 of the report gives an overview of the European patent system, including national patent offices and the European Patent Office (EPO), and the patent application procedure under the Patent Cooperation Treaty (PCT).
Chapter 3 presents the data and methodologies used for the analysis in the subsequent chapters.
Chapter 4 analyses inventive activity in CCMTs of Europe-based inventors. It investigates where European CCMT research and development strengths lie, and compares Europe’s performance with that of other main centres of innovation, in particular the US, Japan, China and Korea.
Chapter 5 presents a global analysis of technology markets where inventions developed in Europe are protected in other regions through the patent system. It further looks at the origin of patent applications filed in Europe, indi-cating global interest in Europe as a market for CCMTs. The patent data analysis is complemented with an investi-gation of international trade flows in CCMT goods and of foreign direct investments.
An examination of the connections between inventive activity and policies directed at climate change miti-gation, together with relevant government expenditure on R&D, is performed in Chapter 6.
Chapter 7, written by UNEP, surveys the potential for use of clean energy in Europe, both by type of energy and by geographical region, against the goals defined by the EU, and gives an overview of current levels of implementation.
Key findings and conclusions are presented in Chapter 8.
2 UNEP – United Nations Environment Programme. ICTSD – International Centre for Trade and Sustainable Development1 For a description of the Y02/Y04S tagging scheme for CCMTs, see Chapter 3.
Marine current turbines, Strangford Lough, Northern Ireland
The European patent system The European patent system
16 17
2 THE EUROPEAN PATENT SYSTEM
The European patent system The European patent system
18 19
2.1Patent protection in Europe
The objective of the patent system
Investing in innovation often involves high levels of risk and uncertainty. Patents provide an incentive to invest by granting patentees a temporary exclusive right to prevent others from exploiting the results of their R&D. This helps them to recoup their development costs and market their inventions without interference from competitors. Third parties must either license these technological solutions from the patent holders, or wait until the exclusive rights expire.
In return for this period of protection, applicants must disclose their invention in a manner sufficiently clear for it to be carried out by a person skilled in the art. Patent applications are published 18 months after the initial filing, providing a timely source of technical information, which is readily available, free of charge, on the internet. Patent literature lays the foundation for further techno-logical developments, informing all stakeholders of the latest developments and preventing researchers from “re-inventing the wheel”.
Overall, the objective of the patent system is to promote technological innovation and the dissemination of techni-cal information, to the mutual benefit of inventors and the public, “in a manner that is conducive to social and economic welfare” (Article 7 of the Agreement on Trade-Related Aspects of Intellectual Property Rights – TRIPS). To fulfil its purpose, the patent system must offer fair and sound protection and facilitate the wide diffusion of knowledge.
Protection of inventions in Europe
In Europe, inventors can apply for patent protection in the individual European states via the national patent systems and/or seek regional protection through a centralised European procedure at the European Patent Office (EPO).
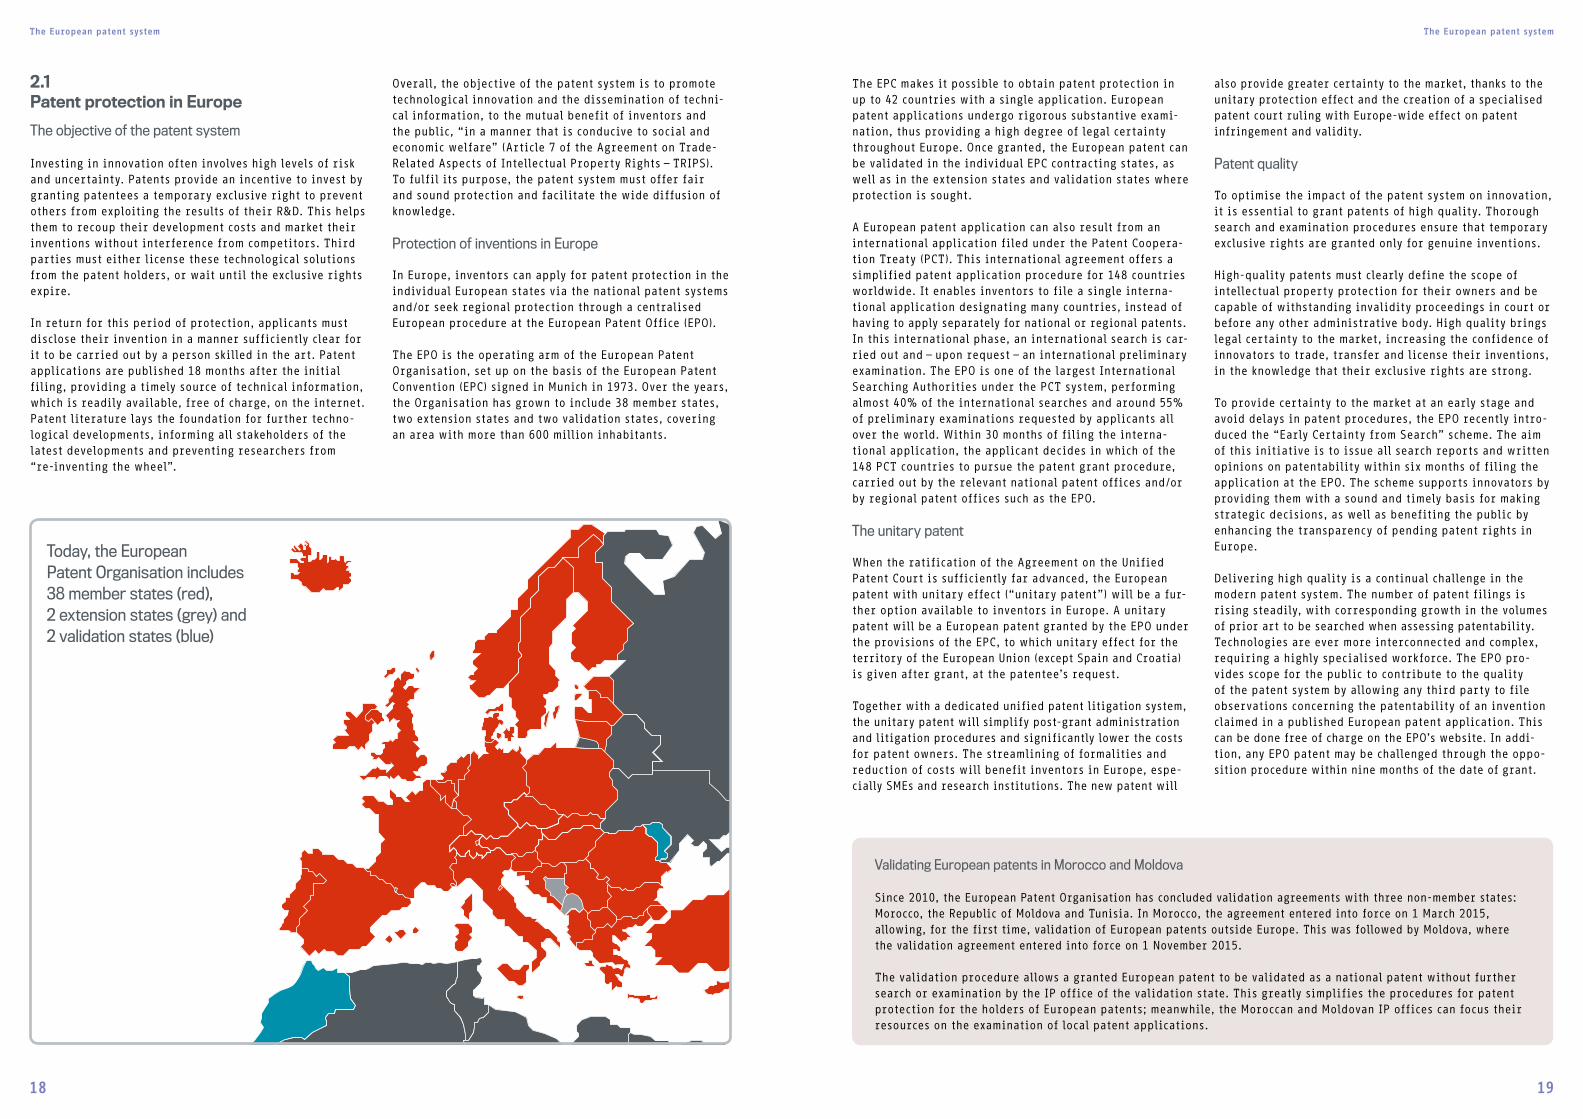
The EPO is the operating arm of the European Patent Organisation, set up on the basis of the European Patent Convention (EPC) signed in Munich in 1973. Over the years, the Organisation has grown to include 38 member states, two extension states and two validation states, covering an area with more than 600 million inhabitants.
The EPC makes it possible to obtain patent protection in up to 42 countries with a single application. European patent applications undergo rigorous substantive exami-nation, thus providing a high degree of legal certainty throughout Europe. Once granted, the European patent can be validated in the individual EPC contracting states, as well as in the extension states and validation states where protection is sought.
A European patent application can also result from an international application filed under the Patent Coopera-tion Treaty (PCT). This international agreement offers a simplified patent application procedure for 148 countries worldwide. It enables inventors to file a single interna-tional application designating many countries, instead of having to apply separately for national or regional patents. In this international phase, an international search is car-ried out and – upon request – an international preliminary examination. The EPO is one of the largest International Searching Authorities under the PCT system, performing almost 40% of the international searches and around 55% of preliminary examinations requested by applicants all over the world. Within 30 months of filing the interna-tional application, the applicant decides in which of the 148 PCT countries to pursue the patent grant procedure, carried out by the relevant national patent offices and/or by regional patent offices such as the EPO.
The unitary patent
When the ratification of the Agreement on the Unified Patent Court is sufficiently far advanced, the European patent with unitary effect (“unitary patent”) will be a fur-ther option available to inventors in Europe. A unitary patent will be a European patent granted by the EPO under the provisions of the EPC, to which unitary effect for the territory of the European Union (except Spain and Croatia) is given after grant, at the patentee’s request.
Together with a dedicated unified patent litigation system, the unitary patent will simplify post-grant administration and litigation procedures and significantly lower the costs for patent owners. The streamlining of formalities and reduction of costs will benefit inventors in Europe, espe-cially SMEs and research institutions. The new patent will
also provide greater certainty to the market, thanks to the unitary protection effect and the creation of a specialised patent court ruling with Europe-wide effect on patent infringement and validity.
Patent quality
To optimise the impact of the patent system on innovation, it is essential to grant patents of high quality. Thorough search and examination procedures ensure that temporary exclusive rights are granted only for genuine inventions.
High-quality patents must clearly define the scope of intellectual property protection for their owners and be capable of withstanding invalidity proceedings in court or before any other administrative body. High quality brings legal certainty to the market, increasing the confidence of innovators to trade, transfer and license their inventions, in the knowledge that their exclusive rights are strong.
To provide certainty to the market at an early stage and avoid delays in patent procedures, the EPO recently intro-duced the “Early Certainty from Search” scheme. The aim of this initiative is to issue all search reports and written opinions on patentability within six months of filing the application at the EPO. The scheme supports innovators by providing them with a sound and timely basis for making strategic decisions, as well as benefiting the public by enhancing the transparency of pending patent rights in Europe.
Delivering high quality is a continual challenge in the modern patent system. The number of patent filings is rising steadily, with corresponding growth in the volumes of prior art to be searched when assessing patentability. Technologies are ever more interconnected and complex, requiring a highly specialised workforce. The EPO pro-vides scope for the public to contribute to the quality of the patent system by allowing any third party to file observations concerning the patentability of an invention claimed in a published European patent application. This can be done free of charge on the EPO’s website. In addi-tion, any EPO patent may be challenged through the oppo-sition procedure within nine months of the date of grant.
Validating European patents in Morocco and Moldova
Since 2010, the European Patent Organisation has concluded validation agreements with three non-member states: Morocco, the Republic of Moldova and Tunisia. In Morocco, the agreement entered into force on 1 March 2015, allowing, for the first time, validation of European patents outside Europe. This was followed by Moldova, where the validation agreement entered into force on 1 November 2015.
The validation procedure allows a granted European patent to be validated as a national patent without further search or examination by the IP office of the validation state. This greatly simplifies the procedures for patent protection for the holders of European patents; meanwhile, the Moroccan and Moldovan IP offices can focus their resources on the examination of local patent applications.
Today, the European Patent Organisation includes 38 member states (red), 2 extension states (grey) and 2 validation states (blue)
The European patent system The European patent system
20 21
Farouk Tedjar and Jean-Claude Foudraz (France)
Finalists of the European Inventor Award 2012 in the category of SMEs, in the area of technologies for solid waste management (Y02W30)
Invention: Method for recycling batteries
Billions of lithium-ion-based rechargeable bat-teries are produced every year to power cell phones, laptops and MP3 players. Discarding them can create huge amounts of waste. French scien-tists Farouk Tedjar and Jean-Claude Foudraz devel-oped a novel solution – which is fast, effective, inex pensive and uses less energy – to recycle these batteries and recover 98% of the valuable metals they contain.
2.2Transparency and patent information
Patent disclosure and knowledge dissemination
Disclosure, publication and dissemination of patent infor-mation play a fundamental role in maintaining the balance of rights and obligations in the patent system. These three steps ensure that the major part of the technical knowledge produced every day by the world’s innovators is made available to the public. Without the patent system, most of this information would probably remain secret.
Patent information is, first and foremost, an invaluable source of technical knowledge and a sensitive indicator of developments in the technology market. Patent literature can be searched to find one or more solutions to a technical problem, to learn from the research and development of other innovators, and to identify emerging trends in a particular field of interest, such as climate change mitigation technologies.
Digitisation and publication of patent data over the internet has greatly enhanced the potential for knowledge dissemination. Some large IP organisations, such as the EPO, major national patent offices (e.g. the IP5) and WIPO, have assumed a proactive role as global information pro-viders, developing tools that remove barriers to access for the general public, while continuing to expand their data collections to guarantee maximum geographical coverage. The EPO’s Espacenet3 service provides free access to the world's largest repository of patents and patent appli-cations, comprising over 90 million documents.
Although Espacenet enables complex searches with a combination of key words and filters, the search process remains dependent on patent classification, i.e. the system of codes that serve to group inventions according to techni-cal areas. The classification system common to all patent offices, with 70 000 technology codes, is the International Patent Classification (IPC). The patent classifi cation now used by the EPO is the Cooperative Patent Classification (CPC), a new system jointly managed with the United States Patent and Trademark Office (USPTO). With over 250 000 codes, the CPC is an extension of the IPC that combines the best practices of both offices and allows for more accurate and efficient searching. Since its introduction in 2013, it has been adopted by several large IP offices, including those of Korea (KIPO), China (SIPO), Russia (ROSPATENT) and Brazil (INPI), as well as by the EPO’s member states, and is rapidly becoming the de facto global refined classification system.
Integrated into the CPC is the Y02/Y04S tagging scheme, specially developed by the EPO for searching documents relating to climate change mitigation technologies (CCMTs). This brings together under one umbrella many different CCMTs traditionally classified under a wide range of tech-nology fields. The aim is to increase the transparency of patent information and enhance the accessibility of these technologies to the general public. The Y02/Y04S scheme currently contains over 900 searchable codes with nearly 2.3 million patent publications.
A further initiative, to aid monitoring the status of patent proceedings on the same patent application filed at differ-ent patent offices, is the IP5 “Global Dossier” service, pro-vided by the EPO with data from the JPO, KIPO, SIPO and the USPTO, which allows users to access, from a single entry point, information on how their applications are progress-ing in the various patent offices around the world.
4 Completion is expected at the end of 2015.
Patent statistics for decision makers
Industry has long made use of patent statistics in support of strategic decisions on R&D investments, competitors’ behaviour and “freedom to operate”. Today, growing IP awareness and training have also made patent data more accessible to a large range of actors in the public sector, where reliable concrete evidence is required to guide policy-making. Patents are well-suited to meet this need: they represent a high-quality source of information that can be used to address a wide range of policy issues in the fields of science and technology, R&D and innovation, entrepreneurship, global value chains, development and economic growth.
Overcoming the language barrier with Patent Translate
In order to improve accessibility and transparency of multilingual patent information, the EPO has equipped its vast free-of-charge patent database Espacenet with a high-quality machine translation tool, called Patent Translate.
Patent Translate is a very effective, practical and user-friendly information tool (powered by Google) that allows users to simultaneously compare the original text with the translations in different languages, and quickly get an understanding of the invention described in the patent.
Patent Translate is now complete and provides on-the-fly-translation between English and the other 27 official languages of the EPO member states, plus Chinese, Japanese, Korean and Russian. Translation from and into French and German is also available for all of the EPO languages.
Finding sustainable technologies in patents: the Y02/Y04S tagging scheme
In response to the requirements of external organi-sations, the EPO has developed a dedicated classi-fication scheme for CCMTs, termed the Y02/Y04S tagging scheme. This scheme is part of the Coopera-tive Patent Classification (CPC) and available for public use within the EPO’s Espacenet and PATSTAT ser vices. It presents an overview of key CCMT areas, increasing the transparency of patenting activity and accessibility of these technologies, while also allowing trends and statistics to be derived.
The Y02/Y04S scheme covers:
– Y02B – CCMTs related to buildings
– Y02C – Capture, storage, sequestration or disposal of greenhouse gases
– Y02E – Reduction of greenhouse gas emissions, related to energy generation, transmission or distribution
– Y02P – CCMTs relating to production in energy intensive industries4
– Y02T – CCMTs related to transportation
– Y02W – CCMTs related to wastewater treatment or waste management
– Y04S – Systems integrating technologies related to power network operation, communication or information technologies for improving elec-trical power generation, transmission, distri-bution, management or usage, i.e. smart grids
Both the technical and legal aspects of patent information are important to policy-makers; they provide input on the development of emerging technologies, their origin and ownership, and the transfer flows between countries. Patent landscaping studies, such as the one presented in this report, can provide a clear picture of developments in technological areas at a national, regional and inter-national level through visualisation in maps and graphs of large amounts of complex data.
One of the most widely used tools for statistical research is the EPO Worldwide Patent Statistical Database (PATSTAT), which is publicly available and contains over 82 million patent applications from nearly 100 countries. Interes t-ing ly, today 40% of PATSTAT users come from governmental research and policy-making.
3 See www.espacenet.com
Data sources and methodology Data sources and methodology
22 23
3DATA SOURCES AND METHODOLOGY
Offshore wind farm, North Sea
Data sources and methodology Data sources and methodology
24 25
For this study, data from five main sources has been gathered: the EPO Worldwide Patent Statistical Database (PATSTAT), the United Nations Commodity Trade Statistics Database, the UNCTAD TRAINS database, Bureau van Dijk's ORBIS database, and the World Bank World Development Indicators.
Patent data
The patent data used in the study is drawn from the World-wide Patent Statistical Database5 (PATSTAT) maintained by the European Patent Office. PATSTAT is the largest interna-tional patent database available to the research community, with over 82 million patent applications included. Patent documents are categorised using the Cooperative Patent Classification (CPC), the International Patent Classification (IPC) and national classification systems. In particular, the new Y02/Y04S tagging scheme of the CPC, developed by the EPO to identify patents in PATSTAT pertaining to “technolo-gies or applications for mitigation against climate change”, is used. This scheme is the result of an unprecedented effort by the EPO, whereby patent examiners specialised in each technology, with the help of external experts, have developed a tagging scheme for patents related to CCMTs. The Y02/Y04S categories provide the most reliable method available today for identifying CCMT patent filings, and the scheme is becoming the de facto inter-national standard for clean innovation studies. CCMTs include technologies that reduce the amount of greenhouse gas emitted into the atmosphere when pro-ducing or consuming energy: for example, renewable energy technologies, carbon capture and storage or elec-tric vehicles. They also include technologies, such as batteries, that do not directly contribute to carbon emis-sions reduction but are complementary to low-carbon technologies. Thus, climate change mitigation technologies are a subset of “green” technologies, which also include technologies such as those relating to water or air pollu-tion control. The Y02/Y04S tagging scheme has now been extended to include Y02W for CCMTs in solid and liquid waste treatment (not available in PATSTAT at the time of this analysis), and will be further extended to include Y02P for production, covering CCMTs in energy-intensive industries. The cate gories included in this study are listed in Table 1. A detailed list of all sub-classifications is available on the EPO website.6
To introduce the indicators used in this and other studies, it is useful to briefly review how the patent system works. A patent is a legal title protecting an invention. To be patented, a product or process must be new, involve an inventive step and be susceptible of industrial application. The legal protection conferred by a patent gives its owner the right to exclude others from making, using, selling, offering for sale or importing the patented invention for the term of the patent, which is usually 20 years from the filing date, and in the country or countries where the pat-ent has been filed (and subsequently granted). This set of rights provides the patentee with a competitive advantage. The cost to the inventor, in return, is the mandatory public disclosure of the technology for which protection is sought. Disclosure makes subsequent imitation easier and facili-tates other future technological developments.
To make things clearer, consider a simplified invention process. In the first stage, an inventor from a particular country “invents” a new technology. The inventor then decides how to protect the intellectual property associated with this invention and where to market it. A patent appli-cation is filed in country 1 (thereby establishing “prior-ity”), which may grant the applicant an exclusive right to commercially exploit the invention in that country if the subject-matter meets the requirements for patentability. Usually, a patent will be sought in country 1 if the invention is to be marketed there, or if there may be a possibility of licensing it to others. The patent applicant also has the right to submit a patent application for the same invention to other national or regional patent offices (or WIPO7) within 12 months, claiming the original filing date as the legally valid date of filing. The set of patents in different countries relating to the same invention is called a patent family. The vast majority of patent families include only one filing (usually in the home country of the inventor, particularly for large countries such as the US). When a patent is sought in several countries, the first filing date worldwide is called the priority date. Accordingly, the first patent filing is called the priority application and the first patent office is referred to as the priority office.
In this study, patent applications are sorted by priority year.8 Because they are first published 18 months after filing, there is a lag between the filing date and the time at which they are observed in the PATSTAT database. For this reason, analysis of the data beyond 2011, which is the latest comprehensive year in the June 2015 version of PATSTAT, is not possible. The number of patent families9 is used as an indicator of the number of inventions, and the number of technologies invented in country A and also filed in country B is used as an indicator of the number of inventions transferred from country A to country B. This approach has been used extensively in recent years, particularly in the environmental field (Lanjouw and Mody, 1996; Eaton and Kortum, 1999; Dechezleprêtre et al., 2011; Dechezleprêtre et al., 2013).
5 Latest version, dated June 2015.6 See http://worldwide.espacenet.com/classification.
7 See an explanation of PCT filings in Chapter 2.8 NB: previous EPO-UNEP studies have defined filings by publication year. 9 The simpler form of the patent family (DOCDB) is used, not the wider INPADOC family definition.
In the simpler definition, each patent document in the family must have the same priority document or set of priority documents.
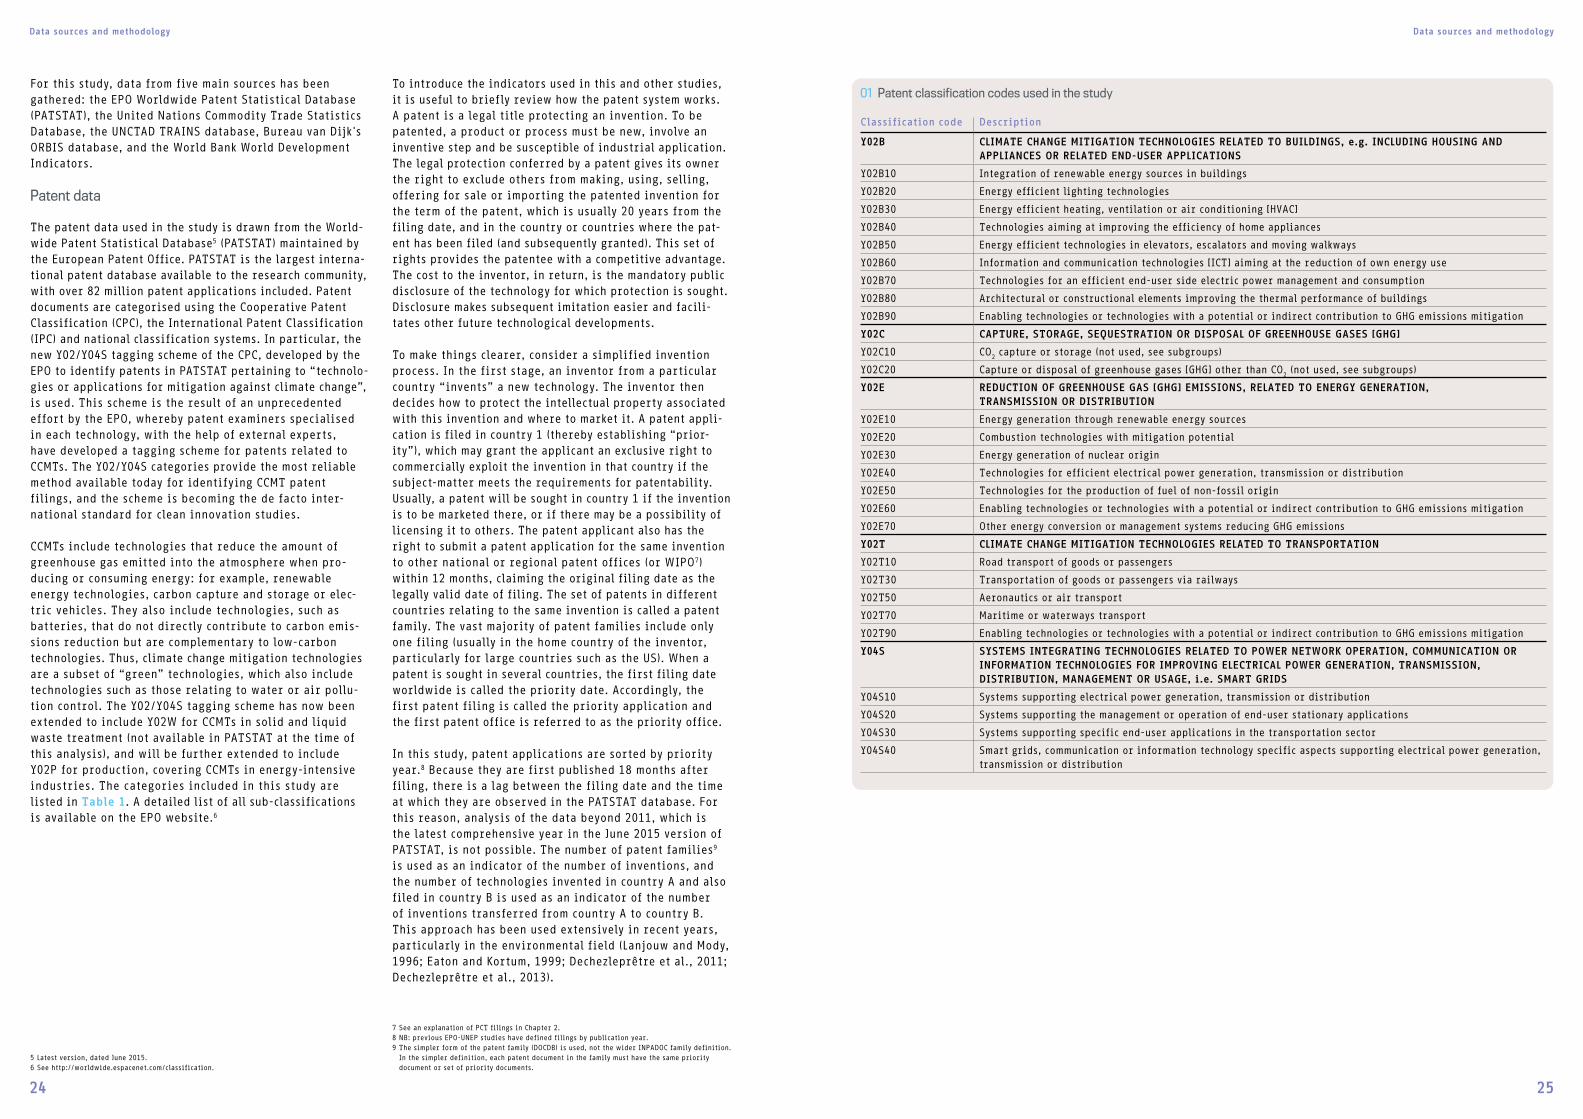
01 Patent classification codes used in the study
Classification code Description
Y02B CLIMATE CHANGE MITIGATION TECHNOLOGIES RELATED TO BUILDINGS, e.g. INCLUDING HOUSING AND APPLIANCES OR RELATED END-USER APPLICATIONS
Y02B10 Integration of renewable energy sources in buildings
Y02B20 Energy efficient lighting technologies
Y02B30 Energy efficient heating, ventilation or air conditioning [HVAC]
Y02B40 Technologies aiming at improving the efficiency of home appliances
Y02B50 Energy efficient technologies in elevators, escalators and moving walkways
Y02B60 Information and communication technologies [ICT] aiming at the reduction of own energy use
Y02B70 Technologies for an efficient end-user side electric power management and consumption
Y02B80 Architectural or constructional elements improving the thermal performance of buildings
Y02B90 Enabling technologies or technologies with a potential or indirect contribution to GHG emissions mitigation
Y02C CAPTURE, STORAGE, SEQUESTRATION OR DISPOSAL OF GREENHOUSE GASES [GHG]
Y02C10 CO2 capture or storage (not used, see subgroups)
Y02C20 Capture or disposal of greenhouse gases [GHG] other than CO2 (not used, see subgroups)
Y02E REDUCTION OF GREENHOUSE GAS [GHG] EMISSIONS, RELATED TO ENERGY GENERATION, TRANSMISSION OR DISTRIBUTION
Y02E10 Energy generation through renewable energy sources
Y02E20 Combustion technologies with mitigation potential
Y02E30 Energy generation of nuclear origin
Y02E40 Technologies for efficient electrical power generation, transmission or distribution
Y02E50 Technologies for the production of fuel of non-fossil origin
Y02E60 Enabling technologies or technologies with a potential or indirect contribution to GHG emissions mitigation
Y02E70 Other energy conversion or management systems reducing GHG emissions
Y02T CLIMATE CHANGE MITIGATION TECHNOLOGIES RELATED TO TRANSPORTATION
Y02T10 Road transport of goods or passengers
Y02T30 Transportation of goods or passengers via railways
Y02T50 Aeronautics or air transport
Y02T70 Maritime or waterways transport
Y02T90 Enabling technologies or technologies with a potential or indirect contribution to GHG emissions mitigation
Y04S SYSTEMS INTEGRATING TECHNOLOGIES RELATED TO POWER NETWORK OPERATION, COMMUNICATION OR INFORMATION TECHNOLOGIES FOR IMPROVING ELECTRICAL POWER GENERATION, TRANSMISSION, DISTRIBUTION, MANAGEMENT OR USAGE, i.e. SMART GRIDS
Y04S10 Systems supporting electrical power generation, transmission or distribution
Y04S20 Systems supporting the management or operation of end-user stationary applications
Y04S30 Systems supporting specific end-user applications in the transportation sector
Y04S40 Smart grids, communication or information technology specific aspects supporting electrical power generation, transmission or distribution
Data sources and methodology Data sources and methodology
26 27
To determine in which country a patented invention has been developed, information on the inventor's country of residence is used. A patent application must always name an inventor, who must be a physical person. In contrast, the applicant can be a legal person, and in practice the appli-cation fees are normally paid by a company or institution. PATSTAT includes information on both the inventor and the applicant. Inventor information is used to determine where inventions are developed, and applicant information to determine the legal owner of the patent. In practice, the inventor country and the applicant country are almost always the same, but nothing prevents a US-based company from filing a patent application for an invention developed in its Europe-based research lab. In this case, the patent will be considered as a European invention. When a patented technology has been developed jointly between inventors located in different countries, fractional counting is applied. For example, if the technology was developed by inventors located in Germany and France, one half of a patent is counted for each inventor country.
In all the patent statistics presented below, “Europe” is defined as the member and extension states of the Euro-pean Patent Organisation, which are listed in Annex 1. Where the analysis or statistic is limited to countries that are also members of the European Union, this group of countries is referred to as the EU.
Despite the recent profusion of studies using patent data, patent-based indicators are imperfect proxies for techno-logical invention and technology transfer, and have several limitations (see OECD, 2009, for a recent overview). Firstly, patents are only one of several means of protecting inventions, along with lead time, industrial secrecy, or purposefully complex specifications (Cohen et al., 2000; Frietsch and Schmoch, 2006). In particular, some inventors may prefer secrecy to prevent public disclosure of the invention imposed by patent law or to save costs relating to patenting. However, there are very few examples of economically significant inventions that have not been patented (Dernis et al., 2001).
Secondly, the propensity to patent differs between sec-tors, depending on the nature of the technology (Cohen, Nelson and Walsh, 2000). It also depends on the risk of imitation in a particular country. Accordingly, inventions are more likely to be patented in countries with techno-logical capabilities and effective enforcement of IPRs. This means that greater patenting activity could reflect either greater inventive activity or a greater propensity to file patents in that country. Some methods used in this paper and described below allow to partly control for this problem.
Another limitation is that, while a patent grants the exclusive right to use a technology in a given country, there is nothing to ensure that the patent owner will actually exercise this right. This could significantly bias the results if applying for patent protection were free, which could encourage inventors to patent widely and indiscriminately. However, patenting involves significant expense, in terms of both the costs of preparing the application and the administrative costs and fees associated with the grant procedure. In addition, the grant of a patent in a given country may be of limited value to the holder if that coun-try’s enforcement of intellectual property rights is weak, since publication of the patent can increase the risk of imi-tation (see Eaton and Kortum, 1996, 1999). Finally, patent infringement litigation usually takes place in the country where the technology is commercialised (as this is where the alleged infringement occurs). Thus, inventors will be reluctant to incur the cost of patent protection in a country unless they expect there to be a market for the technology concerned.
However, the fact remains that the value of individual patents is heterogeneous: many patents have low value, while other patents have a very high value. As a conse-quence, the absolute number of patents does not perfectly reflect the value of technological innovation. Methods have been developed to address this issue. In this report, data on international patent families is used to construct statistics for “high-value” inventions. Where appropriate, patents filed with at least two jurisdictions are used to screen out low-value patents, as has been done elsewhere (Dechezleprêtre et al 2011; Johnstone et al., 2012). Patents filed in at least two jurisdictions are referred to as “claimed priorities”, because when applicants file additional patent applications abroad after the initial application they can claim the application date of the first application (the “priority date”) as the starting date for patent protection in other jurisdictions.10 Using patent applications filed in at least two jurisdictions helps to filter out low-value inventions, for which protection is typically sought at a single patent office (see Guellec and van Pottelsberghe, 2000, and Harhoff et al., 2003).11 Since patent protection is costly, applicants are only likely to file in several jurisdictions if they see enough market potential for the invention.
10 For a discussion of the merits of the use of “claimed priorities”, as well as a review of a number of applications, see Hašci c and Migotto (2015). For a discussion of family size as a patent value indicator, see Harhoff et al. (2003).
11 All applications filed with the EPO and WIPO (so-called PCT filings) are treated as patent applications filed in at least two jurisdictions. Given the higher costs of EPO and PCT filings compared to the national route, applicants will only choose a European or international application if they intend to file in several jurisdictions simultaneously. Furthermore, the qualitative results do not change if the alternative definition is used.
A further complication arises from the fact that not all patent applications result in granted patents. Sometimes the patent application does not fulfil the patentability cri-teria, or the applicant loses commercial interest in seeking patent protection for the invention while the application is still pending. In addition, since the grant procedure takes time, there is usually a delay of several years between the filing date and the date of grant. This creates an additional timeliness problem when considering granted patents only. Therefore, unless stated otherwise, the analysis will focus on counting patent families, where a patent family repre-sents a set of patent applications, granted or not granted in different countries, that are related to the same pro-posed invention. Throughout the report, the term “inven-tion” refers to patent families.12
Trade data
Trade data in USD comes from the United Nations COMTRADE database, which reports bilateral trade between countries at a highly disaggregated product level. Trade data in the COMTRADE database covers between 70% and 90% of world trade obtained from the WTO Statistics Database, depend-ing on the year.
As is the case with patent data, the very detailed classifi-cation system used in the COMTRADE database (a six-digit classification of commodities) makes it possible to specifi-cally identify trade in equipment goods that incorporate technologies to cut GHG emissions (for example, wind tur-bines). To identify products incorporating CCMTs, the same approach as in Glachant et al. (2013) and Sugathan (2013) is taken. The list of commodity codes used in the study is presented in Table 2. Technology transfer is then mea-sured by the value of trade in these goods between trading partners.
12 The simpler form of the patent family (DOCDB) is used.
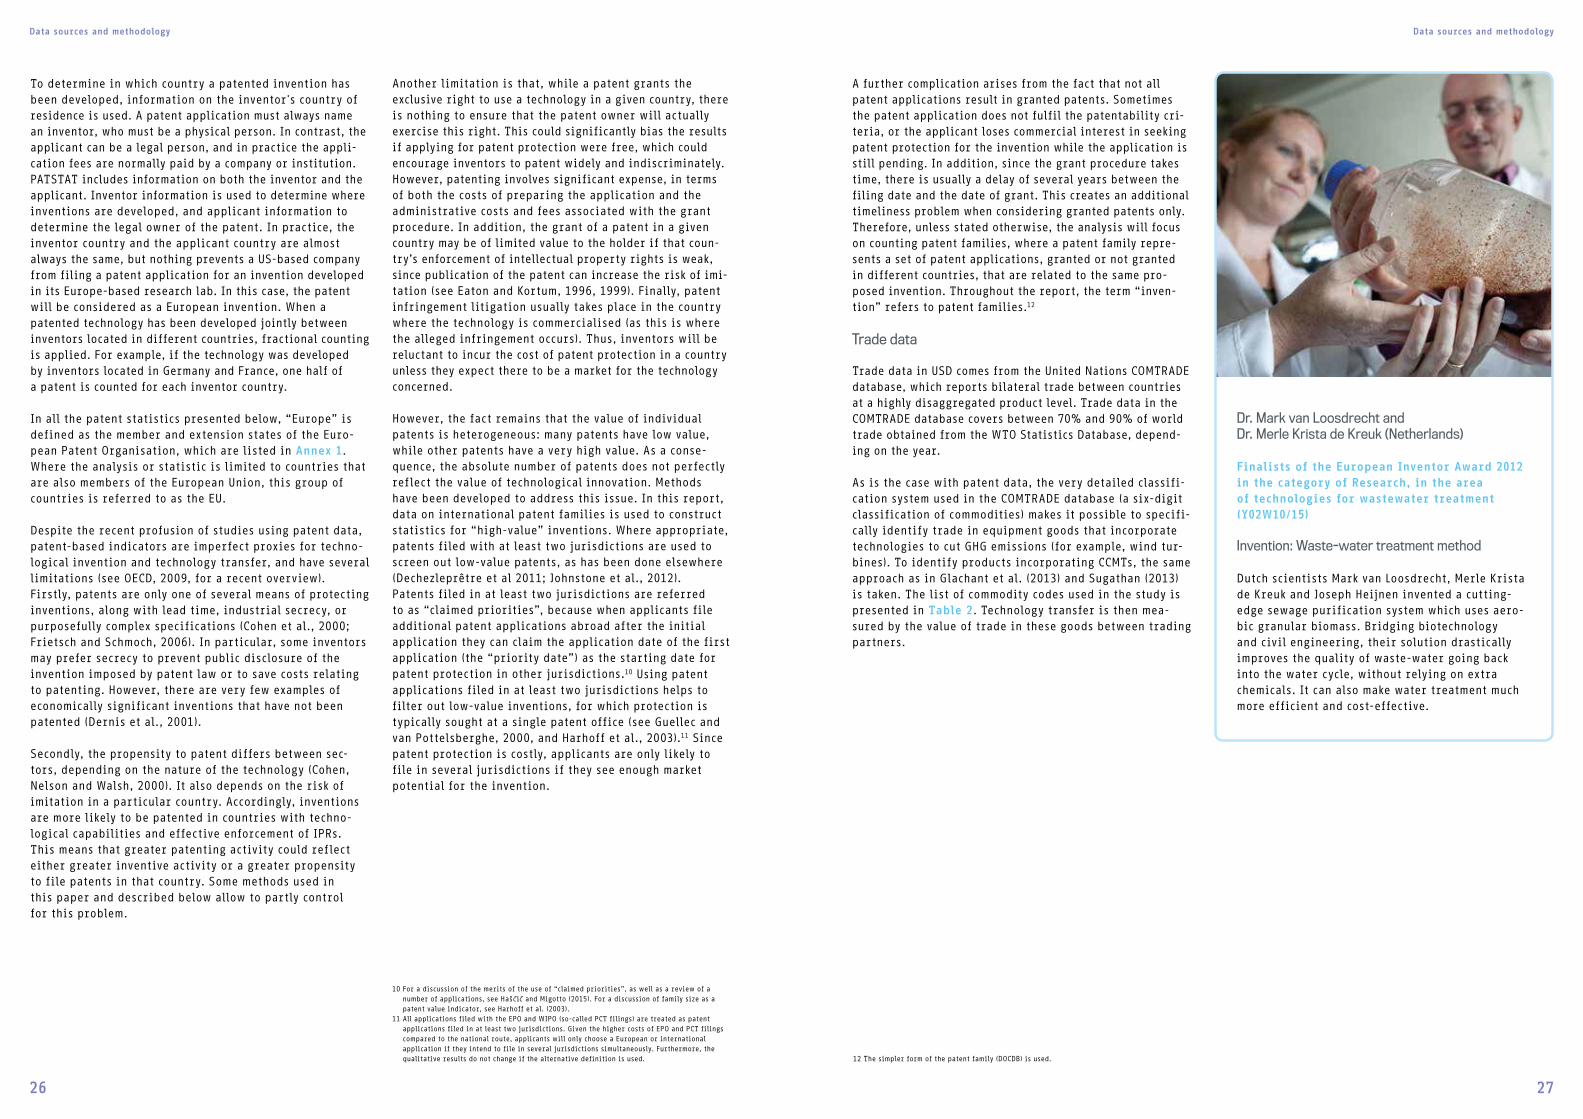
Dr. Mark van Loosdrecht and Dr. Merle Krista de Kreuk (Netherlands)
Finalists of the European Inventor Award 2012 in the category of Research, in the area of technologies for wastewater treatment (Y02W10/15)
Invention: Waste-water treatment method
Dutch scientists Mark van Loosdrecht, Merle Krista de Kreuk and Joseph Heijnen invented a cutting-edge sewage purification system which uses aero-bic granular biomass. Bridging biotechnology and civil engineering, their solution drastically improves the quality of waste-water going back into the water cycle, without relying on extra chemicals. It can also make water treatment much more efficient and cost-effective.
Data sources and methodology Data sources and methodology
28 29
Tariff data
Tariff data in percentage points comes from the United Nations Conference on Trade and Development (UNCTAD) Trade Analysis and Information System (TRAINS) database. TRAINS is a comprehensive database at the most disaggre-gated level under the harmonised system (HS), covering tariff and non-tariff measures as well as import flows by origin for more than 150 countries. Tariff information was downloaded for all the HS codes used in the trade analysis and is presented in Table 2. The duty type is the “effectively applied rate”, which uses preferential tariffs when they exist and is thus the best available measure of tariffs. Furthermore, we use the “weighted average” tariff, which is the average of tariffs weighted by their corresponding trade value.
Foreign investment data
To measure foreign direct investment, the financial data-base ORBIS is used, provided by Bureau Van Dijk under a commercial licence.13 The ORBIS database includes firm-level data on investment stocks in foreign countries (due to mergers and acquisitions, creation of subsidiaries, etc.). To identify FDI by firms involved in sectors related to climate change, the ORBIS database is matched with the PATSTAT database and companies that own at least one patent application in climate-related technology are identi-fied. These companies are referred to as “CCMT companies”. Because patent applications in the various categories pre-sented in Table 1 are used in order to identify companies engaged in international investment activity, the FDI data covers exactly the same categories as those presented in the table.
The rationale for this restriction is twofold. First, it makes it possible to provide an indicator of FDI at the technology level. Economic sector classifications available at the company level are too aggregated to allow for meaningful analyses at the technology level. For example, in the “production of electricity” sector, companies can be identified in general, but not renewable energy producers. Second, the restriction makes it possible to identify foreign investment that potentially involves the transfer of climate-friendly technologies. This explains why patent and FDI statistics have the same technology scope.
13 The ORBIS dataset, provided by Bureau van Dijk, is one of the sources most commonly used by researchers and contains financial information on millions of listed and unlisted companies worldwide. For this study, the April 2013 version of ORBIS was used.
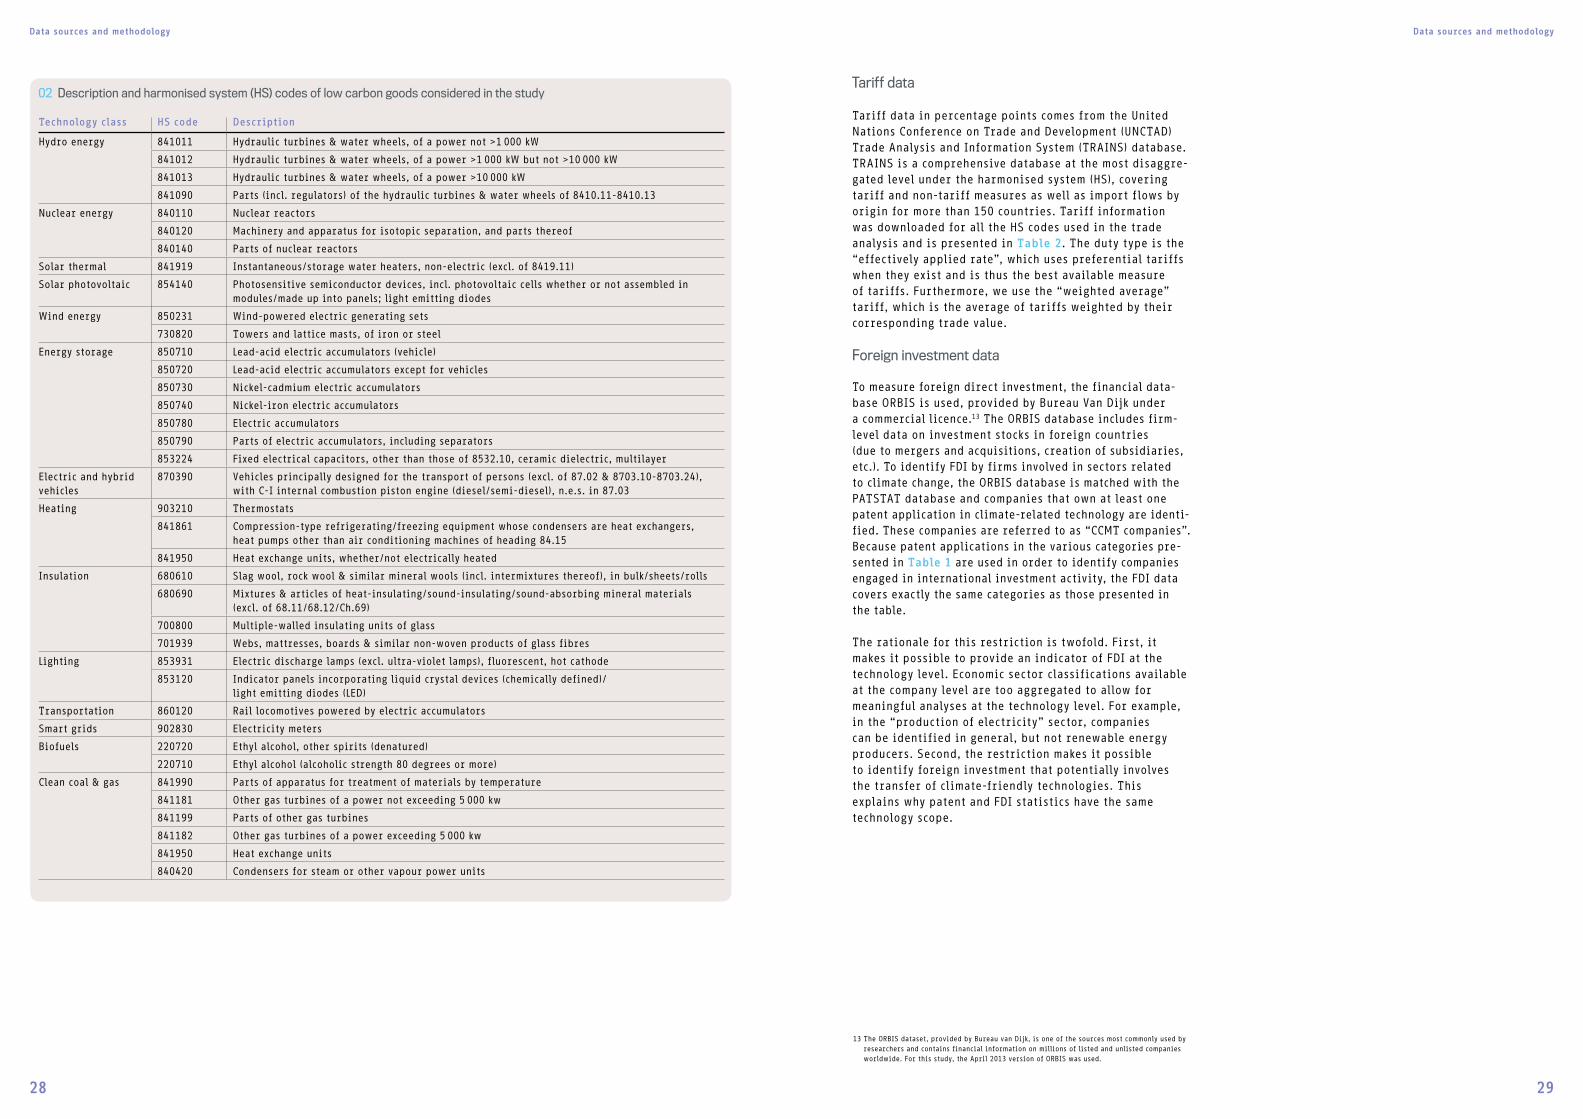
02 Description and harmonised system (HS) codes of low carbon goods considered in the study
Technology class HS code Description
Hydro energy 841011 Hydraulic turbines & water wheels, of a power not >1 000 kW
841012 Hydraulic turbines & water wheels, of a power >1 000 kW but not >10 000 kW
841013 Hydraulic turbines & water wheels, of a power >10 000 kW
841090 Parts (incl. regulators) of the hydraulic turbines & water wheels of 8410.11-8410.13
Nuclear energy 840110 Nuclear reactors
840120 Machinery and apparatus for isotopic separation, and parts thereof
840140 Parts of nuclear reactors
Solar thermal 841919 Instantaneous/storage water heaters, non-electric (excl. of 8419.11)
Solar photovoltaic 854140 Photosensitive semiconductor devices, incl. photovoltaic cells whether or not assembled in modules/made up into panels; light emitting diodes
Wind energy 850231 Wind-powered electric generating sets
730820 Towers and lattice masts, of iron or steel
Energy storage 850710 Lead-acid electric accumulators (vehicle)
850720 Lead-acid electric accumulators except for vehicles
850730 Nickel-cadmium electric accumulators
850740 Nickel-iron electric accumulators
850780 Electric accumulators
850790 Parts of electric accumulators, including separators
853224 Fixed electrical capacitors, other than those of 8532.10, ceramic dielectric, multilayer
Electric and hybrid vehicles
870390 Vehicles principally designed for the transport of persons (excl. of 87.02 & 8703.10-8703.24), with C-I internal combustion piston engine (diesel/semi-diesel), n.e.s. in 87.03
Heating 903210 Thermostats
841861 Compression-type refrigerating/freezing equipment whose condensers are heat exchangers, heat pumps other than air conditioning machines of heading 84.15
841950 Heat exchange units, whether/not electrically heated
Insulation 680610 Slag wool, rock wool & similar mineral wools (incl. intermixtures thereof), in bulk/sheets/rolls
680690 Mixtures & articles of heat-insulating/sound-insulating/sound-absorbing mineral materials (excl. of 68.11/68.12/Ch.69)
700800 Multiple-walled insulating units of glass
701939 Webs, mattresses, boards & similar non-woven products of glass fibres
Lighting 853931 Electric discharge lamps (excl. ultra-violet lamps), fluorescent, hot cathode
853120 Indicator panels incorporating liquid crystal devices (chemically defined)/ light emitting diodes (LED)
Transportation 860120 Rail locomotives powered by electric accumulators
Smart grids 902830 Electricity meters
Biofuels 220720 Ethyl alcohol, other spirits (denatured)
220710 Ethyl alcohol (alcoholic strength 80 degrees or more)
Clean coal & gas 841990 Parts of apparatus for treatment of materials by temperature
841181 Other gas turbines of a power not exceeding 5 000 kw
841199 Parts of other gas turbines
841182 Other gas turbines of a power exceeding 5 000 kw
841950 Heat exchange units
840420 Condensers for steam or other vapour power units
Geothermal power station, Iceland
Europe as a global centre of CCMT inventive activity Europe as a global centre of CCMT inventive activity
30 31
4EUROPE AS A GLOBAL CENTRE OF CCMT INVENTIVE ACTIVITY
Europe as a global centre of CCMT inventive activity Europe as a global centre of CCMT inventive activity
32 33
4.1Global trends
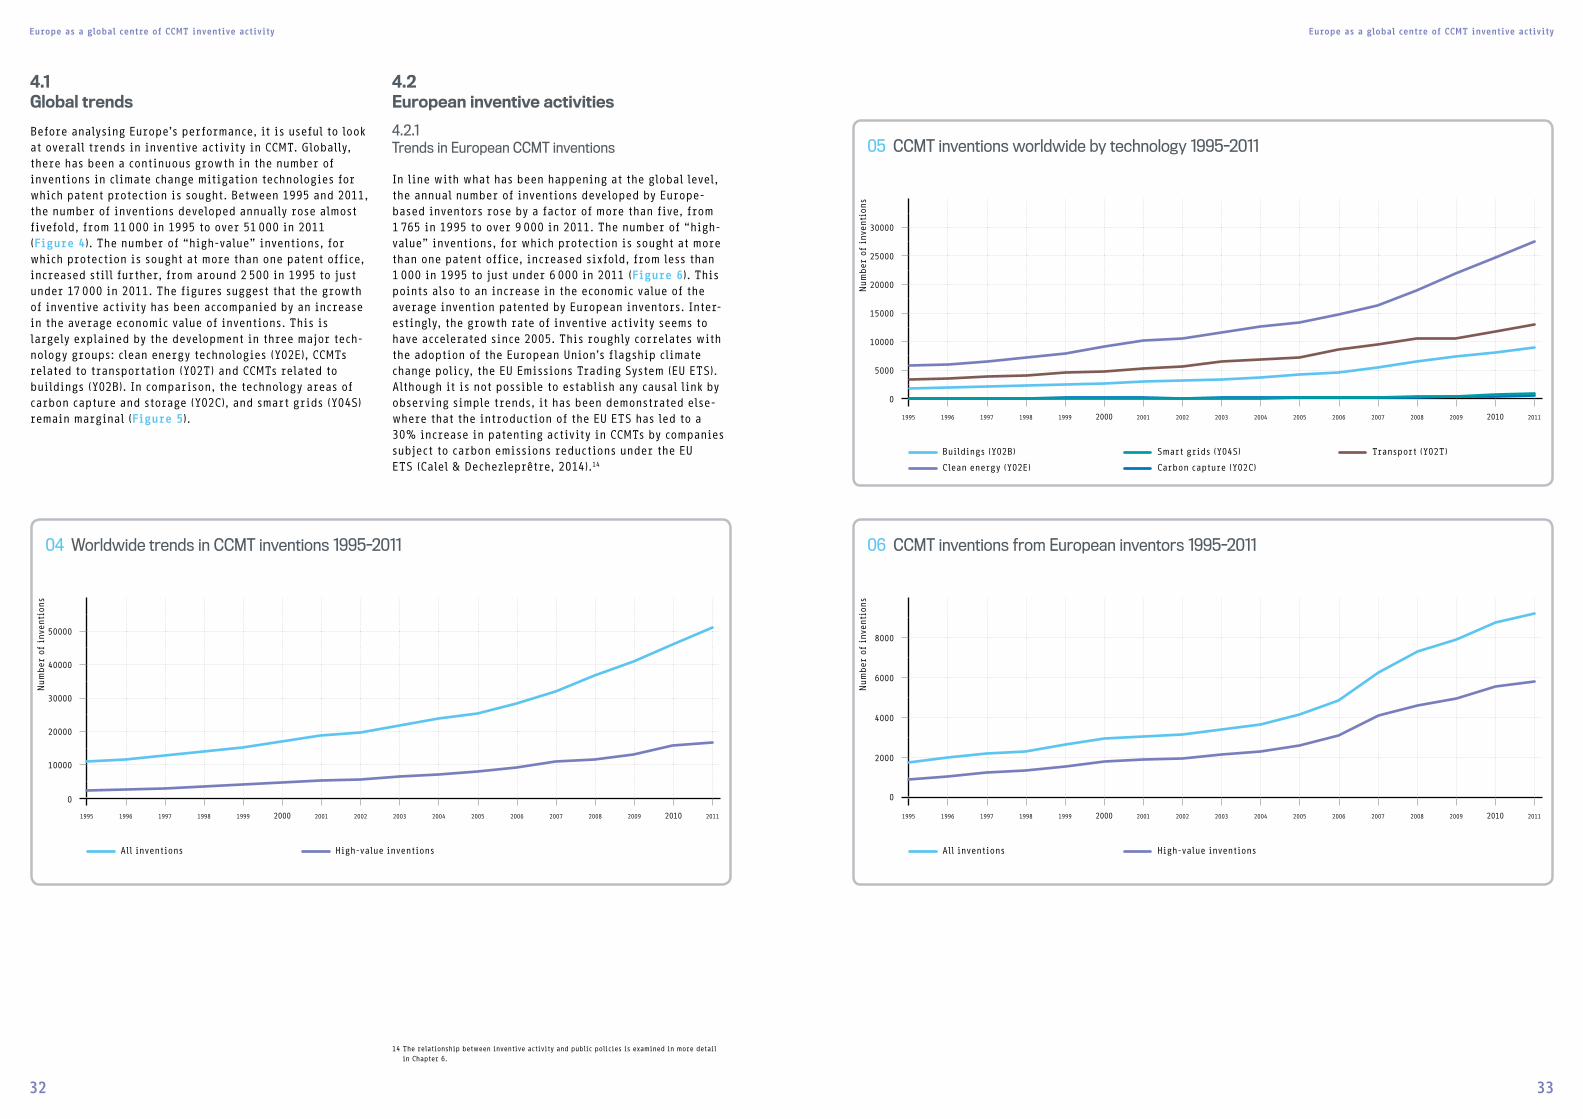
Before analysing Europe’s performance, it is useful to look at overall trends in inventive activity in CCMT. Globally, there has been a continuous growth in the number of inventions in climate change mitigation technologies for which patent protection is sought. Between 1995 and 2011, the number of inventions developed annually rose almost fivefold, from 11 000 in 1995 to over 51 000 in 2011 (Figure 4). The number of “high-value” inventions, for which protection is sought at more than one patent office, increased still further, from around 2 500 in 1995 to just under 17 000 in 2011. The figures suggest that the growth of inventive activity has been accompanied by an increase in the average economic value of inventions. This is largely explained by the development in three major tech-nology groups: clean energy technologies (Y02E), CCMTs related to transportation (Y02T) and CCMTs related to buildings (Y02B). In comparison, the technology areas of carbon capture and storage (Y02C), and smart grids (Y04S) remain marginal (Figure 5).
14 The relationship between inventive activity and public policies is examined in more detail in Chapter 6.
4.2European inventive activities
4.2.1Trends in European CCMT inventions
In line with what has been happening at the global level, the annual number of inventions developed by Europe-based inventors rose by a factor of more than five, from 1 765 in 1995 to over 9 000 in 2011. The number of “high-value” inventions, for which protection is sought at more than one patent office, increased sixfold, from less than 1 000 in 1995 to just under 6 000 in 2011 (Figure 6). This points also to an increase in the economic value of the average invention patented by European inventors. Inter-estingly, the growth rate of inventive activity seems to have accelerated since 2005. This roughly correlates with the adoption of the European Union’s flagship climate change policy, the EU Emissions Trading System (EU ETS). Although it is not possible to establish any causal link by observing simple trends, it has been demonstrated else-where that the introduction of the EU ETS has led to a 30% increase in patenting activity in CCMTs by companies subject to carbon emissions reductions under the EU ETS (Calel & Dechezleprêtre, 2014).14
04 Worldwide trends in CCMT inventions 1995-2011
Num
ber
of
inve
ntio
ns
1995 1996 1997 1998 1999 2000 2001 2002 2003 2004 2005 2006 2007 2008 2009 2010 2011
All inventions High-value inventions
50000
40000
30000
20000
10000
0
05 CCMT inventions worldwide by technology 1995-2011
30000
25000
20000
15000
10000
5000
0
Num
ber
of
inve
ntio
ns
1995 1996 1997 1998 1999 2000 2001 2002 2003 2004 2005 2006 2007 2008 2009 2010 2011
Buildings (Y02B)
Clean energy (Y02E)
Smart grids (Y04S)
Carbon capture (Y02C)
Transport (Y02T)
06 CCMT inventions from European inventors 1995-2011
Num
ber
of
inve
ntio
ns
1995 1996 1997 1998 1999 2000 2001 2002 2003 2004 2005 2006 2007 2008 2009 2010 2011
All inventions High-value inventions
8000
6000
4000
2000
0
Europe as a global centre of CCMT inventive activity Europe as a global centre of CCMT inventive activity
34 35
4.2.2Europe compared to other major innovation centres
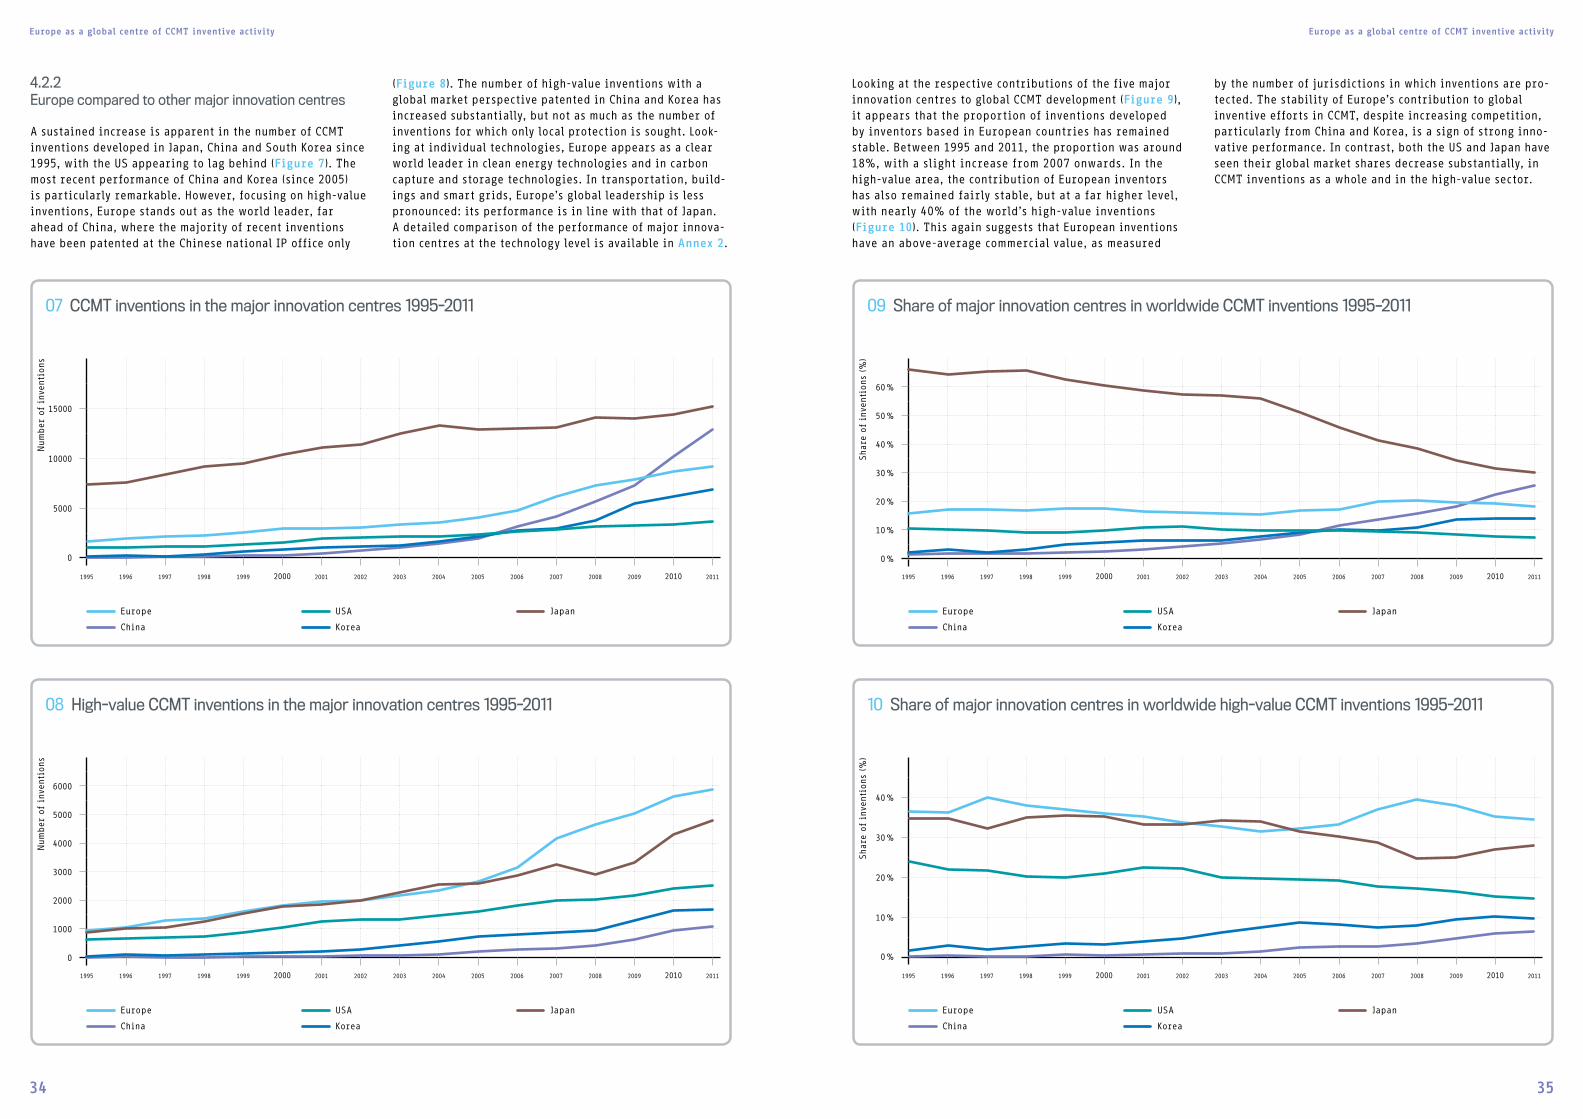
A sustained increase is apparent in the number of CCMT inventions developed in Japan, China and South Korea since 1995, with the US appearing to lag behind (Figure 7). The most recent performance of China and Korea (since 2005) is particularly remarkable. However, focusing on high-value inventions, Europe stands out as the world leader, far ahead of China, where the majority of recent inventions have been patented at the Chinese national IP office only
(Figure 8). The number of high-value inventions with a global market perspective patented in China and Korea has increased substantially, but not as much as the number of inventions for which only local protection is sought. Look-ing at individual technologies, Europe appears as a clear world leader in clean energy technologies and in carbon capture and storage technologies. In transportation, build-ings and smart grids, Europe’s global leadership is less pronounced: its performance is in line with that of Japan. A detailed comparison of the performance of major innova-tion centres at the technology level is available in Annex 2.
Looking at the respective contributions of the five major innovation centres to global CCMT development (Figure 9), it appears that the proportion of inventions developed by inventors based in European countries has remained stable. Between 1995 and 2011, the proportion was around 18%, with a slight increase from 2007 onwards. In the high-value area, the contribution of European inventors has also remained fairly stable, but at a far higher level, with nearly 40% of the world’s high-value inventions (Figure 10). This again suggests that European inventions have an above-average commercial value, as measured
by the number of jurisdictions in which inventions are pro-tected. The stability of Europe’s contribution to global inventive efforts in CCMT, despite increasing competition, particularly from China and Korea, is a sign of strong inno-vative performance. In contrast, both the US and Japan have seen their global market shares decrease substantially, in CCMT inventions as a whole and in the high-value sector.
08 High-value CCMT inventions in the major innovation centres 1995-2011
6000
5000
4000
3000
2000
1000
0
Num
ber
of
inve
ntio
ns
1995 1996 1997 1998 1999 2000 2001 2002 2003 2004 2005 2006 2007 2008 2009 2010 2011
Europe
China
USA
Korea
Japan
07 CCMT inventions in the major innovation centres 1995-2011
1995 1996 1997 1998 1999 2000 2001 2002 2003 2004 2005 2006 2007 2008 2009 2010 2011
Europe
China
USA
Korea
Japan
15000
10000
5000
0
Num
ber
of
inve
ntio
ns
10 Share of major innovation centres in worldwide high-value CCMT inventions 1995-2011
1995 1996 1997 1998 1999 2000 2001 2002 2003 2004 2005 2006 2007 2008 2009 2010 2011
Europe
China
USA
Korea
Japan
40 %
30 %
20 %
10 %
0 %
Shar
e of
inv
enti
ons
(%)
09 Share of major innovation centres in worldwide CCMT inventions 1995–2011
1995 1996 1997 1998 1999 2000 2001 2002 2003 2004 2005 2006 2007 2008 2009 2010 2011
Europe
China
USA
Korea
Japan
60 %
50 %
40 %
30 %
20 %
10 %
0 %
Shar
e of
inv
enti
ons
(%)
Europe as a global centre of CCMT inventive activity Europe as a global centre of CCMT inventive activity
36 37
4.2.3Inventive activity by technology
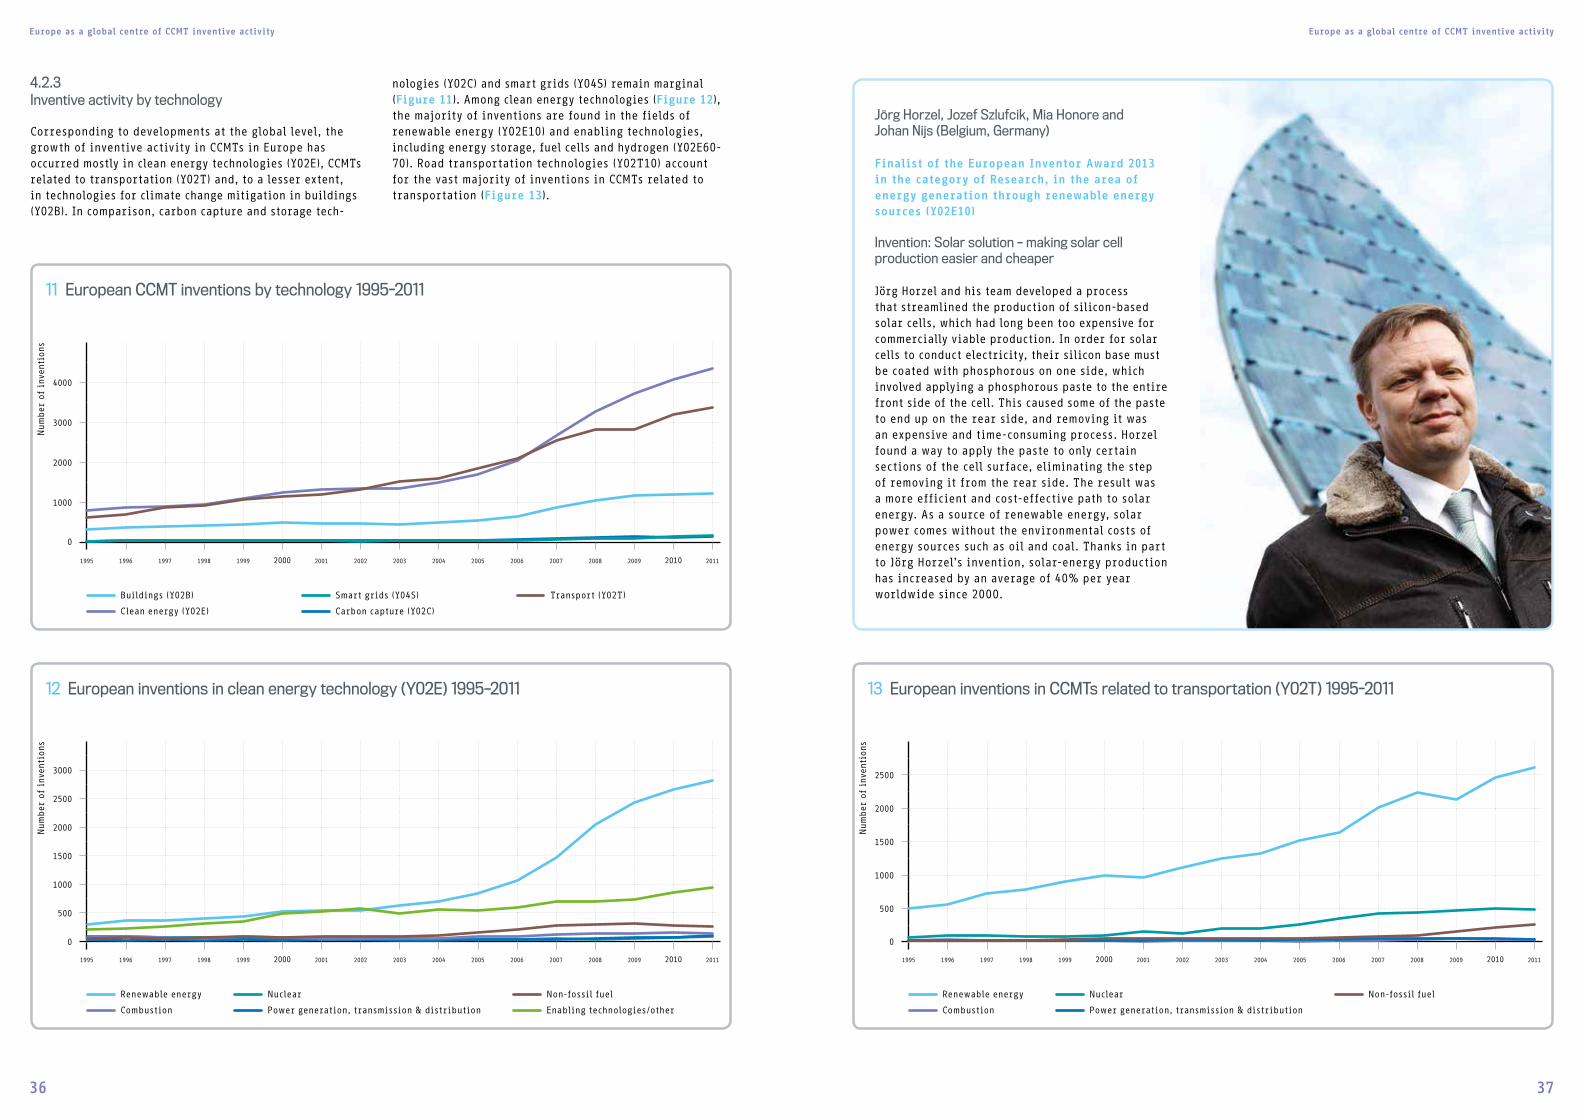
Corresponding to developments at the global level, the growth of inventive activity in CCMTs in Europe has occurred mostly in clean energy technologies (Y02E), CCMTs related to transportation (Y02T) and, to a lesser extent, in technologies for climate change mitigation in buildings (Y02B). In comparison, carbon capture and storage tech-
nologies (Y02C) and smart grids (Y04S) remain marginal (Figure 11). Among clean energy technologies (Figure 12), the majority of inventions are found in the fields of renewable energy (Y02E10) and enabling technologies, including energy storage, fuel cells and hydrogen (Y02E60-70). Road transportation technologies (Y02T10) account for the vast majority of inventions in CCMTs related to transportation (Figure 13).
Jörg Horzel, Jozef Szlufcik, Mia Honore and Johan Nijs (Belgium, Germany)
Finalist of the European Inventor Award 2013 in the category of Research, in the area of energy generation through renewable energy sources (Y02E10)
Invention: Solar solution – making solar cell production easier and cheaper
Jörg Horzel and his team developed a process that streamlined the production of silicon-based solar cells, which had long been too expensive for commercially viable production. In order for solar cells to conduct electricity, their silicon base must be coated with phosphorous on one side, which involved applying a phosphorous paste to the entire front side of the cell. This caused some of the paste to end up on the rear side, and removing it was an expensive and time-consuming process. Horzel found a way to apply the paste to only certain sections of the cell surface, eliminating the step of removing it from the rear side. The result was a more efficient and cost-effective path to solar energy. As a source of renewable energy, solar power comes without the environmental costs of energy sources such as oil and coal. Thanks in part to Jörg Horzel’s invention, solar-energy production has increased by an average of 40% per year worldwide since 2000.
11 European CCMT inventions by technology 1995-2011
Num
ber
of
inve
ntio
ns
1995 1996 1997 1998 1999 2000 2001 2002 2003 2004 2005 2006 2007 2008 2009 2010 2011
Buildings (Y02B)
Clean energy (Y02E)
Smart grids (Y04S)
Carbon capture (Y02C)
Transport (Y02T)
4000
3000
2000
1000
0
3000
2500
2000
1500
1000
500
0
Renewable energy
Combustion
Nuclear
Power generation, transmission & distribution
Non-fossil fuel
Enabling technologies/other
12 European inventions in clean energy technology (Y02E) 1995–2011
Num
ber
of
inve
ntio
ns
1995 1996 1997 1998 1999 2000 2001 2002 2003 2004 2005 2006 2007 2008 2009 2010 2011
13 European inventions in CCMTs related to transportation (Y02T) 1995-2011
Num
ber
of
inve
ntio
ns
1995 1996 1997 1998 1999 2000 2001 2002 2003 2004 2005 2006 2007 2008 2009 2010 2011
Renewable energy
Combustion
Nuclear
Power generation, transmission & distribution
Non-fossil fuel
2500
2000
1500
1000
500
0
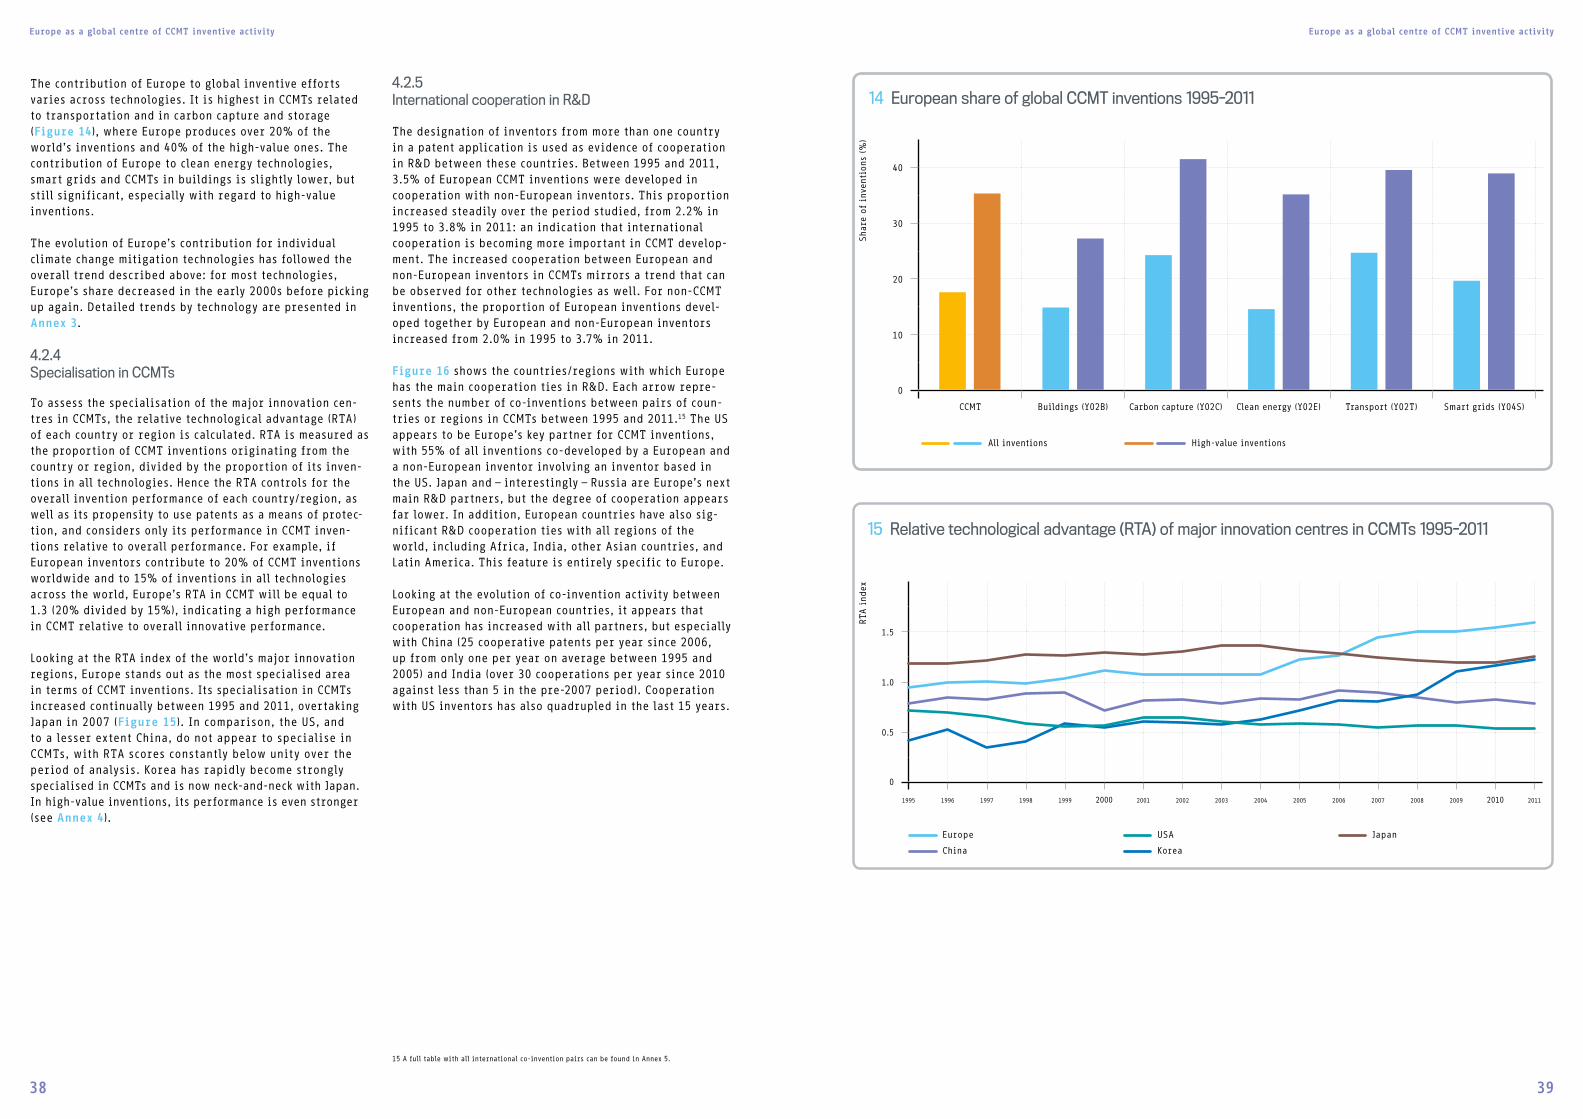
Europe as a global centre of CCMT inventive activity Europe as a global centre of CCMT inventive activity
38 39
The contribution of Europe to global inventive efforts varies across technologies. It is highest in CCMTs related to transportation and in carbon capture and storage (Figure 14), where Europe produces over 20% of the world’s inventions and 40% of the high-value ones. The contribution of Europe to clean energy technologies, smart grids and CCMTs in buildings is slightly lower, but still significant, especially with regard to high-value inventions.
The evolution of Europe’s contribution for individual climate change mitigation technologies has followed the overall trend described above: for most technologies, Europe’s share decreased in the early 2000s before picking up again. Detailed trends by technology are presented in Annex 3.
4.2.4Specialisation in CCMTs
To assess the specialisation of the major innovation cen-tres in CCMTs, the relative technological advantage (RTA) of each country or region is calculated. RTA is measured as the proportion of CCMT inventions originating from the country or region, divided by the proportion of its inven-tions in all technologies. Hence the RTA controls for the overall invention performance of each country/region, as well as its propensity to use patents as a means of protec-tion, and considers only its performance in CCMT inven-tions relative to overall performance. For example, if European inventors contribute to 20% of CCMT inventions worldwide and to 15% of inventions in all technologies across the world, Europe’s RTA in CCMT will be equal to 1.3 (20% divided by 15%), indicating a high performance in CCMT relative to overall innovative performance.
Looking at the RTA index of the world’s major innovation regions, Europe stands out as the most specialised area in terms of CCMT inventions. Its specialisation in CCMTs increased continually between 1995 and 2011, overtaking Japan in 2007 (Figure 15). In comparison, the US, and to a lesser extent China, do not appear to specialise in CCMTs, with RTA scores constantly below unity over the period of analysis. Korea has rapidly become strongly specialised in CCMTs and is now neck-and-neck with Japan. In high-value inventions, its performance is even stronger (see Annex 4).
4.2.5International cooperation in R&D
The designation of inventors from more than one country in a patent application is used as evidence of cooperation in R&D between these countries. Between 1995 and 2011, 3.5% of European CCMT inventions were developed in cooperation with non-European inventors. This proportion increased steadily over the period studied, from 2.2% in 1995 to 3.8% in 2011: an indication that international cooperation is becoming more important in CCMT develop-ment. The increased cooperation between European and non-European inventors in CCMTs mirrors a trend that can be observed for other technologies as well. For non-CCMT inventions, the proportion of European inventions devel-oped together by European and non-European inventors increased from 2.0% in 1995 to 3.7% in 2011.
Figure 16 shows the countries/regions with which Europe has the main cooperation ties in R&D. Each arrow repre-sents the number of co-inventions between pairs of coun-tries or regions in CCMTs between 1995 and 2011.15 The US appears to be Europe’s key partner for CCMT inventions, with 55% of all inventions co-developed by a European and a non-European inventor involving an inventor based in the US. Japan and – interestingly – Russia are Europe’s next main R&D partners, but the degree of cooperation appears far lower. In addition, European countries have also sig-nificant R&D cooperation ties with all regions of the world, including Africa, India, other Asian countries, and Latin America. This feature is entirely specific to Europe.
Looking at the evolution of co-invention activity between European and non-European countries, it appears that cooperation has increased with all partners, but especially with China (25 cooperative patents per year since 2006, up from only one per year on average between 1995 and 2005) and India (over 30 cooperations per year since 2010 against less than 5 in the pre-2007 period). Cooperation with US inventors has also quadrupled in the last 15 years.
15 A full table with all international co-invention pairs can be found in Annex 5.
15 Relative technological advantage (RTA) of major innovation centres in CCMTs 1995-2011
1995 1996 1997 1998 1999 2000 2001 2002 2003 2004 2005 2006 2007 2008 2009 2010 2011
Europe
China
USA
Korea
Japan
1.5
1.0
0.5
0
RTA
ind
ex
40
30
20
10
0
CCMT Buildings (Y02B) Carbon capture (Y02C) Clean energy (Y02E) Transport (Y02T) Smart grids (Y04S)
14 European share of global CCMT inventions 1995-2011
All inventions High-value inventions
Shar
e of
inv
enti
ons
(%)
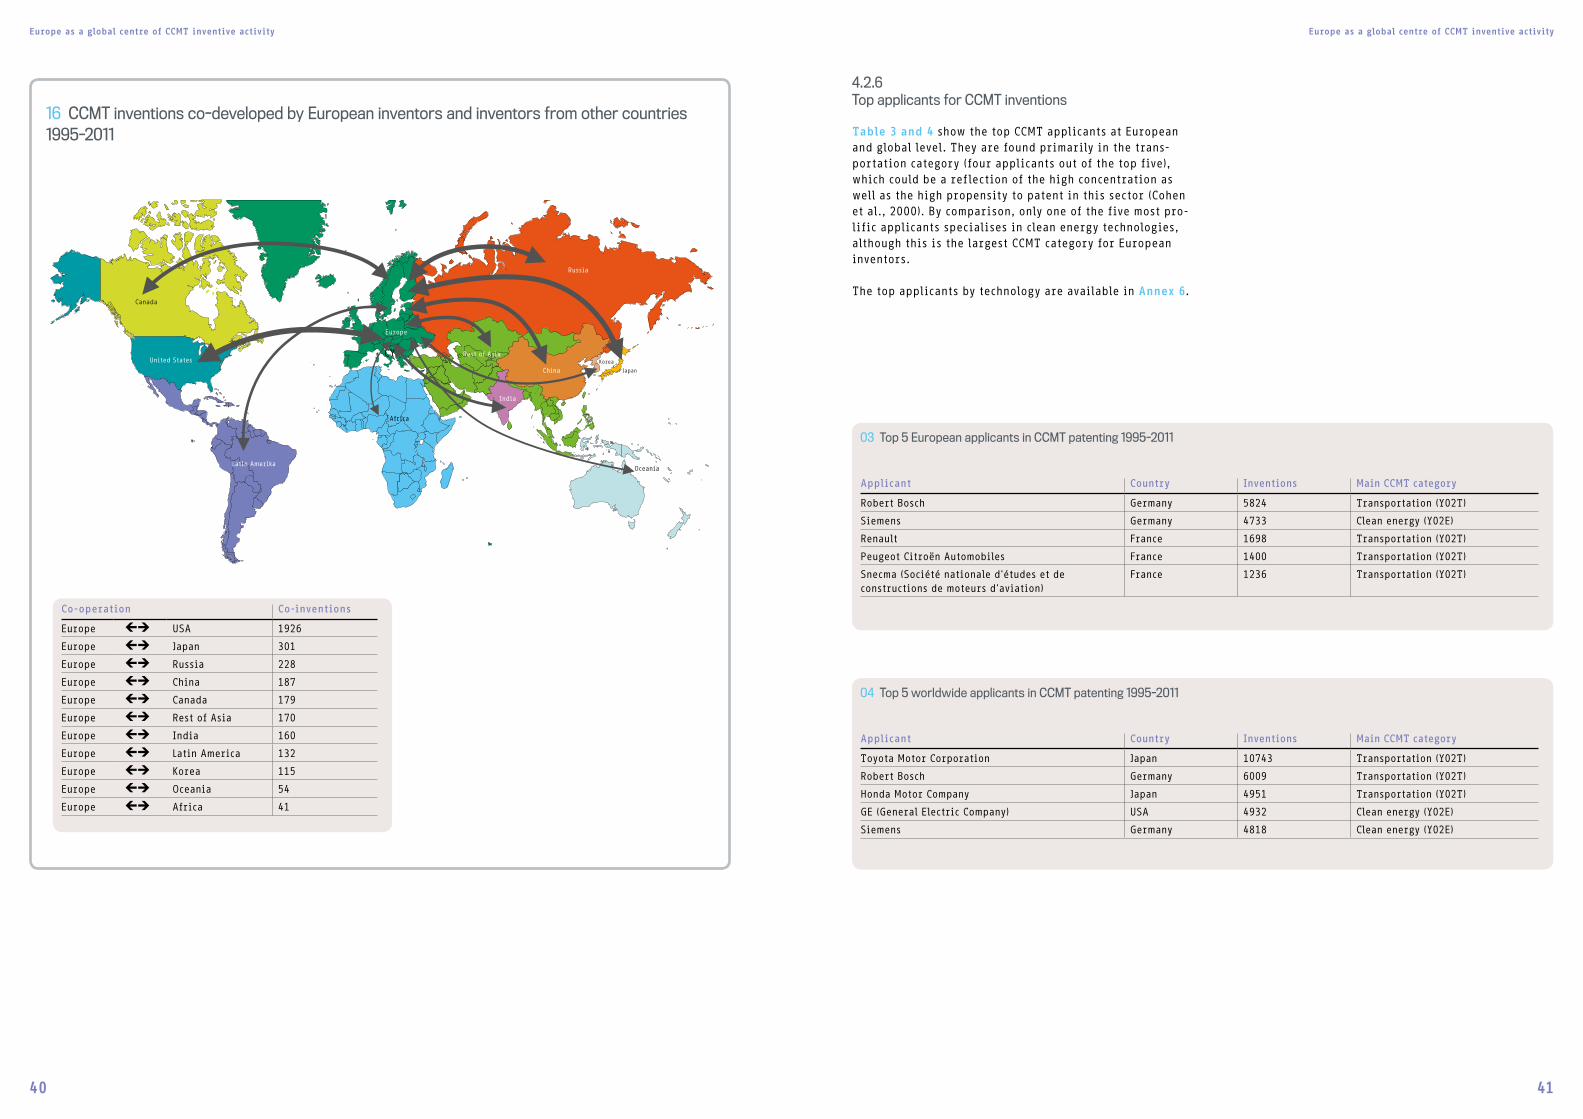
Europe as a global centre of CCMT inventive activity Europe as a global centre of CCMT inventive activity
40 41
4.2.6Top applicants for CCMT inventions
Table 3 and 4 show the top CCMT applicants at European and global level. They are found primarily in the trans-portation category (four applicants out of the top five), which could be a reflection of the high concentration as well as the high propensity to patent in this sector (Cohen et al., 2000). By comparison, only one of the five most pro-lific applicants specialises in clean energy technologies, although this is the largest CCMT category for European inventors.
The top applicants by technology are available in Annex 6.
03 Top 5 European applicants in CCMT patenting 1995-2011
Applicant Country Inventions Main CCMT category
Robert Bosch Germany 5824 Transportation (Y02T)
Siemens Germany 4733 Clean energy (Y02E)
Renault France 1698 Transportation (Y02T)
Peugeot Citroën Automobiles France 1400 Transportation (Y02T)
Snecma (Société nationale d'études et de constructions de moteurs d'aviation)
France 1236 Transportation (Y02T)
04 Top 5 worldwide applicants in CCMT patenting 1995-2011
Applicant Country Inventions Main CCMT category
Toyota Motor Corporation Japan 10743 Transportation (Y02T)
Robert Bosch Germany 6009 Transportation (Y02T)
Honda Motor Company Japan 4951 Transportation (Y02T)
GE (General Electric Company) USA 4932 Clean energy (Y02E)
Siemens Germany 4818 Clean energy (Y02E)
16 CCMT inventions co-developed by European inventors and inventors from other countries 1995-2011
Co-inventions wordwide
Canada
United States
Europe
India
Russia
Japan
Korea
OceaniaLatin Amerika
China
Africa
CY Rest of Asia
From/To/From Coinventions
Europe !1 Africa 41 Europe !1 Canada 179 Europe !1 China 187 Europe !1 India 160 Europe !1 Japan 301 Europe !1 Korea 115 Europe !1 Oceania 54 Europe !1 Rest of America 132Europe !1 Rest of Asia 170Europe !1 Russia 228 Europe !1 USA 1926
Co-operation Co-inventions
Europe !1 USA 1926
Europe !1 Japan 301
Europe !1 Russia 228
Europe !1 China 187
Europe !1 Canada 179
Europe !1 Rest of Asia 170
Europe !1 India 160
Europe !1 Latin America 132
Europe !1 Korea 115
Europe !1 Oceania 54
Europe !1 Africa 41

Europe as a global centre of CCMT inventive activity Europe as a global centre of CCMT inventive activity
42 43
4.3Inventive activity in individual European countries
4.3.1Country comparison
Inventiveness appears highly concentrated within Europe, five countries representing 80% of inventive activity. With almost half of Europe’s CCMT inventions in the most recent period, Germany appears as the clear leader in CCMT, even if other countries are catching up, most notably France, Italy, UK and Spain. Germany’s leadership is apparent in all technologies (Figure 17). Looking at the two technologies with the highest European inventive activity, it appears that in renewable energy Germany’s invention performance is four times greater than that of the second largest inventor country, France (Figure 18). The share of German inventions in road transportation technologies is even higher (Figure 19).
CCMT inventions (1995-2011) for all EPC member and extension states can be found in Annex 7.
17 European CCMT inventions by country 1995-2011
Num
ber
of
inve
ntio
ns
1995 1996 1997 1998 1999 2000 2001 2002 2003 2004 2005 2006 2007 2008 2009 2010 2011
Germany
France
Italy
Spain
UK
Rest of Europe
4000
3000
2000
1000
0
18 European inventions in renewable energy (Y02E10) by country 1995-2011
Num
ber
of
inve
ntio
ns
1995 1996 1997 1998 1999 2000 2001 2002 2003 2004 2005 2006 2007 2008 2009 2010 2011
Germany
France
Italy
Spain
UK
Rest of Europe
1200
1000
800
600
400
200
0
19 European inventions in road transportation (Y02T10) by country 1995-2011
Num
ber
of
inve
ntio
ns
1995 1996 1997 1998 1999 2000 2001 2002 2003 2004 2005 2006 2007 2008 2009 2010 2011
Germany
France
Italy
Spain
UK
Rest of Europe
1500
1000
500
0
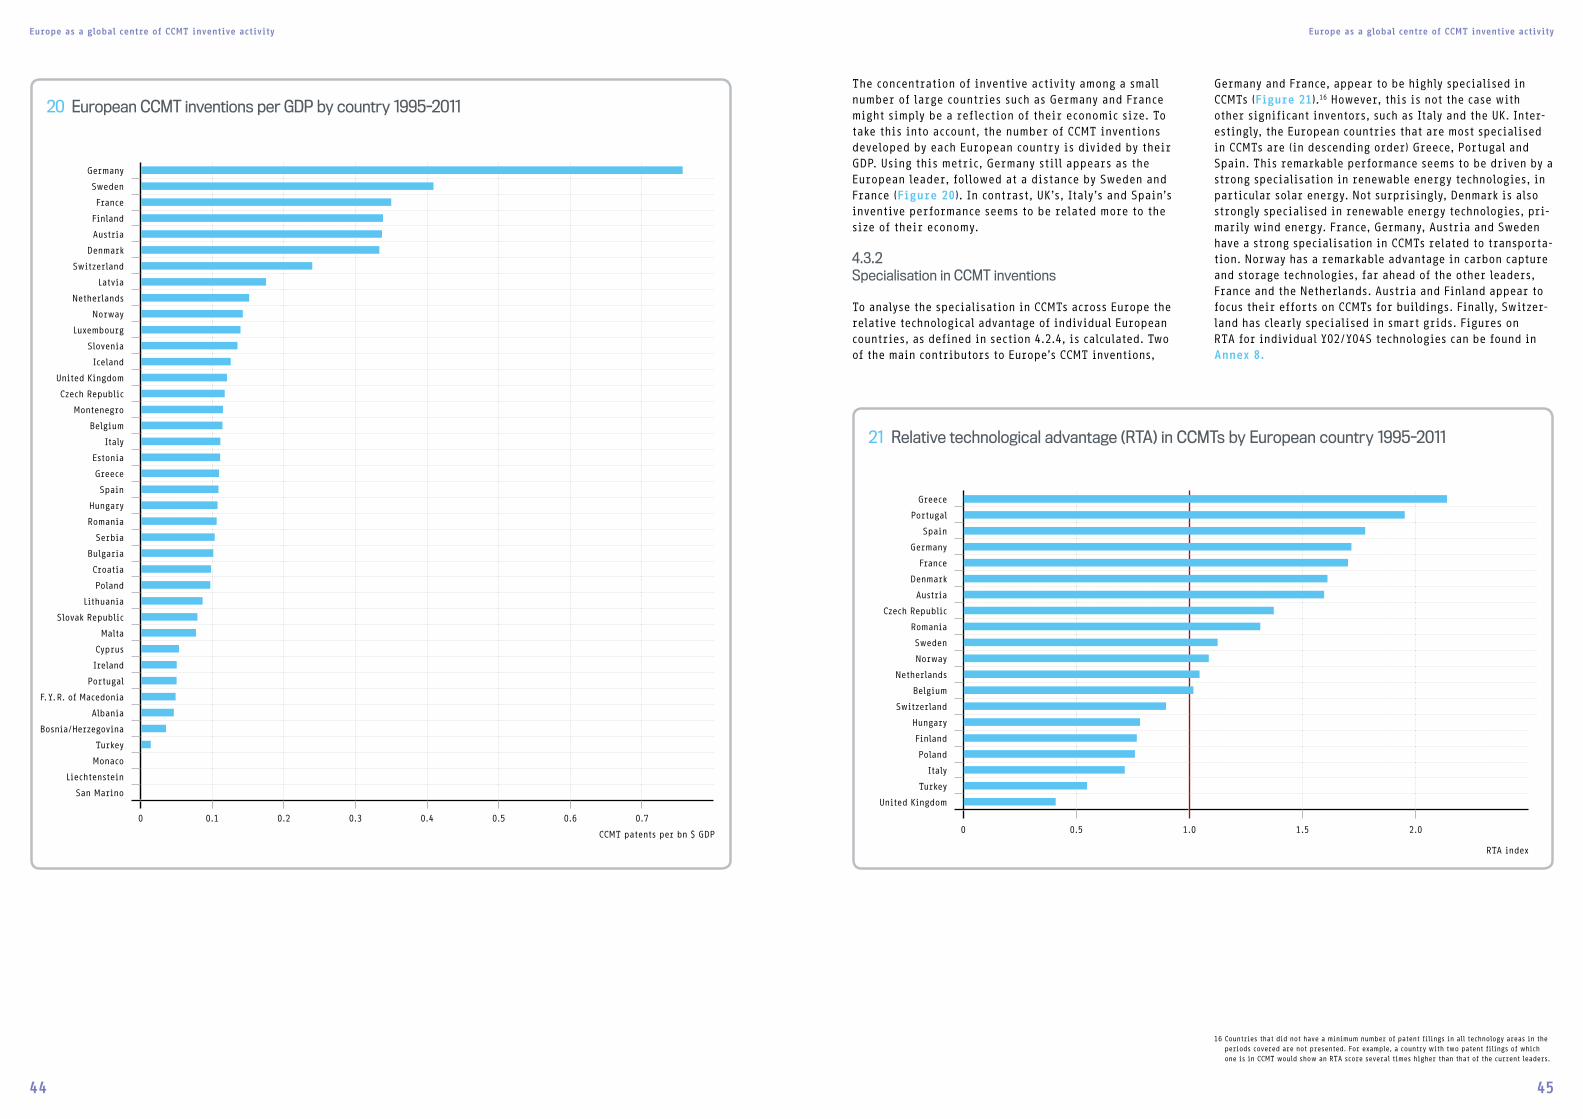
Europe as a global centre of CCMT inventive activity Europe as a global centre of CCMT inventive activity
44 45
The concentration of inventive activity among a small number of large countries such as Germany and France might simply be a reflection of their economic size. To take this into account, the number of CCMT inventions developed by each European country is divided by their GDP. Using this metric, Germany still appears as the European leader, followed at a distance by Sweden and France (Figure 20). In contrast, UK’s, Italy’s and Spain’s inventive performance seems to be related more to the size of their economy.
4.3.2Specialisation in CCMT inventions
To analyse the specialisation in CCMTs across Europe the relative technological advantage of individual European countries, as defined in section 4.2.4, is calculated. Two of the main contributors to Europe’s CCMT inventions,
Germany and France, appear to be highly specialised in CCMTs (Figure 21).16 However, this is not the case with other significant inventors, such as Italy and the UK. Inter-estingly, the European countries that are most specialised in CCMTs are (in descending order) Greece, Portugal and Spain. This remarkable performance seems to be driven by a strong specialisation in renewable energy technologies, in particular solar energy. Not surprisingly, Denmark is also strongly specialised in renewable energy technologies, pri-marily wind energy. France, Germany, Austria and Sweden have a strong specialisation in CCMTs related to transporta-tion. Norway has a remarkable advantage in carbon capture and storage technologies, far ahead of the other leaders, France and the Netherlands. Austria and Finland appear to focus their efforts on CCMTs for buildings. Finally, Switzer-land has clearly specialised in smart grids. Figures on RTA for individual Y02/Y04S technologies can be found in Annex 8.
16 Countries that did not have a minimum number of patent filings in all technology areas in the periods covered are not presented. For example, a country with two patent filings of which one is in CCMT would show an RTA score several times higher than that of the current leaders.
20 European CCMT inventions per GDP by country 1995-2011
0 0.1 0.2 0.3 0.4 0.5 0.6 0.7
Germany
Sweden
France
Finland
Austria
Denmark
Switzerland
Latvia
Netherlands
Norway
Luxembourg
Slovenia
Iceland
United Kingdom
Czech Republic
Montenegro
Belgium
Italy
Estonia
Greece
Spain
Hungary
Romania
Serbia
Bulgaria
Croatia
Poland
Lithuania
Slovak Republic
Malta
Cyprus
Ireland
Portugal
F. Y. R. of Macedonia
Albania
Bosnia/Herzegovina
Turkey
Monaco
Liechtenstein
San Marino
CCMT patents per bn $ GDP
Greece
Portugal
Spain
Germany
France
Denmark
Austria
Czech Republic
Romania
Sweden
Norway
Netherlands
Belgium
Switzerland
Hungary
Finland
Poland
Italy
Turkey
United Kingdom
21 Relative technological advantage (RTA) in CCMTs by European country 1995-2011
RTA index
0 0.5 1.0 1.5 2.0
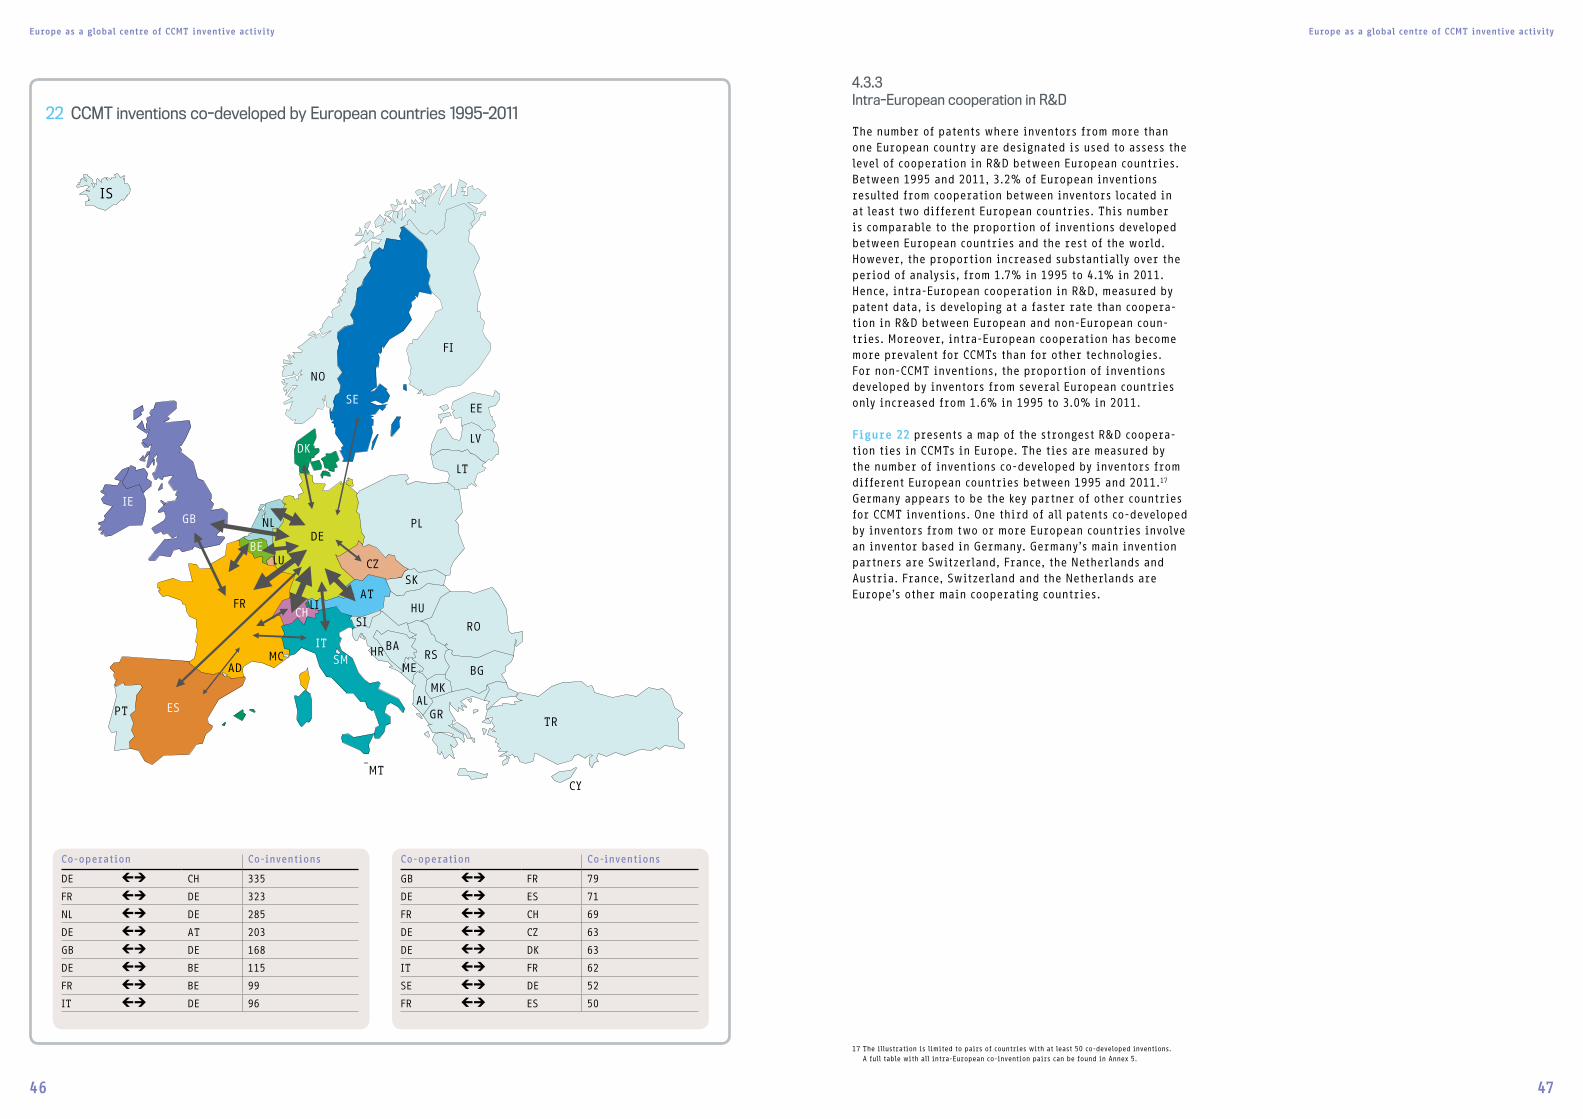
Europe as a global centre of CCMT inventive activity Europe as a global centre of CCMT inventive activity
46 47
4.3.3Intra-European cooperation in R&D
The number of patents where inventors from more than one European country are designated is used to assess the level of cooperation in R&D between European countries. Between 1995 and 2011, 3.2% of European inventions resulted from cooperation between inventors located in at least two different European countries. This number is comparable to the proportion of inventions developed between European countries and the rest of the world. However, the proportion increased substantially over the period of analysis, from 1.7% in 1995 to 4.1% in 2011. Hence, intra-European cooperation in R&D, measured by patent data, is developing at a faster rate than coopera-tion in R&D between European and non-European coun-tries. Moreover, intra-European cooperation has become more prevalent for CCMTs than for other technologies. For non-CCMT inventions, the proportion of inventions developed by inventors from several European countries only increased from 1.6% in 1995 to 3.0% in 2011.
Figure 22 presents a map of the strongest R&D coopera-tion ties in CCMTs in Europe. The ties are measured by the number of inventions co-developed by inventors from different European countries between 1995 and 2011.17 Germany appears to be the key partner of other countries for CCMT inventions. One third of all patents co-developed by inventors from two or more European countries involve an inventor based in Germany. Germany’s main invention partners are Switzerland, France, the Netherlands and Austria. France, Switzerland and the Netherlands are Europe’s other main cooperating countries.
17 The illustration is limited to pairs of countries with at least 50 co-developed inventions. A full table with all intra-European co-invention pairs can be found in Annex 5.
22 CCMT inventions co-developed by European countries 1995-2011
Co-inventions Europe
SE
DK
AT
DE
FR
ES
GB
CZ
NL
LU
CH
IT
BE
PL
LT
LV
SI
HRBA
ME
RO
BGRS
GR
MKAL
NO
FI
EE
IE
PT
SMAD
MC
CY
HU
SK
LI
IS
TR
MT
From/To/From Coinventions
DE !1 AT 203 DE !1 BE 115 DE !1 CH 335 DE !1 CZ 63 DE !1 DK 63 DE !1 ES 71 FR !1 BE 99 FR !1 CH 69
From/To/From Coinventions
FR !1 DE 323FR !1 ES 50 GB !1 DE 168 GB !1 FR 79 IT !1 DE 96 IT !1 FR 62 NL !1 DE 285 SE !1 DE 52
Co-operation Co-inventions
DE !1 CH 335
FR !1 DE 323
NL !1 DE 285
DE !1 AT 203
GB !1 DE 168
DE !1 BE 115
FR !1 BE 99
IT !1 DE 96
Co-operation Co-inventions
GB !1 FR 79
DE !1 ES 71
FR !1 CH 69
DE !1 CZ 63
DE !1 DK 63
IT !1 FR 62
SE !1 DE 52
FR !1 ES 50
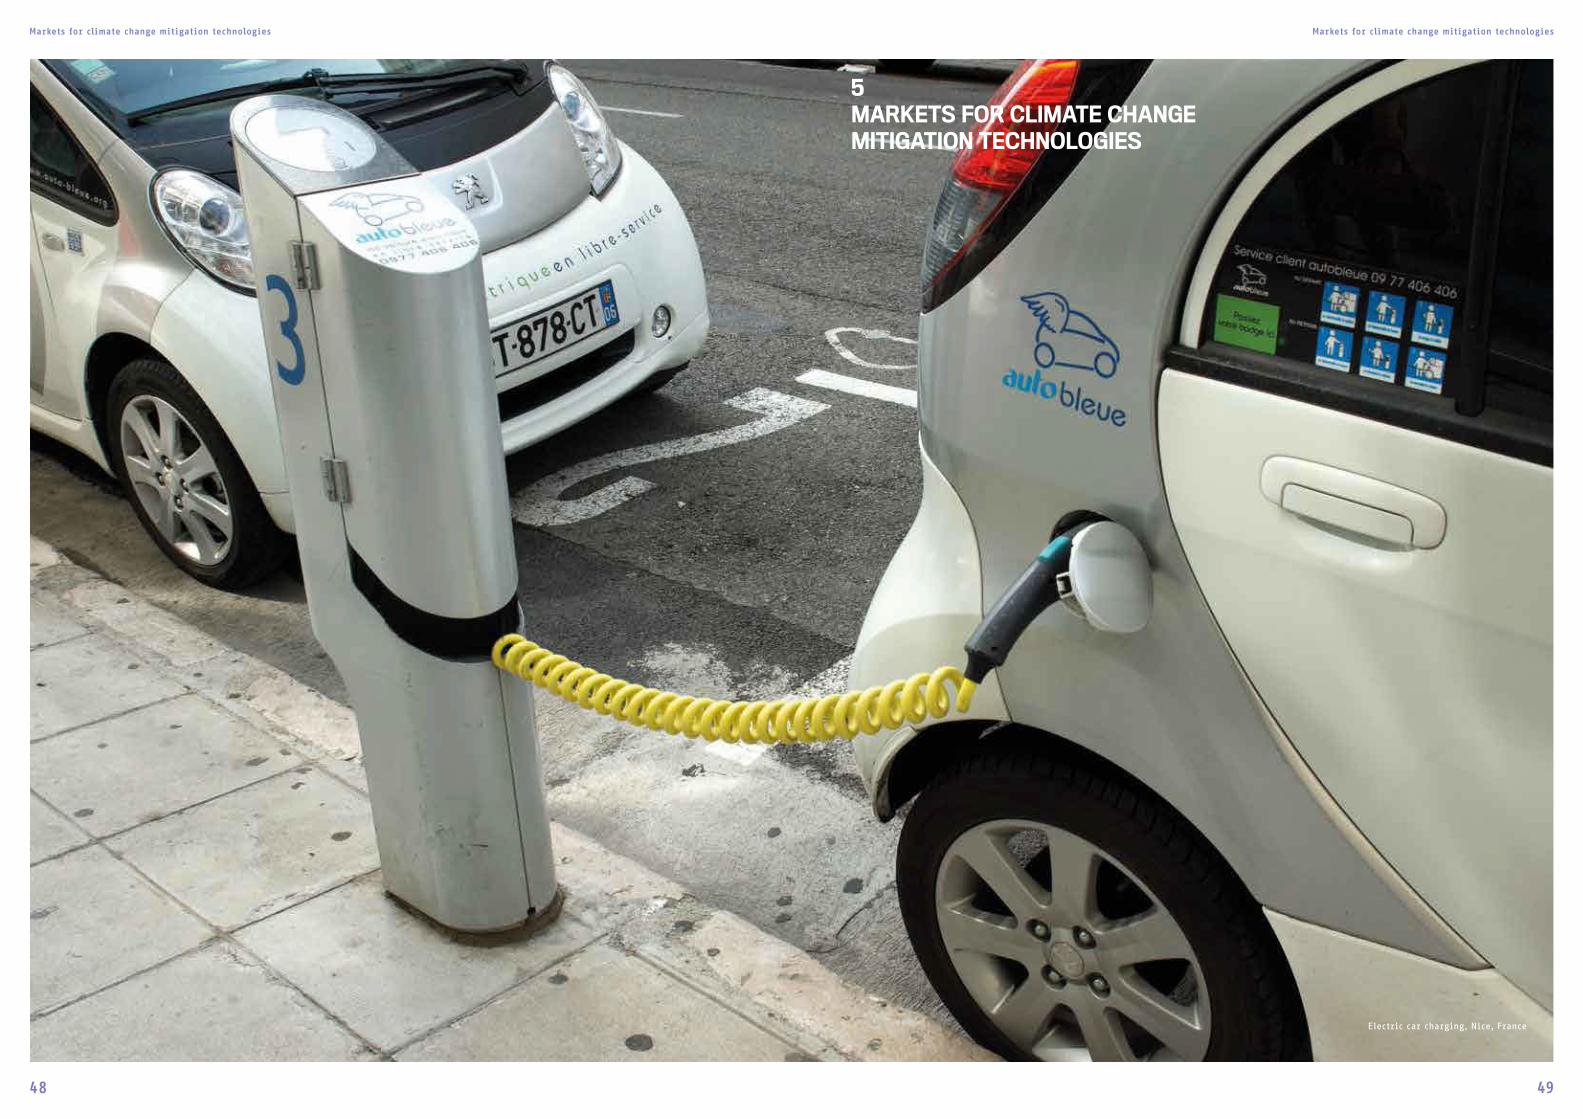
Electric car charging, Nice, France
Markets for climate change mitigation technologies Markets for climate change mitigation technologies
48 49
5MARKETS FOR CLIMATE CHANGE MITIGATION TECHNOLOGIES
Markets for climate change mitigation technologies Markets for climate change mitigation technologies
50 51
5.1Evidence from patent data
5.1.1Europe’s position as a market for CCMT inventions
Figure 23 presents the countries/regions where appli-cants sought patent protection for CCMT inventions over the period 1995-2011. The number of patent applications in CCMTs increased considerably across all regions of
the world. Europe appears as the main destination of CCMT patent filings worldwide, closely followed by Japan. The US is another major recipient of CCMT patent applications, as are China, where the growth rate from 2000 onwards was particularly impressive, and Korea. Other regions appear to be less attractive destinations.
Statistics for the top 25 target countries in patent appli-cations can be found in Annex 9.
This ranking varies considerably across technologies, and specialists interested in a particular area of technology are recommended to perform their own more detailed analysis. As an example, the patent application analyses for photovoltaic energy and wind energy are presented in Figure 24 and Figure 25. Japan is the main destination for photovoltaic energy patent applications, followed by the US, while Europe is the main destination for wind patent applications, far ahead of China in second place. In general, the number of filings in all five regions accelerated immensely from 2006.
5.1.2Key European markets for CCMT inventions
The next graph presents the distribution of granted CCMT patents across the 38 EPC contracting states and the two extension states between 1995 and 2011 (Figure 26). This includes patents granted directly by national IP offices and European patents granted by the EPO. To determine where European patents finally define exclusive rights, data on national validation after grant is used. The first column (EUR) includes all patents granted in Europe, by
23 Patent filings in CCMTs by region 1995-2011
25000
20000
15000
10000
5000
0
1995 1996 1997 1998 1999 2000 2001 2002 2003 2004 2005 2006 2007 2008 2009 2010 2011
Europe
China
USA
Korea
Japan
Rest of the world
Num
ber
of
pat
ent
appl
icat
ions
24 Patent filings in photovoltaic energy (Y02E10/50) by region 1995-2011
1995 1996 1997 1998 1999 2000 2001 2002 2003 2004 2005 2006 2007 2008 2009 2010 2011
Europe
China
USA
Korea
Japan
Rest of the world
4000
3000
2000
1000
0
Num
ber
of
pat
ent
appl
icat
ions
25 Patent filings in wind energy (Y02E10/70) by region 1995-2011
1995 1996 1997 1998 1999 2000 2001 2002 2003 2004 2005 2006 2007 2008 2009 2010 2011
Europe
China
USA
Korea
Japan
Rest of the world
2500
2000
1500
1000
500
0
Num
ber
of
pat
ent
appl
icat
ions
100000
80000
60000
40000
20000
0
EUR DE FR GB ES AT IT SE NL DK CH BE PT FI IE PL GR CZ LU NO TR HU RO SK MC BG SI CY EE LV LT HR IS MT SM MK AL RS
26 Market coverage for granted CCMT patents in Europe 1995-2011
Num
ber
of
gran
ted p
aten
ts
52,1
%
32,7
%
27,
6 %
16,4
%
15,6
%
11,8
%
7,2
%
6,9
%
5,3
%
4,9
%
3,8
%
2,5
%
2,4
%
1,8
%
1,7
%
1,6
%
1,1
%
1,1
%
1,1
%
1,0
%
0,7
%
0,7
%
0,5
%
0,5
%
0,4
%
0,3
%
0,3
%
0,2
%
0,2
%
0,2
%
0,1
%
0,1
%
0,0
%
0,0
%
0,0
%
0,0
%
0,0
%
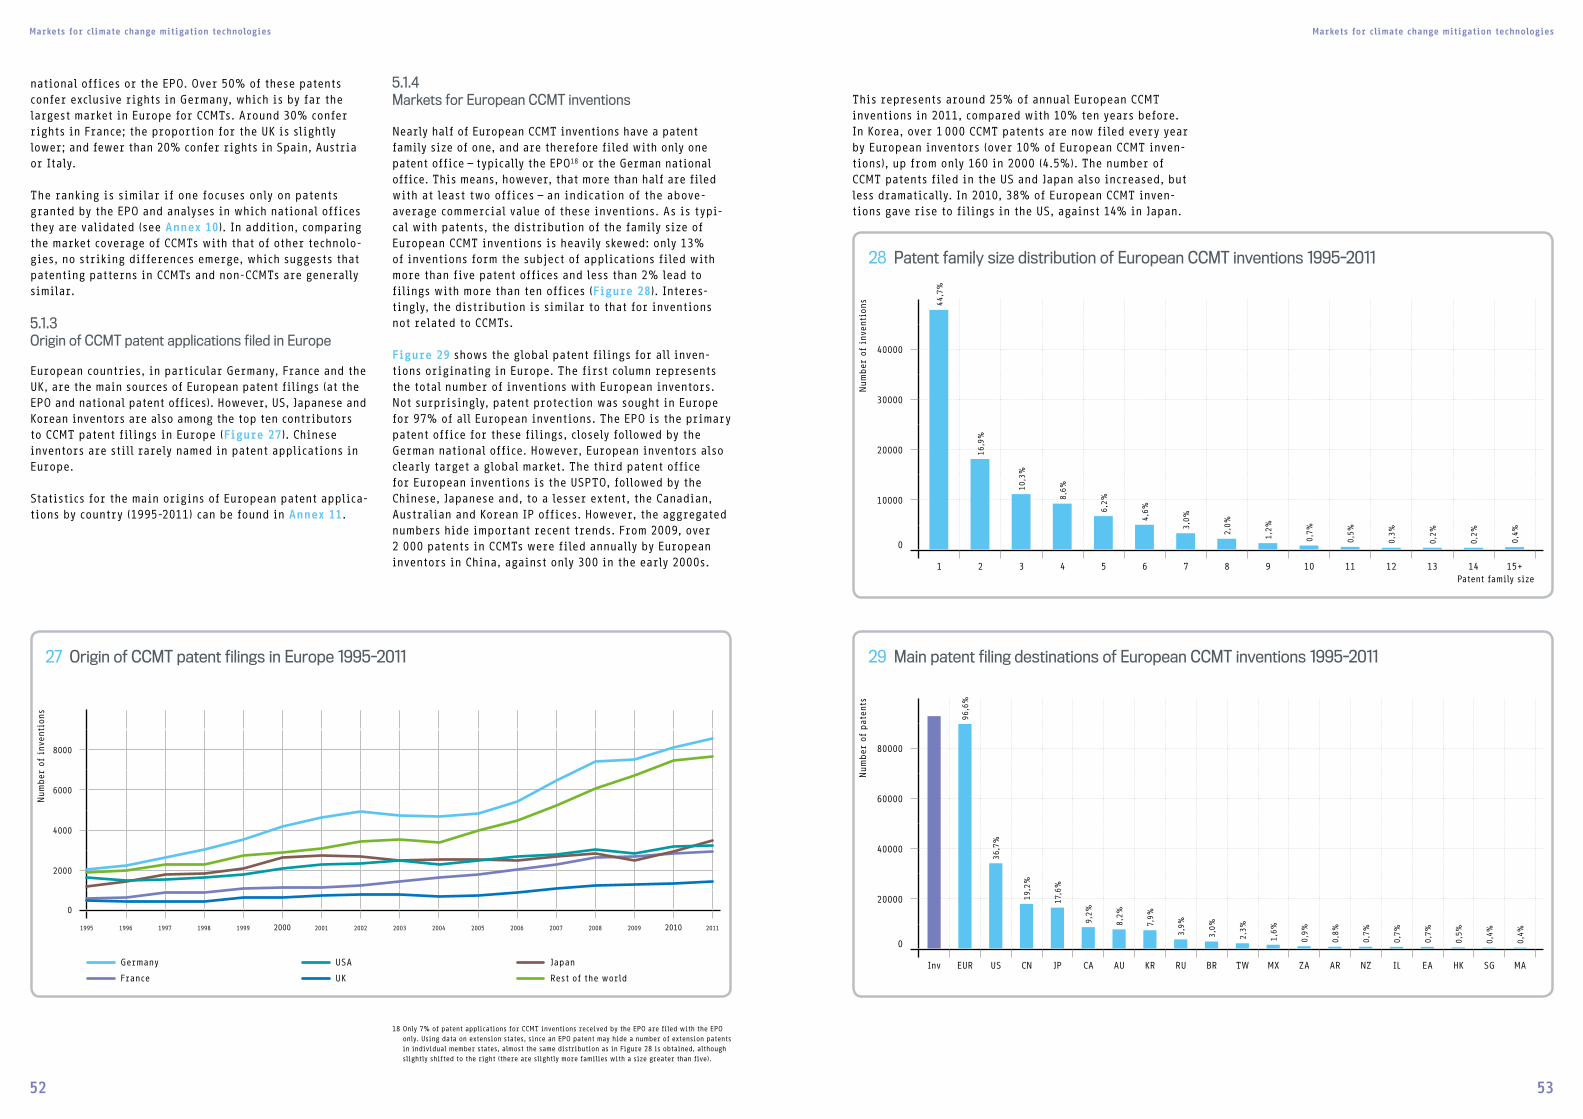
Markets for climate change mitigation technologies Markets for climate change mitigation technologies
52 53
national offices or the EPO. Over 50% of these patents confer exclusive rights in Germany, which is by far the largest market in Europe for CCMTs. Around 30% confer rights in France; the proportion for the UK is slightly lower; and fewer than 20% confer rights in Spain, Austria or Italy.
The ranking is similar if one focuses only on patents granted by the EPO and analyses in which national offices they are validated (see Annex 10). In addition, comparing the market coverage of CCMTs with that of other technolo-gies, no striking differences emerge, which suggests that patenting patterns in CCMTs and non-CCMTs are generally similar.
5.1.3Origin of CCMT patent applications filed in Europe
European countries, in particular Germany, France and the UK, are the main sources of European patent filings (at the EPO and national patent offices). However, US, Japanese and Korean inventors are also among the top ten contributors to CCMT patent filings in Europe (Figure 27). Chinese inventors are still rarely named in patent applications in Europe.
Statistics for the main origins of European patent applica-tions by country (1995-2011) can be found in Annex 11.
5.1.4Markets for European CCMT inventions
Nearly half of European CCMT inventions have a patent family size of one, and are therefore filed with only one patent office – typically the EPO18 or the German national office. This means, however, that more than half are filed with at least two offices – an indication of the above- average commercial value of these inventions. As is typi-cal with patents, the distribution of the family size of European CCMT inventions is heavily skewed: only 13% of inventions form the subject of applications filed with more than five patent offices and less than 2% lead to filings with more than ten offices (Figure 28). Interes-tingly, the distribution is similar to that for inventions not related to CCMTs.
Figure 29 shows the global patent filings for all inven-tions originating in Europe. The first column represents the total number of inventions with European inventors. Not surprisingly, patent protection was sought in Europe for 97% of all European inventions. The EPO is the primary patent office for these filings, closely followed by the German national office. However, European inventors also clearly target a global market. The third patent office for European inventions is the USPTO, followed by the Chinese, Japanese and, to a lesser extent, the Canadian, Australian and Korean IP offices. However, the aggregated numbers hide important recent trends. From 2009, over 2 000 patents in CCMTs were filed annually by European inventors in China, against only 300 in the early 2000s.
This represents around 25% of annual European CCMT inventions in 2011, compared with 10% ten years before. In Korea, over 1 000 CCMT patents are now filed every year by European inventors (over 10% of European CCMT inven-tions), up from only 160 in 2000 (4.5%). The number of CCMT patents filed in the US and Japan also increased, but less dramatically. In 2010, 38% of European CCMT inven-tions gave rise to filings in the US, against 14% in Japan.
18 Only 7% of patent applications for CCMT inventions received by the EPO are filed with the EPO only. Using data on extension states, since an EPO patent may hide a number of extension patents in individual member states, almost the same distribution as in Figure 28 is obtained, although slightly shifted to the right (there are slightly more families with a size greater than five).
80000
60000
40000
20000
0
Inv EUR US CN JP CA AU KR RU BR TW MX ZA AR NZ IL EA HK SG MA
29 Main patent filing destinations of European CCMT inventions 1995-2011
Num
ber
of
pat
ents
27 Origin of CCMT patent filings in Europe 1995-2011
1995 1996 1997 1998 1999 2000 2001 2002 2003 2004 2005 2006 2007 2008 2009 2010 2011
Germany
France
USA
UK
Japan
Rest of the world
8000
6000
4000
2000
0
Num
ber
of
inve
ntio
ns
40000
30000
20000
10000
0
1 2 3 4 5 6 7 8 9 10 11 12 13 14 15+
28 Patent family size distribution of European CCMT inventions 1995-2011
Num
ber
of
inve
ntio
ns
Patent family size
16,9
%
10,3
%
8,6
%
6,2
%
4,6
%
3,0
%
2,0
%
44,7
%
1,2
%
0,7
%
0,5
%
0,3
%
0,2
%
0,2
%
0,4
%
96,6
%
36,7
%
19,2
%
17,6
%
9,2%
8,2
%
7,9%
3,9
%
3,0
%
2,3
%
1,6
%
0,9
%
0,8
%
0,7
%
0,7
%
0,7
%
0,5
%
0,4
%
0,4
%
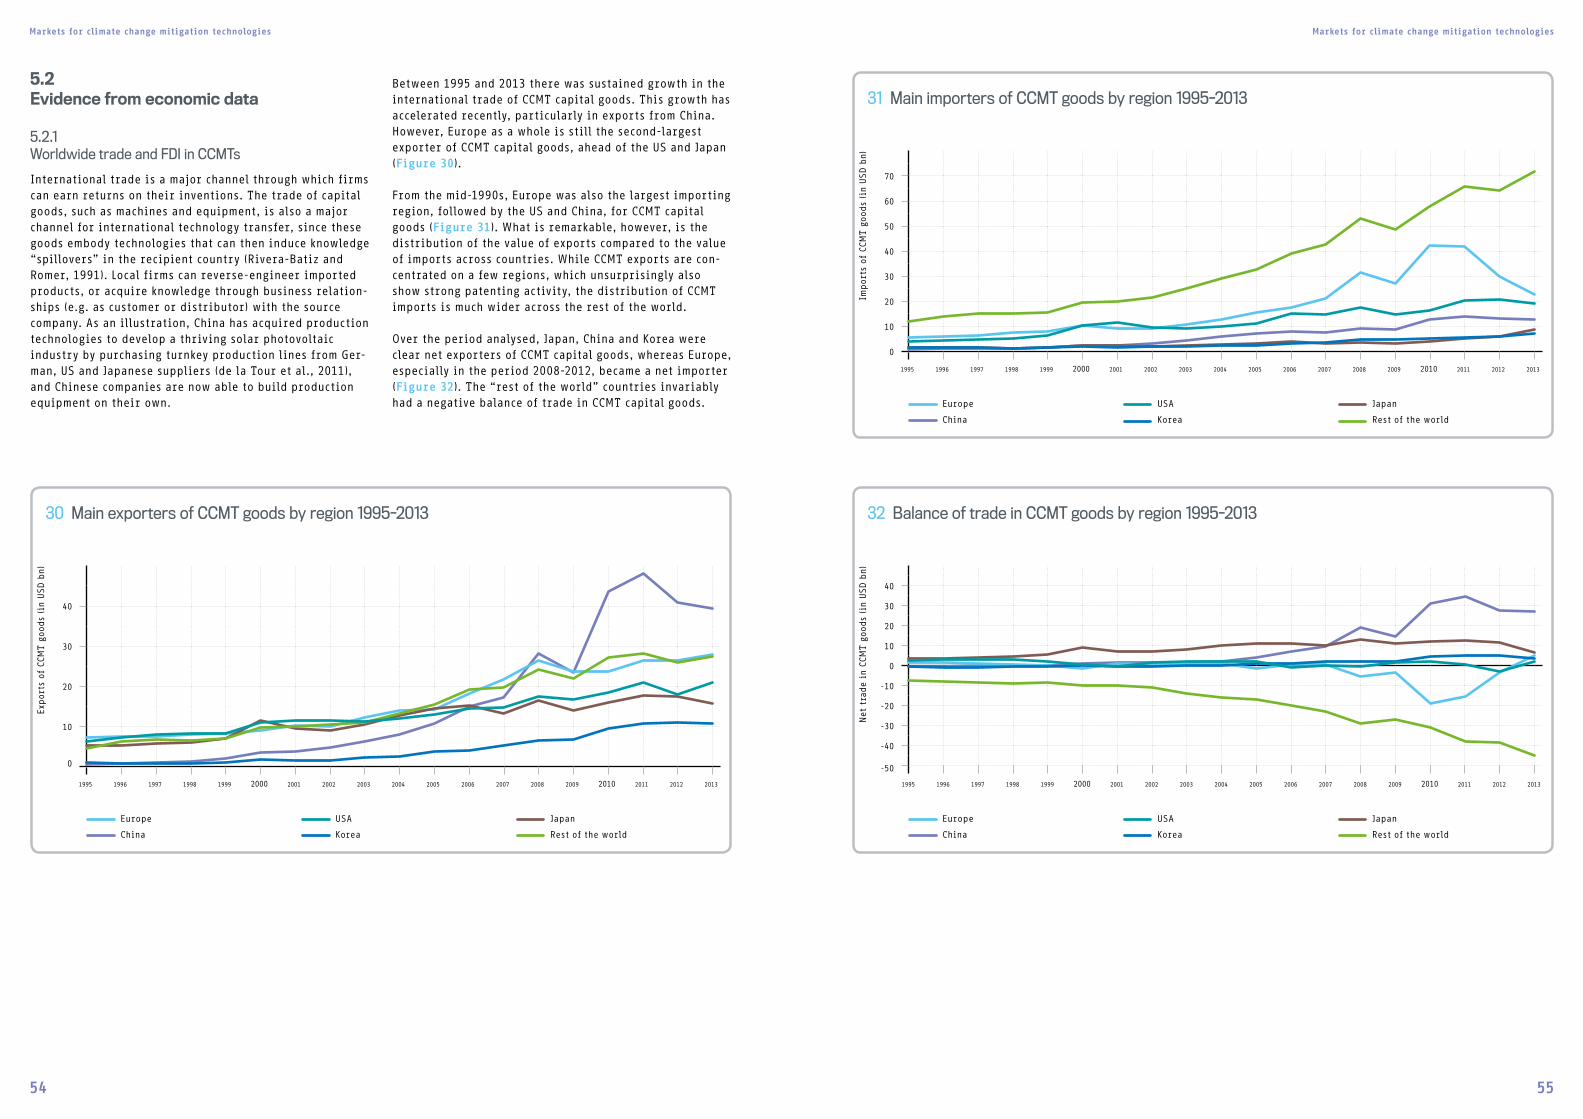
Markets for climate change mitigation technologies Markets for climate change mitigation technologies
54 55
5.2Evidence from economic data 5.2.1Worldwide trade and FDI in CCMTs
International trade is a major channel through which firms can earn returns on their inventions. The trade of capital goods, such as machines and equipment, is also a major channel for international technology transfer, since these goods embody technologies that can then induce knowledge “spillovers” in the recipient country (Rivera-Batiz and Romer, 1991). Local firms can reverse-engineer imported products, or acquire knowledge through business relation-ships (e.g. as customer or distributor) with the source company. As an illustration, China has acquired production technologies to develop a thriving solar photovoltaic industry by purchasing turnkey production lines from Ger-man, US and Japanese suppliers (de la Tour et al., 2011), and Chinese companies are now able to build production equipment on their own.
Between 1995 and 2013 there was sustained growth in the international trade of CCMT capital goods. This growth has accelerated recently, particularly in exports from China. However, Europe as a whole is still the second-largest exporter of CCMT capital goods, ahead of the US and Japan (Figure 30).
From the mid-1990s, Europe was also the largest importing region, followed by the US and China, for CCMT capital goods (Figure 31). What is remarkable, however, is the distribution of the value of exports compared to the value of imports across countries. While CCMT exports are con-centrated on a few regions, which unsurprisingly also show strong patenting activity, the distribution of CCMT imports is much wider across the rest of the world.
Over the period analysed, Japan, China and Korea were clear net exporters of CCMT capital goods, whereas Europe, especially in the period 2008-2012, became a net importer (Figure 32). The “rest of the world” countries invariably had a negative balance of trade in CCMT capital goods.
31 Main importers of CCMT goods by region 1995-2013
1995 1996 1997 1998 1999 2000 2001 2002 2003 2004 2005 2006 2007 2008 2009 2010 2011 2012 2013
Europe
China
USA
Korea
Japan
Rest of the world
70
60
50
40
30
20
10
0
Impor
ts o
f CC
MT g
oods
(in
USD
bn)
32 Balance of trade in CCMT goods by region 1995-2013
1995 1996 1997 1998 1999 2000 2001 2002 2003 2004 2005 2006 2007 2008 2009 2010 2011 2012 2013
Europe
China
USA
Korea
Japan
Rest of the world
40
30
20
10
0
-10
-20
-30
-40
-50
Net
tra
de
in C
CMT g
oods
(in
USD
bn)
30 Main exporters of CCMT goods by region 1995-2013
1995 1996 1997 1998 1999 2000 2001 2002 2003 2004 2005 2006 2007 2008 2009 2010 2011 2012 2013
Europe
China
USA
Korea
Japan
Rest of the world
40
30
20
10
0
Expor
ts o
f CC
MT g
oods
(in
USD
bn)
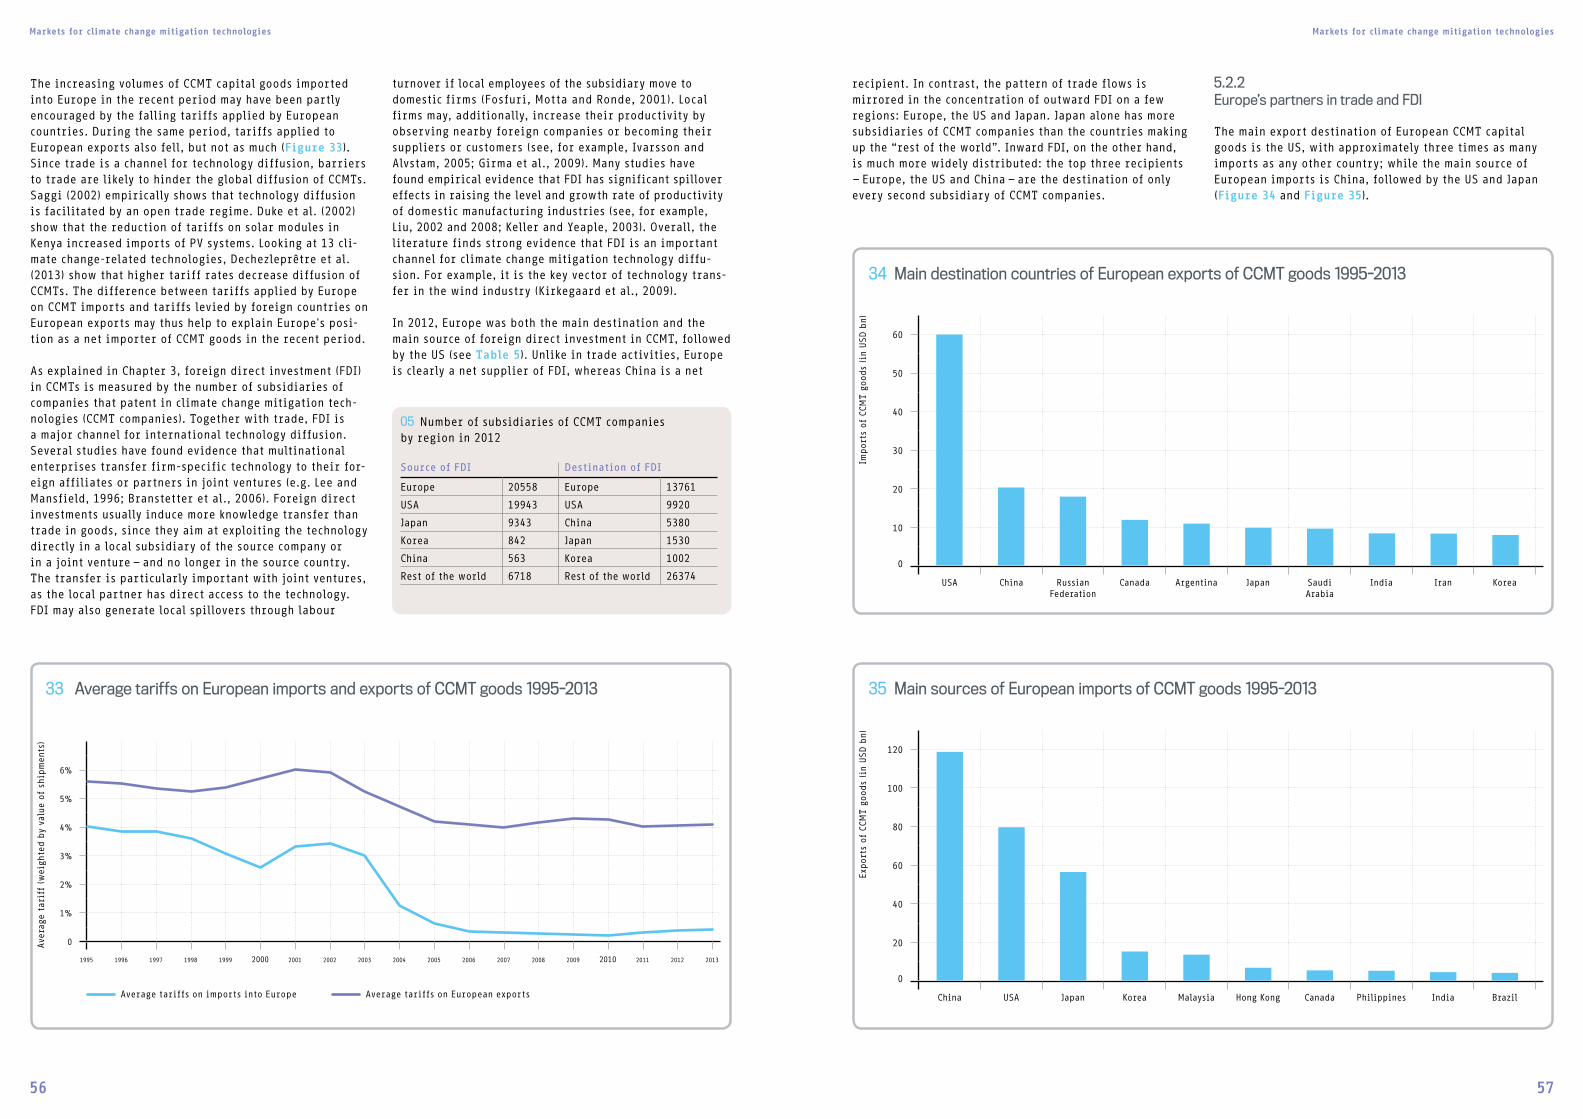
Markets for climate change mitigation technologies Markets for climate change mitigation technologies
56 57
The increasing volumes of CCMT capital goods imported into Europe in the recent period may have been partly encouraged by the falling tariffs applied by European countries. During the same period, tariffs applied to European exports also fell, but not as much (Figure 33). Since trade is a channel for technology diffusion, barriers to trade are likely to hinder the global diffusion of CCMTs. Saggi (2002) empirically shows that technology diffusion is facilitated by an open trade regime. Duke et al. (2002) show that the reduction of tariffs on solar modules in Kenya increased imports of PV systems. Looking at 13 cli-mate change-related technologies, Dechezleprêtre et al. (2013) show that higher tariff rates decrease diffusion of CCMTs. The difference between tariffs applied by Europe on CCMT imports and tariffs levied by foreign countries on European exports may thus help to explain Europe's posi-tion as a net importer of CCMT goods in the recent period.
As explained in Chapter 3, foreign direct investment (FDI) in CCMTs is measured by the number of subsidiaries of companies that patent in climate change mitigation tech-nologies (CCMT companies). Together with trade, FDI is a major channel for international technology diffusion. Several studies have found evidence that multinational enterprises transfer firm-specific technology to their for-eign affiliates or partners in joint ventures (e.g. Lee and Mansfield, 1996; Branstetter et al., 2006). Foreign direct investments usually induce more knowledge transfer than trade in goods, since they aim at exploiting the technology directly in a local subsidiary of the source company or in a joint venture – and no longer in the source country. The transfer is particularly important with joint ventures, as the local partner has direct access to the technology. FDI may also generate local spillovers through labour
turnover if local employees of the subsidiary move to domestic firms (Fosfuri, Motta and Ronde, 2001). Local firms may, additionally, increase their productivity by observing nearby foreign companies or becoming their suppliers or customers (see, for example, Ivarsson and Alvstam, 2005; Girma et al., 2009). Many studies have found empirical evidence that FDI has significant spillover effects in raising the level and growth rate of productivity of domestic manufacturing industries (see, for example, Liu, 2002 and 2008; Keller and Yeaple, 2003). Overall, the literature finds strong evidence that FDI is an important channel for climate change mitigation technology diffu-sion. For example, it is the key vector of technology trans-fer in the wind industry (Kirkegaard et al., 2009).
In 2012, Europe was both the main destination and the main source of foreign direct investment in CCMT, followed by the US (see Table 5). Unlike in trade activities, Europe is clearly a net supplier of FDI, whereas China is a net
5.2.2Europe’s partners in trade and FDI
The main export destination of European CCMT capital goods is the US, with approximately three times as many imports as any other country; while the main source of European imports is China, followed by the US and Japan (Figure 34 and Figure 35).
recipient. In contrast, the pattern of trade flows is mirrored in the concentration of outward FDI on a few regions: Europe, the US and Japan. Japan alone has more subsidiaries of CCMT companies than the countries making up the “rest of the world”. Inward FDI, on the other hand, is much more widely distributed: the top three recipients – Europe, the US and China – are the destination of only every second subsidiary of CCMT companies.
05 Number of subsidiaries of CCMT companies by region in 2012
Source of FDI Destination of FDI
Europe 20558 Europe 13761
USA 19943 USA 9920
Japan 9343 China 5380
Korea 842 Japan 1530
China 563 Korea 1002
Rest of the world 6718 Rest of the world 26374
33 Average tariffs on European imports and exports of CCMT goods 1995-2013
6%
5%
4%
3%
2%
1%
0Ave
rage
tar
iff
(wei
ghte
d b
y va
lue
of s
hipm
ents
)
1995 1996 1997 1998 1999 2000 2001 2002 2003 2004 2005 2006 2007 2008 2009 2010 2011 2012 2013
Average tariffs on imports into Europe Average tariffs on European exports
120
100
80
60
40
20
0
China USA Japan Korea Malaysia Hong Kong Canada Philippines India Brazil
35 Main sources of European imports of CCMT goods 1995-2013
Expor
ts o
f CC
MT g
oods
(in
USD
bn)
60
50
40
30
20
10
0
USA China Russian Federation
Canada Argentina Japan Saudi Arabia
India Iran Korea
34 Main destination countries of European exports of CCMT goods 1995-2013
Impor
ts o
f CC
MT g
oods
(in
USD
bn)
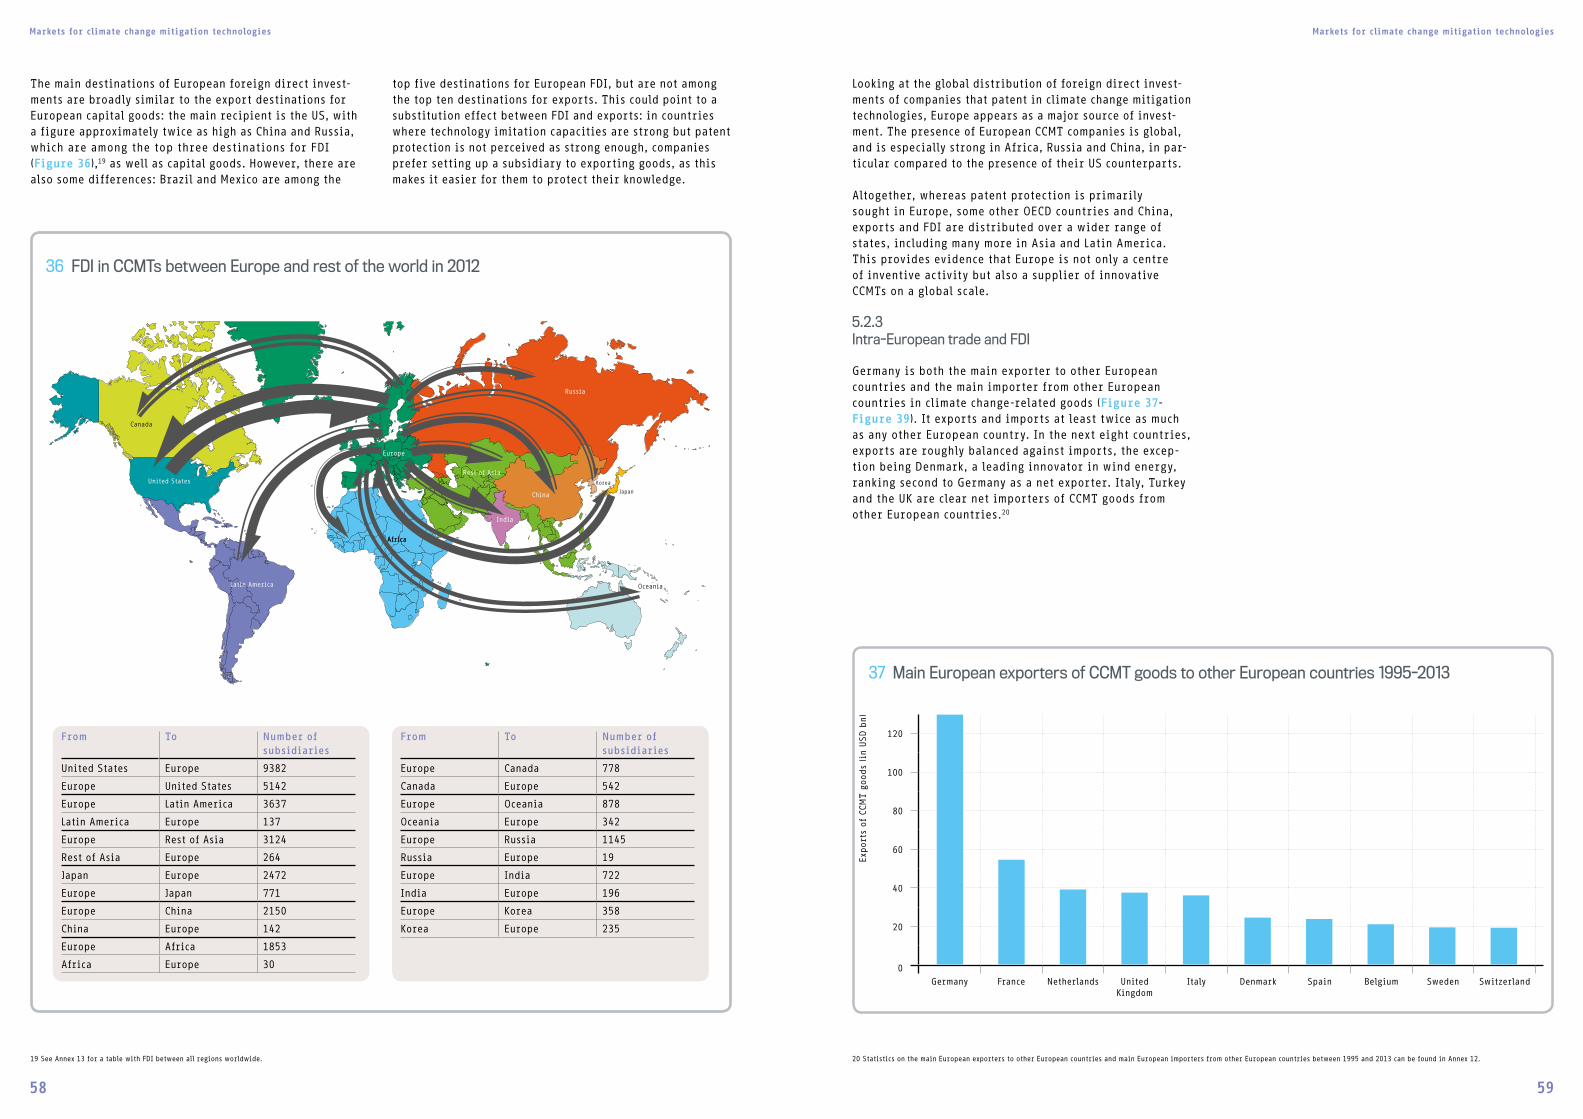
Markets for climate change mitigation technologies Markets for climate change mitigation technologies
58 59
The main destinations of European foreign direct invest-ments are broadly similar to the export destinations for European capital goods: the main recipient is the US, with a figure approximately twice as high as China and Russia, which are among the top three destinations for FDI (Figure 36),19 as well as capital goods. However, there are also some differences: Brazil and Mexico are among the
Looking at the global distribution of foreign direct invest-ments of companies that patent in climate change mitigation technologies, Europe appears as a major source of invest-ment. The presence of European CCMT companies is global, and is especially strong in Africa, Russia and China, in par-ticular compared to the presence of their US counterparts.
Altogether, whereas patent protection is primarily sought in Europe, some other OECD countries and China, exports and FDI are distributed over a wider range of states, including many more in Asia and Latin America. This provides evidence that Europe is not only a centre of inventive activity but also a supplier of innovative CCMTs on a global scale.
5.2.3Intra-European trade and FDI
Germany is both the main exporter to other European countries and the main importer from other European countries in climate change-related goods (Figure 37- Figure 39). It exports and imports at least twice as much as any other European country. In the next eight countries, exports are roughly balanced against imports, the excep-tion being Denmark, a leading innovator in wind energy, ranking second to Germany as a net exporter. Italy, Turkey and the UK are clear net importers of CCMT goods from other European countries.20
top five destinations for European FDI, but are not among the top ten destinations for exports. This could point to a substitution effect between FDI and exports: in countries where technology imitation capacities are strong but patent protection is not perceived as strong enough, companies prefer setting up a subsidiary to exporting goods, as this makes it easier for them to protect their knowledge.
19 See Annex 13 for a table with FDI between all regions worldwide. 20 Statistics on the main European exporters to other European countries and main European importers from other European countries between 1995 and 2013 can be found in Annex 12.
36 FDI in CCMTs between Europe and rest of the world in 2012
Subsidiaries worldwide
Canada
United States
Europe
India
Russia
Japan
Korea
OceaniaLatin America
China
Africa
From To Subsidiaries
USA Europe 9382Europe USA 5142Europe Rest of America 3637Rest of America Europe 137Europe Rest of Asia 3124Rest of Asia Europe 264Japan Europe 2472Europe Japan 771Europe China 2150China Europe 142Europe Africa 1853Africa Europe 30
From To Subsidiaries
Europe Canada 778Canada Europe 542Europe Oceania 878Oceania Europe 342Europe Russia 1145Russia Europe 19Europe India 722India Europe 196Europe Korea 358Korea Europe 235
Africa
Rest of Asia
120
100
80
60
40
20
0
Germany France Netherlands United Kingdom
Italy Denmark Spain Belgium Sweden Switzerland
37 Main European exporters of CCMT goods to other European countries 1995-2013
Expor
ts o
f CC
MT g
oods
(in
USD
bn)
From To Number of subsidiaries
United States Europe 9382
Europe United States 5142
Europe Latin America 3637
Latin America Europe 137
Europe Rest of Asia 3124
Rest of Asia Europe 264
Japan Europe 2472
Europe Japan 771
Europe China 2150
China Europe 142
Europe Africa 1853
Africa Europe 30
From To Number of subsidiaries
Europe Canada 778
Canada Europe 542
Europe Oceania 878
Oceania Europe 342
Europe Russia 1145
Russia Europe 19
Europe India 722
India Europe 196
Europe Korea 358
Korea Europe 235
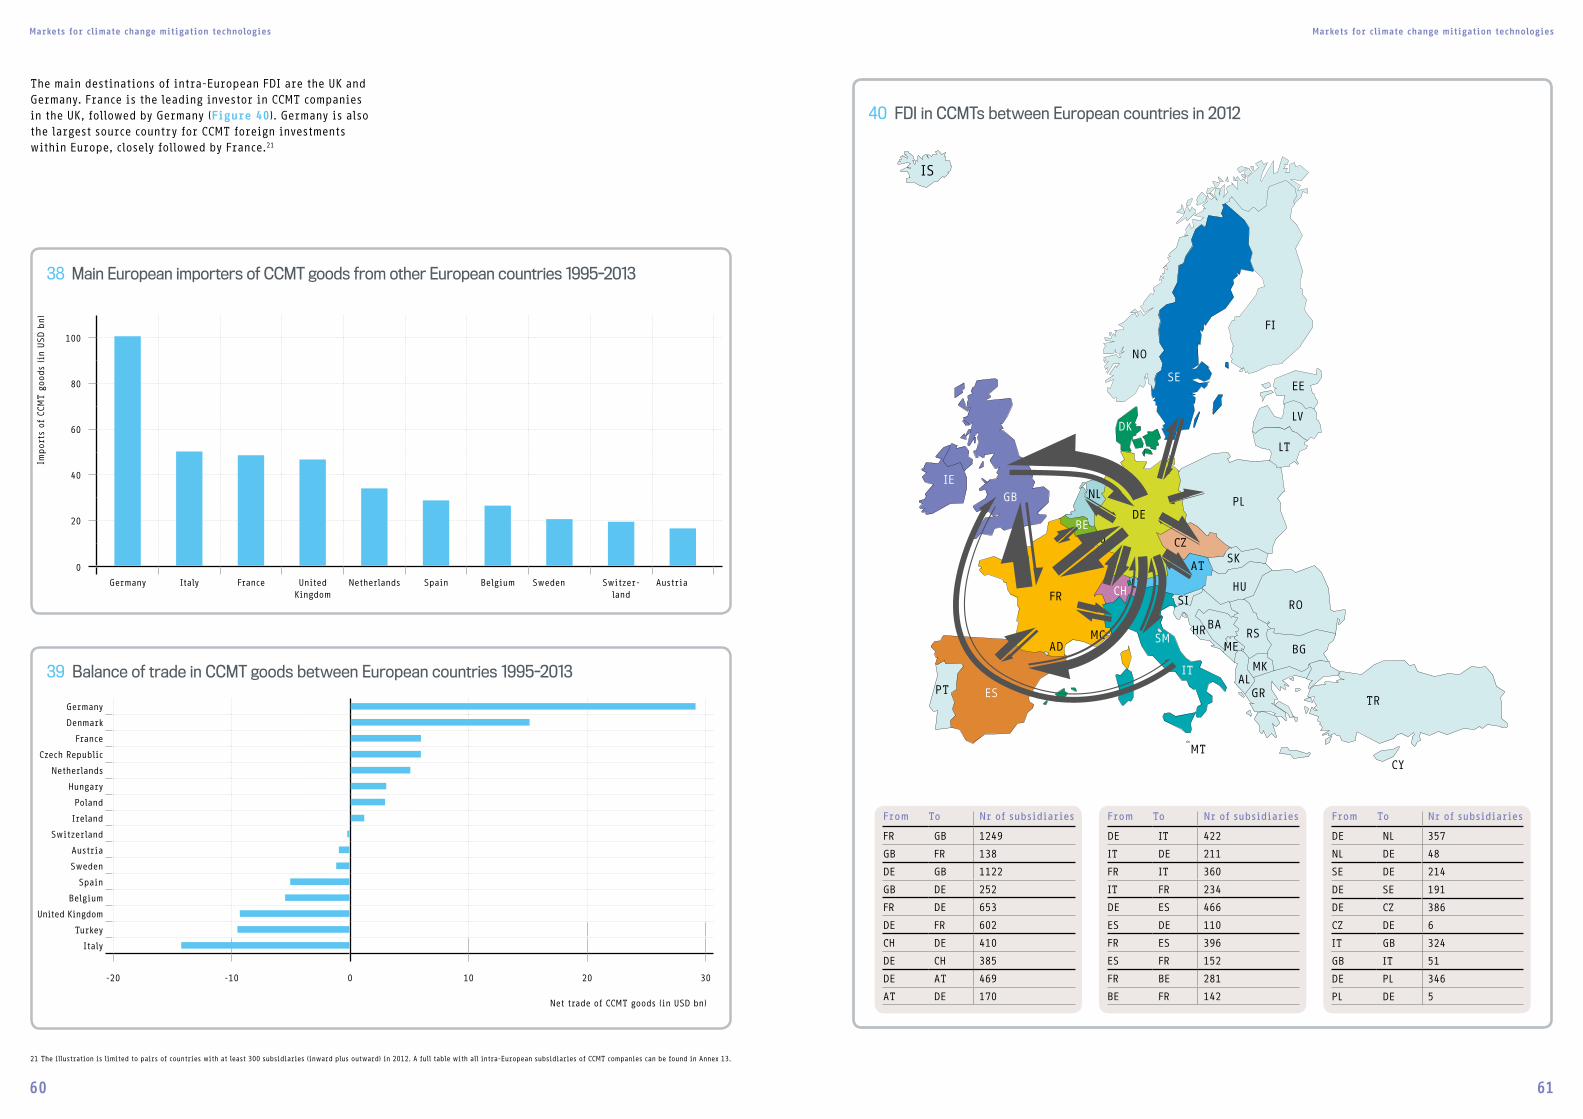
Markets for climate change mitigation technologies Markets for climate change mitigation technologies
60 61
The main destinations of intra-European FDI are the UK and Germany. France is the leading investor in CCMT companies in the UK, followed by Germany (Figure 40). Germany is also the largest source country for CCMT foreign investments within Europe, closely followed by France.21
21 The illustration is limited to pairs of countries with at least 300 subsidiaries (inward plus outward) in 2012. A full table with all intra-European subsidiaries of CCMT companies can be found in Annex 13.
39 Balance of trade in CCMT goods between European countries 1995-2013
-20 -10 0 10 20 30
Germany
Denmark
France
Czech Republic
Netherlands
Hungary
Poland
Ireland
Switzerland
Austria
Sweden
Spain
Belgium
United Kingdom
Turkey
Italy
Net trade of CCMT goods (in USD bn)
40 FDI in CCMTs between European countries in 2012
Subsidiaries Europe
SE
DK
AT
DE
FR
ES
GB
CZ
NL
LU
CH
IT
BE
PL
LT
LV
SI
HRBA
ME
RO
BGRS
GR
MKAL
NO
FI
EE
IE
PT
SMAD
MC
CY
HU
SK
LI
IS
TR
MT
From To Subsidiaries
FR GB 1249GB FR 138DE GB 1122GB DE 252FR DE 653DE FR 602CH DE 410DE CH 385DE AT 469AT DE 170DE IT 422IT DE 211FR IT 360IT FR 234DE ES 466ES DE 110
From To Subsidiaries
FR ES 396ES FR 152FR BE 281BE FR 142DE NL 357NL DE 48SE DE 214DE SE 191DE CZ 386CZ DE 6IT GB 324GB IT 51DE PL 346PL DE 5
From To Nr of subsidiaries
FR GB 1249
GB FR 138
DE GB 1122
GB DE 252
FR DE 653
DE FR 602
CH DE 410
DE CH 385
DE AT 469
AT DE 170
100
80
60
40
20
0
Germany Italy France United Kingdom
Netherlands Spain Belgium Sweden Switzer- land
Austria
38 Main European importers of CCMT goods from other European countries 1995-2013
Impor
ts o
f CC
MT g
oods
(in
USD
bn)
From To Nr of subsidiaries
DE IT 422
IT DE 211
FR IT 360
IT FR 234
DE ES 466
ES DE 110
FR ES 396
ES FR 152
FR BE 281
BE FR 142
From To Nr of subsidiaries
DE NL 357
NL DE 48
SE DE 214
DE SE 191
DE CZ 386
CZ DE 6
IT GB 324
GB IT 51
DE PL 346
PL DE 5
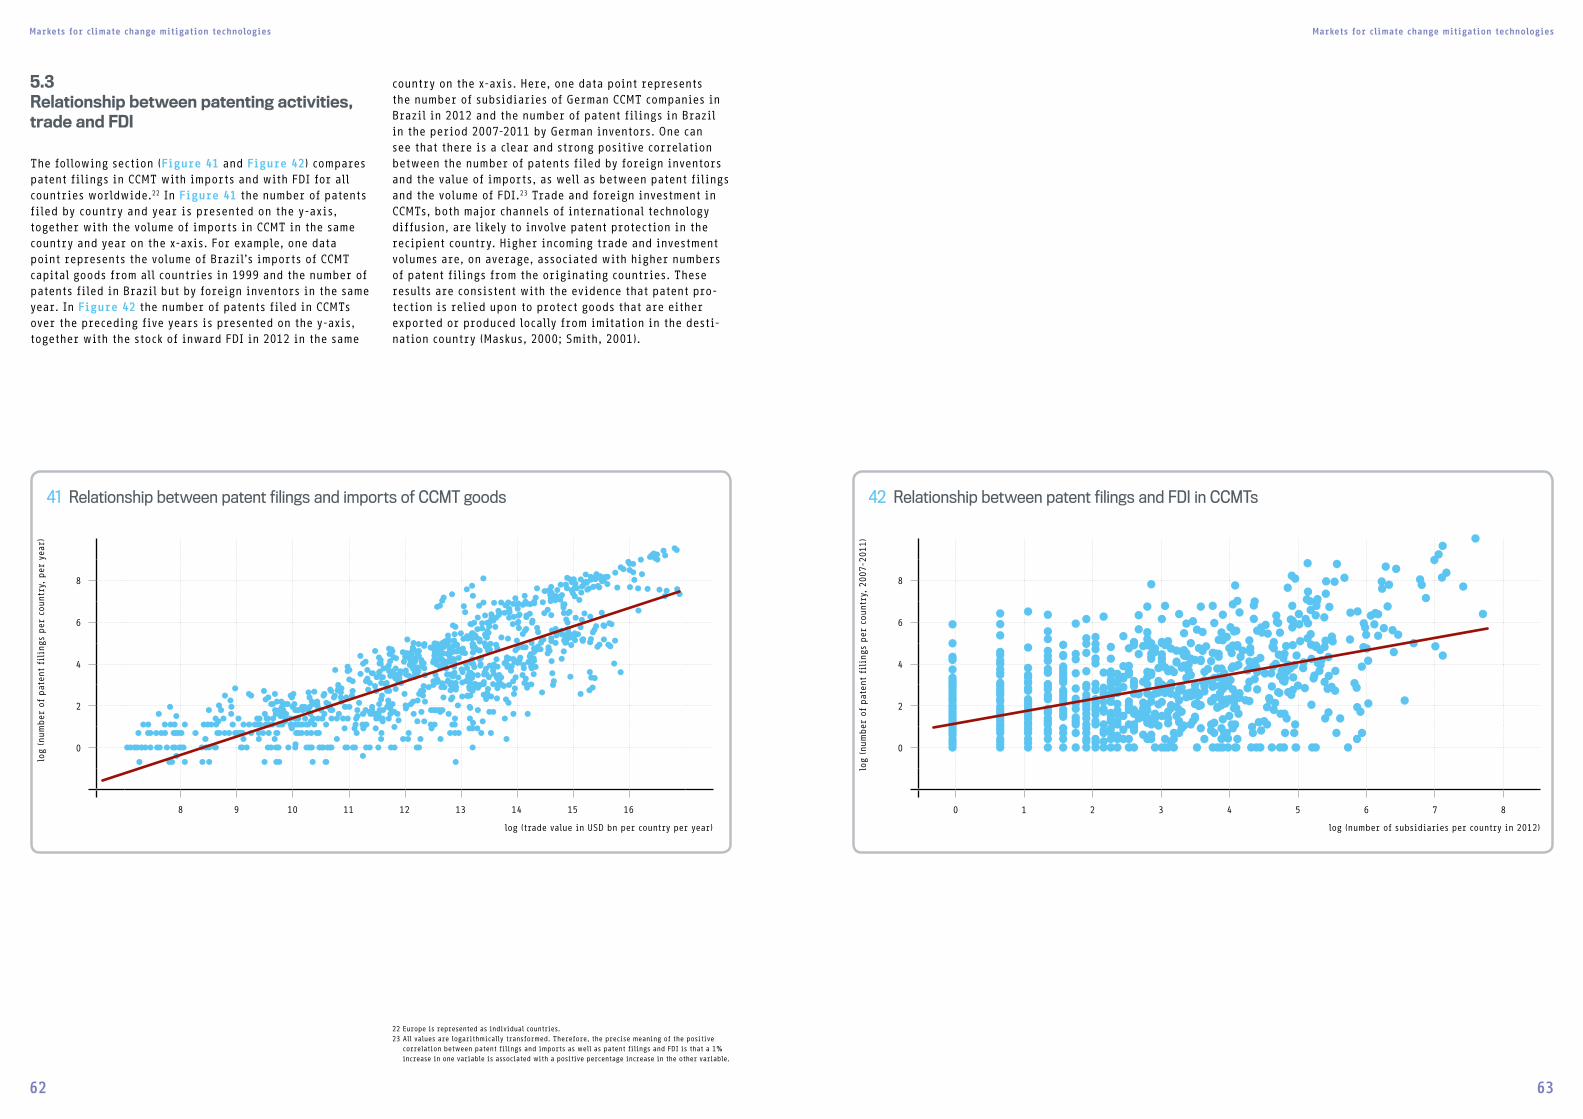
Markets for climate change mitigation technologies Markets for climate change mitigation technologies
62 63
country on the x-axis. Here, one data point represents the number of subsidiaries of German CCMT companies in Brazil in 2012 and the number of patent filings in Brazil in the period 2007-2011 by German inventors. One can see that there is a clear and strong positive correlation between the number of patents filed by foreign inventors and the value of imports, as well as between patent filings and the volume of FDI.23 Trade and foreign investment in CCMTs, both major channels of international technology diffusion, are likely to involve patent protection in the recipient country. Higher incoming trade and investment volumes are, on average, associated with higher numbers of patent filings from the originating countries. These results are consistent with the evidence that patent pro-tection is relied upon to protect goods that are either exported or produced locally from imitation in the desti-nation country (Maskus, 2000; Smith, 2001).
5.3Relationship between patenting activities, trade and FDI
The following section (Figure 41 and Figure 42) compares patent filings in CCMT with imports and with FDI for all countries worldwide.22 In Figure 41 the number of patents filed by country and year is presented on the y-axis, together with the volume of imports in CCMT in the same country and year on the x-axis. For example, one data point represents the volume of Brazil’s imports of CCMT capital goods from all countries in 1999 and the number of patents filed in Brazil but by foreign inventors in the same year. In Figure 42 the number of patents filed in CCMTs over the preceding five years is presented on the y-axis, together with the stock of inward FDI in 2012 in the same
22 Europe is represented as individual countries.23 All values are logarithmically transformed. Therefore, the precise meaning of the positive
correlation between patent filings and imports as well as patent filings and FDI is that a 1% increase in one variable is associated with a positive percentage increase in the other variable.
8
6
4
2
0
41 Relationship between patent filings and imports of CCMT goods
log
(num
ber
of
pat
ent
fili
ngs
per
cou
ntry
, per
yea
r)
log (trade value in USD bn per country per year)
8
6
4
2
0
42 Relationship between patent filings and FDI in CCMTs
log
(num
ber
of
pat
ent
fili
ngs
per
cou
ntry
, 20
07-2
011)
log (number of subsidiaries per country in 2012)
8 9 10 11 12 13 14 15 16 0 1 2 3 4 5 6 7 8
Climate change policy in the European Union Climate change policy in the European Union
64 65
6CLIMATE CHANGE POLICY IN THE EUROPEAN UNION
Public building made of solar panels, wood and mirror glass, Barcelona, Spain
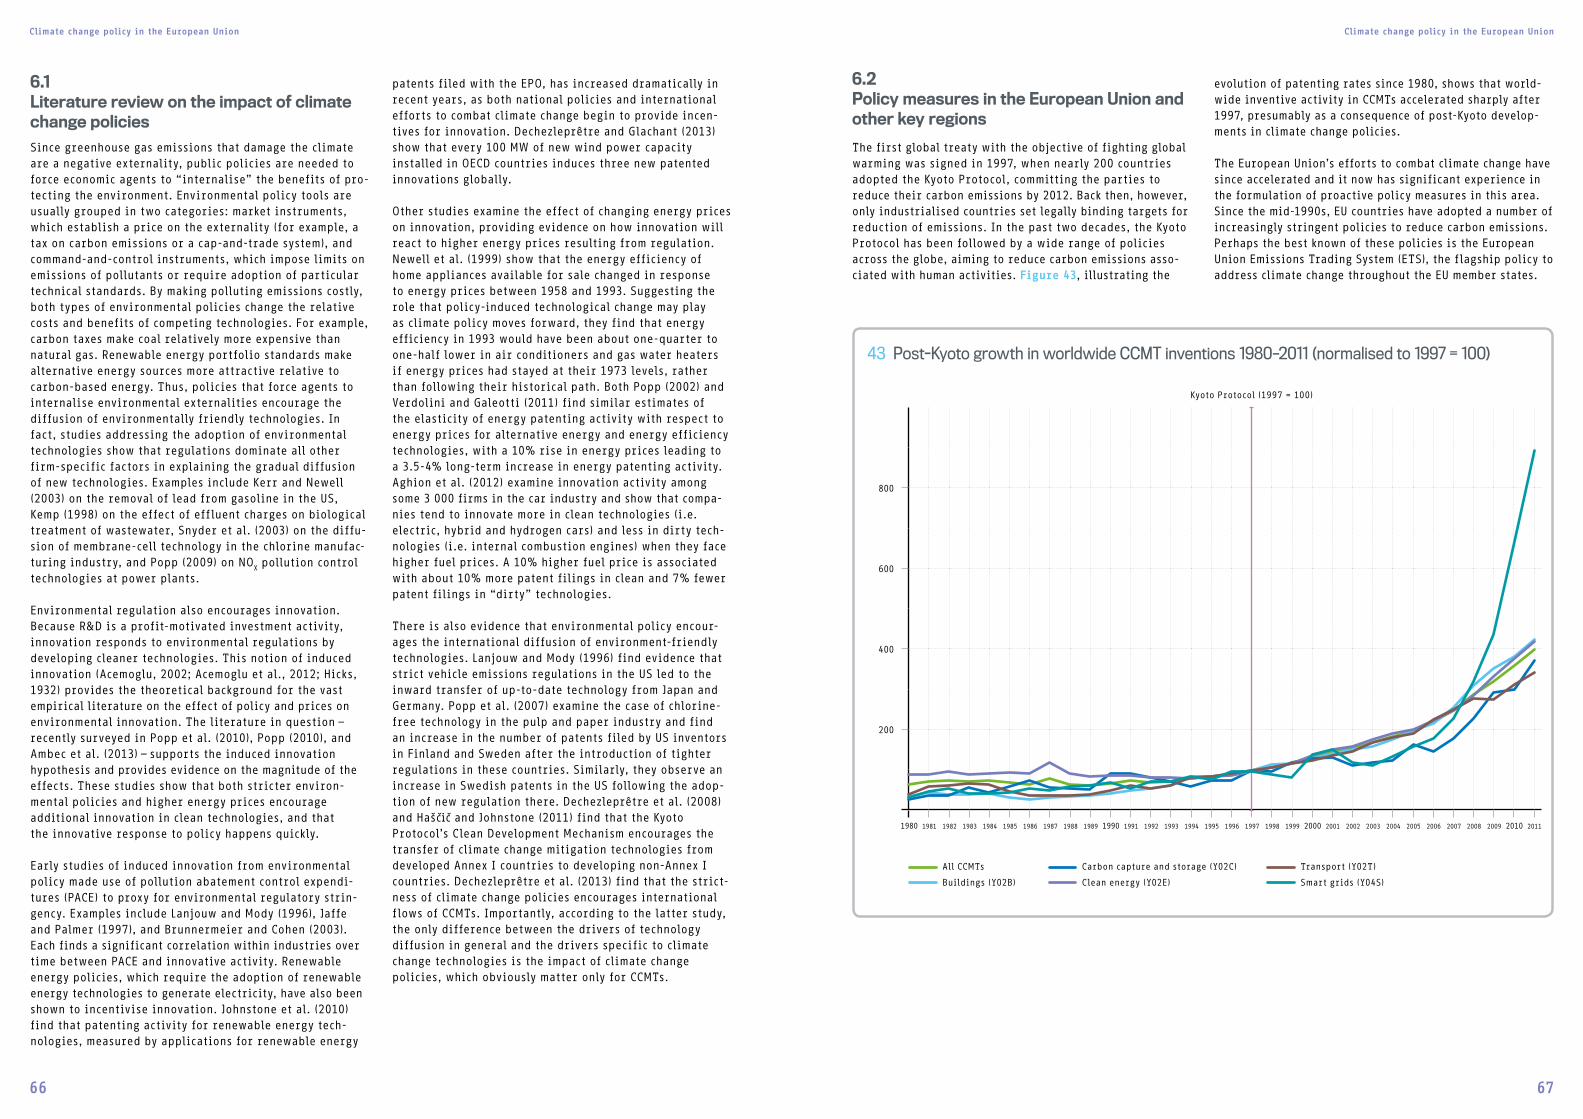
Climate change policy in the European Union Climate change policy in the European Union
66 67
6.1Literature review on the impact of climate change policies Since greenhouse gas emissions that damage the climate are a negative externality, public policies are needed to force economic agents to “internalise” the benefits of pro-tecting the environment. Environmental policy tools are usually grouped in two categories: market instruments, which establish a price on the externality (for example, a tax on carbon emissions or a cap-and-trade system), and command-and-control instruments, which impose limits on emissions of pollutants or require adoption of particular technical standards. By making polluting emissions costly, both types of environmental policies change the relative costs and benefits of competing technologies. For example, carbon taxes make coal relatively more expensive than natural gas. Renewable energy portfolio standards make alternative energy sources more attractive relative to carbon-based energy. Thus, policies that force agents to internalise environmental externalities encourage the diffusion of environmentally friendly technologies. In fact, studies addressing the adoption of environmental technologies show that regulations dominate all other firm-specific factors in explaining the gradual diffusion of new technologies. Examples include Kerr and Newell (2003) on the removal of lead from gasoline in the US, Kemp (1998) on the effect of effluent charges on biological treatment of wastewater, Snyder et al. (2003) on the diffu-sion of membrane-cell technology in the chlorine manufac-turing industry, and Popp (2009) on NO
X pollution control technologies at power plants.
Environmental regulation also encourages innovation. Because R&D is a profit-motivated investment activity, innovation responds to environmental regulations by developing cleaner technologies. This notion of induced innovation (Acemoglu, 2002; Acemoglu et al., 2012; Hicks, 1932) provides the theoretical background for the vast empirical literature on the effect of policy and prices on environmental innovation. The literature in question – recently surveyed in Popp et al. (2010), Popp (2010), and Ambec et al. (2013) – supports the induced innovation hypothesis and provides evidence on the magnitude of the effects. These studies show that both stricter environ-mental policies and higher energy prices encourage additional innovation in clean technologies, and that the innovative response to policy happens quickly.
Early studies of induced innovation from environmental policy made use of pollution abatement control expendi-tures (PACE) to proxy for environmental regulatory strin-gency. Examples include Lanjouw and Mody (1996), Jaffe and Palmer (1997), and Brunnermeier and Cohen (2003). Each finds a significant correlation within industries over time between PACE and innovative activity. Renewable energy policies, which require the adoption of renewable energy technologies to generate electricity, have also been shown to incentivise innovation. Johnstone et al. (2010) find that patenting activity for renewable energy tech-nologies, measured by applications for renewable energy
patents filed with the EPO, has increased dramatically in recent years, as both national policies and international efforts to combat climate change begin to provide incen-tives for innovation. Dechezleprêtre and Glachant (2013) show that every 100 MW of new wind power capacity installed in OECD countries induces three new patented innovations globally.
Other studies examine the effect of changing energy prices on innovation, providing evidence on how innovation will react to higher energy prices resulting from regulation. Newell et al. (1999) show that the energy efficiency of home appliances available for sale changed in response to energy prices between 1958 and 1993. Suggesting the role that policy-induced technological change may play as climate policy moves forward, they find that energy efficiency in 1993 would have been about one-quarter to one-half lower in air conditioners and gas water heaters if energy prices had stayed at their 1973 levels, rather than following their historical path. Both Popp (2002) and Verdolini and Galeotti (2011) find similar estimates of the elasticity of energy patenting activity with respect to energy prices for alternative energy and energy efficiency technologies, with a 10% rise in energy prices leading to a 3.5-4% long-term increase in energy patenting activity. Aghion et al. (2012) examine innovation activity among some 3 000 firms in the car industry and show that compa-nies tend to innovate more in clean technologies (i.e. electric, hybrid and hydrogen cars) and less in dirty tech-nologies (i.e. internal combustion engines) when they face higher fuel prices. A 10% higher fuel price is associated with about 10% more patent filings in clean and 7% fewer patent filings in “dirty” technologies.
There is also evidence that environmental policy encour-ages the international diffusion of environment-friendly technologies. Lanjouw and Mody (1996) find evidence that strict vehicle emissions regulations in the US led to the inward transfer of up-to-date technology from Japan and Germany. Popp et al. (2007) examine the case of chlorine-free technology in the pulp and paper industry and find an increase in the number of patents filed by US inventors in Finland and Sweden after the introduction of tighter regulations in these countries. Similarly, they observe an increase in Swedish patents in the US following the adop-tion of new regulation there. Dechezleprêtre et al. (2008) and Hašci c and Johnstone (2011) find that the Kyoto Protocol’s Clean Development Mechanism encourages the transfer of climate change mitigation technologies from developed Annex I countries to developing non-Annex I countries. Dechezleprêtre et al. (2013) find that the strict-ness of climate change policies encourages international flows of CCMTs. Importantly, according to the latter study, the only difference between the drivers of technology diffusion in general and the drivers specific to climate change technologies is the impact of climate change policies, which obviously matter only for CCMTs.
6.2Policy measures in the European Union and other key regions
The first global treaty with the objective of fighting global warming was signed in 1997, when nearly 200 countries adopted the Kyoto Protocol, committing the parties to reduce their carbon emissions by 2012. Back then, however, only industrialised countries set legally binding targets for reduction of emissions. In the past two decades, the Kyoto Protocol has been followed by a wide range of policies across the globe, aiming to reduce carbon emissions asso-ciated with human activities. Figure 43, illustrating the
evolution of patenting rates since 1980, shows that world-wide inventive activity in CCMTs accelerated sharply after 1997, presumably as a consequence of post-Kyoto develop-ments in climate change policies.
The European Union’s efforts to combat climate change have since accelerated and it now has significant experience in the formulation of proactive policy measures in this area. Since the mid-1990s, EU countries have adopted a number of increasingly stringent policies to reduce carbon emissions. Perhaps the best known of these policies is the European Union Emissions Trading System (ETS), the flagship policy to address climate change throughout the EU member states.
43 Post-Kyoto growth in worldwide CCMT inventions 1980–2011 (normalised to 1997 = 100)
All CCMTs
Buildings (Y02B)
Carbon capture and storage (Y02C)
Clean energy (Y02E)
Transport (Y02T)
Smart grids (Y04S)
1980 1981 1982 1983 1984 1985 1986 1987 1988 1989 1990 1991 1992 1993 1994 1995 1996 1997 1998 1999 2000 2001 2002 2003 2004 2005 2006 2007 2008 2009 2010 2011
800
600
400
200
Kyoto Protocol (1997 = 100)
Climate change policy in the European Union Climate change policy in the European Union
68 69
Beginning with an overall cap on carbon emissions in Europe, the EU sets a national CO2 emissions limit for each country. For specified economic activities (such as energy generation or the production of cement), carbon allowances are then set which can be traded by the operators of instal-lations under the scheme.24 As a result, the ETS covers around 45% of the EU's greenhouse gas emissions. In the transportation sector, EU standards have been adopted to limit emissions from new vehicles. The “Euro” emission standards were first implemented across EU member states in 1992 (Euro 1) and have subsequently been tightened in a series of incremental steps (Euro 2, 3, etc.). In 2009 the EU established an ambitious target of 20% share25 of energy from renewable sources in the overall energy mix by 202026, and a target of saving 20% of the Union’s primary energy consumption by 202027. Furthermore, on 23 October 2014 EU leaders adopted a commitment to reduce domestic green-house gas (GHG) emissions by 40% in 2030 relative to 1990 and an even more ambitious objective to reduce greenhouse gas emissions by at least 80% below 1990 levels by 2050. The targets are supposed to be met by a combination of renewable energy, gas and nuclear energy sources.28
Alongside EU-wide policies, the individual member states have adopted a large array of further policies aiming at reducing GHG emissions. In particular, all EU countries have implemented at least one of the major support instruments towards renewable energy deployment (feed-in tariffs, feed-in premiums, tender schemes or quota obligations). Among these instruments, feed-in tariff schemes are clearly dominant, with implementation in 85% of countries. Almost all countries have also implemented at least one supple-mentary support scheme: investment grants, fiscal measures (tax incentives, etc.) or financing support (loans, etc.).
An indicator developed by the OECD to measure the overall stringency of these various policies is available for all OECD countries since 1990 (Botta and Kozluk, 2014). Looking at the EU as a whole,29 it is evident that climate policy stringency has increased substantially since 1995. However, comparing the stringency of climate policy across the world, the EU is not a clear leader and appears less ambi-tious than Korea and Japan, albeit only by a small margin (Figure 44).30 It is also interesting to find that climate policy in the US, which is generally seen as unambitious, is in fact almost as stringent as in Europe when all poli-cies related to carbon emissions are taken into account. In terms of carbon emissions per unit of GDP, however, the EU appears as the clear leader, with the lowest level of CO
2 intensity (Figure 45). In the period studied, the carbon intensity of the EU economy fell remarkably, from over 320g CO
2 per euro of GDP in 1995 to less than 220g in 2010.
Gunnar Asplund (Sweden)
Finalist of the European Inventor Award 2015 in the category of Industry, in the area of enabling technologies or technologies with a potential or indirect contribution to GHG emissions mitigation (Y02E60)
Invention: High-voltage power grid connection Ugly pylons and power lines, long strands of cables and large, unsightly power conversion stations: Although modern civilisation would be unthinkable without it, electrical distribution is often obtru-sive. Dealing with this problem, Swedish engineer Gunnar Asplund has helped hide away much of a power grid’s infrastructure. At the same time, he’s boosted the efficiency of transmitting electricity from remote power stations, making renewable energy sources, such as solar and wind, a more viable option.
24 Activity-specific size criteria then determine which installations are included in the EU ETS. In energy production, for example, only combustion installations with a yearly thermal input exceeding 20 MWh are covered. In the absence of data on non-regulated installations, it is not possible to determine the fraction of emissions produced by installations with an input of less than 20 MWh.
25 Each EU member state has its own Europe 2020 target. The national targets take into account the member countries' different starting points, renewable energy potential and economic performance. For more information on the targets that each country has adopted, together with the respective action plans, see: https://ec.europa.eu/energy/node/71 (Last accessed: 3 September 2015).
26 Directive 2009/28/EC of the European Parliament and of the Council on the promotion of the use of energy from renewable sources and amending and subsequently repealing Directives 2001/77EC and 2003/30/EC, of 23 April 2009. Available at: http://ec.europa.eu/agriculture/bioenergy/potential/index_en.htm
27 In 2012, with a view to achieving this target, the EU adopted Directive 2012/27/EU of the European Parliament and of the Council on energy efficiency, amending Directives 2009/125/EC and 2010/30/EU and repealing Directives 2004/8/EC and 2006/32/EC. Available at: http://eur-lex.europa.eu/legal-content/EN/TXT/HTML/?uri=CELEX:32012L0027&from=EN (Last accessed: 3 September 2015).
28 The 2050 Energy Strategy, including the Roadmap 2050 for a competitive low-carbon economy. For more information see: European Commission. Energy. 2050 Energy Strategy. Available at: http://ec.europa.eu/energy/en/topics/energy-strategy/2050-energy-strategy. (Last accessed: 4 September 2015).
29 Individual countries are weighted by GDP in order to calculate the average European policy stringency.
30 The indicator was not available for Chinese climate policy stringency, since China is not an OECD member country.
44 Stringency of climate policy in the EU, Japan, Korea and the US 1995-2012
Stri
ngen
cy i
ndic
ator
of
clim
ate
pol
icy
1995 1996 1997 1998 1999 2000 2001 2002 2003 2004 2005 2006 2007 2008 2009 2010 2011 2012
Europe
Japan
USA
Korea
4
3
2
1
0
45 CO2 intensity of GDP in major innovation centres 1995-2012
1995 1996 1997 1998 1999 2000 2001 2002 2003 2004 2005 2006 2007 2008 2009 2010
Europe
China
USA
Korea
Japan
1.1
1.0
0.9
0.8
0.7
0.6
0.5
0.4
0.3
0.2
0.1
0
kgCO
2 per
eur
o of
GDP
Climate change policy in the European Union Climate change policy in the European Union
70 71
Looking at CO2 intensity in conjunction with climate change policy and invention activity, it is clear that invention efforts and policy stringency have gone hand in hand, and that the proliferation of inventions in CCMTs has been accompanied by a decrease in CO
2 intensity. Despite the difficulty of establishing a causal relationship, it is reason-able to assume that the increasing stringency of climate change policy has been a major driver behind the growth in CCMT inventions in Europe (Figure 46 and Figure 47). As explained in section 6.1, a large literature has shown that environmental policies increase innovation in environ-ment-friendly technologies (see Lanjouw and Mody, 1996; Jaffe and Palmer, 1997; Brunnermeier and Cohen, 2003); Johnstone et al., 2010; Dechezleprêtre and Glachant, 2013; Newell et al., 1999; Popp, 2002; Verdolini and Galeotti, 2011; Aghion et al., 2012).
6.3Public R&D investment in CCMTs
In Europe, the development of CCMT inventions has been largely supported by public spending on R&D. The Inter-national Energy Agency collects data on public R&D expen-ditures in CCMT among its members. Public R&D includes R&D funded by public bodies at central or federal level, or at a country’s first administrative subdivision level (i.e. provincial or state government units).31 Government estab-lishments include ministries or cabinet-level departments, regional councils, independent public agencies, state-owned enterprises, government-funded research organisa-tions and public higher-education establishments.
After a long decline, the amount of public R&D spending devoted to climate change technologies by European gov-ernments has doubled since 2000, from EUR 2.2bn annually to EUR 4.5bn, which represents around 0.05% of Europe’s GDP.32 However, public R&D expenditures on CCMTs are still 20% below what they were in 1985 after the second oil shock, when they peaked at EUR 5.5bn (Figure 48).
31 The public R&D data is taken from the International Energy Agency database, so only the European countries that are members of the OECD are included, namely: Austria, Belgium, the Czech Republic, Denmark, Estonia, Finland, France, Germany, Greece, Hungary, Iceland, Ireland, Italy, Luxembourg, the Netherlands, Norway, Poland, Portugal, the Slovak Republic, Slovenia, Spain, Sweden, Switzerland, Turkey and the UK.
32 The central EU funding for R&D in the CCMT area is not included in the comparison of Europe with other IP5 regions because there is no comprehensive data on EU funding for CCMTs. However, this does not significantly distort the picture, since the vast bulk of public funding for clean energy technologies in Europe comes from national governments, with European institutions playing only a marginal role. For example, the estimated public (EU and national) RD&D investments dedicated to six CCMTs covered by the EU Strategic Energy Technology Plan in 2010 amounted to EUR 2.26bn, made up of EUR 2.02 bn from national sources and EUR 0.24bn (11%) from the EU (see Dechezleprêtre and Popp, 2015).
47 CCMT inventions in Europe and stringency of climate policy in the EU 1995-2011
Num
ber
of
inve
ntio
ns
1995 1996 1997 1998 1999 2000 2001 2002 2003 2004 2005 2006 2007 2008 2009 2010 2011
CCMT inventions Stringency of climate policy
8000 4.0
6000 3.0
4000 2.0
2000 1.0 Stri
ngen
cy i
ndic
ator
of
clim
ate
pol
icy
46 CCMT inventions in Europe and CO2 intensity of GDP in the EU 1995-2010
Num
ber
of
inve
ntio
ns
1995 1996 1997 1998 1999 2000 2001 2002 2003 2004 2005 2006 2007 2008 2009 2010
CCMT inventions CO2 intensity of GDP
8000 0.35
6000 0.30
4000 0.25
2000 0.20kg
CO2
per
Eur
o of
GDP
48 European public R&D spending on CCMTs 1980-2011
1980 1981 1982 1983 1984 1985 1986 1987 1988 1989 1990 1991 1992 1993 1994 1995 1996 1997 1998 1999 2000 2001 2002 2003 2004 2005 2006 2007 2008 2009 2010 2011
5.5
5.0
4.5
4.0
3.5
3.0
2.5
2.0
Publi
c R&
D (in
EUR b
n)
Climate change policy in the European Union Climate change policy in the European Union
72 73
Looking at other major OECD innovation centres, Europe’s public support for R&D in CCMT appears comparable in volume to the US and Japan (Figure 49). Europe has recently overtaken Japan in absolute terms, but still lags behind in relation to GDP: public R&D expenditures on CCMT represent 0.074% of GDP in Japan against 0.05% in Europe. In comparison, the US spent 0.032% of its GDP on CCMT R&D and Korea 0.027%.33
33 The spike in public R&D expenditures in the US in 2009 was due to the American Recovery and Reinvestment Act of 2009, which included EUR 27.2bn for research and investment in energy efficiency and renewable energy.
The technology that receives the largest amount of public money in Europe is nuclear energy. However, support for nuclear energy has stagnated since 1995, and the growth of public expenditure is explained by increased support for clean energy technologies, in particular renewable energy, and, to a lesser extent, for CCMTs related to transportation, buildings and carbon capture and storage (Figure 50).
Within Europe, France is the largest provider of public money for CCMT R&D, with over EUR 1bn in 2011. It is fol-lowed by Germany, with EUR 700m in 2011. This represents 0.05% of GDP in France against only 0.02% in Germany (Figure 51). However, almost half of France’s public expenditure on CCMT R&D was devoted to nuclear energy.
As a consequence of large public R&D expenditures, France and Germany are also the top two countries in terms of the number of patents filed by public bodies (universities, government-funded research centres, etc.) in Europe, as shown in Figure 52.
52 European CCMT inventions from public institutions by country 1995-2011
Num
ber
of
inve
ntio
ns
1995 1996 1997 1998 1999 2000 2001 2002 2003 2004 2005 2006 2007 2008 2009 2010 2011
Germany
France
Italy
Netherlands
UK
Finland
250
200
150
100
50
0
49 Public R&D spending on CCMTs in Europe, Japan, Korea and the US 1995-2011
Europe
Japan
USA
Korea
1995 1996 1997 1998 1999 2000 2001 2002 2003 2004 2005 2006 2007 2008 2009 2010 2011
8
7
6
5
4
3
2
1
0
Publi
c R&
D (in
EUR b
n)
50 European public R&D spending on CCMTs by technology 1995-2011
1995 1996 1997 1998 1999 2000 2001 2002 2003 2004 2005 2006 2007 2008 2009 2010 2011
Buildings (Y02B)
Carbon capture (Y02C)
Other clean energy (Y02E)
Renewables (Y02E10)
Nuclear (Y02E30)
Smart grids (Y04S)
Road transport (Y02T10)
Other transport (Y02T)
1200
1000
800
600
400
200
0
Publi
c R&
D (in
EUR m
)
51 European public R&D spending on CCMTs by country 1995-2011
1995 1996 1997 1998 1999 2000 2001 2002 2003 2004 2005 2006 2007 2008 2009 2010 2011
Germany
France
Italy
Netherlands
UK
Finland
1200
1000
800
600
400
200
0
Publi
c R&
D (in
EUR m
)
Germany's first self-sufficient bioenergy village, Juehnde, Germany
7EUROPE’S CLEAN ENERGY POTENTIAL AND EXPLOITATION
Europe’s clean energy potential and exploitation Europe’s clean energy potential and exploitation
74 75
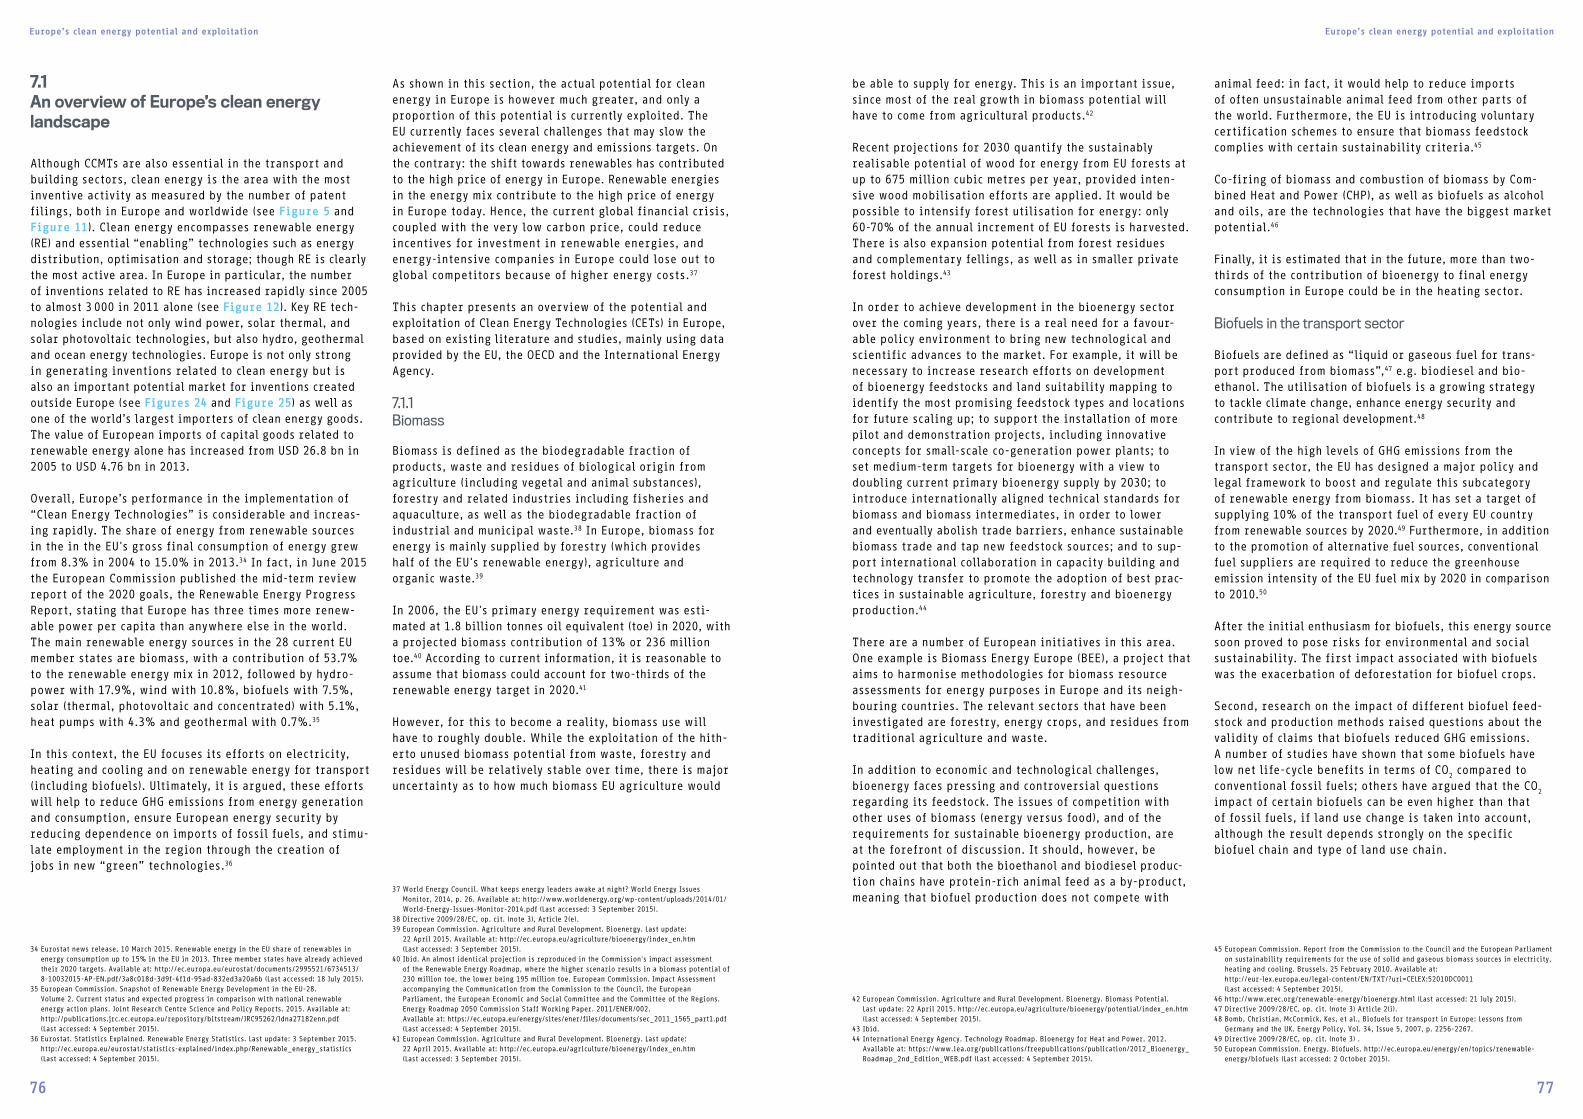
Europe’s clean energy potential and exploitation Europe’s clean energy potential and exploitation
76 77
7.1An overview of Europe’s clean energy landscape
Although CCMTs are also essential in the transport and building sectors, clean energy is the area with the most inventive activity as measured by the number of patent filings, both in Europe and worldwide (see Figure 5 and Figure 11). Clean energy encompasses renewable energy (RE) and essential “enabling” technologies such as energy distribution, optimisation and storage; though RE is clearly the most active area. In Europe in particular, the number of inventions related to RE has increased rapidly since 2005 to almost 3 000 in 2011 alone (see Figure 12). Key RE tech-nologies include not only wind power, solar thermal, and solar photovoltaic technologies, but also hydro, geothermal and ocean energy technologies. Europe is not only strong in generating inventions related to clean energy but is also an important potential market for inventions created outside Europe (see Figures 24 and Figure 25) as well as one of the world’s largest importers of clean energy goods. The value of European imports of capital goods related to renewable energy alone has increased from USD 26.8 bn in 2005 to USD 4.76 bn in 2013.
Overall, Europe’s performance in the implementation of “Clean Energy Technologies” is considerable and increas-ing rapidly. The share of energy from renewable sources in the in the EU's gross final consumption of energy grew from 8.3% in 2004 to 15.0% in 2013.34 In fact, in June 2015 the European Commission published the mid-term review report of the 2020 goals, the Renewable Energy Progress Report, stating that Europe has three times more renew-able power per capita than anywhere else in the world. The main renewable energy sources in the 28 current EU member states are biomass, with a contribution of 53.7% to the renewable energy mix in 2012, followed by hydro-power with 17.9%, wind with 10.8%, biofuels with 7.5%, solar (thermal, photovoltaic and concentrated) with 5.1%, heat pumps with 4.3% and geothermal with 0.7%.35
In this context, the EU focuses its efforts on electricity, heating and cooling and on renewable energy for transport (including biofuels). Ultimately, it is argued, these efforts will help to reduce GHG emissions from energy generation and consumption, ensure European energy security by reducing dependence on imports of fossil fuels, and stimu-late employment in the region through the creation of jobs in new “green” technologies.36
As shown in this section, the actual potential for clean energy in Europe is however much greater, and only a proportion of this potential is currently exploited. The EU currently faces several challenges that may slow the achievement of its clean energy and emissions targets. On the contrary: the shift towards renewables has contributed to the high price of energy in Europe. Renewable energies in the energy mix contribute to the high price of energy in Europe today. Hence, the current global financial crisis, coupled with the very low carbon price, could reduce incentives for investment in renewable energies, and energy-intensive companies in Europe could lose out to global competitors because of higher energy costs.37
This chapter presents an overview of the potential and exploitation of Clean Energy Technologies (CETs) in Europe, based on existing literature and studies, mainly using data provided by the EU, the OECD and the International Energy Agency.
7.1.1Biomass
Biomass is defined as the biodegradable fraction of products, waste and residues of biological origin from agriculture (including vegetal and animal substances), forestry and related industries including fisheries and aquaculture, as well as the biodegradable fraction of industrial and municipal waste.38 In Europe, biomass for energy is mainly supplied by forestry (which provides half of the EU's renewable energy), agriculture and organic waste.39
In 2006, the EU's primary energy requirement was esti-mated at 1.8 billion tonnes oil equivalent (toe) in 2020, with a projected biomass contribution of 13% or 236 million toe.40 According to current information, it is reasonable to assume that biomass could account for two-thirds of the renewable energy target in 2020.41
However, for this to become a reality, biomass use will have to roughly double. While the exploitation of the hith-erto unused biomass potential from waste, forestry and residues will be relatively stable over time, there is major uncertainty as to how much biomass EU agriculture would
be able to supply for energy. This is an important issue, since most of the real growth in biomass potential will have to come from agricultural products.42
Recent projections for 2030 quantify the sustainably realisable potential of wood for energy from EU forests at up to 675 million cubic metres per year, provided inten-sive wood mobilisation efforts are applied. It would be possible to intensify forest utilisation for energy: only 60-70% of the annual increment of EU forests is harvested. There is also expansion potential from forest residues and complementary fellings, as well as in smaller private forest holdings.43
In order to achieve development in the bioenergy sector over the coming years, there is a real need for a favour-able policy environment to bring new technological and scientific advances to the market. For example, it will be necessary to increase research efforts on development of bioenergy feedstocks and land suitability mapping to identify the most promising feedstock types and locations for future scaling up; to support the installation of more pilot and demonstration projects, including innovative concepts for small-scale co-generation power plants; to set medium-term targets for bioenergy with a view to doubling current primary bioenergy supply by 2030; to introduce internationally aligned technical standards for biomass and biomass intermediates, in order to lower and eventually abolish trade barriers, enhance sustainable biomass trade and tap new feedstock sources; and to sup-port international collaboration in capacity building and technology transfer to promote the adoption of best prac-tices in sustainable agriculture, forestry and bioenergy production.44
There are a number of European initiatives in this area. One example is Biomass Energy Europe (BEE), a project that aims to harmonise methodologies for biomass resource assessments for energy purposes in Europe and its neigh-bouring countries. The relevant sectors that have been investigated are forestry, energy crops, and residues from traditional agriculture and waste.
In addition to economic and technological challenges, bioenergy faces pressing and controversial questions regarding its feedstock. The issues of competition with other uses of biomass (energy versus food), and of the requirements for sustainable bioenergy production, are at the forefront of discussion. It should, however, be pointed out that both the bioethanol and biodiesel produc-tion chains have protein-rich animal feed as a by-product, meaning that biofuel production does not compete with
animal feed: in fact, it would help to reduce imports of often unsustainable animal feed from other parts of the world. Furthermore, the EU is introducing voluntary certification schemes to ensure that biomass feedstock complies with certain sustainability criteria.45
Co-firing of biomass and combustion of biomass by Com-bined Heat and Power (CHP), as well as biofuels as alcohol and oils, are the technologies that have the biggest market potential.46
Finally, it is estimated that in the future, more than two-thirds of the contribution of bioenergy to final energy consumption in Europe could be in the heating sector.
Biofuels in the transport sector
Biofuels are defined as “liquid or gaseous fuel for trans-port produced from biomass”,47 e.g. biodiesel and bio-ethanol. The utilisation of biofuels is a growing strategy to tackle climate change, enhance energy security and contribute to regional development.48
In view of the high levels of GHG emissions from the transport sector, the EU has designed a major policy and legal framework to boost and regulate this subcategory of renewable energy from biomass. It has set a target of supplying 10% of the transport fuel of every EU country from renewable sources by 2020.49 Furthermore, in addition to the promotion of alternative fuel sources, con ventional fuel suppliers are required to reduce the greenhouse emission intensity of the EU fuel mix by 2020 in comparison to 2010.50
After the initial enthusiasm for biofuels, this energy source soon proved to pose risks for environmental and social sustainability. The first impact associated with biofuels was the exacerbation of deforestation for biofuel crops.
Second, research on the impact of different biofuel feed-stock and production methods raised questions about the validity of claims that biofuels reduced GHG emissions. A number of studies have shown that some biofuels have low net life-cycle benefits in terms of CO
2 compared to conventional fossil fuels; others have argued that the CO2 impact of certain biofuels can be even higher than that of fossil fuels, if land use change is taken into account, although the result depends strongly on the specific biofuel chain and type of land use chain.
34 Eurostat news release, 10 March 2015. Renewable energy in the EU share of renewables in energy consumption up to 15% in the EU in 2013. Three member states have already achieved their 2020 targets. Available at: http://ec.europa.eu/eurostat/documents/2995521/6734513/ 8-10032015-AP-EN.pdf/3a8c018d-3d9f-4f1d-95ad-832ed3a20a6b (Last accessed: 18 July 2015).
35 European Commission. Snapshot of Renewable Energy Development in the EU-28. Volume 2. Current status and expected progress in comparison with national renewable energy action plans. Joint Research Centre Science and Policy Reports. 2015. Available at: http://publications.jrc.ec.europa.eu/repository/bitstream/JRC95262/ldna27182enn.pdf (Last accessed: 4 September 2015).
36 Eurostat. Statistics Explained. Renewable Energy Statistics. Last update: 3 September 2015. http://ec.europa.eu/eurostat/statistics-explained/index.php/Renewable_energy_statistics (Last accessed: 4 September 2015).
37 World Energy Council. What keeps energy leaders awake at night? World Energy Issues Monitor, 2014, p. 26. Available at: http://www.worldenergy.org/wp-content/uploads/2014/01/World-Energy-Issues-Monitor-2014.pdf (Last accessed: 3 September 2015).
38 Directive 2009/28/EC, op. cit. (note 3), Article 2(e). 39 European Commission. Agriculture and Rural Development. Bioenergy. Last update:
22 April 2015. Available at: http://ec.europa.eu/agriculture/bioenergy/index_en.htm (Last accessed: 3 September 2015).
40 Ibid. An almost identical projection is reproduced in the Commission's impact assessment of the Renewable Energy Roadmap, where the higher scenario results in a biomass potential of 230 million toe, the lower being 195 million toe. European Commission. Impact Assessment accompanying the Communication from the Commission to the Council, the European Parliament, the European Economic and Social Committee and the Committee of the Regions. Energy Roadmap 2050 Commission Staff Working Paper. 2011/ENER/002. Available at: https://ec.europa.eu/energy/sites/ener/files/documents/sec_2011_1565_part1.pdf (Last accessed: 4 September 2015).
41 European Commission. Agriculture and Rural Development. Bioenergy. Last update: 22 April 2015. Available at: http://ec.europa.eu/agriculture/bioenergy/index_en.htm (Last accessed: 3 September 2015).
42 European Commission. Agriculture and Rural Development. Bioenergy. Biomass Potential. Last update: 22 April 2015. http://ec.europa.eu/agriculture/bioenergy/potential/index_en.htm (Last accessed: 4 September 2015).
43 Ibid.44 International Energy Agency. Technology Roadmap. Bioenergy for Heat and Power. 2012.
Available at: https://www.iea.org/publications/freepublications/publication/2012_Bioenergy_Roadmap_2nd_Edition_WEB.pdf (Last accessed: 4 September 2015).
45 European Commission. Report from the Commission to the Council and the European Parliament on sustainability requirements for the use of solid and gaseous biomass sources in electricity, heating and cooling. Brussels. 25 February 2010. Available at: http://eur-lex.europa.eu/legal-content/EN/TXT/?uri=CELEX:52010DC0011 (Last accessed: 4 September 2015).
46 http://www.erec.org/renewable-energy/bioenergy.html (Last accessed: 21 July 2015).47 Directive 2009/28/EC, op. cit. (note 3) Article 2(i). 48 Bomb, Christian, McCormick, Kes, et al., Biofuels for transport in Europe: Lessons from
Germany and the UK. Energy Policy, Vol. 34, Issue 5, 2007, p. 2256-2267. 49 Directive 2009/28/EC, op. cit. (note 3) .50 European Commission. Energy. Biofuels. http://ec.europa.eu/energy/en/topics/renewable-
energy/biofuels (Last accessed: 2 October 2015).
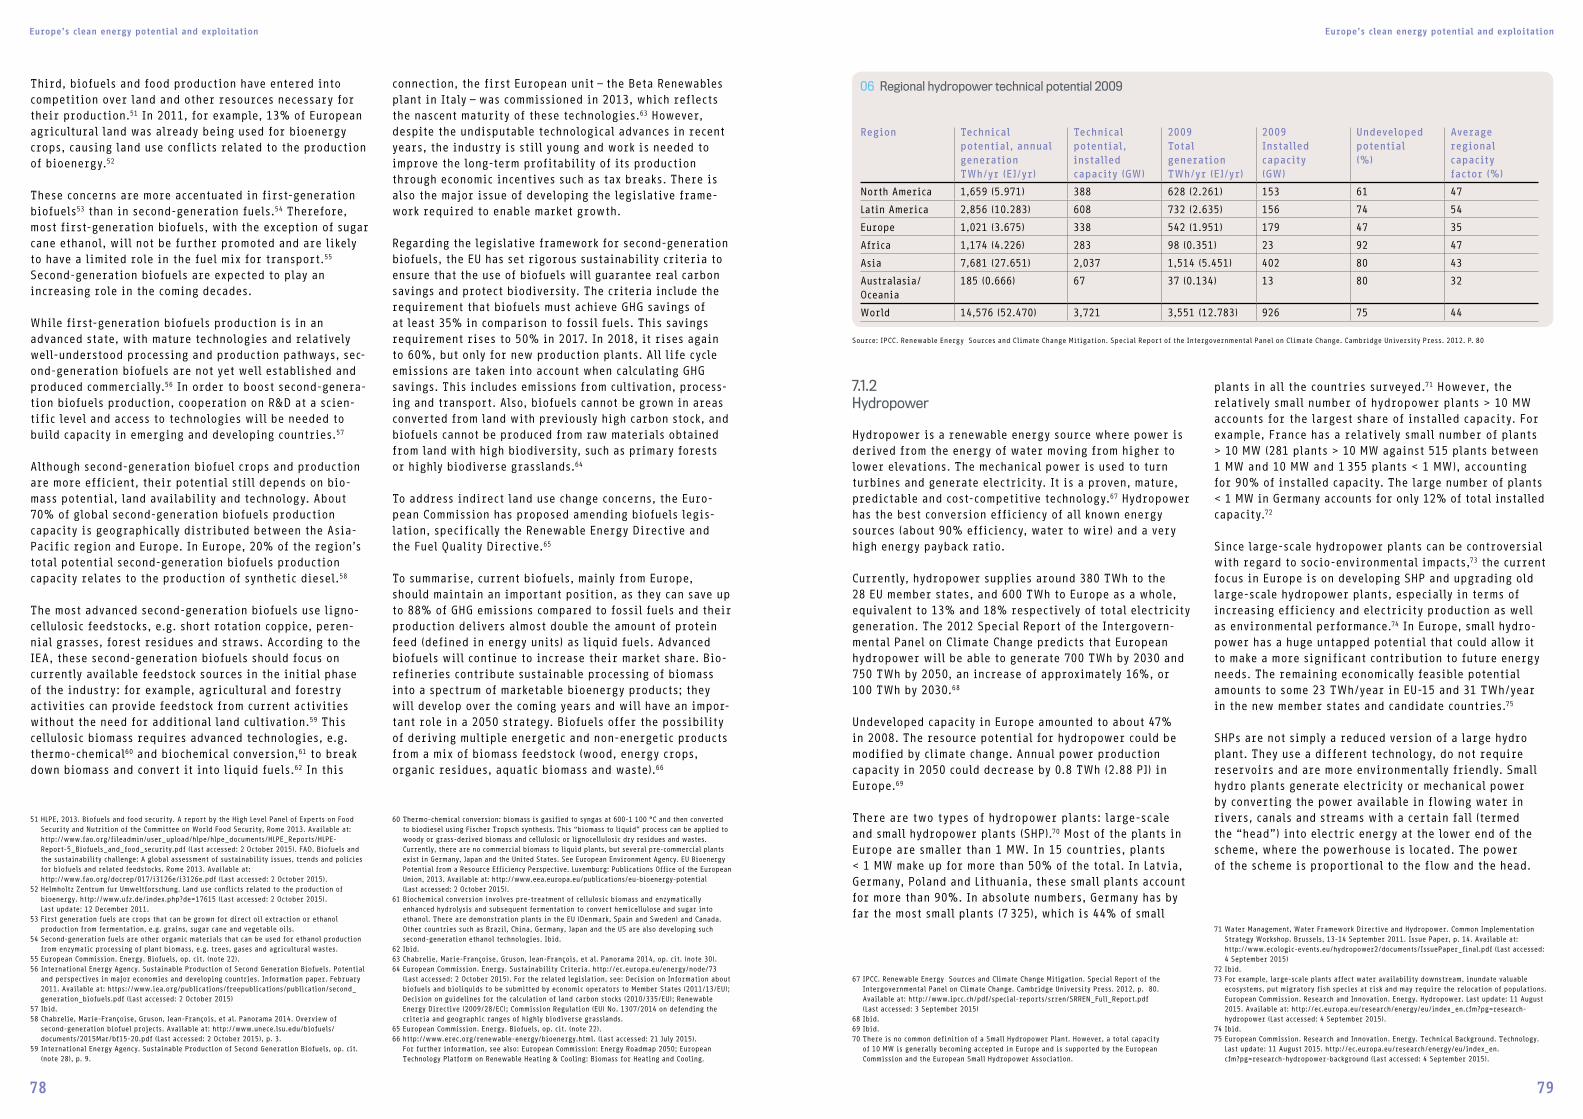
Europe’s clean energy potential and exploitation Europe’s clean energy potential and exploitation
78 79
Third, biofuels and food production have entered into competition over land and other resources necessary for their production.51 In 2011, for example, 13% of European agricultural land was already being used for bioenergy crops, causing land use conflicts related to the production of bioenergy.52
These concerns are more accentuated in first-generation biofuels53 than in second-generation fuels.54 Therefore, most first-generation biofuels, with the exception of sugar cane ethanol, will not be further promoted and are likely to have a limited role in the fuel mix for transport.55 Second-generation biofuels are expected to play an increasing role in the coming decades.
While first-generation biofuels production is in an advanced state, with mature technologies and relatively well-understood processing and production pathways, sec-ond-generation biofuels are not yet well established and produced commercially.56 In order to boost second-genera-tion biofuels production, cooperation on R&D at a scien-tific level and access to technologies will be needed to build capacity in emerging and developing countries.57
Although second-generation biofuel crops and production are more efficient, their potential still depends on bio-mass potential, land availability and technology. About 70% of global second-generation biofuels production capacity is geographically distributed between the Asia-Pacific region and Europe. In Europe, 20% of the region’s total potential second-generation biofuels production capacity relates to the production of synthetic diesel.58
The most advanced second-generation biofuels use ligno-cellulosic feedstocks, e.g. short rotation coppice, peren-nial grasses, forest residues and straws. According to the IEA, these second-generation biofuels should focus on currently available feedstock sources in the initial phase of the industry: for example, agricultural and forestry activities can provide feedstock from current activities without the need for additional land cultivation.59 This cellulosic biomass requires advanced technologies, e.g. thermo-chemical60 and biochemical conversion,61 to break down biomass and convert it into liquid fuels.62 In this
connection, the first European unit – the Beta Renewables plant in Italy – was commissioned in 2013, which reflects the nascent maturity of these technologies.63 However, despite the undisputable technological advances in recent years, the industry is still young and work is needed to improve the long-term profitability of its production through economic incentives such as tax breaks. There is also the major issue of developing the legislative frame-work required to enable market growth.
Regarding the legislative framework for second-generation biofuels, the EU has set rigorous sustainability criteria to ensure that the use of biofuels will guarantee real carbon savings and protect biodiversity. The criteria include the requirement that biofuels must achieve GHG savings of at least 35% in comparison to fossil fuels. This savings requirement rises to 50% in 2017. In 2018, it rises again to 60%, but only for new production plants. All life cycle emissions are taken into account when calculating GHG savings. This includes emissions from cultivation, process-ing and transport. Also, biofuels cannot be grown in areas converted from land with previously high carbon stock, and biofuels cannot be produced from raw materials obtained from land with high biodiversity, such as primary forests or highly biodiverse grasslands.64
To address indirect land use change concerns, the Euro-pean Commission has proposed amending biofuels legis-lation, specifically the Renewable Energy Directive and the Fuel Quality Directive.65
To summarise, current biofuels, mainly from Europe, should maintain an important position, as they can save up to 88% of GHG emissions compared to fossil fuels and their production delivers almost double the amount of protein feed (defined in energy units) as liquid fuels. Advanced biofuels will continue to increase their market share. Bio-refineries contribute sustainable processing of biomass into a spectrum of marketable bioenergy products; they will develop over the coming years and will have an impor-tant role in a 2050 strategy. Biofuels offer the possibility of deriving multiple energetic and non-energetic products from a mix of biomass feedstock (wood, energy crops, organic residues, aquatic biomass and waste).66
7.1.2Hydropower
Hydropower is a renewable energy source where power is derived from the energy of water moving from higher to lower elevations. The mechanical power is used to turn turbines and generate electricity. It is a proven, mature, predictable and cost-competitive technology.67 Hydropower has the best conversion efficiency of all known energy sources (about 90% efficiency, water to wire) and a very high energy payback ratio.
Currently, hydropower supplies around 380 TWh to the 28 EU member states, and 600 TWh to Europe as a whole, equivalent to 13% and 18% respectively of total electricity generation. The 2012 Special Report of the Intergovern-mental Panel on Climate Change predicts that European hydropower will be able to generate 700 TWh by 2030 and 750 TWh by 2050, an increase of approximately 16%, or 100 TWh by 2030.68
Undeveloped capacity in Europe amounted to about 47% in 2008. The resource potential for hydropower could be modified by climate change. Annual power production capacity in 2050 could decrease by 0.8 TWh (2.88 PJ) in Europe.69
There are two types of hydropower plants: large-scale and small hydropower plants (SHP).70 Most of the plants in Europe are smaller than 1 MW. In 15 countries, plants < 1 MW make up for more than 50% of the total. In Latvia, Germany, Poland and Lithuania, these small plants account for more than 90%. In absolute numbers, Germany has by far the most small plants (7 325), which is 44% of small
plants in all the countries surveyed.71 However, the relatively small number of hydropower plants > 10 MW accounts for the largest share of installed capacity. For example, France has a relatively small number of plants > 10 MW (281 plants > 10 MW against 515 plants between 1 MW and 10 MW and 1 355 plants < 1 MW), accounting for 90% of installed capacity. The large number of plants < 1 MW in Germany accounts for only 12% of total installed capacity.72
Since large-scale hydropower plants can be controversial with regard to socio-environmental impacts,73 the current focus in Europe is on developing SHP and upgrading old large-scale hydropower plants, especially in terms of increasing efficiency and electricity production as well as environmental performance.74 In Europe, small hydro-power has a huge untapped potential that could allow it to make a more significant contribution to future energy needs. The remaining economically feasible potential amounts to some 23 TWh/year in EU-15 and 31 TWh/year in the new member states and candidate countries.75
SHPs are not simply a reduced version of a large hydro plant. They use a different technology, do not require reservoirs and are more environmentally friendly. Small hydro plants generate electricity or mechanical power by converting the power available in flowing water in rivers, canals and streams with a certain fall (termed the “head”) into electric energy at the lower end of the scheme, where the powerhouse is located. The power of the scheme is proportional to the flow and the head.
51 HLPE, 2013. Biofuels and food security. A report by the High Level Panel of Experts on Food Security and Nutrition of the Committee on World Food Security, Rome 2013. Available at: http://www.fao.org/fileadmin/user_upload/hlpe/hlpe_documents/HLPE_Reports/HLPE-Report-5_Biofuels_and_food_security.pdf (Last accessed: 2 October 2015). FAO. Biofuels and the sustainability challenge: A global assessment of sustainability issues, trends and policies for biofuels and related feedstocks. Rome 2013. Available at: http://www.fao.org/docrep/017/i3126e/i3126e.pdf (Last accessed: 2 October 2015).
52 Helmholtz Zentrum fur Umweltforschung. Land use conflicts related to the production of bioenergy. http://www.ufz.de/index.php?de=17615 (Last accessed: 2 October 2015). Last update: 12 December 2011.
53 First generation fuels are crops that can be grown for direct oil extraction or ethanol production from fermentation, e.g. grains, sugar cane and vegetable oils.
54 Second-generation fuels are other organic materials that can be used for ethanol production from enzymatic processing of plant biomass, e.g. trees, gases and agricultural wastes.
55 European Commission. Energy. Biofuels, op. cit. (note 22). 56 International Energy Agency. Sustainable Production of Second Generation Biofuels. Potential
and perspectives in major economies and developing countries. Information paper. February 2011. Available at: https://www.iea.org/publications/freepublications/publication/second_generation_biofuels.pdf (Last accessed: 2 October 2015)
57 Ibid.58 Chabrelie, Marie-Françoise, Gruson, Jean-François, et al. Panorama 2014. Overview of
second-generation biofuel projects. Available at: http://www.unece.lsu.edu/biofuels/documents/2015Mar/bf15-20.pdf (Last accessed: 2 October 2015), p. 3.
59 International Energy Agency. Sustainable Production of Second Generation Biofuels, op. cit. (note 28), p. 9.
60 Thermo-chemical conversion: biomass is gasified to syngas at 600-1 100 °C and then converted to biodiesel using Fischer Tropsch synthesis. This “biomass to liquid” process can be applied to woody or grass-derived biomass and cellulosic or lignocellulosic dry residues and wastes. Currently, there are no commercial biomass to liquid plants, but several pre-commercial plants exist in Germany, Japan and the United States. See European Environment Agency. EU Bioenergy Potential from a Resource Efficiency Perspective. Luxemburg: Publications Office of the European Union, 2013. Available at: http://www.eea.europa.eu/publications/eu-bioenergy-potential (Last accessed: 2 October 2015).
61 Biochemical conversion involves pre-treatment of cellulosic biomass and enzymatically enhanced hydrolysis and subsequent fermentation to convert hemicellulose and sugar into ethanol. There are demonstration plants in the EU (Denmark, Spain and Sweden) and Canada. Other countries such as Brazil, China, Germany, Japan and the US are also developing such second-generation ethanol technologies. Ibid.
62 Ibid.63 Chabrelie, Marie-Françoise, Gruson, Jean-François, et al. Panorama 2014, op. cit. (note 30).64 European Commission. Energy. Sustainability Criteria. http://ec.europa.eu/energy/node/73
(Last accessed: 2 October 2015). For the related legislation, see: Decision on Information about biofuels and bioliquids to be submitted by economic operators to Member States (2011/13/EU); Decision on guidelines for the calculation of land carbon stocks (2010/335/EU); Renewable Energy Directive (2009/28/EC); Commission Regulation (EU) No. 1307/2014 on defending the criteria and geographic ranges of highly biodiverse grasslands.
65 European Commission. Energy. Biofuels, op. cit. (note 22). 66 http://www.erec.org/renewable-energy/bioenergy.html. (Last accessed: 21 July 2015).
For further information, see also: European Commission: Energy Roadmap 2050; European Technology Platform on Renewable Heating & Cooling: Biomass for Heating and Cooling.
67 IPCC. Renewable Energy Sources and Climate Change Mitigation. Special Report of the Intergovernmental Panel on Climate Change. Cambridge University Press. 2012, p. 80. Available at: http://www.ipcc.ch/pdf/special-reports/srren/SRREN_Full_Report.pdf (Last accessed: 3 September 2015)
68 Ibid.69 Ibid.70 There is no common definition of a Small Hydropower Plant. However, a total capacity
of 10 MW is generally becoming accepted in Europe and is supported by the European Commission and the European Small Hydropower Association.
71 Water Management, Water Framework Directive and Hydropower. Common Implementation Strategy Workshop. Brussels, 13-14 September 2011. Issue Paper, p. 14. Available at: http://www.ecologic-events.eu/hydropower2/documents/IssuePaper_final.pdf (Last accessed: 4 September 2015)
72 Ibid.73 For example, large-scale plants affect water availability downstream, inundate valuable
ecosystems, put migratory fish species at risk and may require the relocation of populations. European Commission. Research and Innovation. Energy. Hydropower. Last update: 11 August 2015. Available at: http://ec.europa.eu/research/energy/eu/index_en.cfm?pg=research-hydropower (Last accessed: 4 September 2015).
74 Ibid.75 European Commission. Research and Innovation. Energy. Technical Background. Technology.
Last update: 11 August 2015. http://ec.europa.eu/research/energy/eu/index_en.cfm?pg=research-hydropower-background (Last accessed: 4 September 2015).
06 Regional hydropower technical potential 2009
Region Technical potential, annual generation TWh/yr (EJ/yr)
Technical potential, installed capacity (GW)
2009 Total generation TWh/yr (EJ/yr)
2009Installed capacity (GW)
Undeveloped potential (%)
Average regional capacity factor (%)
North America 1,659 (5.971) 388 628 (2.261) 153 61 47
Latin America 2,856 (10.283) 608 732 (2.635) 156 74 54
Europe 1,021 (3.675) 338 542 (1.951) 179 47 35
Africa 1,174 (4.226) 283 98 (0.351) 23 92 47
Asia 7,681 (27.651) 2,037 1,514 (5.451) 402 80 43
Australasia/Oceania
185 (0.666) 67 37 (0.134) 13 80 32
World 14,576 (52.470) 3,721 3,551 (12.783) 926 75 44
Source: IPCC. Renewable Energy Sources and Climate Change Mitigation. Special Report of the Intergovernmental Panel on Climate Change. Cambridge University Press. 2012. P. 80
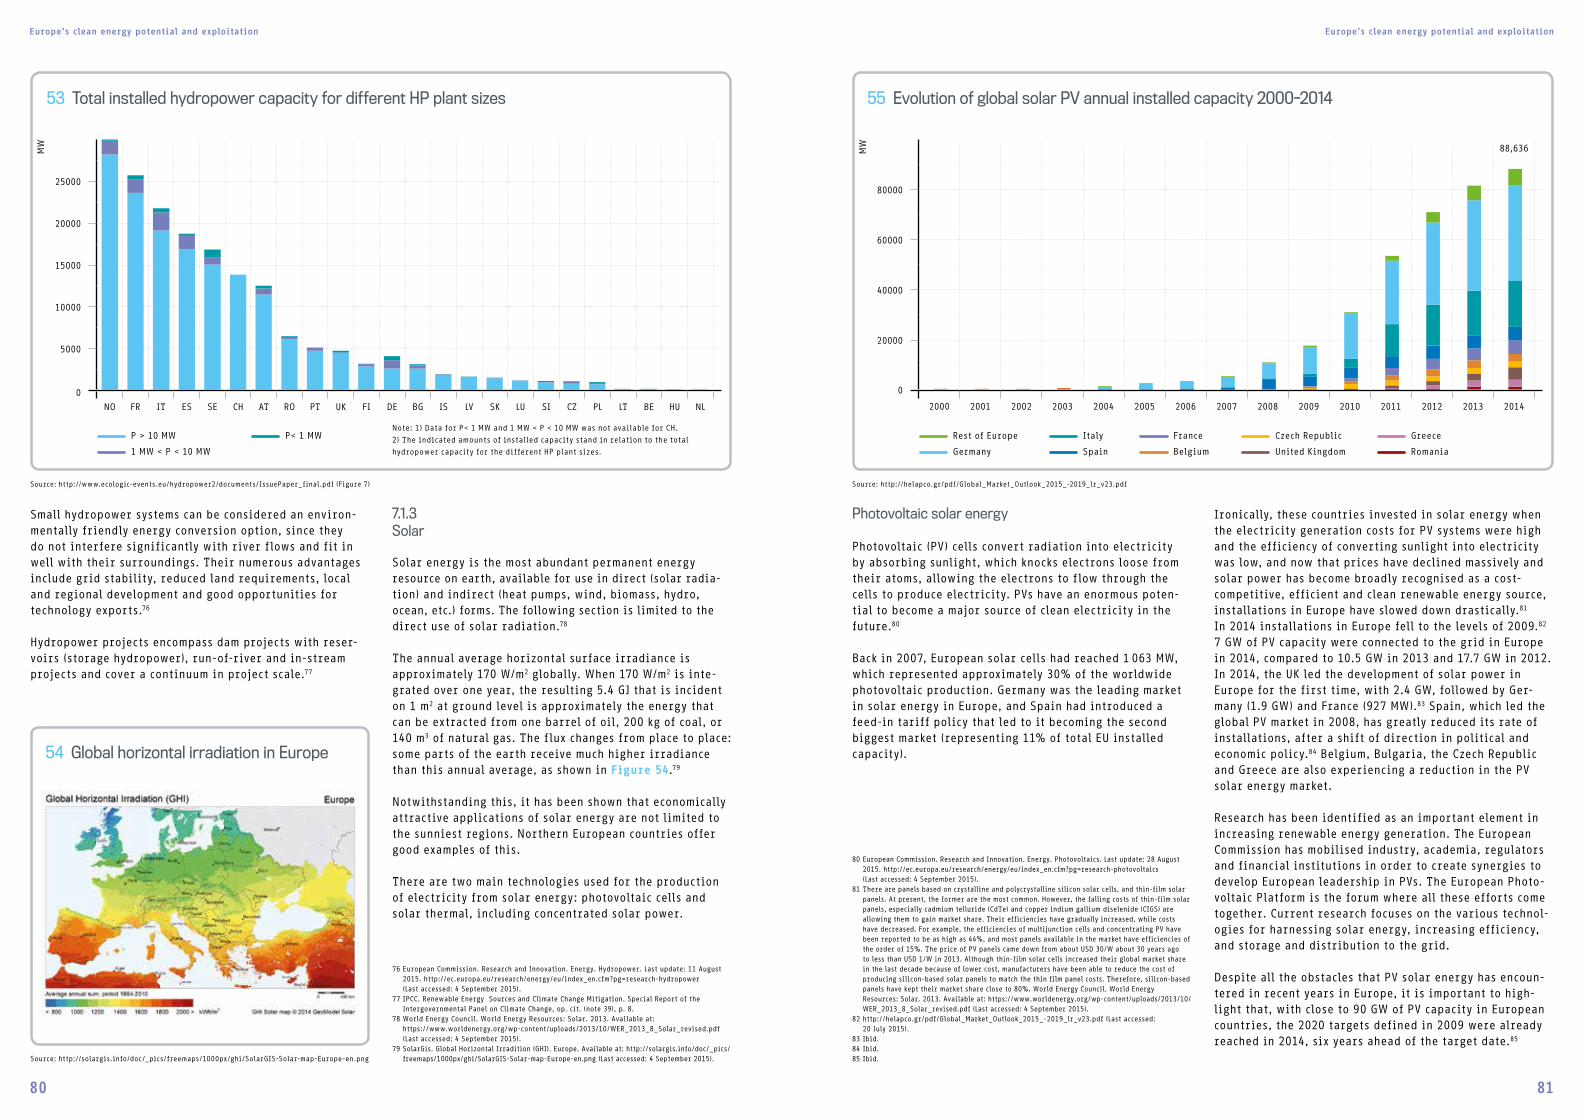
Europe’s clean energy potential and exploitation Europe’s clean energy potential and exploitation
80 81
Small hydropower systems can be considered an environ-mentally friendly energy conversion option, since they do not interfere significantly with river flows and fit in well with their surroundings. Their numerous advantages include grid stability, reduced land requirements, local and regional development and good opportunities for technology exports.76
Hydropower projects encompass dam projects with reser-voirs (storage hydropower), run-of-river and in-stream projects and cover a continuum in project scale.77
7.1.3Solar
Solar energy is the most abundant permanent energy resource on earth, available for use in direct (solar radia-tion) and indirect (heat pumps, wind, biomass, hydro, ocean, etc.) forms. The following section is limited to the direct use of solar radiation.78
The annual average horizontal surface irradiance is approximately 170 W/m2 globally. When 170 W/m2 is inte-grated over one year, the resulting 5.4 GJ that is incident on 1 m2 at ground level is approximately the energy that can be extracted from one barrel of oil, 200 kg of coal, or 140 m3 of natural gas. The flux changes from place to place: some parts of the earth receive much higher irradiance than this annual average, as shown in Figure 54.79
Notwithstanding this, it has been shown that economically attractive applications of solar energy are not limited to the sunniest regions. Northern European countries offer good examples of this.
There are two main technologies used for the production of electricity from solar energy: photovoltaic cells and solar thermal, including concentrated solar power.
Photovoltaic solar energy
Photovoltaic (PV) cells convert radiation into electricity by absorbing sunlight, which knocks electrons loose from their atoms, allowing the electrons to flow through the cells to produce electricity. PVs have an enormous poten-tial to become a major source of clean electricity in the future.80
Back in 2007, European solar cells had reached 1 063 MW, which represented approximately 30% of the worldwide photovoltaic production. Germany was the leading market in solar energy in Europe, and Spain had introduced a feed-in tariff policy that led to it becoming the second biggest market (representing 11% of total EU installed capacity).
Ironically, these countries invested in solar energy when the electricity generation costs for PV systems were high and the efficiency of converting sunlight into electricity was low, and now that prices have declined massively and solar power has become broadly recognised as a cost- competitive, efficient and clean renewable energy source, installations in Europe have slowed down drastically.81 In 2014 installations in Europe fell to the levels of 2009.82 7 GW of PV capacity were connected to the grid in Europe in 2014, compared to 10.5 GW in 2013 and 17.7 GW in 2012. In 2014, the UK led the development of solar power in Europe for the first time, with 2.4 GW, followed by Ger-many (1.9 GW) and France (927 MW).83 Spain, which led the global PV market in 2008, has greatly reduced its rate of installations, after a shift of direction in political and economic policy.84 Belgium, Bulgaria, the Czech Republic and Greece are also experiencing a reduction in the PV solar energy market.
Research has been identified as an important element in increasing renewable energy generation. The European Commission has mobilised industry, academia, regulators and financial institutions in order to create synergies to develop European leadership in PVs. The European Photo-voltaic Platform is the forum where all these efforts come together. Current research focuses on the various technol-ogies for harnessing solar energy, increasing efficiency, and storage and distribution to the grid.
Despite all the obstacles that PV solar energy has encoun-tered in recent years in Europe, it is important to high-light that, with close to 90 GW of PV capacity in European countries, the 2020 targets defined in 2009 were already reached in 2014, six years ahead of the target date.85
76 European Commission. Research and Innovation. Energy. Hydropower. Last update: 11 August 2015. http://ec.europa.eu/research/energy/eu/index_en.cfm?pg=research-hydropower (Last accessed: 4 September 2015).
77 IPCC. Renewable Energy Sources and Climate Change Mitigation. Special Report of the Intergovernmental Panel on Climate Change, op. cit. (note 39), p. 8.
78 World Energy Council. World Energy Resources: Solar. 2013. Available at: https://www.worldenergy.org/wp-content/uploads/2013/10/WER_2013_8_Solar_revised.pdf (Last accessed: 4 September 2015).
79 SolarGis. Global Horizontal Irradition (GHI). Europe. Available at: http://solargis.info/doc/_pics/freemaps/1000px/ghi/SolarGIS-Solar-map-Europe-en.png (Last accessed: 4 September 2015).
80 European Commission. Research and Innovation. Energy. Photovoltaics. Last update: 28 August 2015. http://ec.europa.eu/research/energy/eu/index_en.cfm?pg=research-photovoltaics (Last accessed: 4 September 2015).
81 There are panels based on crystalline and polycrystalline silicon solar cells, and thin-film solar panels. At present, the former are the most common. However, the falling costs of thin-film solar panels, especially cadmium telluride (CdTe) and copper indium gallium diselenide (CIGS) are allowing them to gain market share. Their efficiencies have gradually increased, while costs have decreased. For example, the efficiencies of multijunction cells and concentrating PV have been reported to be as high as 44%, and most panels available in the market have efficiencies of the order of 15%. The price of PV panels came down from about USD 30/W about 30 years ago to less than USD 1/W in 2013. Although thin-film solar cells increased their global market share in the last decade because of lower cost, manufacturers have been able to reduce the cost of producing silicon-based solar panels to match the thin film panel costs. Therefore, silicon-based panels have kept their market share close to 80%. World Energy Council. World Energy Resources: Solar. 2013. Available at: https://www.worldenergy.org/wp-content/uploads/2013/10/WER_2013_8_Solar_revised.pdf (Last accessed: 4 September 2015).
82 http://helapco.gr/pdf/Global_Market_Outlook_2015_-2019_lr_v23.pdf (Last accessed: 20 July 2015).
83 Ibid.84 Ibid.85 Ibid.
54 Global horizontal irradiation in Europe
25000
20000
15000
10000
5000
0
NO FR IT ES SE CH AT RO PT UK FI DE BG IS LV SK LU SI CZ PL LT BE HU NL
53 Total installed hydropower capacity for different HP plant sizes
MW
P > 10 MW
1 MW < P < 10 MW
P< 1 MW Note: 1) Data for P< 1 MW and 1 MW < P < 10 MW was not available for CH.
2) The indicated amounts of installed capacity stand in relation to the total
hydropower capacity for the different HP plant sizes.
55 Evolution of global solar PV annual installed capacity 2000-2014
80000
60000
40000
20000
0
2000 2001 2002 2003 2004 2005 2006 2007 2008 2009 2010 2011 2012 2013 2014
MW 88,636
Rest of Europe
Germany
Italy
Spain
France
Belgium
Czech Republic
United Kingdom
Greece
Romania
Source: http://www.ecologic-events.eu/hydropower2/documents/IssuePaper_final.pdf (Figure 7)
Source: http://solargis.info/doc/_pics/freemaps/1000px/ghi/SolarGIS-Solar-map-Europe-en.png
Source: http://helapco.gr/pdf/Global_Market_Outlook_2015_-2019_lr_v23.pdf

Europe’s clean energy potential and exploitation Europe’s clean energy potential and exploitation
82 83
Solar thermal
Given that 49% of the final energy demand in the EU is used for heating and cooling,84 and that only biomass, geothermal and solar renewable sources generate heat, Europe has put its efforts into meeting the need for low-temperature heat with solar thermal energy.85 Of this low-temperature heat demand, 61% is used in households, while 19% and 20% is used in services and industry respectively.88
In order to use the potential for solar energy to meet these needs, models of solar active houses, large-scale prefabricated solar renovation technologies and thermal energy storage were promoted. In 2010, the EU adopted the Energy Performance of Buildings Directive89 concern-ing the residential and the tertiary sector. The Directive obliges member states to apply minimum requirements regarding the energy performance of new and existing buildings, such as the use of renewable energies for heat-ing and cooling installations, including solar thermal for water heating.90
Recent progress in solar thermal energy in Europe is divided among small systems (mainly in the domestic sec-tor), large systems and very large systems – such as solar district heating plants.
Looking at the year 2014, the market for small systems amounted to 2 GWth, which represents a decrease of 6.8% in comparison with the previous years. The total installed capacity in Europe reached 31.8 GWth. Solar thermal energy suffered, together with PV solar energy, a con-traction in its largest markets in Europe. It reached the same market level as in 2007, before the peak year of 2008. The main factors influencing these developments include the falling price of gas, difficult access to finance for consumers, a slow-moving construction sector, fewer pub-lic support schemes for solar thermal, and competition from other energy sources with more attractive market incentives.91 Nevertheless, there are still market develop-ment opportunities for solar thermal energies, provided that some barriers are removed and support policies put in place. For example, Greece and Spain managed to grow their markets by 18.9% and 9.8%.
A different scenario was observed for larger systems. Large systems – above 35 kWth – for commercial and indus-trial solar heating have not decreased as much as the small systems. Very large systems – above 350 kWth /
500 m² – are growing rapidly. Most of this growth is due to solar district heating plants92 in Denmark, but signifi-cant developments are also apparent in other European countries, using different solutions led by other actors.93 The EU sees potential for these very large systems to meet heating energy needs in Europe, but recognises that suc-cess does not depend only on the availability of ready-to-use technology and on physical conditions, but also on the combination of legislative and economic frameworks taking into account the specific interests of active local stakeholders and citizens.94
In the relatively new field of solar district heating, the SDHplus project, which has been running since 2012, brings together countries that have experience in this area with others which see the potential but have only recently started to explore the possibilities. The project has 18 pilot studies and 13 business models. The new countries involved in the project are France, Italy and Poland.95
Concentrated solar power
This technology concentrates solar energy at a single point, which is then used to heat up a fluid, produce steam and activate turbines that produce electricity. There are different techniques to concentrate the solar power, such as parabolic trough, parabolic dish or power tower systems. One of the advantages of the technology is that it can pro-vide combined heat and power.96
In Europe, the Mediterranean region has the most poten-tial for the development of concentrated solar power (CSP), since the exploitation of solar energy using this technol-ogy differs according to sunlight conditions. CSP power plants have been built in Spain, with the financial support of the EU.97
The severe financial and economic crisis of 2008 has affected the development of CSP in Europe, especially in Spain, which is the country with the highest potential for CSP in the region. Since 2010, Spain has installed only 2.3 GW.98
Adolf Goetzberger (Germany)
Winner of the European Inventor Award 2009in the category of Lifetime achievement, in the area of photovoltaic
When Goetzberger started to round up support for solar energy in the mid-1970s, the world's total solar cell production was at just 500 Kilowatts.
Goetzberger excelled in his early career working in semiconductor research. In the 1960s, he worked with a US Nobel Prize winner and at Bell Laboratories in the United States. During that stretch, Goetzberger pub-lished work that still plays a vital role in today's semi-conductor technology. But he eventually returned to Germany to realise his dream - to help solar energy to a breakthrough.
In the late 1970s, he provided visionary research into fluorescent planar collector-concentrators for solar energy conversion, which could revolutionise effi-ciency levels of solar power generation. In 1981, he founded the Freiburg-based Fraunhofer-Institut for Solar Energy Systems (ISE).
Over the next few years he drove groundbreaking research in the young sector. To this day, his book "Photovoltaic Solar Energy Generation" is a standard cited by scientists all over the world.
Under Goetzberger's lead, the ISE developed the first highly efficient, fully electronic inverter for stand-alone photovoltaic systems, and it took first steps toward highly efficient silicon and III-V solar cells, thin-film solar cells and solar-grade silicon.
In the field of improving efficiency, it cooperated in the development of the first transparent insulation materials, which hit the market in 1988.
In 1989, the institute participated in the 1 000 Roofs Programme, at the time the world's largest, wide-scale testing project of small, grid-connected photovoltaic systems. In the early 1990s, the ISE also pioneered an energy self-sufficient, zero-emissions house that today is replicated all over the world.
Goetzberger has cooperated in researching Concen-trating Solar Power (CSP), which could satisfy all of Europe's electricity needs by 2050, a study sponsored by the German government found.
Today, the European photovoltaic industry is worth EUR 14 bn a year, and Germany is home to the world's largest solar PV market. It's difficult to envision such a development without the work – and persistence - of Adolf Goetzberger.
86 ESTIF. The Solar Thermal Potential in Europe. Available at: http://www.estif.org/fileadmin/estif/content/events/downloads/Potential%2520Solar%2520Thermal_Webinar.pdf (Last accessed: 4 September 2015).
87 http://www.estif.org/?id=661 (Last accessed: 20 July 2015). 88 ESTIF. The Solar Thermal Potential in Europe, op. cit. (note 59).89 Directive 2010/31/EU of the European Parliament and of the Council of 19 May 2010 on the
energy performance of buildings. Available at: http://eur-lex.europa.eu/legal-content/EN/TXT/HTML/?uri=CELEX:32010L0031&from=EN (Last accessed: 4 September 2015).
90 European Commission. Energy and Buildings. Renewable Energies and Energy Efficiency. Joint Research Centre. Available at: https://ec.europa.eu/jrc/sites/default/files/energy_and_buildings_en.pdf (Last accessed: 4 September 2015).
91 ESTIF. Solar Thermal Markets in Europe. Trends and Market Statistics 2014. June 2015. Available at: http://www.estif.org/fileadmin/estif/content/market_data/downloads/2014_solar_thermal_markets_LR.pdf (Last accessed: 4 September 2015).
92 Solar district heating systems collect the sun’s energy over large areas, storing it and feeding it into the heating grid. This can generate enough power to supply heat and hot water to areas of towns or whole villages.
93 Ibid. 94 European Commission. Harnessing Solar Thermal Energy for District Heating.
https://ec.europa.eu/easme/en/news/harnessing-solar-thermal-energy-district-heating (Last accessed: 4 September 2015).
95 Ibid.96 European Commission. Research and Innovation. Energy. Concentrated Solar Power. Last update:
11 August 2015. http://ec.europa.eu/research/energy/eu/index_en.cfm?pg=research-csp (Last accessed: 4 September 2015).
97 Ibid. 98 Organisation for Economic Cooperation and Development/International Energy Agency.
Technology Roadmap. Solar Thermal Electricity. 2014 Edition. Available at: https://www.iea.org/publications/freepublications/publication/TechnologyRoadmapSolarThermalElectricity_ 2014edition.pdf (Last accessed: 4 September 2015).
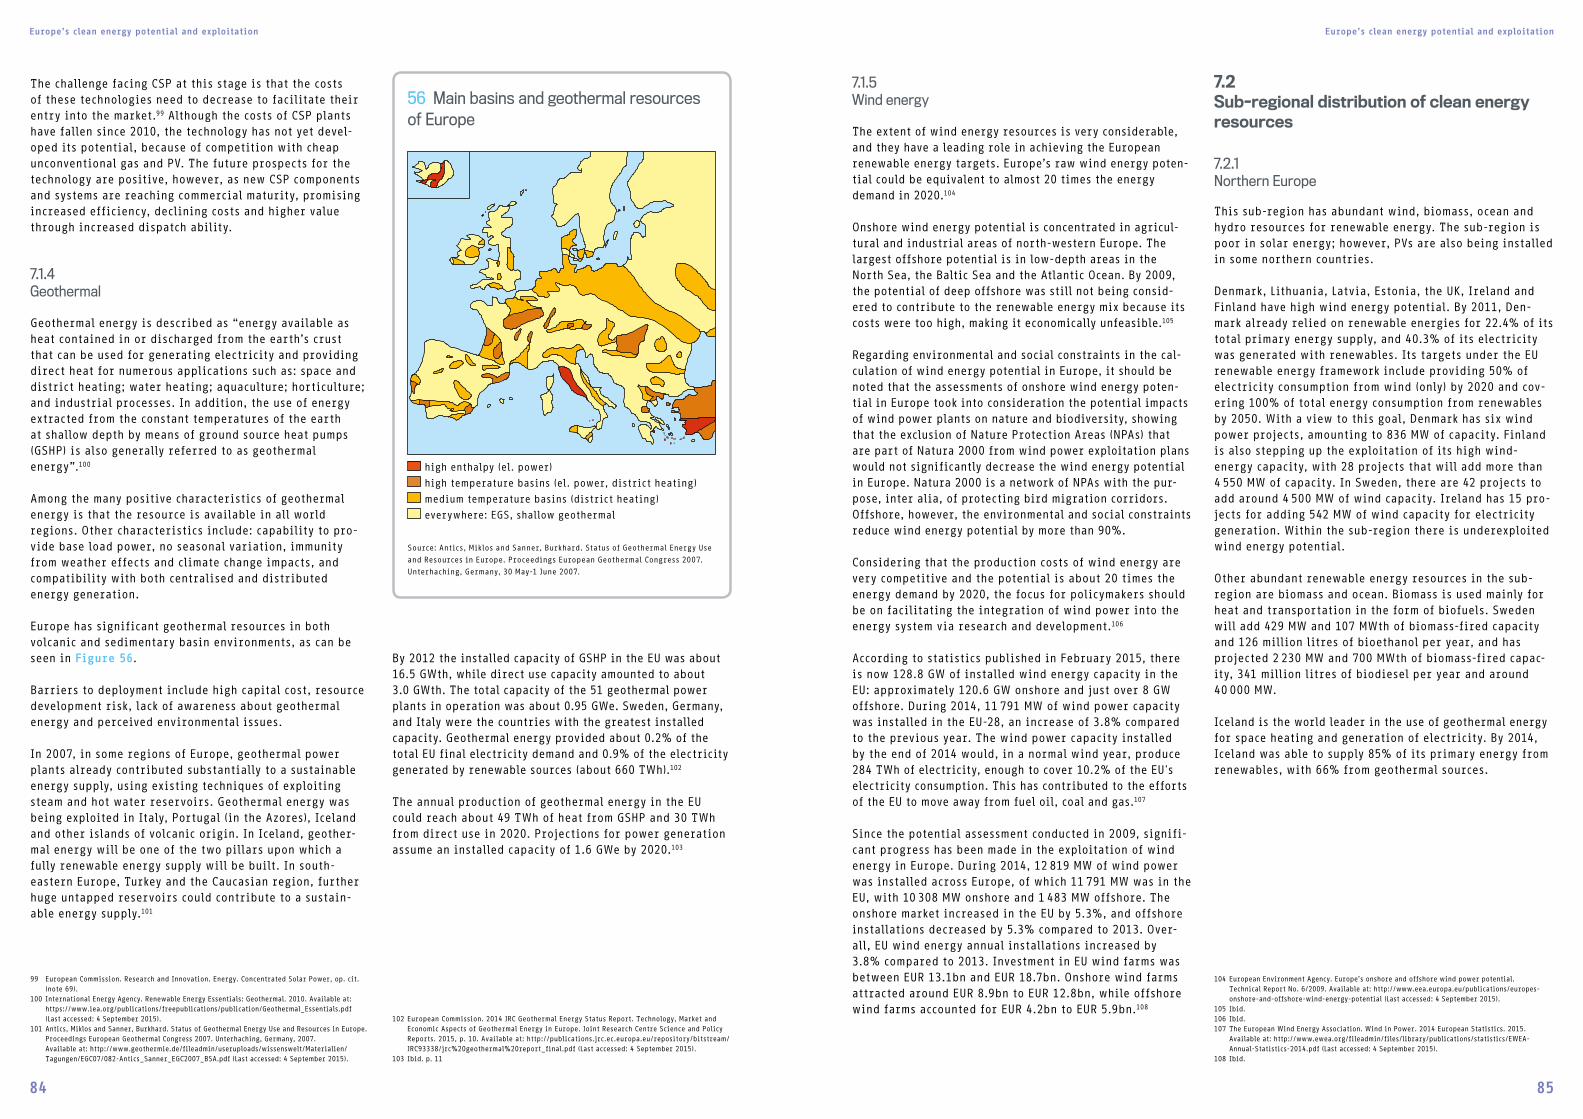
Europe’s clean energy potential and exploitation Europe’s clean energy potential and exploitation
84 85
The challenge facing CSP at this stage is that the costs of these technologies need to decrease to facilitate their entry into the market.99 Although the costs of CSP plants have fallen since 2010, the technology has not yet devel-oped its potential, because of competition with cheap unconventional gas and PV. The future prospects for the technology are positive, however, as new CSP components and systems are reaching commercial maturity, promising increased efficiency, declining costs and higher value through increased dispatch ability.
7.1.4Geothermal
Geothermal energy is described as “energy available as heat contained in or discharged from the earth’s crust that can be used for generating electricity and providing direct heat for numerous applications such as: space and district heating; water heating; aquaculture; horticulture; and industrial processes. In addition, the use of energy extracted from the constant temperatures of the earth at shallow depth by means of ground source heat pumps (GSHP) is also generally referred to as geothermal energy”.100
Among the many positive characteristics of geothermal energy is that the resource is available in all world regions. Other characteristics include: capability to pro-vide base load power, no seasonal variation, immunity from weather effects and climate change impacts, and compatibility with both centralised and distributed energy generation.
Europe has significant geothermal resources in both volcanic and sedimentary basin environments, as can be seen in Figure 56.
Barriers to deployment include high capital cost, resource development risk, lack of awareness about geothermal energy and perceived environmental issues.
In 2007, in some regions of Europe, geothermal power plants already contributed substantially to a sustainable energy supply, using existing techniques of exploiting steam and hot water reservoirs. Geothermal energy was being exploited in Italy, Portugal (in the Azores), Iceland and other islands of volcanic origin. In Iceland, geother-mal energy will be one of the two pillars upon which a fully renewable energy supply will be built. In south- eastern Europe, Turkey and the Caucasian region, further huge untapped reservoirs could contribute to a sustain-able energy supply.101
By 2012 the installed capacity of GSHP in the EU was about 16.5 GWth, while direct use capacity amounted to about 3.0 GWth. The total capacity of the 51 geothermal power plants in operation was about 0.95 GWe. Sweden, Germany, and Italy were the countries with the greatest installed capacity. Geothermal energy provided about 0.2% of the total EU final electricity demand and 0.9% of the electricity generated by renewable sources (about 660 TWh).102
The annual production of geothermal energy in the EU could reach about 49 TWh of heat from GSHP and 30 TWh from direct use in 2020. Projections for power generation assume an installed capacity of 1.6 GWe by 2020.103
7.1.5Wind energy
The extent of wind energy resources is very considerable, and they have a leading role in achieving the European renewable energy targets. Europe’s raw wind energy poten-tial could be equivalent to almost 20 times the energy demand in 2020.104
Onshore wind energy potential is concentrated in agricul-tural and industrial areas of north-western Europe. The largest offshore potential is in low-depth areas in the North Sea, the Baltic Sea and the Atlantic Ocean. By 2009, the potential of deep offshore was still not being consid-ered to contribute to the renewable energy mix because its costs were too high, making it economically unfeasible.105
Regarding environmental and social constraints in the cal-culation of wind energy potential in Europe, it should be noted that the assessments of onshore wind energy poten-tial in Europe took into consideration the potential impacts of wind power plants on nature and biodiversity, showing that the exclusion of Nature Protection Areas (NPAs) that are part of Natura 2000 from wind power exploitation plans would not significantly decrease the wind energy potential in Europe. Natura 2000 is a network of NPAs with the pur-pose, inter alia, of protecting bird migration corridors. Offshore, however, the environmental and social constraints reduce wind energy potential by more than 90%.
Considering that the production costs of wind energy are very competitive and the potential is about 20 times the energy demand by 2020, the focus for policymakers should be on facilitating the integration of wind power into the energy system via research and development.106
According to statistics published in February 2015, there is now 128.8 GW of installed wind energy capacity in the EU: approximately 120.6 GW onshore and just over 8 GW offshore. During 2014, 11 791 MW of wind power capacity was installed in the EU-28, an increase of 3.8% compared to the previous year. The wind power capacity installed by the end of 2014 would, in a normal wind year, produce 284 TWh of electricity, enough to cover 10.2% of the EU's electricity consumption. This has contributed to the efforts of the EU to move away from fuel oil, coal and gas.107
Since the potential assessment conducted in 2009, signifi-cant progress has been made in the exploitation of wind energy in Europe. During 2014, 12 819 MW of wind power was installed across Europe, of which 11 791 MW was in the EU, with 10 308 MW onshore and 1 483 MW offshore. The onshore market increased in the EU by 5.3%, and offshore installations decreased by 5.3% compared to 2013. Over-all, EU wind energy annual installations increased by 3.8% compared to 2013. Investment in EU wind farms was between EUR 13.1bn and EUR 18.7bn. Onshore wind farms attracted around EUR 8.9bn to EUR 12.8bn, while offshore wind farms accounted for EUR 4.2bn to EUR 5.9bn.108
7.2Sub-regional distribution of clean energy resources
7.2.1 Northern Europe
This sub-region has abundant wind, biomass, ocean and hydro resources for renewable energy. The sub-region is poor in solar energy; however, PVs are also being installed in some northern countries.
Denmark, Lithuania, Latvia, Estonia, the UK, Ireland and Finland have high wind energy potential. By 2011, Den-mark already relied on renewable energies for 22.4% of its total primary energy supply, and 40.3% of its electricity was generated with renewables. Its targets under the EU renewable energy framework include providing 50% of electricity consumption from wind (only) by 2020 and cov-ering 100% of total energy consumption from renewables by 2050. With a view to this goal, Denmark has six wind power projects, amounting to 836 MW of capacity. Finland is also stepping up the exploitation of its high wind-energy capacity, with 28 projects that will add more than 4 550 MW of capacity. In Sweden, there are 42 projects to add around 4 500 MW of wind capacity. Ireland has 15 pro-jects for adding 542 MW of wind capacity for electricity generation. Within the sub-region there is underexploited wind energy potential.
Other abundant renewable energy resources in the sub-region are biomass and ocean. Biomass is used mainly for heat and transportation in the form of biofuels. Sweden will add 429 MW and 107 MWth of biomass-fired capacity and 126 million litres of bioethanol per year, and has projected 2 230 MW and 700 MWth of biomass-fired capac-ity, 341 million litres of biodiesel per year and around 40 000 MW.
Iceland is the world leader in the use of geothermal energy for space heating and generation of electricity. By 2014, Iceland was able to supply 85% of its primary energy from renewables, with 66% from geothermal sources.
102 European Commission. 2014 JRC Geothermal Energy Status Report. Technology, Market and Economic Aspects of Geothermal Energy in Europe. Joint Research Centre Science and Policy Reports. 2015, p. 10. Available at: http://publications.jrc.ec.europa.eu/repository/bitstream/JRC93338/jrc%20geothermal%20report_final.pdf (Last accessed: 4 September 2015).
103 Ibid. p. 11
104 European Environment Agency. Europe’s onshore and offshore wind power potential. Technical Report No. 6/2009. Available at: http://www.eea.europa.eu/publications/europes-onshore-and-offshore-wind-energy-potential (Last accessed: 4 September 2015).
105 Ibid. 106 Ibid. 107 The European Wind Energy Association. Wind in Power. 2014 European Statistics. 2015.
Available at: http://www.ewea.org/fileadmin/files/library/publications/statistics/EWEA-Annual-Statistics-2014.pdf (Last accessed: 4 September 2015).
108 Ibid.
99 European Commission. Research and Innovation. Energy. Concentrated Solar Power, op. cit. (note 69).
100 International Energy Agency. Renewable Energy Essentials: Geothermal. 2010. Available at: https://www.iea.org/publications/freepublications/publication/Geothermal_Essentials.pdf (Last accessed: 4 September 2015).
101 Antics, Miklos and Sanner, Burkhard. Status of Geothermal Energy Use and Resources in Europe. Proceedings European Geothermal Congress 2007. Unterhaching, Germany, 2007. Available at: http://www.geothermie.de/fileadmin/useruploads/wissenswelt/Materialien/Tagungen/EGC07/082-Antics_Sanner_EGC2007_BSA.pdf (Last accessed: 4 September 2015).
56 Main basins and geothermal resources of Europe
high enthalpy (el. power)
high temperature basins (el. power, district heating)
medium temperature basins (district heating)
everywhere: EGS, shallow geothermal
Source: Antics, Miklos and Sanner, Burkhard. Status of Geothermal Energy Use
and Resources in Europe. Proceedings European Geothermal Congress 2007.
Unterhaching, Germany, 30 May-1 June 2007.
Europe’s clean energy potential and exploitation Europe’s clean energy potential and exploitation
86 87
7.2.2Eastern Europe
In this European sub-region, the renewable energy resources provide a mosaic of clean energy potential that is awaiting exploitation. In general, though with some exceptions, energy consumption per capita is lower than the European average, with heavy reliance on fossil fuels to meet energy demands.
Bulgaria is a country with vast wind, solar, hydro, biomass and geothermal potential. Currently, 7.1% of its primary energy supply is from renewables. By 2020, Bulgaria aims to provide 16% of its final energy from renewables; it has one small hydropower project that will add 80 MW of capacity, and has announced 12 PV projects that together would add a further 185 MW of installed capacity, as well as 23 wind power projects to install a capacity of 2 300 MW.
The Czech Republic is one of the countries in the sub-region with more diversity of renewable energy resources, second only to Romania. The Czech Republic is rich in wind, hydro, biomass and geothermal. By 2013 its share of renewables in the total primary energy supply was 12.4%,109 which is to increase to 13.5% by 2020. It aims to achieve this objective by exploiting its solar, biomass and wind energy resources. Its main source of renewable energy is biomass, accounting for 87.2% of total renewable energy production. There is also potential to develop hydro and geothermal.
Romania is going in the same direction as the Czech Republic, developing solar, wind and biomass energy resources. Romania had set a goal of 24% of renewable energy in total energy generation by 2020, which has already been achieved, far in advance of the target date.110 There is further potential for exploiting geothermal and hydro power. In the latter field, Romania is one of the sub-region's leaders, with hydropower taking a 23.1% share in total renewable energy generation; the only country where this proportion is higher, at 28.4%, is Slovakia.111
Poland, Slovakia and Hungary are generating energy from geothermal resources and biomass. By 2013, the share of renewables in primary energy supply was 11.3% in Poland, 9.8% in Slovakia and Hungary, which is already very close to the targets that they had set for 2020, i.e. 15%, 14% and 13% respectively.112 The share of geothermal energy in total renewable energy generation is 5.4% in Hungary, 0.2% in Poland and 0.4% in Slovakia. Poland and Hungary produce more than 90% of their renewable energy from biomass.
7.2.3Western Europe
Austria is rich in solar, hydro, geothermal and biomass resources, which it is successfully exploiting. By 2011, 26.3% of its total primary energy supply was from renew-able energies.113 Its target is to have 45% of final energy from renewables by 2020. Austria is the leader in hydro-power generation in this sub-region, with 38.1% of its renewable energy production by 2013. The next source of energy is biomass, with 56.2% of Austria’s renewable energy production, this being the country with the small-est share of biomass in the sub-region.114
Germany and Belgium are mainly rich in wind resources, although they also have some hydropower and biomass potential. Their prime current source of energy is biomass, with 70.8% and 79.7% respectively of total renewable energy production. After biomass, wind and solar are the most developed sources of renewable energy. Germany leads solar production in the sub-region, with a share of 9.6% in renewable energies; Belgium takes second place, with 8.4%. The situation in wind energy is similar: Ger-many leads the sub-region, with 13.2%; Belgium is in third place, with 10.7% of wind energy in total renewable energy generation in 2013. Both countries have several projects to increase the installed capacity in biomass and geothermal energy.
France is one of the countries with more diversity in renewable energy resources, including wind, solar, hydro, biomass, geothermal and ocean. By 2011, 7.2% of its total primary energy supply was from renewable energies. Its target is to achieve 23% of final energy from renewables by 2020. France produces renewable energy mostly from biomass and hydropower, with 70.8% and 26.3% of total renewable energy. On a smaller scale, it also produces wind, solar and geothermal energy.
The Netherlands is mainly rich in biomass and wind energy. The country's share of renewable energies in total primary energy supply amounted to 4.2% by 2011. Its target is to increase this to 14% by 2020. In 2013, its chief resources for renewable energies were biomass and wind, with 86.3% and 11.3% respectively of total renewable energy production. It also produces energy from solar, hydro-power and geothermal, but to a lesser extent. Its projects for increasing installed capacity are mainly in biomass and wind power.
7.2.4Southern Europe
This sub-region is privileged in terms of renewable energy resources. Whereas the North is richer in wind, the South has clear skies and sunny days throughout the year, and therefore solar power has the most potential. There is also geothermal potential, as well as hydropower.
Malta covers 72.6% of its renewable energy from solar power; the remaining 27.4% is from biomass. This share is the highest in the region. Greece and Spain also have high shares of solar energy in their total renewable energy production, with 20.1% and 25.4% respectively in 2013.
Greece, Spain and Portugal have a more diversified renew-able energy mix. Greece derives 21.9% of its renewable energy from hydropower, 14.3% from wind, 43% from bio-mass and 0.3% from geothermal. Spain has shares of 26.7% from wind power (the highest in the sub-region), 39.9% from biomass, 18.2% from hydropower and 0.1% from geo-thermal in total renewable energy production. Portugal produces 18.4% of its total renewable energy from wind, 55.4% from biomass, 21% from hydropower, 2% from solar, and, remarkably, 3.2% from geothermal. By 2011, Greece and Spain covered 11.7% of their total energy supply from renewables. Their target by 2020 is to increase this pro-portion to 20%, which appears entirely feasible, since by 2013 they had already reached 15% of renewable energies. In Portugal, 22.4% of the total energy supply was from renewable energies by 2011; the country's target for 2020 is to increase this share to 31%.
Cyprus has a small share of renewable energies (5.1%) in its total primary energy supply, and only 3.1% of its elec-tricity generation is from renewables. Cyprus has high solar energy potential and medium wind potential, but hydro, biomass and ocean power are low. At present, 64.1% of its renewable energy comes from solar, 18.3% from wind, 16.3% from biomass and 1.4% from geothermal.115 The country aims to double its share of renewables in final energy supply by 2020. To this end, it has announced a number of projects to increase its capacity in biomass, solar and wind installed capacity, to a total of 114.7 MW.
Albania and Montenegro are the countries of the sub-region with the highest shares of hydropower in the total of renewable energy production, with 73.7% and 55.3% respectively. Both countries complement hydropower with energy produced from biomass, with 24.8% and 44.7% respectively. However, they are not the only countries that exploit hydropower resources; Croatia and Macedonia also produce 45.9% and 44.8% of their total renewable energy mix from hydropower, combining this with biomass. Mac-edonia uses also geothermal power to produce energy, with a 3% share of the renewable energy mix.
109 Eurostat news release, 10 March 2015. Renewable energy in the EU, op. cit. (note 1). 110 Quartz. Three European countries have already hit their 2020 renewable energy goals.
10 March 2015. Available at: http://qz.com/359415/three-european-countries-have-already- hit-their-2020-renewable-energy-goals/ (Last accessed: 4 September 2015).
111 Eurostat. Statistics Explained. Primary Production of Renewable Energy between 2003 and 2013, op. cit. (note 82).
112 Eurostat news release, 10 March 2015. Renewable Energy in Europe, op. cit. (note 1).
115 Eurostat. Statistics Explained. Primary Production of Renewable Energy between 2003 and 2013. 2015. Available at: http://ec.europa.eu/eurostat/statistics-explained/images/8/8b/Primary_production_of_renewable_energy%2C_2003_and_2013_YB15.png (Last accessed: 4 September 2015).
Italy, Slovenia and Macedonia are the three countries with the highest proportion of renewable energy from geothermal power. Italy produces 21.3% from geothermal, and is the country in Europe with the highest share of this resource. Slovenia and Macedonia follow, with 3.6% and 3% respectively.
113 IRENA. Renewable Energy Country Profiles European Union. EU-27. Available at: http://www.irena.org/DocumentDownloads/Publications/_EU27Complete.pdf (Last accessed: 4 September 2015).
114 Eurostat. Statistics Explained. Primary Production of Renewable Energy between 2003 and 2013, op. cit. (note 82).
Units:
Terawatthours (TWh) = 109 kWh GW of electrical output (GWe) = 106 MWPetajoules (PJ) = 109 MJExajoule (EJ) = 1 012 MJ1 kWh = 3.6 MJThe power in megawatts of an electricity generating plant may be expressed as MWe or MWt (or MWth)
Wind power, Bouches du Rhône, France
8KEY FINDINGS AND CONCLUSIONS
Key findings and conclusions Key findings and conclusions
88 89
Key findings and conclusions Key findings and conclusions
90 91
This report has brought together data on patents, trade flows, foreign direct investments, climate change policies, CO
2 emissions, public R&D expenditures and renewable energy deployment and potential, in order to provide a comprehensive and up-to-date picture of invention and associated economic activities in climate change mitiga-tion technologies, worldwide and specifically in Europe.
This chapter presents the key findings from the explora-tion of this large and unique dataset.
8.1Key findings
Globally, there has been a continuous growth in inventive activity in climate change mitigation technologies since 1995, in particular in clean energy technologies, CCMTs related to transportation and CCMTs related to buildings. Between 1995 and 2011, the number of CCMT inventions developed annually in the world increased almost fivefold, from 11 000 to 51 000. This growth was even faster than in other technologies, with the share of CCMTs rising from 2% to nearly 6% of all global inventive activity. Further-more, there is evidence that the average value of these inventions, as indicated by their international diffusion, has also increased: the number of “high-value” inventions, for which protection was sought in at least two countries, rose even more sharply, from around 2 500 in 1995 to just under 17 000 in 2011.
Europe appears to be a major global centre for CCMT invention activity. In line with developments across the world, invention in CCMTs in Europe increased by a factor of five, from 1 765 inventions in 1995 to over 9 000 in 2011, and with an acceleration of the growth rate since 2005. While it is difficult to compare patents filed in different jurisdictions, the metric used in this report indicates that Europe is the world’s leader in CCMT inven-tions, ahead of Japan, the US, Korea and China. European inventors are responsible for around 40% of high-value CCMT inventions developed in the world. This proportion has remained stable across the 16-year period of analysis, despite increasing competition from China and Korea. The number of high-value inventions from Europe has multi-plied by roughly six, from less than 1 000 in 1995 to just under 6 000 in 2011.
This remarkable increase in Europe’s inventive activity is driven mainly by developments in renewable energy (such as wind and solar power), energy storage (including fuel cells and hydrogen) and road transportation techno-logies (efficient combustion engines, electric and hybrid vehicles). In other fields, in particular smart grid tech-nologies, which are key to the large-scale deployment of renewable energy, the numbers of inventions have remained relatively small.
Compared to CCMT inventions worldwide, Europe’s relative performance is particularly strong in CCMTs related to transportation and smart grids, and carbon capture and storage. It is somewhat lower, but still significant, in clean energy technologies and in the buildings sector.
The degree of specialisation is increasing, as in Japan and Korea. Within Europe, inventiveness appears highly concentrated, with five countries accounting for 80% of inventive activity. It is clearly dominated by Germany, with almost half of Europe’s CCMT inventions in the most recent period for which data is available, followed by France, Spain, Italy and the UK. In renewable energy, Ger-many’s invention performance is fully four times greater than that of the second main inventor country, France.
Germany’s performance is partly a reflection of its eco-nomic size, but more importantly, it also has the highest number of CCMT inventions per unit of GDP. In terms of this indicator, it is followed by Sweden, France and Finland. Interestingly, the data reveals that some countries, such as Greece and Portugal, which are less active in innovation overall, are nevertheless highly specialised in CCMTs.
Between 1995 and 2011, only 3.2% of European CCMT inventions resulted from cooperation between inventors located in at least two different European countries. This number is comparable to the proportion of inventions developed between European countries and the rest of the world (3.5%). However, an interesting feature of European inventive activity in CCMT is that intra-European coopera-tion in these technologies is developing at a much faster rate than in others, from 1.7% in 1995 to 4.1% in 2011. It has even surpassed that between European and non-European inventors, which rose from 2.2% to 3.8% in the same period.
Not surprisingly, the intellectual property rights associ-ated with European inventions are primarily protected in Europe, but they are also widely and increasingly pro-tected around the world. For example, in 2010, 38% of European CCMT inventions gave rise to patent filings in the US, 25% in China, 14% in Japan and 10% in Korea. On average, CCMT patents are filed in two jurisdictions, while roughly 13% are filed in five or more jurisdictions. This distribution is similar to that for non-CCMT technologies.
Europe also appears as the world’s main market for CCMT, as measured by patent filings from both Europe and over-seas. There is considerable variation across technologies; for example, Europe is the main destination for wind power patent applications, but comes after Japan, the US and China for solar PV. Although European inventors, in particular from Germany, France and the UK, are the main source of European CCMT patent filings, US, Japanese and Korean inventors are also among the top ten contributors. The number of European CCMT patent applications with Chinese inventors still remains relatively small.
A consequence of Europe’s strong inventive activity is that the region is one of the world’s main exporters of CCMT products. However, it is also a large importer of CCMT goods. Overall, Europe is a net importer of CCMT products, whereas Japan, China and the US are net exporters. Signifi-cantly, tariffs on European exports are on average around 4%, several times higher than the average European import tariffs on CCMT goods (less than 1%). Europe’s main trading partners in CCMT are China and the US. However, there are also important differences within Europe: for example, Germany is a net exporter of CCMT products to the rest of Europe. Europe also appears as a major source of foreign direct investment in CCMT, surpassing even that of the US, with investments spanning all continents. Germany and France are the largest source countries of intra-European FDI in CCMTs.
The analysis also reveals a strong statistical relationship between cross-border patent filings, trade flows and FDI. While this relationship has been observed for other technologies as well, it confirms that patent protection facilitates incoming trade and investment flows and may thus encourage the international transfer of CCMTs through these channels.
An analysis of Europe’s climate change policy stringency, combined with a review of the economic literature, sug-gests that policies which put a price on carbon emissions, such as fuel taxes and the European emissions trading system, and other regulatory measures, such as emission standards for new vehicles, have a key significance for Europe’s performance in CCMT invention. A likely conse-quence of these policies, and of the induced invention response, is that the carbon intensity of Europe’s GDP fell sharply between 1995 and 2010 by over 30%, from over 320g of CO
2 per euro of GDP to less than 220g, and has remained the world’s lowest since before 2000.
Evidence also suggests that Europe’s performance has been partly supported by direct public financing for research and development. Government funding in Europe for R&D activities in CCMT has doubled since 2000, from EUR 2.2bn annually to EUR 4.5bn, which represents around 0.05% of Europe’s GDP, and is of a similar order of magnitude to the US and Japan. However, European public R&D expenditures on CCMTs are still below the level of 1985. Moreover, some key enabling technologies, such as smart grids and carbon capture and storage, receive very small amounts of public money compared to nuclear and renewable energy.
Key findings and conclusions Key findings and conclusions
92 93
Renewable energy (RE) already accounted for some 15% of energy in the European Union in 2013, and the EU can already claim three times more renewable power per capita than anywhere else in the world. It has further ambitious goals to reduce CO
2 emissions by 20% in 2020, and 80% by 2050. The current source of over 50% of the EU’s renewable energy is biomass, together with 18% hydro, 10% wind, 5% solar, 4% heat pumps and nearly 1% geothermal, but all of these technologies still have huge untapped potential. For instance, biomass could account for two-thirds of the RE target in 2020, while wind energy is projected to supply half of Denmark’s electricity by 2020, and the raw potential of wind power could meet the EU’s energy needs 20 times over.
Policy has had a marked impact on European CCMT develop-ments. Thermal and photovoltaic solar energy has had strong support in Germany and Spain in particular, and many regions have promoted the use of wind power. Bio-fuels have also had pan-European support. However, in many fields, the implementation of RE policies must also deal with environmental issues, such as land use and competition with food in the case of biomass production, and visual impact in the case of wind power.
8.2Conclusions
The data suggests that policies have been successful in encouraging CCMT development in Europe, which today is the world’s main centre for CCMT inventions. The strong and continuing growth in this field of inventive activity has helped Europe to achieve the lowest emissions per unit of GDP worldwide. However, the International Energy Agency estimates that public R&D spending would still need at least to double to achieve the intended carbon emissions reduc-tions (IEA, 2010). Continued and intensified support for CCMT R&D, through carbon pricing mechanisms and policies that support innovation in general, therefore appears essential.
European inventors file a large number of patent applica-tions abroad, in particular in the US, Japan, China and Korea. Climate change policies in these countries, which drive the local demand for CCMT, thus have a direct effect on European inventive activities by providing incentives to develop new technologies and export them to foreign markets. An ambitious global agreement on climate change at the COP21 in Paris could translate into strong climate change mitigation policies in signatory countries. This could have a tremendous positive impact in terms of avoided climate change, and it would also benefit European inventors, who are in a strong position to gain from global initiatives on CCMT inventions.
The analysis shows that European companies derive advantages from the international transfer of their CCMT inventions, which can generate benefits in Europe. They can also generate benefits overseas, in cases where Euro-pean firms trade with or invest in recipient countries through foreign direct investments. In view of the strong statistical relationship between patent filings, trade flows and foreign direct investment, effective patent pro-tection in destination countries could encourage trade in CCMTs and FDI. Policies that increase international technology diffusion could help both to reduce global emissions and to generate more business opportunities for European CCMT inventors.
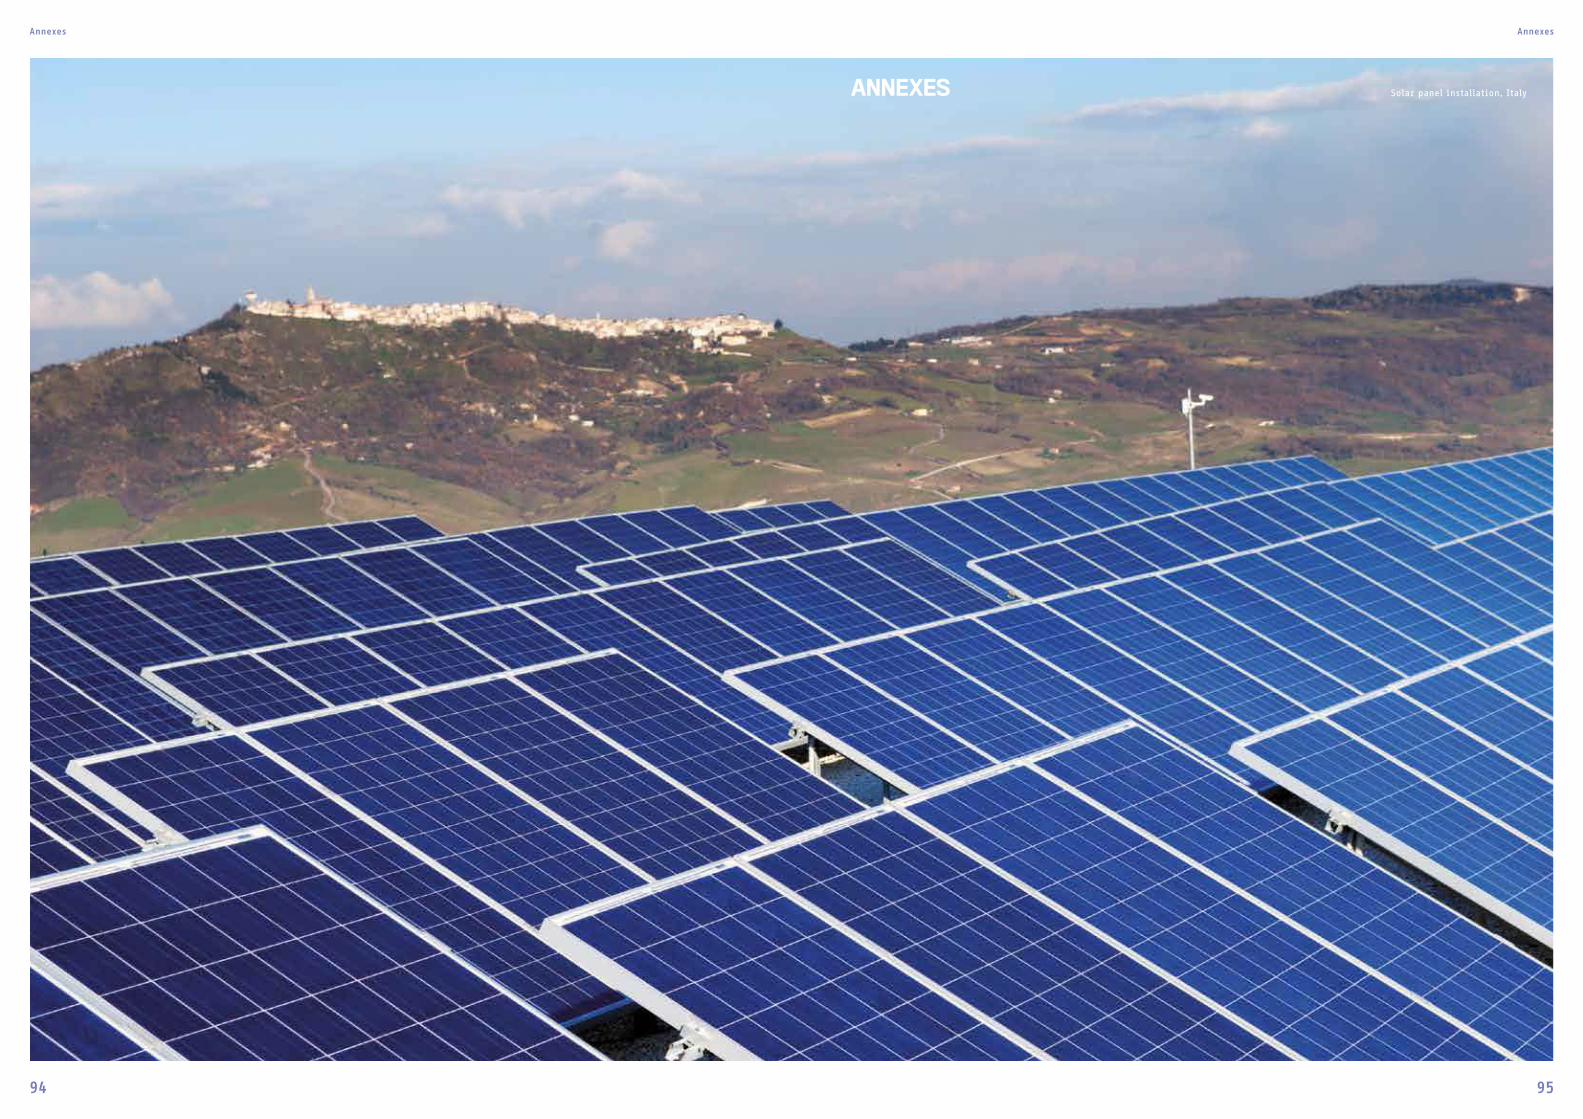
Solar panel installation, Italy
Annexes Annexes
94 95
ANNEXES
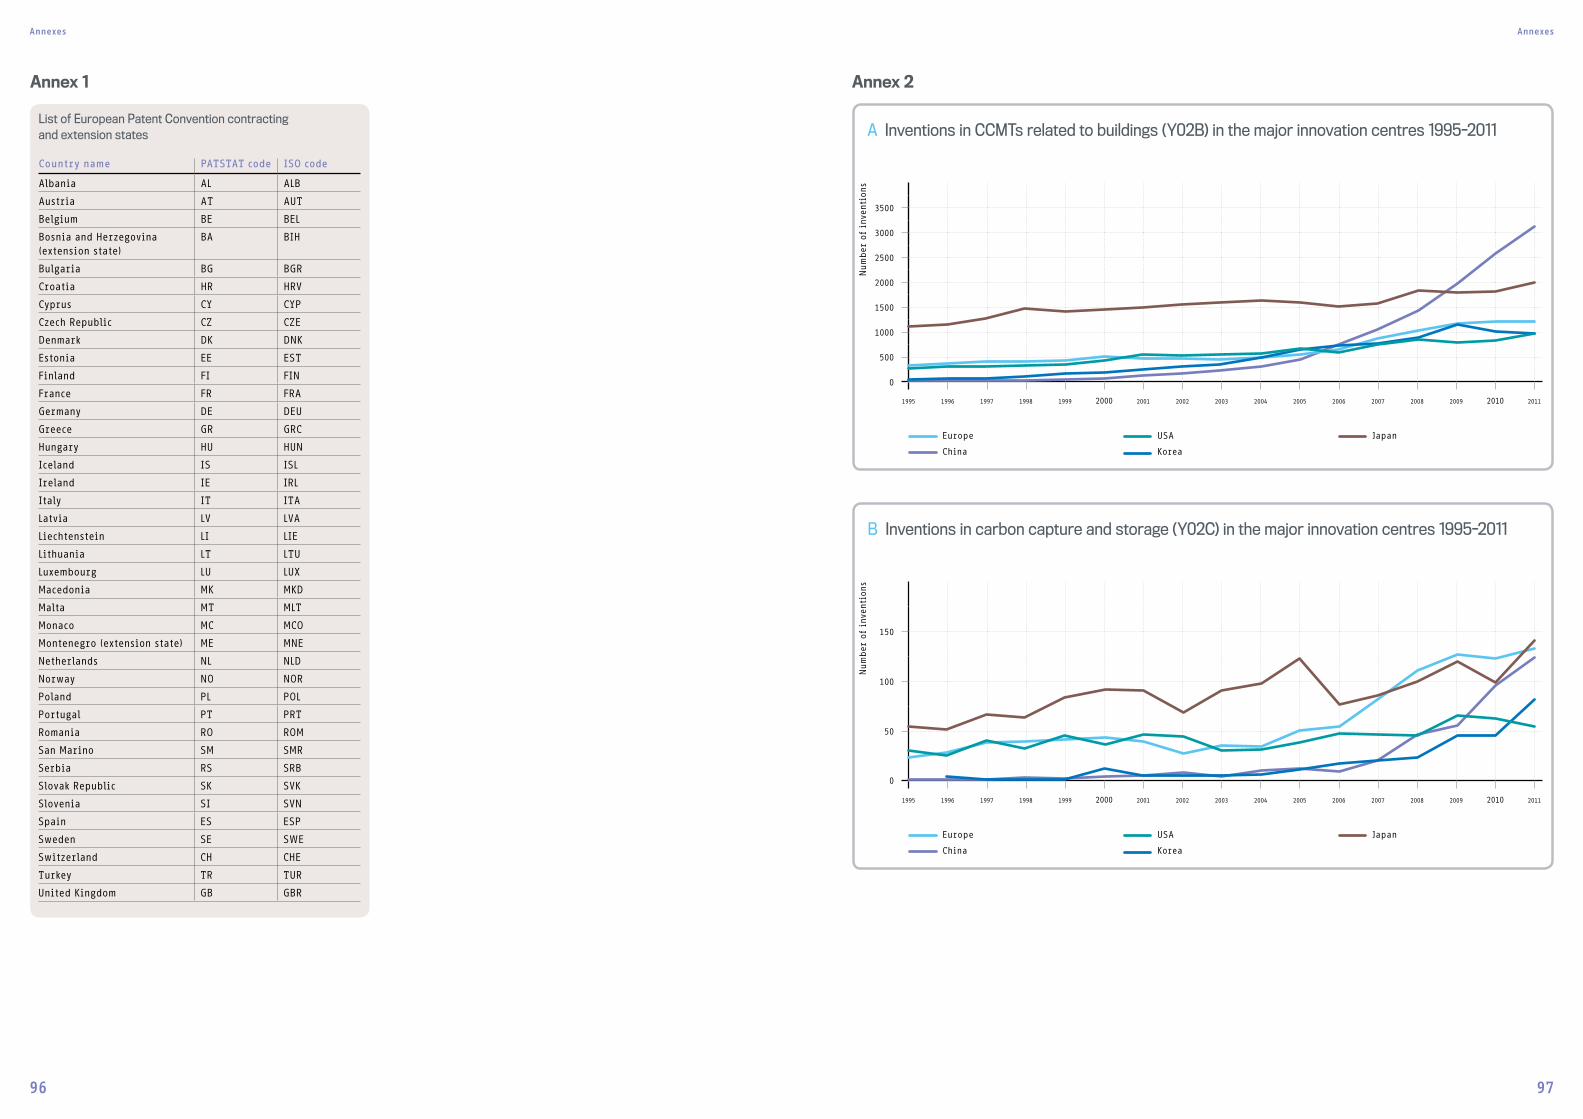
Annexes Annexes
96 97
Annex 1 Annex 2
List of European Patent Convention contracting and extension states
Country name PATSTAT code ISO code
Albania AL ALB
Austria AT AUT
Belgium BE BEL
Bosnia and Herzegovina (extension state)
BA BIH
Bulgaria BG BGR
Croatia HR HRV
Cyprus CY CYP
Czech Republic CZ CZE
Denmark DK DNK
Estonia EE EST
Finland FI FIN
France FR FRA
Germany DE DEU
Greece GR GRC
Hungary HU HUN
Iceland IS ISL
Ireland IE IRL
Italy IT ITA
Latvia LV LVA
Liechtenstein LI LIE
Lithuania LT LTU
Luxembourg LU LUX
Macedonia MK MKD
Malta MT MLT
Monaco MC MCO
Montenegro (extension state) ME MNE
Netherlands NL NLD
Norway NO NOR
Poland PL POL
Portugal PT PRT
Romania RO ROM
San Marino SM SMR
Serbia RS SRB
Slovak Republic SK SVK
Slovenia SI SVN
Spain ES ESP
Sweden SE SWE
Switzerland CH CHE
Turkey TR TUR
United Kingdom GB GBR
3500
3000
2500
2000
1500
1000
500
0
A Inventions in CCMTs related to buildings (Y02B) in the major innovation centres 1995-2011
1995 1996 1997 1998 1999 2000 2001 2002 2003 2004 2005 2006 2007 2008 2009 2010 2011
Europe
China
USA
Korea
Japan
Num
ber
of
inve
ntio
ns
150
100
50
0
B Inventions in carbon capture and storage (Y02C) in the major innovation centres 1995-2011
1995 1996 1997 1998 1999 2000 2001 2002 2003 2004 2005 2006 2007 2008 2009 2010 2011
Europe
China
USA
Korea
Japan
Num
ber
of
inve
ntio
ns
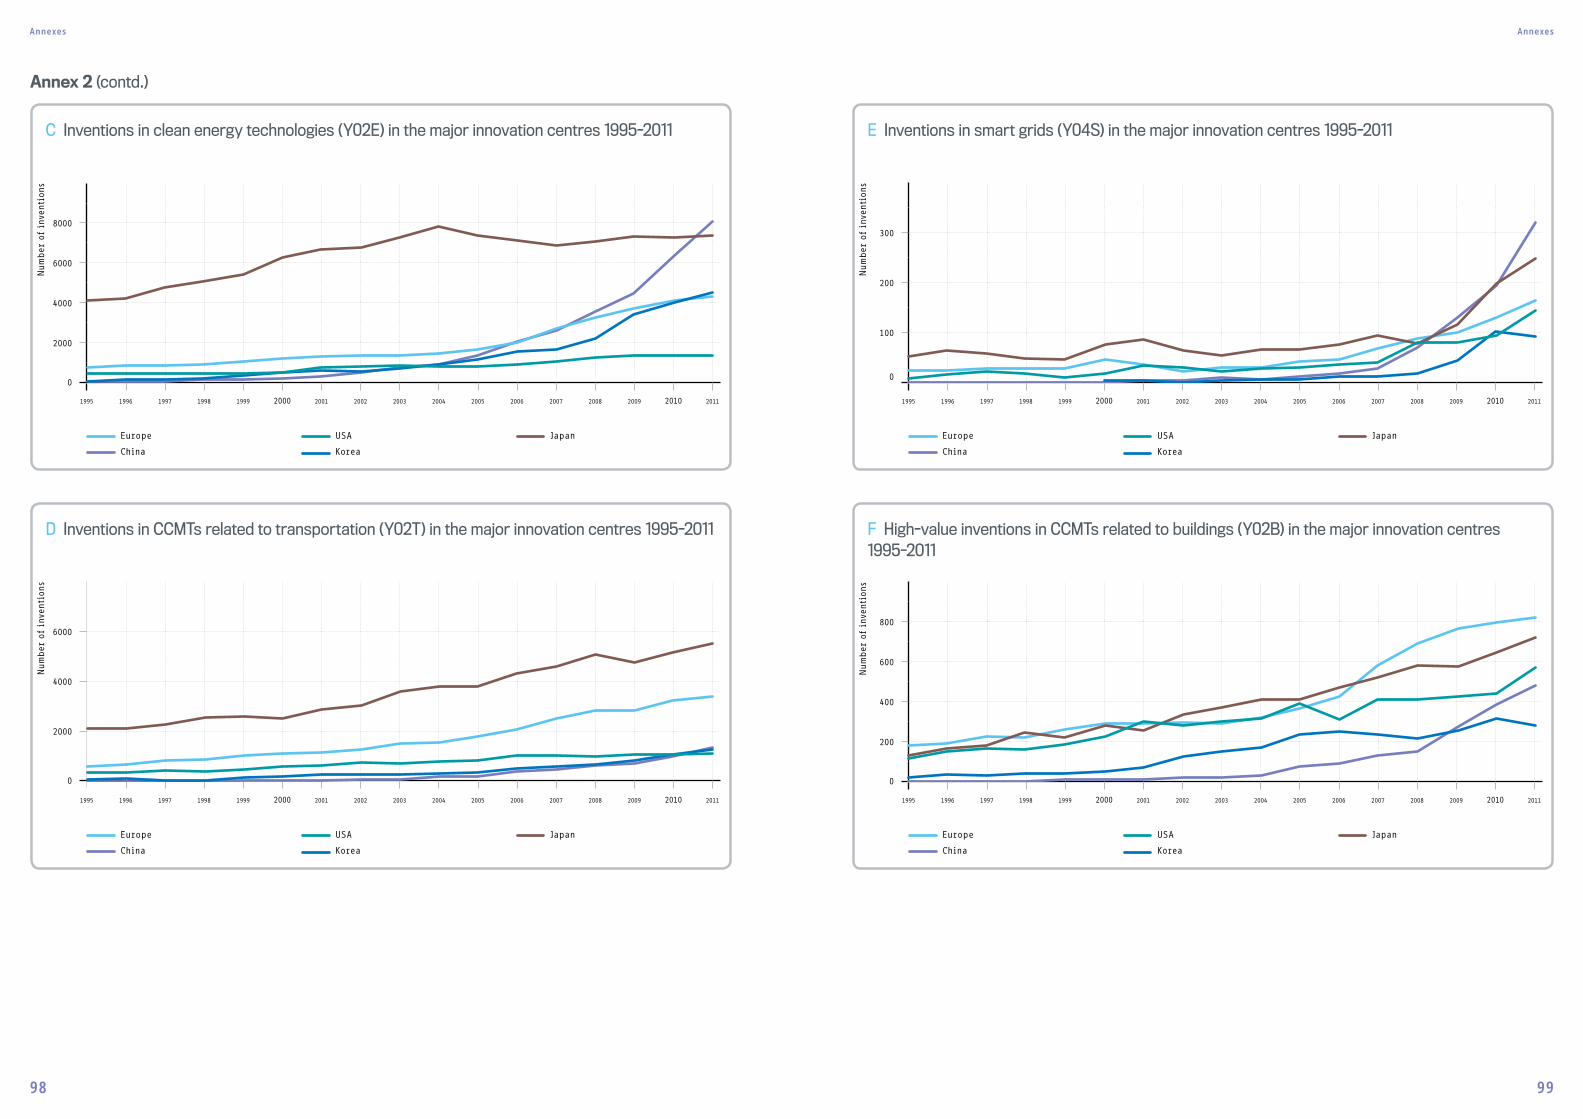
Annexes Annexes
98 99
Annex 2 (contd.)
300
200
100
0
E Inventions in smart grids (Y04S) in the major innovation centres 1995-2011
1995 1996 1997 1998 1999 2000 2001 2002 2003 2004 2005 2006 2007 2008 2009 2010 2011
Num
ber
of
inve
ntio
ns
Europe
China
USA
Korea
Japan
C Inventions in clean energy technologies (Y02E) in the major innovation centres 1995-2011
1995 1996 1997 1998 1999 2000 2001 2002 2003 2004 2005 2006 2007 2008 2009 2010 2011
Europe
China
USA
Korea
Japan
8000
6000
4000
2000
0
Num
ber
of
inve
ntio
ns
800
600
400
200
0
F High-value inventions in CCMTs related to buildings (Y02B) in the major innovation centres 1995-2011
1995 1996 1997 1998 1999 2000 2001 2002 2003 2004 2005 2006 2007 2008 2009 2010 2011
Num
ber
of
inve
ntio
ns
Europe
China
USA
Korea
Japan
D Inventions in CCMTs related to transportation (Y02T) in the major innovation centres 1995-2011
1995 1996 1997 1998 1999 2000 2001 2002 2003 2004 2005 2006 2007 2008 2009 2010 2011
Europe
China
USA
Korea
Japan
6000
4000
2000
0
Num
ber
of
inve
ntio
ns
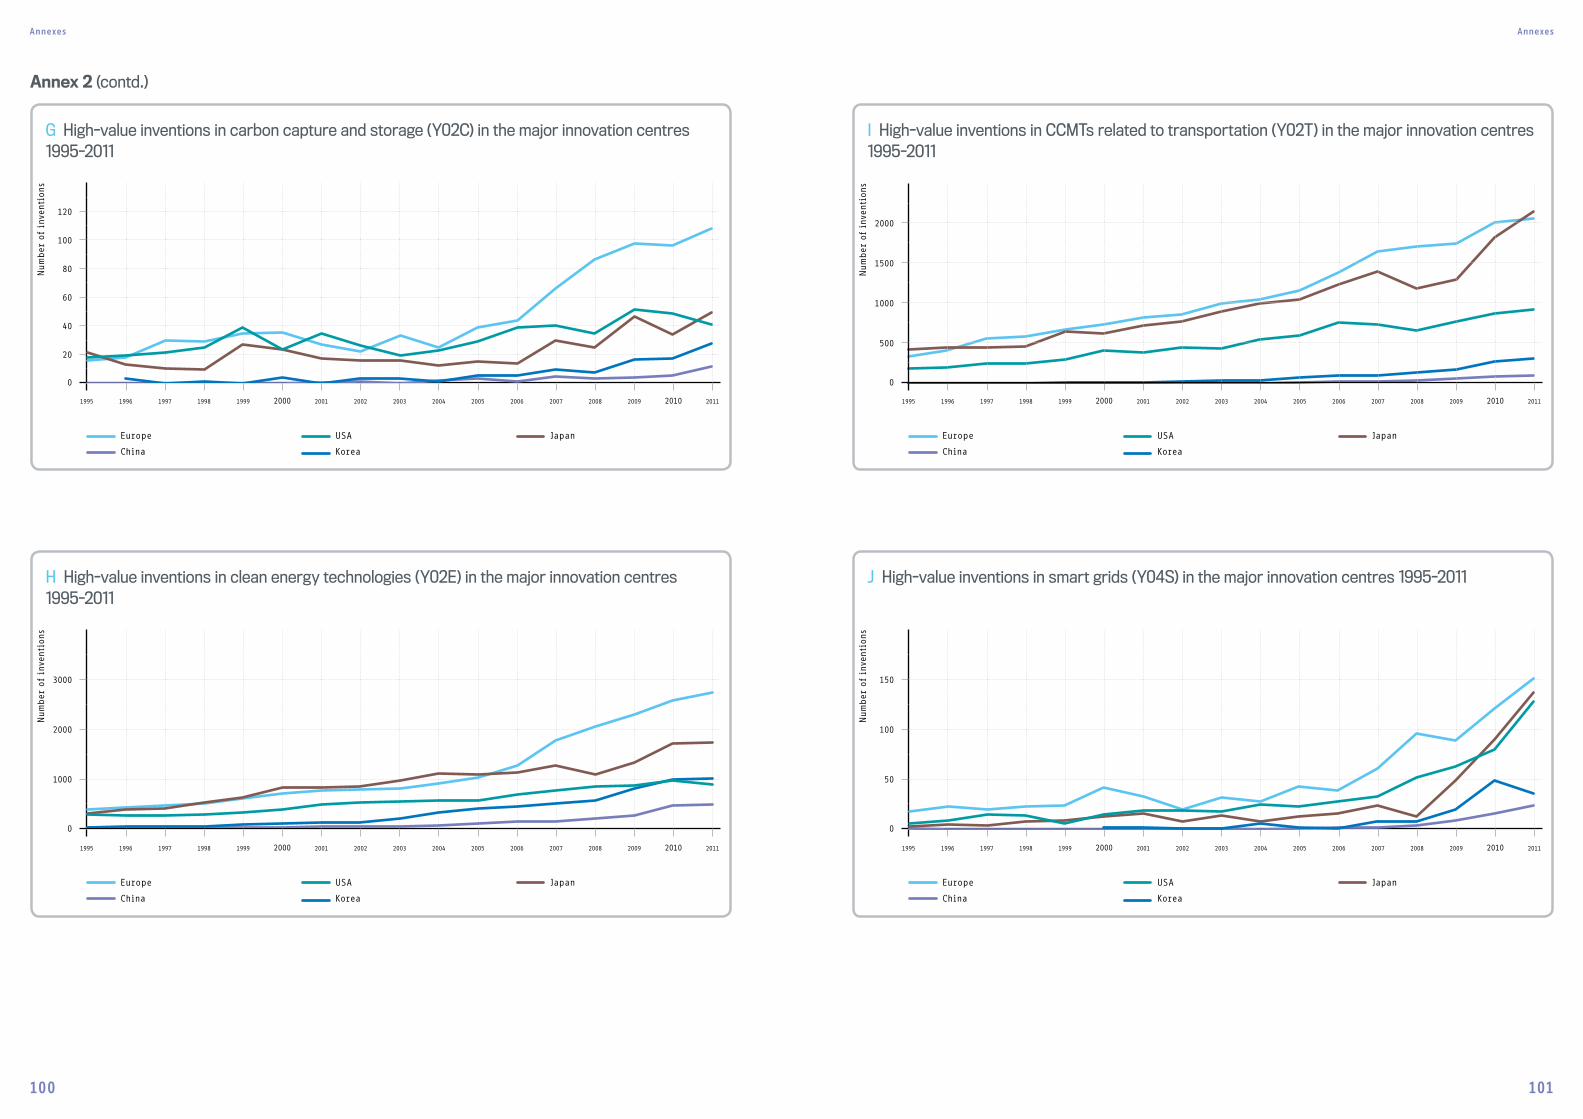
Annexes Annexes
100 101
Annex 2 (contd.)
I High-value inventions in CCMTs related to transportation (Y02T) in the major innovation centres 1995-2011
1995 1996 1997 1998 1999 2000 2001 2002 2003 2004 2005 2006 2007 2008 2009 2010 2011
Europe
China
USA
Korea
Japan
2000
1500
1000
500
0
Num
ber
of
inve
ntio
ns
120
100
80
60
40
20
0
G High-value inventions in carbon capture and storage (Y02C) in the major innovation centres 1995-2011
1995 1996 1997 1998 1999 2000 2001 2002 2003 2004 2005 2006 2007 2008 2009 2010 2011
Num
ber
of
inve
ntio
ns
Europe
China
USA
Korea
Japan
J High-value inventions in smart grids (Y04S) in the major innovation centres 1995-2011
1995 1996 1997 1998 1999 2000 2001 2002 2003 2004 2005 2006 2007 2008 2009 2010 2011
Europe
China
USA
Korea
Japan
150
100
50
0
Num
ber
of
inve
ntio
ns
H High-value inventions in clean energy technologies (Y02E) in the major innovation centres 1995-2011
1995 1996 1997 1998 1999 2000 2001 2002 2003 2004 2005 2006 2007 2008 2009 2010 2011
Europe
China
USA
Korea
Japan
3000
2000
1000
0
Num
ber
of
inve
ntio
ns
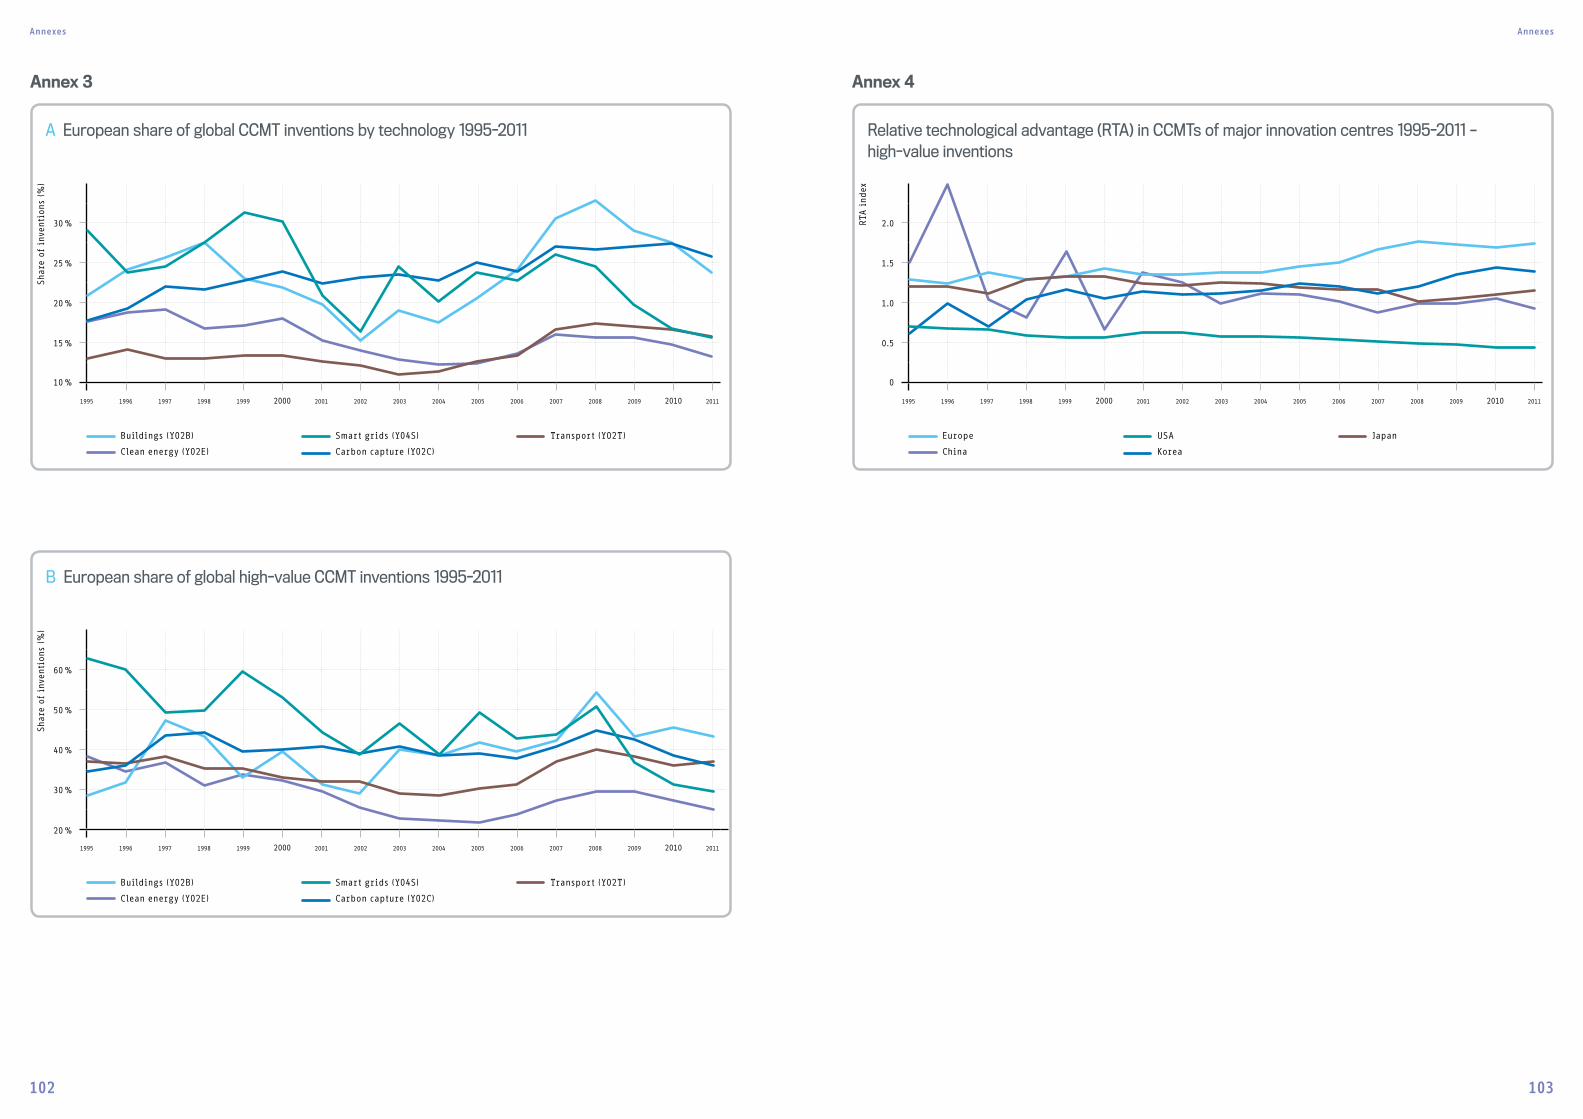
Annexes Annexes
102 103
Annex 3 Annex 4
Relative technological advantage (RTA) in CCMTs of major innovation centres 1995-2011 – high-value inventions
1995 1996 1997 1998 1999 2000 2001 2002 2003 2004 2005 2006 2007 2008 2009 2010 2011
Europe
China
USA
Korea
Japan
2.0
1.5
1.0
0.5
0
RTA i
ndex
B European share of global high-value CCMT inventions 1995-2011
1995 1996 1997 1998 1999 2000 2001 2002 2003 2004 2005 2006 2007 2008 2009 2010 2011
Buildings (Y02B)
Clean energy (Y02E)
Smart grids (Y04S)
Carbon capture (Y02C)
Transport (Y02T)
60 %
50 %
40 %
30 %
20 %
Shar
e of
inv
enti
ons
(%)
A European share of global CCMT inventions by technology 1995-2011
1995 1996 1997 1998 1999 2000 2001 2002 2003 2004 2005 2006 2007 2008 2009 2010 2011
Buildings (Y02B)
Clean energy (Y02E)
Smart grids (Y04S)
Carbon capture (Y02C)
Transport (Y02T)
30 %
25 %
20 %
15 %
10 %
Shar
e of
inv
enti
ons
(%)
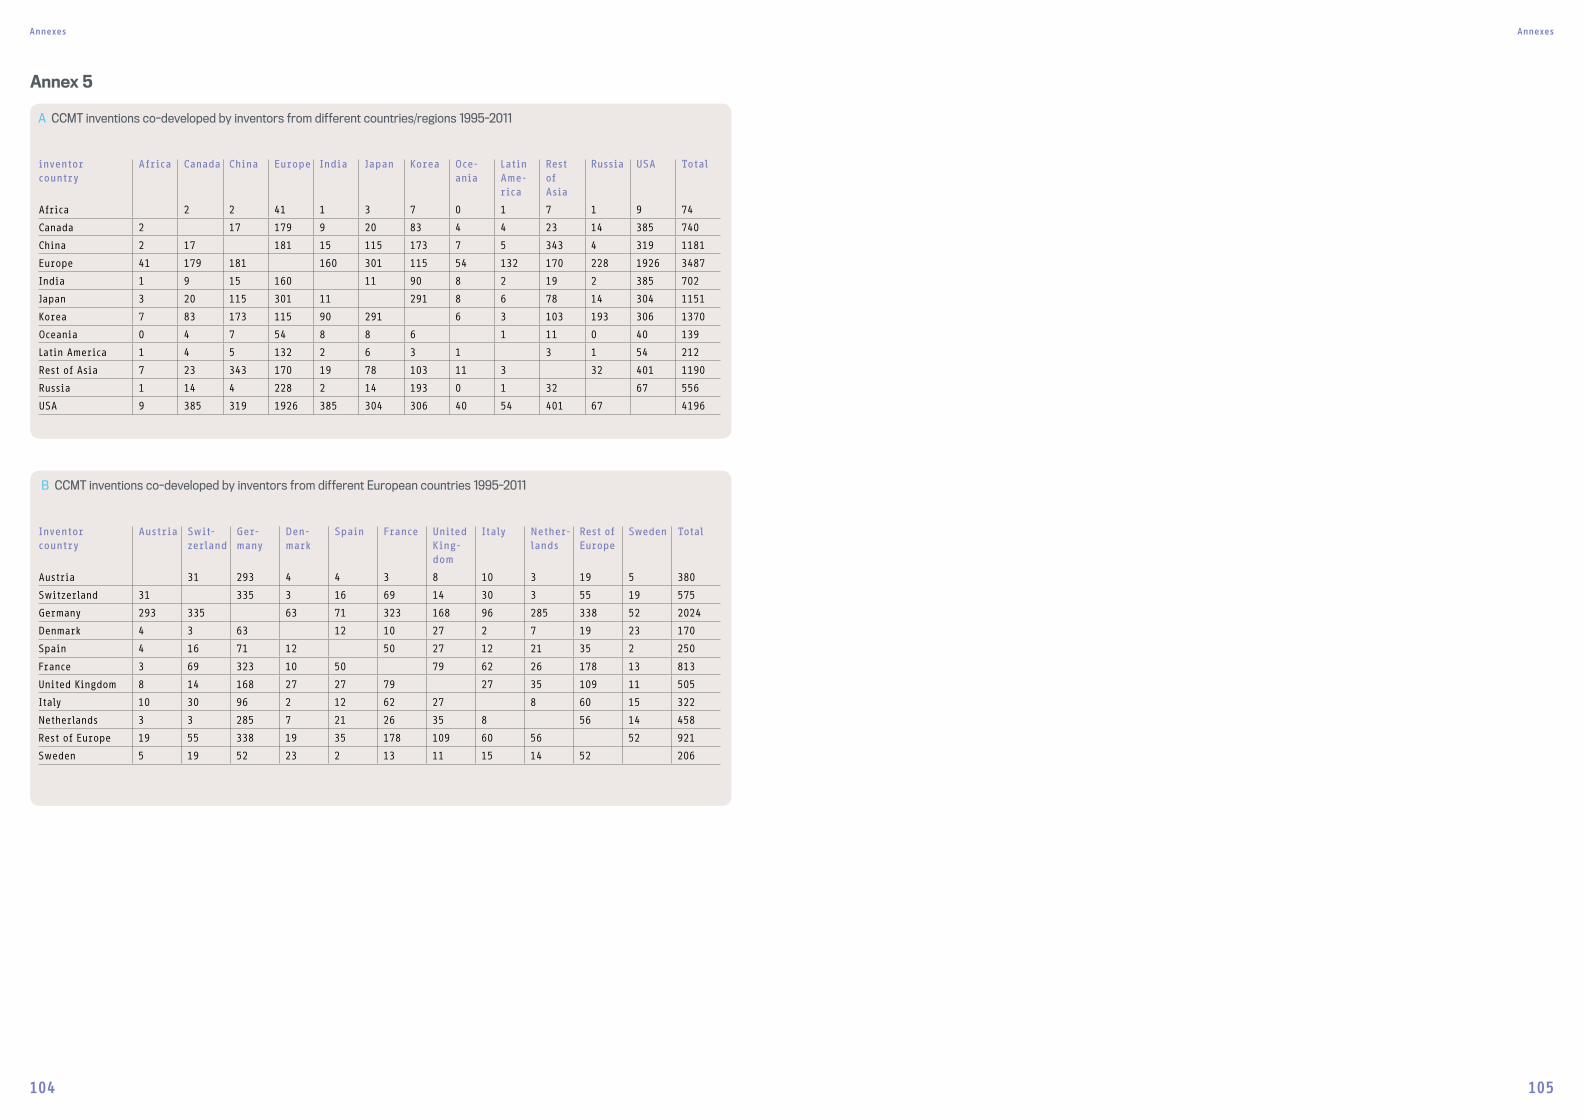
Annexes Annexes
104 105
Annex 5
A CCMT inventions co-developed by inventors from different countries/regions 1995-2011
inventor country
Africa Canada China Europe India Japan Korea Oce-ania
Latin Ame-rica
Rest of Asia
Russia USA Total
Africa 2 2 41 1 3 7 0 1 7 1 9 74
Canada 2 17 179 9 20 83 4 4 23 14 385 740
China 2 17 181 15 115 173 7 5 343 4 319 1181
Europe 41 179 181 160 301 115 54 132 170 228 1926 3487
India 1 9 15 160 11 90 8 2 19 2 385 702
Japan 3 20 115 301 11 291 8 6 78 14 304 1151
Korea 7 83 173 115 90 291 6 3 103 193 306 1370
Oceania 0 4 7 54 8 8 6 1 11 0 40 139
Latin America 1 4 5 132 2 6 3 1 3 1 54 212
Rest of Asia 7 23 343 170 19 78 103 11 3 32 401 1190
Russia 1 14 4 228 2 14 193 0 1 32 67 556
USA 9 385 319 1926 385 304 306 40 54 401 67 4196
B CCMT inventions co-developed by inventors from different European countries 1995-2011
Inventor country
Austria Swit-zerland
Ger-many
Den-mark
Spain France United King-dom
Italy Nether-lands
Rest of Europe
Sweden Total
Austria 31 293 4 4 3 8 10 3 19 5 380
Switzerland 31 335 3 16 69 14 30 3 55 19 575
Germany 293 335 63 71 323 168 96 285 338 52 2024
Denmark 4 3 63 12 10 27 2 7 19 23 170
Spain 4 16 71 12 50 27 12 21 35 2 250
France 3 69 323 10 50 79 62 26 178 13 813
United Kingdom 8 14 168 27 27 79 27 35 109 11 505
Italy 10 30 96 2 12 62 27 8 60 15 322
Netherlands 3 3 285 7 21 26 35 8 56 14 458
Rest of Europe 19 55 338 19 35 178 109 60 56 52 921
Sweden 5 19 52 23 2 13 11 15 14 52 206
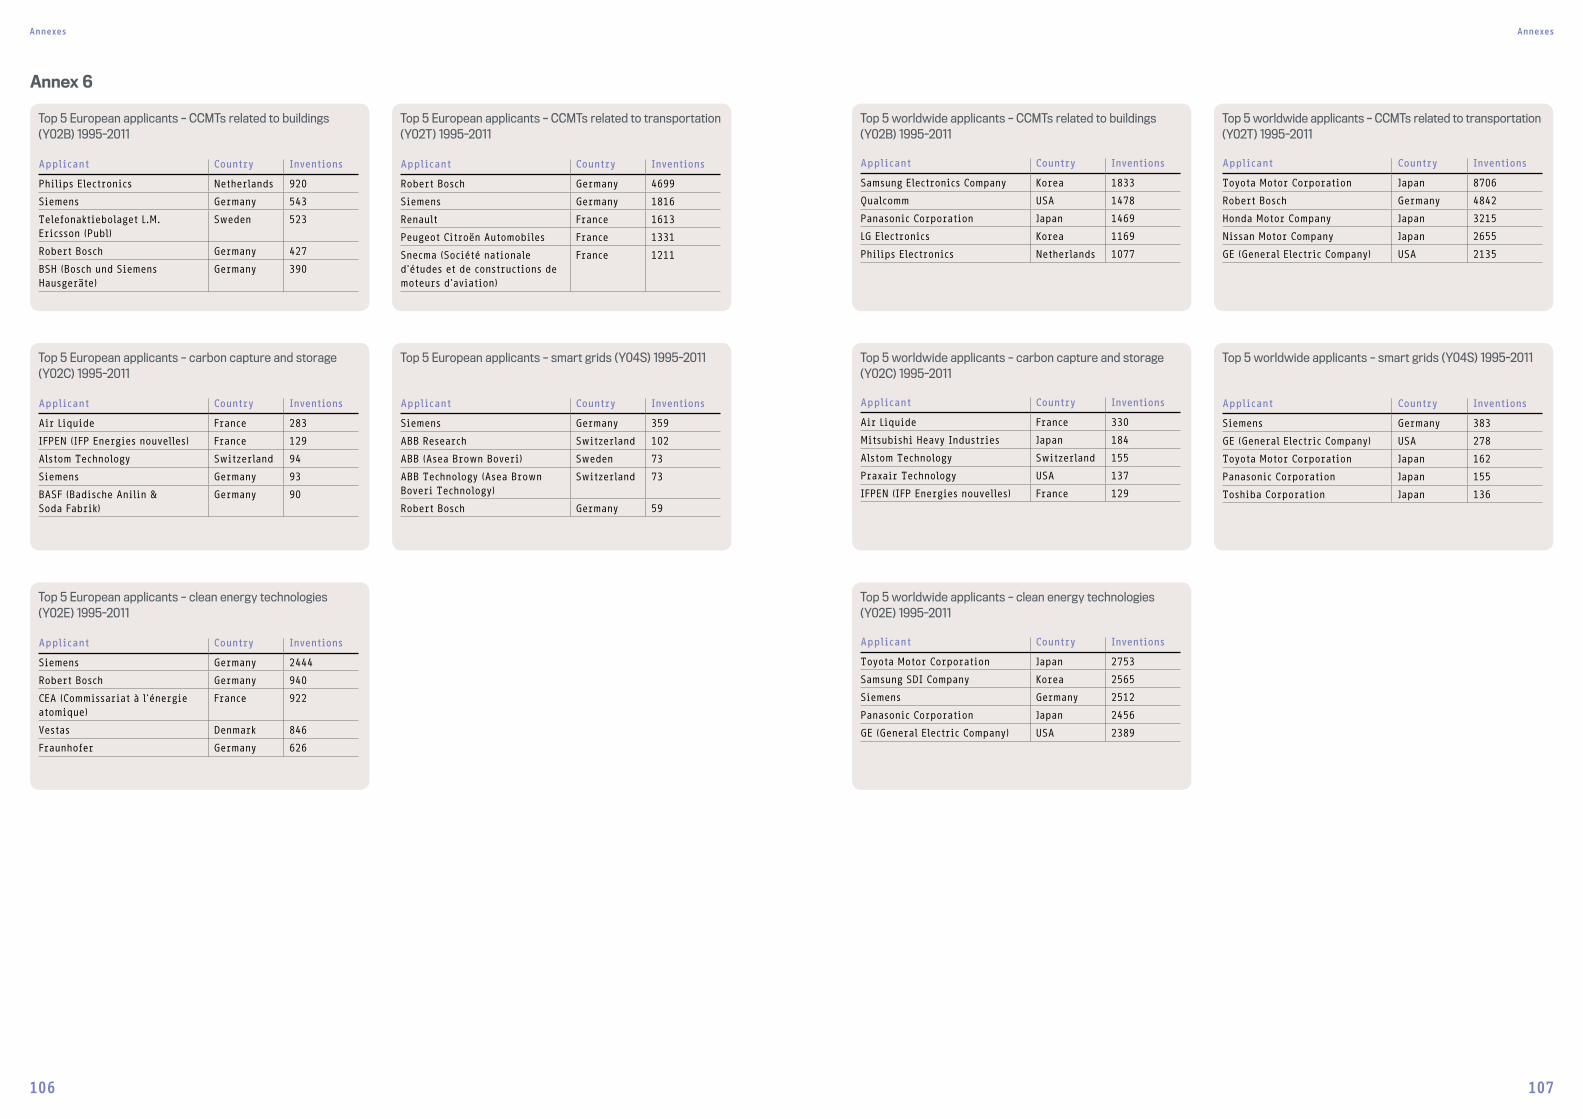
Annexes Annexes
106 107
Annex 6
Top 5 European applicants – CCMTs related to buildings (Y02B) 1995-2011
Applicant Country Inventions
Philips Electronics Netherlands 920
Siemens Germany 543
Telefonaktiebolaget L.M. Ericsson (Publ)
Sweden 523
Robert Bosch Germany 427
BSH (Bosch und Siemens Hausgeräte)
Germany 390
Top 5 European applicants – carbon capture and storage (Y02C) 1995-2011
Applicant Country Inventions
Air Liquide France 283
IFPEN (IFP Energies nouvelles) France 129
Alstom Technology Switzerland 94
Siemens Germany 93
BASF (Badische Anilin & Soda Fabrik)
Germany 90
Top 5 European applicants – clean energy technologies (Y02E) 1995-2011
Applicant Country Inventions
Siemens Germany 2444
Robert Bosch Germany 940
CEA (Commissariat à l'énergie atomique)
France 922
Vestas Denmark 846
Fraunhofer Germany 626
Top 5 European applicants – CCMTs related to transportation (Y02T) 1995-2011
Applicant Country Inventions
Robert Bosch Germany 4699
Siemens Germany 1816
Renault France 1613
Peugeot Citroën Automobiles France 1331
Snecma (Société nationale d'études et de constructions de moteurs d'aviation)
France 1211
Top 5 European applicants – smart grids (Y04S) 1995-2011
Applicant Country Inventions
Siemens Germany 359
ABB Research Switzerland 102
ABB (Asea Brown Boveri) Sweden 73
ABB Technology (Asea Brown Boveri Technology)
Switzerland 73
Robert Bosch Germany 59
Top 5 worldwide applicants – CCMTs related to buildings (Y02B) 1995-2011
Applicant Country Inventions
Samsung Electronics Company Korea 1833
Qualcomm USA 1478
Panasonic Corporation Japan 1469
LG Electronics Korea 1169
Philips Electronics Netherlands 1077
Top 5 worldwide applicants – carbon capture and storage (Y02C) 1995-2011
Applicant Country Inventions
Air Liquide France 330
Mitsubishi Heavy Industries Japan 184
Alstom Technology Switzerland 155
Praxair Technology USA 137
IFPEN (IFP Energies nouvelles) France 129
Top 5 worldwide applicants – clean energy technologies (Y02E) 1995-2011
Applicant Country Inventions
Toyota Motor Corporation Japan 2753
Samsung SDI Company Korea 2565
Siemens Germany 2512
Panasonic Corporation Japan 2456
GE (General Electric Company) USA 2389
Top 5 worldwide applicants – CCMTs related to transportation (Y02T) 1995-2011
Applicant Country Inventions
Toyota Motor Corporation Japan 8706
Robert Bosch Germany 4842
Honda Motor Company Japan 3215
Nissan Motor Company Japan 2655
GE (General Electric Company) USA 2135
Top 5 worldwide applicants – smart grids (Y04S) 1995-2011
Applicant Country Inventions
Siemens Germany 383
GE (General Electric Company) USA 278
Toyota Motor Corporation Japan 162
Panasonic Corporation Japan 155
Toshiba Corporation Japan 136
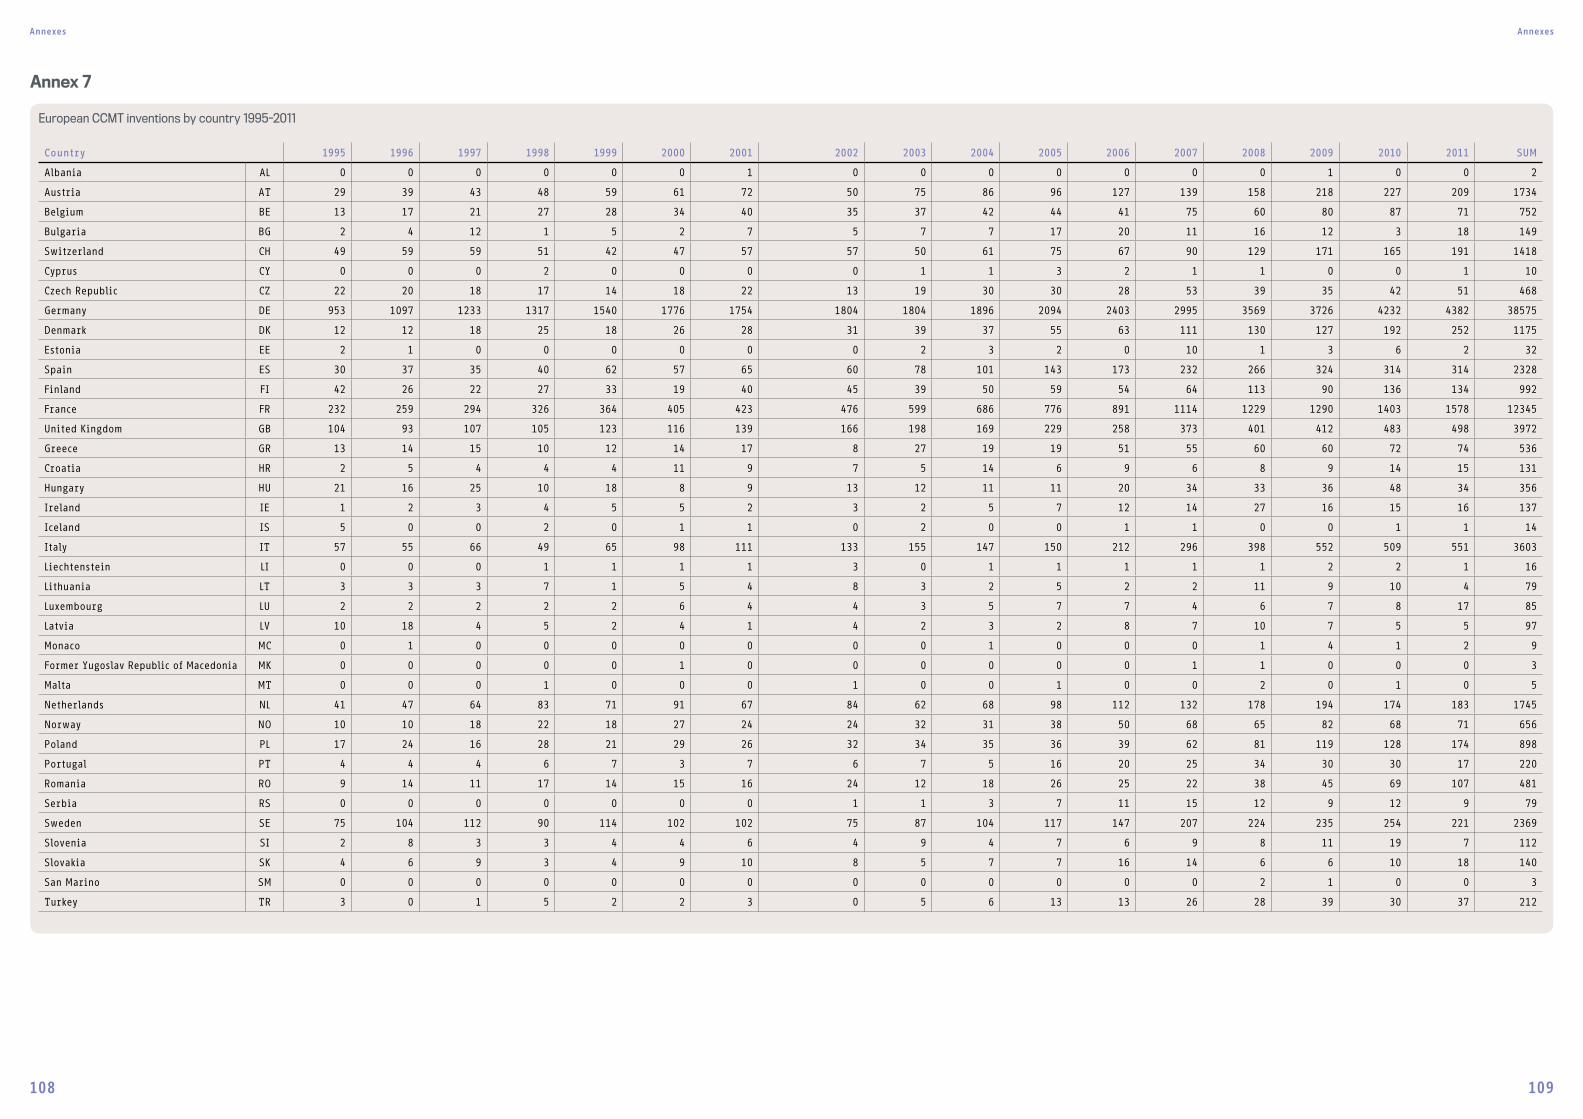
Annexes Annexes
108 109
Annex 7
European CCMT inventions by country 1995-2011
Country 1995 1996 1997 1998 1999 2000 2001 2002 2003 2004 2005 2006 2007 2008 2009 2010 2011 SUM
Albania AL 0 0 0 0 0 0 1 0 0 0 0 0 0 0 1 0 0 2
Austria AT 29 39 43 48 59 61 72 50 75 86 96 127 139 158 218 227 209 1734
Belgium BE 13 17 21 27 28 34 40 35 37 42 44 41 75 60 80 87 71 752
Bulgaria BG 2 4 12 1 5 2 7 5 7 7 17 20 11 16 12 3 18 149
Switzerland CH 49 59 59 51 42 47 57 57 50 61 75 67 90 129 171 165 191 1418
Cyprus CY 0 0 0 2 0 0 0 0 1 1 3 2 1 1 0 0 1 10
Czech Republic CZ 22 20 18 17 14 18 22 13 19 30 30 28 53 39 35 42 51 468
Germany DE 953 1097 1233 1317 1540 1776 1754 1804 1804 1896 2094 2403 2995 3569 3726 4232 4382 38575
Denmark DK 12 12 18 25 18 26 28 31 39 37 55 63 111 130 127 192 252 1175
Estonia EE 2 1 0 0 0 0 0 0 2 3 2 0 10 1 3 6 2 32
Spain ES 30 37 35 40 62 57 65 60 78 101 143 173 232 266 324 314 314 2328
Finland FI 42 26 22 27 33 19 40 45 39 50 59 54 64 113 90 136 134 992
France FR 232 259 294 326 364 405 423 476 599 686 776 891 1114 1229 1290 1403 1578 12345
United Kingdom GB 104 93 107 105 123 116 139 166 198 169 229 258 373 401 412 483 498 3972
Greece GR 13 14 15 10 12 14 17 8 27 19 19 51 55 60 60 72 74 536
Croatia HR 2 5 4 4 4 11 9 7 5 14 6 9 6 8 9 14 15 131
Hungary HU 21 16 25 10 18 8 9 13 12 11 11 20 34 33 36 48 34 356
Ireland IE 1 2 3 4 5 5 2 3 2 5 7 12 14 27 16 15 16 137
Iceland IS 5 0 0 2 0 1 1 0 2 0 0 1 1 0 0 1 1 14
Italy IT 57 55 66 49 65 98 111 133 155 147 150 212 296 398 552 509 551 3603
Liechtenstein LI 0 0 0 1 1 1 1 3 0 1 1 1 1 1 2 2 1 16
Lithuania LT 3 3 3 7 1 5 4 8 3 2 5 2 2 11 9 10 4 79
Luxembourg LU 2 2 2 2 2 6 4 4 3 5 7 7 4 6 7 8 17 85
Latvia LV 10 18 4 5 2 4 1 4 2 3 2 8 7 10 7 5 5 97
Monaco MC 0 1 0 0 0 0 0 0 0 1 0 0 0 1 4 1 2 9
Former Yugoslav Republic of Macedonia MK 0 0 0 0 0 1 0 0 0 0 0 0 1 1 0 0 0 3
Malta MT 0 0 0 1 0 0 0 1 0 0 1 0 0 2 0 1 0 5
Netherlands NL 41 47 64 83 71 91 67 84 62 68 98 112 132 178 194 174 183 1745
Norway NO 10 10 18 22 18 27 24 24 32 31 38 50 68 65 82 68 71 656
Poland PL 17 24 16 28 21 29 26 32 34 35 36 39 62 81 119 128 174 898
Portugal PT 4 4 4 6 7 3 7 6 7 5 16 20 25 34 30 30 17 220
Romania RO 9 14 11 17 14 15 16 24 12 18 26 25 22 38 45 69 107 481
Serbia RS 0 0 0 0 0 0 0 1 1 3 7 11 15 12 9 12 9 79
Sweden SE 75 104 112 90 114 102 102 75 87 104 117 147 207 224 235 254 221 2369
Slovenia SI 2 8 3 3 4 4 6 4 9 4 7 6 9 8 11 19 7 112
Slovakia SK 4 6 9 3 4 9 10 8 5 7 7 16 14 6 6 10 18 140
San Marino SM 0 0 0 0 0 0 0 0 0 0 0 0 0 2 1 0 0 3
Turkey TR 3 0 1 5 2 2 3 0 5 6 13 13 26 28 39 30 37 212
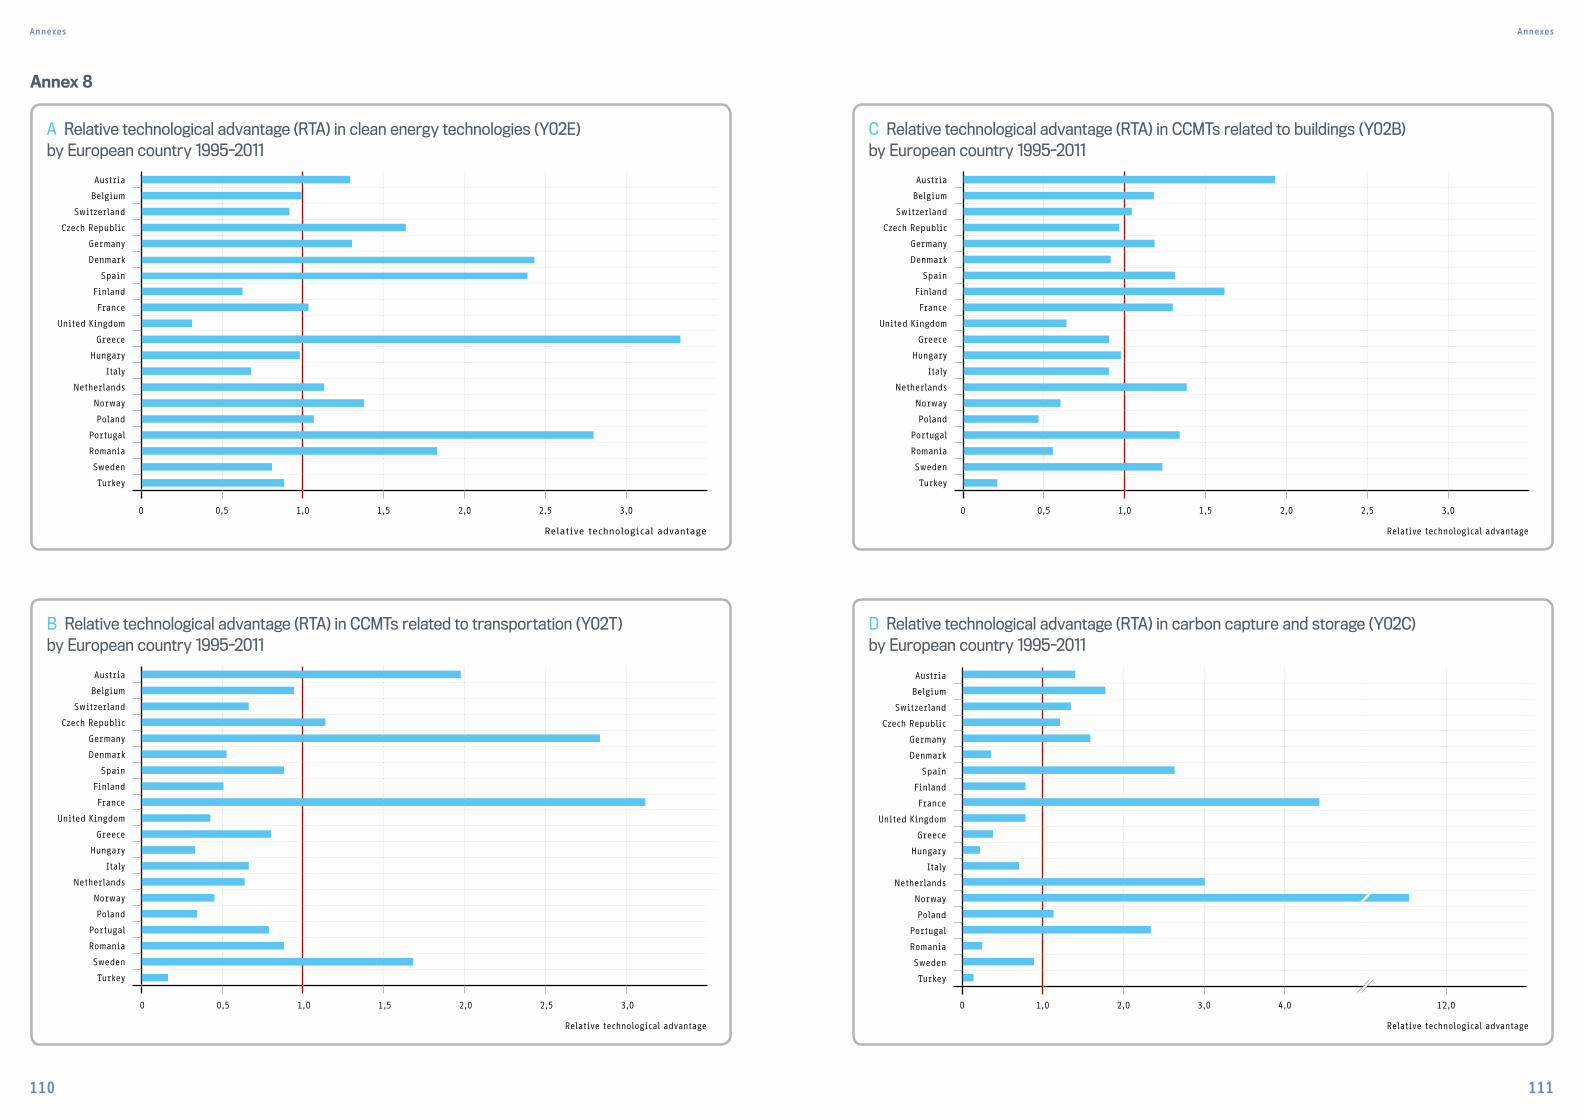
Annexes Annexes
110 111
Annex 8
A Relative technological advantage (RTA) in clean energy technologies (Y02E) by European country 1995-2011
Austria
Belgium
Switzerland
Czech Republic
Germany
Denmark
Spain
Finland
France
United Kingdom
Greece
Hungary
Italy
Netherlands
Norway
Poland
Portugal
Romania
Sweden
Turkey
Relative technological advantage
0 0,5 1,0 1,5 2,0 2,5 3,0
C Relative technological advantage (RTA) in CCMTs related to buildings (Y02B) by European country 1995-2011
Austria
Belgium
Switzerland
Czech Republic
Germany
Denmark
Spain
Finland
France
United Kingdom
Greece
Hungary
Italy
Netherlands
Norway
Poland
Portugal
Romania
Sweden
Turkey
0 0,5 1,0 1,5 2,0 2,5 3,0
Relative technological advantage
B Relative technological advantage (RTA) in CCMTs related to transportation (Y02T) by European country 1995-2011
Austria
Belgium
Switzerland
Czech Republic
Germany
Denmark
Spain
Finland
France
United Kingdom
Greece
Hungary
Italy
Netherlands
Norway
Poland
Portugal
Romania
Sweden
Turkey
Relative technological advantage
0 0,5 1,0 1,5 2,0 2,5 3,0
D Relative technological advantage (RTA) in carbon capture and storage (Y02C) by European country 1995-2011
Austria
Belgium
Switzerland
Czech Republic
Germany
Denmark
Spain
Finland
France
United Kingdom
Greece
Hungary
Italy
Netherlands
Norway
Poland
Portugal
Romania
Sweden
Turkey
Relative technological advantage
0 1,0 2,0 3,0 4,0 12,0
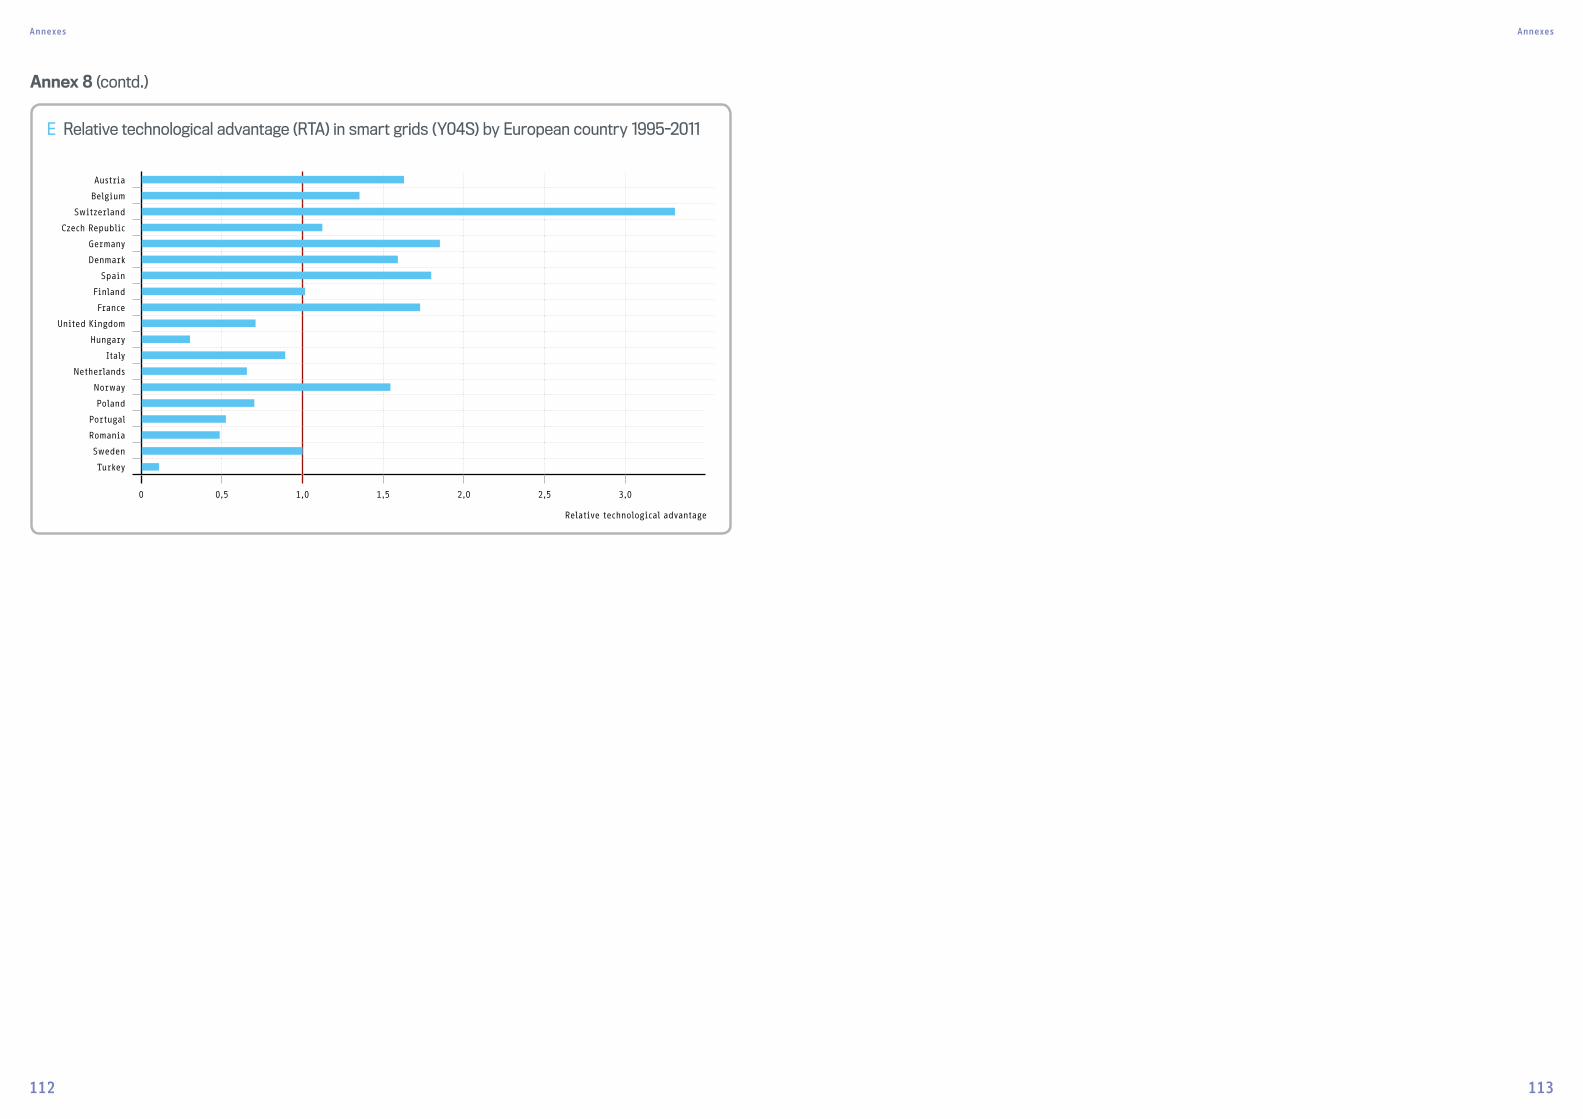
Annexes Annexes
112 113
Annex 8 (contd.)
E Relative technological advantage (RTA) in smart grids (Y04S) by European country 1995-2011
Austria
Belgium
Switzerland
Czech Republic
Germany
Denmark
Spain
Finland
France
United Kingdom
Hungary
Italy
Netherlands
Norway
Poland
Portugal
Romania
Sweden
Turkey
Relative technological advantage
0 0,5 1,0 1,5 2,0 2,5 3,0
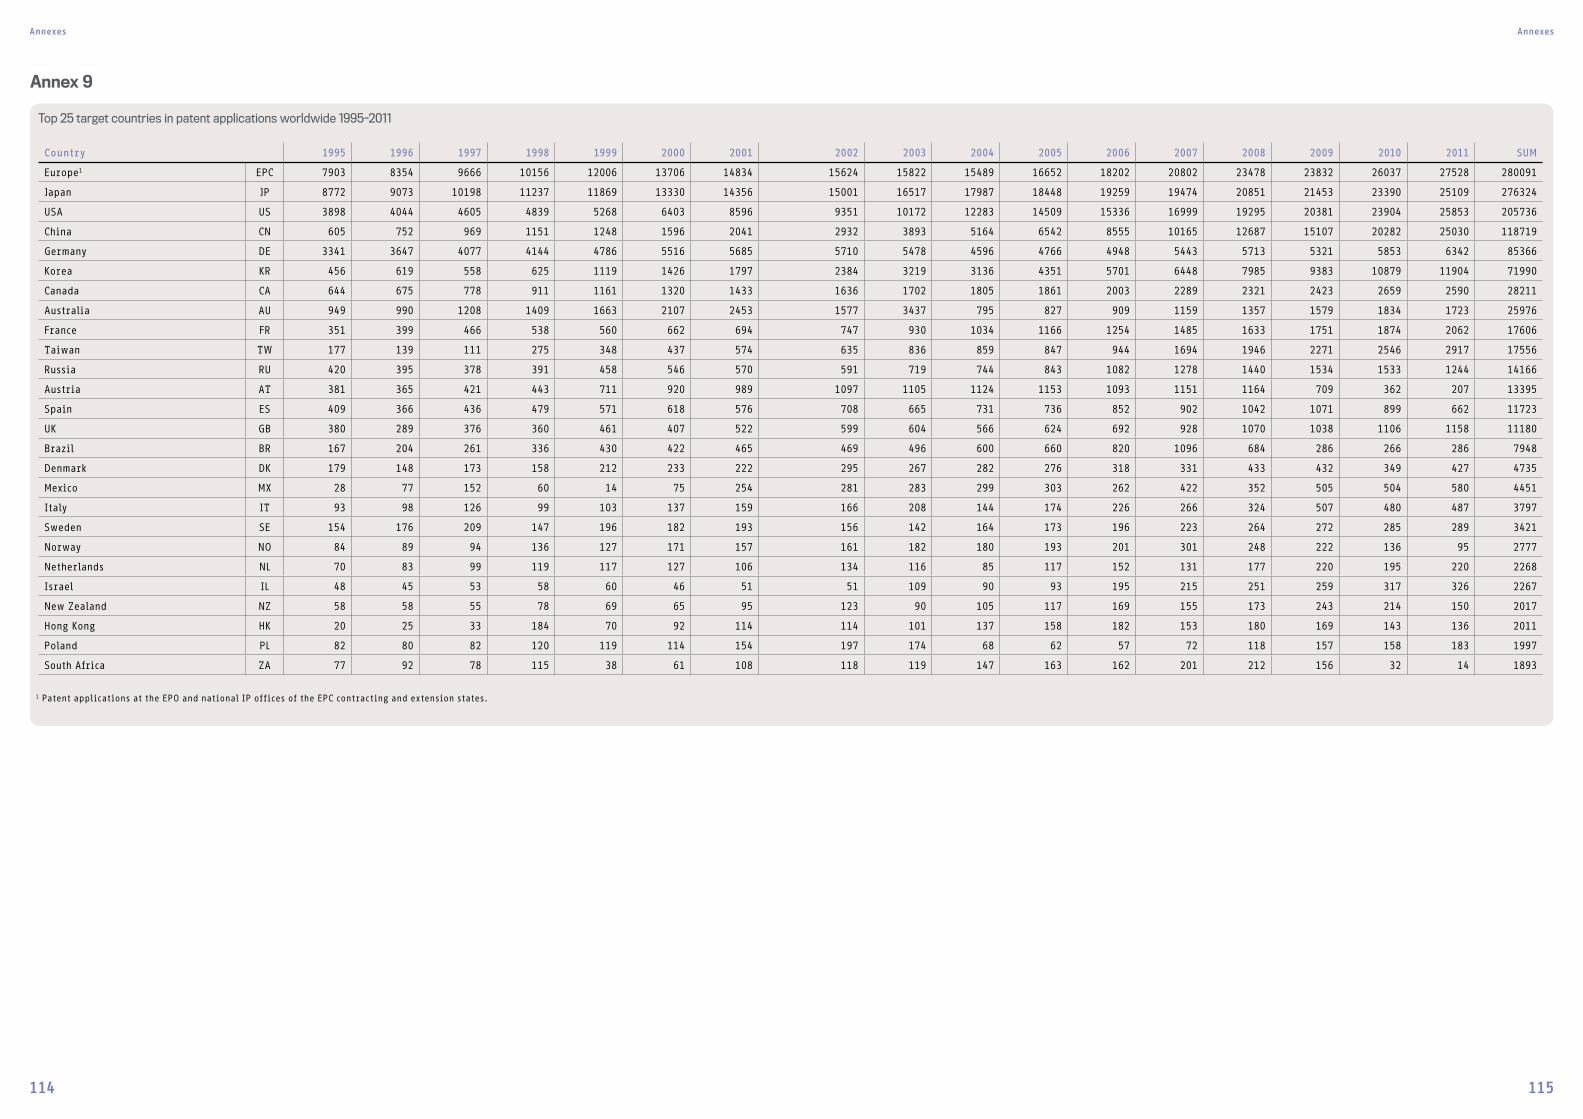
Annexes Annexes
114 115
Annex 9
Top 25 target countries in patent applications worldwide 1995-2011
Country 1995 1996 1997 1998 1999 2000 2001 2002 2003 2004 2005 2006 2007 2008 2009 2010 2011 SUM
Europe1 EPC 7903 8354 9666 10156 12006 13706 14834 15624 15822 15489 16652 18202 20802 23478 23832 26037 27528 280091
Japan JP 8772 9073 10198 11237 11869 13330 14356 15001 16517 17987 18448 19259 19474 20851 21453 23390 25109 276324
USA US 3898 4044 4605 4839 5268 6403 8596 9351 10172 12283 14509 15336 16999 19295 20381 23904 25853 205736
China CN 605 752 969 1151 1248 1596 2041 2932 3893 5164 6542 8555 10165 12687 15107 20282 25030 118719
Germany DE 3341 3647 4077 4144 4786 5516 5685 5710 5478 4596 4766 4948 5443 5713 5321 5853 6342 85366
Korea KR 456 619 558 625 1119 1426 1797 2384 3219 3136 4351 5701 6448 7985 9383 10879 11904 71990
Canada CA 644 675 778 911 1161 1320 1433 1636 1702 1805 1861 2003 2289 2321 2423 2659 2590 28211
Australia AU 949 990 1208 1409 1663 2107 2453 1577 3437 795 827 909 1159 1357 1579 1834 1723 25976
France FR 351 399 466 538 560 662 694 747 930 1034 1166 1254 1485 1633 1751 1874 2062 17606
Taiwan TW 177 139 111 275 348 437 574 635 836 859 847 944 1694 1946 2271 2546 2917 17556
Russia RU 420 395 378 391 458 546 570 591 719 744 843 1082 1278 1440 1534 1533 1244 14166
Austria AT 381 365 421 443 711 920 989 1097 1105 1124 1153 1093 1151 1164 709 362 207 13395
Spain ES 409 366 436 479 571 618 576 708 665 731 736 852 902 1042 1071 899 662 11723
UK GB 380 289 376 360 461 407 522 599 604 566 624 692 928 1070 1038 1106 1158 11180
Brazil BR 167 204 261 336 430 422 465 469 496 600 660 820 1096 684 286 266 286 7948
Denmark DK 179 148 173 158 212 233 222 295 267 282 276 318 331 433 432 349 427 4735
Mexico MX 28 77 152 60 14 75 254 281 283 299 303 262 422 352 505 504 580 4451
Italy IT 93 98 126 99 103 137 159 166 208 144 174 226 266 324 507 480 487 3797
Sweden SE 154 176 209 147 196 182 193 156 142 164 173 196 223 264 272 285 289 3421
Norway NO 84 89 94 136 127 171 157 161 182 180 193 201 301 248 222 136 95 2777
Netherlands NL 70 83 99 119 117 127 106 134 116 85 117 152 131 177 220 195 220 2268
Israel IL 48 45 53 58 60 46 51 51 109 90 93 195 215 251 259 317 326 2267
New Zealand NZ 58 58 55 78 69 65 95 123 90 105 117 169 155 173 243 214 150 2017
Hong Kong HK 20 25 33 184 70 92 114 114 101 137 158 182 153 180 169 143 136 2011
Poland PL 82 80 82 120 119 114 154 197 174 68 62 57 72 118 157 158 183 1997
South Africa ZA 77 92 78 115 38 61 108 118 119 147 163 162 201 212 156 32 14 1893
1 Patent applications at the EPO and national IP offices of the EPC contracting and extension states.
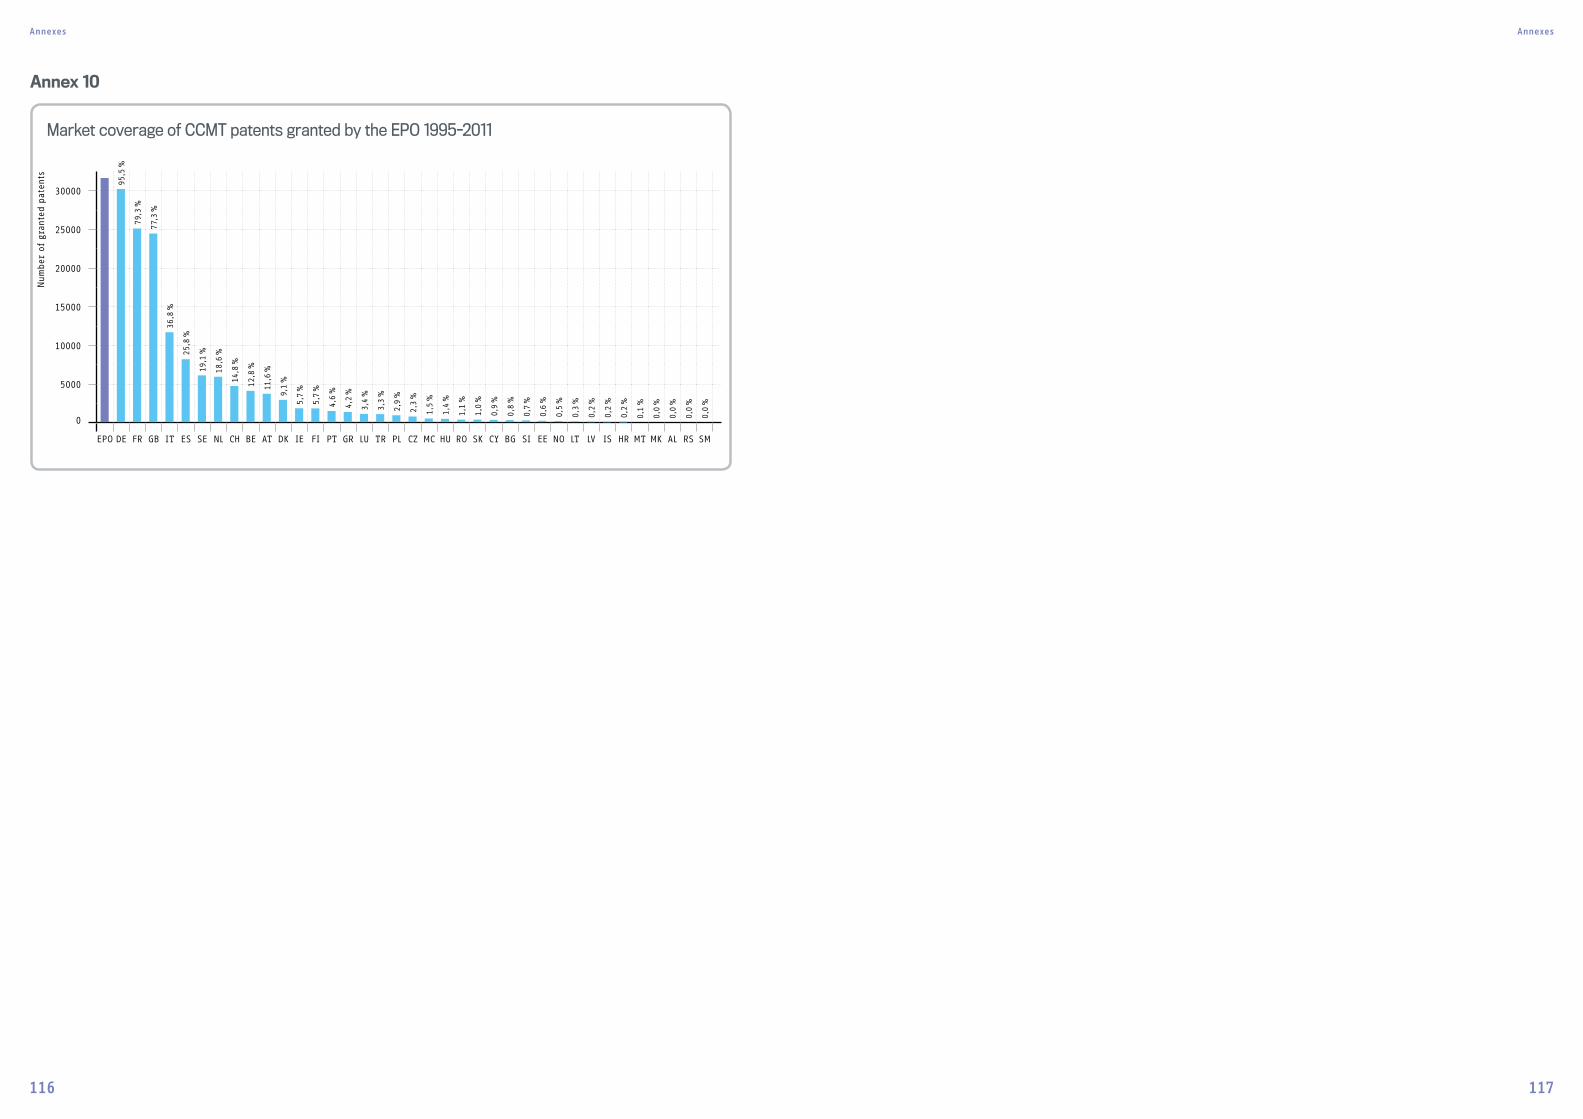
Annexes Annexes
116 117
Annex 10
30000
25000
20000
15000
10000
5000
0
EPO DE FR GB IT ES SE NL CH BE AT DK IE FI PT GR LU TR PL CZ MC HU RO SK CY BG SI EE NO LT LV IS HR MT MK AL RS SM
Market coverage of CCMT patents granted by the EPO 1995-2011
Num
ber
of
gran
ted p
aten
ts
95,5
%
79,
3 %
77,
3 %
36,8
%
25,8
%
19,1
%
18,6
%
14,8
%
12,8
%
11,6
%
9,1
%
5,7
%
5,7
%
4,6
%
4,2
%
3,4
%
3,3
%
2,9
%
2,3
%
1,5
%
1,4
%
1,1
%
1,0
%
0,9
%
0,8
%
0,7
%
0,6
%
0,5
%
0,3
%
0,2
%
0,2
%
0,2
%
0,1
%
0,0
%
0,0
%
0,0
%
0,0
%
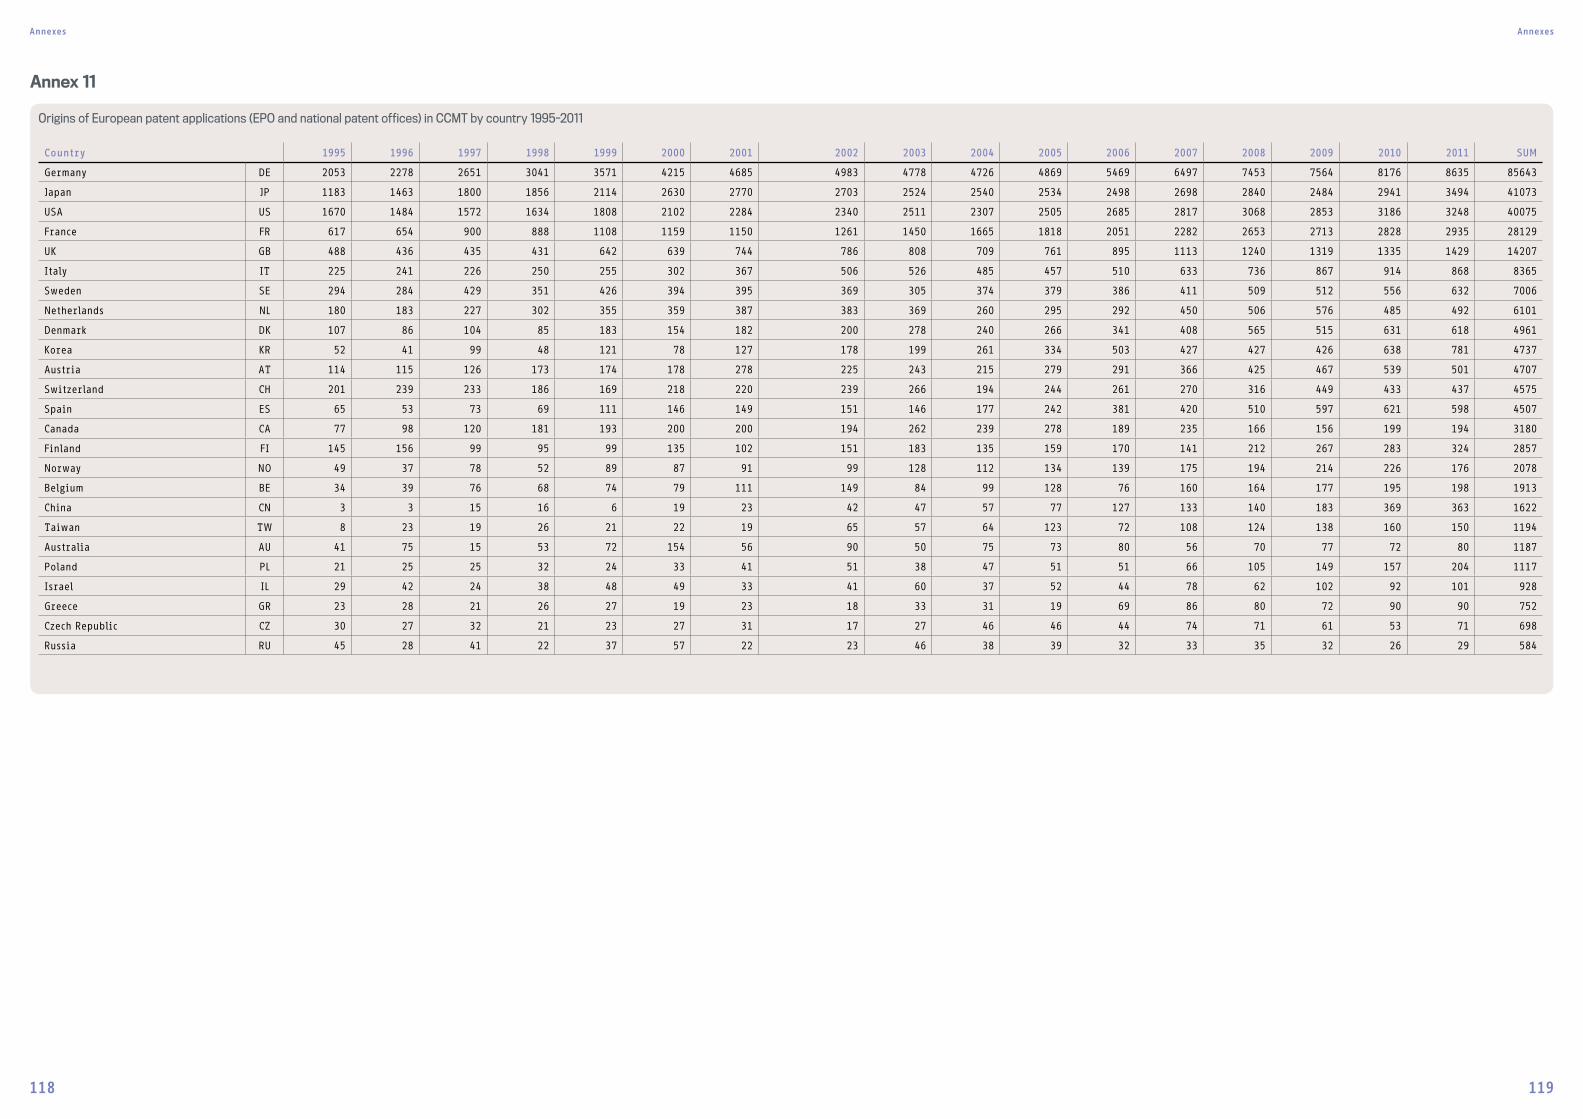
Annexes Annexes
118 119
Annex 11
Origins of European patent applications (EPO and national patent offices) in CCMT by country 1995-2011
Country 1995 1996 1997 1998 1999 2000 2001 2002 2003 2004 2005 2006 2007 2008 2009 2010 2011 SUM
Germany DE 2053 2278 2651 3041 3571 4215 4685 4983 4778 4726 4869 5469 6497 7453 7564 8176 8635 85643
Japan JP 1183 1463 1800 1856 2114 2630 2770 2703 2524 2540 2534 2498 2698 2840 2484 2941 3494 41073
USA US 1670 1484 1572 1634 1808 2102 2284 2340 2511 2307 2505 2685 2817 3068 2853 3186 3248 40075
France FR 617 654 900 888 1108 1159 1150 1261 1450 1665 1818 2051 2282 2653 2713 2828 2935 28129
UK GB 488 436 435 431 642 639 744 786 808 709 761 895 1113 1240 1319 1335 1429 14207
Italy IT 225 241 226 250 255 302 367 506 526 485 457 510 633 736 867 914 868 8365
Sweden SE 294 284 429 351 426 394 395 369 305 374 379 386 411 509 512 556 632 7006
Netherlands NL 180 183 227 302 355 359 387 383 369 260 295 292 450 506 576 485 492 6101
Denmark DK 107 86 104 85 183 154 182 200 278 240 266 341 408 565 515 631 618 4961
Korea KR 52 41 99 48 121 78 127 178 199 261 334 503 427 427 426 638 781 4737
Austria AT 114 115 126 173 174 178 278 225 243 215 279 291 366 425 467 539 501 4707
Switzerland CH 201 239 233 186 169 218 220 239 266 194 244 261 270 316 449 433 437 4575
Spain ES 65 53 73 69 111 146 149 151 146 177 242 381 420 510 597 621 598 4507
Canada CA 77 98 120 181 193 200 200 194 262 239 278 189 235 166 156 199 194 3180
Finland FI 145 156 99 95 99 135 102 151 183 135 159 170 141 212 267 283 324 2857
Norway NO 49 37 78 52 89 87 91 99 128 112 134 139 175 194 214 226 176 2078
Belgium BE 34 39 76 68 74 79 111 149 84 99 128 76 160 164 177 195 198 1913
China CN 3 3 15 16 6 19 23 42 47 57 77 127 133 140 183 369 363 1622
Taiwan TW 8 23 19 26 21 22 19 65 57 64 123 72 108 124 138 160 150 1194
Australia AU 41 75 15 53 72 154 56 90 50 75 73 80 56 70 77 72 80 1187
Poland PL 21 25 25 32 24 33 41 51 38 47 51 51 66 105 149 157 204 1117
Israel IL 29 42 24 38 48 49 33 41 60 37 52 44 78 62 102 92 101 928
Greece GR 23 28 21 26 27 19 23 18 33 31 19 69 86 80 72 90 90 752
Czech Republic CZ 30 27 32 21 23 27 31 17 27 46 46 44 74 71 61 53 71 698
Russia RU 45 28 41 22 37 57 22 23 46 38 39 32 33 35 32 26 29 584
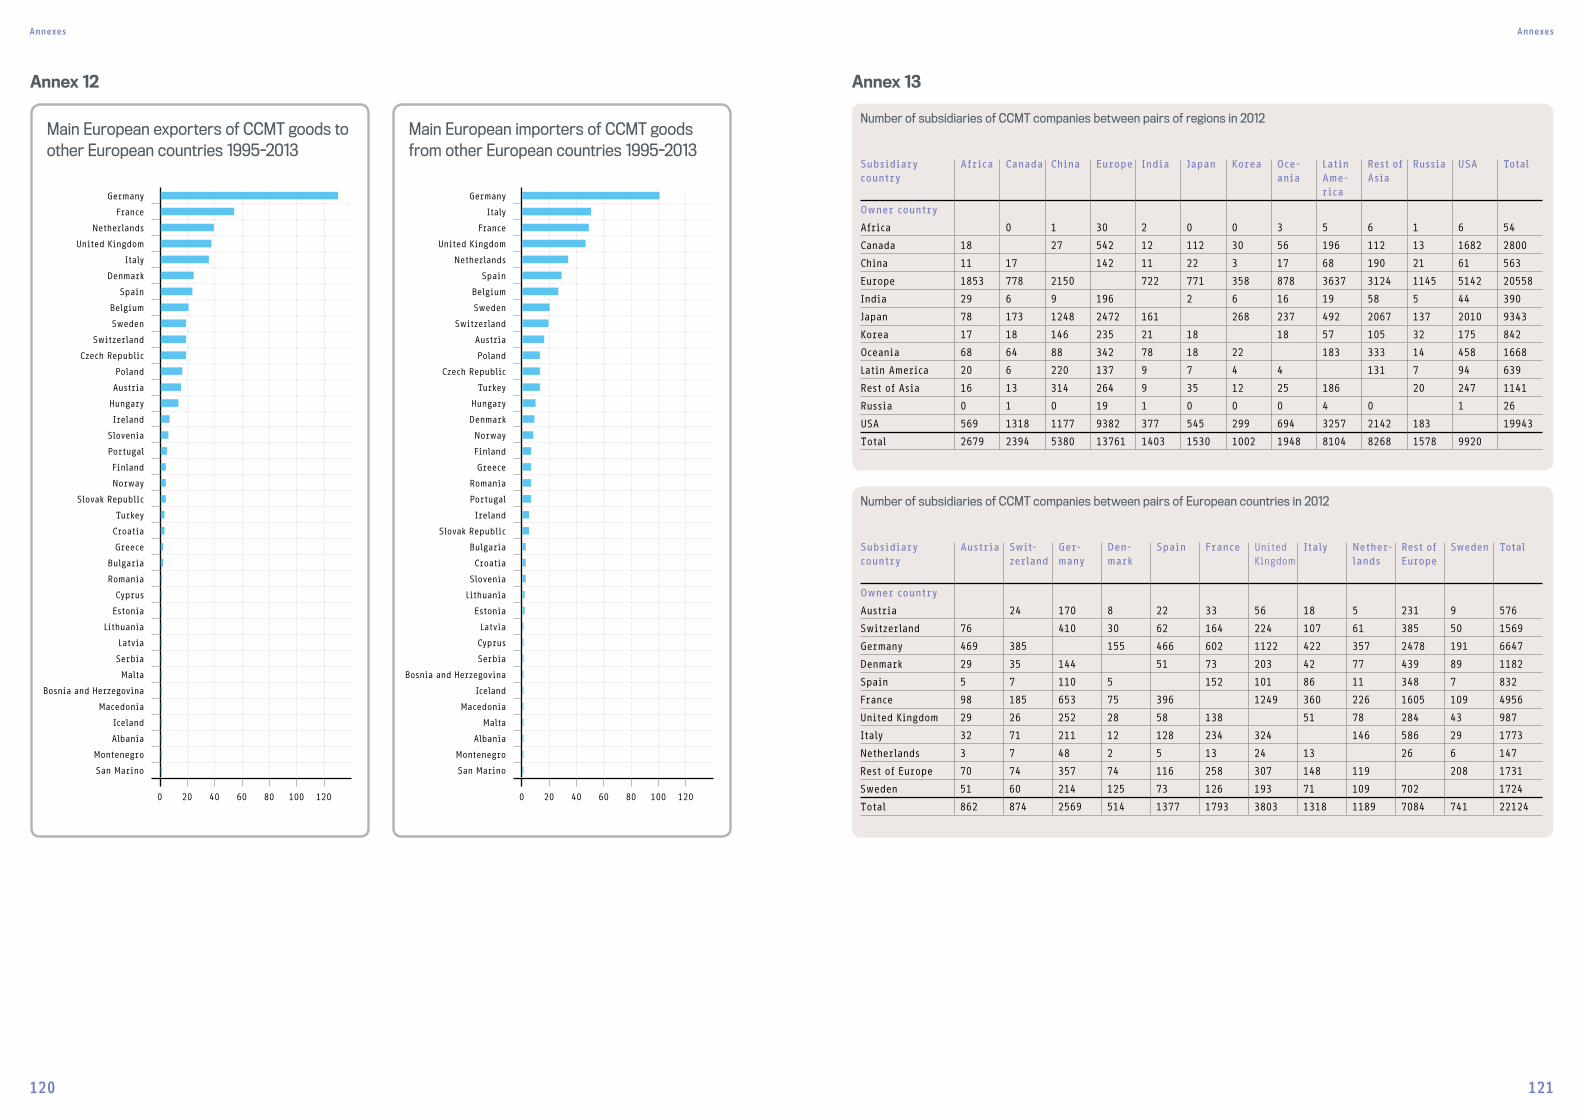
Annexes Annexes
120 121
Annex 12 Annex 13
Germany
Italy
France
United Kingdom
Netherlands
Spain
Belgium
Sweden
Switzerland
Austria
Poland
Czech Republic
Turkey
Hungary
Denmark
Norway
Finland
Greece
Romania
Portugal
Ireland
Slovak Republic
Bulgaria
Croatia
Slovenia
Lithuania
Estonia
Latvia
Cyprus
Serbia
Bosnia and Herzegovina
Iceland
Macedonia
Malta
Albania
Montenegro
San Marino
Main European importers of CCMT goods from other European countries 1995-2013
0 20 40 60 80 100 120
Germany
France
Netherlands
United Kingdom
Italy
Denmark
Spain
Belgium
Sweden
Switzerland
Czech Republic
Poland
Austria
Hungary
Ireland
Slovenia
Portugal
Finland
Norway
Slovak Republic
Turkey
Croatia
Greece
Bulgaria
Romania
Cyprus
Estonia
Lithuania
Latvia
Serbia
Malta
Bosnia and Herzegovina
Macedonia
Iceland
Albania
Montenegro
San Marino
Main European exporters of CCMT goods to other European countries 1995-2013
0 20 40 60 80 100 120
Number of subsidiaries of CCMT companies between pairs of regions in 2012
Subsidiary country
Africa Canada China Europe India Japan Korea Oce-ania
Latin Ame-rica
Rest of Asia
Russia USA Total
Owner country
Africa 0 1 30 2 0 0 3 5 6 1 6 54
Canada 18 27 542 12 112 30 56 196 112 13 1682 2800
China 11 17 142 11 22 3 17 68 190 21 61 563
Europe 1853 778 2150 722 771 358 878 3637 3124 1145 5142 20558
India 29 6 9 196 2 6 16 19 58 5 44 390
Japan 78 173 1248 2472 161 268 237 492 2067 137 2010 9343
Korea 17 18 146 235 21 18 18 57 105 32 175 842
Oceania 68 64 88 342 78 18 22 183 333 14 458 1668
Latin America 20 6 220 137 9 7 4 4 131 7 94 639
Rest of Asia 16 13 314 264 9 35 12 25 186 20 247 1141
Russia 0 1 0 19 1 0 0 0 4 0 1 26
USA 569 1318 1177 9382 377 545 299 694 3257 2142 183 19943
Total 2679 2394 5380 13761 1403 1530 1002 1948 8104 8268 1578 9920
Number of subsidiaries of CCMT companies between pairs of European countries in 2012
Subsidiary country
Austria Swit-zerland
Ger-many
Den-mark
Spain France United Kingdom
Italy Nether-lands
Rest of Europe
Sweden Total
Owner country
Austria 24 170 8 22 33 56 18 5 231 9 576
Switzerland 76 410 30 62 164 224 107 61 385 50 1569
Germany 469 385 155 466 602 1122 422 357 2478 191 6647
Denmark 29 35 144 51 73 203 42 77 439 89 1182
Spain 5 7 110 5 152 101 86 11 348 7 832
France 98 185 653 75 396 1249 360 226 1605 109 4956
United Kingdom 29 26 252 28 58 138 51 78 284 43 987
Italy 32 71 211 12 128 234 324 146 586 29 1773
Netherlands 3 7 48 2 5 13 24 13 26 6 147
Rest of Europe 70 74 357 74 116 258 307 148 119 208 1731
Sweden 51 60 214 125 73 126 193 71 109 702 1724
Total 862 874 2569 514 1377 1793 3803 1318 1189 7084 741 22124
122 123
ABBREVIATIONS AND ACRONYMS
Abbreviations and Acronyms
BEE Biomass Energy Europe
CCMT Climate change mitigation technologies
CETs Clean energy technologies
CHP Combined heat and power
COP Conference of the Parties (of the United Nations Framework Convention on Climate Change)
CPC Cooperative Patent Classification
CSP Concentrated solar power
EPO European Patent Office
EU European Union
EU ETS EU Emissions Trading System
FDI Foreign direct investment
GDP Gross domestic product
GHG Greenhouse gases
GSHP Ground source heat pumps
HS Harmonised system
ICTSD International Centre for Trade and Sustainable Development
IP Intellectual property
IP5 Five largest intellectual property offices (EPO, JPO, KIPO, SIPO, USPTO)
IPC International Patent Classification
IPCC Intergovernmental Panel on Climate Change
IPR Intellectual property right
JPO Japan Patent Office
KIPO Korean Intellectual Property Office
NPA Nature Protection Areas
OECD Organisation for Economic Co-operation and Development
PACE Pollution Abatement Control Expenditures
PATSTAT Worldwide Patent Statistical Database
PCT Patent Cooperation Treaty
PV Photovoltaic
R&D Research and development
RD&D Research, development and deployment
RE Renewable energy
ROSPATENT Russian Federal Service for Intellectual Property
RTA Relative technological advantage
SHP Small hydropower plants
SIPO State Intellectual Property Office of the Peoples' Republic of China
SMEs Small and medium-sized enterprises
TRIPS Agreement on Trade-Related Aspects of Intellectual Property Rights
UNCTAD TRAINS United Nations Conference on Trade and Development's Trade Analysis and Information System
UNEP United Nations Environment Programme
UNFCCC United Nations Framework Convention on Climate Change
USPTO United States Patent and Trademark Office
WIPO World Intellectual Property Organization
WTO World Trade Organization
Y02/Y04S Dedicated tagging scheme and searchable database for CCMTs
BIBLIOGRAPHY
Acemoglu, D., Aghion, P., Bursztyn L., Hemous D. (2012), The Environment and Directed Technical Change. The American Economic Review, 102(1): 131-166
Acemoglu, D. (2002), Directed Technical Change. Review of Economic Studies, 69: 781-810
Aghion, P., Dechezleprêtre, A., Hemous, D., Martin R., Reenen J. V. (2012), Carbon Taxes, Path Dependency and Directed Technical Change: Evidence from the Auto Industry. Journal of Political Economy, forthcoming
Ambec, S., Cohen, M., Elgie, S., Lanoie, P. (2013), The Porter Hypothesis at 20: Can Environmental Regulation Enhance Innovation and Competitiveness? Review of Environmental Economics and Policy 7 (1): 2-22
Bomb, C., McCormick, K. et. al. (2007), Biofuels for transport in Europe: Lessons from Germany and the UK. Energy Policy, 34 (5): 2256-2267
Botta, E. and Koz luk T. (2014), Measuring Environmental Policy Stringency in OECD Countries: A Composite Index Approach, OECD Economics Department Working Papers, 1177, OECD Publishing.
Branstetter, L., Fisman, R., Foley, C. (2006), Do stronger intellectual property rights increase international technology transfer? Quarterly Journal of Economics 121(1): 321-349
Brunnermeier, S. and Cohen, M. (2003), Determinants of environmental innovation in US manufacturing industries, Journal of Environmental Economics and Management, 45 (2): 278-293
Calel, R. and Dechezleprêtre, A. (2014), Environmental Policy and Directed Technological Change: Evidence from the Euro-pean carbon market, Review of Economics and Statistics, forthcoming
Cohen W., Nelson, R., Walsh, J. (2000), Protecting their intellectual assets: appropriability conditions and why U.S. manufacturing firms patent (or not), NBER working paper series, Working Paper 7552
Cohen, W., Nelson, R., Walsh, J. (2000), Protecting their intellectual assets: appropriability conditions and why U.S. manufacturing firms patent (or not), NBER working paper series, Working Paper 7552
De La Tour, A., Glachant, M., Ménière, Y. (2011), Innovation and international technology transfer: The case of the Chinese photovoltaic industry, Paris: MINES ParisTech
Dechezleprêtre, A. and Glachant M. (2013), Does foreign environmental policy influence domestic innovation? Evidence from the wind industry, Environmental & Resource Economics 2014, 58(3): 391-413
Dechezleprêtre, A., Glachant, M., Ménière, Y. (2008), The Clean Development Mechanism and the international diffusion of technologies: An empirical study, Energy Policy 36(4): 1273-1283
Dechezleprêtre, A., Glachant, M., Ménière, Y. (2013), What Drives the International Transfer of Climate Change Mitiga-tion Technologies? Empirical Evidence from Patent Data, Environmental & Resource Economics, 54(2): 161-178
Dechezleprêtre, A., Glachant, M., Hašci c, I., Johnstone, N., Ménière, Y. (2011), Invention and Transfer of Climate Change Mitigation Technologies: A Global Analysis, Review of Environmental Economics and Policy 5(1): 109-130
Dechezleprêtre, A., and Popp, D. (2015), Fiscal and Regula-tory Instruments for Clean Technology Development in the European Union, CESIfo Working Paper No. 5361
Dernis, H., Guellec, D., van Pottelsberghe, B. (2001), Using Patent Counts for Cross-country Comparisons of Technology Output, STI Review No. 27, OECD, Paris
Duke, R., Jacobson, A., Kammen, D. (2002), Photovoltaic Module Quality in the Kenyan Solar Home Systems Market, Energy Policy 30: 477-499
Eaton, J. and Kortum, S. (1996), Trade in ideas: Patenting and productivity in the OECD, Journal of international Economics 40(3): 251-278
Eaton, J. and Kortum, S. (1999), International technology diffusion: Theory and measurement, International Economic Review 40 (3): 537-570
Fosfuri, A., Motta, M., Ronde, T. (2001), Foreign direct investment and spillovers through workers’ mobility, Journal of International Economics, 53(1): 205-222
Frietsch, R. and Schmoch, U. (2006), Technological Struc-tures and Performance Reflected by Patent Indicators, in: Schmoch, U., Rammer, C., Legler, H. (eds.): National Systems of Innovation in Comparison. Structure and Performance Indicators for Knowledge Societies
HLPE, 2013. Biofuels and food security. A report by the High Level Panel of Experts on Food Security and Nutrition of the Committee on World Food Security, Rome 2013
Girma, S., Gong, Y., Yu, Z. (2008), Can production subsidies explain China’s export performance? Evidence from firm-level data, Kiel Working Paper No. 1442
124 125
Glachant, M., Dussaux, D., Ménière, Y., Dechezleprêtre, A. (2013), Promoting International Technology Transfer of Low-Carbon Technologies: Evidence and Policy Perspec-tives, study commissioned by the French Council of Strategic Analysis
Guellec, D. and van Pottelsberghe, B. (2000), The Impact of Public R&D Expenditure on Business R&D, OECD Science, Technology and Industry Working Papers, 2000/04, OECD Publishing http://dx.doi.org/10.1787/670385851815
Harhoff, D., Scherer, F., Vopel, K. (2003), Exploring the tail of the patent value distribution, in: Grandstrand, O. (Ed.), The Economics of the Patent System, in press
Hašci c, I. and Johnstone, N. (2011), CDM and international technology transfer: empirical evidence on wind power, Climate Policy 11(6): 1303-1314
Hašci c, I. and Migotto, M. (2015), Measuring environmental innovation using patent data, OECD Environment Working Papers, No. 89, OECD Publishing, Paris. http://dx.doi.org/10.1787/5js009kf48xw-en
Hašci c, I. et al. (2012), Recent trends in innovation in cli-mate change mitigation technologies, in OECD, Energy and Climate Policy: Bending the Technological Trajectory, OECD Publishing http://dx.doi.org/10.1787/9789264174573-4-en
Hicks, J. R. (1932), The Theory of Wages. Basingstoke: Palgrave MacMillan
The Intergovernmental Panel on Climate Change (IPCC) (2014), Synthesis Report
International Energy Agency. Technology Roadmap. Bioenergy for Heat and Power. 2012
Ivarsson, I. and Alvstam, C. (2005), Technology Transfer from TNCs to Local Suppliers in Developing Countries: A Study of AB Volvo’s Truck and Bus Plants in Brazil, China, India, and Mexico, World Development, 33(8): 1325–1344
Jaffe, A. and Palmer, K. (1997), Environmental regulation and innovation: a panel data study, Review of Economics and Statistics, 79(4): 610-619
Johnstone, N., Hašci c, I., Popp, P. (2010), Renewable Energy Policies and Technological Innovation: Evidence Based on Patent Counts, Environmental & Resource Economics, European Association of Environmental and Resource Economists, 45(1): 133-155
Johnstone. N., Hašci c, I., Poirier, J., Hemar, M., Michel, C. (2012), Environmental policy stringency and technological innovation: evidence from survey data and patent counts, Applied Economics, Taylor & Francis Journals, 44(17): 2157-2170
Keller, W., Yeaple, S. (2003), Multinational Enterprises, International Trade, and Productivity Growth: Firm-Level Evidence from the United States, Working Paper No. 03/248
Kemp, R. (1998), The Diffusion of Biological Waste-Water Treatment Plants in the Dutch Food and Beverage Industry, Environmental and Resource Economics, 12: 113-136
Kerr, S. and Newell, R. (2003), Policy-Induced Technology Adoption: Evidence from the U.S. Lead Phasedown, Journal of Industrial Economics, 51(3): 317-343
Kirkegaard, J., Hanemann, T., Weischer, L. (2009), It Should Be a Breeze: Harnessing the Potential of Open Trade and Investment Flows in the Wind Energy Industry, Washington DC: Peterson Institute for International Economics
Lanjouw, J. and Mody, A. (1996), Innovation and the Interna-tional Diffusion of Environmentally Responsive Technology, Research Policy 25: 549-571
Lee, J. and Mansfield, E. (1996), Intellectual Property Protection and U.S. Foreign Direct Investment, Review of Economics and Statistics 78: 181-186
Liu, Z. (2002), Foreign direct investment and technology spillover: evidence from China, Journal of Comparative Economics 30: 579-602
Liu, Z. (2008), Foreign direct investment and technology spillovers: theory and evidence, Journal of Development Economics, 85: 176-193
Maskus, K. (2000), Parallel Imports, The World Economy, Wiley Blackwell, 23(9): 1269-1284
Newell, R., Jaffe, A., Stavins, R. (1999), The Induced Innova-tion Hypothesis and Energy-Saving Technological Change, Quarterly Journal of Economics 114: 941-75
OECD (2009), OECD patent statistics manual, Technical report
Popp, D. (2002), Induced Innovation and Energy Prices, American Economic Review, 92(1): 160-180
Popp, D., Fleishman, R., Alexander, R., Bretschneider, S. (2009), Does Regulation Stimulate Technical Productive Effi-ciency? The Effect of Air Quality Policies on the Efficiency of U.S. Power Plants, Energy Policy, 37(11): 4574-4582
Popp, D. (2010), Exploring Links Between Innovation and Diffusion: Adoption of NOX Control Technologies at U.S. Coal-fired Power Plants, Environmental and Resource Economics, 45(3): 319-352
Popp, D., Wu, Y., Bretschneider, S. (2007), The Effects of Innovation Policies on Private R&D Investment: A Cross-national Empirical Study, Economics of Innovation and New Technology, 16(4): 237-253
Popp, D., Rausser, G., Smith, V., Zilberman, D. (2010), Innovation and Climate Policy, Annual Review of Resource Economics, vol. 2, eds., Annual Reviews, Palo Alto, CA, pages 275-298
Rivera-Batiz, L. and Romer, P. (1991), International trade with endogenous technological change, NBER working papers series, Working Paper No. 3594
Saggi, K. (2002), Trade, Foreign Direct Investment, and International Technology Transfer: A Survey, World Bank Research Observer, World Bank Group, 17(2): 191-235
Smith P. J. (2001), How do foreign patent rights affect U.S. exports, affiliate sales, and licenses? Journal of Inter-national Economics, 55: 411-439
Snyder, L., Miller, N., Stavins, R. (2003), The effects of environmental regulations on technology diffusion: The case of chlorine manufacturing. Am. Econ. Rev.
Sugathan, M. (2013) Lists of Environmental Goods: An Overview, Information Note, ICTSD
Verdolini, E. and Galeotti, M. (2011), At home and abroad: An empirical analysis of innovation and diffusion in energy technologies, Journal of Environmental Economics and Management, 61: 119-134
World Energy Council, What keeps energy leaders awake at night? World Energy Issues Monitor, 2014, page 26
DISCLAIMER
The designations employed and the presentation of the material in this publication do not imply the expression of any opinion whatsoever on the part of the publishers concerning the legal status of any country, territory, city or area or of its authorities, or concerning delimitation of its frontiers or boundaries. Moreover, the views expressed do not necessarily represent the decision or the stated policy of the publishers, nor does citing of trade names or com-mercial processes constitute endorsement.
This publication may be reproduced in whole or in part and in any form for educational or non-profit purposes without special permission from the publishers, provided acknowledgment of the source is made. The publishers would appreciate receiving a copy of any publication that uses this publication as a source.
No use of this publication may be made for resale or any other commercial purpose whatsoever without prior per-mission in writing. Application for such permission, with a statement of the purpose and intent of the reproduction, should be addressed to [email protected]

126 127
This report is published byThe United Nations Environment Programme (UNEP) and the European Patent Office (EPO)© UNEP, EPO 2015
AuthorsIlja Rudyk, Gerard Owens, Alessia Volpe (EPO)Robert Ondhowe (UNEP)Antoine Dechezleprêtre (Grantham Research Institute, London School of Economics) undertook the statistical analysis included in Chapters 4, 5 and 6 under the co-ordination of the EPO.
ContributorsEssi Karjalainen, Karin Terzic (EPO), with assistance from the EPO Language Service
Reviewers (in alphabetical order) Theon van Dijk (Lexonomics), Karsten Krause (European Commission), Ahmed Abdel Latif, Pedro Roffe (ICTSD), Nikolaus Thumm (Joint Research Center, EuropeanCommission)
Y02 and Y04SThe tagging scheme for patent documents related to climate change mitigation technologies was developed by an EPO team of examiners, led by Javier Hurtado-Albir, Victor Veefkind and Stefano Angelucci.
PhotosCover, page 12/13, 22/24, 30/31, 48/49, 64/65, 94/95: Thinkstock Photos; page 16/17, 74/75, 88/89: laif
Design and productionGraphic Design Munich (EPO)
The report can be downloaded from:www.epo.org/climate-europe
IMPRINT
UNEP:www.unep.org
EPO:www.epo.org
EPO Espacenet:www.espacenet.com
Cooperative Patent Classification:www.cpcinfo.org
Y02 tagging scheme:www.epo.org/y-classification
Y02 e-learning module:www.epo.org/classification-course
EPO Worldwide Patent Statistical Database (PATSTAT):www.epo.org/patstat
IPCC Report:www.ipcc.ch/report/ar5/syr/
ISBN: 978-3-89605-145-5

United Nations Environment Programme (UNEP)Division of Environmental Law and ConventionsUnited Nations Avenue, GigiriP. O. Box 30552 – 00100Nairobi, Kenya.www.unep.org
European Patent Office (EPO)Bob-van-Benthem-Platz 180469 Munich Germanywww.epo.org
Solar, wind and biomass energy sources, Germany