1. climate change: mitigation &...
TRANSCRIPT
1. Climate change: Mitigation & Adaptation
1A. The current situation In accordance with the Covenant of Mayors, Nijmegen has a CO2 reduction objective of 20%. This objective is laid down in our Climate policy and therewith also in the Nijmegen Energy Covenant. Nijmegen wants to be energy neutral by 2045. This entails a 100% CO2 reduction by 2045 compared to reference year 2008. Nijmegen is member of Mayors Adapt.
Reduction objectives of the city
Baseline year Target year % reduction
2008 2045 100% CO2 reduction
2008 2020 20% CO2 reduction
C02 emission /head
CO2/inhab. Total
Transport CO2/inhab.
Total (minus transport) CO2/inhab.
5.88 tonnes 0.98 tonnes 4.9
Total annual CO2 emission (tonnes) 844,657
tonnes 2014
Total CO2 emission per consumed MWh electricity
581 tonnes/MWh
2014
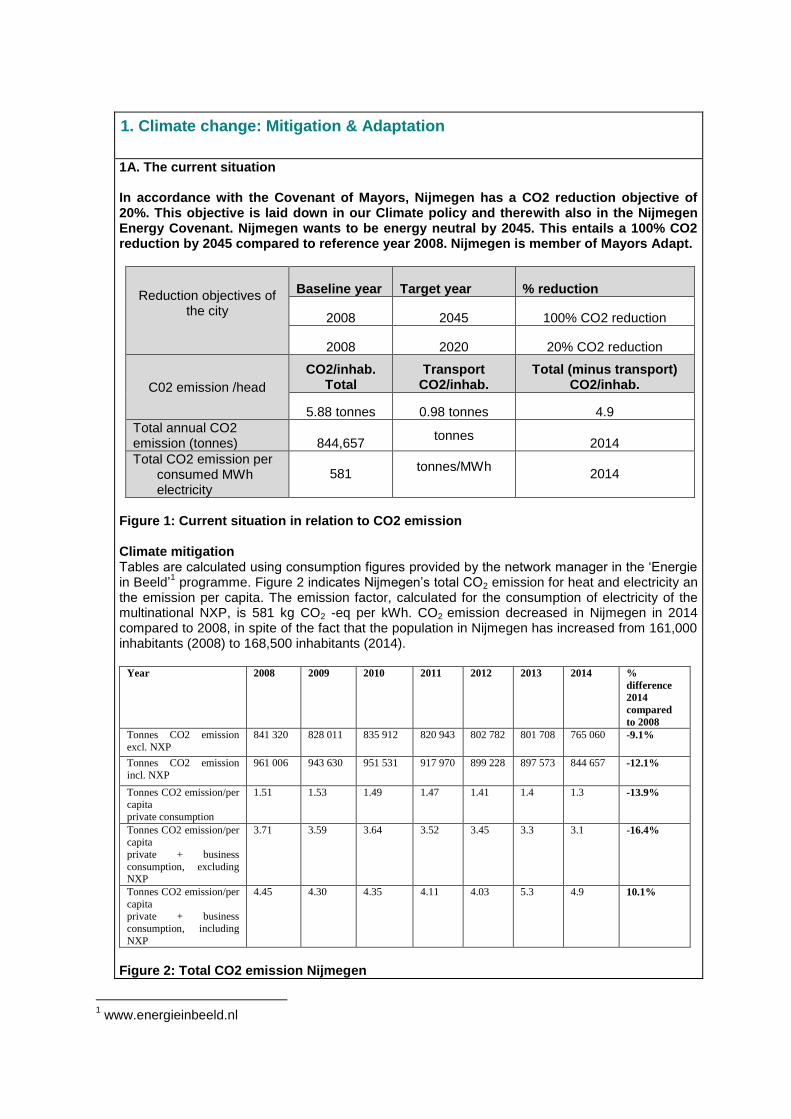
Figure 1: Current situation in relation to CO2 emission Climate mitigation Tables are calculated using consumption figures provided by the network manager in the ‘Energie in Beeld’
1 programme. Figure 2 indicates Nijmegen’s total CO2 emission for heat and electricity an
the emission per capita. The emission factor, calculated for the consumption of electricity of the multinational NXP, is 581 kg CO2 -eq per kWh. CO2 emission decreased in Nijmegen in 2014 compared to 2008, in spite of the fact that the population in Nijmegen has increased from 161,000 inhabitants (2008) to 168,500 inhabitants (2014).
Year 2008 2009 2010 2011 2012 2013 2014 %
difference
2014
compared
to 2008
Tonnes CO2 emission
excl. NXP
841 320 828 011 835 912 820 943 802 782 801 708 765 060 -9.1%
Tonnes CO2 emission
incl. NXP
961 006 943 630 951 531 917 970 899 228 897 573 844 657 -12.1%
Tonnes CO2 emission/per capita
private consumption
1.51 1.53 1.49 1.47 1.41 1.4 1.3 -13.9%
Tonnes CO2 emission/per capita
private + business
consumption, excluding NXP
3.71 3.59 3.64 3.52 3.45 3.3 3.1 -16.4%
Tonnes CO2 emission/per
capita
private + business
consumption, including
NXP
4.45 4.30 4.35 4.11 4.03 5.3 4.9 10.1%
Figure 2: Total CO2 emission Nijmegen
1 www.energieinbeeld.nl
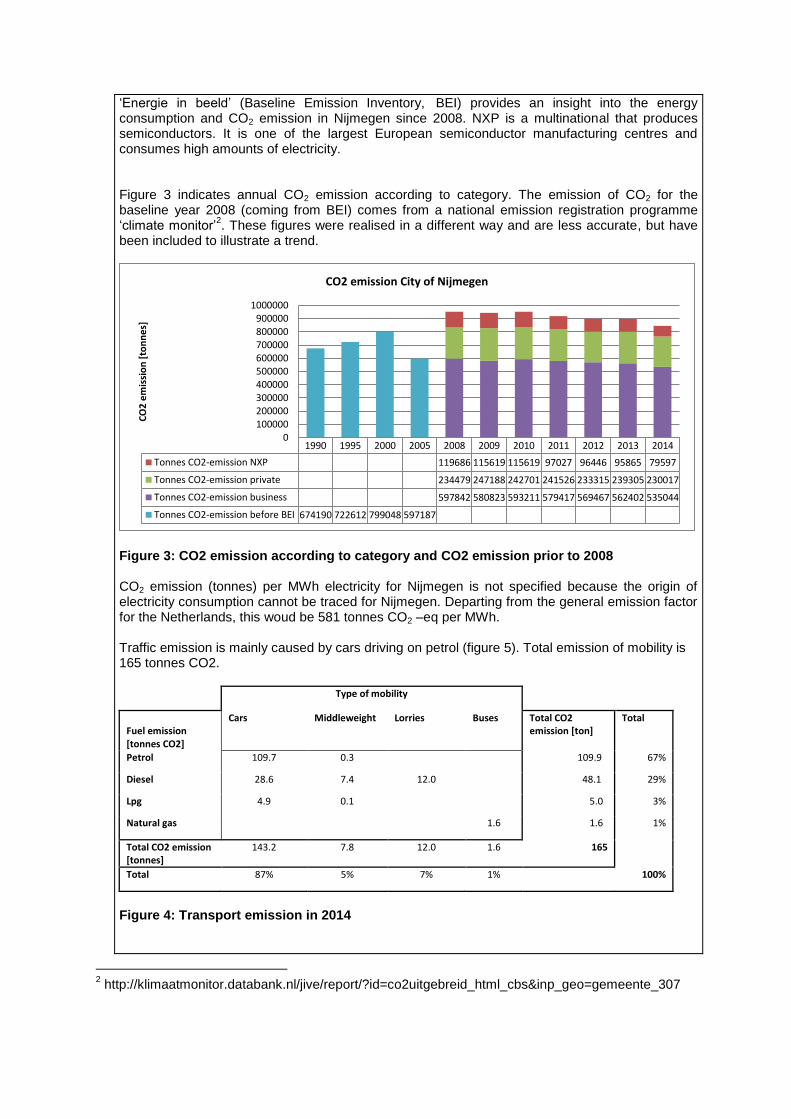
‘Energie in beeld’ (Baseline Emission Inventory, BEI) provides an insight into the energy consumption and CO2 emission in Nijmegen since 2008. NXP is a multinational that produces semiconductors. It is one of the largest European semiconductor manufacturing centres and consumes high amounts of electricity. Figure 3 indicates annual CO2 emission according to category. The emission of CO2 for the baseline year 2008 (coming from BEI) comes from a national emission registration programme ‘climate monitor’
2. These figures were realised in a different way and are less accurate, but have
been included to illustrate a trend.
Figure 3: CO2 emission according to category and CO2 emission prior to 2008 CO2 emission (tonnes) per MWh electricity for Nijmegen is not specified because the origin of electricity consumption cannot be traced for Nijmegen. Departing from the general emission factor for the Netherlands, this woud be 581 tonnes CO2 –eq per MWh. Traffic emission is mainly caused by cars driving on petrol (figure 5). Total emission of mobility is 165 tonnes CO2.
Type of mobility
Fuel emission [tonnes CO2]
Cars Middleweight Lorries Buses Total CO2 emission [ton]
Total
Petrol 109.7 0.3 109.9 67%
Diesel 28.6 7.4 12.0 48.1 29%
Lpg 4.9 0.1 5.0 3%
Natural gas 1.6 1.6 1%
Total CO2 emission [tonnes]
143.2 7.8 12.0 1.6 165
Total 87% 5% 7% 1% 100%
Figure 4: Transport emission in 2014
2 http://klimaatmonitor.databank.nl/jive/report/?id=co2uitgebreid_html_cbs&inp_geo=gemeente_307
1990 1995 2000 2005 2008 2009 2010 2011 2012 2013 2014
Tonnes CO2-emission NXP 119686 115619 115619 97027 96446 95865 79597
Tonnes CO2-emission private 234479 247188 242701 241526 233315 239305 230017
Tonnes CO2-emission business 597842 580823 593211 579417 569467 562402 535044
Tonnes CO2-emission before BEI 674190 722612 799048 597187
0100000200000300000400000500000600000700000800000900000
1000000
CO
2 e
mis
sio
n [
ton
ne
s]
CO2 emission City of Nijmegen
The municipality of Nijmegen sets a good example to the city for C02 reduction. Since 2008 we have been buying green energy (gas and electricity) together with neighbouring communities for the consumption of the own organisation. Our entire fleet has been replaced by cars using biogas. We stimulate our 1,800 employees to travel as enviromentally-friendly as possible. For trips during work, we use public transport, (electric) bikes and e-scooters, which have covered over 100,000 kilometres since 2010. For commuter traffic, the municipality adopts a strict licence regime for parking cars. We stimulate the use of bicycles by facilitating decent bicycle sheds, showers and offering personnel budget for buying bikes. Internal post is delivered by bike couriers or with the natural gas fleet. Ships that moor at the Waal quay can use shore power provisions (green electricity). When renewing street lamps, energy efficient LED fittings are placed. We also significantly reduce energy consumption and therefore also CO2 emission for wastewater management and drinking water production. Nijmegen has had a Sewage Plans since 1994 and a Water Plan since 2001. The objective is to optimise the wastewater and rainwater drainage system. Less and less rainwater goes into the sewer and is filtered in our own soil. For this less pumping capacity is required for sewage pumping. Simultaneously, Nijmegen is becoming less vulnerable to severe rainfall. The Nijmegen sewage water purification plant has been generating energy through fermentation since 2015 (figure 5). In its production of drinking water in the Netherlands, Vitens is aiming for a 20% reduction of energy consumption and 50% CO2 reduction in 2010-2020. Their energy nexus is quite low (0.4 kwh/m3).
Figure 5: Logo Energiefabriek Climate adaptation The municipality of Nijmegen is a member of the Mayors Adapt Covenant and will for now not be drawing up an integral climate adaptation strategy. Our adaptation policy is included in the existing policy plans (sewage system, water and green). This has covered our vulnerability for heavy rainfall and heat stress (see 1B). The State sees to a reduction of flood vulnerability (Delta programme).
1B. Previous achievement objectives Climate mitigation policy The municipality of Nijmegen has been consciously working on the climate, with citizens of the city as well as with the business world and knowledge institutions for a long time. An overview of our climate policy: Early in 2008 the “Climate Framework Memorandum - A good climate for change” was determined by the council. The objectives for climate and energy were:
Climate neutral organisation by 2015;
Climate neutral city by 2032;
20% sustainable energy by 2020. The municipality wants to realise municipality-wide energy saving of 3% net/year on the total gas and electricity consumption in the municipality. To enable this, good insights in the energy
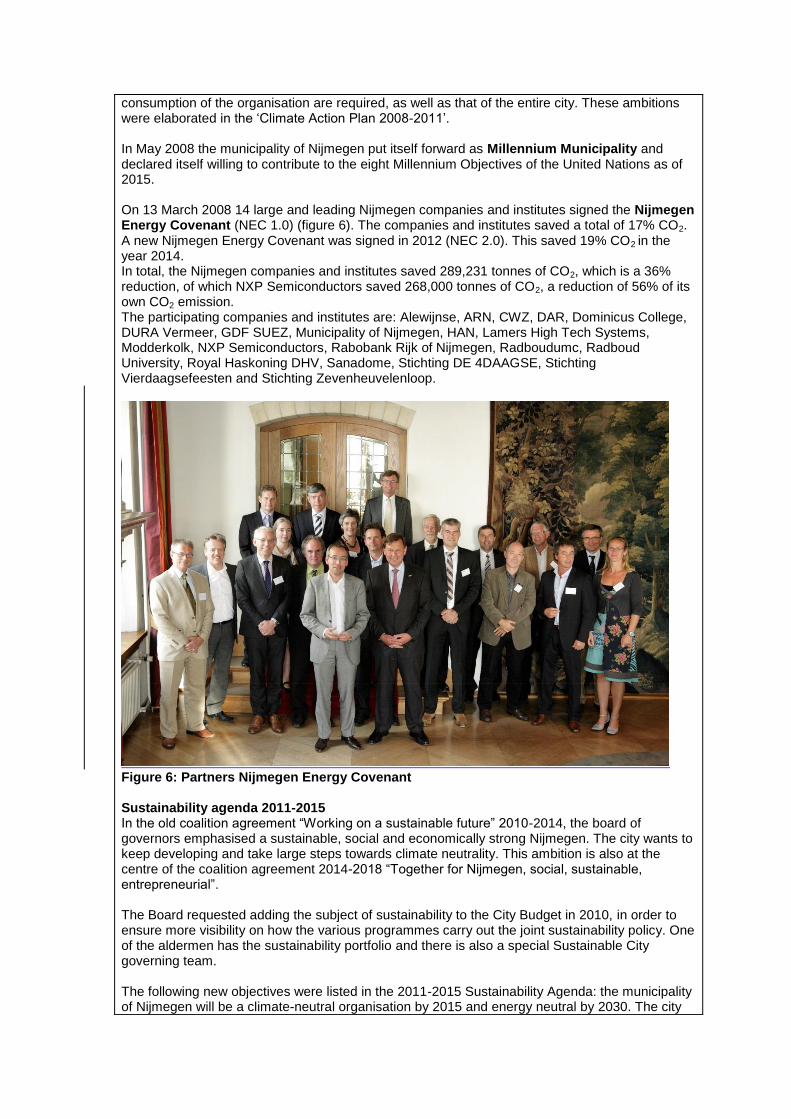
consumption of the organisation are required, as well as that of the entire city. These ambitions were elaborated in the ‘Climate Action Plan 2008-2011’. In May 2008 the municipality of Nijmegen put itself forward as Millennium Municipality and declared itself willing to contribute to the eight Millennium Objectives of the United Nations as of 2015. On 13 March 2008 14 large and leading Nijmegen companies and institutes signed the Nijmegen Energy Covenant (NEC 1.0) (figure 6). The companies and institutes saved a total of 17% CO2. A new Nijmegen Energy Covenant was signed in 2012 (NEC 2.0). This saved 19% CO2 in the year 2014. In total, the Nijmegen companies and institutes saved 289,231 tonnes of CO2, which is a 36% reduction, of which NXP Semiconductors saved 268,000 tonnes of CO2, a reduction of 56% of its own CO2 emission. The participating companies and institutes are: Alewijnse, ARN, CWZ, DAR, Dominicus College, DURA Vermeer, GDF SUEZ, Municipality of Nijmegen, HAN, Lamers High Tech Systems, Modderkolk, NXP Semiconductors, Rabobank Rijk of Nijmegen, Radboudumc, Radboud University, Royal Haskoning DHV, Sanadome, Stichting DE 4DAAGSE, Stichting Vierdaagsefeesten and Stichting Zevenheuvelenloop.
Figure 6: Partners Nijmegen Energy Covenant Sustainability agenda 2011-2015 In the old coalition agreement “Working on a sustainable future” 2010-2014, the board of governors emphasised a sustainable, social and economically strong Nijmegen. The city wants to keep developing and take large steps towards climate neutrality. This ambition is also at the centre of the coalition agreement 2014-2018 “Together for Nijmegen, social, sustainable, entrepreneurial”. The Board requested adding the subject of sustainability to the City Budget in 2010, in order to ensure more visibility on how the various programmes carry out the joint sustainability policy. One of the aldermen has the sustainability portfolio and there is also a special Sustainable City governing team. The following new objectives were listed in the 2011-2015 Sustainability Agenda: the municipality of Nijmegen will be a climate-neutral organisation by 2015 and energy neutral by 2030. The city
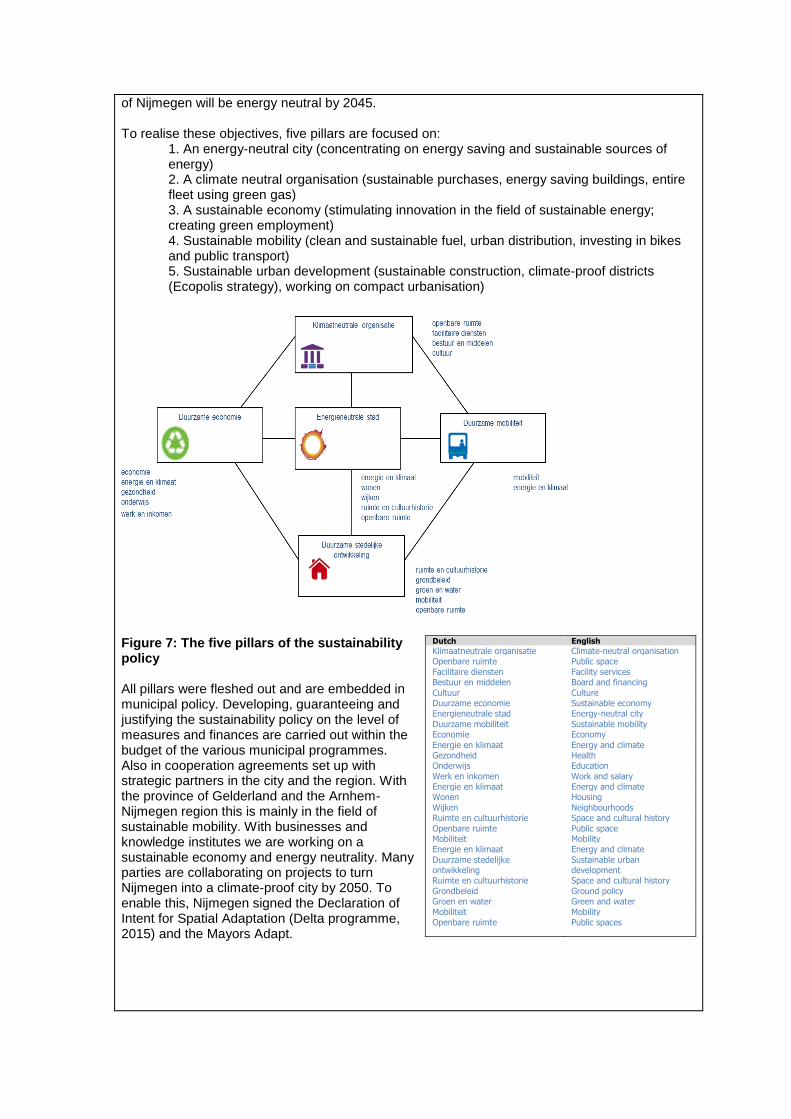
of Nijmegen will be energy neutral by 2045. To realise these objectives, five pillars are focused on:
1. An energy-neutral city (concentrating on energy saving and sustainable sources of energy) 2. A climate neutral organisation (sustainable purchases, energy saving buildings, entire fleet using green gas) 3. A sustainable economy (stimulating innovation in the field of sustainable energy; creating green employment) 4. Sustainable mobility (clean and sustainable fuel, urban distribution, investing in bikes and public transport) 5. Sustainable urban development (sustainable construction, climate-proof districts (Ecopolis strategy), working on compact urbanisation)
Figure 7: The five pillars of the sustainability policy All pillars were fleshed out and are embedded in municipal policy. Developing, guaranteeing and justifying the sustainability policy on the level of measures and finances are carried out within the budget of the various municipal programmes. Also in cooperation agreements set up with strategic partners in the city and the region. With the province of Gelderland and the Arnhem-Nijmegen region this is mainly in the field of sustainable mobility. With businesses and knowledge institutes we are working on a sustainable economy and energy neutrality. Many parties are collaborating on projects to turn Nijmegen into a climate-proof city by 2050. To enable this, Nijmegen signed the Declaration of Intent for Spatial Adaptation (Delta programme, 2015) and the Mayors Adapt.
Dutch English
Klimaatneutrale organisatie Climate-neutral organisation Openbare ruimte Public space
Facilitaire diensten Facility services Bestuur en middelen Board and financing
Cultuur Culture Duurzame economie Sustainable economy Energieneutrale stad Energy-neutral city
Duurzame mobiliteit Sustainable mobility Economie Economy
Energie en klimaat Energy and climate Gezondheid Health Onderwijs Education
Werk en inkomen Work and salary Energie en klimaat Energy and climate Wonen Housing
Wijken Neighbourhoods Ruimte en cultuurhistorie Space and cultural history
Openbare ruimte Public space Mobiliteit Mobility Energie en klimaat Energy and climate
Duurzame stedelijke ontwikkeling
Sustainable urban development
Ruimte en cultuurhistorie Space and cultural history
Grondbeleid Ground policy Groen en water Green and water
Mobiliteit Mobility Openbare ruimte Public spaces
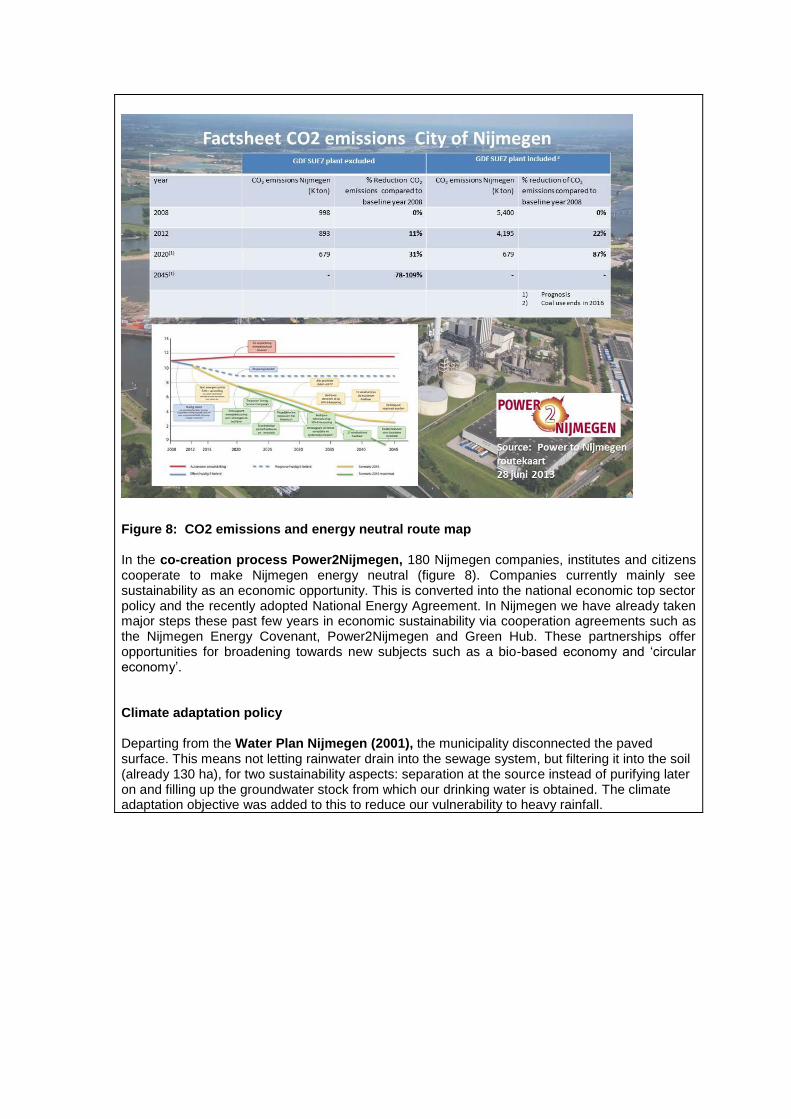
Figure 8: CO2 emissions and energy neutral route map In the co-creation process Power2Nijmegen, 180 Nijmegen companies, institutes and citizens cooperate to make Nijmegen energy neutral (figure 8). Companies currently mainly see sustainability as an economic opportunity. This is converted into the national economic top sector policy and the recently adopted National Energy Agreement. In Nijmegen we have already taken major steps these past few years in economic sustainability via cooperation agreements such as the Nijmegen Energy Covenant, Power2Nijmegen and Green Hub. These partnerships offer opportunities for broadening towards new subjects such as a bio-based economy and ‘circular economy’. Climate adaptation policy Departing from the Water Plan Nijmegen (2001), the municipality disconnected the paved surface. This means not letting rainwater drain into the sewage system, but filtering it into the soil (already 130 ha), for two sustainability aspects: separation at the source instead of purifying later on and filling up the groundwater stock from which our drinking water is obtained. The climate adaptation objective was added to this to reduce our vulnerability to heavy rainfall.

Figure 9: Flood map – Flow paths (section vulnerable area Nijmegen east) In 2009 Nijmegen was hit by very heavy rainfall and several streets on the lateral moraine (Nijmegen east) and in the centre flooded. Since then, the municipality has gained insight into the risks. Various models are ready and we can imitate every type of rainshower to see what the consequences are (figure 9). Residential projects began in 2012 in the most vulnerable streets to prevent future damage. Via surveys and resident meetings, residents were asked questions and informed. Residents were given a practical tool to make their house ‘waterproof’, for both above-ground floods and underground floods from the sewers. Our Water Service Point/ Sustainable Living counter provide this communication. Nijmegen took part in the European Interreg IVB Future Cities project. Nijmegen exchanged knowledge and experiences with Arnhem and Tiel, Hastings in England, Rouen in France, Ypres in Belgium and lead partner Emscher-genossenschaft/Lippeverband in the area of making city climate proof. Cities are noticing the effects of climate change relatively quickly. Larger periods of heat have a lot of effect on a stone environment (figure 10). In order to combat such ‘heat islands’ and improve the climate for people living in the city, urban (spatial) adaptation is necessary. This, by disconnecting water (to make sure it doesn’t drain into the sewer system), by using heat/cold storage and by the using residual heat of factories to heat houses. Constructing green roofs combines many advantages: retains water, sees to CO2 capture, retains micro-dust, provides ventilation and insulation of buildings and a better living climate.
Dutch English
Legenda Legend Plangebied Plan area Waterdiepte in mm Water depth in mm
Hoogte in m +NAP Height in m + NAP (normal Amstedam water level)
Hoog High Laag Low
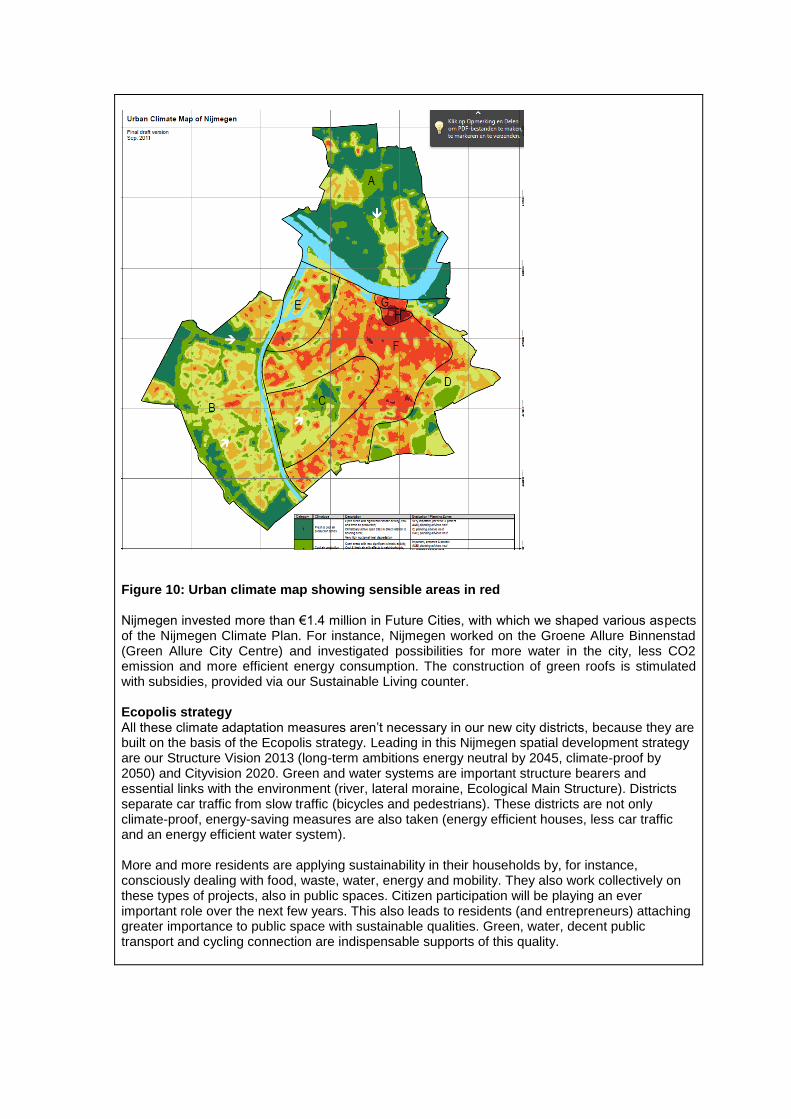
Figure 10: Urban climate map showing sensible areas in red Nijmegen invested more than €1.4 million in Future Cities, with which we shaped various aspects of the Nijmegen Climate Plan. For instance, Nijmegen worked on the Groene Allure Binnenstad (Green Allure City Centre) and investigated possibilities for more water in the city, less CO2 emission and more efficient energy consumption. The construction of green roofs is stimulated with subsidies, provided via our Sustainable Living counter. Ecopolis strategy All these climate adaptation measures aren’t necessary in our new city districts, because they are built on the basis of the Ecopolis strategy. Leading in this Nijmegen spatial development strategy are our Structure Vision 2013 (long-term ambitions energy neutral by 2045, climate-proof by 2050) and Cityvision 2020. Green and water systems are important structure bearers and essential links with the environment (river, lateral moraine, Ecological Main Structure). Districts separate car traffic from slow traffic (bicycles and pedestrians). These districts are not only climate-proof, energy-saving measures are also taken (energy efficient houses, less car traffic and an energy efficient water system). More and more residents are applying sustainability in their households by, for instance, consciously dealing with food, waste, water, energy and mobility. They also work collectively on these types of projects, also in public spaces. Citizen participation will be playing an ever important role over the next few years. This also leads to residents (and entrepreneurs) attaching greater importance to public space with sustainable qualities. Green, water, decent public transport and cycling connection are indispensable supports of this quality.
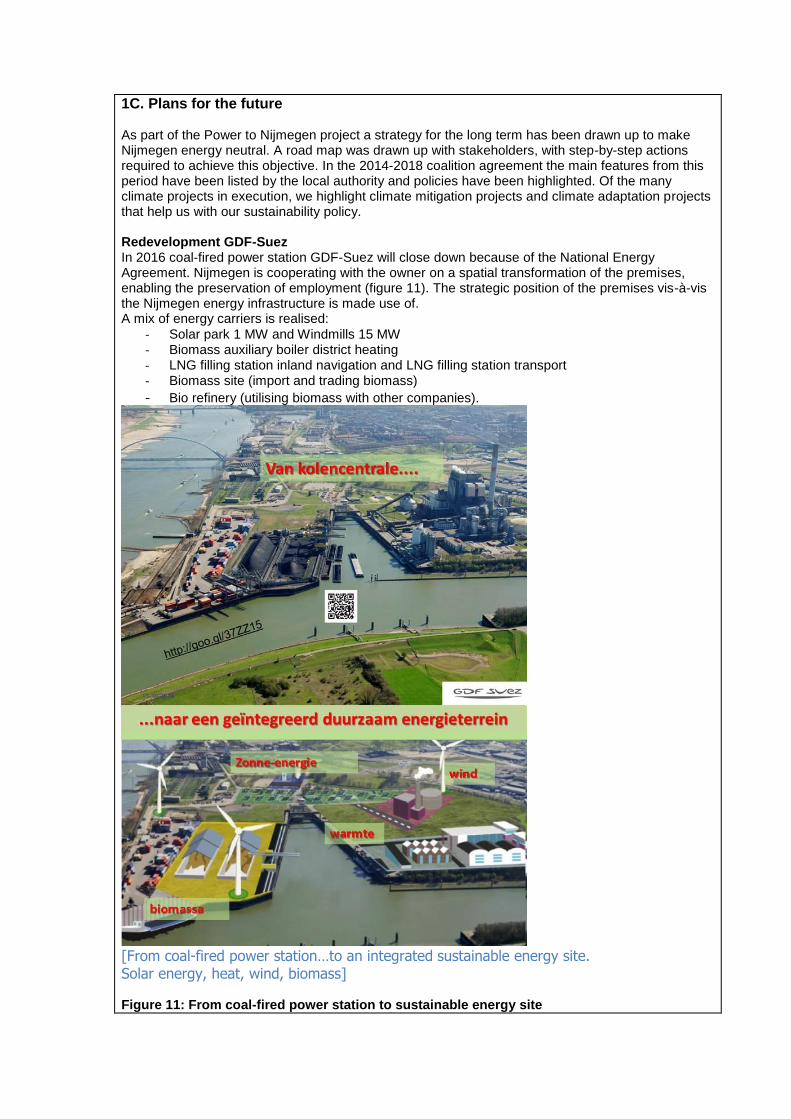
1C. Plans for the future As part of the Power to Nijmegen project a strategy for the long term has been drawn up to make Nijmegen energy neutral. A road map was drawn up with stakeholders, with step-by-step actions required to achieve this objective. In the 2014-2018 coalition agreement the main features from this period have been listed by the local authority and policies have been highlighted. Of the many climate projects in execution, we highlight climate mitigation projects and climate adaptation projects that help us with our sustainability policy. Redevelopment GDF-Suez In 2016 coal-fired power station GDF-Suez will close down because of the National Energy Agreement. Nijmegen is cooperating with the owner on a spatial transformation of the premises, enabling the preservation of employment (figure 11). The strategic position of the premises vis-à-vis the Nijmegen energy infrastructure is made use of. A mix of energy carriers is realised:
- Solar park 1 MW and Windmills 15 MW - Biomass auxiliary boiler district heating - LNG filling station inland navigation and LNG filling station transport - Biomass site (import and trading biomass)
- Bio refinery (utilising biomass with other companies).
[From coal-fired power station…to an integrated sustainable energy site. Solar energy, heat, wind, biomass] Figure 11: From coal-fired power station to sustainable energy site
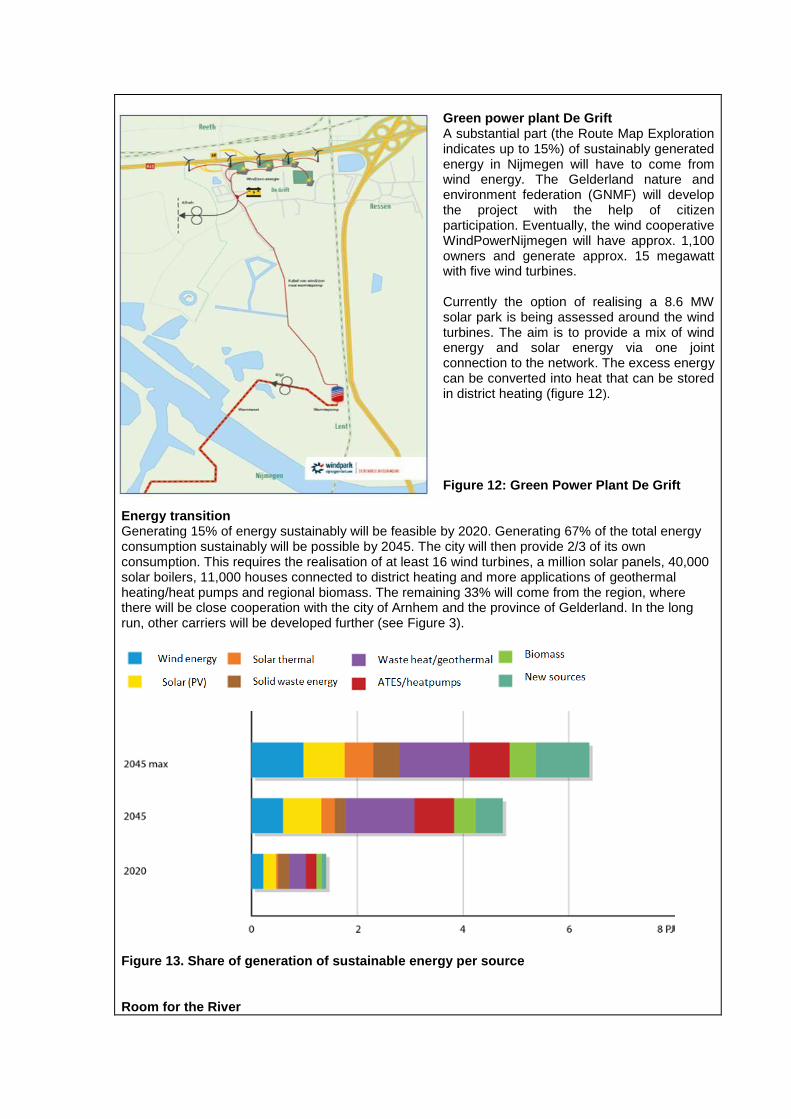
Green power plant De Grift A substantial part (the Route Map Exploration indicates up to 15%) of sustainably generated energy in Nijmegen will have to come from wind energy. The Gelderland nature and environment federation (GNMF) will develop the project with the help of citizen participation. Eventually, the wind cooperative WindPowerNijmegen will have approx. 1,100 owners and generate approx. 15 megawatt with five wind turbines. Currently the option of realising a 8.6 MW solar park is being assessed around the wind turbines. The aim is to provide a mix of wind energy and solar energy via one joint connection to the network. The excess energy can be converted into heat that can be stored in district heating (figure 12). Figure 12: Green Power Plant De Grift
Energy transition Generating 15% of energy sustainably will be feasible by 2020. Generating 67% of the total energy consumption sustainably will be possible by 2045. The city will then provide 2/3 of its own consumption. This requires the realisation of at least 16 wind turbines, a million solar panels, 40,000 solar boilers, 11,000 houses connected to district heating and more applications of geothermal heating/heat pumps and regional biomass. The remaining 33% will come from the region, where there will be close cooperation with the city of Arnhem and the province of Gelderland. In the long run, other carriers will be developed further (see Figure 3).
Figure 13. Share of generation of sustainable energy per source Room for the River
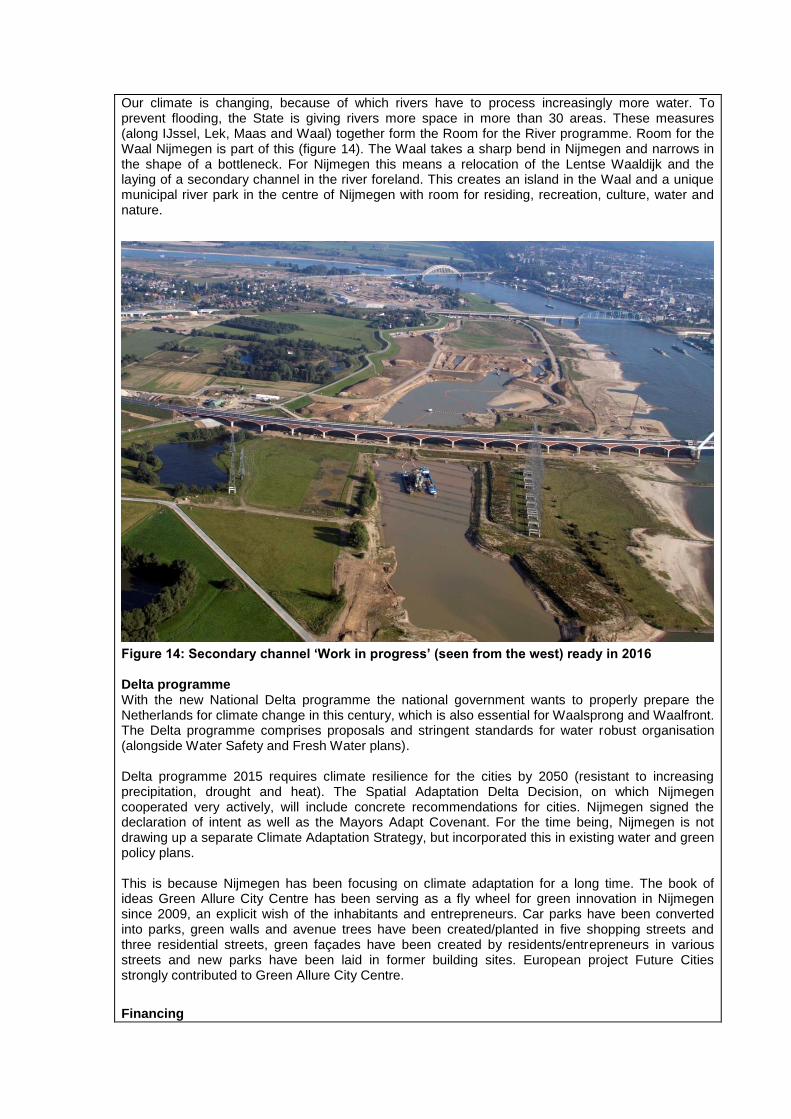
Our climate is changing, because of which rivers have to process increasingly more water. To prevent flooding, the State is giving rivers more space in more than 30 areas. These measures (along IJssel, Lek, Maas and Waal) together form the Room for the River programme. Room for the Waal Nijmegen is part of this (figure 14). The Waal takes a sharp bend in Nijmegen and narrows in the shape of a bottleneck. For Nijmegen this means a relocation of the Lentse Waaldijk and the laying of a secondary channel in the river foreland. This creates an island in the Waal and a unique municipal river park in the centre of Nijmegen with room for residing, recreation, culture, water and nature.
Figure 14: Secondary channel ‘Work in progress’ (seen from the west) ready in 2016 Delta programme With the new National Delta programme the national government wants to properly prepare the Netherlands for climate change in this century, which is also essential for Waalsprong and Waalfront. The Delta programme comprises proposals and stringent standards for water robust organisation (alongside Water Safety and Fresh Water plans). Delta programme 2015 requires climate resilience for the cities by 2050 (resistant to increasing precipitation, drought and heat). The Spatial Adaptation Delta Decision, on which Nijmegen cooperated very actively, will include concrete recommendations for cities. Nijmegen signed the declaration of intent as well as the Mayors Adapt Covenant. For the time being, Nijmegen is not drawing up a separate Climate Adaptation Strategy, but incorporated this in existing water and green policy plans. This is because Nijmegen has been focusing on climate adaptation for a long time. The book of ideas Green Allure City Centre has been serving as a fly wheel for green innovation in Nijmegen since 2009, an explicit wish of the inhabitants and entrepreneurs. Car parks have been converted into parks, green walls and avenue trees have been created/planted in five shopping streets and three residential streets, green façades have been created by residents/entrepreneurs in various streets and new parks have been laid in former building sites. European project Future Cities strongly contributed to Green Allure City Centre.
Financing
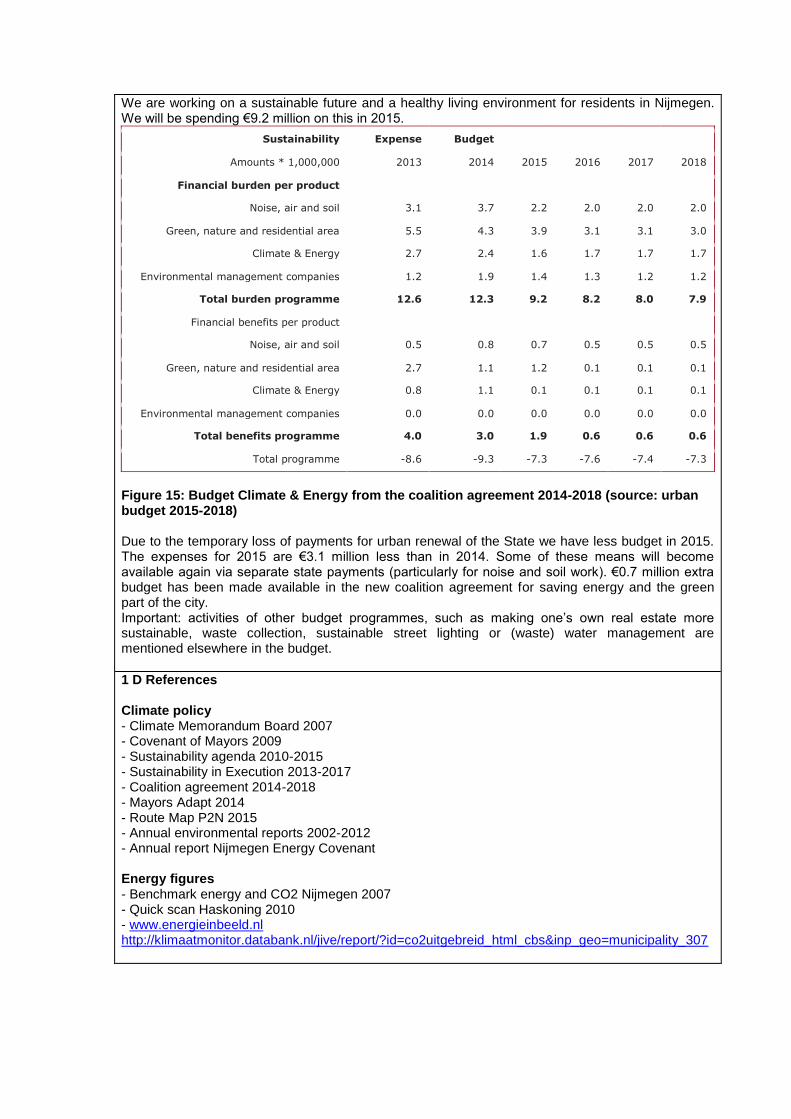
We are working on a sustainable future and a healthy living environment for residents in Nijmegen. We will be spending €9.2 million on this in 2015.
Sustainability Expense Budget
Amounts * 1,000,000 2013 2014 2015 2016 2017 2018
Financial burden per product
Noise, air and soil 3.1 3.7 2.2 2.0 2.0 2.0
Green, nature and residential area 5.5 4.3 3.9 3.1 3.1 3.0
Climate & Energy 2.7 2.4 1.6 1.7 1.7 1.7
Environmental management companies 1.2 1.9 1.4 1.3 1.2 1.2
Total burden programme 12.6 12.3 9.2 8.2 8.0 7.9
Financial benefits per product
Noise, air and soil 0.5 0.8 0.7 0.5 0.5 0.5
Green, nature and residential area 2.7 1.1 1.2 0.1 0.1 0.1
Climate & Energy 0.8 1.1 0.1 0.1 0.1 0.1
Environmental management companies 0.0 0.0 0.0 0.0 0.0 0.0
Total benefits programme 4.0 3.0 1.9 0.6 0.6 0.6
Total programme -8.6 -9.3 -7.3 -7.6 -7.4 -7.3
Figure 15: Budget Climate & Energy from the coalition agreement 2014-2018 (source: urban budget 2015-2018) Due to the temporary loss of payments for urban renewal of the State we have less budget in 2015. The expenses for 2015 are €3.1 million less than in 2014. Some of these means will become available again via separate state payments (particularly for noise and soil work). €0.7 million extra budget has been made available in the new coalition agreement for saving energy and the green part of the city. Important: activities of other budget programmes, such as making one’s own real estate more sustainable, waste collection, sustainable street lighting or (waste) water management are mentioned elsewhere in the budget.
1 D References Climate policy - Climate Memorandum Board 2007 - Covenant of Mayors 2009 - Sustainability agenda 2010-2015 - Sustainability in Execution 2013-2017 - Coalition agreement 2014-2018 - Mayors Adapt 2014 - Route Map P2N 2015 - Annual environmental reports 2002-2012 - Annual report Nijmegen Energy Covenant Energy figures - Benchmark energy and CO2 Nijmegen 2007 - Quick scan Haskoning 2010 - www.energieinbeeld.nl http://klimaatmonitor.databank.nl/jive/report/?id=co2uitgebreid_html_cbs&inp_geo=municipality_307