report no. 39855-in india achieving the mdgs in … 2007 document of the world bank report no....
TRANSCRIPT

May 2007
Document of the World BankR
eport No. 39855-IN
India A
chieving the MD
Gs in India’s Poor States
Report No. 39855-IN
IndiaAchieving the MDGs in India’s Poor StatesReducing Child Mortality in Orissa
Human Development UnitSouth Asia Region
Pub
lic D
iscl
osur
e A
utho
rized
Pub
lic D
iscl
osur
e A
utho
rized
Pub
lic D
iscl
osur
e A
utho
rized
Pub
lic D
iscl
osur
e A
utho
rized
Pub
lic D
iscl
osur
e A
utho
rized
Pub
lic D
iscl
osur
e A
utho
rized
Pub
lic D
iscl
osur
e A
utho
rized
Pub
lic D
iscl
osur
e A
utho
rized


This report was written by Christine Allison, Lead Human Development Specialist in the South Asia Region with substantial support @om Ihsan Ajwad (Economist). Peter Berman, Maitreyi Das, Srivatsa Krishna, Samik Sunder Das and Priti Kumar participated in select missions to Orissa and other poor states. An in-depth field report for Bolangir District, Orissa, was prepared by Susanne van Dillen (University of Bonn). Gertrude Cooper provided administrative and production support to the report.
The Peer Reviewers for the work are Mariam Claeson, Abdo Yazbeck and Viviana Mangiaterra, and we have benefited from their advice and support throughout the work Julian Schweitzer (Sector Director), Mansoora Rashid and Anabela Abreu (Sector Managers) have also provided support and advice. Various other colleagues in the World Bank have contributed ideas.
An earlier version of the report was presented to a meeting of the Orissa Government’s multi-sectoral steering group on child mortality (Februaly 2006). Also in India, interactions with UNICEF, DflD and other stakeholders have helped inform the work.


Contents
Executive Summary .......................................................................................................................... i 1 . Introduction .............................................................................................................................. 1 2 . Orissa ....................................................................................................................................... 3 3 . Recent Trends in Infant and Child Mortality, Orissa ............................................................... 8 4 . The Correlates of Infant and Child Mortality: The Framework ............................................. 12 5 . Applying the Framework to Orissa ........................................................................................ 16
A . The Individual Woman ........................................................................................................ 17 (i) The expectant mother ....................................................................................................... 17 (ii) The birth .......................................................................................................................... 18 (iii) Care o f Newborn and young children ............................................................................ 21 (iv) Mothers’ education - one of the strongest factors influencing child mortality .............. 23
B . The Family ........................................................................................................................... 24 C . The Community ................................................................................................................... 28 D . Services ................................................................................................................................ 29
State Heterogeneity - District Profiles .................................................................................. 31 A . Individual Woman and Mother ............................................................................................ 32 B . The Family ........................................................................................................................... 33 C . Services ................................................................................................................................ 34
7 . Conclusions and Policy Implications - The Roadmap to Lower Child Mortality ................. 37 Bibliography .................................................................................................................................. 51 Annex Tables ................................................................................................................................. 53
6 .
Boxes
Box 2.1: Specific Characteristics of Poverty in Orissa: ................................................................... 5 Box 3.1: Why do different datasets produce different IMR estimates? ......................................... 10 Box 5.1: Ante-natal and Post-natal Care and Practices: Findings from a survey of eight districts27 Box 6.1: Mayurbhanj: Achieving rapid reduction in child mortality ............................................ 36 Box 7.1: Navajyoti: Reducing neonatal mortality and morbidity .................................................. 44
Box 7.3: A conditional cash transfer for Maternal and Child Health - Orissa style ...................... 50 Box 7.2: Joined up thinking. joined up action. The Case o f ANKUR ........................................... 45
Figures
Figure 3.1: Infant Mortality Rate . India and Orissa (1981 . 1999) ............................................... 8 Figure 5.1: Proportion of mothers receiving antenatal care and tetanus toxoid vaccines across castes and welfare quintiles ........................................................................................................... 19 Figure 5.2: The proportion o f deliveries conducted at home across caste and household welfare quintiles .......................................................................................................................................... 20 Figure 5.3: Birth attendants across caste and household welfare groups ....................................... 21 Figure 5.4: BCG, DPT3 and measles immunization rates o f children between 1 and 2 years o f age across caste and welfare quintiles .................................................................................................. 23 Figure 5.5: Child, Infant and Neonatal mortality rates by mother’s educational attainment ......... 24 Figure 5.6: Proportion o f mothers receiving antenatal care and tetanus toxoid vaccines across mother’s education ......................................................................................................................... 24 Figure 5.7: Variation in child and infant mortality across social identity and welfare quintiles ... 28

Figure 6.1: Child mortality rates across districts ........................................................................... 3 1
Number of infant deaths prevented ................................................................................................ 41 Figure 7.1: Simulated reductions in Infant Mortality from changes in four policy variables:
Tables
Table 1.1: Infant Mortality Rates across Selected Indian States. 1980-1999 .................................. 1
Table 2.2: Selected Human Development and BPL Indicators by District ..................................... 6
Table 4.1: Framework for Assessing Impact of Various Factors on Child Mortality .................... 14
Table 6.2: District level performance with IMR: Good and bad performers ................................. 35 Table 7.1: The Framework Revisited: What the Orissa evidence suggests ................................... 37 Table.7.2: A summary o f the most important factors. direct and indirect. impacting Neo-natal. Infant and Child Mortality in Orissa .............................................................................................. 38
Table 7.4: Simulated reductions in Infant Mortality from changes in four policy variables:
Table 7.5: Existing Interventions in the Priority Areas: A Scorecard ........................................... 43
Table 2.1: Headcount Index in Regions o f Orissa by Social Group (1999-2000) ........................... 4
Table 3.1: Trends in some core indicators. RCH I and RCH I1 ....................................................... 9
Table 6.1: Child. Infant. and Neo-natal Mortality Rates in Select Districts .................................. 32
Table 7.3: The Multi-Sectoral Menu of Interventions, ranked by difficulty and time- horizon .... 40
Number o f infant deaths prevented ................................................................................................ 41

As we have been undertaking the work associated with this report (which started in early 2005) the Government of Orissa has shown a determination to raise the profile of child mortality, and to make a concerted effort to accelerate a reduction in the number of infant and child deaths. The launch in April 2005 of “navajyoti”- a strategy to improve maternal and child care, with a particular focus on districts with high IMR - represents such a move, building on the experience of the earlier IMR mission; and in more recent times the launch in Orissa of the national rural health mission - an approach which brings together under one umbrella a number of centrally sponsored schemes. The latter is particularly noteworthy as it seeks to reach out beyond the health sector and involve nutrition, water and sanitation in the actions required to reduce infant and child mortality. It also recognizes the importance of district level plans by way of building on local resources and responding to local conditions. The state government has constituted a cross- departmental committee to bring together the various sectors which have a role to play in addressing child mortality, and we have had the pleasure of interacting with that committee in the course of preparing this report. These developments represent an important base upon which to deepen the dialogue around the spec@ strategies which could be adopted, and the subsequent implementation of a program which wil l ensure a reduction in child mortality.


Achieving The MDGs in India’s Poor States
EXECUTIVE SUMMARY
This report builds on the World Bank’s earlier report on the Millennium Development Goals (MDGs) in India (2004), which highlighted the challenges India faces in meeting a number of the MDGs. That report drew attention to the variation in MDG indicators across the states of India, and showed how much of the “gap” rests with a handful of poor states, of which one is Orissa. Although most of the MDG targets wil l be a stretch for Orissa - and other poor states - it is child mortality where the challenge is perhaps greatest’, for three reasons: first, there is a complex mix of policy issues to address root causes involving food, health, education, water, sanitation, and infrastructure, to name just some of the core sectors; second, it requires a number of different actors - individuals, households, communities as well as policy makers and service providers - all to do their part - and providing effective services to women and children living in remote areas, many of whom are extremely poor and illiterate, is particularly challenging; and third, while events such as starvation deaths, avian f lu, outbreaks of polio make the news and draw the attention of top-level policy makers, the steady state of large numbers of children dying before theirfijlh birthday rarely tops the headlines. As such, although many would consider child mortality a leading indicator of development more generally, it is yet to find its way to the top of the country’s political agenda and to enjoy the support of high profile leaders.
The Millennium Development Goal for child mortality establishes a two-thirds reduction in under-five mortality between 1990 and 2015. For India, this translates into a target of around 32 deaths per 1000 live births, or a corresponding IMR of 27/1000 (starting from a figure of 80/1000 in 1990). The 11th Five Year Plan agenda would bring forward these targets to the year 2012. Using the same metric for Orissa, the infant mortality MDG target is 41/1000 in 2015, and the child mortality target is 49/1000. Within the framework of the National Rural Health Mission, the Government of Orissa has set for itself an IMR target of 50/1000 by 2010. Considering recent estimates place child mortality in the 80s (87/1000 according to the SRS, and 81 according to the NFHS), these targets should be considered a “stretch goal”. Yet by establishing them it has already served to raise the profile of child mortality in the state and stimulated discussion about what needs to done and how best it can be done. This report aims to help inform that debate and lay the groundwork for action which wil l set the state well on the road to achieving - and going beyond - the child mortality MDG.
Some of the highlights of Orissa’s child mortality situation can be summarized as follows:
During the past few years, infant and child mortality has fallen across the State - the exact numbers are subject to some variation across different data sources.
Should data be available on maternal mortality, that too in al l likelihood would also pose a major MDG I
challenge for Orissa.
i

Achieving The MDGs in India’s Poor States
Rising incomes in the coastal districts, increased completion of post-primary schooling for females, delayed age of marriage and first birth, and improved ante- natal care are some of the factors associated with falling infant and child mortality. There are a number of other factors known to be associated with maternal and child health where progress in the state has been less good: environmental conditions (water, sanitation, indoor air pollution), hygiene practices, vector born disease (especially malaria), maternal and child nutrition, births attended by trained medical person (either at home or in a clinichospital), and emergency obstetric care. Of particular note is stagnant rates of immunization coverage.
0 There remains considerable variation across districts, with coastal districts in general having lower IMWchild mortality and interior/KBK districts having much higher rates. Malkangiri, the district with the highest child mortality rate, has more than 120 child deaths per 1000 live births compared to Balasore (46/1000), the district with the lowest child mortality rate; there is less variation .with neonatal mortality rates than with post-neonatal infant and child mortality.; Districts with the highest infant and child mortality rates are generally poorer, the Cfemale) population is less educated, the population lives in more sparse settlements with poor road connections, making access to health and other services more difSicult, and service provision is weak. However, there are districts such as Sambalpur, Deogarh, Mayurbhanj, and Bhadrak which have lower mortality rates than their socio-economic status would suggest, and these offer interesting sites for further investigation.
0 Although childhfant mortality rates are higher among the Scheduled Tribe population of Orissa, this is largely a function of poverty (lower levels of income and assets,) low levels of education, and poor access/utilization on health services.
0
Many of the findings of the investigation underpinning this report confirm what is more broadly known about the child mortality situation in India, but some of the findings are more unique to Orissa (and potentially other poor states). Examples of the latter include the- seasonalitv of infant mortalitv during the rainy season (due to fever, malaria, diarrhea and pneumonia) and the cold season (indoor air pollution), the role of malaria, and the very uoor environmental health pi-actices (hygiene, cooking fuel). These more Orissa-specific factors, coupled with the high rates of uovertv, low levels of (female) literacv, the exceptionally poor state of public services (including health services) and infrastructure, especially roads, all contribute to high levels of neonatal, infant and child mortality.
Drawing f rom the broader framework for assessing the impact of the various factors influencing child mortality (Table 4.1 in the body of the report), the figure below summarizes the evidence for Orissa, and begins to tease out those factors, practices, and services which have the strongest association with child mortality. The figure below is organized into four quadrants - ( i ) characteristics and behaviors associated with the individual womadmother, ( i i ) the family within which the woman lives and into which the child is born, ( i i i ) the community, and (iv) service provision. Each quadrant represents an important segment of the production function of child survival, and while shown as separate spheres, there are significant interactions and inter- dependences across all of them. This underscores the highly complex nature of child survival and the requirement for inputs and actions in a number of different policy spheres.
.. 11

Achieving The MDGs in India’s Poor States
Education (esp. post-primary) Nutrition (during pregnancy and breastfeeding)
Age at first birth and spacing between births
The Framework for Understanding Child Mortality: Actors and Actions
Income and wealth Intra-household dynamics Water (piped into house)
A. Individual woman/mother B. The family
survival C. The Community
Environmental health practices (water, sanitation, solid waste)
Beliefs and practices (e.g. at the birth) Women’s self-help groups
Active PRIs
D. Services
Basic healthhutrition services in village/outreach to households
Access to health facilities for emergency obstetric and sick child care
Other services, such as school, roadtransport and electricity
What interventions are needed?
Looking to the future and a policy agenda, which is most likely to support an acceleration in the rate of decline of child mortality, there is an inclination to say that many things need to change, and indeed that is the case. But on the basis of quantitative and qualitative analysis (detailed in the report), we can suggest a shortlist of twelve interventions which seem to be particularly important. We have divided these into three categories: relatively quick and easy; more involved and needing more time; and longer term - but critical. Regarding the interventions in the latter category - measures which reduce income poverty for the poorest, and educating girls beyond primary education (ideally through secondary school) - the potential impact on lowering infant and child mortality is very significant. For example, policy simulations show that if all women of child bearing age had at least a primary education, the infant mortality rate in Orissa would fall by around 35% of its present value. Comparative data from other countries in the region confirm this finding. Likewise, a doubling of the asset index (a proxy for household income) would lead to a 17% reduction in infant mortality.
The interventions (listed in the table on the next page) are clearly quite different in nature, involving direrent actors and actions in a variety of places - at home, by the household, by local communities, through outreach from diferent key sectors, and/or through access to fixed and referral services - span a very varied time-frame, involve different levels and types of resources (human and financial), and require diferent delivery strategies. Also, as illustrated in the Table, the role of these interventions varies across neo-natal, infant and child mortality and as such the optimal mix of interventions could change depending on the mortality profile. For example, a district with high post-neonatal mortality (such as Koraput) might need to place equal emphasis on the interventions in the right hand column of the table, whereas a district with high
... 111

Achieving The MDGs in India's Poor States
neonatal mortality but low post-neonatal mortality (such as Khorda) might need to place more emphasis on interventions in the first column.
" _- ~ ~ - ~ - - 1_ I - - I _ " f - I Neo-natal mortality I (first month)
Hierarchy of Interventions I. Quick and easy
Improved hygiene practices, especially hand washing with soap Insecticide treated nets
2. More involved, needing more time and resources
Quality ante-natal and post-natal care, strong emphasis on maternal educatiodhome practiceslnutrition Birth, including at home, attended by trained midwife or doctor Access to (physical, financial) emergency obstetric and newborn care, and reliable service provision
Exclusive breastfeeding from Day One Spacing between births o f
I 24 months or more I Nutrition education supported by
supplementary nutrition for pregnant and lactating women Clean cooking fuels
1 PiDed water into house 3. More long-term but critical
Measures which promote empowerment and reduce income poverty for the poorest Post-primary education, especially for girls
Infant and child mortality
Improved hygiene practices, especially hand washing with soap Insecticide treated nets
Quality child care, with an emphasis on home practices, treatment o f sick child and immunization
Access to (physical, financial) emergency care for sick child, immunization and other preventative programs Exclusive breastfeeding for 6 months Spacing between births o f 24 months or more Supplementary nutrition for lactating women; weaning and child feeding practices Clean cooking fuels Piped water into house
Measures which promote empowerment and reduce income poverty for the poorest Post-primary education, emeciallv for girls
Together, the Government of India and the Government of Orissa support a very rich policy agenda addressing many of the priority areas identified in this Table. I n the past year alone a number of major new initiatives have been launched by GoI, including the National Rural Health Mission, a second Reproductive and Child Health Program, the National Rural Employment Guarantee Scheme, and a rural infrastructure program. These complement other centrally sponsored schemes in the area of nutrition (PDS and ICDS), education (SSA), and vector-borne diseases (including malaria). At the state level, there is a whole host of programs including "missions" for rural drinking water and sanitation, a women's empowerment/rural credit scheme (Mission Shakti), school scholarship program for ST/SC girls, an IMWneo-natal
i v

Achieving The MDGs in India’s Poor States
“mission”, and the Orissa Health Sector Program. Overall, it could be concluded that Orissa is adequately provided for in terms of the essential policies and programs needed to bring about a further reduction in infant and child mortality. Moreover, some of the shortcomings identified by past reviews - such as inflexible centrally sponsored schemes and over-centralized planning, lack of attention to state and district heterogeneity - are being addressed in the new programs.
But there are problems and major challenges.
First, while there may be a perception in federal and state government circles that there is a full array of policies and programs to address the multi-sectoral nature of child survival, the reality for people living in the remoter rural areas is quite different. I n parts of Orissa there is a near absence of services: public service providers and critical supplies are ofen absent due to both a shortage of providers and weak governance of resources in the system), private providers are few due to limited market sizehahe, and there are relatively few non-governmental agencies. Heavy seasonal rains and poor infrastructure present additional barriers to regular service provision in rural Orissa. But i t is not just a problem of physical access and fickle service suppliers. The poor are ofen faced with significant costs (user charges) when accessing public services, especially health services. A study undertaken in Bolangir District recently found fee for service arrangements in place with Anganwadi workers (for ante-natal care), ANMs (attending births), and in government medical facilities (for many services). Moreover, patients reported not only facing considerable expenses in seeking healthcare from a government facility but were also exposed to a great deal of arbitrariness and il l-wil l at the time of seeking medical care. The challenge to expand and sustain effective coverane/out-reach of services to Orissa’s interior districts and scattered populations - in particular the ST population - cannot be understated. Adautinn uronrams to different situations and needs, and considering different delivery strategies - especially involving communities, local governments and NGOs - steps recently initiated by the Orissa Government - seem promising areas.
Second, some service providers are carrying too many responsibilities and their impact on any one priority is limited. A good example would be the Anganwadi worker who is the frontline service provider of many programs for women and children. Although such an arrangement helps promote convergence across programs, one person can only do so much. The advent of a second community based worker under the Rural Health Mission - the ASHA - is a good initiative and should help free up time for the Anganwadi worker to focus her core responsibilities. Line management of the two different functionaries - who report to two different government departments - wil l remain a challenge. Introduction of fixed health and nutrition days, at which service providers from different line departments converge in a village and provide integrated services, is one initiative to overcome this problem. Another is the increasing involvement of PRI bodies in the oversight of local service delivery.
Third, building on recent efforts to respond to national and state level heterogeneity, further sharpening the focus on those districts and blocks where child mortality is highest, and varying the “input package” of centrally sponsored schemes to reflect local conditions and the relative levels of neonatal, infant and child mortality is still needed. Preparing district (and block) plans, empowering communities and decentralizing resources, responsibilities and accountabilities to local government are all core elements of getting the right mix.
Fourth, too many programs are run as self contained “silos” and miss critical synergies: too often potential synergy is lost due to complementary inputs occurring at different times and in different places. There are, for example, strong potential complementarities across sectors, such as those between health and nutrition, or between supply-side investments in service delivery and
V

Achieving The MDGs in India’s Poor States
demand-side benefits from community mobilization. Finding ways to achieve greater inter- sectoral integratiodconvergence in order to benefit from the strong positive interactions across sectors and across programs should be given higher priority than launching any more new programs. The example of ANKUR, a joint initiative of the Orissa Government, and UNICEF is an interesting attempt to promote more multi-sectoral collaboration.
Joined up thinking, joined up action: The Case of ANKUR
ANKUR i s a joint initiative o f the Government o f Orissa and UNICEF, under implementation in the Distr ict o f Koraput (one o f the poorest KBK districts). I t has four inter- related goals:
0 Improve the quality o f education for tribal children and girls 0 Improve nutrition and development o f children under 3 years o f age 0 Improve infant survival 0 Support implementation o f state-wide reforms for rural drinking water and sanitation.
At the heart o f the program i s the District Plan of’Action for the young child, which identifies where action i s needed and by whom. There are no new activities, bur rather a focus on establishing functional linkages between existing programs to maximize their impact for the young child. This involves joint planning, implementation, and assessment aimed at changing community and family level behavior, strengthening service delivery, and ensuring strong interface between community and service providers. Distr ict level coordination i s replicated at block, Gram Panchayat and village levels.
ANKUR was launched in 2004 and i s a four year program, covering all blocks in a phased manner. The bulk o f activities involve support for micro-planning, capacity building and training o f front-line functionaries, and frequent coordination meetings. In two pilot blocks additional support for implementation o f integrated actions in health, water and sanitation, education, child development and nutrition i s also envisaged.
The final area where the existing array of government policies and programs might be considered lacking is the strong emphasis given to supply side and hardware interventions at the expense of insuficient attention to demand side, “the soft side of services”, information and behavioral aspects. A quick survey of existing interventions in Orissa (Table 7.5 in the text) finds the need for more emphasis on IEC, BCC in a number of programs (especially water and sanitation), a greater focus of promotive/preventative healthcare of women and young children, and support to individuals, households and communities to demand and access services.
Putting it all together: What might a child mortality reducing program look like?
I n so far as child mortality is linked to multiple determinants, there is a compelling argument for a more holistic, or integrated approach designed to bring to bear all relevant factors in one place at one point in time. But a “one size f i t s all” approach wil l not work: what is needed for one situation may differfrom what is needed in another situation. As such, a range of interventions should be considered depending on local conditions and ideally subject to close monitoring and periodic evaluations in order to provide feedback on what is working. I n addition, in order for local preferences to be followed, placing purchasing power to “pick and mix” from the various interventions with individuals and communities would be an important
v i

Achieving The MDGs in India’s Poor States
development. This could be in the form of vouchers or block grants, for example. This approach speaks to “thinking multi-sectorally, acting locally”.
One should also be mindful of the danger that trying to address everything in one package becomes difSused and unwieldy, and impact is minimal. Asking ourselves the following set of questions is key: “of which sectors does it make the most sense to develop linkages and what benefits do these linkages produce; do these linkages add value over and above what these sectors are already doing on their own - and/or could be doing if better implemented; and which linkages are likely to be most cost-effective”. Moreover, to be effective, multi-sectoral action requires the cooperation and coordination of a variety of actors and stakeholders. Many of these requirements run counter to public sector culture and practice in India, and as such present another major hurdle. This leads us to “thinking multi-sectorally, acting locally and selectively ”.
The Orissa state government has constituted a cross-departmental committee to bring together the various sectors that have a role to play in addressing child mortality, under the leadership of the Development Commissioner. This an important step forward in acknowledging the multi-sectoral nature of child mortality. Moving forward, G o 0 wil l need to consider alternative mechanisms to deliver any new and additional interventions. Given the importance of focusing energy at the local level, and reaching out more effectively to poor households and communities, working in conjunction with Mission Shakti (the self-help group movement) PRIs and NGOs would seem central to the design. The Orissa Poverty Reduction Mission is another promising organizational model to deliver on a multi-sectoral program.
Building on the above, any new such program could be organized into two groups of activities: ( i ) cross-cutting support to enhance individual and household behavior and promote demand for services, and ( i i ) innovative sewice delivery strategies involving public and private sectors, and NGOs, together with mechanisms that support greater accountability. These are detailed below.
I. Cross-cutting Support to Promote Behavioral Change and Enhance Demand
a. IEC/BCC - a substantial package of activities to increase knowledge, awareness and practices regarding behaviors that have a significant impact on child mortality. This might involve hygiene (hand washing with soap), water, sanitation, indoor air pollution (use of clean fuels, improved ventilation), malaria (use of bed nets), nutrition and feeding practices, early diagnosis of medical problems, and service provision (what, where and how). These messages would be designed for a variety of stakeholders, viz. households, community leaders, PRIs, SHGs, and government functionaries. This would build on the new right to information bill and citizen charter, and aim to take information to women in their villages and homes through a variety of media.
b. Addressing poverty and demand for critical child survival inputs. Many of the interventions identified as high priority involve a financial outlay on the part of households. Included here would be food (quantity and variety), cooking fuels other than wood or dung, soap for hand washing, insecticide treated nets, costs involved in sending (girl) children to post-primary school together with the transport and user charges incurred when using either public or private health services. The absence of resources to meet these costs leads women and their families to adopt strategies which can have dire consequences for their own health and that of their children.
vi i

Achieving The MDGs in India’s Poor States
I n the long run, poverty reducing economic growth should address these problems, although the extent to which growth wil l penetrate the remote rural areas where the extreme poor live is an open question. But, in any event, shorter-term action is called for and there are a number of instruments that could be used to provide financial support to poor households. Vouchers, stipends, scholarships are examples of instruments which provide poor people with additional purchasing power for key services. India’s own JSY2 is an example of a scheme designed to ease the financial constraint which prevents pregnant women for giving birth in a hospital. Another instrument is the conditional cash transfer (CCT). This instrument has been successful in Latin America (especially Mexico) and is gaining interest elsewhere in the world. A CCT could support two critical aspects of child survival. The cash transfer to elinible women would help address income vovertv and the various ways in which it manifests itself into sub-optimal behavior, including the early return to wage employment and the cessation of exclusive breast-feeding. By combining the cash transfer with rewired actions on the behavioral side, the program would support attendance at information, education, and training programs (such as promoting better hygiene and feeding practices, as detailed in a. above) as well as possibly fu l l utilization of ante-natal, birthing and post-natal services, growth monitoring of babies. (This would require critical improvement in the provision of services, behaviors of service providers, and other complementary actions.) The program could be started as a pilot in a few of the poorest blocks, be accompanied by a robust effort to improve services, and include a monitoring and evaluation framework to allow for a review of its effectiveness. Over time it could expand to provide support to families with post-primary aged girls who struggle to afford schooling. Given the very strong effect of secondary education on maternal and child health this would be a very strategic investment on the part of government.
11. Innovative Service Delivery Strategies - getting services to poor women
a. Community Investment and Innovation Fund (CI IF) . This could be managed by a consortium of SHGs and front line service providers (ANM, Anganwadi, ASHA, RWSS), and would provide a pool of jlexible funding to support local area innovation and initiative. The funds could be channeled through PRIs in the form of block grants. Some examples of activities that might be funded through the CIIF include:
e
0
More significant supplemental nutrition for pregnant and lactating mother. Health risk fund, a combination of savings and subsidy, to meet costs of health carehealth insurance for the poor, especially at time of delivery. Bulk purchase of insecticide anti-mosquito nets for pregnant women and young children in high risk areas. Supplementary maintenance of A WC, health sub-center and provision of missing essential supplies; adequate water and sanitation. Improved community water source and training of community in water quality testing and monitoring. Support towards cost of individual household latrines (IHL) for poorest of poor families (with bonus scheme for communities which achieve ful l elimination of open defecation).
Janani Suraksha Yojana (JSY) is an initiative under the National Rural Health Mission whereby a cash grant is paid to all BPL women upon the delivery of a live baby. An additional payment is made to mothers who deliver in health facilities. ASHAs supporting women during their pregnancy and at the time of their delivery also receive a payment under the scheme.
... V l l l

Achieving The MDGs in India’s Poor States
Scholarship scheme for ST girls where heavy drop-out from primary school is a problem.
b. Strengthened Service Delivery (hardware and software) by line departments - selective investments in a number of areas such as:
Support for front line service provision in key sectors (health, nutrition, hygiene, water and sanitation); rotation of workers, additional training, etc. Build up functional referral capacities for child and maternal health outcomes with investment, restructuring, incentives. Management contracts for running of health facilities and other public-private partnership innovations. Measures to address lack of motivation and instill drive for performance in government functionaries, measure and reward results. Strengthen supervision, training, and management especially at district and block levels. Case manager to support poor womedfamilies derive services from public health facilities, especially at the time of the infant’s birth - services from which they are often excluded. Seasonality - additional out-reach care for babies born in the rainy season (July, August, September) and the cold months (November-January).
c. Modification to some service provision packages, e.g., ICDS, to give greater priority to under-malnutrition in 0-36 month age children, including exclusive breast feeding and micronutrient supplementation: also women’s nutrition status before, during pregnancy and in early months after birth; targeting RWSS to areas with greatest epidemiological need; pilot measures to address indoor air pollution reduction.
d. Technical support and training to SHGs and PRIs for performance monitoring of service providers, promoting greater accountability through instruments such as scorecards; also to encourage greater participation of other institutions, e.g., NGOs, universities, in social audits.
e. More evidence-based Planning, Monitoring and Evaluation - support for data collection to undelpin evidence based planning, including at the local, operational level as well as at district and state level; also to support monitoring and evaluation of inputs and activities vis-&vis child mortality outcome goals. Support would be provided for capacity building in (local level) data analysis and planning as well as data collection.
Many of these areas would require considerable background work to assess their feasibility and to undertake costing. I n so far as there are similar activities underway in other states - for example, integrated child development pilot project in Madhya Pradesh, an information campaign for school management committees in Uttar Pradesh, a PRI block grant program in Karnataka, community-based development program in Andhra Pradesh - as well as useful pilots in Orissa (such as ANKUR) - a detailed review of these would enhance the knowledge base. Finally, there is growing experience from around the world with multi-sectoral programs, especially regarding nutrition and HIV/AIDs, which offer important insights into elements and strategies associated with success.
i x

Achieving The MDGs in India’s Poor States
1. INTRODUCTION
“Past shortcomings notwithstanding, we can reach the Millennium Development Goals for IMR and MMR by the end of the 11th Plan”
Approach Paper for the 11th Five Year Plan, Planning Commission, Government of India, June 14, 2006.
1.1 The Millennium Development Goal (MDG) for child mortality refers to a two-thirds reduction in under-five mortality between 1990 and 2015. For India, this translates into a target o f around 32 deaths per 1000 live births, or a corresponding IMR of 2711000. An ambitious 11th Five Year Plan agenda - quoted above - would bring forward these targets to the year 2012. For Orissa, th i s translates into a target IMR of 41/1000. Within the framework o f the National Rural Health Mission, the Government o f Orissa has set for itself an equally ambitious IMR target o f 50/1000 by 2010 - a very significant reduction from the 2002 figure (of 87/1000 according to the SRS, and 81 according to the NFHS).
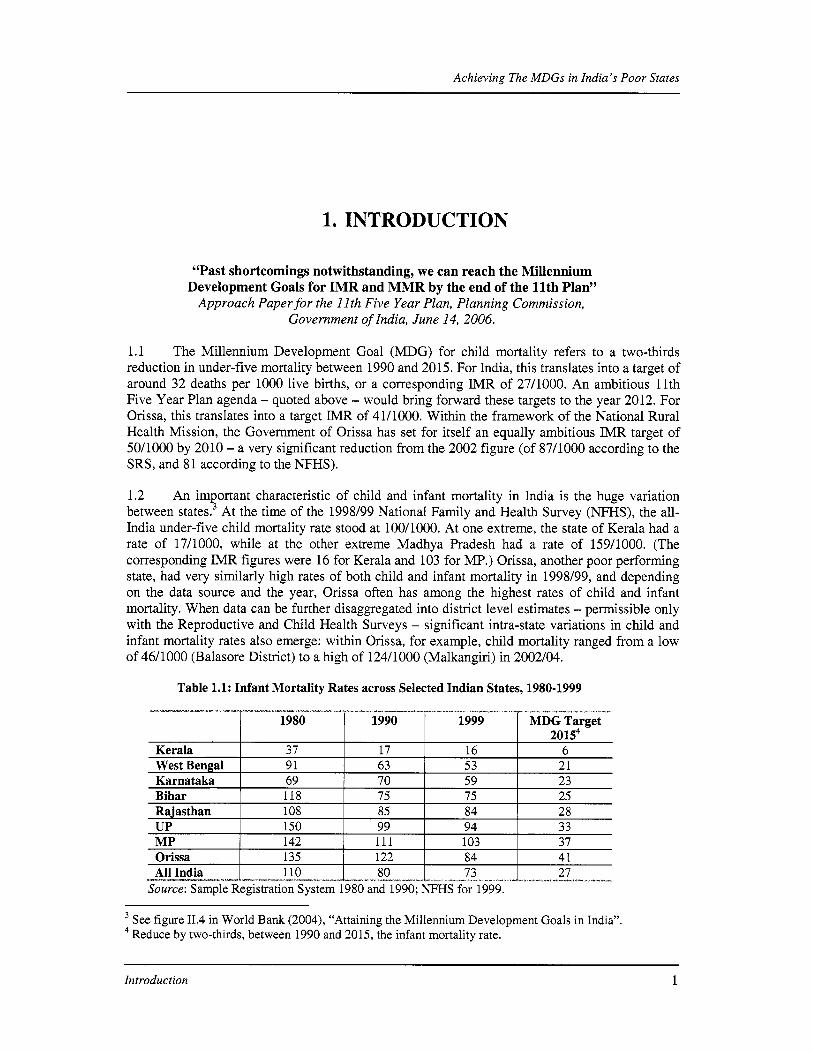
1.2 An important characteristic o f child and infant mortality in India i s the huge variation between state^.^ At the time of the 1998/99 National Family and Health Survey (NFHS), the all- India under-five child mortality rate stood at 100/1000. At one extreme, the state o f Kerala had a rate o f 17/1000, while at the other extreme Madhya Pradesh had a rate o f 159/1000. (The corresponding IMR figures were 16 for Kerala and 103 for MP.) Orissa, another poor performing state, had very similarly high rates o f both child and infant mortality in 1998/99, and depending on the data source and the year, Orissa often has among the highest rates o f child and infant mortality. When data can be further disaggregated into district level estimates - permissible only with the Reproductive and Child Health Surveys - significant intra-state variations in child and infant mortality rates also emerge: within Orissa, for example, child mortality ranged from a low o f 46/1000 (Balasore District) to a high o f 124/1000 (Malkangiri) in 2002/04.
Table 1.1: Infant Mortality Rates across Selected Indian States, 1980-1999
Source: Sample Registration System 1980 and 1990; N F H S for 1999.
See figure 11.4 in World Bank (2004), “Attaining the Millennium Development Goals in India”. Reduce by two-thirds, between 1990 and 2015, the infant mortality rate. 4
Introduction 1

Achieving The MDGs in India’s Poor States
1.3 Thus, as India prepares to meet the MDG infant, child (and maternal) mortality targets by the end o f the 1 l t h Plan period, the biggest challenge rests with some o f the poorest performing states - which also are home to a large share o f the Indian population. Four states - UP, MP, Bihar and Rajasthan - together accounted for slightly more than one half of all infant deaths in India in the year 2000. Although not a large population state (37 million, or around 3.5% of India’s population), Orissa - the focus of this particular report - accounted for 5 percent o f all infant deaths in 2000. Further disaggregating to the district level, the mortality reduction challenge rests with some hundred or so districts throughout India, including about a dozen of Orissa’s thirty district^.^ Evidence from around the developing world as well as progress from other Indian states suggests that these targets are within the bounds o f achievement, but extraordinary effort w i l l be required in a number o f areas. The question i s what to do and how best to do it. This i s the subject o f th is report.
1.4 The report focuses on the state o f Orissa. The rationale for this choice o f state i s threefold: f i rst , among the poor states it has some o f the worst human developmentMDG indicators (see the UNDP sponsored Human Development Report, Orissa, 2005); second, there i s considerable intra-state variation, which shows that better human developmenthealth outcomes are possible in such a poor state; and third, there i s considerable interest on the part o f the Government of Orissa to take on the challenge of rapidly reducing child and infant mortality. While some o f the findings and recommendations o f this paper are specific to Orissa, and indeed some are specific to just parts of Orissa, reflecting the particular circumstances o f the state, other findings and recommendations are applicable elsewhere.
1.5 The report i s organized as follows: the next chapter provides a brief background on Orissa. This i s followed by a review o f recent trends with infant and child mortality in the state. Chapter 4 introduces a framework for assessing the multitude o f factors which have a bearing on infant and child mortality, dividing them into four groups: the individual womadmother; the family; the community and service provision. Chapter 5 applies the analytical framework to Orissa and th i s i s followed by a chapter 6 which looks at district level patterns. The final chapter o f the report pulls it altogether and attempts to answer three questions: what i s needed to bring down child mortality rates in Orissa and achieve the 11” Five Year Plan and MDG goal; how well are existing interventions placed to do the job; and where are the gaps and how can they best be filled. The report ends with an outline o f a possible multi-sectoral program designed to reduce child mortality in Orissa.
According to the NFHS data during 1994-99 a fifth of the country’s districts and villages accounted for one half o f all infant deaths in India.
Introduction 2

Achieving The MDGs in India’s Poor States
2. ORISSA
2.1 With a per capita income o f around US$250, Orissa ranks as India’s second poorest state. The population i s mostly rural, with 87 percent o f the 37 mill ion people l iving in rural areas. The state has one of the lowest population densities (236 versus 324 persons per square kilometer) in the country, and certain parts o f the state have fewer than 100 people/square kilometer. The state also has a low population growth rate, the result of a relatively low fertility rate (3.3) and a fairly high mortality rate. The state i s home to one of the highest rates o f poverty o f all-India (47% versus the all India average o f 26%, 1999/2000, NSS6), and poverty i s more prevalent in rural areas (48 percent) than in urban areas (43 percent). There i s considerable variation within the state, with the coastal areas generally being more developed and having a lower poverty rate; the interior i s less developed and has very high rates o f poverty, in excess o f 80% in some places. Scheduled tribes also figure prominently in the state’s population (23% versus the India average o f 8%), and within the state have a very high incidence o f poverty (73%). Scheduled Tribes dominate in certain districts (such as Gajapati, Kandhamal, Keonjhar, Koraput, Malkangiri, Mayurbhanj, Nabarangpur, Rayagada and Sundargarh). Among the non-income indicators o f welfare, education i s central: the state has one o f the lower levels o f literacy (64% in 2001), but the trend i s positive, albeit showing some deceleration. There i s a significant gender gap in school enrolment and literacy rates (female literacy i s 51% compared to male literacy o f 76%), but that too i s improving.
2.2 Poverty in Orissa i s closely associated with the lack o f economic growth in the state. Whereas in 1980 per capita income in Orissa was 27% lower than the rest o f India, in 1997 i t was 70% lower’. B y 1999-2000 Orissa’s agricultural wages - a major source o f income for the poor - were the lowest in India.’ Other factors contributing to poverty in Orissa include high inequality in asset ownership (especially land), significant dependence on forest products, low levels o f literacy and, until recently, little private (foreign) investment. The state i s vulnerable to various large-scale natural hazards, such as cyclones - e.g., the super cyclone of 1999 - floods, drought, and malaria i s rife. In general, the coastal areas are prone to floods, while the rest o f the state i s vulnerable to drought as a result o f the combined impact o f lack o f irrigation facilities and erratic rainfall. I t has been estimated that over a seven year period from 1996/97 to 2002/03, drought induced crop losses o f over 50% occurred in five years and affected 261 out o f 314 blocks o f the state.
2.3 Regional disparities. Orissa i s an overwhelmingly rural state. Across rural areas, inequalities are pronounced between the relatively wealthy coastal area (32 percent poverty) and inland areas (the rates range from 50 percent in the northern region to a staggering 87 percent in
More recent poverty estimates from the 2004 NSS suggest a decline in poverty. Mackinnon (2002). Assessing the Impact of Fiscal and Structural Reforms on Poverty in Orissa. (Oxford
Policy Management.) ’ A Deaton and J Dreze. ‘Poverty and Inequality in India: A Re-examination. Economic and Political Weekly, September 2002.
Orissa 3

Achieving The MDGs in India's Poor States
- - - - - ~ - ~ - - --"ll̂ ll_- ~ " ~ " ~ - ~ ~ . - Rural
Region ST sc Other All Coastal 66.6 42.2 24.3 31.7 Southern 92.4 88.9 77.7 87.1 Northern 61.7 57.2 34.7 49.8
52.3 33.3 .o Orissa 73.1 --_ Y I I I - - ~ -
the southern regiong). While poverty declined in the rural coastal region during the 1990s, rural areas in the southern region witnessed an unprecedented increase in poverty from 69 percent in 1993-94 to 87 percent in 1999-00 (poverty also increased slightly in the northern region).
Urban ST sc Other All 63.5 75.7 34.3 41 72.3 85.0 24.6 43 54.4 63.1 37.8 46 59.4 72.0 34.2
-.--r--&-,-̂ u~rrrrr- _^_ j *_ _l__-_-.__.~___u
2.4 Social identity. Orissa has the third highest concentration (after MP and Maharashtra) of scheduled tribes (ST) population; Scheduled caste (SC) and ST constitute respectively 16.2 and 22.2 percent o f the total population. Poverty among the SC and especially the ST population i s strikingly higher than among other population groups. Thus, while the ST population represents 22 percent o f the population o f Orissa, they constitute more than 40 percent o f the total number o f poor. The relative disadvantage o f the scheduled tribe population i s a remarkably robust feature o f the profile o f poverty in Orissa: many social indicators (education, health) for this group are considerably worse than for the majority population, as well as compared to the ST population in other parts o f India.
Table 2.1: Headcount Index in Regions of Orissa by Social Group (1999-2000)'0
2.5 When taken together, regional and social identity characteristics present a very striking picture: no less than 92 percent o f the ST population l iving in the rural areas of the southern region" o f the state i s poor. Regarding the urban areas, the highest incidence o f poverty i s among the SC population l iving in the Southern region.
2.6 Structural and economic factors. Orissa's extensive poverty reflects a number o f structural and economic features. Agricultural yields in Orissa are lower than in the rest o f India, reflecting a low share of irrigated area (only 22 percent o f agricultural land i s irrigated as per the Agricultural Census) and low use o f commercial inputs. The proportion o f villages connected by all weather roads i s also lower than in the rest of India, with farmers not well connected to markets and processing infrastructure, thereby leading to an unusually high share of paddy in output and limited diversification. Orissa i s characterized by a high incidence o f subsistence production and traditional land tenure. Beyond already skewed land ownership patterns, there i s documented evidence on processes o f land alienation and the expropriation o f tribal groups, suggesting that improvements in the property rights o f the poor i s likely to be good for poverty reduction. Orissa's forest and tourist potential are under exploited, and as a result o f mismanagement, total forested area, constituting a central livelihood asset for tribal households, are continuously being depleted.12
Estimates o f poverty from small scale household studies in two o f the southern region districts suggest a somewhat lower poverty rate in the region o f 70-75% in 2000/01. lo Official NSS Data as calculated by A Dubey and referenced in De Haan (2005). l1 This comprises the districts o f Boudh, Balangir, Kalahandi, Kandhamal, Koraput, Malkangiri, Nabarangpur, Nawapara, Rayagada, and Sonepur.
According to the Forest Survey of India, the rate o f deforestation i s much higher in Orissa than at the all India level.
12
Orissa 4

Achieving The MDGs in India’s Poor States
Box 2.1: Specific Characteristics of Poverty in Orissa: As identified by Department of Planning and Coordination (Economic Survey 2004)
Spatial disparities e.g., Southern Orissa Vulnerability to recurrent natural calamities Erratic precipitation which constrains the development o f agricultural livelihoods Poor development o f irrigation facilities Marginalization and poor connectivity in Southern and Western hills (restricts emergence o f and access to centers o f growth and service delivery) leading to extreme poverty and vulnerability Stagnation o f agricultural growth Despite significance o f forest resources, poor management and acute degradation undermines the possibility o f sustained profitability Absence of adequate statewide infrastructure base, thwarting private sector development. Communicable diseases (especially the deadly form o f malaria) which spread easily given poor housing, prevalence o f malnutrition and extremes o f weather. Public health infrastructure i s thinly spread and malfunctioning (with poor equipment, vacancies and absenteeism) Large-scale development projects (dams, river valley projects, open cast mining, etc.) and associated displacement, particularly acute in ST hi l ly areas High sensitivity to price fluctuations, which PDS i s only partially able to address Shock prone labor markets due to lack o f economic diversification (out o f agriculture) and limited
2.7 Human Development indicators. While Orissa’s human development indicators have improved steadily in recent years, but they s t i l l fal l behind the rest o f India. L i fe expectancy at 61 (for both men and women) i s low; maternal mortality (362 per 100,000 live births) i s much higher than in many neighboring states (e.g., 154 in AP and 264 in West Bengal). More than half o f all children are underweight, and - in contrast to other major states - there has been little progress in Orissa over the past decade in reducing child malnutrition rates. In education, there are heartening s igns o f catching-up with the rest o f India, both in terms o f enrollment and literacy rates for both sexes. However, evidence suggests that health and education outcomes are considerably worse among the poor, perpetuating a vicious cycle o f debilitating ill-health, illiteracy, and poverty.
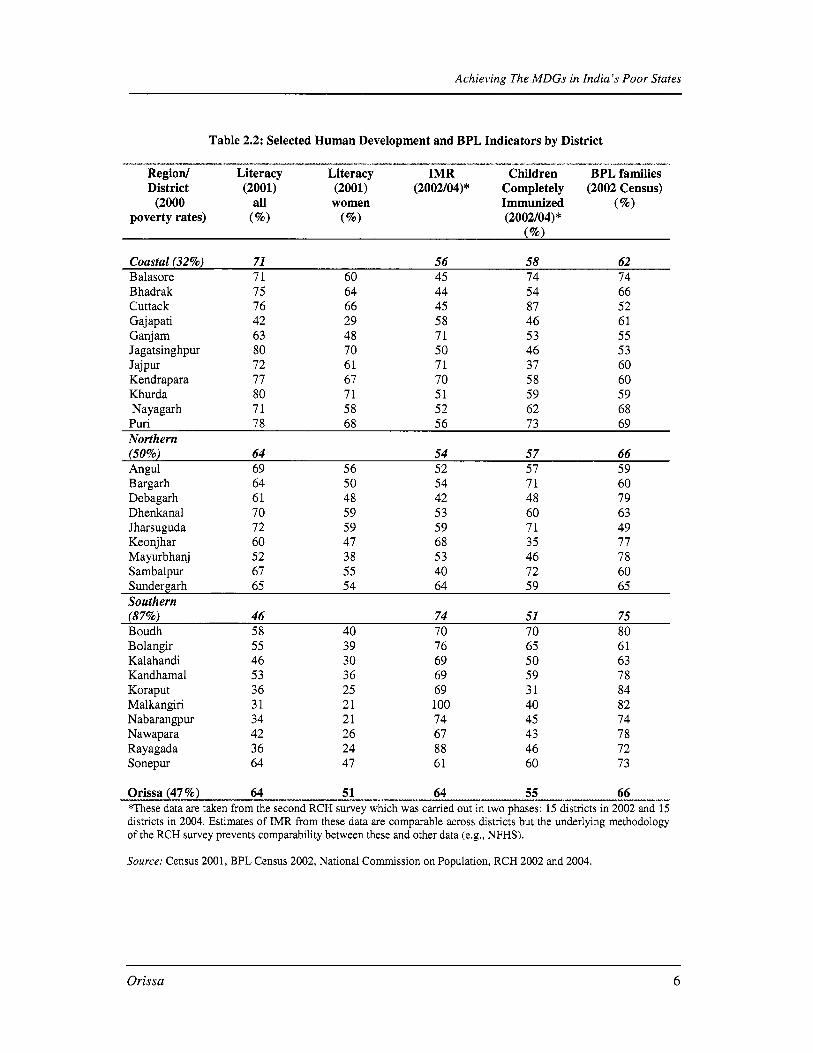
2.8 There i s considerable variation across districts in both health and education indicators. On the basis o f the census data and information taken from a variety o f other sources (published in Orissa’s Human Development Report, 2004), the data presented in Table 3 show an interesting pattern. While the state-wide literacy rate rose from 49% in 1991 to 64% in 2001, literacy levels in the southern region remained around 45%. Health indicators also show considerable intra-state variation. Initial efforts to correlate various indicators for human welfare deprivation (e.g., D e Haan, 2005) appear to suggest that people in the worst o f f economic districts suffer from multiple deprivations.
Orissa 5
Achieving The MDGs in India’s Poor States
Table 2.2: Selected Human Development and BPL Indicators by District
Region/ Literacy Literacy IMR Children BPL families District (2001) (2001) (2002/04)* Completely (2002 Census)
---I-----a-- I*-”*,u”-. - ~ - - - - ” ~ ~ ~ ~ - - ~ - ~ - - ~ - - . ~ ------I_y ~~~“ I\IxI*--.yI. __
(2000 all women Immunized (%Io) poverty rates) (%) (%) (2002/04) *
Coastal (32%) 71 56 58 62 Balasore 71 60 45 74 74 B hadrak Cuttack Gajapati Ganj am Jagatsinghpur Jajpur Kendrapara Khurda Nayagarh
75 76 42 63 80 72 77 80 71
64 66 29 48 70 61 67 71 58
44 45 58 71 50 71 70 51 52
54 87 46 53 46 37 58 59 62
66 52 61 55 53 60 60 59 68 . -
Puri 78 68 56 73 69 Northern (50%) 64 54 57 66
Bargarh 64 50 54 71 60
Dhenkanal 70 59 53 60 63
Angul 69 56 52 57 59
Deb agar h 61 48 42 48 79
Jharsuguda 72 59 59 71 49 Keonjhar 60 47 68 35 77 Mayurbhanj 52 38 53 46 78 Sambalpur 67 55 40 72 60 Sundergarh 65 54 64 59 65 Southern (87%) 46 74 51 75 Boudh 58 40 70 70 80 Bolangir Kalahandi Kandhamal Koraput Malkangiri Nabarangpur Nawapara Rayagada Sonepur
55 46 53 36 31 34 42 36 64
39 76 30 69 36 69 25 69 21 100 21 74 26 67 24 88 47 61
65 50 59 31 40 45 43 46 60
61 63 78 84 82 74 78 72 73
Orissa (47 %) 64 51 64 55 66 *These data are taken from the second RCH survey which was carried out in two phases: 15 districts in 2002 and 15 districts in 2004. Estimates of IMR from these data are comparable across districts but the underlying methodology of the RCH swey prevents comparability between these and other data (e.g., NFHS).
Source: Census 2001, BPL Census 2002, National Commission on Population, RCH 2002 and 2004.
----~-----
Orissa 6
Achieving The MDGs in India’s Poor States
2.9 Health risks are among the most common risks faced by the population in 0 r i ~ s a . l ~ There are a number o f communicable diseases - malaria, filariasis, tuberculosis, gastro-intestinal, respiratory infections, and leprosy - which are widespread in Orissa and which contribute to poverty, morbidity and mortality. According to the WHO, the region comprised o f western Orissa and Chhattisgarh accounts for the highest number o f registered malaria cases in India. With an annual average o f 480,000 cases reported between 1998 and 2001, of which on average 380 were fatal, Orissa was in the lead by a large margin. More recent surveillance data suggest a decline in the number o f reported cases (to around 300,000 in 2004), but nonetheless Orissa continues to account for f i f ty percent of India’s malaria burden. After malaria, in terms o f both morbidity and mortality, tuberculosis poses a significant threat to l i fe and livelihoods in Orissa. Aggravating the situation i s the fact that the public health infrastructure i s thin and patchy, especially in the southern and western parts o f the region. The services it provides are reputed to be unreliable and beset with problems, such as poor equipment, vacancies, absenteeism, informal payments and lack o f supplies. There are also problems on the uptake side. Interviews carried out in connection with the van Dil len Bolangir survey (see Annex 2 for details) revealed that poor infrastructure and difficulties associated with transportation o f the sick person, and the cost of treatment (public and private, with clear preference for private medical institutions largely due to the more predictable nature of care and costs) were frequent reasons for seeking treatment only when the infection reached an advanced stage and the patient was already in a life-threatening condition.
2.10 The region known as Orissa’s ‘KBK districts’ i s not only the poorest part of Orissa, but also one of the poorest and most vulnerable parts in the whole o f India. I t i s remote from any major city, and parts become inaccessible during the rainy season (and for as much as 6 months o f the year). In addition to the health risks noted above (especially malaria), the inhabitants o f the ‘KBK’ districts are most sensitive to fluctuations in both consumer and producer prices. Because there i s very little diversification out of agriculture, the labor market in Orissa’s ‘KBK districts’ i s also prone to shocks, which are transmitted through scarcity o f employment opportunities. Whatever diversification there i s mostly takes the form o f non-agricultural casual wage.
l3 In a recent survey of households in Orissa, close to 30% of households reported experiencing a health shock in the past year, and among the poorest households this was the most frequent of all shocks. (Mahendra Dev et al. CESS. 2006)
Orissa 7

Achieving The MDGs in India's Poor States
3. RECENT TRENDS IN INFANT AND CHILD MORTALITY, ORISSA
3.1 Infant mortality rates (IMR) in Orissa have been among the highest for all-India during the past two decades, but like elsewhere seem to be falling. (Different data sets - NFHS, SRS and R C H al l generate different estimates o f IMR - see Box 3.1 for a discussion o f these differences - but all agree on one thing: IMR in Orissa i s falling.) According to data from the Sample Registration System, in 1980, the IMR for Orissa was 135 deaths per 1000 l ive births: this compared with an all-India figure of 110, a nationwide high of 150 in UP and a nationwide low o f 37 in Kerala. B y the year 2000, the all-India figure had fallen to 68/1000, the rate in UP had fallen to 83/1000, while the rate in Orissa was 86/1000.'4 Despite the decline, IMR in Orissa in the year 2000 was the highest o f al l Indian states, almost seven times the rate in Kerala.
Figure 3.1: Infant Mortality Rate - India and Orissa (1981 - 1999)
w 160 5 140 0 120
I= I- 80
n
0 0 2 v) 100
60
I- 40 2
z 2 20 0 -
YEAR
1-
Source: As for Table 1.1.
3.2 The R C H data likewise show a significant declining trend in IMR. Between the two rounds of data collection (1998/99 and 2002/04), there has been a decline in the rate from 77/1000 to 64/1000. The decline in seen in most districts. (Annex Table Al). Notwithstanding the confidence intervals with which district level estimates o f IMR can be taken (arising from relatively small numbers o f observations), there does appear to be very positive falling IMR in a number o f districts, viz. Balasore, Mayurbhanj, Gajapati and Jagatsinghpur. Child mortality cannot be estimated from the f i r s t RCH round, but the trend from the N F H S figure for 1998/99 to the RCH figure for 2002/04 suggests a very significant decline. Moreover, the relatively small difference between child mortality and infant mortality in the second R C H survey (i.e., 73 and 64
l4 By 2004, SRS data give Orissa an IhTR of 77/1000
Recent Trends in Infant and Child Mortality, Orissa 8

Achieving The MDGs in India’s Poor States
% married before age 18 years- Ante-natal care during pregnancy: % at least one ANC visit
% full ANC (3 visits+TT+IFA) % tetanus toxoid Delivery of baby: % home delivery % safe deliveries* Breastfeeding % breastfed within first 2 hours o f birth % exclusive breastfeeding till 6 month Immunization: % of 12-36 month children:
Immunized aAainst measles Fully Immunized
-,.”.*---- ---.“-...- ----
respectively, a gap of 9 deaths/1000 births among the age group 1-5 years) suggests rapid progress in reducing mortality in the 1-5 year age group. Likewise, there would appear to be some decline in neo-natal mortality in this period, though there i s less reliability around the robustness o f any estimate. However, o f more significant note i s the high preponderance o f neo-natal in the overall infant and child mortality rates: state-wide RCH data (2002/04) show a neo-natal rate o f 44/1000 - in other words, two-thirds o f infant deaths are in the f i r s t month of l i f e and sixty percent o f under five, child mortality deaths are in the neo-natal period.
32.2 23.1
72.9 76.0 32.5 58.4 79.7 86.0
76.2 65.0 32.7 58.0
13.9 44.8
4.9 20.3
57.8 55.4 64.1 67.9
“-_^*_-v
Table 3.1: Trends in some core indicators, RCH I and RCH I1
(1998/99) (2002/04)
Infant mortality rate ( er 1000) Education level of mothers: % literate Marriage before 18 birthday:
_1___-_1_ _. ~- Change
(33.7) (13.0)
11.5
(9.1)
3.1 25.9 6.3
(12.2) 25.3
30.9
15.4
(2.3) 3.9 - *-.--- “ I ~- + N F H S 1998/99 figure (no estimate o f child mortality can be made from RCH I)
* Safe deliveries include institutional deliveries and home deliveries assisted by doctor/nurse/ANM.
3.3 The direct causes of infant and child mortality are well documented g l~ba l l y , ’ ~ although less i s known about the direct causes o f neonatal mortality than at other ages. The main clinical causes of death in India are diarrhea, pneumonia and infectious diseases (such as malaria), with underweightlmalnutrition often considered a major contributing factor. According to the Government of India’s “causes o f death, annual report” infant deaths in rural Orissa are attributed to pre-maturity (39%), pneumonia (15%), respiratory infection (9%), anemia (8%), bronchitis/asthma (5%), and tetanus (3%). Regarding children aged 1-5 years, the main causes of death are pneumonia (19%), diarrhea (14%), anemia (12%), jaundice (9%), typhoid (7%), malaria (7%), and meningitis (5%).
l5 See, for example, Rutstein (2000) and The Lancet, special edition on child survival, summer 2003.
Recent Trends in Infant and Child Mortality, Orissa ~
9

Achieving The MDGs in India’s Poor States
_I__ ~- ----x--- - ~ - I I- ~ i_ -“- ----.” --_ ~ .“ . - .-l”-l__ _ - _ . ~ I --- c1.“- I__l_i - ~
Box 3.1: Why do different d e different IMR estimates?
There are three different sources of estimates for IMR for Orissa - and all produce a slightly different figure for the same year. The RCH data generate different estimates of infant mortality for the state of Orissa as compared to the Sample Registration System (SRS) and the National Family Health Survey (NFHS) - for s imi la r years. The primary difference in estimates between the RCH and the SRS i s the method of data collection. While the RCH conducts a one-off interview of mothers about births and deaths in the five years preceding the survey, the SRS uses part time local enumerators to conduct continuous enumeration of births and deaths. The differences in data collection between RCH and the NFHS, on the other hand, are quite minor. The former i s representative at the district level, while the latter i s only representative at the state level due to sample size. At the state level, the two surveys produce similar IMR estimates for 1998/99 - RCH produces a figure of 77 deaths per thousand births, compared to 81 in NFHS. The differences across data sources serve as a caution about using the absolute levels of IMR generated from the RCH data, especially the district level estimates where the number of observations become fewer. However, the RCH data are quite reliable for purposes of comparison across time periods (i.e., from RCH I to RCH 11), across districts, and for analysis o f the various factors influencing child
-v----Fm”-p-p *------------.” -- m o r t a l i t y .
3.4 Whi le there are a whole host o f factors, direct and indirect, which play a part in chi ld survival, some o f the more important ones are known to include: women’s education, age o f marriage and f i r s t birth, ante-natal check-ups during pregnancy, number o f pregnancies and birth spacing, births attended by a trained birth attendant, births in medical facilities, exclusive breastfeeding and immunization. At the state level, trends in some o f these indicators for which RCH data f rom both rounds exist are presented in Table 3.1. All indicators show a trend in the desired direction bar one.
3.5 On the positive side, (mean) age o f marriage and f i r s t birth have risen (by hal f a year in the case o f marriage in the period 1999 to 2004), girls and mothers are more educated, and they are seeking more ante-natal care. On the RCH service delivery front, there appears to have been improvement in a number o f areas, notably ante-natal care (the incidence o f three ANC visit has risen f rom 33% to 58%, and tetanus toxoid coverage from 80% to 86%). On a less positive note, while there has been some gain in births attended by a trained birth attendant and taking place in a health facility (public and private), both figures remain low. Post-delivery visits f rom a health worker have marginally improved (from 9% to 14% o f births). Exclusive breastfeeding for 6 months has increased f rom 5% to 20% o f mothers but i s s t i l l far below the desired level. (Physical) access to health facilities remains very low, although ICDS centers have become much more widely available. One area where the trend i s not at a l l positive i s immunization. The proportion of children immunized against measles - a potentially fatal disease for young children - has held steady, but the proportion o f children immunized against a l l the childhood diseases has if anything fallen in the period 1998/99 to 2002/04. Moreover, district level data suggest that this i s not an isolated trend: in twenty (out o f thirty) districts the coverage rate has fallen.I6 (Annex Table A2).
3.6 Looking at trends in the eight KBK districts, where poverty levels are high, women’s education low, and the proportion o f ST population large, the absolute levels o f most indicators are poorer compared to other districts, but bar immunization rates, there has been good progress. By 2002/04, the aggregate IMR for the eight KBK districts was 15 deaths/1000 birth lower than i t
l6 For other indicators, district level data show that the inter-survey trends were in the desired direction: all districts showed improvements in women’s literacy and delayed age of marriage, both reflecting expansion of schooling for girls. Births in a health facility and onset of breastfeeding after the birth also show solid trends.
Recent Trends in Infant and Child Mortality, Orissa 10

Achieving The MDGs in India’s Poor States
had been in 1998/99 (from 91/1000 to 76/1000), and the inter-temporal fall in IMR was slightly higher for KBK districts than non-KBK districts. The declining trend in immunization rates can however be seen in the KBK districts as elsewhere: a particularly worrisome trend since in 1998/99 these districts compared well with the rest o f the state (Annex Table A2).
3.7 There i s wide-scale documentation o f a preference for male children in India. Orissa data (RCH and in-depth study) show the typical pattern of a slightly higher number o f boy child births (in the ratio of 5 1:49) and a higher neo-natal mortality rate among male children, especially in the rural areas (across both time periods). Post-neonatal infant mortality rates, on the other hand, are very similar across boy and girl children although there i s a slightly higher girl child mortality rate in the 1-5 year age range. Breastfeeding practices and immunization rates are very similar across boy and girl children, but boy children are often favored in the following way: health expenditure (treatment and medicine) can be higher for male children, and male children are more closely watched during the f i r s t months o f their lives, in part in the belief that they are more susceptible to disease. (van Dillen) On balance, because infant and child mortality rates are dominated by neo-natal mortality, survival rates are generally higher for girl children, especially in the rural areas, although there i s some variation.
Recent Trends in Infant and Child Mortality, Orissa 11

Achieving The MDGs in India’s Poor States
4. THE CORRELATES OF INFANT AND CHILD MORTALITY: THE FRAMEWORK
4.1 There exists a large body of empirical studies which focus on analyzing the determinants o f child mortality in India, and elsewhere in the world.” The key findings often indicate that household income, female education, access to health services, and immunization are some of the most important determinants o f child mortality. This evidence indicates that public policies emphasizing improvement in access to school (especially for girls), promoting economic growth and improving access to health services are all well placed to help reduce child mortality. Several recent studies have also shown that environmental conditions, such as access to safe water and sanitation facilities, electricity, and use o f clean cooking fuels have an important health impact on young children. A recent World Bank study on the role o f public policy and service delivery supporting India’s efforts to attain the MDGs found a strong association between in fadchi ld mortality on the one hand, and government health spending, female literacy, access to roads, regular supply o f electricity, sanitation, and ante-natal careltetanus immunization o f women on the other hand. That same report also demonstrated that if poor states, such as Orissa, enjoyed levels of spending and services s imi lar to that in the non-poor states, infant mortality rates would fall by an estimated 36.5 deaths per 1000 births.’*
4.2 As such, i t i s thus widely documented that there are multiple factors which influence whether a baby or young child survives the early years o f life. These factors relate to the mother, including her situation prior to the pregnancy as well as practices during the pregnancy, through the birth and into the early days and months of the child’s life. In so far as the mother lives within the domain o f a family, the situation and practices o f the household more generally are also important. Similarly, the community i s also o f relevance, as i t too exhibits social and cultural norms around preferred practices impacting both mother and child. The fourth category o f factors that have a bearing on the survival o f the young babyjchild are services available to the mother and her family. A framework setting out these various factors i s summarized below and developed in more detail in Table 4.1, where a brief explanation o f how these four categories o f factors - individual, family, community and services - might impact infant and child mortality can be found.
l7 See, for example, Pandey, Cheo, Luther, Sahu and Chand (1998), Rozenzweig and Schultz (1982), Murthi, Guio and Dreze (1995), Hughes, Lvovsky and Dunleavy (2001), Jalan and Ravaliion (2003), Mishra and Retherford (1997), (2003), WHO (1997), and Wagstaff and Claeson (2004). ’* World Bank (2004).
The Correlates of Infant and Child Mortality: The Framework 12

Achieving The MDGs in India's Poor States
- ~ . ~ ~ - - ~ - Health
Outcome
Lower child
Mortality; Healthier
Babies and young
Children
--A -,- -.*--.. X . ~ - ^ _ ^
Individual Woman
Health, nutrition and general well- being o f woman prior to and during pregnancy, affected by level o f education, and the woman's status within the family, among other factors.
""* *, -*---,"- I - ~, _(I__
Household
Household behaviors (e.g., hygiene) and other risk factors
Household resources (assets, income, food, housing)
Maternal and childcare practices o f family members.
Community
Community resources, environment, values and norms; socio- economic structure o f community, formal and informal institutions.
-L "X _. I ̂ _. f f --I"- -,I_
Service Provision
Health services - public and private; Nutrition services; School Infrastructure Transport, access to services and market
4.3 Improvement in child survival, especially for the poor, requires that the range o f factors identified in t h i s framework be fully understood and assessed for purposes o f identifying the entry points for change. Consider, for example, the situation o f a child born into a poor family in remote, rural Orissa. The mother i s likely to have - at best - a primary school education (of questionable quality), have married at a young age and born her f irst child before her eighteenth birthday. She may or may not have had more than one ANC check-up, but in all likelihood w i l l have been given a tetanus toxoid vaccination. If the child survives the birth - most likely in the home with the support o f relatives but no trained birth attendant - from a very early age he/she w i l l be exposed to the risk o f disease through poor water quality and quantity (poor people are less able to afford modem connections and usage charges), inadequate sanitation, poor hygiene practices, indoor air pollution (cheap fuels), poor housing conditions, and high exposure to disease vectors (especially malaria). The child i s most likely to have lower resistance to infectious diseases because he/she w i l l be undernourished due to denial o f colostrum at birth, insufficient breast-feeding, a diet deficient in one or more of the essential micronutrients, had low birth weight as a result of poor maternal nutrition, short birth intervals between children, and to have recurrent disease episodes. Once sick, this poor child i s less likely to be taken to an appropriate health-care provider, due to lack o f knowledge on the part o f the mother and/or advice from older female relatives, poor road access, and the costs associated with seeking modem health care. If they are fortunate, once there, the child i s less likely to receive appropriate care because facilities serving poor communities are not as likely to have well-trained staff on hand or to be stocked with supplies and drugs needed to attend to the poor child. In this way, the poor child i s more likely to die. Challenges to child survival thus exist at every step along the path from exposure and resistance to infectious disease in the home, through care- giving to care-seeking, to the probability that the child wi l l receive prompt treatment with effective therapeutic agents.
The Correlates of Infant and Child Mortality: The Framework 13

Achieving The MDGs in India’s Poor States
Table 4.1: Framework for Assessing Impact of Various Factors on Child Mortality”
Domain of Variables
A. The Individual Woman 1. The expectant Mother
2. The birth (birth order, first and subsequent): where and with whom
3. Care and treatment o f new born and child
B. The Family 4. Household behaviors and risk factors
5. Household resources
C. The Communitv 6. Physical environment
7 . Community attitudes
Factors to consider
Education Age at first pregnancy Birth spacing Time-uselworklactivities Nutrition and health status Use o f ante-natal services Place o f birth Delivery attended by trained birth attendant Access to emergency obstetric care, and essential neo-natal services Treatment o f new-born - washing, early breastfeedingkolorums, exclusive breastfeeding until 6 months; feeding and weaning o f child; immunizations; prevention and treatment o f sick child Return to work
Hygienehanitation practices (e.g., hand washing, use of latrine); Cooking with “clean” fuel Disease prevention (esp. malaria, diarrhea, pneumonia) Migration. Attitudes to pregnancy and child bearing; health care seeking Dractice Assets (land, business, savings, people), income. Availability o f food. Intra-household distribution o f resources, esp. food. Type o f housing, ventilation, fueYelectricitv. water. sanitation.
Infrastructure (roads, water, sanitation, electricity ) School, other public institutions. Environmental health factors.
Gender norms; religious beliefs; ethnic mix. Attitude towards government and “modern” sector.
How factors impact child mortality, direct and indirect
Knowledge o f pregnancy, nutrition and related matters Physical maturity/ ability o f body to carry child Caring practices during uremancvlbirth uremration Non-hygienic birth and complications during birth can result in neo-natal death o f child (and mother)
Inappropriate care o f babylyoung child can increase probability o f infant mortality; Failure to immunize child, seek medical care for sick child can also contribute to child mortality. Early return to work can interrupt breastfeeding and care
Interaction o f other family members with motherlbaby Environmental health Access to health care Young mother may be subject to practices dictated by others around her, especially older women.
Role o f pregnanthew mother in economy o f family. Abi l i ty o f family to afford food, health care, and seek it for pregnant womadbabylyoung (girl) child. Oualitv o f home environment.
Economic conditions facilitating or hindering healthy lifestyle; access o f pregnant womanlmother/young child to various services Social conditions facilitating or hindering access o f pregnant womanlmother to various services.
l9 This framework i s adapted from World Bank (2001) Poverty Reduction Strategy Paper Sourcebook, 2nd edition.
The Correlates of Infant and Child MortaliQ: The Framework 14

Achieving The MDGs in India’s Poor States
8. Local institutions - political and administrative; leadership structures
D. Service Provision 9. Supply (and cost) o f health services
10. Supply (and cost) o f other services
Community groups (SHGs). Decentralized planning, political and financial support for key interventions (PRIs)
Availability o f facilities; staffing; quality o f service - public, private, traditional; availability o f medicineddrugs, blood, etc. (Forman and informal) cost o f using service Education & training Transport (public, private) Water and sanitation Electricity Financial services
~ ~~
Level o f empowerment o f women to influence resource allocation decisions pertinent to mothers. Local control over resources for important services.
Accessibility o f health services to women; (physical) distance, social distance (esp. for poor); hours o f operations; costs associated with using the service; out-reach to remote areas Knowledge, attitudebehavior Access to services Input to good health Lighting, cooling, Consumption smoothing, paying for emerEncies -y__cx__( I % ...-*
The Correlates of Infant and Child Mortality: The Framework 15

Achieving The MDGs in India’s Poor States
5. APPLYING THE FRAMEWORK TO ORISSA
5.1 In this part o f the report we apply the framework presented in the previous section and apply i t to data for the state o f Orissa. The idea here i s to validate the existence, relevance and strength o f the multiple factors impacting child survival with the view to better informing policy. In the f i r s t case, we apply the framework to state-wide data (this chapter). In the second instance, we disaggregate the analysis to the district level (chapter 6).
The data
5.2 The primary data set used in this chapter i s the Reproductive and Child Health (RCH) household survey. One of the major reasons these data are used (as compared to other household surveys) i s that the data are representative at the district level, as well as being ideally suited to analyze the socioeconomic correlates o f child mortality in Orissa. Two rounds o f data are available, spanning the years 1998 to 2004. Each of the two rounds were carried out in two phases, half the 30 districts were surveyed in each o f the phases. The f i r s t and second phases o f the first round were collected during 1998 and 1999 respectively, and for the second round the first phase was carried out in 2002 and the second phase in 2004. The data provide specific insights into RCH services, such as coverage o f antenatal care and immunization services; extent o f safe deliveries; utilization o f government health services, and user satisfaction as well as broader household level socio-economic variables.”
5.3 B y way o f complementing the analysis that can be done with the RCH household data, the World Bank commissioned an in-depth study o f child mortality in one o f the KBK districts - Bolangir. This district was chosen since i t afforded an opportunity to build on a five-year panel of household data, which had been collected by a research team very familiar with the local area. Although a small number o f households Gust under 200), and in no way representative o f Bolangir District let alone the state more generally, the richness o f data gathered over a five year period and the additional insights gained from a dedicated “round” on child mortality are crucial to an understanding o f household knowledge, practices and decision making as they impact child mortality. (Annex 2 carries more details on the in-depth study, hereafter called the Bolangir van Dil len study.)
5.4 The material presented in the following paragraphs draws on both quantitative data from the RCH household surveys as well as data from the van Dil len study. On the quantitative side, we use both linear relationships and multivariate analysis to assess the impact o f the various factors. (Regression tables are at the end o f the paper, Annex Tables A8-A l l . ) While a lot can be learned from these manipulations, and indeed can be used to inform policy and program design, i t i s crucial to stress that the explanatory power o f any one o f these relationships i s not very strong21
2o For a fuller description of the RCH data, see http://www.rchindia.org.abtus.htm. 21 The R squared in the multivariate analysis i s low, which indicates that many of the factors impacting child mortality are not being captured by the model.
Applying the Framework to Orissa 16

Achieving The MDGs in India’s Poor States
- in other words, there remains a lot of unexplained variation in infant and child mortality outcomes. This i s where the in-depth qualitative material comes in.
A. THE INDIVIDUAL WOMAN
5.5 There are a number o f characteristics of the woman bearing the child that have a direct (and indirect) relationship on the likely survival chances of the baby/young child, as well as the mother herself. These include the age o f first pregnancy, birth spacing, nutritional and health status o f the woman prior to and during pregnancy, activities and care during pregnancy - including use of health services, place where the birth takes place, care o f the newborn, feeding o f the young child and preventative and curative interventions for the sick child. The education and socio-economic status o f the woman play a very important role throughout. These various factors are discussed in turn in the following paragraphs.
(i) The expectant mother
5.6 The average age at marriage (cohabitation) and age at first birth are important for child survival. Typically having a f i r s t birth at age less than 20 years i s associated with higher infant mortality. This i s true for both rural and urban areas. While the average age o f marriage has risen to 17.6 years in the second RCH survey (up from 17.1 years in the f i rs t survey), almost 12 percent o f f i r s t births are to mothers who are 18 years of age or younger. (Table A9).
5.7 Physical work during pregnancy. The van Dil len Bolangir study found that women, on average, engaged in physically demanding work up to the sixth month o f pregnancy, longer if the household depended crucially on the income or seasonal needs dictated the labor need. Insights suggest that this practice has changed little in recent years. Interestingly there i s l i t t le variation across caste groups. In some communities, the pregnant woman’s relatives would arrive in the 7th month o f pregnancy, bearing gifts and staying till the birth of the baby, thus relieving the soon-to- be-mother o f housework and assisting with the birth. In other communities, young women travel to their parents’ village for the birth and stay there for some months after the birth.
5.8 Nutrition. Poor nutrition i s another key factor affecting maternal and child health - bearing children in poor nutritional condition further depletes a woman’s body, with far-reaching effects on her health and that o f her children. Poor nutrition among pregnant women in countries with a very high maternal and neonatal mortality rate i s found to be a major contributing factor to those high rates. In India, anemia i s reported to be a factor in more than 60 percent o f maternal deaths. Gender stratification and attitudes also contribute through household behavior that deprives poor women o f adequate nutrition, which leads to small stature and higher risk o f delivery complications.
5.9 The RCH data do not provide any insights into maternal nutrition, but we do have some information from the van Dillen Bolangir study. Attitudes, knowledge and practice vary considerably in western Orissa. Older women support the notion that pregnant women should eat as little as possible in order to have small babies and an easy birth, and also contend that dietary supplements are leading to more caesarean births. Younger women on the other hand seem better informed about the importance of good nutrition during pregnancy, taking their information from ANM/Anganwadi and the media (including TV). Depending on seasonal availability, in about 50 percent of cases women report a varied diet, though somewhat lacking in animal products. This eating practice continues through the lactating period. There i s an interesting association between expectant father’s education and their knowledge o f the importance o f good nutrition during
Applying the Framework to Orissa 17

Achieving The MDGs in India’s Poor States
pregnancy: more educated fathers are more inclined to understand the benefit o f good nutrition and do whatever they can to provide for their pregnant wives.
5.10 Health seeking behavior of mothers-to-be. Effective prenatal care can benefit mothers and unborn children. Complicated pregnancies can sometimes be flagged during these visits, thereby averting complications at the time o f the birth. In addition, these visits help mothers, especially f i rst time mothers, learn about what they should and should not do to ensure a safe delivery. The in-depth Bolangir District study suggests that more women are seeking medical assistance when they detect some form o f complication with their pregnancy - an occurrence in around one quarter o f all pregnancies. On the precautionary side, according to the RCH data, more than 70% of women record one antenatal check-up during their pregnancy, and a little more than 50% received three antenatal care checkups during their most recent pregnancy (some at home, some at a clinic). A very high proportion o f pregnant women, about 86 percent, received the tetanus toxoid (TT) vaccine prior to their last birth - an important step forward in reducing deaths of mothers and babies due to tetanus. However, the fact that the rate o f TT vaccination i s higher than that o f a single ANC visit suggests that opportunities to undertake check-ups are being missed. While health workers have a mandate to carry out immunizations, they may lack the skil ls, time, equipment, incentive and/or household “permission” to perform ANC check-ups.
5.11 Factors associated with greater number of ANC visits in Orissa are similar to elsewhere: first pregnancy, ethnicity, women’s education, and wealthhcome. For example, while 43 percent o f scheduled tribe mothers-to-be received antenatal care, 70 percent o f non-backward castes received full three antenatal care checkups. Although there i s variation in tetanus toxoid vaccine coverage rates across caste groups, the variation i s smaller than for ANC checkups. The same pattern emerges across poverty groups. Dividing the households into welfare quintiles” almost eighty percent o f all mothers in the lowest welfare quintile (i.e. the poorest) received the tetanus toxoid vaccine, while 93 percent o f mothers in the richest welfare quintile holds received the TT vaccine. However, the disparity across welfare quintiles i s stark for the proportion o f mothers receiving three antenatal care checkups. Only 41 percent of poor mothers receive 3 ANC checkups, while 82 percent o f women from the top welfare quintile mothers receive 3 ANC checkups (Figure 5.1). Quality and the value o f preventative care as well as the cost o f accessing ante-natal services are likely to be factors in this outcome.
(ii) The birth
5.12 Seasonal factors. In-depth fieldwork from Bolangir District shows considerable variation in mortality rates across seasons. A large proportion (45%) o f child deaths occur in just three months o f the year, July, August, September, i.e., the rainy season. Immediate causes o f death are thought to be fever, malaria, diarrhea and pneumonia. During this time o f the year travel by road i s very difficult making medical assistance difficult to access if i s needed. Also during this time of the year, viral fever and colds are widespread, and are particularly harmful to new mothers and young children. The cold season (November-January) i s also associated with more than average deaths. This i s thought to be associated with the need for heating, which i s typically an open fire with either firewood or cow-dung, and if used can lead to serious indoor pollution from smoke.
22 This i s done using an asset index as a proxy for household consumptiontincome (since the RCH surveys do not collect income or consumption data, but do collect asset information - durable goods, housing characteristics). See Filmer and Pritchett (1998) for more details on this methodology and i ts robustness as a measure o f household welfare.
Applying the Framework to Orissa 18

Achieving The MDGs in India’s Poor States ~ ~
Figure 5.1: Proportion of mothers receiving antenatal care and tetanus toxoid vaccines across castes and welfare quintiles
100% I-’--- 90% 80% 70% 60% 50910 40% 30% 20% 10% 0%
sc ST OBC Other
Pregnant mothers who received at least 3 ANC’ Proportion oi mothers receiwg tetanus toxoid
100% 90% 80% 70% 6O”io 5036 4036 30% 20% 10% 0%
Quintile 1 Quintile 2 Quintile 3 Quintile 4 Quintile 5 Pregnant mothers who received at least 3 ANCl Proporlion oi mothers receiung tetanus toxoid ,
Source: WB estimation using RCH I1 data.
5.13 Birth order and birth spacing/previous birth interval. First births are more at risk than subsequent births (even controlling for mothers age) and high order births (after 6 or 7) are also risky, but have very low frequency. There i s a higher incidence o f neonatal deaths among f i rs t born children than subsequent births. But women carrying their f i r s t child are more likely to have ante-natal checkups and deliver in a health facility than for subsequent births. While the average birth interval i s in the range o f 24 months, 46% o f births o c c u at a lower interval. Birth intervals o f more than 24 months have a very significant (positive) impact on neonatal, infant and child mortality rates; by comparison, birth intervals o f less than 24 months tend to be strongly associated with higher mortality rates (Tables A8, A9 and A10).
5.14 Place of delivery. Although falling, almost seven out o f every ten deliveries are conducted at home in Orissa. The disparity in home based deliveries i s particularly strong across urban and rural areas. In urban areas, 41 percent o f all deliveries were conducted in the home, while in rural areas 77 percent o f all deliveries are conducted at home. Around three quarters o f births for scheduled tribe women are carried out in the home, while for non-backward castes, 46 percent o f births are carried out at home. There i s a steady inverse relationship between the proportion o f deliveries at home and the household’s economic status. While 85 percent o f all births in the poorest households are conducted at home, 21 percent o f all births in the richest households are conducted at home. Furthermore, there i s a particularly sharp drop in the proportion o f births carried out at home between quintile 4 and quintile 5 (figure 5.2). This suggests that delivery in a health facility i s particularly valuedcan be afforded by the richest households in Orissa. Mother’s education also influences place of birth, as does the availability o f a facility. There is, however, no direct relationship between place o f birth and neonatal deaths.
Applying the Framework to Orissa 19

Achieving The MDGs in India’s Poor States
Figure 5.2: The proportion of deliveries conducted at home across caste and household welfare quintiles
I 1
80% 70% 60% 50% 40% 30% 20% 10%
0% 1 Scheduled Caste Scheduled Tnbe OBC Other
Source: World Bank estimation using RCH I1 data. I
( I ‘ i
90% 80% 70% 60% 50% 40% 30% 20% 10% 0%
Quintile 1 Quintile 2 Quintile 3 Quiniile 4 Quintile 5
5.15 Assistance with the birth. In and o f itself, delivering a baby at home i s considered acceptable practice if the birth i s attended by a trained birth attendant, the birth place i s sanitary, and there i s access to emergency obstetric and intensive neonatal care services, should they be needed. (Obviously being present in a health facility with emergency obstetric and intensive neonatal care prior to the actual birth i s a preferable arrangement, but not always possible.) Almost three quarters o f all deliveries are conducted by untrained people, and there i s a higher rate o f neo-natal mortality among babies delivered by an untrained person (45/1000) compared to a trained medical worker (37/1000). Relatives and friends conduct 44 percent o f all home deliveries, with another 30 percent being conducted by untrained Dais. Births among scheduled tribes are the least likely to be attended by skilled birth attendants. Only one in seven scheduled tribe births i s carried out by a trained attendant, while 37 percent o f all births o f non-backward castes are carried out by skilled birth attendants. Similar disparities are seen across household welfare quintiles. For the poorest households in Orissa, about 16 percent o f all births are conducted by skilled birth attendants, while more than half o f all births in the richest households are conducted by skilled birth attendants (figure 5.3). The cost o f paying for the services of a trained birth attendant run into the hundreds o f rupees (anything from Rs. 200-600; van Dillen) and can be beyond the reach o f poor families. For A N M s , the large geographical areas falling in their jurisdiction and their lack o f mobility further constrain their ability to be present at home births.
,
5.16 The van Dil len study in Bolangir District found more than 90% o f births took place at home, and only 10% of these were attended by a trained birth attendant: in 83% of the home deliveries an untrained female relative alone was at the birth, and in the balance a traditional healer was called in. Considering the state o f communications, infrastructure and transport in the area - as well as the households’ hygiene practices (discussed below), home deliveries o f this sort are highly risky. Should complications arise, competent medical assistance i s often sought only when mother and/or baby are in a critical condition, often coming too late.23
23 Van Dillen finds a high incidence of baby deaths occurring at the time of birth, or shortly thereafter, from complications such as breech position.
Applying the Framework to Orissa 20

Achieving The MDGs in India’s Poor States
Figure 5.3: Birth attendants across caste and household welfare groups
100% 90% 80% 70% 60% 50% 40% 30% 20% 1 0% 0%
SC ST OBC Other
100% 90% 80% 70% 60% 50% 40% 30% 20% 10% 0%
Quintile 1 Quintile 2 Quintile 3 Quintile 4 Quintile 5
Source: World Bank estimation using RCH I1 data.
(iii) Care of Newborn and young children
5.17 Field study data suggest that the newborn child and the mother are cloistered in the house for the f i r s t one to two weeks following the birth, either in a separate room or in a secluded place. Contact with the baby and the mother are restricted.
5.18 Post-natal visits by ANM. Less than 15% of new mothers get a visit from the ANM after giving birth (RCH data). However, there i s an interesting pattern o f visits: a greater incidence o f post-natal visits by ANMs occur in the rural areas, among ST mothers, less educated and poorer women, than among others. Van Dillen’s Bolangir study suggests that around 40% of children get at least one medical check-up during the f i r s t 6 months o f their life, but this could be initially with a traditional healer rather than an allopathic doctor, and in response to an illness. Issues o f accessibility and cost can lead mothers to traditional healers rather than an allopathic doctor.
5.19 Breastfeeding. Exclusive breastfeeding for the f i r s t 6 months o f a child’s l i fe i s closely associated with higher rates o f child survival in the developing world.24 Both the RCH data and the van Dillen study report that young mothers obtain information on breastfeeding mainly from female relatives, rarely from medical practitioners. Breastfeeding practices, therefore, are largely determined by household and community traditions, which i s not necessarily advantageous for the child’s health. In t h i s manner, colostrums i s often squeezed out (claiming i t i s impure, and bad for the child), and the young baby i s fed cow’s milk or sugar water until the mother’s milk begins to flow. There i s some evidence that more educated and better-off mothers start breastfeeding sooner and allow babies to have colostrum. However, less educated and poorer mothers are more inclined to breastfeed longer. ST women, reflecting these influences, are more inclined to breastfeed longer but avoid giving their babies colostrum. State-wide only 20 percent of mothers practice exclusive breastfeeding up till the age o f 6 months (Table A6).
5.20 Breastfeeding on demand requires the mother’s presence. For most women, this i s possible during the f i r s t two months o f the baby’s life, but for poorer women who are required to
24 The Lancet 362, 2003.
Applying the Framework to Orissa 21

Achieving The MDGs in India’s Poor States
return to work soon thereafter i t can become a problem. Young babies are sometimes left with elderly relatives or a young sibling, with mother’s returning from their work every 2-4 hours to feed the baby. This can involve a cut in wages. Other mothers take their young babies to the field with them and attend to them as needed. Women typically seek work most compatible with regular breastfeeding during the first 6-12 months, as much as possible, a practice more easily followed among the better o f f households (van Dillen).
5.21 Weaning. This reportedly can start any time between 3 months and 10 months. The most common weaning foods are enriched milk powder, r ice paste, rice cakes, biscuits and cows milk (van Dil len study).
5.22 Health problems of the young child. Newborns are frequently affected by three different afflictions: diarrhea, fever, and skin rashes. A number o f other afflictions affect slightly older children and can contribute to their death; pneumonia, diphtheria, measles and malaria. (Fever related to malaria i s the number one cause o f death among young children in the Bolangir study area.) Concerning choice o f treatment for young children, many households start with home remedies (such as turmeric and figs for the treatment o f diarrhea), then turn to traditional healers (in the case o f skin rashes in particular) then to a traveling quack (who i s favored because he comes to the village, thus reliving the family o f travel expenses and he w i l l often provide services on credit). Only if the case looks sufficiently serious i s the baby taken to a public or private clinic. Reasons for not going to a clinic include (i) difficulties with transport - condition o f the road and the expense o f hiring a vehicle, (ii) the cost o f medical serviceshreatment, (iii) the cost of medicines and pathological tests, and (iv) the requirement that subsequent visits occur. A high proportion (108 out o f 173) o f infant fatalities arising from sick children in the Bolangir study never found their way to medical assistance prior to dying. Much more attention i s clearly needed to the integration o f preventative and treatment o f sick children, starting from the home and then taking the child to a qualified health care provider.
5.23 Immunization. More than 60 percent o f all children between the ages o f 1 and 2 years have received 3 doses of DPT, 3 doses o f polio and a vaccine against measles, and 55% o f children under the age o f 3 years are fully immunized (RCH data). More than 80 percent o f children have received the BCG vaccine, but only 28 percent o f babies received their polio OPV 0 drops. Immunization rates vary predictably across caste groups and across household welfare groups (Figure 5.4). Scheduled tribes and scheduled castes respectively account for among the lowest immunization coverage rates. Similarly, immunization coverage rates increase with household welfare quintiles for BCG, DPT3 and measles. The relatively low rate o f immunization against measles i s o f particular interest to this paper, in so far as i t can make an impact on reducing child mortality. Set against an overall rate o f 68% coverage ~tate-wide,’~ coverage o f ST/SC and poor populations at around 60% i s o f particular concern, falling well below the target o f universal immunization o f one-year olds.
25 Orissa’s performance with measles vaccination in “middling” among states. See fig. 11.24 in World Bank (2004).
Applying the Framework to Orissa 22

Achieving The MDGs in India’s Poor States
Figure 5.4: BCG, DPT3 and measles immunization rates of children between 1 and 2 years of age - across caste and welfare quintiles
1 I 120% 90% Wfo 70% 60% 50% 40% 30% 20% 1 0% 0%
sc ST OBC Other I
~
BCG i DPT3 D Measles ~
100%
80%
60%
40%
200lO
0% Quintile 1 Quintile 2 Quintile 3 Quintile 4 Quintile 5
Source: World Bank estimation using RCH I1 data.
5.24 Knowledge and treatment o f diarrhea reflect education and income levels o f the population, thus there i s an urban bias, on the one hand, and poorer practice among ST population on the other hand. (There i s no apparent child gender dimension though.) But state-wide more than 80% of mothers claim knowledge o f appropriate treatment to deal with diarrhea.
(iv) Mothers’ education - one of the strongest factors influencing child mortality
5.25 Education o f women affects child mortality indirectly, through a range o f intermediate factors. Mother’s educational attainment in Orissa i s indeed an important factor, with higher levels of educational attainment contributing to lower levels o f under 5, infant and neonatal mortality (figure 5.5). The literature i s abound with evidence on the link between good health outcomes, whether for the mother or for the child, and the educational attainment o f the mother. Mothers who are more educated tend to delay marriage, which in turn delays child bearing, are more inclined to seek health care for themselves and their children, have a greater decision making role in the family, practice better hygiene, nutrition and health management (treatment of new-born, washing and feeding practice; feeding and weaning o f older child; immunizations; care and treatment o f sick child, etc.) and seek health care when it i s needed There can also be an income effect through more educated mothers having higher earnings. In th is respect, Orissa i s at a distinct disadvantage. Almost 60 percent of mothers in the 15-44 age range have no education and 13 percent have less than a primary school education. Conversely, only a quarter o f all mothers have at least primary school education The strongest education impact occurs among women with more than 5 years o f education, and as shown in figure 5.5, child mortality rates are considerable lower with th i s level o f education. Moreover, this relationship holds true when all other variables are held constant (Tables AS, A9 and A10).
Applying the Framework to Orissa 23

Achieving The MDGs in India’s Poor States ~ ~
Figure 5.5: Child, Infant and Neonatal mortality rates by mother’s educational attainment
I No Education Primary or less More than pnmary
I
Source: World Bank estimation using RCH I1 data.
5.26 The importance o f women’s education i s further reflected in health seeking behavior during pregnancy. Only 40 percent of mothers with no education received 3 ANC checkups, while 72 percent o f mothers who have more than a primary education received 3 ANC checkups. Again, the disparity in tetanus toxoid vaccine coverage rates i s smaller, with 78 percent o f mothers with no education receiving the TT vaccine, and more than 90 percent o f mothers with some education receiving the TT vaccine (figure 5.6).
Figure 5.6: Proportion of mothers receiving antenatal care and tetanus toxoid vaccines across mother’s education
Md% ..
80%
60%
40%
20%
0% No Education Primary or less More than primary
10 % mothers recervlng tetanus toxoid vaccine I 1 % mothers receimg 3 ANC checkups 1
Source: World Bank estimation using RCH I1 data.
B. THEFAMILY
5.27 There i s a tendency to treat all members o f a household, or family, as a single unit assuming that whatever benefits one member w i l l benefit the entire household. This may not always be true. Intra-household differences in gender and age may significantly affect how
Applying the Framework to Orissa 24

Achieving The MDGs in India’s Poor States
decisions are made and whether a decision i s beneficial for all members. Gender disparities in access to education, credit and political influence have considerable impact on how individual family members are valued and on the degree to which women (as well as men) have a voice in household decisions about health and health care. Recognition o f the importance o f individuals and households in reducing child mortality should lead policy makers to consider both the individual woman and the broader household.
5.28 There are a number o f characteristics o f the family in which the pregnant woman belongs and into which the child i s born that have a direct (and indirect) relationship on the likely survival chances of the baby/young child, as well as the mother herself. These include the assets and resources o f the family: i t s size and composition, physical assets (land, livestock, business, property, house), financial assets and income, amenities - such as water, sanitation, electricity, telephone, and availability o f food. A household’s daily practices and routines also have an important influence on the condition of a pregnant woman, young mothers and young children. They include the attitudes and behaviors o f the family members v i s - h i s hygienehanitation, cooking and eating, the work burden carried by the pregnant (and lactating) mother, interaction with health-care providers during pregnancy, at the time of the birth and after the birth as well as the birth place, care o f the newborn, feeding o f the young child and preventative and curative interventions for the sick child. The socio-economic status o f the woman within the household w i l l also be an important factor. Some o f these aspects for which Orissa data exist are discussed below.
5.29 Water and sanitation. Provision of safe water has contributed to declines in mortality in many developed countries, and poor sanitation and unsafe water, along with poor personal hygiene are known to be major factors in the wide prevalence o f parasitic diseases. Waterborne diseases can undermine the health o f pregnant women because they cause anemia, a risk factor for pregnant mothers as well as their unborn children. In a review o f over two thousand publications, Fewtrell et al. (2005) summarized the evidence as follows: (i) water quality interventions reduce diarrheal illnesses; (ii) household water connections also reduce the incidence o f diarrhoea; (iii) hygiene interventions, especially hand washing, are very important for reducing diarrheal illnesses and upper respiratory-tract infections, and can be effective in areas o f poor water and/or sanitation; (iv) the impact o f improved sanitation i s thought to be positive in reducing diarrheal illnesses, but few studies are robust in their design; and (v) multiple interventions consisting o f water supply, sanitation and hygiene education do not necessary strengthen the impact over and above any one individual intervention, although improved water quality at point of consumption was rarely included in the studiesaZ6
5.30 The link between water supply and health o f mothers and children involves both household and community factors, and the ability o f a household to translate piped water, for example, into lower morbidity and mortality i s by no means straightforward. Indeed a study in India (Jalan and Ravallion, 2001) found that health gains from piped water largely bypassed poor families, although reduction in diarrhea among children in better-off households was significant. Other work has noted that it i s the better hygiene practices (especially hand-washingz7) and sanitation (use o f latrines) that has a bigger impact on reducing child mortality. As far as these are facilitated by the convenience o f piped water in the house (for frequent hand washing) and a place to dispose o f feces (latrines) the infrastructure i s an important factor for health outcomes,
26 Reduction in incidence o f diarrhea across these five interventions i s as follows: (i) 15-39%; (ii) 19-23%; (iii) 33-42%; (iv) 24-36%; and (v) 30-33%. ’’ See, for example Luby et al. (2005) “Effect to hand-washing on child health: a randomized controlled trial”. In The Lancet, vol. 366, July 2005.
Applying the Framework to Orissa 25

Achieving The MDGs in India’s Poor States
especially the reduction o f diarrhea and associated child mortality. Quantity o f water i s particularly key, in large part due to the increased feasibility o f adopting safe hygiene practices.
5.31 The RCH surveys collect information on the source o f water for the household: tap (inside and outside), hand-pump, covereduncovered well, open water source and any other. (There are no data on quantity o f water nor on hygiene practices.) The data do show a positive relationship between tap water and (lower) child mortality, especially at older ages o f children. The effect i s most pronounced in the urban areas where taps are more prevalent, especially in the home. In rural areas, when other factors - such as household income and women’s education - are taken into account the positive effect disappears. This i s not to say that access to clean water i s unimportant, but other factors may be more important. Also, how clean water i s used in baby care and child rearing i s hugely important. The effect o f modem sanitation on infandchild mortality i s similar to water: there i s a consistent positive impact on lower mortality as a linear relationship, but the relationship i s not significant where other factors are taken into account (as shown in the regression tables in the annex o f the paper). In all likelihood, the accompanying behaviors are not present in many rural households.
5.32 The van Dillen Bolangir study confirms that hygiene practices are woefully inadequate: few households boi l water (not even for weaning foods); in virtually all households the women reported never washing their hands with soap before cooking (including the preparation o f weaning foods); use o f pit toilets, even where they exist i s rare, and hand washing after defecation i s also very rare (15% o f households on an occasional basis). Results from a baseline study on health outcomes o f sanitation project in Bhadrak Distr ict (2005)*’ are somewhat more positive: hand washing among adults and children was quite common, although use o f soap was likewise rarez9; use o f pit latrines was low (10% of households) as was treatment o f drinking water (boil, treat or filter, 11%). The incidence of diarrhea among children under five was high, with close to half o f all children having had an episode o f diarrhea in the month prior to the survey (August and September) .
5.33 Cooking fuels. Various studies in India (Hughes and Dunleavy, 2002; van der Klaauw and Wang, 2004) have shown that indoor air pollution caused by certain cooking fuels contributes to infant and child mortality. Indoor air pollution i s associated with acute respiratory infections, asthma, blindness, chronic pulmonary disease, and tuberculosis - all illnesses found extensively in Orissa. Other studies have modeled the gains in child survival from switching to cleaner cooking fuels (such as kerosene and liquid petroleum gas). The van Dil len Bolangir study reports that most households in rural Orissa are cooking with firewood, supplemented with cow-dung - both o f which produce a lot o f smoke, known to be a serious health hazard. While women are most affected, many young children are with their mothers whilst cooking (9 1/137 households) and inhaling the smoke.
5.34 Malaria i s widespread throughout much of Orissa, especially in the interior districts in the west of the state, and i t i s one o f the most serious threats to health and well-being. Orissa accounts for a very proportion o f the all-India deaths associated with malaria, and the number of reported cases o f malaria has remained stubbornly high (at around 400,000 p.a.). Young children are particularly at risk, for they are much less resistant than adults. The Government o f India promotes a number o f strategies to address malaria, including early diagnosis and treatment, indoor spraying, insecticide treated bed nets, larvivorous fish, and behavior change communication. According to a UNICEF study in eight districts o f Orissa, less than 50% of
’’ Undertaken by RTI International, under the guidance of the Orissa Department for Rural Development. 29 Knowledge about the importance of soap was however very high among adults.
Applying the Framework to Orissa 26

Achieving The MDGs in India’s Poor States
pregnant women took chloroquine, and only 2% o f children slept under a treated bed-net. Likewise, less than half the households in the van Dil len Bolangir study area reported taking precautionary measures against malaria, with less than 15% of households using mosquito bed nets - the balance using smoke from straw, leaves and occasionally commercial coils. Van Dillen’s data suggest a strong relationship between use o f precautionary measures against malaria and lower infant and child mortality. Reasons cited for not using precautionary measures include lack o f awareness o f the danger of mosquito bites, the cost o f mosquito nets, and the unpleasant feeling associated with sleeping under the nets (a feeling o f suffocation).
-- I__-p --- *---*-
Box 5.1: Ante-natal and Post-natal Care and Practices: Findings from a survey of eight districts
Data collected from households (1400/district), monitoring o f practices at health sub-centers (30) and facility surveys in health institutions (lO/district) found the following:
0
0
0
Less than 5% o f home deliveries attended by a TBA are “clean” 77% o f newborns are bathed within first 48 hours raising the risk o f hypothermia Less than a half o f infants receive some post-natal care: only 10% receive full post-natal care Only 50% o f pregnant women take chloroquine Less than 10% o f women receive ANC in the first trimester Less than half o f infants are exclusively breastfeed for 6 months Less than 4% o f children under 5 years benefits from safe water sanitatiodhygiene practices Less than 2% o f children under 5 years sleep under a treated bed net at night Less than one third o f children with diarrhea received oral re-hydration treatment
5.35 Household resources - assets and income. Poverty acts through many channels which ultimately affect infant and child mortality. Chief among these factors are work load o f women during pregnancy and lactation, nutrition status o f women and children, affordability of healthcare and drugs, and quality o f housing and amenities in the house. According to the R C H data, both under 5 and infant mortality rates vary considerably across household welfare groups. Unsurprisingly, there i s a monotonic decreasing relationship between child mortality and household wealth (assets). While the poorest households lose around 94 children before the age o f five per 1,000 live births, the richest households lose around 43 children before the age o f five. IMR too decreases with household wealth (assets), with 77 deaths per 1,000 live births in the richest households and less than half (38 deaths per 1,000 live births) in the richer households. Neonatal deaths also fall as income rises, though the difference across income groups i s less striking than with older children. Other indicators o f mother’s well-being during pregnancy, birth and child-bearing-related behavior show a similar pattern with household wealth (assets): better- o f f households have a higher incidence of ANC check-ups, especially with a doctor, a higher proportion of pregnant women get tetanus toxoid injections, deliver their babies in either a government or private hospital with a trained medical practitioner, and have their children fully immunized (figure 5.7).
Applying the Framework to Orissa 27

Achieving The MDGs in India's Poor States
Figure 5.7: Variation in child and infant mortality across social identity and welfare quintiles
Scheduled Schediiiedlribe Mher backward Other Lk not bow Quintile 1 Qiiintile le 3 Quinile 4 Guinlile 5
Source: World Bank estimation using RCH I1 data.
5.36 Social Identity. On the surface this i s also an important factor in explaining different levels of childhnfant mortality. As shown in Figure 5.7 (above), the incidence o f child and infant mortality i s higher among scheduled tribe families than any other group: child mortality at 100 per 1,000 live births, infant mortality at 80/1000 and neonatal mortality at 51/1000 are all well above the rates for other groups. B y the same token, health care seeking behavior among pregnant ST women also shows fewer ANC visits, a very high incidence of home delivery with untrained persons and lower rates o f child immunization. However, when other factors are taken into account, most importantly poverty and education o f women, the mortality outcomes in ST families are not so different from any other groups o f the population. In other words, if ST households had the same level o f education and income as other households, in al l likelihood their child survivallmortality rates would be similar to the rest o f the population. But, in so far as ST populations are poorer, less educated and live in remoter parts o f the state, a concerted effort w i l l be needed to compensate for these other factors in order to have a positive impact on reducing infant and child mortality.
5.37 Household level behavior and risk factors are influenced and reinforced by conditions in the community. Community factors include both the values and norms that shape household attitudes and behaviors and the physical and environmental conditions o f the community. Beyond the family into which the young child i s born l ies the community, also with various characteristics, resources, assets and institutions which can have a bearing on the survival probabilities o f the child. Rural infrastructure such as roads, schools, health facilities, anganwadi center, etc., would all seem to be important factors which could influence infant and child mortality, as well as environmental conditions (water, air quality, weather, etc.). Likewise the institutions o f the village - formal and informal - could also play a part in determining who (which people) get access to what facilities and services. Gender norms can also be influenced by the community, and the existence o f community groups, the degree o f social cohesion can also
Applying the Framework to Orissa 28

Achieving The MDGs in India’s Poor States
affect practices. While these are important relationships to probe, the RCH data have limited information upon which to develop an ~nderstanding.~’
5.38 Roads and transport. Delays in reaching treatment facilities pose critical life- threatening obstacles for women who experience an obstetric emergency. Such delays can be the result of physical accessibility factors such as a distance to a facility, the availability and cost of transport, and the conditions o f the road. In Zimbabwe, for example, a study showed that the lack o f availability o f transport accounted for 50 percent o f maternal deaths related to hemorrhage. Research in Nigeria, Uganda and Tanzania finds that poor roads, lack o f vehicles and high transport costs were major causes o f delay in deciding to seek and in reaching emergency obstetric care. The van Dil len study in Bolangir District likewise found that one o f the key reasons for taking a young child to hospital only when i t s condition was critical was difficulty with transport (road condition) and the expenditure associated with hiring a vehicle. Villagers identified “giving birth” as a risk because mothers could not reach health centers due to inadequate road access, particularly difficult during the rainy season, if they needed to.
5.39 In the RCH data the existence o f an all-weather road shows a positive relationship with lower infant and child mortality, and i s closely correlated with the full course o f ante-natal check- ups and giving birth in a health facility in the rural areas (Annex Tables A l l and A12).
D. SERVICES
5.40 Health and Nutrition Facilities. Orissa i s one o f the most sparsely populated states in India, and with many facilities “norm based” this low density poses a particularly difficult service delivery challenge. Primary health centers, community health centers, and hospitals are within the same village for a very small fraction of households. However, i t does appear that ICDS centers are relatively numerous, with more than 80 percent o f households having an ICDS center within the village. Sub-centers too are within the village of around a third o f all households in Orissa. As far as one can tell from the RCH data, there i s l i t t le or not relationship between the existence of a health facility and in fadchi ld mortality outcomes. The one exception i s lower neonatal mortality rates where a private hospital i s close by (see Annex Table A9). O f course, these data tell us l i t t le about quality o f service (are service providers present and knowledgeable about the services they are expected to provide, for example), and non-physical accessibility o f the service to the potential clientele - all critical to having an impact on neonatal, infant and child mortality. On these matters, we have some insights from the in-depth study in Bolangir District, and these are presented in the next few paragraphs.
5.41 In connection with a scheme under which pregnant women and their newborns are given free medicines (including folic acid) during pregnancy and vaccines in public health facilities, the van Dillen study recorded that the anganwadi worker, who i s suppose to do the registration would do so only if paid a bribe (rates o f Rs. 10-100 were recorded). B y the same token, A N M s who are suppose to assist with deliveries are reported to charge between Rs. 200 and Rs. 600 on a routine basis for such services, an even larger amount i f the ANM i s called “out o f proper working hours” on an emergency basis.
5.42 Absenteeism o f staff working in government health facilities i s a common problem, fully confirmed by the Van Dil len study. This i s true for both PHCs and hospitals, and involves a wide
30 This i s an area where further study would be helpful.
Applying the Framework to Orissa 29

Achieving The MDGs in India’s Poor States
range of staff from the anganwadi worker, the ANM and doctors.31 At best, staff adhere to core working hours and finding medical help after regular hours i s a particular problem. When a trip to a PHC or hospital involved the hiring of a vehicle such vain attempts to see a doctor involves the waste o f considerable expenditure. However, there are cases o f committed health workers who perform excellent service and “charge only moderate fees”.
5.43 Corruption in connection with the utilization o f government medical facilities i s a common theme emerging from the field study. I t was often reported that the quality o f medical care depended on the patient’s ability to pay either larger-than-usual fees, or to pay fees for services where no fees should be charged. In some facilities, the entire medical staff, doctors, nurses, and even the peons are complicit in extracting payments from patients. Fees can be demanded either directly or indirectly through obvious neglect. Fees are unpredictable, and can be subject to negotiation. What curbs these practices i s the fear o f monitoring and control.
5.44 Transport costs and fees for medical services, whether legitimate or not, are not the only reasons why parents hesitate to take their children, or pregnant relatives to hospital before their condition becomes clearly serious. The additional costs that arise in connection with the purchase o f medicines and the need for pathological tests are also barriers to service. Doctors in government hospitals are reported to frequently refer patients to private pharmacy shops to buy medicines citing the absence o f medicines or their “bad quality” in the hospital. Many pathological tests are also referred to private laboratories.
5.45 In sum, people not only face considerable expense in seeking healthcare from a government facility: patients are exposed to a high degree o f arbitrariness and i l l -wi l l at a time when they most need support and reassurance.
5.46 For many o f the reasons cited above, people often turn to the private sector for health care. Quacks and traditional healers are the f i r s t choice when the condition i s thought not to be l i f e threatening. (The choice apparently does not reflect deep conviction - most people seem to appreciate the s k i l l s of a well-trained doctor - but i s rather a reflection o f the obstacles and drawbacks associated with approaching a doctor). The quack comes to the village/patient, rather than vice versa, and wi l l often accept payment on credit.
5.47 Once it i s clear that the patient i s in a serious condition, according to van Dillen, quite a number o f households turn to private physicians - well-trained and well-regarded doctors - if they are available. In contrast to dealing with the public sector, financial matters are straightforward. There are prices for services, and patients and their relatives do not have to put up with arbitrary negotiations about side payments. Although perhaps presenting higher fees, if transport and opportunity costs are fully considered, together with the more predictable nature o f costs, turning to private physicians i s a credible alternative to seeking health care from government facilities. Moreover, quality service for the most part i s forthcoming, and the patient has some control over next steps - medicines, pathological tests and subsequent visits - should these be needed.
31 A recent World Bank review o f the ICDS/Supplementary Nutrition program in Orissa found a 30 percent absent rate among Anganwadi workers. (2006).
Applying the Framework to Orissa 30

Achieving The MDGs in India's Poor States
6. STATE HETEROGENEITY - DISTRICT PROFILES
6.1 We have now summarized the general pattern o f relationships, and teased out those factors having the strongest effect on neo-natal, infant and child mortality in Orissa. We have also categorized the factors into four groups: individual woman, family, community and service provision. We can now take the analysis to more disaggregated geographical areas - to the level where action might best be taken. Ideally this could be at the level of the District, Block - even down to the village. Due to the large sample size and sampling frame, the RCH data afford the possibility o f looking at district level patterns for some o f the variables.
Child mortality at the district level
6.2 Data for all 30 districts show considerable inter-district variation with child mortality rates (figure 6.1, and Annex Table Al). Child mortality rates vary from a high o f 124 deaths per 1000 live births in Malkangiri to a low o f 46/1000 in Balasore. Malkangiri also has the highest IMR (lOO/lOOO) while Sambalpur has the lowest IMR (40/1000). The ranking o f districts by child mortality and infant mortality shows some variation - such as Nayagarh and Gajapati which have modest IMRs (52 and 58 respectively) but quite high child mortality (72 and Sl ) , suggesting the presence o f mortality factors affecting children in the 1-5 age range. Two other districts stand out as having high child mortality rates where the mortality i s particularly high in the 1-5 year age period (Kalanidhi and Koraput). In many districts where IMR i s relatively low, child mortality i s similarly low, reflecting considerable progress in reducing mortality among children in the 1-5 age range - these are typically the best performing districts.
Figure 6.1: Child mortality rates across districts
I
Source: WB estimation using RCH I1 data.
State Heterogeneity - District Profiles 31

Achieving The MDGs in India’s Poor States
6.3 There i s less variation with neo-natal mortality rates across districts - a low of 29/1000 (Bhadrak) to a high o f 63/1000 (Boudh). In some districts (Khordha, Sambalpur, Sundargarh, Balasore and Dhenkanal) neo-natal deaths account for 80%+ o f IMR, and in Boudh it i s more than 90%. Two districts, Rayagada and Malkangiri, stand out as having very high rates o f child mortality - 118 and 124 respectively, yet even there the neo-natal mortality rates are not especially high (49 and 48 respectively). This pattern probably reflects the very high incidence of home births, the low incidence o f trained medical personnel at the birth and a general reluctance to give birth in a medical facility unless i t becomes critical. These patterns vary little across districts.
Table 6.1: Child, Infant, and Neo-natal Mortality Rates in Select Districts
Neo-natal mortality
Note: Numbers in parenthesis refer to district ranking by child mortality rate, with (1) being lowest and (30) being highest.
A. INDIVIDUAL WOMAN A M ) MOTHER
6.4 Regarding education, there i s considerable variation in the education status o f women o f child-bearing age: Balasore, Cuttack, Jagatsinghpur, Kendrapara and Puri - all coastal districts have relatively high levels o f education, whilst Rayagada, Nuapada and Malkangiri have low levels o f education status. As expected, there i s a close relationship between levels o f education and district level mortality figures: generally speaking, districts with higher levels of education have lower child mortality (especially Cuttack and Jagatsinghpur), while districts having low levels of education have high child mortality (especially Malkangiri and Rayagada). (See Table A3.) As noted above, education o f women affects child mortality indirectly through a range o f channels: delayed age o f marriage and f i r s t birth, health seeking behavior during pregnancy, at birth and for young child, decision making role/control o f resources within the family, hygiene, nutrition and health management practices, and feeding and weaning practices to name just some of the more important channels.
6.5 Antenatal care, delivery and post-natal care. Quite a high incidence o f women are getting at least one ANC visit (76%) and 58% are getting three ante-natal check-ups. Considerable variation exists across districts - Bolangir, Boudh, Cuttack, Puri, Sambalpur, Sonapur and Bargarh are getting higher numbers o f women into ANC; Malkangiri and Nabarangpur, for example, are not doing so well. However, all districts are doing very well on tetanus toxoid, even the ones that struggle on other services (86% average coverage: Annex Table A4).
State Heterogeneity - District Profiles 32

Achieving The MDGs in India’s Poor States
6.6 Despite high levels o f ANC visits few women deliver their babies outside the home - 65% o f all deliveries in Orissa are in the home. In Kendujhar, Rayagada, Koraput, Gajapati and Malkangiri, around 80% of all deliveries are at home.32 Most home deliveries are assisted by either an untrained dai (30%) or a relative/friend (44%). Malkangiri and Koraput have a particularly high number of births assisted by an untrained person (Annex Table A5). As to the reason for these patterns, the over-whelming majority o f women say i t i s “not necessary” to go to a health facility. In three districts (Bhadrak, Kendujhar and Rayagada) cost was cited as an issue though transport in and o f itself was rarely mentioned; poor service quality was o f concern in close to ten percent of situations, with four districts recording a higher level of service quality concern (Sambalpur, Anugul, Bargarh and Bhadrak). The extent to which this pattern o f over- whelming home delivery in the hands o f untrained health workers i s a major factor in explaining the very high levels o f neonatal mortality throughout the state remains an open question, but there i s evidence to suggest that i t i s an important factor. Only a s m a l l percentage o f new mothers receive a visit from the ANM (14% state wide). In a few Districts, the percentage o f visits i s higher - Rayagada (32%), Malkangiri (25%) and Kendujhar (19%) - and in these same districts there i s evidence o f additional visits (in Rayagada, for example, 23% of new mothers receiving a second visit).
6.7 Breastfeeding. Breastfeeding practice o f the newborn child shows some variation across districts. On average, 45% o f babies are breastfed within the f i r s t 2 hours o f delivery (a significant increase since the f i r s t RCH survey) - more than a half in eight districts, with Puri topping the league with over 60%; by comparison less than a third o f babies born in Angul, Sambalpur and Bargarh are breastfed within 2 hours o f birth. Regarding the duration of breastfeeding, while some 81% of mothers breastfeed for a few months, only 16% continue with exclusive breastfeeding for 6 months. Angul, Jajapur, and Sundargarh have the highest incidence o f longer term breastfeeding, while in Cuttack, Khordha and Nayagada mothers tend to introduce other foods before the child reaches 6 months. In Orissa, as in many places in the sub-continent, the practice o f squeezing and destroying colostrum (rather than allowing the baby to absorb it) i s widespread: 52% o f mothers follow this practice (72% in Malkangiri): mothers in Nuapada, Khordha, Kandhamal and Ganjam are somewhat more inclined to allow the babies to have colostrum than elsewhere.
B. THEFAMILY
6.8 From the analysis in the previous section we know that household assetdwealth, along with mothers’ education, are two o f the strongest correlates of infant and child mortality in Orissa. District level data further confirm this relationship. The poorest districts o f Malkangiri, Keonjhar and Nabarangpur have high child mortality rates - 124, 84 and 88 respectively - while the better off districts o f Cuttack, Puri, Khorda and Anugul have much lower rates (49, 58, 54 and 64 respectively). However, there are others - Sonepur, Mayurbhanj, Bargarh, Deogarh and Bhadrak, for example - which have a much lower mortality rate than their wealth status would suggest. At the other extreme Ganjam and Sundargarh have higher mortality rates than there wealth rank would suggest (Annex Table A3).
32 Only in Khordha District are a higher proportion of deliveries undertaken in a medical facility (either government or private), probably reflecting the availability of facilities in and around Bhubaneswar, and higher levels o f education and income.
State Heterogeneity - District Profiles 33

Achieving The MDGs in India’s Poor States
6.9 The ST/SC population mix o f a district also has some bearing on infant and child mortality outcomes. But while i t i s true that two districts with a high incidence of ST population also have high IMRs (Rayagada and Malkangiri), other districts with large ST populations have relatively low IMRs: Sambalpur, Mayurbhanji and Sundargarh. As noted above, the education level o f the ST/SC population i s typically lower than among other social groups, and this combined with the higher incidence of poverty (Table 2.1) largely explain the observed higher infant and child mortality rates among the ST/SC population.
C. SERVICES
6.10 Immunization. State-wide the “fully immunized” rate33 in 2002/4 i s very similar to that recorded under the f i r s t RCH survey (1998/99): around 55% o f children under the age o f 36 months having received all the recommended immunizations. There i s some variation in district performance between the two periods: four districts have significantly improved their performance - Balasore, Ganjam, Boudh and Cuttack - but a large number o f districts have slipped, most notably Jajapur, Koraput and Sundargarh. Among the different vaccinations, BCG coverage i s generally good (81%) (Jajapur and Malkangiri slipping a little), DPT 3 and Polio 3 reasonable 62% and 61% respectively - with only Malkangiri standing out with consistently low rates o f coverage and Sambalpur with consistent high rates (Annex Table A6). Regarding measles, the state-wide average i s 68% coverage of 12-14 month olds. The districts o f Puri, Cuttack and Boudh achieve more than 80% coverage while Koraput, Malkangiri, Jajpur and Jagatsinghpur barely reach the 50% mark.
6.11 Access to ICDS and health facilities. While access to ICDS centers i s pretty comprehensive throughout the state (83% o f households have access to an ICDS center), access to health facilities i s very varied. At one extreme, the districts of Angul and Kendujhar have pretty good coverage o f both public and private facilities (see Table A7). At the other extreme, districts such as Malgangiri and Sonapur have good access to neither public nor private health facilities.
How well are districts performing?
6.12 A final part o f the district level analysis involves an exercise whereby the actual IMRs for the districts are compared with “predicted” IMR numbers: “predicted” estimates are made by aggregating a number o f household socio-economic values, such as the wealth index, women’s education, ethnicity of household, type o f house, drinking water and sanitation, electricity, cooking fuel and other household characteristics known to be associated with child (infant) mortality. In so far as these are some o f the main determinants o f mortality outcomes, they can be expected to predict the actual observed rates. I t i s important to note that the formula used to predict the IMRs does not include any health facility variables - the only service provision data contained in the RCH survey. This i s because these variables are not significant in explaining the observed variation in actual infant mortality rates (see Annex Table A9)34. The results for this exercise are presented in Table 6.2: lower numbers indicate an IMR performance better than household socio-economic characteristics would suggest; a higher number (more than 100%) indicate a poorer performance than household socio-economic characteristics would suggest.
33 BCG, DPT (3 doses), Polio (3 doses) and measles for children under 36 months. 34 I t i s possible that if more disaggregated data were available on health services, especially quality and timely availability of service, some significance vis-a-vis mortality rates would be observed.
State Heterogeneity - District Profiles 34

Achieving The MDGs in India’s Poor States
Table 6.2: District level performance with IMR: Good and bad performers ----- Districts Actual IMR Predicted IMR* Actual I M R as a
(RCH data) % predicted IMR* (lower figure indicates better performance)
B hadrak 40 59 69 Deogarh 46 66 69 Sambalpur 45 65 69
Balasore 45 56 79 Cuttack 45 52 87 Mayurb hanj 59 67 88 Koraput 68 77 89 Bargarh 60 67 89 Dhenkanal 53 58 91 Jharsuguda 58 63 93 Sonepur 62 66 94 Keonj har 67 70 95 Angul 57 60 96 Kalahandi 69 71 96 Khurda 54 55 97 Jagatsinghpur 52 52 100 Sundargarh 67 65 102
Nuapada 74 70 105
Gaj apati 58 77 75
Nayagada 61 59 103
Puri 55 52 106 Ganjam 71 66 107 Nabarangpur 73 68 107 Kandhamal 77 70 109 Bolangir 76 69 110 Rayagada 92 80 115
Jajpur 75 63 120 Malkangiri 103 82 125
Boudh 70 60 116
Kendrapara 69 54 128
Total 64 64
* Predicted IMR i s based on wealth (asset) index, mother’s education, ethnicity of household and other household characteristics: lower numbers indicate an IMR performance better than household socio-economic characteristics would suggest; a higher number (more than 100%) indicate a poorer performance than household socio-economic characteristics would suggest.
6.13 Through this analysis, three districts stand out as having an actual IMR that i s considerably lower than their socio-economic circumstances would suggest - these districts are Bhadrak, Deogarh and Sambalpur; three others districts - Malkangiri, Jajapur and Kendrapara - are at the other end of the spectrum and have actual IMRs considerably higher than observed conditions would suggest they should be. These six districts - the good performers and the poor
State Heterogeneity - District Profiles 35

Achieving The MDGs in India’s Poor States
performers - could offer interesting sites for further investigation: the positive deviants and the negative deviants. In particular, household behavior and health service provision vis-&vis antenatal and post-natal care seem particularly important: Sambalpur, for example, does wel l w i th ante-natal care, deliveries in a medical facility, exclusive breastfeeding, and immunization despite being a district wi th average wealth and education, and a relatively high ST population (35%).
-- ------ ~~
Box 6.1: Mayurbhanj: Achieving rapid reduction in child mortality
Mayurbhanj i s a district in the northern part of Orissa. I t has a vast land area (10,000 sq.km.), a population o f 2.2 million, of which more than 50% belong to schedule tribes and lead lives as huntedgatherers. This i s a poor district (77% of the population are classified as BPL), and the level of literacy quite low (38% among women). Malaria i s endemic in 21 out of 26 blocks. The district i s implementing a wide range of interventions including early diagnosis and prompt treatment, vector control (spraying, bed nets and fish) and BCC. There has been some modest decline in the number of reported cases and deaths. There i s a high incidence of malnutrition, irritated by floods and drought, and pneumonia and diarrhoea are widespread in the district.
Infant mortality has dropped from a high of 96/1000 in the late 1990s (one of the highest in the state at that time) to around 53/1000 in 2004 (RCH data).
Mayurbhanj has been the focus of a number o f innovative child survival programs, including CARE India’s Integrated Nutrition and Health Project. More recently, with support from UNICEF, the Integrated Management of Neonatal and Childhood Illnesses was introduced in Mayurbhanj in 2004 and planning i s to cover the entire district by the end of 2006. The linchpin of IMNCI i s the Anganwadi workers: trained in a variety of child survival interventions including visits of newborns (1” visit within 24 hours; 3 visits within first 10 days); intense follow-up/case management of sick babies - referral, with associated transport money; food and hygiene practices; and close collaboration between the AWW and ANM and other health department functionaries.
An important part of the IMNCI strategy i s to “de-medicalise” vital aspects of child care, provide single standard protocols for identification, classification, referral and treatment by community healthhtrition workers. The program also promotes partnership with local NGOs, and uses “freelance” trainers and monitors - local young men and women with grassroots experience. At the Block level, there i s regular convening o f progress review meetings, facilitated by UNICEF/local NGOs, with a particular focus on planning and problem analysis. Like many community based programs, the success o f this IMNCI rests with the quality and effectiveness o f capacity buildinghraining o f community level workers, regular contact with those workers, the content of the message, availability o f supplies, and support for community workers to reach out to marginalized neighborhoods. A review o f CARE India’s INHP found that the involvement of women’s groups and PRI institutions, and coordination mechanisms between ICDS and MOHFW at block and district levels was instrumental in the success of i ts various child survival interventions (CARE India, 2004). -- ---
State Heterogeneity - District Profiles 36
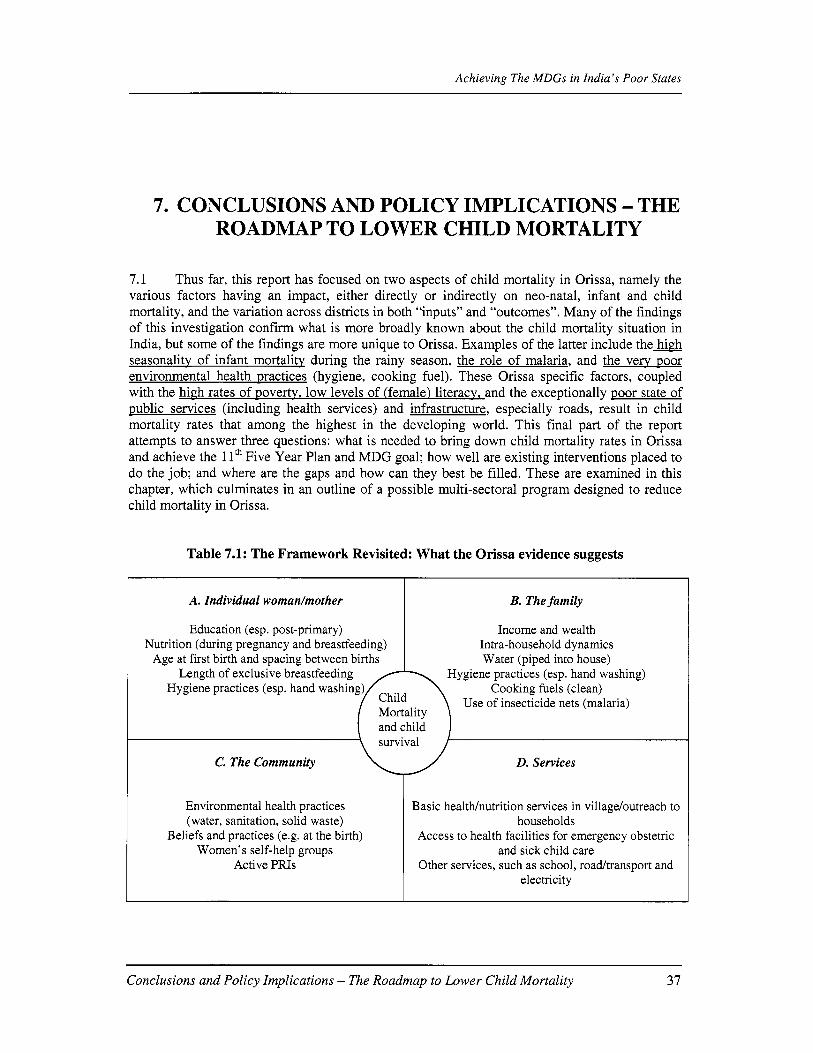
Achieving The MDGs in India’s Poor States
A. Individual woman/mother
7. CONCLUSIONS AND POLICY IMPLICATIONS - THE ROADMAP TO LOWER CHILD MORTALITY
B. The family
7.1 Thus far, this report has focused on two aspects o f child mortality in Orissa, namely the various factors having an impact, either directly or indirectly on neo-natal, infant and child mortality, and the variation across districts in both “inputs” and “outcomes”. Many of the findings o f this investigation confirm what i s more broadly known about the child mortality situation in India, but some o f the findings are more unique to Orissa. Examples o f the latter include t h e m seasonality o f infant mortality during the rainy season, the role o f malaria, and the very Door environmental health practices (hygiene, cooking fuel). These Orissa specific factors, coupled with the high rates of poverty, low levels o f (female) literacy, and the exceptionally poor state of public services (including health services) and infrastructure, especially roads, result in child mortality rates that among the highest in the developing world. This final part o f the report attempts to answer three questions: what i s needed to bring down child mortality rates in Orissa and achieve the 1 I* Five Year Plan and MDG goal; how well are existing interventions placed to do the job; and where are the gaps and how can they best be filled. These are examined in this chapter, which culminates in an outline o f a possible multi-sectoral program designed to reduce child mortality in Orissa.
Education (esp. post-primary) Nutrition (during pregnancy and breastfeeding)
Age at first birth and spacing between births
Table 7.1: The Framework Revisited: What the Orissa evidence suggests
Income and wealth Intra-household dynamics Water (piped into house)
C. The Community D. Services
Environmental health practices (water, sanitation, solid waste)
Beliefs and practices (e.g. at the birth) Women’s self-help groups
Active PRIs
Basic heal thhtr i t ion services in village/outreach to households
Access to health facilities for emergency obstetric and sick child care
Other services, such as school, roadtransport and electricity
Conclusions and Policy Implications - The Roadmap to Lower Child Mortality 37

Achieving The MDGs in India's Poor States
-p--p-----m--̂ --I-
Factors underscored by quantitative data*
Age of mother at first birth
Summarizing the evidence
1 "_____^
Neo-natal Infant Under 5 mortality mortality year
mortality
Weak Moderate Weak
7.2 Table 7.1 (above) and Table 7.2 (below) summarize the evidence discussed in previous chapters, and begin to tease out those factors, practices, and services which have the biggest impact on child mortality. Table 7.1 uses the same framework introduced earlier in chapter 4, but narrows the l i s t to those factors which are validated by the Orissa specific data. This table i s organized into four quadrants or spheres with each sphere representing an important segment o f the production function of child survival. But while shown as separate spheres there are significant interactions and inter-dependences across all o f them, and they are best seen as four parts o f an integrated whole. Table 7.1 captures the variables contributing to all levels of child mortality, and Table 7.2 breaks the analysis down into neo-natal, infant and under 5 mortality. Table 7.2 further builds on the regression results (presented in the annex tables A8-10) and as such i s able to suggest the strength o f the relationship - defined here as strong, moderate or weak - for those variables for which RCH household data are available.
-* -----, .---.--- Notes: * See Tables A8 (under five mortality), A9 (infant mortality) and A10 (neonatal mortality) for detailed regression results, which i s the source o f classification o f strong, moderate and weak, + Van Di l len study in Bolangir District, and other qualitative data. Since these qualitative studies do not have sufficient measurement to classify the strength o f the effect, we have use moderate throughout.
Conclusions and Policy Implications - The Roadmap to Lower Child Mortality 38

Achieving The MDGs in India’s Poor States
What interventions are needed?
7.3 One o f the striking features o f the factors, practices, and services i s their multi-sectoral nature, and the importance o f actions in four separate, but closely related domains (the individual woman, family, community and service delivery). As such, progress with reduction o f child mortality depends on a wide range o f actors and actions. As “producers” o f good health outcomes for themselves and their babieskhildren, individual and household behaviors are central to child survival; the income and wealth o f households, community support systems, and nutrition, education, the environment, water, sanitation and a variety o f other factors are all relevant in the quest for falling child mortality. Some o f these factors also present themselves as obstacles to accessing healthcare critical to a healthy pregnancy and childbirth, including financial and physical barriers such as an all-weather road, distance to a health facility or the costs associated with getting there. On the supply side, a whole set of variables can undermine the effectiveness o f care when i t i s sought, for example getting access to healthcare providers in a timely fashion, knowing ahead o f time the payment schedule (should it apply), the availability o f medicines, provider performance and appropriate treatment.
7.4 Building on the evidence we can narrow the l i s t o f important interventions to a short-list o f twelve. We have further divided these into three categories: relatively quick and easy to implement; more involved and needing more time; and those requiring a longer time horizon. These are presented in Table 7.3.
7.5 These interventions are clearly quite different in nature, span a very varied time-frame, and involve different levels and types of resources. Also, as illustrated in Table 7.3, the role o f these interventions varies across neo-natal, infant and child mortality and as such the optimal mix o f interventions could change depending on the mortality profile. For example, a district with high post-neonatal mortality (such as Koraput) might need to place equal emphasis on the interventions in the right hand column o f the table, whereas a district with high neonatal mortality but low post-neonatal mortality (such as Khorda) might need to place more emphasis on interventions in the f i r s t column.
7.6 B y way o f illustrating the potential impact of different interventions on reducing infant and child mortality, we have undertaken some simulations with the RCH data. Starting with the results o f the regression for infant mortality (Annex Table A9) we selected those four policy variables which are thought to have a significant impact on reducing infant mortality. These are girls post-primary education, household income, birth spacing and all-weather road. We then raised the value o f these key variables - for example, assumed that all women o f child bearing age have post-primary education, or all households have access to an all-weather road - while everything else stays the same, and assessed the impact o f this on reducing infant mortality. In this exercise the decline in infant mortality i s attributed directly to the policy change and ignores any behavioral change as a response to the policy change. This might lead to an over-estimation o f the positive effect o f the policy change.35 The results are summarized in Table 7.4 (for three scenarios) and figure 7.1 (one scenario). 36
35 Lee, Rosenzweig and Pitt, 1997. 36 Similar exercises have been undertaken for all-India, for example, by van der Klaauw and Wang (2004), and Deolalikar (2004). In their paper, Subbarao and Raney (1995) find a reduction o f 25 infant deaths per 1000 live births from a doubling o f the female secondary school enrollment in a set o f low-income countries.
Conclusions and Policy Implications - The Roadmap to Lower Child Mortality 39

Achieving The MDGs in India's Poor States
Table 7.3: The Multi-Sectoral Menu o f Interventions, ranked by difficulty and time- horizon
Conclusions and Policy Implications - The Roadmap to Lower Child Mortality 40

Achieving The MDGs in India’s Poor States
Roportion of households with access to all weather roads Roportion of mothers with a birth spacing of 24 to 48 months
3t Wealth index
Table 7.4: Simulated reductions in Infant Mortality from changes in four policy variables: Number of infant deaths prevented
D o u E n g the value of the indicator from its RCH2
Education level of women o f child bearing age: at least completed primary school Poverty - as measured by the wealth index Birth spacing of more than 24
level
9
11
8
y_-II_p
Notes: Present values of indicators are as follows: at least pi
Raising the value of the indicator to the level observed in “best” district
9
13
2
2
26 64
38
41 nary education, 34%
Utopia: raising the value of the indicator to 100%
23
n.a.
10
3
35 64
29
41 f women; all-weather __I__I_x”~~c_-L.yL-;__yI _x-
road, 54% of villages; births spaced at more than 24 months, 28%.-“Best” districts are as follows: schooling (Cuttack); Wealth index (Khurda); Proportion of mothers reporting a birth spacing of more than 24 months (Nuapada); Proportion of households with access to all weather roads (Cuttack).
Figure 7.1: Simulated reductions in Infant Mortality from changes in four policy variables: Number of infant deaths prevented
8 -2 9 7-
-4
CT t: -6
c -8
&
r a .-
YO chanae in variable
Note: change i s variable i s by +lo% intervals, reaching 100% (Le., doubling) at the right hand end.
7.7 Perhaps the most striking conclusion from this exercise i s that, on paper, the infant (child) mortality goal associated with the MDG 2015 targets i s achievable for Orissa. One policy variable alone - post-primary schooling o f girls - wi l l go along way to achieving the child
~
Conclusions and Policy Implications - The Roadmap to Lower Child Mortality ~
41

Achieving The MDGs in India’s Poor States
mortality goal (as well as achieving the two education MDGs). Combining t h i s strategy with those interventions which enable girls’ schooling to have i t s intended payoff vis-&vis lower child mortality, Le., improved nutrition, access to quality health services, information on the value o f environmental hygiene and cooking practices, safe water, etc., should have a significant effect. Further combining the other policy variables from Table 7.4 - reducing poverty, in particular raising incomes among the poorest, improving the all-weather road network, and critical elements of the RCH program (birth spacing, exclusive breastfeeding, trained mid-wife/doctor at birth) - would further complement the schooling effect.
Existing interventions - what are they doing?
7.8 Together, the Government o f India and the Government o f Orissa support a very rich policy agenda covering many o f the priority areas identified in Table 7.3. In the past year alone a number o f major new initiatives have been launched by GoI, including the Rural Health Mission, a second Reproductive and Child Health Program, the Rural Employment Guarantee Scheme, and a rural infrastructure program. These complement other centrally sponsored schemes in the area o f nutrition (PDS and ICDS), education (SSA), and vector borne diseases (including malaria). At the state level, there i s a whole host o f programs including “missions” for rural drinking water and sanitation, a women’s empowermenthural credit scheme (Mission Shakti), school scholarship program for ST/SC girls, an IMWneo-natal “mission”, and the Orissa Health Sector Program. Table 7.5 presents a summary o f the policies and programs for the priority interventions. The table also offers a summary situation analysis o f the policies and programs.
7.9 National Rural Health Mission. One o f the most important new initiatives o f the Government o f India i s the National Rural Health Mission (NRHM). The program focuses on 18 states in which the public health indicators are poor. As such i t includes Orissa. The goal o f the program i s to support the reduction of infant and maternal mortality, further reduce fertility and achieve a major reduction in the prevalence o f many diseases, through the provision o f universal access to services in health (women and child, immunization), nutrition, water, and sanitation. NRHM was launched in Orissa in June 2005, and following the preparation o f a state-wide plan, district level plans are underway. Major elements o f the program include a new community health worker - ASHA, various financial incentive schemes (for patients and the ASHA), the creation o f village health and sanitation committees, strengthening o f public health infrastructure and provision of mobile medical units for remote areas, convergence o f various vertical health programs under one umbrella, close collaboration with nutrition programs, total sanitation campaign and rural water mission, and greater emphasis on monitoring outputs and outcomes. The program also seeks to work closely with Panchayat Raj institutions - including a Rs. 10,000 fund into a joint account, ANM/Sarpanch, for minor repairs and maintenance at health sub- centers - as well as with NGOs and the private sector
Conclusions and Policy Implications - The Roadmap to Lower Child Mortality 42

Achieving The MDGs in India’s Poor States
Table 7.5: Existing Interventions in the Priority Areas: A Scorecard *-_̂ -______I_Lz_IyI--,,-,------ --p-?a--”“pM-
Intervention Core Elements Situation assessment
Poverty reduction Income Growth promoting policies increasing Women’s empowerment Wide-scale SHG movement, Mission Shakti,
promising, but needs more support (viz. AP)
retention and quality; scholarships for some SC/ST girls in place
Education Schooling o f girls Rapid enrollment expansion, but issues o f (esp. post-primary)
Maternal and Child Health Services Ante-natal care R C H program, supplemented by NRHh4
State and district plans; convergence o f services being promoted; ASHA Few home births attended by trained attendant: training o f TBAs Upgrading o f CHCsPHCs underway; R C H promoting institutional deliveries but unreliable and poor quality service
Static coverage, needs new push Many barriers to accessing health services, physicaUfinancia1; quality o f care variable.
Birth (home)
Emergency obstetric and Newborn care
Post-natal care Few home visits Immunization Treatment o f sick child
Home Care of Mother and child Pregnandnursing woman Many good practices, but room for
Baby/young child Improvement: IECBCC
Hygiene practices (whole family)
BCC needs much more focus; linkages with water, food, etc. need attention
Nutrition Maternal nutrition (indirect) TPDS/AAY - poor targeting (direct) ICDS/SNP - limited impact Insufficient IEC on diet, colostrum, early And exclusive breastfeeding
Breastfeeding/weaning
Micronutrient supplements Variable coverage
Water Piped connections to homes Rural water “mission” More safe water IEC needed
Sanitation Hygiene practices
Environment Indoor air pollution
Malaria control
Total Sanitation Campaign Heavy infrastructure focus; more BCC needed PDS kerosene/electrification not reaching the poor Malaria program - needs big push on Preventative side, esp. bed nets
Roads All weather access New NREGS program offers potential to improve access in remoter parts
- - “ - ~ ~ - ~ ~ ~ ~ - - ~ ~ - - ~ - ~ - e---”*- x I I
Conclusions and Policy Implications - The Roadmap to Lower Child Mortality 43

Achieving The MDGs in India's Poor States
Building on the 2001 IMR Mission and launched in 2005, Navajyoti i s an initiative of the Orissa State Government to strengthen community based care aimed at reducing neo-natal mortality. In recognition of the intra-state variation with mortality rates, the program focuses on 14 high infant mortality districts, but plans eventually to expand into a l l districts (under RCH2). Core elements of the home based care of mother and child program include: every delivery i s attended by a skilled birth attendant (including dais, suitably trained in hygiene, care of the new-born and mother, and identification of the need for emergency obstetric and newborn care), improved ANC and birth preparedness, home visits of the newborn, upgraded maternal and child services at Block PHC/CHC and referral hospitals, promotion of chemoprophylaxis and insecticide treated bed-nets for protection against malaria, and fixed monthly health and nutrition days (for ANM, Anganwadi and dais - and now including ASHA). The
s and PRIxo= -----__ I ._E --...-.- I * I I -"I
also aims to l i nk2 with the Mission Shakti self-he --̂---- -- . ~ _ _ I ~ ~ ~ - - ~ __
7.10 Overall, i t could be concluded that Orissa i s adequately provided for in terms o f the essential policies and programs needed to bring about a further reduction in infant and child mortality. Moreover, some o f the shortcomings identified by past reviews - such as inflexible centrally sponsored schemes and over-centralized planning, lack o f attention to state and district heterogeneity - are being addressed in the new programs. But there are problems and major challenges.
First, while there may be a perception in federal and state government circles that there i s a full array o f policies and programs to address the multi-sectoral nature of child survival, the reality for people l iving in the remoter rural areas i s quite different. In parts o f Orissa there i s a near absence o f services: public service providers and critical supplies are often absent (due to both a shortage o f providers and weak governance o f resources in the system), private providers are few due to limited market sizehahe, and there are relatively few non-governmental agencies. Heavy seasonal rains and poor infrastructure present additional barriers to regular service provision in rural Orissa. But it i s not just a problem o f physical access and fickle service suppliers. The poor are often faced with significant costs (user charges) when accessing public services, especially health services. A study undertaken in Bolangir District recently found fee for service arrangements in place with Anganwadi workers (for ante-natal care), A N M s (attending births), and in government medical facilities (for many services). Moreover, patients reported not only facing considerable expenses in seeking healthcare from a government facility but were also exposed to a great deal o f arbitrariness and i l l -w i l l at the time o f seeking medical care. The challenge to expand and sustain effective coverage/out-reach o f services to Orissa's interior districts and scattered populations - in particular the ST population - cannot be understated. Adauting programs to different situations and needs, and considering different delivery strategies - especially involving communities, local governments and NGOs - steps recently initiated by the Orissa Government - seem promising areas. Second, some service providers are carrying too many responsibilities and their impact on any one priority i s limited. A good example would be the Anganwadi worker who i s the frontline service provider o f many programs for women and children. Although such an arrangement helps promote convergence across programs, one person can only do so much. The advent o f a second community based worker under the Rural Health Mission - the ASHA - i s a good initiative and should help free up time for the Anganwadi worker to focus her core responsibilities. Line management o f the two different functionaries - who report to two different government departments - wi l l remain a challenge. Introduction o f fixed health and nutrition days, at which service providers from different
Conclusions and Policy Implications - The Roadmap to Lower Child Mortality 44

Achieving The MDGs in India’s Poor States
line departments converge in a village and provide integrated services i s one initiative to overcome this problem. Another i s the increasing involvement o f PRI bodies in the oversight o f local service delivery. Third, building on recent efforts to respond to national and state level heterogeneity, further sharpening the focus on those districts and blocks where child mortality i s highest, and varying the “input package” o f centrally sponsored schemes to reflect local conditions and the relative levels of neonatal, infant and child mortality i s s t i l l needed. Preparing district (and block) plans, empowering communities and decentralizing resources, responsibilities and accountabilities to local government are all core elements o f getting the right mix. Fourth, too many programs are run as self contained “silos” and m i s s critical synergies: too often potential synergy i s lost due to complementary inputs occurring at different times and in different places. There are, for example, strong potential complementarities across sectors, such as those between health and nutrition, or between supply-side investments in service delivery and demand-side benefits from community mobilization. Finding ways to achieve greater inter-sectoral integratiodconvergence in order to benefit from the strong positive interactions across sectors and across programs should be given higher priority than launching any more new programs. The example o f ANKUR, a joint initiative o f the Orissa Government, and UNICEF i s an interesting attempt to promote more multi-sectoral collaboration. The final area where the existing array o f government policies and programs might be considered lacking i s the strong emphasis given to supply side and hardware interventions at the expense o f insufficient attention to demand side,” the soft side o f services”, information and behavioral aspects. A quick survey o f existing interventions in Orissa (Table 7.5) finds the need for more emphasis on IEC, BCC in a number o f programs (especially water and sanitation), a greater focus o f promotive/preventative healthcare o f women and young children, and support to individuals, households and communities to demand and access services.
0
0
Box 7.2: Joined up thinking, joined up action, The Case of ANKUR
ANKUR i s a joint initiative o f the Government o f Orissa and UNICEF, under implementation in the District o f Koraput (one o f the poorest Kl3K districts). I t has four inter-related goals:
Improve the quality o f education for tribal children and girls Improve nutrition and development o f children under 3 years o f age Improve infant survival
0 Support implementation o f state-wide reforms for rural drinking water and sanitation.
At the heart o f the program i s the District Plan o f Action for the young child, which identifies where action i s needed and by whom. There are no new activities, but rather a focus on establishing functional linkages between existing programs to maximize their impact for the young child. This involves joint planning, implementation, and assessment aimed at changing community and family level behavior, strengthening service delivery, and ensuring strong interface between community and service providers. District level coordination i s replicated at block, Gram Panchayat and village levels.
ANKUR was launched in 2004 and i s a four year program, covering al l blocks in a phased manner. The bulk o f activities involve support for micro-planning, capacity building and training o f front-line functionaries, and frequent coordination meetings. In two pilot blocks additional support for implementation o f integrated actions in health, water and sanitation, education, child development and nutrition i s also envgised.
“ ‘ - ~ - ~ - w * - - - ~ - ~ - - ~ --~,--, -~~,--.--- ------___ ~
~~
Conclusions and Policy Implications - The Roadmap to Lower Child Mortality ~
45

Achieving The MDGs in India’s Poor States
Putting it all together: What might a child mortality reducing program look like?37
7.11 In so far as child mortality i s linked to multiple determinants, there i s a compelling for a more holistic, or integrated approach designed to bring to bear all relevant factors in one place at one point in time. But a “one size f i t s all” approach w i l l not work: it: what i s needed for one situation may differ from what i s needed in another situation. As such, a range o f interventions should be considered depending on local conditions and ideally subject to close monitoring and periodic evaluations in order to provide feedback on what i s working. In addition, in order for local preferences to be demonstrated purchasing power to “pick and mix” from the various interventions should be place with individuals and communities wherever possible. This could be in the form o f vouchers or block grants, for example. This approach speaks to “thinking multi- sectorally, acting locally”.
7.12 One should also be mindful of the danger that trying to address everything in one package becomes diffused and unwieldy, and impact i s minimal. Asking ourselves the following set o f questions i s key: “of which sectors does i t make the most sense to develop linkages and what benefits do these linkages produce; do these linkages add value over and above what these sectors are already doing on their own - and/or could be doing if better implemented; and which linkages are likely to be most cost-effective”. Moreover, to be effective, multi-sectoral action requires the cooperation and coordination of a variety o f actors and stakeholders. Many o f these requirements run counter to public sector culture and practice in India, and as such present another major hurdle. This leads us to “thinking multi-sectorally, acting locally and selectively”.
7.13 The Orissa state government has constituted a cross-departmental committee to bring together the various sectors which have a role to play in addressing child mortality, under the leadership o f the Development Commissioner. This an important step forward in acknowledging the multi-sectoral nature o f child mortality. Moving forward, G o 0 w i l l need to consider alternative mechanisms to deliver any new and additional interventions. Given the importance o f focusing energy at the local level, and reaching out more effectively to poor households and communities, working in conjunction with Mission Shakti (the self-help group movement) PRIs and NGOs would seem central to the design. The Orissa Poverty Reduction Mission i s another promising organizational model to deliver on a multi-sectoral program.
7.14 Building on the above, a new such program could be organized into two groups o f activities: (i) cross-cutting support to enhance individual and household behavior and promote demand for services, and (ii) innovative service delivery strategies involving public and private sectors, and NGOs, together with mechanisms that support greater accountability. These are detailed below.
I. Cross-cutting Support to Promote Behavioral Change and Enhance Demand
a. ZEC/BCC - a substantial package o f activities to increase knowledge, awareness and practices regarding behaviors that have a significant impact on child mortality. This might involve hygiene (hand washing with soap), water, sanitation, indoor air pollution (use o f clean fuels, improved ventilation), malaria (use o f bed nets), nutrition and feeding practices, early diagnosis o f medical problems, and service provision (what, where and how). These messages would be designed for a variety o f stakeholders, viz. households, community leaders, PRIs, SHGs, and government
37 This potential program design flows in part from a World Bank TA mission to Orissa in February 2006.
Conclusions and Policy Implications - The Roadmap to Lower Child Mortality 46

Achieving The MDGs in India’s Poor States
functionaries. This would build on the new right to information bill and citizen charter, and aim to take information to women in their villages and homes through a variety o f media.
b. Addressing poverty and demand for critical child survival inputs. Many o f the interventions identified as high priority involve a financial outlay on the part o f households. Included here would be food (quantity and variety), cooking fuels other than wood or dung, soap for hand washing, insecticide treated nets, costs involved in sending (girl) children to post-primary school together with the transport and user charges incurred when using either public or private health services. The absence o f resources to meet these costs leads women and their families to adopt strategies which have dire consequences for their own health and that o f their children.
In the long-run, poverty reducing economic growth should address these problems, although the extent to which growth w i l l penetrate the remote rural areas where the extreme poor l ive i s an open question. But, in any event, shorter-term action i s called for and there are a number o f instruments that can be used to provide financial support to poor households. Vouchers, stipends, scholarships are examples of instruments which provide poor people with additional purchasing power for key services. India’s own JSY38 i s an example o f a scheme designed to ease the financial constraint which prevents pregnant women for giving birth in a hospital. Another instrument i s the conditional cash transfer (CCT). This instrument has been successful in Latin America (especially Mexico) and i s gaining interest elsewhere in the world. A CCT could support two critical aspects o f child survival. The cash transfer to eligible women would help address income poverty and the various ways in which it manifests i tsel f into sub-optimal behavior, including the early return to wage employment be and the cessation o f exclusive breast-feeding. B y combining the cash transfer with rewired actions on the behavioral side, the program would support attendance at information, education, and training programs (such as promoting better hygiene and feeding practices, as detailed in a. above) as well as possibly full utilization o f ante-natal, birthing and post-natal services, growth monitoring o f babies. (This would require improvement in the provision o f services, behaviors of service providers, and other complementary actions.) The program could be started as a pilot in a few o f the poorest blocks, be accompanied by a robust effort to improve services, and include a monitoring and evaluation framework to allow for a critical review o f i t s effectiveness. Over time it could expand to provide support to families with post- primary aged girls who struggle to afford schooling, given the very strong effect of secondary education on maternal and child health. (See Box 7.3 for further details).
11. Innovative Service Delivery Strategies - getting services to poor women
c. Community Znvestment and Innovation Fund (CIIF). This could be managed by a consortium o f SHGs and front l ine service providers (ANM, Anganwadi, ASHA, RWSS), and would provide a pool o f flexible funding to support local area
38 Janani Suraksha Yojana (JSY) i s an initiative under the National Rural Health Mission whereby a cash grant i s paid to all BPL women upon the delivery o f a live baby. An additional payment i s made to mothers who deliver in health facilities. ASHAs supporting women during their pregnancy and at the time o f their delivery also receive a payment under the scheme.
Conclusions and Policy Implications - The Roadmap to Lower Child Mortality 47

Achieving The MDGs in India’s Poor States
innovation and initiative. The funds could be channeled through PRIs in the form o f block grants. Some examples of activities that might be funded through the CIIF include:
More significant supplemental nutrition for pregnant and lactating mother. Health risk fund, a combination of savings and subsidy, to meet costs of health care/health insurance for the poor, especially at time o f delivery. Bulk purchase o f insecticide anti-mosquito nets for pregnant women and young children in high risk areas. Supplementary maintenance of AWC, health sub-center and provision o f missing essential supplies; adequate water and sanitation. Improved community water source and training o f community in water quality testing and monitoring. Support towards cost of individual household latrines (IHL) for poorest of poor families (with bonus scheme for communities which achieve full elimination o f open defecation). Scholarship scheme for ST girls where heavy drop-out from primary school i s a pro b 1 em .
d. Strengthened Service Delivery (hardware and software) by line departments - selective investments in a number o f areas such as:
Support for front l ine service provision in key sectors (health, nutrition, hygiene, water and sanitation); rotation o f workers, additional training, etc. Build up functional referral capacities for child and maternal health outcomes with investment, restructuring, incentives. Management contracts for running of health facilities and other public-private partnership innovations. Measures to address lack o f motivation and instill drive for performance in government functionaries, measure and reward results. Strengthen supervision, training, and management especially at district and block levels. Case manager to support poor womedfamilies derive services from public health facilities, especially at the time o f the infant’s birth - services from which they are often excluded. Seasonality - additional out-reach care for babies born in the rainy season (July, August, September) and the cold months (November-January).
e. Modification to some service provision packages, e.g., ICDS, to give greater priority to under-malnutrition in 0-36 month age children, including exclusive breast feeding and micronutrient supplementation; also women’s nutrition status before, during pregnancy and in early months after birth; targeting RWSS to areas with greatest epidemiological need; pilot measures to address indoor air pollution reduction.
f. Technical support and training to SHGs and PRIs for performance monitoring o f service providers, promoting greater accountability through instruments such as scorecards; also to encourage greater participation o f other institutions, e.g., NGOs, universities, in social audits.
Conclusions and Policy Implications - The Roadmap to Lower Child Mortality 48

Achieving The MDGs in India’s Poor States
g. More evidence-based Planning, Monitoring and Evaluation - support for data collection to underpin evidence-based planning, including at the local, operational level as well as at district and state level; also to support monitoring and evaluation o f inputs and activities v i s - h i s child mortality outcome goals. Support would be provided for capacity building in (local level) data analysis and planning as well as data collection.
7.15 Many o f these areas would require considerable background work to assess their feasibility and to undertake costing. In so far as there are similar activities underway in other states - for example, integrated child development pilot project in Madhya Pradesh, an information campaign for school management committees in Uttar Pradesh, a PRI block grant program in Karnataka, community-based development program in Andhra Pradesh - as well as useful pilots in Orissa (such as ANKUR) - a detailed review o f these would enhance the knowledge base. Finally, there i s growing experience from around the world with multi-sectoral programs, especially regarding nutrition and HTv/AIDs, which offer important insights into elements and strategies associated with success.
Conclusions and Policy Implications - The Roadmap to Lower Child Mortality 49

Achieving The MDGs in India's Poor States
" _ _ - " - Box 7.3: A conditional cash transfer for Maternaland
Conditional cash transfers (CCT) combine more traditional cash transfer programs with financial incentives for families to invest in human capital. Typically, cash transfers are disbursed to poor families conditional on the household engaging in a set o f behaviors deemed important for human capital formation. While most CCTs have focused on children's formal education, a few in Latin America have addressed malnutrition and high morbidity/mortality. Mexico's quite famous CCT program (Progresa -0portunidades) provides a cash transfer contingent on (i) family members using preventive health services, (ii) children aged 0-5 and lactating mothers attending growth monitoring clinics and receiving nutrition supplements as well as nutrition and hygiene education; and (iii) pregnant women attending prenatal care clinics (as well as other elements, including schooling). Studies o f the Mexico program show significant improvement in the health o f both children and adults, and for purposes o f this paper, a reduction in child mortality (Gertler, 2004; Bardhan, 2004). For example, one municipality with full coverage o f PROGRESA-Oportunidades experienced a drop in i t s infant mortality rate to a level 11% lower than it would have had without the program. Other low income Latin American countries, such as Honduras and Nicaragua are also experimenting with CCTs for health and nutrition.
In the case o f Orissa, one could imagine a CCT designed to improve the nutrition and health status o f pregnandlactating women and their young children. The cash transfer would help address (income) poverty and could support a number o f actions associated with child mortality, viz. better maternal nutrition, costs of getting ANC, hiring a trained birth attendant and delivering in a medical facility (transport and user charges), exclusive breastfeeding for 6 months - postponing the return to wage labor, purchase o f insecticide treated nets (against malaria), cleaner cooking fuel, and soap for hand washing, to name just some.
On the side of behavioral change, the transfer could be conditional on some o f the same elements as the Mexico program (listed above) - at least three ANC, T T (only from recognized service provider); birth attended by trained person; post-natal check-ups, growth monitoring o f babies and young children - as well as attendance at information and education sessions addressing use o f anti-malarial measures, clean cooking fuels, personal hygiene, exclusive breastfeeding and maternal and child nutrition. In order to promote the desired behavioral changes, the CCT would need to be accompanied by lots o f IEC and BCC.
The program could be geographically targeted to the districtshlocks with the highest mortality rates, and further targeted to the poorer sections o f society. Targeting criteria would need to be carefully considered. In those communities where the SHG movement i s strong, this could be part o f the targeting methodology (as it used in the IKP project in Andhra Pradesh).
Monitoring o f actions and behaviors are an important part o f the program design. Here there would need to be balance between promoting the desired home behaviors (such as hand washing and use o f insecticide treated bed nets ) and those actions which can be monitored by a third party.
The level o f payment and the duration o f payment would need careful consideration too, but a payment for at least one year (from minus 6 months o f birth to age 6 months) - ideally longer - would seem sensible. Given the seasonal dimension o f infant morbidity and mortality noted in this paper, a seasonal emphasis o f the program would be desirable.
A crucial element o f the success o f the CCT would be significant improvement in the supply o f services. This would be both out-reach IEC/BCC programs as well as in-situ ante-natal, maternal and child care programs. Some o f the measures supported by the rural health mission (such as JSY, incentive system for ASHA) Eesent an e llent startingpoint, but mu ore would need to be done. - ̂.' --* - I - ----~-- 1 " " " * ^_ I * _ _-._ /.=- --.-"- - ~1~ lj__ I-* - " ~ ~ ._
Conclusions and Policy Implications - The Roadmap to Lower Child Mortality 50

Achieving The MDGs in India’s Poor States
BIBLIOGRAPHY
CARE India: Lessons from the Early Learning Phase of INHP 11. January 2004
: Newborn Care at the Community Level
De Haan, A. and A. Dubey. 2005. Poverty Disparities or the Development of Underdevelopment in Orissa. EPW. May-June 2005.
Deaton, A. and Jean Dreze. 2002. “Poverty and Inequality in India: A Re-examination.” Economic and Political Weekly, September 2002.
Gertler, Paul. “Do conditional cash transfers improve child health? Evidence from Porgresa’s Control Randomized Experiment”. In Health, Health Care and Economic Development, Vol. 94. No. 2, May 2004.
Government of India: 2001. Census 2001.
: 2002. BPL Census
. 2006. Formulation of District Health Action Plans : Process Manual. National Rural Health Mission. Ministry of Health and Family Welfare. June.
Government of Orissa: Human Development Report 2004
: ANKUR - Linkages for the Young Child, May 2004.
: 2005. Orissa Health Sector Plan 2005-2010.
: Navajyoti: A strategy to improve maternal and child care with focus on prevention o f neonatal mortality and morbidity. April 2005.
Guillot, M. and Gupta, S. 2005. “Water Access, Household Sanitation and Child Survival in India”. Mimeo.
Hughes, G. and Dunleavy, M. 2000. Why do babies and young children die in India? The role of the Household Environment. Mimeo.
International Institute for population Studies. (2001). Reproductive and Child Health Project. Rapid Household Survey (Phase 1 and 2). 1998 and 1999.
Conclusions and Policy Implications - The Roadmap to Lower Child Mortality 51
Achieving The MDGs in India’s Poor States
Jalan, Jyotsna and Martin Ravallion. 2003. Does piped water improve child health for poor families in rural India? Journal of Econometrics, 112: 153-173, February 2003.
IFPRI. Final Report on the Impact of Progresa on Health. November 2000.
Luby et al. 2005. “Effect to hand-washing on child health: a randomized controlled trial”. The Lancet. Vol. 366, July 2005.
Mackinnon, J. 2002. Assessing the Impact of Fiscal and Structural Reforms on Poverty in Orissa. Oxford Policy Management.
Millennium Project. 2005. Who’s got the power? Transforming health systems for women and children. UN Task Force on Child Health and Maternal Health. Mishra and Retherford. 1997.
National Commission on Population, Reproductive and Child Health Surveys 2002 and 2004.
Pandey, A. and Choe, Luther, Sahu and Chand. 1998. Infant and Child Mortality in India. National Family Health Survey Subject Reports, Number 11, December 1998.
RTI International. 2005. Environmental Health Impacts of Water Supply, Sanitation and Hygiene Interventions in Rural Orissa, India. Final Study Protocol.
The Lancet. 2003. Special edition on child survival. Summer 2003.
Van Der Klaauw, B. and Wang, L. 2004. “Child Mortality in Rural India”. Mimeo.
Van Dillen, Suzanne. 2006. Child Health and Mortality in Western Orissa: A report based on a longitudinal Household Survey in Bolangir District. University of Bonn. Mimeo.
World Bank. 200 1. Poverty Reduction Strategy Paper Sourcebook. 2”*. Edition.
. 2004. India: Attaining the Millennium Development Goals in India.
. 2004. The Millennium Development Goals for Health: Rising to the Challenges
. 2004. Reaching out to the Child: An integrated Approach to Child Development.
. 2004. Water, Sanitation and Hygiene: interventions and diarrhea. A systematic review and meta-analysis. HNF’ Discussion Paper. August 2004.
. 2005. Health, Nutrition and Population Sector in Orissa. A policy note.
World Health Organization. 1997.
Conclusions and Policy Implications - The Roadmap to Lower Child Mortality 52

Achieving The MDGs in India’s Poor States
ANNEX TABLES
Annex Tables 53

Achieving The MDGs in India’s Poor States
ate*District, RCHI and I1 - I_ -” ~ ~ - I l - _ _ _ _ _ _ l - ~ - - ~ ~~~
Districts ranked by Child Infant Infant Neo-natal Child Mortality - lowestto highest, Mortality from RCH2 Rate,
1. Balasore 2. Sambalpur 3. Cuttack 4. Khurda 5. Bhadrak 6. Jagatsinghpur 7. Deogarh 8. Puri 9. Dhenkanal 10. Jharsuguda
12. Mayurbhanj 13. Bargarh 14. Sonepur 15. Nayagarh 16. Boudh 17. Ganj am 18. Kendrapara 19. Jajpur 20. Nuapada 2 1. Sundargarh 22. Bolangir 23. Kandhamal 24. Kalahandi 25. Gajapati 26. Keonjhar 27. Nabarangpur 28. Koraput 29. Rayagada 30. Malkangiri All districts
11. Anugul
87 67 46 60 51 85 68 51 53 81 61 96 75 81 47 90 93 66 63 88 84 78 87 92 111 73 71 93 101 122 77.0
Mortality Rate, RCH2
45 40 45 51 44 50 42 56 53 59 52 53 54 61 52 70 71 70 71 67 64 76 69 69 58 68 74 69 88 100 64.0
mortality rate
RCH2 36 37 33 46 29 31 35 38 46 46 42 38 36 47 45 63 46 53 51 52 55 58 57 50 31 39 48 37 49 48
44.3
Mortality Rate, RCH2
46 49 49 54 56 56 57 58 60 62 64 65 68 68 72 72 74 78 78 79 79 79 80 80 81 84 88 93 118 124 73.4
Annex Tables 54

Achieving The MDGs in India's Poor States
Marriage before 18 Proportion of years of age Births at home
Districts mothers literate (%) (%I (%I
Angul Balasore Bargarh B hadrak Bolangir Boudh Cuttack Deogarh Dhenkanal Gaj apati Ganj am Jagatsinghpur Jajpur Jharsuguda Kalahandi Kandhamal Kendrapara Keonjhar Khurda Koraput Malkangiri Mayurbhanj Nabarangpur Nayagada Nuapada Puri Rayagada Sambalpur Sonepur Sundargarh
RCH I 35.9 49.6 39.3 47.7 22.8 28.9 62.1 40.6 47.7 21.7 29.3 62.7 49.5 43.6 16.7 19.4 61.5 32.0 61.6 13.6 10.6 33.1 11.4 44.1 15.2 52.9 29.1 40.3 31.4 44.7
RCH I1 63.4 63.0 44.5 57.7 40.1 56.2 70.5 51.7 61.8 34.3 45.0 72.4 55.6 56.7 35.0 39.8 67.8 45.4 71.5 33.0 13.3 48.8 32.8 57.8 31.6 67.9 31.1 52.4 48.1 48.2
R C H I R C H I I R C H I 40.0 83.6 28.4 84.8 59.8 77.6 17.7 80.7 57.7 87.1 50.6 88.0 10.6 59.5 33.3 80.7 36.6 71.2 41.8 88.1 50.7 77.1 9.2 64.7 14.7 71.2 17.8 65 .O 59.4 89.6 41.6 87.7 15.8 78.5 30.1 81.4 23.4 44.7 64.7 89.4 56.0 92.6 32.6 84.8 69.5 92.8 53.5 69.0 42.5 92.6 14.0 61.5 38.5 80.4 29.5 70.8 39.2 86.2 17.0 65.5
RCH I1 62.1 69.0 66.4 62.9 61.1 65.6 47.8 67.6 52.0 78.7 67.3 35.5 63.4 62.8 69.4 65.4 57.7 77.7 44.3 80.7 89.7 65.4 71.3 60.5 76.1 39.4 81.4 53.8 68.1 62.5
Annex Tables 55

Achieving The MDGs in India’s Poor States
Table A 2 (cont): Trends in Breastfeeding and Immunization, yI RCH 1 and I1
Children breastfed within 2 hours of Children 12-24 months
birth fully immunized Districts (%I (%I
Angul Balasore Bargarh Bhadrak Bolangir Boudh Cuttack Deogarh Dhenkanal Gaj apati Ganj am Jagatsinghpur Jajpur Jharsuguda Kalahandi Kandhamal Kendrapara Keonj har Khurda Koraput Malkangiri Mayurbhanj Nabarangpur Nayagada Nuapada Puri Rayagada Sambalpur Sonepur Sundargarh
RCH 1 7.6 14.3 13.1 8.2 11.3 13.7 11.3 12.1 9.9 13.2 12.1 16.9 7.7 11.3 18.8 31.4 12.7 8.2 8.9 12.8 9.5 22.4 23.5 9.3 21.9 12.1 16.5 20.8 9.9 21.2
RCH I 1 29.2 54.5 29.7 40.9 40.4 52.2 50.1 35.7 53.5 56.7 49.7 43.2 43.5 34.4 44.6 40.2 55.5 38.4 42.1 43.5 49.7 48.0 43.3 41.8 36.8 61.7 40.1 27.2 49.3 54.2
R C H I* 68.9 51.0 64.0 54.7 72.2 50.8 70.5 53.2 71.3 59.8 37.6 58.6 56.2 79.8 54.9 67.7 53.9 45.8 61.2 55.1 50.0 55.2 28.1 65.1 52.4 61.1 56.0 76.6 66.7 80.3
RCH I1 56.7 73.5 70.8 54.0 65.1 69.5 86.5 48.4 60.2 46.2 53.2 45.8 36.9 70.5 49.9 59.4 58.1 35.3 59.2 31.0 39.9 46.0 44.8 62.3 42.9 73.0 46.0 72.4 60.4 59.0
13.9% 44.8% 57.8% 55.4% _I_--p-
Total
Annex Tables 56

Achieving The MDGs in India’s Poor States
Table A3: District-wise Child, Infant and Neo-natal mortality Women’s Education and E t h n i c i t G C H I1 Districts --* r a n k d c v e r t y Districts Women’s Ethnicity :
ranked by Neonatal Infant Child education: % of household mortality Mortality mortality % with at population
wealth index rate Rate rate least who is (wealthiest to primary scheduled
poorest) schooling tribe
---- --a- --
Cuttack Puri Angul Khurda Balasore Ganjam Dhenkanal Jagatsinghpur Sambalpur Nayagada Jharsuguda Sundargarh Kendrapara Jajpur Bhadrak Boudh Bolangir Gajapati Rayagada Koraput Bargarh Kandhamal Deogarh Kalahandi Mayurbhanj Sonepur Nabarangpur Nuapada Keonj har Malkangiri
32.5 38.3 42.3 45.5 36.2 45.5 45.7 30.7 37.4 45.1 45.9 54.9 52.8 50.5 28.6 62.8 58.0 31.2 48.6 37.4 36.2 57.1 34.7 50.0 38.1 47.4 47.6 52.1 38.9 47.9
44.8 55.3 57.4 53.8 44.6 71.1 52.8 52.3 45.1 60.8 58.2 66.8 69.0 75.4 40.5 69.6 76.3 57.7 91.5 67.9 59.6 76.8 45.7 68.6 59.0 61.8 73.1 73.6 66.8 102.8
49 58 64 54 46 74 60 56 49 72 62 79 78 78 56 72 79 81 118 93 68 80 57 80 65 68 88 79 84 124
52 4 46 1 43 13 43 3 47 12 26 5 43 10 53 1 37 35 37 6 34 38 35 49 47 0 38 4 39 3 35 14 30 21 25 42 22 45 25 46 26 24 29 41 35 30 25 27 36 46 25 8 26 39 22 30 31 40 9 67
Annex Tables 57

Achieving The MDGs in India’s Poor States
Table A4: Antenatal care at the District level --...--p----.”---p *-------* -,..-“,.d_̂__l-l__ll -.*_ ---.- - _”-+ ** ..- +**- - Neo-natal % pregnant % pregnant % pregnant
Districts ranked by Mortality women getting women getting women getting NNMR - lowest to Rate Tetanus toxoid one ANC three ANC
highest Bhadrak 29 92 73 55 Jagatsinghpur 31 82 79 71 Gaj apati 31 85 75 55 Cuttack 33 94 86 63 Debargarh 35 86 73 66 Bargarh 36 92 88 58 Balasore 36 86 68 65 Sambalpur 37 93 87 72 Koraput 37 79 72 45 Puri 38 89 84 68 Mayurbhanj 38 90 78 56 Kenduj har 39 78 58 27 Anugul 42 80 72 48
Khordha 46 91 81 56 Ganj am 46 77 76 62 Dhenkanal 46 91 80 70 Jharsuguda 46 93 86 63 Sonapur 47 88 85 65 Nabarangpur 48 80 58 55 Malkangiri 48 69 54 41 Rayagada 49 86 72 55 Kalahandi 50 86 70 34 Jajapur 51 87 74 52 Nuapada 52 85 79 56 Kendrapara 53 93 80 65 Sundargarh 55 86 75 54 Kandhamal 57 85 69 51 Bolangir 58 92 88 61 Boudh 63 92 87 59
Nayagarh 45 81 72 51
Annex Tables 58

Achieving The MDGs in India's Poor States
Table AS: M o r t a 9 r a t e s andklaces of d e l i v e x I----------.--- - ,"..-- ~-,-,A- __-~. -_r I r _-~l---_-l_n-./ -_ Districts ranked by Neonatal % deliveries in % deliveries at % home NNMR - lowest to mortality rate medical facility home deliveries by
highest trained medical personnel
(including Dai) B hadrak 29 27 64 27
Gaj apati 31 79 18 Cuttack 33 48 27 Debargarh 35 68 18 Bargarh 36 28 68 34 Balasore 36 69 24 Sambalpur 37 34 56 29
Jagatsinghpur 31 36 54
Koraput 37 81 7 Puri 38 39 34 Mayurbhanj 38 24 67 30 Kenduj har 39 79 19
Nayagarh 45 61 14 Khordha 46 46 47 19 Ganj am 46 28 66 24 D henkanal 46 52 16
Anugul 42 29 62 12
Jharsuguda 46 63 44 Sonapur 47 25 69 22 Nabarangpur 48 71 18 Malkangiri 48 9 89 8 Rayagada 49 15 80 27 Kalahandi 50 69 16 Jajapur 51 28 64 28 Nuapada 52 17 75 16
Sundargarh 55 23 63 25 Kandhamal 57 19 67 22 Bolangir 58 61 32 Boudh 63 66 22 All districts 44.3 24 65 23
Kendrapara 53 58 45
--p---wpp-- ~ ~ - ~ , -
Annex Tables 59

Achieving The MDGs in India’s Poor States
Table A6: Child Mortality, Breastfeeding, Medical Knowledge and Immunization _IIp --- ~ - ~ - ~ .--- at the District level
% of children % of children Districts ranked by At least 6 months Some knowledge aged 12-36 aged 12-24 Child Mortality exclusive of appropriate months fully months - lowest to highest breastfeeding diarrhea immunized immunized
1. Balasore 19 86 74 79 2. Sambalpur 21 80 72 78 3. Cuttack 6 87 87 90 4. Khordha 5 100 59 65 5. Bhadrak 15 100 54 61
7. Debargarh 8 77 4s 66 8. Puri 19 89 73 82 9. Dhenkanal 8 84 60 76 10. Jharsuguda 17 67 71 78 11. Anugul 27 100 57 70
(%o) treatment against measles
6. Jagatsinghpur 9 91 46 50
12. Mayurbhanj 9 65 46 74 13. Bargarh 17 100 71 79 14. Sonepur 23 100 60 70 15. Nayagarh 7 75 62 68 16. Boudh 13 85 70 82 17. Ganj am 14 100 53 66 18. Kendrapara 13 92 58 64
20. Nuapada 20 90 43 56 2 1. Sundargarh 35 100 59 70 22. Bolangir 15 81 65 75 23. Kandhamal 17 100 59 73 24. Kalahandi 14 82 50 71 25. Gajapati 9 44 46 66 26. Kendujhar 9 100 35 58 27. Nabarangpur 21 67 45 65
29. Rayagada 12 51 46 64
All districts 15.6 82.8 55.4 67.9
19. Jajapur 25 100 37 53
28. Koraput 24 44 31 51
30. Malkangiri 22 61 40 54
--- ----- --M-*I__x__l.- --------”- -....----
Annex Tables 60

Achieving The MDGs in India’s Poor States
Table A7: District-wise Health Facilities: Districts ranked by Wealth -- E E t 2 k h ? L - -------
Percentage Percentage Percentage Percentage of of of of households households households households having having having having access to access to access to access to ICDS health PHC CHC/RH Center in sub-center the village in the
----“-**wl-
Percentage of households having access to private clinic in the village
Malkangiri Keonjhar Nuapada Nabarangpur Sonepur Mayurbhanj Kalahandi Deogarh Kandhamal Bargarh Koraput Rayagada Gajapati Bolangir Boudh B hadrak Jajpur Kendrapara Sundargarh Jharsuguda Nayagada Sambalpur Jagatsinghpur Dhenkanal Ganj am Balasore Khurda Angul Puri Cuttack
86.7 89.6 92.0
100.0 86.2 91.0 81.1 85.9 80.7 86.4 87.1 64.2 73.3 90.4 92.1 84.9 84.6 92.2 78.8 87.7 37.4 83.9 88.5 85.1 84.7 92.3 89.8 90.4 90.1
100.0
13.7 62.3 34.5 36.7 16.2 33.5 9.5
15.9 30.8 36.7 28.8 45.0 32.3 21.9 47.5 25.2 33.9 22.1 30.1 26.3 11.4 30.5 26.4 29.5 30.6 21.2 21.9 55.1 16.8 11.0
3.3 26.3
3.3 16.2 4.3 3.3
13.2 0.0
14.6 24.5 25.8
8.6 25.7
3.0 0.0
17.7 6.3 8.8
14.7 18.9 8.0
18.9 10.5 10.5 12.6 19.2 0.0
34.9 14.8 2.5
0.0 55.6 0.0 3.3 0.0 5.7 0.0
38.3 12.5 13.7 3.7 6.9 1.6 3.4 2.4 1.5
29.0 0.0
10.0 11.7 14.4 17.6 0.0 3.9 4.2
10.6 27.0 60.4 0.0 0.0
2.4 31.1
1.5 3.3 3.4 9.4 7.6 6.8
14.1 23.1 13.7 1.2
16.7 17.7 5.1 3.7 2.9
12.5 5.6 8.4
13.0 21.8 16.9 11.8 19.9 3.8 0.0
27.9 0.0 5.4
Annex Tables 61

Achieving The MDGs in India's Poor States
I ~ ~ - - ~ - ~ ~ - - " ~ ~ - - ~ . ~ ~ -I--- -I- -41^~1--~--1^---. 111 ̂ L^ --..""..I --*-.- - - . Table A8: Determinants of Under Five M o r t a l i i Rural & Urban Rural Only
Fixed Effects Fixed Effects Rural 1.231691 ** 1.229558 ** Girl 0.90598 1 0.898685 * 0.864608 ** 0.85678 ** Birthorder 2-3 0.877404 0.885801 0.896669 0.902523 Birthorder > 3 0.817931 0.840953 0.787169 0.814531 Birthspacing 24-47 0.69023 *** 0.691463 *** 0.643824 *** 0.647429 *** Birthspacing >47 0.76069 *** 0.762547 *** 0.707044 *** 0.709229 *** sc 1.298516 ** 1.304395 ** 1.39494 ** 1.329594 ** ST 1.280964 ** 1.326351 ** 1.266834 1.277518 * Other Backward 1.14522 1 1.127642 1.202275 1.129843 Age of mother at birth 20-29 0.836459 * 0.831691 * 0.835279 * 0.828787 * Age of mother at birth > 29 0.95 1299 0.934791 0.921378 0.89420 1 Age started living with husband 15-19 0.976459 0.974974 0.947998 0.9325 11 Age started living with husband > 19 0.9841 1 0.993 187 0.95283 0.955273 Mother's education 1-5 0.798927 ** 0.774013 ** 0.805807 * 0.778248 ** Mother's education >5 0.506861 *** 0.494211 *** 0.522689 *** 0.507933 ***
1.273186 ** Semi-Pucca 1.252815 ** 1.294047 ** 1.219409 Pucca 1.178961 1.22599 1 1.183951 1.2612 Tap inside 1.1261 07 1.121768 1.38826 1 1.327789 Tap public 0.723739 ** 0.702909 ** 0.830767 0.792312 Handpump 0.804734 * 0.789234 ** 0.822242 0.824757 * Uncovered well 0.785968 * 0.76252 ** 0.768959 * 0.752479 ** Own flush 0.958237 0.95858 1 1.04 1495 1.057868 Shared 1.433462 1.442487 1.620582 1.67734 Public Community 2.759855 * 2.725091 * 2.486833 2.65888 Light from electricity 1.386449 ** 1.37574 ** 1.457535 ** 1.480984 *** Cooking LPG 1.036977 1.094795 1.554573 1.619706 Wealth index 0.697228 *** 0.677146 *** 0.63324 *** 0.601136 *** ICDS 1.032194 1.027216 Sub-center 0.863066 * 0.906232 PHC 0.94983 1 0.967435 CHC/RH 1.196672 1.18395 Gov. dispensary 0.849334 0.794674 ** Gov. hospital 1.122349 1.097421 Private clinic 1.254078 * 1.232999 Private hospital 1.096439 1.082474 ISM 1.065601 1.066964 Al l weather road 0.896338 0.888634 Obs 15413 15413 11621 11621 R-Squared 0.03 0.03
21 1 254 139 172 LR Chi --"...*-- ~ ~ ~ I I ^ _ _ ^ - I _ _ I I _ I I _ p ~ ~ - - ~ - ~ ~ - I-- -- ~ ~ ~ * . _ I __I. I ~
Annex Tables 62

Achieving The MDGs in India's Poor States
Table A9: Determinants of Infant MortaliQ -P - ~ ~ - ,I -----I - -- - " _ " I 1 ' - ~ I _ - x - ~ _ l _ _ _ a _ _ " - - i ~ . y --~-----"---I -- -s_l_ L
Rural 8z Urban Rural Only Fixed Effects Fixed Effects
Rural 1.26115 ** 1.26893 ** Girl 0.881514 * 0.875261 ** @ti28929 ** 0.822901 *** Birthorder 2-3 0.940122 0.945779 0.961343 0.964565 Birthorder > 3 0.957477 0.973582 0.896 0.922782 Birthspacing 24-47 0.669465 *** 0.672059 *** 0.619733 *** 0.624455 *** Birthspacing >47 0.727465 *** 0.727912 *** 0.65249 *** 0.653235 *** sc 1.322585 ** 1.302557 ** 1.423981 ** 1.318025 * ST 1.259998 * 1.267212 * 1.293996 1.246092 Other Backward 1.2113 1.174694 1.298565 * 1.188049 Age of mother at birth 20-29 0.789083 ** 0.788365 ** 0.801111 ** 0.797906 ** Age of mother at birth > 29 0.93305 1 0.921796 0.9 609 3 9 0.937395 Age started living with husband 15-19 1.032045 1.036328 1.030954 1.014751 Age started living with husband > 19 1.058196 1.069312 1.027725 1.0278 12 Mother's education 1-5 0.843 123 0.819795 * 0.849942 0.826215 * Mother's education >5 0.543625 *** 0.529231 *** 0.545479 *** 0.529707 *** Semi-Pucca 1.2078 * 1.244944 ** 1.14838 1.198948 Pucca 1.15469 1.202793 1.1 1 6459 1.195206 Tap inside 1.3 10229 1.3 18054 1.638755 1.552788 Tap public 0.795832 0.78801 1 0.9046 16 0.86845 Handpump 0.831045 0.82601 1 0.870438 0.873041 Uncovered well 0.835618 0.823012 0.8242 17 0.8 18 13 Own flush 0.969237 0.968003 1.009073 1.03 1695 Shared 1.631748 * 1.648223 * 1.841794 1.8983 19 Public Community 3.021716 ** 3.021007 ** 2.688818 2.91946 * Light from electricity 1.448197 *** 1.449635 *** 1.517667 *** 1.54799 *** Cooking LPG 1.139203 1.191499 1.695334 1.742716 * Wealth index 0.667363 *** 0.649151 *** 0.628622 ** 0.60161 *** ICDS 1.022717 1.039764 Sub-center 0.926267 0.963662 PHC 0.95 1344 0.945491 CHC/RH 1.135686 1.137469 Gov. dispensary 0.821223 0.788547 ** Gov. hospital 1.236229 1.196563 Private clinic 1.297217 * 1.281359 * Private hospital 0.990345 0.979623 I S M 1.150343 1.126044 All weather road 0.914531 0.903327 Obs 15413 15413 11621 11621
133 149 LR Chi R-Squared 0.03 0.02
---------------* ---- 207 -- 181 _I
Annex Tables 63

Achieving The MDGs in India's Poor States
Rural & Urban Rural Only Fixed Effects Fixed Effects
Rural Girl Birthorder 2-3 Birthorder > 3 Birthspacing 24-47 Birthspacing >47 sc ST Other Backward Age o f mother at birth 20-29 Age of mother at birth > 29 Age started living with husband 15-19 Age started living with husband > 19 Mother's education 1-5 Mother's education >5 Semi-Pucca Pucca Tap inside ' Tap public Handpump Uncovered well Own flush Shared Public Community Light from electricity Cooking LPG Wealth index ICDS Sub-center PHC CHC/RH Gov. dispensary Gov. hospital Private clinic Private hospital ISM
1.244299 0.8316465 0.8547438 0.7203833 0.658436
0.6485577 1.2153 18 1.1 151 14
0.9940293 0.883721 8
1.141 137 1 . O m 4 1 1.035887
0.9056137 0.5826088 1 .OS6386
0.9320914 1.54 196
0.8 864308 0.8592659 0.8638 12 1.079158
0.8625252 1.747703 1.384473
0.9942741 0.75 1
* **
*** ***
***
*
**
*
1.2375 0.8284358 0.8541 115 0.6923023 0.661 1983 0.6474978
1.209177 1.093 178
0.9892796 0.8895782
1.14836 1.031748 1.044062
0.9062733 0.5808786
* ** 0.7882731
0.8398245 0.8291939
*** 0.6138048 *** 0.5514253
1.405899 1.175253 1.104624
0.9567957 1.277258 1 .O 10227 1.004591
0.8638475 *** 0.5600035
1.057825 0.9447 824
1.554392 * 0.8918327 0.86 19408 0.902343 1.065352
0.9049891 1.847647 1.37987 ** 1.01087
0.748912 *
0.9872321 0.9150839
1.766676 0.8855537 0.9180189 0.8331277
1.4409 16 0.5857609 2.186049 1.437875 1.721408
0.7041879 0.9710889 0.9337616 0.9523993
1.654299 0.7322567
1.173042 1.462458
0.8171256 1.050389
*** 0.7839177 *** 0.8388396 0.8069256
*** 0.61912 *** *** 0.5553061 *** * 1.31 1014
1.11441 1.03635 1
0.9526084 1.26075
0.992539 0.9869102 0.8591421
*** 0.5508344 *** 1.00129
0.9280743 1.676467
0.8411634 0.9245441 0.8715701
1.397649 0.6267976 2.55637 1
* 1.463763 ** 1.757698
0.6942337 * 0.988428
0.9441103 0.9424679
*** 1.627417 *** ** 0.7220281 **
1.1456 ** 1.488728 **
0.7902655 0.992321
Al l weather road 0.9252402 0.9327677 Obs 15413 15413 11621 11621 R-Squared 0.02 0.02
108 Likelihood Ratio ---.-*-,---- 109 113 I05 ---- -*-------" -
Annex Tables 64
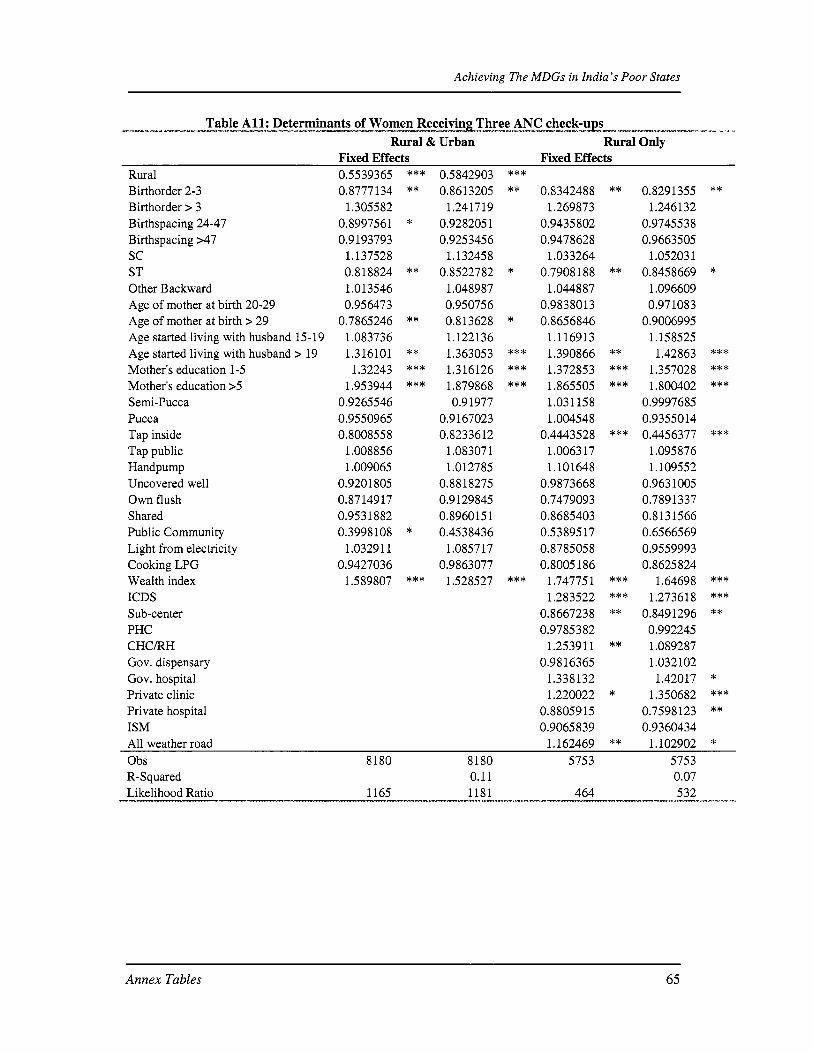
Achieving The MDGs in India's Poor States
Table A l l : Determinants of Women ReceivinLThree ANC c h e c k - - s I* - *--*---- -+-----.------ -----. z ----_"-.l_ _" - ~ ~ - -~ I . I
Rural & Urban Rural Only Fixed Effects Fixed Effects
Rural Birthorder 2-3 Birthorder > 3 Birthspacing 24-47 Birthspacing >47 sc ST Other Backward Age of mother at birth 20-29 Age of mother at birth > 29 Age started living with husband 15-19 Age started living with husband > 19 Mother's education 1-5 Mother's education >5 Semi-Pucca Pucca Tap inside Tap public Handpump Uncovered well Own flush Shared Public Community Light from electricity Cooking LPG Wealth index ICDS Sub-center PHC C H C N Gov. dispensary Gov. hospital Private clinic Private hospital ISM
0.5539365 0.8777 134
1.305582 0.8997561 0.9193793
1.137528 0.818824 1 .O 13546 0.956473
0.7865246 1.083736 1.316101 1.32243
1.953944 0.9265546 0.9550965 0.8008558
1.008856 1.009065
0.9201805 0.8714917 0.9531882 0.3998 108
1.0329 1 1 0.9427036
1.589807
*** **
*
**
**
** *** ***
*
***
0.5842903 0.86 13205
1.24 17 19 0.9282051 0.9253456
1.1 3245 8 0.8522782
1.048987 0.950756 0.813628 1.1221 36 1.363053 1.316126 1.879868 0.91977
0.9167023 0.8233612
1.083071 1 .O 127 85
0.8818275 0.9129845 0.896015 1 0.4538436
1.085717 0.9863077
1.528527
*** **
*
*
*** *** ***
***
0.8 34248 8 1.269873
0.9435802 0.9478628
1.033264 0.7908 188
1.044887 0.9838013 0.8656846
1.116913 1.390866 1.372853 1.865505 1.03 1158 1.004548
0.4443528 1.006317 1.10 1648
0.9873668 0.7479093 0.8685403 0.5389517 0.8785058 0.8005186
1.74775 1 1.283522
0.8667238 0.9785382
1.2539 1 1 0.9816365
1.338132 1.220022
0.8805915 0.9065839
**
**
** *** ***
***
*** *** **
**
*
0.829 1355 1.246132
0.9745538 0.9663505
1.05203 1 0.8458669
1.096609 0.971083
0.9006995 1.158525 1.42863
1.357028 1.800402
0.9997685 0.9355014 0.4456377
1.095876 1.109552
0.9631005 0.7891337 0.8131566 0.6566569 0.9559993 0.8625824
1.64698 1.2736 18
0.849 1296 0.992245 1.089287 1.032102 1.42017
1.350682 0.7598123 0.9360434
**
*
*** *** ***
***
*** *** **
* *** **
Al l weather road 1.162469 ** 1.102902 * Obs 8180 8180 5753 5753 R-Squared 0.11 0.07
1165 1181 464 532 Likelihood Ratio ~ - - - . - - ~ - ~ - - - - ~ - " l " _ _ ~ 1.1 - - -
Annex Tables 65

Achieving The MDGs in India's Poor States
Table A12: Determinants of Home Deliverx I- I_ ---- ". "-'..&--WI...M-uI -- I _. -~'---~.-~- _-I ** __I -.,, ~ ---*.- " L f- - x x- - -.-- % -
Rural & Urban Rural Only Fixed Effects Fixed Effects
Rural 2.132039 *** 2.036278 *** Birthorder 2-3 1.548282 *** 1.568897 *** 1.670121 *** 1.689847 *** Birthorder > 3 1.479045 * 1.611086 ** 1.188842 1.277778 Birthspacing 24-47 1.205952 *** 1.194879 *** 1.118257 1.116732 Birthspacing >47 1.411812 *** 1.436272 *** 1.472093 *** 1.520653 *** SC 1.024486 1.063559 0.942322 1.01 1325 ST 1.624606 *** 1.860426 *** 1.508443 *** 1.812483 *** Other Backward 1.0158 19 1.06 1562 1.003284 1.07452 Age of mother at birth 20-29 0.984904 0.936151 0.978214 0.919208 Age of mother at birth > 29 0.908078 0.843395 0.966606 0.882945 Age started living with husband 15-19 0.8592 0.813225 ** 0.705759 *** 0.647196 *** Age started living with husband > 19 0.609719 *** 0.539628 *** 0.485689 *** 0.414676 *** Mother's education 1-5 Mother's education >5 Semi-Pucca Pucca Tap inside Tap public Handpump Uncovered well Own flush Shared Public Community Light from electricity Cooking LPG Wealth index ICDS Sub-center PHC CHCRH Gov. dispensary Gov. hospital Private clinic Private hospital ISM
0.805265 0.49 17 18 1.0561 17 1.21707 1 1 .I 52948 0.804652 0.836593 0.87055 1 0.98 1009 0.854522 0.866723 0.99948 1 0.75 1104 0.493992
*** 0.743966 *** 0.479373
1.027092 ** 1.08533
1.064743 * 0.767125
0.772136 0.757027 1.084612 0.867798 0.907017 1.028475
** 0.8166 *** 0.49286
*** 0.893345 *** 0.472974
1.076126 1.207521 1.623833
** 0.902962 ** 0.864469 ** 0.821714
1.276105 0.835555 1.640389
1.0453 * 0.859454 *** 0.485618
0.996889 1.001927 0.89164
1.199059 1.051 193 0.4043 1
1.148062 1.332552 1.169147
0.805393 ** *** 0.450225 ***
1.00812 1.040077
* 1.369512 0.838148 0.830968 0.723316 ** 1.072654 0.762509 1.462606 1.062263 0.97897 1
*** 0.506286 *** 1.048762 1.04209
0.920285 * 1.073443
1.226015 ** *** 0.445169 ***
1.06554 ** 1.204349 * 1.143568
Al l weather road 0.755018 *** 0.766764 *** Obs 12349 12349 946 1 946 1 R-Squared Likelihood Ratio
0.24 0.16 3109 3580 1038 1549
Annex Tables 66

Achieving The MDGs in India's Poor States
Annex 2: Longitudinal Household Survey, Bolangir
The Original Panel Survey
The focus o f the original survey was on individual and household activity and income portfolios. I t was designed with the aim o f generating a panel, with data collected over several periods. Three rounds o f data collection have been conducted, starting in October 2001. For the first round (kharif 2000, rabi 2001, kharif 2001), the actual field work was carried out between October 2001 and February 2002; for the second round (kharif2002, rabi 2003, kharif2003), the field work was carried out between January and June 2004; for the third round (rabi 2004, kharif 2004), the field work was carried out between January and June 2005. Immediately following the completion o f th i s last round, the special round - undertaken for this particular report - was carried out between August and November 2005.
After a two-week period o f training in the field, the lead researcher accompanied and supervised the original team throughout the f i r s t round o f data collection in 2001/2002. Dr. B. K. Behera, the principal assistant and local project coordinator, independently organized the canvassing o f the second and third rounds, and the special survey. During this time, the author made two more trips to the field, and, when not in Orissa, was in almost daily email contact with Dr. Behera. The fieldwork teams consisted o f three to five young anthropologists, all from Sambalpur University, most o f them with fresh masters' degrees. The members o f the teams varied slightly from one round to the next. Since day one, however, the teams have been led by Dr. Behera. The teams contributed to the project extensive local knowledge and substantial anthropological competence. The mixture o f male and female investigators proved to be advantageous and improved access to both sexes among our respondents. As befits the topic, all the field investigators for the special survey were female, Dr. Behera playing the role o f coordinator on the spot. All interviews, whether conducted in connection with the panel or the special survey, took about two hours, and all villages (and most households) were repeatedly visited in order to clarify and crosscheck information.
Since the panel survey forms the 'backdrop' o f the special survey, a few remarks about the nature o f the data are in order. Consumption and expenditure data cannot be reliably collected using long recall periods; but extensive experience with household surveys in India has taught us that people have a rather accurate idea o f what they cultivated last year and how much they harvested, whether they worked in agriculture or on construction sites, or whether they participated in employment generation schemes, for how long they did al l this and what they earned on average. Income calculations thus include earnings from wage labor and the various forms o f self-employment reported by our respondents (own cultivation, collection o f forest products, basket weaving, etc.). All input costs were covered, except the opportunity costs o f own labor, land, draught animals and other fixed assets. Despite certain limitations, such 'small panels', if carefully designed and canvassed, can yield important insights into household behavior over time (seasonal and annual) and thus complement large-scale (non-panel) household surveys. As in the special survey, data collection at the household level was supplemented in all rounds by a series o f qualitative (topical) interviews with respondents from inside and outside the study villages. This source o f information has been, and s t i l l is, extremely helpful in making sense of the quantitative data.
39 This research was carried out by Susanne van Dillen, University of Bonn, Department o f Geography.
Annex Tables 67

Achieving The MDGs in India's Poor States
The Special Round for this Report@
The longitudinal survey i s based on an initial sample o f 240 households which have been canvassed since 2001. The sample was drawn as follows: five contiguous Blocks were selected (Kesinga, Titlagarh, Saintala, Muribahal and Bongomunda) and a random sample o f six villages was drawn from each Block, employing a stratification aimed at ensuring a fairly even spatial distribution. Six clusters o f villages were defined in each block and one village drawn at random from each cluster. Eight households were selected in each village, yielding 240 households in all. Again, only spatial stratification was employed, households being selected at random from different parts o f the village settlement area. For the purposes o f the special round, one Block (Kesinga) was dropped, leaving a sample o f 192 households in all.41
The survey consists o f four parts. In Part 1 all members o f the sample households and their characteristics were recorded. In addition, we compiled a l i s t o f all the pregnancies o f all women in the household, including each child's date of birth and, if the child died, the date and immediate cause o f i t s death. Part 2 of the survey deals with household practices. I t investigates attitudes and actual behavior in the realms o f hygiene, nutrition, medical treatment, mobility and other issues that have a potentially important impact on maternal and child health and mortality. In Part 3, all pregnancy and child 'histories' are tracked individually. This includes information about the households circumstances and the existing health infrastructure at the time of pregnancy, childbirth and early infancy, supplemented by detailed information about when and why (or why not) medical assistance was actually sought at the various stages o f this period. The child's history o f vaccination, diseases and medical treatments was also recorded in detail and, to close this section, mothers were asked to explain whether or not they were satisfied with their child's subsequent development. Part 4 deals exclusively with child mortality, each case being tracked separately. I t seeks to capture the run-up to death and so to identify both immediate and long-term causes. Mothers were also asked whether they thought that such deaths could have been avoided, and if so, how.
Turning to the interviewing itself, our respondents were all female, and some o f the topics covered by the questionnaire were sensitive. Yet, women seemed to report their experiences freely and not to mind the considerable length o f the interviews (2-3 hours, depending on the number o f children). Here, three factors seemed to be important: f i rst , they have been familiar with our team o f investigators since 2001; second, all but one member o f the team were female; third, our respondents seemed to have a strong interest in the matter at hand and many were in fact eager to talk.
One focus group interview was conducted in all but two villages, yielding a total o f 22 such interviews. These were generally carried out on 'neutral ground' - that is, a place in the village accessible to members o f all communities - and lasted for about two hours. Six to twelve women from different communities and age groups participated, more often than not joined by their curious men and children. The interview atmosphere was generally friendly and relaxed, which i s at least partly attributable to the fact that our survey team has become a familiar sight to most villagers, and the women seemed to speak freely even in public. The men, for their part,
40 This round was carried out at the specific request of the authors of this paper and under contract to the World Bank.
For further details of the original household survey's aims and design, see van Dil len (2005), 'Income and i t s Variability in a Drought-prone Region: Seasonality, Location and Household Characteristics', mimeo, University o f Bonn, Department of Geography.
41
Annex Tables 68

Achieving The MDGs in India's Poor States
seemed to understand that we were particularly interested in the women's views and made few attempts to take over the discussion. When they did so, they were politely put in their place. Their contributions were also valuable, however; for maternal and child health issues ultimately concern the entire household. The interviews were concerned with four broad themes: (i) pregnancy and child birth; (ii) treatment o f newborns (0-2 months); (iii) mothers' activities and breast-feeding practices during the first year; and (iv) experiences with maternal health and child care facilities.
---- A profile of Bolangir from the RCH data
below average female literacy, primary school completion
the lowest
o f all districts
poorest performing districts) - but note bulk of mortality i s in neo-natal period
f irst RCH survey (87%)
Not one o f the poorest districts (middling), with average share of ST population (21%). Slightly
Mother education has increased, at 40% literacy, lower than state average o f 50% but not among
NNM fell from 65/1000 to 58/1000 in the period 1998/99 to 2002/04, but s t i l l among the highest
Lit t le change in IMR during this period, 76/1000, child mortality i s 79/1000 (one o f the ten
Increase in age o f marriage between two RCH surveys Deliveries at home at 61%, lower than state-wide average o f 65%, and showed major decline from
Also good trends with TT and ANC visits (above state-wide average) Incidence of early breastfeeding also risen; duration o f breastfeeding about average Immunization rate, 65% quite good by state average (55%) but has fallen since RCHl
Annex Tables 69


