reducing work disincentives in the housing choice voucher ... · reducing work disincentives in the...
TRANSCRIPT

Reducing Work Disincentives in the Housing Choice Voucher Program: Rent Reform Demonstration Baseline Report
LOUISVILLELEXINGTON SAN ANTONIO WASHINGTON, D.C.
U.S. Department of Housing and Urban Development | Office of Policy Development and Research
Reducing Work Disincentives in the Housing Choice Voucher Program: Rent Reform Demonstration Baseline Report
Prepared forU.S. Department of Housing and Urban DevelopmentOffice of Policy Development and Research
Submitted byJames RiccioVictoria DeitchNandita VermaMDRC
October 2017

Acknowledgments
This report reflects contributions from many people.1 We are especially grateful to the families who are participating in the Rent Reform Demonstration, whose experiences have informed this report, and to the housing specialists and supervisors at the District of Columbia Housing Authority, Lexington-Fayette Urban County Housing Authority, Louisville Metro Housing Authority, and San Antonio Housing Authority, who implemented the new rent rules and research procedures. We also appreciate the assistance of staff members at these housing agencies who were deeply involved in designing the new rent policies and in determining how best to implement them (and the study procedures), including in Washington, D.C., former Executive Director Adrianne Todman, with Kimberley Cole, Lori Parham, Ronald McCoy, Anissa Jones, Jannie Lebby, and Rani Joseph; in Lexington, Executive Director Austin Simms, with Andrea Wilson, Aldean Pleasant, and Tonya Christopher; in Louisville, Executive Director Tim Barry, with Lisa Osanka, Sarah Abplanalp, Deborah Gilbert, and Cheryl Butler; and in San Antonio, former Executive Director Lourdes Castro Ramirez, with Richard Milk, Brandee Perez, Gary Baxter, and Priscilla Salazar. We also thank Rajan Girdhar and Lorraine Jones of Yardi and Kevin Schworm of Emphasys, who worked with MDRC and the participating housing agencies to implement the new rent reform calculations in their respective housing authority software programs.
We appreciate the support from many staff members at the U.S. Department of Housing and Urban Development (HUD) for their collaboration on the design of the new rent policy and the selection of the demonstration sites, for offering valuable thoughts on the evaluation design, and for reviewing drafts of this report. These staff members include, from the division of Public and Indian Housing, Jemine Bryon, Laurel Davis, Alison Christensen, John Concannon, and Ebony Gayles; and from the division of Policy Development and Research, Todd Richardson, Mark Schroder, Carol Star, and Lynn Rodgers (who was partic-ularly helpful on the use and interpretation of HUD data). Our HUD government technical representatives have been a source of steady guidance on all phases of this work. In that capacity, Jennifer Stoloff helped launch the demonstration and oversaw the initial design phase. Marina Myhre, who joined during the site-selection phase, has been a careful and insightful reviewer of all subsequent design and implementation activities, includ-ing the production of this report. The following staff members
at several other housing agencies participated in initial design discussions and thereby contributed ideas and insights that influenced the early formulation of the new rent policy: Greg Russ and Carolina Lucey, formerly of the Cambridge Housing Authority; Tim Veenstra and Deanna Wheeler of the Chicago Housing Authority; Thomas Graham and Joanne McKenna of the Massachusetts Department of Housing and Community Development; Joyce Stewart of the Housing Authority of Baltimore City; and Katherine Harasz and Louise Hofmeister of the Housing Authority of Santa Clara County.
We thank those reviewers who serve on our expert panel and have given us comments on the new rent rules, the study’s design, and this report: Greg Russ of the Cambridge Housing Authority, Barbara Sard of the Center on Budget and Policy Pri-orities, Amber-Lee Leslie of the Council of Large Public Hous ing Authorities, Janelle Beverly of the Fairfax County Redevelopment and Housing Authority, Michael Wiseman of George Washington University, Lawrence Katz of Harvard University, Tushar Gurjal of the National Association of Housing and Redevelopment Officials, Sarah Mickelson of the National Low-Income Housing Coalition, James Armstrong and Jonathan Zimmerman of the Public Housing Authorities Directors Association, Andrew Lofton of the Seattle Housing Authority, and Larry Orr (a consultant).
At MDRC, Nina Castells and Stephen Freedman reviewed drafts of the policy and evaluation design papers and provided guidance on the approach for calculating retrospective income. Steve Freedman also provided data-management advice. Gordon Berlin, Stephen Freedman, Cynthia Miller, Stephen Nuñez, and Alice Tufel provided comments on drafts of the report. The following current and former MDRC staff members contributed by processing or analyzing quantitative data either for the design of the rent rules or for this report: Zakia Barnes, Daniel Gallagher, Leila Kerimova, Tim Moreland, and Sarah Schell. Jonathan Bi-gelow and Keith Olejniczak worked with the housing agencies to implement the new rent rules and the research design. Crystal Ganges-Reid, Makenzi Sumners, Kemar Taylor, and Audrey Yu prepared the exhibits and assisted with fact checking. We also appreciate the support of our resource managers, Stephanie Rubino and Crystal Ganges-Reid. Joshua Malbin edited an earlier draft of the report, and Carolyn Thomas helped prepare it for HUD’s editor.
1 The acknowledgments list the institutions with which individuals were affiliated at the time they contributed to the work reflected in this report.

Finally, we acknowledge our research partners from other organizations who played a crucial role in the design of the rent rules and the evaluation, worked directly with the housing agencies to implement the new rent rules and research pro-cedures, and offered comments on the report: John Goering of
the City University of New York, Don Davis and Jessica Porter of the Bronner Group, Ingrid Gould Ellen of New York Univer-sity, Roberta Graham of Quadel, Marty Abravanel and Diane Levy of the Urban Institute, and Barbara Fink (a consultant).
Disclaimer
The contents of this report represent the views of the authors and do not necessarily reflect the views or policies of the U.S. Depart-ment of Housing and Urban Development or the U.S. government.
Reducing Work Disincentives in the Housing Choice Voucher Program
Rent Reform Demonstration Baseline Report
iv
Preface
In 1969, a landmark piece of national affordable housing legislation, sponsored by and subsequently named for U.S. Senator Edward Brooke, was enacted into law. Senator Brooke was responding to community and tenant organizing and advocacy, national press attention, and a clearly identified policy need—to ensure that federal affordable housing programs actually lived up to their intended affordability. The Brooke Amendment protected families and individuals in federally assisted housing from being charged rents that were unaffordable to them. Initially, the amendment limited rent charges to 25 percent of the assisted family’s income. Over time, numerous changes were made to the basic rent-setting policy, raising the threshold to 30 percent (enacted in 1981 as a budget offset measure) and adding numerous adjustments, exclusions, and deductions, and also adding minimum and ceiling rent options.
Over time, critics have suggested that the Brooke Amendment, although safeguarding affordability, creates a disincentive to work by dampening tenant motivation to earn more income. In response, The U.S. Department of Housing and Urban Development has undertaken the Rent Reform Demonstration to comprehensively test alternatives to the current rent-setting requirements in one of its key programs: Housing Choice Vouchers (HCV). The demonstration is testing three key goals; specifically how to—
• Incentivize employment for work-eligible individuals.
• Reduce the complexity and administrative burden for public housing agencies (PHAs).
• Avoid unnecessary hardship on assisted families.
This demonstration is currently under way, with field testing in progress. This baseline report provides background information on the status and progress of the demonstration, including preliminary baseline information on families in the four PHAs participating in the demonstration. Overall, the demonstration sample is like the national HCV population in terms of age and family size, but demonstration participants are more likely to be female; are more likely to have a Black, Latino, or Hispanic household head; are less likely to have earned income; and have a lower total tenant payment than the national HCV population.
The baseline survey provided information on employment status, education, the extent and range of barriers to employ-ment, and hardships experienced by the study participants. About 47 percent of survey respondents indicated that they were currently employed, and only about one-half of those (or 24 percent of all respondents) were employed full time. Slightly more than one-third of households had a high school diploma or equivalent (35 percent), and few had 2-year (9 percent) or 4-year (less than 3 percent) college degrees. More than one-half of survey respondents (54 percent) reported a problem that limited work, with physical health (28 percent) and childcare costs (21 percent) listed as the top two barriers to employment overall. Among the participating Rent Reform Demonstration sites, San Antonio (21 percent) and Louisville (17.5 percent) have the highest rates of respondents who cannot work because of the need to care for a sick or disabled family member.
Future reports will assess the impact of the alternative rent model, at 12 and 36 months after random assignment, on employment, earnings, and hardship for the study sample and on administrative efficiencies for the PHA. Another future report will provide a process evaluation of the demonstration implementation.

Reducing Work Disincentives in the Housing Choice Voucher Program
Rent Reform Demonstration Baseline Report
v
Contents
Executive Summary ..........................................................ES-1
Chapters
1 Introduction .................................................................... 1
2 A Closer Look at the New Rent Policy ............................. 9
3 Evaluation Approach ..................................................... 19
4 Characteristics of Families Enrolled in the Study ........... 25
5 Making the Transition to the New Rent Policy and Its Implications for Housing Subsidies ............................... 41
6 Looking Ahead .............................................................. 61
Appendixes
A The Housing Agency Selection Process .......................... 63
B Supplementary Table for Chapter 2 ............................... 65
C Families in Louisville Who Opted Out of the New Rent Policy .................................................................... 66
D Calculating Retrospective Income When There Is a Gap in Income Verification ............................................ 70
E An Example of Safeguards in the New Rent Policy ........ 71
F Letter Sent to Families Who Qualified for Hardship Remedies ...................................................................... 72
References ........................................................................... 73
Reducing Work Disincentives in the Housing Choice Voucher Program
Rent Reform Demonstration Baseline Report
vi
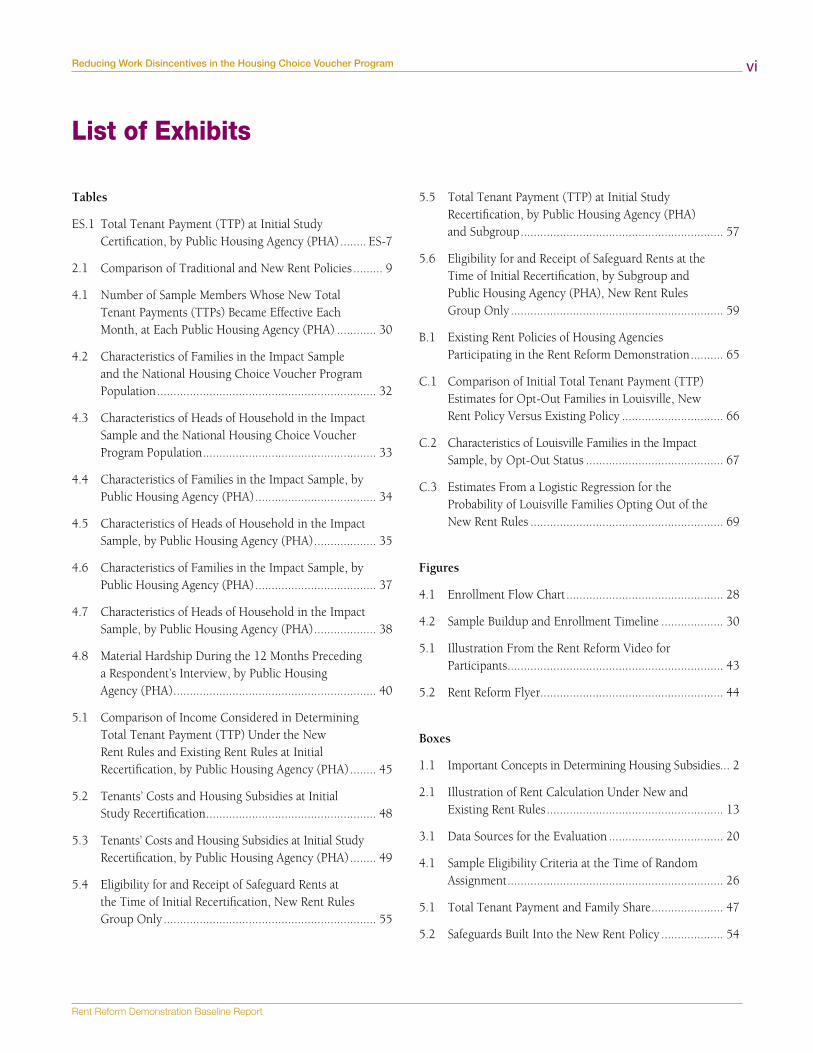
List of Exhibits
Tables
ES.1 Total Tenant Payment (TTP) at Initial Study Certification, by Public Housing Agency (PHA) ........ ES-7
2.1 Comparison of Traditional and New Rent Policies ......... 9
4.1 Number of Sample Members Whose New Total Tenant Payments (TTPs) Became Effective Each Month, at Each Public Housing Agency (PHA) ............ 30
4.2 Characteristics of Families in the Impact Sample and the National Housing Choice Voucher Program Population ................................................................... 32
4.3 Characteristics of Heads of Household in the Impact Sample and the National Housing Choice Voucher Program Population ..................................................... 33
4.4 Characteristics of Families in the Impact Sample, by Public Housing Agency (PHA) ..................................... 34
4.5 Characteristics of Heads of Household in the Impact Sample, by Public Housing Agency (PHA) ................... 35
4.6 Characteristics of Families in the Impact Sample, by Public Housing Agency (PHA) ..................................... 37
4.7 Characteristics of Heads of Household in the Impact Sample, by Public Housing Agency (PHA) ................... 38
4.8 Material Hardship During the 12 Months Preceding a Respondent’s Interview, by Public Housing Agency (PHA) .............................................................. 40
5.1 Comparison of Income Considered in Determining Total Tenant Payment (TTP) Under the New Rent Rules and Existing Rent Rules at Initial Recertification, by Public Housing Agency (PHA) ........ 45
5.2 Tenants’ Costs and Housing Subsidies at Initial Study Recertification .................................................... 48
5.3 Tenants’ Costs and Housing Subsidies at Initial Study Recertification, by Public Housing Agency (PHA) ........ 49
5.4 Eligibility for and Receipt of Safeguard Rents at the Time of Initial Recertification, New Rent Rules Group Only ................................................................. 55
5.5 Total Tenant Payment (TTP) at Initial Study Recertification, by Public Housing Agency (PHA) and Subgroup .............................................................. 57
5.6 Eligibility for and Receipt of Safeguard Rents at the Time of Initial Recertification, by Subgroup and Public Housing Agency (PHA), New Rent Rules Group Only ................................................................. 59
B.1 Existing Rent Policies of Housing Agencies Participating in the Rent Reform Demonstration .......... 65
C.1 Comparison of Initial Total Tenant Payment (TTP) Estimates for Opt-Out Families in Louisville, New Rent Policy Versus Existing Policy ............................... 66
C.2 Characteristics of Louisville Families in the Impact Sample, by Opt-Out Status .......................................... 67
C.3 Estimates From a Logistic Regression for the Probability of Louisville Families Opting Out of the New Rent Rules ........................................................... 69
Figures
4.1 Enrollment Flow Chart ................................................ 28
4.2 Sample Buildup and Enrollment Timeline ................... 30
5.1 Illustration From the Rent Reform Video for Par ticipants .................................................................. 43
5.2 Rent Reform Flyer........................................................ 44
Boxes
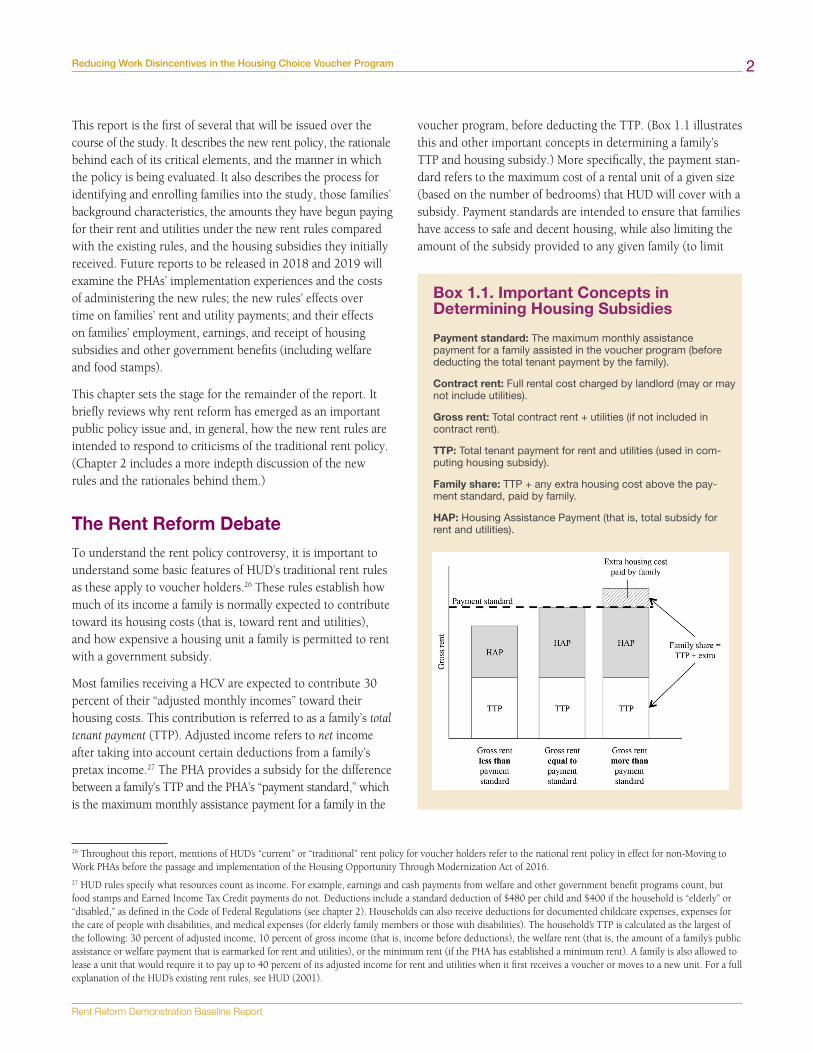
1.1 Important Concepts in Determining Housing Sub sidies... 2
2.1 Illustration of Rent Calculation Under New and Existing Rent Rules ...................................................... 13
3.1 Data Sources for the Evaluation ................................... 20
4.1 Sample Eligibility Criteria at the Time of Random Assignment .................................................................. 26
5.1 Total Tenant Payment and Family Share ...................... 47
5.2 Safeguards Built Into the New Rent Policy ................... 54
Reducing Work Disincentives in the Housing Choice Voucher Program
Rent Reform Demonstration Baseline Report
ES-1
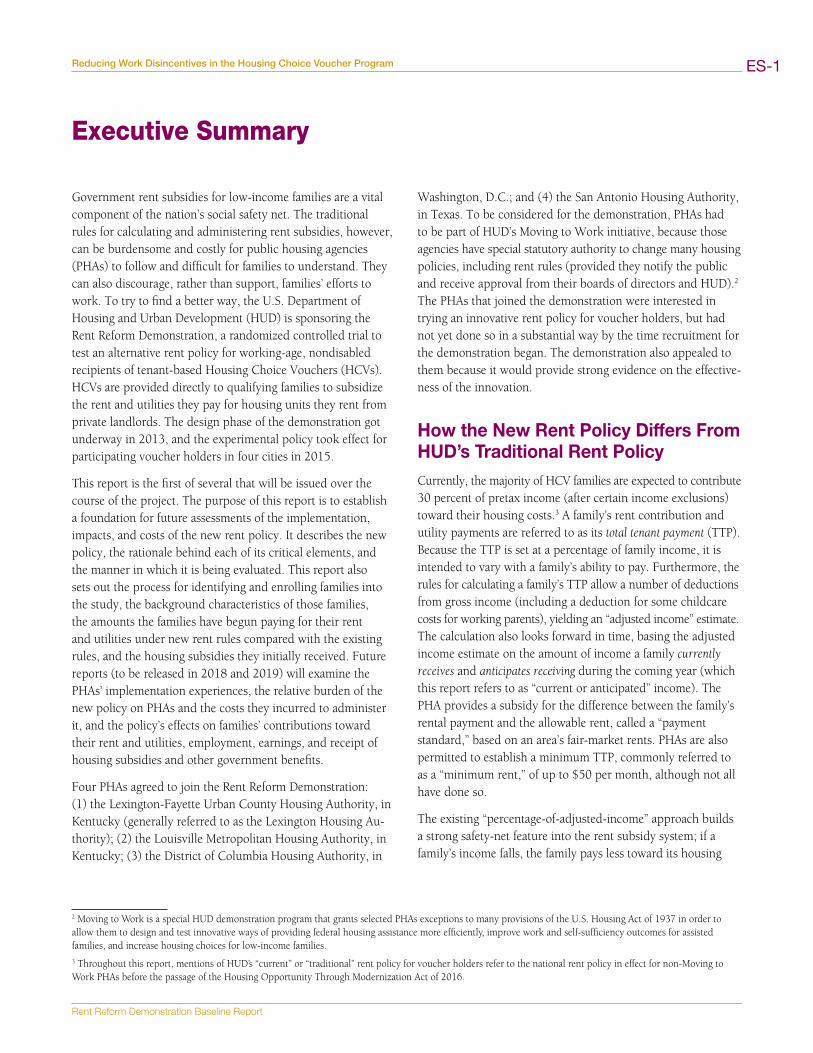
Executive Summary
Government rent subsidies for low-income families are a vital component of the nation’s social safety net. The traditional rules for calculating and administering rent subsidies, however, can be burdensome and costly for public housing agencies (PHAs) to follow and difficult for families to understand. They can also discourage, rather than support, families’ efforts to work. To try to find a better way, the U.S. Department of Housing and Urban Development (HUD) is sponsoring the Rent Reform Demonstration, a randomized controlled trial to test an alternative rent policy for working-age, nondisabled recipients of tenant-based Housing Choice Vouchers (HCVs). HCVs are provided directly to qualifying families to subsidize the rent and utilities they pay for housing units they rent from private landlords. The design phase of the demonstration got underway in 2013, and the experimental policy took effect for participating voucher holders in four cities in 2015.
This report is the first of several that will be issued over the course of the project. The purpose of this report is to establish a foundation for future assessments of the implementation, impacts, and costs of the new rent policy. It describes the new policy, the rationale behind each of its critical elements, and the manner in which it is being evaluated. This report also sets out the process for identifying and enrolling families into the study, the background characteristics of those families, the amounts the families have begun paying for their rent and utilities under new rent rules compared with the existing rules, and the housing subsidies they initially received. Future reports (to be released in 2018 and 2019) will examine the PHAs’ implementation experiences, the relative burden of the new policy on PHAs and the costs they incurred to administer it, and the policy’s effects on families’ contributions toward their rent and utilities, employment, earnings, and receipt of housing subsidies and other government benefits.
Four PHAs agreed to join the Rent Reform Demonstration: (1) the Lexington-Fayette Urban County Housing Authority, in Kentucky (generally referred to as the Lexington Housing Au-thority); (2) the Louisville Metropolitan Housing Authority, in Kentucky; (3) the District of Columbia Housing Authority, in
Washington, D.C.; and (4) the San Antonio Housing Authority, in Texas. To be considered for the demonstration, PHAs had to be part of HUD’s Moving to Work initiative, because those agencies have special statutory authority to change many housing policies, including rent rules (provided they notify the public and receive approval from their boards of directors and HUD).2 The PHAs that joined the demonstration were interested in trying an innovative rent policy for voucher holders, but had not yet done so in a substantial way by the time recruitment for the demonstration began. The demonstration also appealed to them because it would provide strong evidence on the effective-ness of the innovation.
How the New Rent Policy Differs From HUD’s Traditional Rent PolicyCurrently, the majority of HCV families are expected to contribute 30 percent of pretax income (after certain income exclusions) toward their housing costs.3 A family’s rent contribution and utility payments are referred to as its total tenant payment (TTP). Because the TTP is set at a percentage of family income, it is intended to vary with a family’s ability to pay. Furthermore, the rules for calculating a family’s TTP allow a number of de ductions from gross income (including a deduction for some childcare costs for working parents), yielding an “adjusted income” estimate. The calculation also looks forward in time, basing the adjusted income estimate on the amount of income a family currently receives and anticipates receiving during the coming year (which this report refers to as “current or anticipated” income). The PHA provides a subsidy for the difference between the family’s rental payment and the allowable rent, called a “payment stand ard,” based on an area’s fair-market rents. PHAs are also permitted to establish a minimum TTP, commonly referred to as a “minimum rent,” of up to $50 per month, although not all have done so.
The existing “percentage-of-adjusted-income” approach builds a strong safety-net feature into the rent subsidy system; if a family’s income falls, the family pays less toward its housing
2 Moving to Work is a special HUD demonstration program that grants selected PHAs exceptions to many provisions of the U.S. Housing Act of 1937 in order to allow them to design and test innovative ways of providing federal housing assistance more efficiently, improve work and self-sufficiency outcomes for assisted families, and increase housing choices for low-income families. 3 Throughout this report, mentions of HUD’s “current” or “traditional” rent policy for voucher holders refer to the national rent policy in effect for non-Moving to Work PHAs before the passage of the Housing Opportunity Through Modernization Act of 2016.
Reducing Work Disincentives in the Housing Choice Voucher Program
Rent Reform Demonstration Baseline Report
ES-2
costs. However, some experts contend that it also implicitly “taxes” or penalizes tenants for increasing their earnings, which can depress work effort. This implicit penalty is a common tension facing means-tested income transfer programs, includ-ing welfare and food stamps. Although many families with housing assistance work, some empirical evidence supports the hypothesis that receipt of housing assistance may be associated with a modest reduction in employment and earnings.4
The traditional rent policy also requires PHAs to make continuous and administratively burdensome readjustments in TTPs and housing subsidies as a family’s income changes. The complex rules governing the calculation of income and rent have been criticized by many policymakers, PHA officials, interest groups, and others as being administratively burdensome to implement and prone to errors that can lead to improper payments.5
With these concerns in mind, HUD established four major goals for the Rent Reform Demonstration; the new rent policy should (1) simplify the administration of the rent system to reduce PHAs’ administrative burden and costs; (2) create a stronger financial incentive for families to increase their earned income; (3) continue to provide a safety net for families who cannot readily increase their earnings; and (4) minimize increases in PHAs’ average housing-subsidy expenditures per family—and, ideally, reduce those expenditures. Because these goals can sometimes involve opposing strategies, achieving the right balance is a policy challenge.
MDRC’s study team collaborated with HUD, the four PHAs participating in the demonstration, other Moving to Work agencies, and housing experts to consider the pros and cons of various policy options.6 After an extensive development phase,
HUD and the four participating PHAs agreed on a single general policy that also permitted some local variation. The general policy framework includes the following features.
• Extends, from 1 year to 3 years, the period after which a family must “recertify” its continued eligibility for the voucher program, report its income to the housing authority, and have its TTP recalculated.7
• Eliminates all deductions from income and bases a family’s TTP and housing subsidy on 28 percent of its average gross monthly income during the last 12 months (“retrospective income”).8
• Ignores income from assets when the total value of a family’s assets is less than $25,000.
• Simplifies how utility costs are determined.
• Includes a mandatory minimum TTP (minimum rent) as a direct landlord payment, which ranges in value from $50 to $150 per month across the four PHAs.9
• Limits interim recertifications (those that occur before the next required triennial review) to a maximum of one per year, to be conducted only when a family’s retrospective income falls by at least 10 percent.
• Establishes additional safeguards (hardship remedies) to protect families from excessive rent burdens, including temporary (and, in some cases, renewable) TTP reductions for families who meet specified criteria.
From the perspective of rewarding families’ work efforts, the policy’s most important feature is the shift from an annual to a triennial recertification period. During that 3-year period,
4 See Shroder (2010) for a discussion of the theory and evidence concerning work incentives and housing assistance. 5 These and other criticisms are described in Abt Associates, Inc., the Urban Institute, and Applied Real Estate Analysis, Inc. (2010), Government Accountability Office (2012), and Public Housing Authorities Directors Association (2005).6 The study team includes the Urban Institute, the Bronner Group, Quadel Consulting, Branch Associates, and professors Ingrid Gould-Ellen (New York University) and John Goering (City University of New York).7 The review of a family’s eligibility and income is referred to as a recertification. A recertification that occurs every 3 years is called a triennial recertification, which contrasts with the annual recertification required under HUD’s traditional rent policy. 8 The study team conducted a statistical modeling exercise using data obtained from some PHAs and from HUD’s national database (called the Inventory Management System or Public and Indian Housing Information Center) to estimate how a family’s TTP and the PHA’s housing-subsidy expenditures would change under different policy scenarios. These scenarios included alternative assumptions regarding the percentage of income to use in the rent formula (20 percent, 27 percent, and 28 percent). Although the 20- and 27-percent scenarios were more advantageous for tenants, they were more costly from the perspective of PHA subsidies, especially when combined with a 3-year recertification. The PHAs settled on 28 percent of gross income in an attempt to balance the elimination of deductions with the need to limit increases in Housing Assistance Payments (the subsidy payments PHAs make to landlords). Further details on the modeling exercise and the options considered can be found in MDRC (2015), available on request from MDRC.9 The PHA in Lexington established a $150 minimum rent independently, before joining the Rent Reform Demonstration. As mentioned previously, since the enact-ment of the Quality Housing and Work Responsibility Act in 1998, PHAs are also permitted (but not required) to establish minimum TTPs, typically referred to as “minimum rents,” of up to $50 per month. A family subject to a minimum rent would pay at least that amount unless it received a hardship exemption from the PHA. The Rent Reform Demonstration differs in that it requires the PHAs to set minimum TTPs and that families pay this minimum amount directly to the landlord.
Reducing Work Disincentives in the Housing Choice Voucher Program
Rent Reform Demonstration Baseline Report
ES-3
families do not report earnings increases to the PHA and do not pay any more toward their rent and utilities, no matter how much their earnings grow. The policy change effectively reduces the implicit marginal “tax” rate on earnings from 30 percent (under traditional rules) to 0 during that period.
Although some of the changes introduced by the new rent rules simplify the process of determining a family’s TTP (for example, by eliminating deductions, ignoring most asset income, and streamlining the utilities policy), other features can be administratively demanding to implement—for example, computing and verifying retrospective income when a family’s income is volatile and not well-documented or is only partially captured by the administrative records data on families’ income, to which the PHAs have access from other government sources.10 (Of course, such situations also present challenges under the existing policy, which requires estimating future income.) Adopting a 3-year recertification period is intended to reduce the overall burden on PHAs and families by reducing the volume of TTP recalculations PHAs must perform and the number of times they must interact with families, but the advantage may be partly offset by the new rules’ provisions for interim recertifications and hardship reviews.
It is important to note that the policy environment in which the demonstration is operating has not remained static. In particular, in July 2016, the federal government enacted a new law, the Housing Opportunity Through Modernization Act of 2016, to address some of the perceived shortcomings of HUD’s traditional rent policy for voucher holders.11 Still, the alternative policy being tested as part of the Rent Reform Demonstration represents a substantially larger departure from HUD’s traditional policy than does the new law (which has not yet been implemented).
Preparing To Implement the New Rent PolicyImplementing the new rent policy placed substantial new demands on the four PHAs. All of the agencies had to institute new procedures for calculating rents and completing the recer-tification process. They had to implement major adaptations
to their rent-calculation computer software to accommodate the new rules. Their housing specialists needed to understand the policy intent behind the new rent rules and the operational details of those rules; they also needed to learn how to use the new software and how to describe to families the ways in which the new rules would affect their housing subsidies. In addition, staff members needed to understand and comply with a number of special requirements and procedures associated with the random assignment evaluation of the new policy, and they had a short time to enroll and recertify the number of families needed to meet the evaluation’s sample-size requirements. Furthermore, they had to do all these things while continuing to operate the existing rent rules for the control group.
The study team had no direct operational role in the adminis-tration of the new rent rules. However, as the overall manager of the demonstration, technical-assistance provider, and evaluator of the new policy, team members worked closely with the four PHAs to specify the processes required to implement the new rent policy. It helped the agencies think through what their staffing needs would be, how they would integrate research procedures into recertification meetings, and how staff members would be trained to apply the new rent rules. The technical- assistance team prepared a procedures manual for each PHA, conducted staff training, observed recertification meetings, monitored implementation practices, and provided other forms of technical assistance intended to ensure that the new rules were implemented correctly. In addition, the study team and the PHAs worked closely with HUD on policy decisions and interpretations that affected the implementation of the new rent rules.12
The study team also collaborated with the PHAs and their soft-ware vendors to identify the modifications the vendors would need to make to the agencies’ existing software to support the new rules. The vendors then wrote computer code to incorporate the new rules into their proprietary software. After the demon-stration launched, the PHAs shared their experiences with the vendors and requested changes or adjustments, and the vendors made a number of refinements. Throughout the study’s enroll-ment period, both the study team and the software developers continued to support the PHAs as staff members learned to navigate the modified software and use it to implement the new rent policy.
10 “Administrative records” are data collected in the course of administering a program. These data are available to PHAs through the HUD Enterprise Income Verifi-cation system, which provides such information as earnings reflected in unemployment insurance wage records, unemployment insurance compensation, and Social Security and Supplemental Security Income benefits. 11 The new law includes a 3-year, rather than annual, income recertification for families on fixed incomes (such as Social Security) and the use of family income in the prior calendar year to calculate TTPs and rent subsidies (except at initial eligibility). It also eliminates the requirement for families to report increases in earned income between annual recertifications and eliminates interim recertifications to reduce a family’s TTP when that family’s income drops by less than 10 percent.12 For each PHA, the technical-assistance team includes two staff members who coordinate training in the new rent policy, monitor progress, and address problems.
Reducing Work Disincentives in the Housing Choice Voucher Program
Rent Reform Demonstration Baseline Report
ES-4
Evaluating the New Rent PolicyThe evaluation of the new rent policy will use a mixed- methods approach, drawing on a variety of qualitative and quantitative data sources. The study will assess the implementation, effects (or “impacts”), and costs of the new policy. The evaluation uses a randomized controlled trial, one of the most rigorous methods for determining the effectiveness of an intervention. Because households are assigned at random to a “new rent rules group” or to an “existing rent rules group,” any differences in outcomes that emerge over time can be confidently attributed to the new rent policy. Early implementation and impact findings will be available in 2018, and longer-term results, including findings on costs, will be available in 2019.
Implementation Analysis
The implementation analysis will examine how each PHA operates the new rent policy. PHA staff members’ experiences in calculating TTPs using the new rules will be of particular interest. The analysis will track the effort involved in estimat-ing retrospective income; determining utility allowances; and administering interim recertifications, the hardship policy, and other safeguards. The analysis will also examine how PHA staff members and voucher holders view the various features of the new policy with the following questions.
• How do staff members communicate the new rules to families, and how well do families seem to understand them?
• Overall, which elements of the new rent policy are easier or more difficult to administer?
• In practice, in what ways are the new rules more burden-some or less burdensome for agency staff members?
• Are common tensions and conflicts between families and the PHAs less evident under the new policy?
The technical-assistance team’s observations of PHA housing specialists as they conducted initial recertification meetings and calculated TTPs are one important source of information for the implementation analysis. In addition, the study team’s field researchers will visit each PHA to interview the housing specialists and their supervisors about their perspectives on the new rent policy and their experiences in implementing
it, drawing comparisons with the existing policy. The field researchers will also conduct two rounds of indepth interviews with families, in person or by telephone.
Finally, the implementation analysis will use PHA administra-tive records to examine how the new rent policy affects families’ TTPs and housing subsidies at the beginning of the new policy and throughout the demonstration. It will also measure how many families use the policy’s various safeguards, and how often.
Impact Analysis
An underlying hypothesis of the Rent Reform Demonstration is that by helping to “make work pay” (that is, by allowing families to keep more of their earnings when those earnings increase), the new rent rules will lead tenants to increase their efforts to find work, to increase their work hours, to remain employed longer, or to seek higher wages. If tenants do increase their earnings, their reliance on rental assistance and other public subsidies may eventually decline. The impact analysis will test these hypotheses by exploring questions such as the following, using various types of administrative records.13
• Do families in the new rent rules group achieve higher rates of employment and earnings than the existing rent rules group?
• Do families in the new rent rules group rely less on housing subsidies and other government benefits, such as welfare cash assistance (Temporary Assistance for Needy Families) and food stamps (the Supplemental Nutrition Assistance Program), than the existing rent rules group?
• Is the new rent policy able to improve families’ employment and earnings from work, while also protecting them from financial harm and material hardship (for example, excess rent burdens, rent arrears, and homelessness)?14
• Does the new rent policy have different effects for various groups of voucher holders?
Cost Analysis
The cost analysis will use PHA financial and staffing data, along with data from the impact analysis, to assess whether the new rent policy is more cost-effective than the existing rent policy.
13 The data sources will include unemployment insurance wage records (obtained through the federal National Directory of New Hires) for information on employ-ment; records on families’ receipt of welfare cash assistance and food stamps benefits from states’ public benefits records; records from the Homelessness Manage-ment Information System on families’ use of homeless shelters; and HUD 50058 administrative records for TTPs and housing subsidies, arrears, and evictions. (Each voucher family completes or updates a HUD 50058 form as part of its initial or recertification interview.)14 The evaluation does not include a followup survey of families, limiting the extent to which it can measure the effects of the new rent policy on material hardships and other types of family outcomes not available in administrative records.

Reducing Work Disincentives in the Housing Choice Voucher Program
Rent Reform Demonstration Baseline Report
ES-5
It will focus both on the costs of administering the new rent policy relative to the existing policy, and any increases or decreases in expenditures on Housing Assistance Payments.
Several factors could contribute to reductions in administrative costs. For example, under the new policy’s triennial recertifica-tion feature, PHA housing specialists will not have to complete two of the annual recertifications that would otherwise be required during each 3-year period that a family receives a housing subsidy. The staff might also complete fewer interim recertifications because of the one-per-year limit, and should spend less time computing utility allowances, and calculating and verifying complicated income deductions (especially those for childcare). On the other hand, some administrative cost savings may be offset to the extent that calculating retrospec-tive income for families takes more time than calculating current or anticipated income. Administrative cost savings may also be offset by the time that staff members spend processing requests for hardship remedies.
The new policy’s effects on PHAs’ expenditures for housing may be especially important to the policy’s overall cost- effectiveness. The statistical modeling exercise described in an earlier footnote suggests that during the first 3 years (before families in the new rent rules group reach their first triennial recertifications), PHAs may spend more on subsidies for families in the new rent rules group than they would under the traditional rent policy. Unlike the traditional rules, for the first 3 years the new rules will not reduce subsidies for families who earn more from work. Once families with more earned income complete their triennial recertification, however, their rent contributions will increase, allowing PHAs to reduce subsidies for those families and thus recoup some of the extra subsidy payments the PHAs had to forgo earlier.
The modeling exercise suggests that if the new rent policy has little effect on tenants’ earnings, the PHAs may end up spending—cumulatively—about the same amount in housing subsidies for the new rent rules group as for the existing rent rules group. If the policy has a substantial positive effect on tenants’ earnings, PHAs’ cumulative subsidy expenditures may be lower for the new rent rules group, because after the triennial recertification, families who are earning more from work will be making greater rent contributions.15 The evaluation will measure the new rent policy’s effects on the
year-by-year and cumulative expenditures of PHAs on housing subsidies, and combine these totals with estimates of any effects on administrative costs, to arrive at an overall assessment of the costs of the new rent rules relative to the existing policy.
Characteristics of Enrolled FamiliesDuring the 10 months from February 2015 through November 2015, the four PHAs and the study team identified a total of 7,255 voucher holders who were scheduled for annual income reviews and recertifications and who were likely to qualify for the demonstration. Within each PHA, these families were then ran-domly assigned to a program group that would be subject to the new rent rules, or to a control group that would continue to be subject to the existing rent rules.16 Families were enrolled into the research sample before they began the annual recertification process. However, a number of families were subsequently found to be ineligible for the study and were excluded from the sample, yielding a final sample size of 6,660 families.
In order to have national policy relevance, the study must test the new rent rules with voucher holders who are broadly similar to (rather than substantially atypical of) the population of working-age, nondisabled voucher holders across the country. Of course, with only four PHAs in the demonstration, it is impossible to create a research sample that strictly represents this population. Still, the PHAs involved were chosen to yield a sample that would broadly reflect that population. To assess how closely the demonstration sample aligns with the national sample, the study team compared the families in the demonstration with the national population of working-age, nondisabled voucher holders.
The families in the study sample are roughly similar to working-age, nondisabled voucher holders nationally, but may be somewhat more disadvantaged.
Although some differences in background characteristics are evident, the two groups have roughly similar profiles overall.17 According to administrative records, the vast majority of house-holds in the study sample and in the relevant national voucher population are headed by women (94 percent and 89 percent, respectively), and, on average, household heads in both groups are about 39 years old. The average household size in both groups is slightly more than three family members. In addition,
15 See MDRC (2015), which is available on request from MDRC. 16 In Louisville, a special agreement with the PHA enabled families in the new rent rules group to opt out of the new policy, an option that about 22 percent of families took (although, as described in the body of this report, most did not opt out of the evaluation).17 The estimates for the national population are for tenant-based HCV families at Moving to Work and non-Moving to Work PHAs who would meet the study’s eligi-bility criteria. They are based on data obtained from HUD’s Public and Indian Housing Information Center.

Reducing Work Disincentives in the Housing Choice Voucher Program
Rent Reform Demonstration Baseline Report
ES-6
only about one-third of families in both groups have more than one adult living in the household, and about one-quarter overall have no children under the age of 18. The study PHAs vary considerably among themselves when it comes to children in the household; however, in Washington, D.C., 35 percent of families have no children under the age of 18, compared with 14 percent to 22 percent of the other PHAs’ families. The discrepancy with children in the household may partly reflect the fact that the heads of households in Washington, D.C., are older; over 40 percent are 45 or older compared with 18 percent to 22 percent of the heads of other PHAs’ households.
More differences can be seen between the study sample and the national voucher population when it comes to racial and ethnic composition. Although the majority of household heads in both samples are Black or African-American, the group is more highly represented in the study sample (69 percent versus 59 percent nationally). Hispanic or Latino heads of households of any race also make up a somewhat higher proportion of the study sample (23 percent versus 19 percent). The study sample itself also varies among PHAs. For example, in Lexington, Louisville, and Washington, D.C., the majority of heads of households are non-Hispanic/Latino Black or African-American, compared with 22 percent in San Antonio. Three-quarters of San Antonio’s heads of households (of any race) are Hispanic or Latino.
Economically, the study sample appears to be somewhat more disadvantaged than the national voucher population, and is less likely to be working. A smaller proportion of study fami-lies have any income from wages than families in the national voucher population (42 percent compared with 58 percent nationally). However, the proportion of families receiving cash welfare payments is fairly comparable—and low—across the two groups (14 percent compared with 12 percent nationally). The study sample’s average monthly TTP ($256) is somewhat lower than that of the national voucher population ($326).
Many families were contending with significant barriers to employment and material hardships.
According to a brief survey of study families at the time of sam-ple enrollment, 26 percent of household heads reported having no high school diploma or equivalent, and only 12 percent had 2- or 4-year college degrees. In addition, 54 percent of survey respondents reported facing potential impediments to employ-ment, such as physical, emotional, or mental health problems they believed limited their ability to work or the kind of work they could do (31 percent of all respondents), or difficulty affording childcare (21 percent of all respondents).
Almost 70 percent of baseline survey respondents said that they had experienced a financial hardship at some time in the last year, such as an inability to pay utility bills (46 percent), telephone bills (34 percent), or rent (20 percent). About 28 percent indicated that they sometimes did not have enough money to buy food.
Families’ Housing Payments and Sub-sidies Under the New Policy
The initial TTPs calculated after study enrollment were somewhat lower for families in the new rent rules group than in the existing rent rules group. Consequently, their housing subsidies were somewhat higher.
For families subject to the new rent rules, the average new initial TTP under the new policy ($289 per month) was about $20 lower than the average new TTP for the existing rent rules group calculated at the same time after entering the study ($310 per month), or about 6 percent lower. (See table ES.1.) The lower TTP means that the average housing subsidy for the new rent rules group was higher, by about 2.6 percent ($834 compared with $813 for the existing rent rules group). This pattern held for three of the four PHAs. Louisville’s pattern is somewhat different. For that PHA, the average monthly TTP was slightly higher for the new rent rules group (by $12), and the average housing subsidy was lower (by $10). The difference reflects the fact that in Louisville, the average base income for calculating a family’s TTP was higher for the new rent rules group than for the existing rent rules group.
The new rent rules have reduced the proportions of families paying very low and very high TTPs at the time of the initial recertification.
For all PHAs combined, the new rent rules group had lower proportions of families paying no TTP at all and families paying more than $700 per month than was the case in the existing rent rules group (table ES.1). Most of the reduction in the proportion paying no TTP came from two of the PHAs— Louisville and Washington, D.C.—where, unlike Lexington and San Antonio, the existing rent rules do not include a minimum TTP. Because of the minimum TTP provision in the new rules, zero-income families in the new rent rules group would be expected to pay $50 per month in Louisville and $75 in Washington, D.C., unless they applied for and received hardship remedies. (As noted in the following, few families had received hardship remedies at the time this report was written.)

Reducing Work Disincentives in the Housing Choice Voucher Program
Rent Reform Demonstration Baseline Report
ES-7
Table ES.1. Total Tenant Payment (TTP) at Initial Study Certification, by Public Housing Agency (PHA)
Outcome New Rent Rules
Existing Rent Rules Difference
All PHAsAverage TTPa ($) 289 310 – 20TTPa (%) $0 1.9 9.1 – 7.2
$1–$50 5.8 11.5 – 5.7$51–$75 9.7 4.1 5.7$76–$100 9.0 3.3 5.7$101–$150 13.4 11.1 2.3$151–$300 25.3 20.9 4.4$301–$700 27.5 29.5 – 2.0$701 or more 7.4 10.5 – 3.1
Sample size (total = 6,208) 3,118 3,090
LexingtonAverage TTPa ($) 265 321 – 56TTPa (%) $0 0.0 0.0 0.0
$1–$50 0.0 0.2 – 0.2$51–$75 0.0 0.0 0.0$76–$100 0.0 0.0 0.0$101–$150 44.2 38.3 5.9$151–$300 26.8 19.9 7.0$301–$700 26.0 34.9 – 8.9$701 or more 3.0 6.7 – 3.7
Sample size (total = 951) 473 478
LouisvilleAverage TTPa ($) 225 213 12TTPa (%) $0 6.1 16.1 – 10.0
$1–$50 19.9 17.9 2.0$51–$75 5.7 5.5 0.2$76–$100 3.9 2.7 1.2$101–$150 7.1 5.3 1.8$151–$300 27.6 24.5 3.1$301–$700 27.5 23.9 3.6$701 or more 2.2 4.2 – 1.9
Sample size (total = 1,729) 891 838
Outcome New Rent Rules
Existing Rent Rules Difference
San AntonioAverage TTPa ($) 279 311 – 32TTPa (%) $0 0.0 0.0 0.0
$1–$50 0.2 10.5 – 10.2$51–$75 0.0 6.2 – 6.2$76–$100 23.0 5.3 17.7$101–$150 10.7 8.6 2.1$151–$300 30.9 25.4 5.5$301–$700 31.2 37.2 – 6.0$701 or more 4.0 6.8 – 2.8
Sample size (total = 1,720) 857 863
Washington, D.C.Average TTPa ($) 376 392 – 15TTPa (%) $0 0.6 16.1 – 15.5
$1–$50 0.0 12.4 – 12.4$51–$75 28.2 2.9 25.3$76–$100 5.5 3.7 1.8$101–$150 6.0 4.5 1.5$151–$300 16.9 14.0 2.9$301–$700 24.6 24.6 0.0$701 or more 18.2 21.9 – 3.7
Sample size (total = 1,808) 897 911
a TTP is the minimum amount a family must contribute toward rent and utilities regardless of the unit selected. Under the new rent rules TTP is 28 percent of prior-year income, and under the existing rent rules TTP is 30 percent of adjusted income.Notes: Sample sizes for specific outcomes may vary because of missing values. Rounding may cause slight discrepancies in calculating sums and differences. Statisti-cal tests were not performed.Source: MDRC calculations using PHA data
A substantial proportion of the families facing high TTPs relative to their current or anticipated incomes at the time of their initial recertifications automatically received “grace-period” reductions.
If, at the initial income recertification interview, a family’s current or anticipated income was more than 10 percent lower than its income in the previous year, the family automatically received a 6-month grace-period TTP based on 28 percent of its current or anticipated income (or the minimum TTP— unless a hardship remedy was requested and received). About 29 percent of families were granted grace-period TTPs, ranging
from 24 percent in San Antonio to 35 percent in Lexington. At the end of the 6-month grace period, rent for these families would be reset based on the retrospective incomes they reported at the recertification interview. If a family had not mostly restored its average monthly income to its prior-year level, however, it could request an interim recertification or a hardship remedy and continue paying a lower TTP.
Some families in the new rent rules group are paying initial TTPs that are more than 40 percent of their current or anticipated incomes. The proportion would be lower if more families received hardship waivers of the minimum TTP.

Reducing Work Disincentives in the Housing Choice Voucher Program
Rent Reform Demonstration Baseline Report
ES-8
The new rent policy defines a family as having an “excessive rent burden” if its TTP is greater than 40 percent of its current or anticipated gross income. Across the PHAs, 18 percent of families met this definition, ranging from 8 percent in San Antonio to 30 percent in Lexington. In most cases, the rent burden resulted from the requirement that families pay a minimum TTP.
Such families meeting the 40-percent threshold may request a hardship remedy, which may result in a lower TTP. Less than 1 percent of the families across all four PHAs who potentially qualified for hardship remedies at the start of the new rent policy actually received them, however. This fact suggests that a more extensive use of the hardship policy would lower the proportion of families paying TTPs that exceeded the 40-percent threshold (except in Lexington).18
It is not clear why families who potentially qualified for hardship remedies did not request them. Perhaps they did not remember the hardship provisions of the new rent policy or did not realize that they might qualify. Some may have simply chosen not to apply, perhaps because they wanted to minimize further interactions with the housing agency (such as those required to request a hardship remedy), or perhaps some experienced a change in circumstances soon after their new TTPs were set. As evidence of this pattern began to emerge, all PHAs modified
their procedures and mailed letters to all potentially eligible families (that is, those whom the PHA knew had TTPs that exceeded the 40-percent threshold) that reminded them of the hardship provision. In addition, the PHAs mailed a separate flyer to all families in the new rent rules group reminding them that they might qualify for reduced TTPs if their incomes fell before their 3-year recertifications. The flyer also reminded families of the “opportunity” side of the new policy—that is, that if they increased their earnings, they would not have to report those increases to the PHA and would not have to pay higher TTPs during the 3-year period. Families’ responses to these communications will be explored in a later report.
Next Steps in the EvaluationIt is too soon to draw conclusions about the extent to which the new rent policy is achieving its important objectives for families and PHAs. As previously noted, reports scheduled for 2018 and 2019 will examine the PHAs’ experiences in operating the new policy and the costs of administering that policy. They will also present findings on the policy’s effects on how much tenants work and earn, how much families rely on rent subsidies and other government benefits, and how much the PHAs spend on housing subsidies. This report sets the stage for those analyses.
18 In Lexington, a family is not exempt from paying the $150 minimum TTP even if it meets the demonstration’s hardship threshold. As mentioned previously, the minimum TTP predates the demonstration there.

Reducing Work Disincentives in the Housing Choice Voucher Program
Rent Reform Demonstration Baseline Report
1
Chapter 1. Introduction
Government rent subsidies for low-income families are a vital component of the nation’s social safety net. With funding from the U.S. Department of Housing and Urban Development (HUD), approximately 2.2 million low-income households across the country receive housing assistance from tenant-based Housing Choice Vouchers (HCVs)—“portable” subsidies for families living in privately owned housing units—that are provided by 2,243 public housing agencies (PHAs).19 For decades, however, the ways rental subsidies have been calculated and administered have been controversial. Critics have assailed the traditional policy as administratively complex and expensive for PHAs to administer and difficult for families to comprehend. They have also said that they discourage, rather than support, families’ efforts to increase their employment and earnings.20
As one step toward addressing those problems, HUD launched the Rent Reform Demonstration, a new initiative to design and carefully evaluate an alternative rent-subsidy policy using a randomized controlled trial. HUD selected MDRC to lead the initiative, working closely with a small number of local PHAs and HUD.21 The demonstration focuses on recipients of tenant-based HCVs.22
It is important to note that in July 2016 the federal government enacted a new law, the Housing Opportunity Through Modern-ization Act of 2016, to address some of challenges imposed by HUD’s traditional rent policy for voucher holders. In a number of important respects, however, the new rent policy that the Rent Reform Demonstration is testing remains a bolder approach
than the new law (which has not yet been implemented). The findings from the study are therefore expected to contribute evi-dence that is very relevant to continuing conversations about the best ways of providing rent subsidies to low-income families.
The process of designing the demonstration began in 2013. The process of selecting PHAs to participate was completed in 2014,23 and eligible families were selected for the study sample in 2015. Four PHAs are taking part in the demonstration.
• Lexington-Fayette Urban County Housing Authority in Lexington, Kentucky (generally referred to as the Lexington Housing Authority).
• Louisville Metropolitan Housing Authority in Louisville, Kentucky.
• San Antonio Housing Authority in San Antonio, Texas.
• District of Columbia Housing Authority in Washington, D.C.
These 4 PHAs are a subset of the 39 agencies that, at the time the project was launched, were part of HUD’s Moving to Work demonstration.24 Only Moving to Work agencies were considered for the Rent Reform experiment because they are the only PHAs authorized by Congress to make changes in many housing policies, provided they notify the public and receive approval from HUD and from their boards of directors. They have the administrative flexibility to change certain policies, which extends to rent rules, that would otherwise require changes in legislation or regulations.25
19 HUD (2015). The total number of PHAs nationally is 3,895. Formerly referred to as Section 8 vouchers, HCVs are portable in the sense that if a family moves, it can take its subsidy with it and use the voucher with a new landlord of its own choosing, as long as the housing unit meets the PHA’s quality standards. HCVs differ from project-based Section 8 assistance, in which a subsidy is attached to a particular housing unit through a contract between the PHA and a private landlord.20 See Abt Associates, Inc., the Urban Institute, and Applied Real Estate Analysis, Inc. (2010). See also Government Accountability Office (2012) and Public Housing Authorities Directors Association (2005).21 The study team includes technical-assistance housing experts from the Bronner Group and Quadel Consulting, research experts from the Urban Institute and Branch Associates, and professors Ingrid Gould-Ellen (New York University) and John Goering (City University of New York). 22 Families receiving types of vouchers other than tenant-based HCVs were not eligible for the Rent Reform Demonstration. 23 For more information on the process of selecting PHAs to participate in the demonstration, see appendix A.24 Many of the 39 agencies were not suitable candidates for the demonstration because they had already broadly implemented new rent policies, making it difficult or impossible to identify families who were still subject to HUD’s traditional rent rules and could serve as an appropriate control group for the new policy. Also, some Moving to Work agencies had qualifying voucher populations that were too small for the purposes of the evaluation. Other agencies had other priorities that made it difficult to take on the demands of a new demonstration project. 25 According to the Moving to Work Agreement, Moving to Work agencies have the authority to adopt and implement any reasonable policies to calculate tenants’ contributions toward their rents that differ from the program requirements as mandated in the 1937 Act and its current implementing regulations. The four PHAs in the Rent Reform Demonstration were still largely following HUD’s traditional rent policy at the start of the demonstration, with some exceptions that are discussed later in this chapter and in chapter 2. Appendix table B.1 illustrates some of the variations in existing policies that the four PHAs in the Rent Reform Demonstration had already adopted before the demonstration began.
Reducing Work Disincentives in the Housing Choice Voucher Program
Rent Reform Demonstration Baseline Report
2
This report is the first of several that will be issued over the course of the study. It describes the new rent policy, the rationale behind each of its critical elements, and the manner in which the policy is being evaluated. It also describes the process for identifying and enrolling families into the study, those families’ background characteristics, the amounts they have begun paying for their rent and utilities under the new rent rules compared with the existing rules, and the housing subsidies they initially received. Future reports to be released in 2018 and 2019 will examine the PHAs’ implementation experiences and the costs of administering the new rules; the new rules’ effects over time on families’ rent and utility payments; and their effects on families’ employment, earnings, and receipt of housing subsidies and other government benefits (including welfare and food stamps).
This chapter sets the stage for the remainder of the report. It briefly reviews why rent reform has emerged as an important public policy issue and, in general, how the new rent rules are intended to respond to criticisms of the traditional rent policy. (Chapter 2 includes a more indepth discussion of the new rules and the rationales behind them.)
The Rent Reform Debate To understand the rent policy controversy, it is important to understand some basic features of HUD’s traditional rent rules as these apply to voucher holders.26 These rules establish how much of its income a family is normally expected to contribute toward its housing costs (that is, toward rent and utilities), and how expensive a housing unit a family is permitted to rent with a government subsidy.
Most families receiving a HCV are expected to contribute 30 percent of their “adjusted monthly incomes” toward their housing costs. This contribution is referred to as a family’s total tenant payment (TTP). Adjusted income refers to net income after taking into account certain deductions from a family’s pretax income.27 The PHA provides a subsidy for the difference between a family’s TTP and the PHA’s “payment standard,” which is the maximum monthly assistance payment for a family in the
voucher program, before deducting the TTP. (Box 1.1 illustrates this and other important concepts in determining a family’s TTP and housing subsidy.) More specifically, the payment stan-dard refers to the maximum cost of a rental unit of a given size (based on the number of bedrooms) that HUD will cover with a subsidy. Payment standards are intended to ensure that families have access to safe and decent housing, while also limiting the amount of the subsidy provided to any given family (to limit
Box 1.1. Important Concepts in Determining Housing Subsidies
Payment standard: The maximum monthly assistance payment for a family assisted in the voucher program (before deducting the total tenant payment by the family).
Contract rent: Full rental cost charged by landlord (may or may not include utilities).
Gross rent: Total contract rent + utilities (if not included in contract rent).
TTP: Total tenant payment for rent and utilities (used in com-puting housing subsidy).
Family share: TTP + any extra housing cost above the pay-ment standard, paid by family.
HAP: Housing Assistance Payment (that is, total subsidy for rent and utilities).
26 Throughout this report, mentions of HUD’s “current” or “traditional” rent policy for voucher holders refer to the national rent policy in effect for non-Moving to Work PHAs before the passage and implementation of the Housing Opportunity Through Modernization Act of 2016.27 HUD rules specify what resources count as income. For example, earnings and cash payments from welfare and other government benefit programs count, but food stamps and Earned Income Tax Credit payments do not. Deductions include a standard deduction of $480 per child and $400 if the household is “elderly” or “disabled,” as defined in the Code of Federal Regulations (see chapter 2). Households can also receive deductions for documented childcare expenses, expenses for the care of people with disabilities, and medical expenses (for elderly family members or those with disabilities). The household’s TTP is calculated as the largest of the following: 30 percent of adjusted income, 10 percent of gross income (that is, income before deductions), the welfare rent (that is, the amount of a family’s public assistance or welfare payment that is earmarked for rent and utilities), or the minimum rent (if the PHA has established a minimum rent). A family is also allowed to lease a unit that would require it to pay up to 40 percent of its adjusted income for rent and utilities when it first receives a voucher or moves to a new unit. For a full explanation of the HUD’s existing rent rules, see HUD (2001).
Reducing Work Disincentives in the Housing Choice Voucher Program
Rent Reform Demonstration Baseline Report
3
government costs).28 In the HCV program, a family is allowed to pay an additional amount, at its own expense, for rent in a housing unit that has a rent above the payment standard. However, at the beginning of a new lease, the family’s total expenditures for that unit must not constitute more than 40 percent of its adjusted income. A family can also choose to pay additional rent above the payment standard if it must do so to remain in its current housing unit (for example, if the landlord raises the rent); in such cases, the family is allowed to pay more than 40 percent of its adjusted income.
Since the enactment of the Quality Housing and Work Respon-sibility Act in 1998, PHAs have also been permitted to establish minimum TTPs, typically referred to as “minimum rents,” of up to $50 per month. A family subject to a minimum TTP would pay at least that amount, regardless of its income, unless it received a hardship exemption from the PHA.
The primary rationale that HUD and Congress have embraced for the “percentage-of-income” rent policy is protecting low- income and very low-income families from paying an “excessive” proportion of their incomes for rent. Under this rent policy, the amount that a family contributes toward its housing costs will be higher or lower, depending on its income. Although this policy means that a family will pay more if its income grows, it will also pay less if its income falls—an important safety-net feature. Low-income housing advocates have staunchly defended this policy as essential to protecting vulnerable families and children (Abt Associates, Inc., the Urban Institute, and Applied Real Estate Analysis, Inc., 2010).
At the same time, percentage-of-income system has been criticized by public housing industry groups and others as allegedly having unintended negative consequences for: (1) tenant labor force participation (see below), (2) tenant turnover (which, when low, limits the number of similarly needy households that can be offered subsidies, raising questions of fairness or horizontal equity), (3) intrusiveness in tenants’ lives, (4) accuracy of reported income, (5) the inclusion on the lease of additional working adults, (6) PHA finances, and (7) PHA administrative complexities and costs (Abt Associates, Inc., the Urban Institute, and Applied Real Estate Analysis, Inc., 2010). Also, PHA
admin istrators have reported that the current system sometimes confuses voucher applicants and recipients with respect to what rents they are expected to pay from year to year, and that it has adverse effects on morale of PHA staff who have to (invasively) collect and verify households’ incomes. These and other criti-cisms are described in Abt Associates, Inc., the Urban Institute, and Applied Real Estate Analysis, Inc. (2010), Government Accountability Office (2012), and Public Housing Authorities Directors Association (2005).
Rent Subsidies and Tenants’ Labor Force Participation
Among the challenges of designing a rent policy, one of the most complex is how to encourage tenants to increase their earnings, while ensuring that families with lower incomes (and higher need) will receive larger subsidies. This tension is inherent in means-tested benefit programs in which benefit amounts rise and fall as incomes change. Facing a reduction in benefits if their earnings increase, some benefit recipients may choose to work less or not at all to avoid losing benefits.
Although it is widely assumed that housing subsidies, like other means-tested transfer benefits, have a negative effect on labor supply, the theoretical rationale is not obvious. Because housing subsidies are an in-kind benefit, tenants may view the subsidy more like a price cut to a commodity that allows them to consume more housing or other goods and services with the same level of earnings. As such, they may see no reason to reduce their earnings simply because they are receiving housing assistance. Thus, from a theoretical standpoint, one might argue that housing assistance would not necessarily depress earnings.29
Evidence from several U.S. studies, however, offers support for the hypothesis that housing subsidies do indeed lead to a reduc-tion in work effort. They show that although many recipients of housing subsidies do work, housing assistance is associated, on average, with modest reductions in employment and earnings.30 A number of studies have found also evidence that some reduction in labor supply is associated with receipt of cash welfare and food stamps.31 The reduction is hypothesized to occur through a work disincentive (substitution) effect or an income effect.
28 Payment standards are tied to local Fair Market Rents. An area’s Fair Market Rent represents a point on the distribution of all rents charged by private landlords for standard housing units. It is typically set at the 40th percentile, meaning that 40 percent of all housing units in the area would rent for no more than that amount (see the Code of Federal Regulations, 24 CFR 888.113). As specified in the Code of Federal Regulations (24 CFR 982.503), a PHA may set its payment standards, for units of varying sizes, from 90 percent to 110 percent of the published Fair Market Rents for its area, and may adopt higher or lower levels with HUD approval. 29 See Shroder (2010) for a discussion of the theoretical perspective. 30 Shroder (2010) summarizes the findings from these studies, which include an evaluation of the effects of offering housing vouchers to families exiting welfare (Mills et al., 2006); a study of the effects of housing voucher receipt using a housing lottery in Chicago (Jacob and Ludwig, 2012); and a propensity score analysis of voucher holders in Wisconsin (Carlson et al., 2012).31 See Hoynes and Schanzenbach (2010) for a discussion of work incentives in the food stamp program that draws comparisons to the broader literature on labor supply and other transfer programs.

Reducing Work Disincentives in the Housing Choice Voucher Program
Rent Reform Demonstration Baseline Report
4
The disincentive effect can occur because the benefit reduction acts as an implicit tax on earnings, so that every extra dollar earned yields less than a dollar of extra income. The higher the benefit reduction rate, the lower the increase in net income derived from an extra dollar of earnings. In the case of housing subsidies, under traditional rent rules, families face an implicit marginal tax rate of about 30 percent for each extra dollar they earn. If they also receive other means-tested benefits, such as Temporary Assistance for Needy Families, or TANF, or the Supplemental Nutrition Assistance Program, or SNAP, they face an even higher combined marginal tax on earnings. At some point, individuals may decide that it does not “pay” to work, or to increase the hours they work, because the extra effort may not lead to a meaningful improvement in their standard of living. Moreover, some recipients whose income is close to the threshold at which they would no longer qualify for benefits (often referred to as a benefits “cliff”) may strive to keep their earnings below that threshold, especially for benefits like housing subsidies, which may be difficult to regain once lost.
An income effect can depress work effort through a different mechanism. It can occur if an individual views a means-tested income subsidy as a way to maintain the same standard of living with less work effort.
Supporters of rent reform have argued for a variety of changes in rent rules that would reward work, as the next section shows. Little direct, rigorous evidence, however, exists on how such reforms would actually affect tenants’ labor supply. A number of welfare reform experiments offer suggestive evidence showing that employment interventions that included special financial incentives conditioned on work (particularly full-time work), which were designed to help “make work pay,” had positive effects on participants’ employment rates and average earnings.32 Other relevant evidence comes from a study of voucher hold-ers in New York City that tested an earnings supplement for full-time work that was offered separately from the normal rent rules. That study found no effects on labor market outcomes when the incentives were offered alone (that is, without any employment-related services). However, when offered as part of a Family Self-Sufficiency (FSS) program, the incentives and employment-related services had substantial positive effects on tenants’ employment and earnings, although these effects were limited to tenants who were not already working when they entered the study (Nuñez, Verma, and Yang, 2015).
Additional evidence comes from the Jobs-Plus evaluation, which tested an employment intervention in public housing. Jobs-Plus included changes in rent rules that held down the increases in residents’ TTP amounts when they increased their earnings. A number of patterns in the data from that study suggest that the alternative rent policy contributed to the positive effects of Jobs-Plus on tenants’ earnings. However, because that rent policy was tested in combination with other services and supports offered to residents, it is impossible to know for sure how much of the earnings effect was attributable to that feature of the program (Bloom, Riccio, and Verma, 2005; Riccio, 2010). The Rent Reform Demonstration will provide the first direct evi-dence from a randomized trial of how tenants’ employment and earnings are affected solely by introducing a new rent policy that rewards work, without any other work-related interventions.
Proposals for Reform
Numerous policymakers and stakeholders have advocated reform of the traditional rent system to reduce adverse impacts on families, to simplify the administration of the system, or to address the financial condition of PHAs. Policy reform has been elusive, however, because moving to a new system involves fundamental tradeoffs that have made it hard to achieve agree ment and because of a lack of evidence concerning the effects of alter native approaches. For example, simplifying the rent structure (for example, by basing subsidies on unit size) may make it more difficult to ensure that families with the greatest need receive the most assistance. At the same time, offering deep subsidies for an unlimited term makes it difficult to serve equally needy families on waiting lists—given that HUD’s housing subsidies are not an entitlement (that is, are not available to all families who qualify for them), but are limited by the amount of money Congress chooses to allocate for them. Also, the advantages of standards and protections built into a generally common or consistent federal approach must be weighed against the benefits of allowing local agencies to set rent rules based only on local needs, conditions, and philosophies. Another source of tension arises from the need to find the right balance between a strict focus on providing decent affordable housing and meeting other objectives, such as family self-suf-ficiency. These tradeoffs have been discussed and debated for years, with little produced in the way of definitive new evidence about the consequences of changing current rules.
32 See Michalopoulos (2005) for a summary of findings from four experiments that tested financial work incentives in Connecticut, Minnesota, Wisconsin, and Can-ada. The incentives took the form of an increase in the amount of earnings that were disregarded when calculating welfare benefits (thus letting welfare recipients keep more of benefits along with their earnings), or in the form of special wage supplements conditioned on full-time work.

Reducing Work Disincentives in the Housing Choice Voucher Program
Rent Reform Demonstration Baseline Report
5
Other new rent systems have been contemplated, and several have already been adopted by some Moving to Work agencies. These new systems include (1) modifications to the percent-age-of-income calculation (either to income adjustments involving deductions or disregards, or to the percentage itself, for example, by tying different percentages to different income bands); (2) modifications to the payment standard system; (3) various versions of stepped or tiered subsidies, such as a stepped-down subsidy with a subsidy floor; (4) flat subsidies; (5) rent ceilings; (6) variations in the amount of the minimum TTP; and (7) various hybrid models, such as applying a flat subsidy until a household reaches an income threshold and then applying a percentage-of-income rent.33 Discussions of rent reform have also considered time limits on households’ rent subsidies in conjunction with other changes in rent policies. Evidence on the effects of these policies on tenants’ employment and other outcomes is quite limited, and the policies have not been tested in randomized trials or strong quasi-experimental research designs.
A number of proposals have been suggested explicitly to reduce the administrative burdens and costs of the rent-setting process. The proposals include less frequent collection and verification of income (because rent calculations are time con suming and complex to complete) and eliminating deductions that can be complicated to calculate. PHAs have also expressed a desire for simpler ways of estimating utilities costs when utilities are not already included in a unit’s rent. It is often quite difficult for PHAs to estimate utilities costs, with payments varying across households, according to differences in the types of dwellings, the number of bedrooms, and other factors.
In March 2016, HUD sought to address some of these con-cerns by issuing a number of “streamlining” rules that apply to all PHAs.34 Various legislative proposals over the last few years have also included recommendations along these lines for the voucher program, and a number of these and other provisions were included in the Housing Opportunities Through Modern-ization Act of 2016, signed into law in July 2016. The new law includes a 3-year, rather than annual, income recertification for families on fixed incomes (such as Social Security), who are
excluded from the Rent Reform Demonstration; allows PHAs to use family income in the calendar year just past to calculate TTPs and rent subsidies (except at initial eligibility); eliminates the requirement for families to report increases in earned income between annual recertifications (codifying an option that had previously been left to local PHA discretion); and eliminates interim recertifications for families’ whose incomes drop by less than 10 percent.
Although many ideas have been proposed for reforming the tra-ditional rent system, little evidence exists on these ideas’ effects on subsidized households, on PHA administrative practices and costs, or on housing-subsidy expenditures. HUD intends for the Rent Reform Demonstration to help fill that knowledge gap.
Designing the New Rent PolicyThe goals of the new rent policy are to—
(1) Simplify the administration of the voucher rent system to improve transparency, reduce the burden on PHAs and households, and reduce administrative costs.
(2) Increase the financial incentive for tenants to work, increase their earnings, and advance toward self-sufficiency.
(3) Continue to provide a safety net for tenants who cannot readily work or who lose jobs.
(4) Minimize any increases in PHAs’ average housing-subsidy expenditures, and, ideally, reduce those costs.
Savings in average subsidy and administrative costs may make it possible to offer housing assistance to more low-income families, many of whom spend years on waiting lists and, in many cases, never receive assistance.
To develop a new rent model, the study team worked closely with HUD and, initially, with 10 PHAs that had expressed interest in joining the demonstration, and then more intensively with the final group of 4 agencies that actually joined.35 It was vital to design a policy in close partnership with PHAs because they brought real-world expertise to the process, and also
33 For a discussion of these options, see Abt Associates Inc., the Urban Institute, and Applied Real Estate Analysis, Inc. (2010). 34 Among the rules HUD issued in March 2016 are changes that allow for streamlined recertification for families living primarily on fixed incomes (such as Social Security benefits); allow a family to declare without verification that its assets do not exceed $5,000; allow quarterly payment of utility reimbursements that are less than $45 per quarter; allow for the inspection of units every 2 years, rather than every year; allow for the use of alternate inspection methods; and eliminate the re-quirement to reexamine income when a new family member is added. For the full set of streamlining rules, see 81 CFR 12353 and HUD Office of Public and Indian Housing Notice PIH 2016-05 (HA).35 As previously noted, only Moving to Work agencies were eligible for the demonstration. Very small Moving to Work agencies and those that had already imple-mented substantial rent reform policies were eliminated from consideration because they could not meet the conditions for a random assignment evaluation. Other potentially eligible PHAs were contending with a variety of other priorities or issues that made it difficult for them to participate in the demonstration.

Reducing Work Disincentives in the Housing Choice Voucher Program
Rent Reform Demonstration Baseline Report
6
because it was unlikely any PHA would implement a new rent policy and participate in an evaluation if it had little or no say in the policy design and no sense of ownership over the policy.
As part of the policy design process, the study team, HUD, and the 10 PHAs reviewed a range of possible rent reform ideas, including those discussed in Abt Associates Inc., the Urban Institute, and Applied Real Estate Analysis, Inc. (2010). That study collected perspectives on rent reform options from voucher recipients, residents of public housing, waiting-list applicants, and PHA staff members. During the consultation process, the study team sought to identify a common set of approaches all the candidate PHAs would be willing to adopt.36
The study team also conducted a variety of statistical analyses, using national data from HUD and data from a subset of the candidate PHAs, to assess the possible implications of how new approaches might affect households’ rents, households’ net incomes, and PHAs’ housing-subsidy expenditures.37 In addition to these planning efforts, the study team and HUD conferred with representatives of the low-income-housing advocacy community about various design options as they formulated the new policy.38 Leading up to the launch of the demonstration, the study team also worked with each PHA to integrate details of the new rent policy and the Rent Reform Demonstration into its draft annual Moving to Work activity plan, which the PHA then made available for public comment. Once public comments were addressed, each PHA board approved the plan, which was then submitted to HUD’s Moving to Work office for final approval.
The result of those consultations, analyses, and reviews is an alternative rent model that includes several core features that
all four PHAs in the demonstration agreed to implement, while leaving some room for PHAs to adapt those features to local conditions.
Overview of the New Rent Policy The new rent policy applies only to working-age, nondisabled voucher recipients.39 It includes the following core features (which are discussed in more detail in chapter 2).
Changes in rules for recertifying families’ continued eligibility for the voucher program and recomputing their TTPs—
• Replacing the annual recertification schedule with a triennial schedule, so that a family is only required to review its income with the PHA every 3 years. This change means that if a family increases its earnings during that period, it is not required to report the increase to the PHA and its TTP will not be raised.
• Limiting interim recertifications for reductions in income (before the next required triennial review) to a maximum of one per year, and only when a family’s average gross monthly retrospective income over the previous 12 months) falls by at least 10 percent. This change limits the volume of TTP adjustments the PHA makes (because normally they must be made whenever families report income gains or losses of any amount), while still protecting families when their incomes drop substantially.
Changes in the formula for calculating a family’s TTP and subsidy—
• Eliminating all deductions from income, so that gross income, rather than adjusted income, is the basis for calculating a family’s TTP.
36 One popular reform, a tiered rent structure, was among the options given serious consideration. However, it was ultimately rejected, in part out of concern that a small number of wide income bands with large differences in TTP rates from one band to the next could create sizable work disincentives as tenant income ap-proached the top of a band (that is to say, a small jump in income that resulted in a shift from the top of one income band to the bottom of a higher income band could result in a big increase in TTP); conversely, a large number of narrow bands might not offer much relief from the burden of repeatedly recalculating TTPs when families’ incomes changed. Furthermore, the overall process of administering the rent system would not be much simpler if other reforms in the basic TTP calcula-tion process and recertification period were not also addressed.37 For details on these analyses, see MDRC (2015), available on request from MDRC.38 These representatives included the Center on Budget and Policy Priorities and the National Low Income Housing Coalition. These organizations are also represent-ed on an Expert Advisory Panel that HUD has commissioned to review the evaluation. Other expert panel members included representatives from the Public Hous-ing Authorities Directors Association, the National Association of Housing and Redevelopment Officials, and the Council of Large Public Housing Authorities; the executive directors of the Cambridge and Seattle Housing Authorities; and several academic experts. In March 2015, that panel met to discuss the new rent policy and offer guidance on the evaluation design. None of these experts is responsible for final decisions pertaining to the policy or the evaluation.39 Eligible sample members included only voucher holders with vouchers that were administered under the Moving to Work demonstration. Non-Moving to Work Vouchers (that is, Veterans Assisted Special Housing, Moderate Rehabilitation, and Shelter Plus Care), Enhanced Vouchers, and project-based Section 8 vouchers were excluded from the study. Additionally, the study did not include elderly households, disabled households, and households headed by people older than 56 (who would become seniors during the course of the long-term study). Households participating in FSS and homeownership programs before sample enrollment began were also excluded from the study, as were families who held vouchers but were receiving no housing subsidy. The eligibility criteria are more fully described in chapter 4.

Reducing Work Disincentives in the Housing Choice Voucher Program
Rent Reform Demonstration Baseline Report
7
• Calculating TTP at 28 percent of gross income, rather the normal 30 percent of adjusted income.
• Using a family’s average gross monthly retrospective income in setting its TTP and housing subsidy, rather than the traditional practice of using the monthly adjusted income that the family currently has and expects to have in the coming year.
• Ignoring a family’s income from assets when the total value of its assets is less than $25,000 (and not requiring docu-mentation of those assets).
• Simplifying the policy for determining utility allowances to a streamlined standard schedule based primarily on unit size, with some adjustments.
• Establishing a minimum TTP of at least $50 per month and requiring families to pay at least the specified minimum TTP directly to their landlords. All tenants would thus have rent-paying relationships with their landlords, as they would in the unsubsidized rental market.40
Safeguards for families (in addition to interim recertifications)—
• A “grace-period” TTP at the start of the 3-year period, allowing for a temporary (6-month) TTP reduction when a family’s current or anticipated gross income is more than 10 percent lower than its average monthly retrospective gross income over the last year.
• A hardship policy that covers a standard set of conditions and includes a standard set of remedies that permit TTP reductions at any time during the 3-year period, in order to protect households from excessive rent burdens.
Local Variation in the Features of the New Rent Policy
As previously indicated, the PHAs participating in the demon-stration helped to develop and support a common framework for the new rent policy. However, they also saw a need to adapt the model in some ways in response to local consid-erations. In particular, minimum TTP levels vary among the PHAs, ranging from $50 to $150 per month (see chapter 2). The process for determining hardship remedies also varies
(although the conditions defining a hardship and the remedies for them do not). The design team attempted to strike an effective balance between the extent of standardization that would be required in a national policy and the need to permit some local flexibility that may also be reasonable to include in a national policy. The evaluation will explore the tradeoffs associated with these different choices.
How To View “Simplification” Under the New Rent Policy
Although some of the changes introduced by the new rent rules may simplify the process of determining a family’s TTP (for example, by eliminating deductions and streamlining the utilities policy), other changes may be burdensome to imple-ment with some families (for example, computing and verifying retrospective income when a family’s income is volatile and not documented or captured well by the administrative records on families’ income to which the PHAs have access from other government sources).41 Adopting a 3-year recertification period is intended to reduce the overall burden on PHAs and families by reducing the volume of TTP recalculations and the number of contacts families have with the PHA over several years, but whether those outcomes are actually achieved depends on the frequency with which families request hardship remedies and interim recertifications and PHAs approve them. It remains to be seen, therefore, whether the new rent rules—taken as a whole over several years—achieve the goals of simplification and reduced administrative costs. The evaluation will attempt to answer this important question.
The Importance of Communicating the New Rules to Families
It is also important to note that the new rent rules impose extra communication burdens on the PHAs in at least two ways. First, if families are to respond to the work incentive built into the new rules, they must be aware that such an incentive exists and understand how it functions. Second, if the safeguards built into the new policy are to have their intended protective effects, families must be aware of those safeguards, understand how they work, and take advantage of them when needed. The
40 Although most voucher holders pay some rent directly to their landlords, in some cases, the housing authority pays the entire amount to the landlord. Requiring all families in the new rent rules group to pay at least some amount to their landlords was perceived by some HUD officials as a way of helping to prepare those families for the arrangement they would face if they increased their incomes and received lower housing subsidies or moved to different housing and were no longer receiving housing subsidies.41 “Administrative records” are data collected in the course of administering a program. These data are available to PHAs through the HUD Enterprise Income Verifi-cation system, which provides information such as earnings reflected in unemployment insurance wage records, unemployment insurance compensation, and Social Security and Supplemental Security Income benefits. One known issue with the Enterprise Income Verification system is that it is not considered complete—or current—because of reporting lags in some of its data sources. The National Directory of New Hires, for example, has a 6-month reporting lag.
Reducing Work Disincentives in the Housing Choice Voucher Program
Rent Reform Demonstration Baseline Report
8
PHAs must also implement them properly. To implement the new rent policy, therefore, PHAs must undertake regular and active communication efforts, beyond the initial explanations they offer to families at the time of recertification. To that end, with the study team’s guidance and HUD’s support, the PHAs have begun to send additional mailings to remind families of the new policy’s work incentive and safeguards, and to invite them to make contact with a housing specialist if they believe they may qualify for a TTP reduction. The PHAs will send these reminder notices to families at least three times over the course of the demonstration. The evaluation will attempt to determine whether these communication efforts are adequate.
The Scope of This ReportThe purpose of this report is to set the foundation for a future longer-term assessment of the implementation, impacts, and costs of the new rent policy. Chapter 2 describes the central features of the new rules, and the rationale for them, in greater detail. Chapter 3 describes the planned evaluation of the new rent policy. Chapter 4 describes the steps by which families were enrolled into the study, including the random assignment process. It also describes the characteristics of the participating families. Chapter 5 explores the PHAs’ initial progress in institut-ing the new policy. It also presents findings on the new rent policy’s initial effects on families’ TTPs and housing subsidies. Chapter 6, the final chapter, points to the next steps in the evaluation.

Reducing Work Disincentives in the Housing Choice Voucher Program
Rent Reform Demonstration Baseline Report
9
Chapter 2. A Closer Look at the New Rent Policy
In keeping with the goals of the Rent Reform Demonstration, the new rent policy was designed with an eye toward reducing the complexity and burden (and thus the cost) experienced by public housing agencies (PHAs) in administering rent subsidies for Housing Choice Voucher (HCV) recipients; increasing tenants’ employment and earnings in order to help them become more self-sufficient; protecting families from excessive rent burdens; and achieving these outcomes without increasing (and possibly even reducing) total housing-subsidy expenditures relative to the expenditures under the traditional rent system.
It is important to recognize the inherent difficulty of achieving all of these goals simultaneously. For example, protecting tenants from excessive rent burdens may add more complexity to the policy than would be the case if increasing the incentive to work were the only goal. The study team adopted the features of the new rent policy with this consideration in mind. See table 2.1 for a side-by-side comparison of the main features of the new and existing rent policies.
As mentioned in chapter 1, many of the concepts incorporated into the new rent policy draw on ideas that have been debated for years by housing experts. Some are also currently being tried by a number of Moving to Work PHAs independently of the Rent Reform Demonstration. Thus, although the particular package of reforms that is being tested as part of this demon-stration is unique, the demonstration offers an opportunity to learn about the practical application of a number of broadly discussed ideas.
This chapter discusses the features of the new rent policy in greater detail and compares them with the existing rent policy for the control group. Although the PHAs in the demonstration had already adopted some modifications of HUD’s traditional rent rules under their Moving to Work authority before the study began, the rules for the existing rent rules group largely mirror the traditional rules in effect for families receiving vouchers from non-Moving to Work agencies.42 (For a summa-ry of the few modifications in existing rules undertaken by each PHA before the demonstration began that affect the control group in each location, see appendix table B.1.)
Table 2.1. Comparison of Traditional and New Rent Policies (1 of 2)
Component Traditional HUD Policy New Rent Policy
Total Tenant Payment (TTP)
30 percent of adjusted monthly income (that is, total countable anticipated income, minus deductions) or 10 percent of gross income, whichever is higher.
28 percent of gross monthly retrospective income (that is, gross monthly income over the previous 12 months), with no deductions or allowances.
Countable income estimate for setting a family’s TTP and housing subsidy are based on 12-month retrospective income.
Minimum TTP Up to $50 per month, at public housing agency (PHA) discretion.
$50 to $150 per month, depending on the PHA.
All families pay a minimum amount of rent directly to their landlords, to mirror the landlord-tenant relationship in the unsubsidized rental market.
Assets Family income from assets is counted in determining a family’s TTP.
Family income from assets is ignored when total asset value is less than $25,000, and families do not need to document those assets.
Recertification period Annual recertifications. Triennial recertifications.
Interim recertifications when income changes
At an agency’s discretion, families report any income increases when they occur, before the next scheduled recertification. Families may request interim recertifications whenever their incomes fall by any amount.
Earnings gains do not increase TTP for 3 years (that is, until the next triennial recertification.
Interim recertifications are limited to a maximum of one per year, and only when a family’s average gross income over the most recent 12 months drops by more than 10 percent from the retrospective estimate that was used to establish the initial TTP.
Utilities Where the contract rent does not include utilities, a utility allowance is provided based on a detailed schedule that takes into consid-eration voucher size (the number of bedrooms covered by a family’s voucher) and various other aspects of the type of housing unit.
A simplified utilities policy that tailors allowances to a standard base rate for utility costs that varies according to the voucher size, with additional payments available to families paying higher costs due to the type of heating (for example, electric or oil heat) and water and sewer charges.
42 The traditional rent rules referred to in this report are those in effect before the July 2016 passage of the Housing Opportunity Through Modernization Act of 2016.
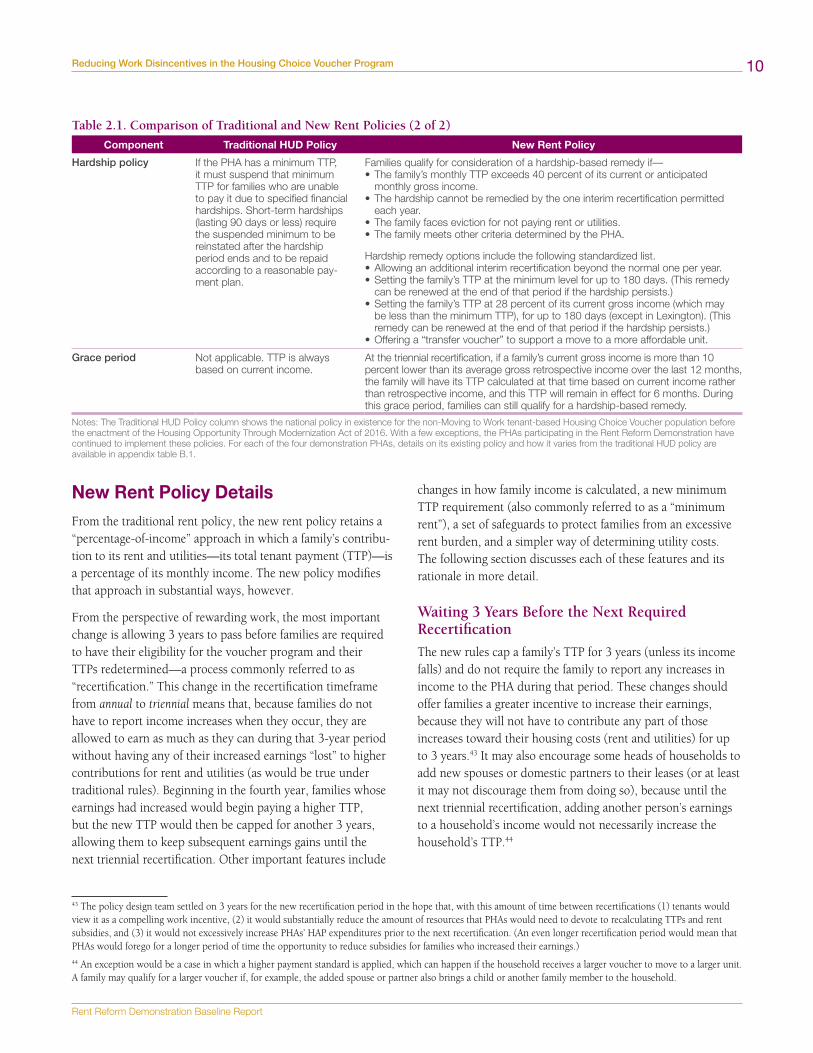
Reducing Work Disincentives in the Housing Choice Voucher Program
Rent Reform Demonstration Baseline Report
10
Table 2.1. Comparison of Traditional and New Rent Policies (2 of 2)
Component Traditional HUD Policy New Rent Policy
Hardship policy If the PHA has a minimum TTP, it must suspend that minimum TTP for families who are unable to pay it due to specified financial hardships. Short-term hardships (lasting 90 days or less) require the suspended minimum to be reinstated after the hardship period ends and to be repaid according to a reasonable pay-ment plan.
Families qualify for consideration of a hardship-based remedy if—•Thefamily’smonthlyTTPexceeds40percentofitscurrentoranticipated
monthly gross income.•Thehardshipcannotberemediedbytheoneinterimrecertificationpermitted
each year. •Thefamilyfacesevictionfornotpayingrentorutilities.•ThefamilymeetsothercriteriadeterminedbythePHA.
Hardship remedy options include the following standardized list.•Allowinganadditionalinterimrecertificationbeyondthenormaloneperyear.•Settingthefamily’sTTPattheminimumlevelforupto180days.(Thisremedy
can be renewed at the end of that period if the hardship persists.) •Settingthefamily’sTTPat28percentofitscurrentgrossincome(whichmay
be less than the minimum TTP), for up to 180 days (except in Lexington). (This remedy can be renewed at the end of that period if the hardship persists.)
•Offeringa“transfervoucher”tosupportamovetoamoreaffordableunit.
Grace period Not applicable. TTP is always based on current income.
At the triennial recertification, if a family’s current gross income is more than 10 percent lower than its average gross retrospective income over the last 12 months, the family will have its TTP calculated at that time based on current income rather than retrospective income, and this TTP will remain in effect for 6 months. During this grace period, families can still qualify for a hardship-based remedy.
Notes: The Traditional HUD Policy column shows the national policy in existence for the non-Moving to Work tenant-based Housing Choice Voucher population before theenactmentoftheHousingOpportunityThroughModernizationActof2016.Withafewexceptions,thePHAsparticipatingintheRentReformDemonstrationhavecontinued to implement these policies. For each of the four demonstration PHAs, details on its existing policy and how it varies from the traditional HUD policy are available in appendix table B.1.
New Rent Policy DetailsFrom the traditional rent policy, the new rent policy retains a “percentage-of-income” approach in which a family’s contribu-tion to its rent and utilities—its total tenant payment (TTP)—is a percentage of its monthly income. The new policy modifies that approach in substantial ways, however.
From the perspective of rewarding work, the most important change is allowing 3 years to pass before families are required to have their eligibility for the voucher program and their TTPs redetermined—a process commonly referred to as “recertification.” This change in the recertification timeframe from annual to triennial means that, because families do not have to report income increases when they occur, they are allowed to earn as much as they can during that 3-year period without having any of their increased earnings “lost” to higher contributions for rent and utilities (as would be true under traditional rules). Beginning in the fourth year, families whose earnings had increased would begin paying a higher TTP, but the new TTP would then be capped for another 3 years, allowing them to keep subsequent earnings gains until the next triennial recertification. Other important features include
changes in how family income is calculated, a new minimum TTP requirement (also commonly referred to as a “minimum rent”), a set of safeguards to protect families from an excessive rent burden, and a simpler way of determining utility costs. The following section discusses each of these features and its rationale in more detail.
Waiting 3 Years Before the Next Required Recertification
The new rules cap a family’s TTP for 3 years (unless its income falls) and do not require the family to report any increases in income to the PHA during that period. These changes should offer families a greater incentive to increase their earnings, because they will not have to contribute any part of those increases toward their housing costs (rent and utilities) for up to 3 years.43 It may also encourage some heads of households to add new spouses or domestic partners to their leases (or at least it may not discourage them from doing so), because until the next triennial recertification, adding another person’s earnings to a house hold’s income would not necessarily increase the household’s TTP.44
43 The policy design team settled on 3 years for the new recertification period in the hope that, with this amount of time between recertifications (1) tenants would view it as a compelling work incentive, (2) it would substantially reduce the amount of resources that PHAs would need to devote to recalculating TTPs and rent subsidies, and (3) it would not excessively increase PHAs’ HAP expenditures prior to the next recertification. (An even longer recertification period would mean that PHAs would forego for a longer period of time the opportunity to reduce subsidies for families who increased their earnings.)44 An exception would be a case in which a higher payment standard is applied, which can happen if the household receives a larger voucher to move to a larger unit. A family may qualify for a larger voucher if, for example, the added spouse or partner also brings a child or another family member to the household.
Reducing Work Disincentives in the Housing Choice Voucher Program
Rent Reform Demonstration Baseline Report
11
Of course, some employed tenants may lose their jobs, which would make it difficult for them to pay their expected TTPs if they were to remain unchanged. To protect against that possibil-ity, the new policy allows a family one interim recertification per year, at which its TTP could be lowered.45 To keep the PHA from having to make frequent adjustments for relatively small changes in income, an interim reduction is only permitted when a household’s average income from the most recent 12 months falls more than 10 percent below the retrospective income previously used to compute its TTP.
Scheduling income recertifications every 3 years is also expected to reduce the administrative burden and costs incurred by PHAs by greatly decreasing the number of one-on-one sessions they have with tenants—potentially by thousands of sessions per year in larger PHAs. The policy should also reduce the burden on families, who will spend less time having to docu-ment and report their incomes to the PHA if they increase their earnings. Of course, if a high proportion of families require once-per-year interim recertifications, and if many families request hardship adjustments (described below), the reduction in sessions may be fewer than anticipated.
Calculating TTP Based on 28 Percent of Families’ Gross Income
Under traditional rent rules, a voucher-holder family gen-erally pays 30 percent of its “adjusted” income (after certain deductions from its pretax income) or 10 percent of its gross income, whichever is higher, for rent and utilities. Under those traditional rules, the amount of annual income counted toward the TTP is reduced using the following deductions: $480 for each dependent; $400 (total) for having one or more elderly family members or family members with disabilities; varied dollar amounts for reasonable childcare expenses that enable a family member to be employed, to actively seek employment, or to further his or her education; and varied dollar amounts for disability assistance or medical expenses for elderly family members and those with disabilities. (As previously noted, households defined as elderly or disabled by HUD were not eligible for the Rent Reform Demonstration.)
The process for computing a household’s TTP under these rules is widely considered to be complex, cumbersome, and difficult for tenants—and often PHA staff members—to understand, which increases the risk of errors during calculation. According to HUD’s Housing Choice Voucher Program Guidebook, for example,
There are two major sources of most errors in calculating annual income. Those are: 1) applicants and participants failing to fully disclose all income information; and 2) incorrect allowance calculations often resulting from failure to obtain third party verification.46 (HUD, 2001: 34)
Under the new rent policy, no deductions are used in cal-culating a family’s TTP. To partially offset the elimination of deductions and the use of gross rather than adjusted income, the rate applied to that income is set at 28 percent (rather than the 30 percent applied to adjusted income under traditional rules). In cases where 28 percent of gross income results in an estimated TTP that is less than the minimum TTP, the minimum TTP applies unless a family requests and receives a hardship remedy. (See section below on safeguards to protect families from excessive rents.)
Before the PHAs and HUD agreed to adopt the 28-percent rate, the study team conducted a modeling exercise using 4 years of data from certain PHAs and from HUD’s national database (called the Inventory Management System or Public and Indian Housing Information Center). The analysis compared how the TTPs and net incomes of certain types of families might change if TTPs were calculated using different percentages of family income (20 percent, 27 percent, and 28 percent), after taking into account families’ housing costs, earnings, work-related expenses, taxes, and government benefits. The analysis also showed how those different rates might affect each of the four PHAs’ total Housing Assistance Payments (HAPs) on behalf of families over a 4-year period and the possible effect on national housing assistance expenditures. The 28-percent rate was selected because a lower rate was at greater risk of being considerably more expensive than the existing policy.47
45 Each year is defined as the first 12 months, the second 12 months, and the third 12 months relative to the beginning of the 3-year period when the family’s new TTP takes effect.46 Concerning third-party verification (that is, documentation where the source of the information is a party other than the tenant), the guidebook explains that “The tenant file must include third party verification of the following factors: Reported family annual income; the value of assets; expenses related to deductions from annual income; and other factors that affect the determination of adjusted income. If third party verification is not available, the file must document efforts to obtain it and why they were unsuccessful” (HUD, 2001: 34).47 Further details on the modeling work are available in MDRC (2015), available on request from MDRC, or in MDRC (2016), available on request from HUD.
Reducing Work Disincentives in the Housing Choice Voucher Program
Rent Reform Demonstration Baseline Report
12
Relying on gross income is one way to simplify the rent calculation process. For working-age, nondisabled families, the difference is most relevant when it comes to childcare deductions, which can be difficult to administer accurately.48 Although eliminat-ing childcare deductions could represent a substantial loss to families with high childcare costs, only a small percentage of households make use of the existing childcare allowance under traditional rent rules—fewer than 9 percent of working-age, nondisabled voucher holders assisted by non-Moving to Work agencies nationally and fewer than 11 percent in the PHAs par-ticipating in the Rent Reform demonstration.49 In part, these low rates reflect the fact that many families who might have benefited from the deductions were not employed. It is also possible that some employed parents relied on family members or friends to care for their children while they worked.
Under the traditional rent rules, childcare deductions are based on anticipated unreimbursed childcare expenses for the coming year (or until the next scheduled review of income). However, actual costs can be difficult to anticipate, particularly for parents who move in and out of jobs, whose childcare providers change, whose childcare needs change (for example, if their work shifts change), whose children make a transition to a free preschool program, or who become eligible for an external childcare subsidy during the course of the year. It is not clear how reliably these types of changes—some of which might result in rent increases or decreases—are reported to PHAs between scheduled reviews of income. It would be considerably more difficult for families to estimate anticipated childcare expenditures (and for PHAs to assess the reasonable-ness of those estimates) under the new rent policy for the entire 3 years until the next triennial recertification and challenging for PHAs to monitor.
For the purposes of the Rent Reform Demonstration, all house-holds already receiving childcare deductions at the time of random assignment were excluded from the study so that they would not have to forfeit an existing benefit. Families who were enrolled in the study and assigned to the new rent rules group do not have access to the childcare deduction as long as the study continues; however, the 3-year cap on their TTPs may leave them with more resources to help cover at least some of their future childcare expenses.
Excluding Income From Assets When Total Asset Value Is Less Than $25,000
Under the traditional rent policy, if a family has assets (such as bank accounts, stocks, and bonds), the income from those assets (such as interest or dividends) must be reported, verified, and included in the income base used to calculate the family’s TTP.50 Typically, however, few voucher holders have assets that produce enough income to have a meaningful effect on their TTPs. Under the new rent policy, if a family has assets worth less than $25,000 in total, any income generated by those assets is ignored for the purposes of computing the family’s TTP. Moreover, the families are not required to document their assets that they attest are worth less than that amount. Ignoring assets below $25,000 can reduce the administrative burden on PHAs and families. The change may also encourage families to try to increase their assets through increased earnings and savings.
Using Income From the Last 12 Months To Determine TTP
Under the new rent policy, a family’s TTP is calculated using its reported and verified income during the 12 months just past (unless the family qualifies for a safeguard option)—the
48 As an illustration of the difficulty of childcare deductions, it is helpful to note that chapter 5 of HUD (2001) describes the childcare allowance as follows: “Reason-able child care expenses for the care of children including foster children, age 12 and younger, may be deducted from annual income if all of the following are true:
• Thecareisnecessarytoenableafamilymembertowork,lookforwork,orfurtherhis/hereducation(academicorvocational);• Theexpenseisnotreimbursedbyanagencyorindividualoutsidethehousehold;and• Theexpensesincurredtoenableafamilymembertoworkdonotexceedtheamountearned.
When more than one family member works, the PHA must determine which family member is being enabled to work because child care is provided. This is neces-sary because the child care allowance cannot exceed the income that family member earns. A good general rule is to assume that the child care expenses enable the lowest paid individual to work, unless this is obviously not the case.
When a family member works and goes to school, the PHA must prorate the child care expense so that the portion of the total child care expense that is specifically related to the hours the family member works can be compared with the amount earned.
PHAs must determine whether child care costs are ‘reasonable.’ Reasonable means reasonable for the care being provided. Reasonable costs for in-home care may be very different from reasonable day-care center costs. Families may choose the type of care to be provided.”49 This estimate is based on the study team’s calculations using 2011 HUD national data from PHAs included in the modeling exercise.50 HUD guidelines state that when assets are $5,000 or less, the actual income from assets is counted. When assets exceed $5,000, the PHA determines income from assets as the greater of the actual income from assets or an imputed income from assets, based on a passbook savings rate established by HUD (HUD, 2001). Howev-er, as previously noted, HUD streamlining provisions issued in 2016 allowed PHAs to accept families’ certification without third-party verification that they did not own assets valued at $5,000 or more.

Reducing Work Disincentives in the Housing Choice Voucher Program
Rent Reform Demonstration Baseline Report
13
“look-back” period. The average monthly income during the previous 12 months is multiplied by 28 percent to determine the TTP. The calculation excludes any nonwage sources that stopped providing income by the end of that period, because the family can no longer count on them. For example, if a family was receiving Temporary Assistance for Needy Families (TANF) or unemployment insurance benefits, but is no longer receiving them, the income from those benefits would be excluded.51 Income from family members who were removed
from the voucher program is also excluded (for example, income from a spouse or other adult who died, who was incarcerated, or who was removed for other reasons during the previous 12 months).
Using prior income contrasts with the traditional policy of cal culating a family’s TTP based on the annual current or anticipated income reported by the household. (See box 2.1 for a comparison of the calculation steps under the existing
Box 2.1. Illustration of Rent Calculation Under New and Existing Rent Rules
Step 1: Calculate Income
Under existing rules, Total Tenant Payment (TTP) is based on current or anticipated income for the upcoming year. The calculation allows deductions for dependents, childcare expenses, and the care of a disabled family member. Under the new policy, TTP is based on gross income from the 12 months just past (or retrospective income).
Existing rules (adjusted current/anticipated income)
Example: Sally is currently working at a job making $600 a month. This job is her only source of income. She also has two children who live with her, so she will receive a deduction from her income of $480 for each child.
Current or anticipated gross income = $600 x 12 months = $7,200
Current or anticipated adjusted income = $7,200 – (480 x 2) = $6,240
New rent policy (retrospective income)
Over the previous 12 months, Sally only had income from earnings, but her earned income fluctuated, and she had no income in some months.
Sally’s Income ($) Last Year (February 2014–January 2015)
Feb Mar Apr May June July Aug Sept Oct Nov Dec Jan
0 200 500 500 400 400 300 0 0 600 600 600
Income from the last year (retrospective income) = $4,100 ($200 + $500 + $500 + $400 + $400 + $300 + $600 + $600 + $600). No deductions are allowed.
Step 2: Calculate TTP and Housing Subsidy
Under traditional rules, rent is usually based on 30 percent of adjusted current or anticipated income. Under the new rent policy, rent is usually based on 28 percent of gross monthly income from the year just past. Sally’s contract rent is $800 and includes all utilities. Her contract rent is under the payment standard. Here’s how her TTP and housing subsidy compare under both sets of rules.
Traditional rent (30 percent of adjusted income)
TTP = $156 (0.30 x $6,240 / 12 months)
Housing subsidy = $644 ($800 – $156 or contract rent – TTP)
New rent rules (28 percent of last year’s income)
TTP = $96 (0.28 x $4,100 / 12 months)
Housing subsidy = $704 ($800 – $96 or contract rent – TTP)
51 Imputed welfare income—that is, TANF income forfeited when a parent does not meet her or his TANF work requirement—is still counted if the family is still enrolled in TANF.
Reducing Work Disincentives in the Housing Choice Voucher Program
Rent Reform Demonstration Baseline Report
14
and new rent policies.) It is difficult to predict anticipated income accurately, because individuals’ employment and other circumstances are likely to change over time; the traditional rent policy addresses that problem by scheduling income reviews annually and having families report changes in their incomes. At the PHAs’ discretion, families can be required to report income increases, which would lead to higher TTPs, between annual income assessments. Families can also have their TTPs lowered through interim recertifications whenever their incomes drop. The traditional approach aims to adjust a family’s TTP routinely as its income rises or falls, so that the family’s contribution to its housing costs, and the government’s housing subsidy, remain roughly in alignment with the family’s changing resources and ability to pay its rent and utilities.
Under the new rent policy, the goal is different, and relying on anticipated income to calculate a family’s TTP would be problem-atic. For one thing, the goal of the new policy is to encourage increases in future earnings by not raising a family’s TTP as its income grows (at least for 3 years). Moreover, offering families the opportunity to lock in for 3 years a TTP based on anticipated income would give a family an incentive to lower its income just before its scheduled recertification. In theory, some family members who were working or capable of working might be tempted to quit their jobs or reduce their hours of work, or if they had recently been laid off, they might avoid looking for new jobs, so that the family’s base income used in calculating its TTP is as low as they can manage it to be. The result could be unnecessarily low rents and unnecessarily high public subsidies. The extent to which voucher holders would actually resort to such practices is unknown. In any case, using retro-spective income to calculate TTPs is intended to avoid creating that financial incentive.
Simply relying on retrospective income, however, could put some families at risk of excessive rent burdens. For example, if a family member has been working steadily but is then laid off just before the family’s recertification to set its TTP for the next 3 years, the family may not be capable of paying a TTP based on its retrospective income. Furthermore, that family member may have difficulty finding a new job quickly, or finding a new job that pays as much as the old one, no matter how hard the person tries, especially during a weak economy. Alternatively, a voucher holder may have recently suffered a disability, or may have retired from work and moved to a lower, fixed income. Thus, simply setting a family’s TTP on the basis of its prior income—income that may be impossible to restore in
future years—could leave some families with too high a rent burden, creating financial hardship for them and even putting them at risk of eviction.
For these reasons, the new rent policy includes a number of safeguards (discussed later in this chapter) to protect families when their incomes fall. These provisions are intended to accommodate the fact that some losses in household income will be permanent or long lasting, whereas others will last only a short while, although it is not necessarily easy to tell in advance which will be which.
Requiring a Minimum TTP of $50 to $150 and Direct Tenant-to-Owner Payments
The new rent policy includes a minimum TTP, but each PHA set the level of its own minimum TTP. The Louisville Metro Housing Authority selected a $50 minimum, which is the same nominal value of the minimum that all housing authorities are already authorized to establish under the Quality of Housing and Work Responsibility Act of 1998. The District of Columbia Housing Authority implemented a $75 minimum, which is roughly equivalent to the current inflation-adjusted value of the $50 minimum permitted when that law was enacted. The San Antonio Housing Authority introduced a $100 minimum, which is double the $50 minimum that the PHA had already implemented for its general voucher population before the Rent Reform Demonstration began. (The $50 minimum will apply to the existing rent rules group at that PHA.) The Lexington Housing Authority implemented the highest minimum TTP— $150—which it had adopted before joining the demonstration (and which, as a result, applies to the existing rent rules group there as well as the new rent rules group).
If families paying the minimum TTP early in the 3-year period steadily increase their incomes, they will continue to pay only the minimum TTP for the remainder of that period. The minimum TTP is a substantial financial benefit for such families but also a reason not to set the minimum too low; it will remain in place for a long time, even as families’ earnings rise, thus potentially increasing the agencies’ housing subsidy expenditures (relative to traditional rent rules). The hardship remedies described subsequently in this chapter are intended to protect families unable to afford the minimum TTP. It should also be noted that the inclusion of a minimum TTP will not necessarily create an added rent burden for the majority of families, because most were already paying above the minimum level before being enrolled in the Rent Reform Demonstration.52
52 Using HUD 50058 data from December 2012, the study team estimated that about 69 percent of households in non-Moving to Work agencies paid $100 or more in rent, and 85 percent paid at least some amount to owners. (Each voucher family completes or updates a HUD 50058 form as part of its initial or recertification interview.)
Reducing Work Disincentives in the Housing Choice Voucher Program
Rent Reform Demonstration Baseline Report
15
Under the traditional rent policy, the PHA pays landlords the entire housing subsidy owed on behalf of some families, leaving families to make payments only to their utility compa-nies (if utilities are not included in the lease). In these cases, families and landlords have no direct financial relationship. Under the new rent policy, all families are required to pay at least the minimum TTP amount to their landlords (unless they have received a waiver of the minimum TTP as a hardship remedy). The policy is intended to mirror normal practices in the unsubsidized rental market and to prepare families for a responsibility they will face when they exit the voucher program.
The provision does not put families at any additional risk of not paying or underpaying their utility bills because it does not change the total subsidy amount that the PHA pays on a family’s behalf. Rather, part of the subsidy that the agency would normally pay a landlord is redirected to the family in the form of a higher utility allowance reimbursement payment (UAP), allowing the family to meet its utility costs.
Including Safeguards To Protect Households From Excessive Rent
The new rent rules include several important exceptions to the policies outlined so far to protect a family from unreasonable increases in its TTP and from the excessive rent burden (and possibly eviction) that might result from basing its TTP on retrospective income, or from imposing the minimum TTP.
TTP Adjustment When a Family Member Becomes Dis-abled. If a family becomes designated as a disabled household (based on HUD’s definition), the PHA will recalculate its TTP based on its current or anticipated gross income immediately, without waiting for its next triennial recertification.53
A Grace-Period TTP. If, at the beginning of a new 3-year period, a family’s current or anticipated gross monthly income for the coming year is substantially less than its average gross monthly retrospective income (that is, more than 10 percent less), the PHA will set a temporary TTP based on the family’s current or anticipated income (or the minimum TTP, which-ever is higher) for a full 6-month “grace period.”54 This grace period will temporarily protect the family from a high rent
burden while it tries to restore its income to its prior level. It will only be available at the beginning of the 3-year period (and at the time of subsequent triennial recertifications).
At the end of the 6-month grace period, the temporary TTP expires, and the family is switched automatically to the “regular” TTP amount that was previously determined based on its retrospec-tive income. No additional review of income is required or offered—unless the family qualifies for an interim recertification or hardship option (see the section on “Hardship Remedies” below).
To a voucher holder who has been working but who is no longer working or who is earning substantially less money at the time of recertification, the grace period offers a period of time to find new work before the regular TTP (based on prior income) is applied. The chosen grace period was 6 months to align with the normal period allowed for recipients of federal unemployment insurance benefits to find new work. Because some tenants will have difficulty replacing lost earnings within 6 months—or, perhaps, ever—other protections are necessary. These protections are provided in the form of an interim recer-tification or hardship remedy at the end of the grace period.
Interim Recertifications. If at the end of the grace period the family has not restored most of its income to its original prior-year level, it may request and would be granted a new recertification.55 The new 12-month look-back period used to calculate the family’s TTP (counting back from the end of the grace period) would take into account the more recent period of low income, and the new TTP would apply until the next triennial recertification (unless the family qualified for another interim recertification or hardship remedy). One interim recertification (not counting the grace-period TTP) is permitted per year.
Hardship Remedies. If a family’s TTP based on its retrospec-tive income ever exceeds 40 percent of its current or anticipated income—at the time its TTP is initially calculated or later during the 3-year period when that TTP is in effect—it may qualify for a hardship remedy. Such a family would be deemed to have an excessive rent burden and may be eligible to have its TTP reduced. (See the following section for further details.)
53 According to the Code of Federal Regulations (24 CFR 5.403), a “disabled family means a family whose head (including co-head), spouse, or sole member is a person with a disability. It may include two or more persons with disabilities living together, or one or more persons with disabilities living with one or more live-in aides.”54 Anticipated monthly income (without deductions) will continue to be defined and calculated according to current HUD guidelines for the voucher program. In certain cases, those guidelines use past earnings to estimate anticipated earnings. For example, if a tenant works as a school aide during the school year and has low-er expected earnings during the summer months, the tenant’s earnings during the past school year and summer months are used to estimate anticipated earnings for the coming 12 months.55 Specifically, the family would be granted a new recertification if its income from the most recent 12-month period is more than 10 percent less than the retrospec-tive income that had been calculated at its original income review.

Reducing Work Disincentives in the Housing Choice Voucher Program
Rent Reform Demonstration Baseline Report
16
The Hardship Policy in More Detail
The hardship policy adopted for the Rent Reform Demonstra-tion attempts to strike a balance between (1) minimizing or ameliorating harm to voucher holders resulting from the new rent rules and (2) minimizing administrative burdens on and costs to PHAs.
A family will be considered for a hardship remedy if at least one of the following criteria is met.
• The family’s total monthly rent exceeds 40 percent of its monthly current or anticipated gross income (including imputed welfare income).56 The situation may occur because of the family’s income level at the time the TTP is calculated, or because it experiences a loss of income or a rent increase.
(This provision differs somewhat in Lexington.)57
• The family faces a risk of eviction for nonpayment of rent—including utility shutoffs for nonpayment of utility bills that could lead to eviction.
• Other exceptional circumstances, as determined by the PHA (expected to be rare).58
The PHA’s staff will first determine whether the hardship can be remedied by the one interim recertification permitted each year (which would not reduce a family’s TTP below the minimum level). If an interim recertification remains an option, that process would be completed instead of having the family request a hardship remedy.
When a PHA staff member enters a family’s income information into the rent-calculation software system, the system indicates whether the family’s TTP is greater than 40 percent of its current or anticipated income. If it is, the system produces a warning
that prompts the staff member to offer the voucher holder the hardship request form. Families must request a hardship remedy in writing by completing the hardship request form and must supply information and documentation that supports a hardship claim.59
Each of the four PHAs participating in the Rent Reform Demon-stration determined its own process for reviewing hardship requests based on its normal procedures for addressing tenants’ grievances. All of them agreed that this process would at minimum include an adequate opportunity for families to appeal if their hardship requests were denied.60
When a hardship request is approved, the staff responsible for administering the hardship process determines which remedy to apply from a limited list of preapproved options. In addition to the remedies offered (in the following list), the family may be referred to federal, state, or local assistance programs to apply for assistance, or to obtain verification that it is ineligible to receive benefits. All four PHAs offer the following options, and the agencies’ staffs determine which to apply in any given situation.
(1) Allowing an additional interim recertification beyond the normal one-per-year option. This additional recertification could lower a household’s TTP (but only as low as the minimum TTP) until the next triennial recertification.
(2) Setting the household’s TTP at the minimum for up to 180 days.
(3) Setting the household’s TTP at 28 percent of current income (which may be less than the minimum TTP, except in Lexington) for up to 180 days.61
56 To put the amount of monthly current or anticipated gross income needed for a hardship remedy in context, it is worth noting that Supplemental Nutrition Assis-tance Program (SNAP) rules include excess shelter costs in calculating SNAP benefits when an applicant’s shelter costs exceed 50 percent of net income.57 The PHA in Lexington implemented a minimum rent of $150 per month before joining the Rent Reform Demonstration. To remain consistent with its existing pol-icy, the hardship criterion under the new rent policy that applies in Lexington specifies that a family will be eligible for a hardship waiver if its monthly TTP exceeds 40 percent of its current or anticipated gross income and is greater than the $150 minimum rent. The hardship policy does not include a waiver of the minimum rent (unless the family becomes disabled).58 The evaluation will identify how the PHAs interpret and apply this criterion in practice. At the time this report was written, no hardship remedies had been issued under this criterion.59 For example, a family must provide proof of the following: loss of eligibility for a federal, state, or local assistance program; loss of employment or reduction in work hours; an eviction letter; a document indicating utilities may be shut off; or a document indicating the family is at risk of eviction. To request a hardship rem-edy based on the risk of eviction for nonpayment of rent or utilities, a family must provide to the PHA a notice from the landlord of nonpayment of rent and the landlord’s intent to terminate the family’s tenancy, or a notice from a utilities company warning of a utilities shutoff. PHAs may set a time limit within which they must receive a copy of this notice from the tenant (for example, no more than 10 business days from the date that the tenant received the notice from the landlord or utility company). A hardship waiver (or the process of applying for a hardship waiver) does not exempt families who claim zero income from a PHA’s regular report-ing requirements for zero-income households. Such households must still provide a detailed accounting of the funds used to cover their basic costs of living (food, personal or family care necessities, and so on) every 90 to 180 days, depending on the PHA’s policy.60 Details of each PHA’s grievance process are included in its Moving to Work Plan, which is available on its website.61 In Lexington, a hardship remedy may include lowering the TTP to $150 for families who are paying above this amount, or to $50 for households that become disabled.

Reducing Work Disincentives in the Housing Choice Voucher Program
Rent Reform Demonstration Baseline Report
17
(4) Offering a “transfer voucher” to support a move to a more affordable unit (including a unit with lower utility expenses).
At the end of the hardship remedy period, the family’s regular TTP is reinstated, and the family is not required to repay the amount they would have paid otherwise. If the hardship continues, the family may submit a request for an extension of the hardship remedy. The hardship remedy period cannot be scheduled to end after the family’s next scheduled triennial recertification.
During the hardship period, when the TTP is reduced, the PHA increases its payment to the landlord to cover the portion of the rent previously paid by the family directly to the landlord. It also notifies the landlord of the change and how long it is likely to last.
A Simplified Utilities Policy
Utility expenses are a crucial component of shelter costs and calculating them is a complex issue for PHAs. For many voucher holders, some or all of those expenses are part of the contract rent paid to the landlord, but for others, utilities are a separate cost. Under traditional federal rules, PHAs help to cover these expenses through a “utility allowance.”
PHAs incur considerable administrative costs to review and, if necessary, update their utility-allowance tables annually (through market surveys and analyses that take into consider-ation the type of dwelling), and to apply them in determining each family’s rent. The process is widely viewed as complicated and error-prone. The PHAs in the Rent Reform Demonstration therefore agreed that the new rent policy should include a more streamlined (and less error prone) approach to calculat-ing the utilities component of a family’s TTP.62
The simplified utilities policy adopted for the Rent Reform Demonstration is based on an approach previously developed by the District of Columbia Housing Authority. Using local area utility rates, each PHA in the demonstration specified a standardized utilities base rate that varied only according to the size of the voucher (that is, the number of bedrooms covered by a family’s voucher). It then specified a few “add-on” amounts for units that were dependent on more expensive utilities. The particular add-ons varied from agency to agency depending on the types of utilities more common in the area.
For example, the PHA in Washington, D.C., includes an add-on payment for units relying on electric heating, which is more expensive than gas heating. It includes another add-on for water and sewer costs when the tenant is responsible for these expenses.63
The new utility policy should result in fewer errors in calcu-lating utility allowances, primarily because it requires housing specialists to gather and take into account much less informa-tion about the characteristics of a rental unit.
Predicting the Possible Effects of the New Rent PolicyOnce the HUD officials and PHAs involved at the early stage agreed on a preliminary approach to a new rent policy, the study team initiated a set of statistical analyses to assess possible financial consequences of the new model for families and for PHAs. The analyses examined not only how the new rules might affect how much families would pay for rent and utilities, but also the possible effects on their overall net income (taking into consideration their earnings, tax obligations, Earned Income Tax Credits, welfare benefits, Supplemental Nutrition Assistance Program benefits, childcare costs, and transportation costs, in addition to their housing assistance) using the Urban Institute’s Net Income Change Calculator for a set of hypo-thetical families (for example, families where the number and ages of children varied). It yielded estimates of the TTP, “family share” (as defined by HUD), and total housing subsidies under the different options that were being considered for the new rent policy. For PHAs, the analysis focused on the possible ef-fects on their housing-subsidy costs. The study team estimated these effects by modeling the potential new rules using 4 years of real data from potential study PHAs and national data from HUD. In both sets of analyses, different assumptions were made regarding what percentage-of-income rate would be applied to gross retrospective income, what minimum TTP would be set, how utilities would be calculated, and how much wage income the families would receive.64
The results helped to reveal tradeoffs among different options and informed the final specifications for the new rent model. Overall, the results showed that under the new rent rules (with the percentage-of-income rate, minimum TTP, and utilities policy that were ultimately adopted), when families increased
62 The study team considered several different utility-allowance policies. This report only discusses the utilities policy adopted in the demonstration. For more infor-mation about other options considered, see MDRC (2015), available from MDRC on request. 63 The Washington, D.C. PHA estimated that its new approach cost the agency about the same as the existing utility allowances. 64 For full details on the data, methods, and results of this modeling exercise, see MDRC (2015), available from MDRC on request.
Reducing Work Disincentives in the Housing Choice Voucher Program
Rent Reform Demonstration Baseline Report
18
their incomes from earnings (especially through full-time employment), their net household incomes were likely to increase more than they would under traditional rent rules. These increases would be achieved primarily by holding families’ TTPs constant in the face of earnings gains during the 3 years before their next triennial recertification. In other words, under the new policy, families could keep more of their increased earnings rather than having to pay more toward their rent and utilities during that period.
The analysis also explored more deeply how PHAs’ subsidy ex-penditures might change over time under the new rent policy at the national level and for selected PHAs.65 It predicted that the new rent policy would cause the agencies’ total housing- subsidy expenditures (that is, HAPs) to be higher during the first 3 years than they would be under traditional rent rules. This increased expenditure occurs largely because families who increased their earnings, and who would therefore have had their subsidies reduced under traditional rules, would instead receive the same level of subsidy until their triennial recertifications took place. The analysis predicted that in year 4, housing-subsidy expenditures under the new rent policy would be somewhat lower than under the traditional policy, even assuming that the new policy did not have a positive effect on families’ earnings. This prediction reflects the fact that, on average, TTPs recalculated in year 4 would be based on higher average earnings because of normal increases in work and earnings over time (that is, increases that would have occurred even in the absence of the new policy). It is at the point of that triennial recertification that PHAs would begin to recoup the housing-subsidy reductions they forwent during the previous 3 years, when TTPs were capped.
The modeling exercise also showed that in the absence of an employment impact, the cumulative housing-subsidy
expenditures for the first 4 years of the policy could be some what higher under the new rent policy compared with the traditional policy. However, if the new policy has a modest employment impact, those subsidy expenditures may reach (or come very close to) a “break-even” level, achieving the cost-neutrality goal of the new policy.
Of course, given data limitations and the number of assump-tions required, it is difficult to predict with certainty from this statistical modeling exercise what will really happen under the new rent policy. The exercise was helpful to the policy designers, however, because it illustrated possible tradeoffs among different options considered for the demonstration. The randomized trial now under way will provide more definitive evidence on how the new policy affects families and PHAs.
ConclusionDesigning the new rent policy for the Rent Reform Demonstra-tion was a challenging process, because the policy sought to balance multiple, sometimes competing, objectives. Moreover, the process had to contend with a variety of perspectives on how those objectives could be achieved. It is thus noteworthy that, despite some differences in perspectives, all four PHAs and HUD reached a consensus on the core elements of the new policy. Some variation does exist among the four agencies re-garding some features of the model, particularly the minimum TTP threshold and procedures for reviewing and approving hardship remedies. For the most part, however, all of the agencies are implementing the same model. This consistency will allow the evaluation to assess how well that model achieves the demonstration’s various objectives when operated under different local conditions.
65 The national estimates are based on several years of national housing-subsidy expenditure data, obtained from HUD, covering all non-Moving to Work housing authorities in the country. The individual PHA estimates are based on similar housing-subsidy expenditure data, covering several years from a number of Moving to Work PHAs that were being considered for the Rent Reform Demonstration, which included the four agencies that finally joined the study.
Reducing Work Disincentives in the Housing Choice Voucher Program
Rent Reform Demonstration Baseline Report
19
Chapter 3. Evaluation Approach
The Rent Reform demonstration includes a rigorous research design and comprehensive evaluation agenda. It uses a ran-domized controlled trial, one of the most rigorous methods for determining the effectiveness of an intervention (Berk, 2005; Bloom, 2006). The evaluation includes a careful assessment of the implementation, impacts, and costs of the new policy, and it examines results from the perspective of the public housing agencies (PHAs) implementing the new policy and the voucher holders. It uses a range of methods and data sources to support the comprehensive research agenda.66
From the perspective of PHAs—and HUD and policymakers—one of the primary goals of the new rent policy is to reduce the burden and costs incurred in administering the rental subsidy system. The evaluation will thus assess the extent to which the new rent rules simplify the administration of housing subsidies, and whether they do so without placing undue housing cost burdens on families. Simplified rules may result in ad ministrative cost savings that could help PHAs stretch their budgets to serve more families in need of housing assistance. PHAs may also achieve savings in average housing-subsidy ex-penditures per family, although any such savings are likely to occur after the initial 3-year recertification ends and probably only if the new rent policy increases families’ earnings.
For families, the critical evaluation question is whether the new rent policy increases their labor-force participation rates and incomes, reduces their reliance on housing subsidies and other government benefits, and, in general, helps them become more self-sufficient. It is also critical to determine whether the new policy can achieve these goals while protecting those families who cannot increase their wage incomes from financial harm and material hardship, as the new rent policy’s hardship provisions and other safeguards are intended to do.
This chapter provides a broad overview of the breadth of the evaluation and outlines the topics that it will explore, including those that will be examined in its later years (that is, outcomes that the new rent policy is unlikely to affect early on, but may affect in the longer term). The chapter also introduces the various data sources at the core of this evaluation: (1) qualitative data gathered from observations conducted as part of ongoing
technical assistance, monitoring efforts, and structured imple-mentation research; (2) quantitative data from the PHAs and other administrative agencies; and (3) relevant PHA documents and reports.
Research Design and Data SourcesThe Rent Reform Demonstration is structured around a two- group randomized controlled trial. The random assignment process was incorporated into the regular recertification process through which PHA staff members normally review whether families continue to meet the voucher program’s income require ments and other requirements. During this process, staff members recalculated how much each family was expected to contribute to its rent and utilities and determined how much of a housing subsidy it would receive. Eligible voucher holders who were scheduled for a recertification between February 2015 and November 2015 were enrolled in the study.67 They were randomly assigned either to a program group that was subject to the new rent policy or to a control group that remained subject to the existing rent rules. (Tables and exhibits in this report refer to the study groups as the new rent rules group and the existing rent rules group, respectively.) The recomputed total tenant payment (TTP) obligations and housing subsidies for families in each research group took effect between June 2015 and March 2016. (The exact dates varied among families and the four PHAs, as shown in chapter 4.)
The power of this research design comes from the fact that, with an adequate sample size, random assignment ensures that the intervention and control groups will be similar in their distributions of observed and unobserved characteristics when the study begins. Thus, differences between the two groups that emerge later on can be attributed with confidence to the intervention.
The effects of the new rent policy will therefore be determined by comparing over time the new rent rules group’s labor-market outcomes and other outcomes with the outcomes of the existing rent rules group. The current evaluation work plan and budget will allow for a followup period covering approximately 2.5 years
66 For a more detailed discussion of the evaluation scope and methods, see MDRC (2016), available on request from HUD.67 Under traditional HUD rules, these recertifications were held annually. Before joining the Rent Reform Demonstration, the District of Columbia Housing Authority had used its Moving to Work authority to switch to a biennial recertification schedule for working-age, nondisabled families. The other three PHAs in the demonstra-tion were on an annual schedule.

Reducing Work Disincentives in the Housing Choice Voucher Program
Rent Reform Demonstration Baseline Report
20
for the full sample, and a longer period for participants who enrolled in the study early on. (Chapter 4 describes the study eligibility criteria, enrollment, and random assignment process in more detail.)
The evaluation of the new rent policy will use a combination of quantitative and qualitative data sources: a baseline survey administered at the time participants enrolled in the study; PHA and HUD administrative records (that is, data collected in the normal course of administering PHA and HUD programs); PHA financial data; unemployment insurance wage records; administrative records on Temporary Assistance for Needy Families (TANF) and Supplemental Nutrition Assistance Program (SNAP) benefits; administrative records on stays in homeless shelters; onsite observations of PHA practices; and indepth interviews with PHA staff members and tenants. Box 3.1 describes these data sources in greater detail.
Research Topics The evaluation includes three main study components: imple-mentation and process research, impact research, and a cost study.
Implementation and Process Research
The implementation study will document how each PHA operates the new rent policy. The evaluation team is particularly interested in understanding how the processes of calculating retrospective income, establishing utility allowances, conduct-ing recertifications, and administering the hardship policy and other safeguards are operated in practice. The team also aims to assess the experiences, understanding, and perspectives of PHA staff members and voucher holders. This study component will use PHA administrative records to examine how the new rent policy affects families’ TTPs and housing subsidies at the beginning of the new policy and throughout the demonstration, and to what degree families use the policy’s various safeguards.
Box 3.1. Data Sources for the Evaluation
• Abaselinesurvey. A voluntary survey completed by study participants with PHA staff members when they enrolled in the study, the baseline survey provides information on a broad range of demographics and other characteristics, including family composition, income, employment status, perceived barriers to employment, and education level. The survey includes items that have been used in other national surveys or similar baseline surveys in other program evalu-ations. It provides information generally not available in the agency administrative records. This report uses the baseline survey data to describe the characteristics of the families in the demonstration when they enrolled in the study.1
• PHArecords. Each voucher family completes or updates a HUD 50058 form as part of its initial or recertification interview. The study team is collecting this information for all study participants, along with historic HUD 50058 data, for one to three years before study enrollment, depending on the PHA. These data (along with the baseline survey data) are used to describe the characteristics of families participating in the study, their incomes and income sources, their TTP amounts, their subsidy levels, and their monthly rent pay-ments to landlords. The same data source will provide similar information over the followup period. The study team is also collecting additional data from each PHA’s internal reporting system that are not available in the 50058 data files, such as information on total housing-subsidy payments, families’ actual TTPs, and the reasons families are terminated from the voucher program. For families who are subject to the new rent policy, the study team is collecting information on grace-period TTPs, interim recertifications, hardship remedies, and retrospective income.
• HUDdata. The study team is analyzing data from HUD’s national database (called the Inventory Management System/Public and Indian Housing Information Center) to describe the national population of families receiving vouchers, to obtain information on families who move to the jurisdictions
of PHAs not participating in the demonstration, and to explore the possible effects of the new rent rules on the national population of voucher holders.
• PHAfinancialdata. Data obtained from each PHA’s financial statements and other administrative records, including HUD’s national database mentioned previously, its Financial Assessment System, and PHAs’ own databases, will be used to assess whether the new rent policy is more cost-efficient to administer than the existing rent policy. It will also attempt to identify which aspects of the new rent policy may be leading to or offsetting any cost savings.
• Implementationandprocessdata. As part of the implemen-tation and process study, the study team will interview PHA managers overseeing the new rent policy, housing specialists recertifying households under the new rent rules, and housing specialists working with families subject to the current rules. The team will document families’ initial recertification experi-ences during an early round of visits; a later round will focus on interim recertifications (in the period following the initial recertification) and the triennial recertification. The evaluation also includes two rounds of structured interviews with a few tenants at each PHA to learn about their experiences with and perspectives on the new rent policy, including any hardships that appear to be created by the new policy.
• Wagerecords. Employment and earnings data, crucial for the demonstration, will be obtained from the National Directory of New Hires, a national database of wage and employment in-formation that was established by the Personal Responsibility and Work Opportunity Reconciliation Act of 1996.
• Public-benefitsdata. In addition to housing and wage records, the study team will obtain data on other public benefits, such as TANF cash assistance and SNAP. Data on homelessness (stays in homeless shelters) will be collected from the Homelessness Management Information System.
1 A copy of the baseline survey is included in supplementary Appendix G of this report, which is available at huduser.gov and www.mdrc.org.

Reducing Work Disincentives in the Housing Choice Voucher Program
Rent Reform Demonstration Baseline Report
21
The Alternative Rent Model in Practice. The four PHAs par-ticipating in the Rent Reform Demonstration are all imple menting the same core features of the new rent model, but as discussed in earlier chapters, some features of the model, such as the level of the minimum TTP, vary among the PHAs. Moreover, the agencies may have different operating experiences because of differences in their administrative systems, organizational capabilities, and local housing markets. Consequently, it will be important to compare the experiences of the PHAs across locations and over time.
Three types of data will shed light on how each agency puts the new rent policy into practice: (1) observations from technical- assistance monitoring efforts, (2) structured implementation research, and (3) quantitative data from the PHAs on the recerti-fication process, including the number of recertifications and hardship exemptions that take place. The process analysis will describe and analyze how each PHA puts the features of the policy into practice, and will explore staff perspectives on how well they are functioning. In addition, it will document PHAs’ efforts to help tenants understand how the new system creates a stronger financial incentive for them to increase their earnings, and will investigate whether staff members and tenants find the new system to be more transparent and easier to comprehend.
To assess whether the new rent rules are simpler and easier to administer, the analysis will compare PHAs’ experiences operating the new policy with their experiences operating the existing policy. Specifically, the analysis will compare how much work it takes under the existing policy and the new policy for PHAs to verify families’ incomes and to calculate TTP amounts, utility allowances, and utility-allowance payments. It will also compare how often PHAs undertake interim recertifications and hardship-related actions for the new and existing rent rules groups.
The study team hypothesized that the new, simplified system will reduce the number of errors PHAs make in computing TTP and subsidy amounts (including those made in the calculation of utility allowances), the number of disputes that arise with families over subsidy amounts, and possibly even the frequency and complexity of Inspector General investi-gations.68 The evaluation will assess whether the new policy yields such changes.
Rent Burden and the Use of the Hardship System. The new rent policy is likely to increase the rent burden some families experience and reduce it for others. In particular, larger families, families with lower incomes, and families who
experience substantial drops in income may have the most difficulty affording the higher minimum TTP, putting them at increased risk of eviction or having their utilities shut off. The hardship remedies are intended to offer them protection.
Other families may find that it is easier to meet their housing expenses under the new rent policy, particularly if the new policy leads them to increase their earnings over time. The extended recertification period, which can hold their TTPs constant for up to 3 years, may help many families increase their disposable incomes, reducing their risk of falling behind on rent and making it easier for them to pay their full utility bills. Overall, only a small proportion of families is likely to experience large increases in their share of rent payments and utility payments under the new rent policy (relative to existing rent rules) during the 3-year recertification period, and the in-terim recertification and hardship policies are intended to help those who do. TTPs are expected to increase after the triennial recertification, reflecting increases in household income during the previous 3 years. It will be important to assess the use of the various safeguards after that recertification as well.
If the new rent policy leads to a sizable number of hardship cases, it will increase the amount of administrative work PHAs have to do and reduce any administrative cost savings that arise from other aspects of the new policy. As described below, the evaluation will assess the new policy’s impacts on the number of hardship cases. It will also assess the costs associated with administering the new hardship policy.
How Well Families Understand the Work Incentives and Safeguards in the New Rules. How well families understand the new rent rules will in large part dictate whether those rules influence their labor-market behaviors while protecting them from excessive rent burdens. The study team will conduct indepth interviews with tenants at each of the PHAs to explore their awareness and comprehension of the triennial recertifica-tion feature, the minimum TTP requirements, the new interim recertification and hardship policies, and the simplified utilities policy. These interviews will provide insights into how well families understand the new policy and their responses to its incentives. They will also reveal why families do or do not seek hardship remedies when their incomes fall. The interviews will explore whether tenants view the new rent policy as more fair and transparent than the existing policy and which features of the new rent rules they find most or least appealing.
These topics will be further explored in interviews with PHA housing specialists. The specialists will be asked how well
68 Inspector General investigations look into possible violations in the administration of HUD programs and activities, or misconduct on the part of HUD employees or the recipients of HUD funds.

Reducing Work Disincentives in the Housing Choice Voucher Program
Rent Reform Demonstration Baseline Report
22
families seem to understand the new rent policies, what aspects of those policies are the most difficult to communicate effectively, the ways the new rent rules are easier than existing rent rules for staff members and families to understand, and the ways staff members communicate with families about the enhanced work incentives and safeguards of the new rent policy.
Effects on Landlord Responses and Tenant-Landlord Rela-tionships. Under the existing rent rules, for some families, the PHA pays the entire housing subsidy to the landlord, and the family’s TTP is used entirely to pay for utilities not included in the lease. In these cases, tenants and landlords have no direct financial relationships. Under the new rent policy, all families are required to pay at least the minimum TTP amount to their landlords directly (unless the minimum TTP has been waived under a hardship remedy). This policy is intended to mirror normal practices in the unsubsidized rental market and to help prepare families for a responsibility they will face when they exit the voucher system.
The evaluation will examine the extent to which families have difficulty meeting their obligations to landlords, and whether they are having more disputes or fewer disputes with their land-lords over rent or property maintenance. The evaluation will try to assess landlord-tenant relationships through interviews with tenants and, because landlords who are dissatisfied are likely to have communicated that fact to the PHAs, with PHA staff.
The Control Context: PHAs’ Current Rent Policies. The current rent policy at each of the participating PHAs will serve as the counterfactual condition or control context against which the new rent policy will be assessed. These existing rent policies largely reflect HUD’s traditional rent policy, operated by non-Moving to Work agencies across the country. As described earlier, however, the participating PHAs had already implemented some changes from HUD’s traditional policy before they joined the demonstration, and the evaluation will need to take those changes into account in interpreting the impact findings. For example, the PHA in Washington, D.C., had already instituted a simplified utilities policy and had also adopted a biennial recertification policy. (Under this policy, a working-age or nondisabled family who increased its anticipated income from the same income source by no more than $10,000 per year would not have its TTP recalculated until its next biennial recertification. The policy was changed in 2016 to eliminate all income-reporting requirements during the 2-year period.) Existing rent rules group families in San Antonio face a $50 minimum TTP, those in Lexington face a $150 minimum TTP, and those in Washington and Louisville have no minimum TTP. Thus, the precise nature of the control condition differs to some extent among the PHAs.
The evaluation’s process research will document PHAs’ existing rent rules, including any changes in those rules that may affect the existing rent rules group, especially in light of the recently passed Housing Opportunity Through Modernization Act of 2016. That information will reveal the larger policy context at each PHA where the new rent policy is tested.
Service Context and Other Local Conditions. The demon-stration PHAs differ in some ways that are not directly related to rent policies but that may influence the effects of the new rent policy. For example, voucher holders in some cities might have greater access to employment-related services than those in oth-er cities. Some housing authorities are located in environments with many such public services available, whereas others are located in areas with service deficits. The new rent policy might be more effective in a community with lots of employment services, because families who are inspired by the new policy’s stronger incentives to work may have more opportunities to get help through job-search or training programs, for example.
It is also possible that the new rent policy will have larger impacts in areas where jobs are more plentiful and possibly where affordable rental housing is more available. People may be more willing to act on the incentive to increase earnings if they are more optimistic about being able to find jobs (because of a stronger job market), and if they are less fearful about finding affordable housing should they earn their way off their housing subsidies. (Voucher holders lose their eligibility for the benefit should their incomes rise above a certain level.)
Ideally, the new rent policy would produce its hoped-for effects regardless of local contexts, in diverse conditions. However, if results vary among the PHAs, it will be important to consider whether local context might be part of the reason. Although it may not be possible to answer this question definitively with so few PHAs in the study, and with limited evaluation resources available to document their local contexts, it may be possible to observe patterns among the PHAs that offer suggestive insights. The evaluation will explore the issue of local context affecting results by drawing on information obtained during site visits; in interviews with PHA staff members; and from published data sources on labor-market conditions, poverty, and the availability of low-cost housing in the metropolitan areas served by the four PHAs.
The Impact Analysis
The impact analysis will test whether the new rent policy led families to increase their earned incomes, and whether this increase was achieved without causing a sustained increase in PHAs’ housing-subsidy payments (in fact, ideally while achieving
Reducing Work Disincentives in the Housing Choice Voucher Program
Rent Reform Demonstration Baseline Report
23
some decrease in those expenditures). Put simply, it will deter mine whether the families randomly assigned to the new rent rules group had better outcomes than those assigned to the existing rent rules group. For example—
• Do families in the new rent rules group achieve higher rates of employment and earnings than those in the existing rent rules group?
• Do families in the new rent rules group rely less on housing subsidies and other government benefits (such as welfare and food stamps) than those in the existing rent rules group?
• Is the new rent policy able to generate positive labor-market outcomes while protecting families from financial harm and material hardship (such as excess rent burdens and homelessness)?69
• Does the new rent policy have different effects on different types of voucher holders?
The basic estimation strategy used to assess the impacts of the new rent policy is analogous to the method researchers have used in many social experiments over the last few decades to generate credible results. The analysis will compare the average outcomes of the new and existing rent rules groups, using regression adjustments to increase the precision of the statistical estimates.70
The impact evaluation will assess the effects of the alternative rent policy on tenants’ lives and on outcomes that can be orga-nized into a few main clusters: work behaviors (employment and earnings), household income and rent burden, homeless-ness, evictions, housing subsidies, and other public benefits. The evaluation will assess effects for all PHAs combined (pooling the study samples from the four PHAs) and for each PHA separately; the sample sizes for the study PHAs provide adequate statistical power to produce policy-relevant impact estimates for each PHA, as well as for the pooled sample (that is, the sample that includes the study participants from all four PHAs combined).
If the results show that the model’s impacts are positive and consistent across the PHAs, it would provide evidence that the model can succeed in a variety of locations and for different types of tenants. Alternatively, if large and statistically significant variations emerge in the impacts when comparing PHAs, it will be important to try to understand what local conditions or
implementation factors may be generating that variation. Even though it would be impossible to identify those causes definitively, it may be possible to generate empirically grounded hypotheses about the possible causes and to rule out certain explanations.
The pooled impact estimates will provide a summary assessment of the overall effects of operating the new rent policy under a variety of conditions, as would be the case if it were expanded to a national scale. The larger sample size for the pooled analysis will increase the precision of the impact estimates, which will become especially relevant when estimating the policy’s effects on subgroups of the full sample. The evaluation will seek to determine whether the new rent policy has more pronounced or different effects on: (1) subgroups of tenants who were and who were not working at the time of random assignment, (2) tenants who had more and less work history at that time, (3) households headed by single parents who were also not employed (with no other adult in the household) as opposed to other types of families, (4) families who were and were not receiving SNAP benefits, and (5) families who were and were not receiving TANF benefits.
The Cost Study
The cost analysis will test two core assumptions of the Rent Reform Demonstration. First, if the new rent rules simplify the process of determining families’ TTPs and housing subsidies, and reduce the amount of engagement between PHA staff members and families, they may reduce PHAs’ costs of admin-istering the rent subsidy system. Second, if the new rent policy increases families’ earnings substantially and causes average household subsidy levels (eventually) to fall, and if it hastens exits from the voucher system by boosting employment, then PHAs may eventually save on their average Housing Assistance Payment expenditures per family.
Administrative Reforms and Housing Authority Cost Savings. A primary goal of the new rent policy is to reduce the burden and costs of administering the Housing Choice Voucher (HCV) program by reducing the time and effort staff members have to put into meeting with tenants, calculating household TTPs, and operating other aspects of the rent policy. The cost analysis will use PHA financial and staffing data to assess whether the new rent policy is more cost-effective to administer than the existing rent policy. For the cost analysis, the study team will estimate the labor costs and relevant direct costs associated
69 The evaluation does not include a followup survey, which limits the extent to which it can measure the new rent policy’s effects on material hardships and other types of family outcomes not available in administrative records.70 In making these adjustments, an outcome, such as “employed” or “moved,” is regressed on an indicator for intervention group status and a range of background characteristics.

Reducing Work Disincentives in the Housing Choice Voucher Program
Rent Reform Demonstration Baseline Report
24
with meeting with tenants and calculating families’ TTPs, and other activities involved in operating the rent system. The team will then compare them with the costs of operating the existing rent system (measured in similar ways and over the same time period, within the limits of available data) to determine the net costs or savings attributable to the new rent policy.71 Attempt-ing to identify which aspects of the policy may be leading to or offsetting any savings (but in a less detailed way) is another goal of the cost analysis.
Effects on Housing-Subsidy Expenditures. The new rent policy is intended to reduce the length of time during which families receive vouchers, the average subsidy amount per household, or both, by encouraging tenants to increase their employment and earnings (primarily through the incentive created by the delayed recertification period). If the new policy does reduce families’ reliance on housing subsidies, that effect is unlikely to occur during the 3-year extended recertification period (unless tenants in the new rent rules group exit the subsidy system more quickly within that period, which is not anticipated). Because increases in tenants’ earnings will not increase their TTPs, any savings in housing-subsidy expenditures are unlikely to occur until after the next triennial recertification (that is, in year 4). At that point, tenants who have increased their earnings will have their TTPs reset at high-er levels, allowing PHAs to recoup the extra housing-subsidy expenditures they are likely to have made during the previous 3 years. It is also possible that, by year 4, a higher proportion of tenants under the new rent policy will have increased their earnings to the point that they are no longer eligible for the voucher program than the proportion that would normally have done so under the existing rent policy, further contribut-ing to housing-subsidy savings.
On the other hand, the new rent policy could also have little or no impact on tenants’ earnings. Tenants who do earn more during the 3-year period before their next recertification interviews might have done so anyway. The boost to their net incomes from the new policy may improve these families’ standards of living, but meanwhile the PHA would have paid more in subsidies than it would have done under existing rent rules, and could not expect to recoup any additional savings when the families’ TTPs reset at recertification. The minimum TTP and the elimination of deductions and allowances in the new rules are intended to counter these potential losses to some extent.
PHAs’ Use of Administrative or Housing-Subsidy Savings. If PHAs do achieve administrative or housing-subsidy savings, what will they do with those extra resources? They may use the money to increase the number of vouchers they make available, or to avoid having to reduce the number of vouchers they make available if federal funding for the voucher program is cut. They may instead use the extra resources to accomplish some other goals. During implementation and process research, the study team will explore how the agencies use such savings by interviewing agency staff members and examining pertinent fiscal and administrative documents.
Possible Effects on PHAs’ Finances Nationwide. Once the effects of the new rent policy are determined for the four PHAs participating in the Rent Reform Demonstration, it may become important to consider how much it may cost the federal govern-ment to operate the new policy nationwide. The study team can adapt the statistical modeling exercise that it conducted when designing the new rent rules to shed some light on that question. As discussed in chapter 2, the model estimated the new rent policy’s potential effects on housing-subsidy expen-ditures nationally and for the four PHAs in the demonstration. To estimate what the effects of the new policy would be nationwide, the evaluation will adapt that statistical model to incorporate estimates of the policy’s actual impacts on families’ incomes and housing subsidies for different types of households in the random assignment experiment, and refine the assump-tions used in the model about interim recertifications, hardship remedies, utility costs, and other factors.
ConclusionChapter 1 outlined a number of long-standing criticisms of HUD’s traditional rent policy for recipients of HCVs. The Rent Reform Demonstration’s new rent policy attempts to address some of those criticisms. It aims to simplify the rent subsidy system to reduce administrative burdens and costs. It also aims to support families’ efforts to work by allowing them to keep any earnings increases they are able to achieve during a 3-year period (rather than pay more for rent and utilities). At the same time, the policy is designed to protect families from excessive rent burdens if they cannot work or if they suffer a loss in income. The new policy is also expected to be roughly cost-neutral over time, relative to the traditional policy. The evaluation strategy described in this chapter will assess how well the new policy achieves these ambitious objectives.
71 The evaluation does not include a detailed time-use study, which will limit the precision with which it can determine whether the new rent rules alter how staff members allocate their time.

Reducing Work Disincentives in the Housing Choice Voucher Program
Rent Reform Demonstration Baseline Report
25
Chapter 4. Characteristics of Families Enrolled in the StudyTo permit a rigorous evaluation of the new rent policy, each of the four public housing agencies (PHAs) participating in the Rent Reform Demonstration agreed to modify its normal processes for determining whether recipients of Housing Choice Vouchers (HCVs) remained eligible for the program and for recalculating the housing subsidies they would receive.72 Between February and November 2015, voucher holders who were approaching their redetermination (or “recertification”) dates and who met the eligibility criteria for the evaluation were enrolled in the study. They were randomly assigned either to a program group that was subject to the new rent pol-icy or to a control group that remained subject to the existing rent rules. As explained in chapter 3, the effects of the new rent policy will be determined by comparing the labor- market outcomes and other outcomes of the two research groups over a followup period lasting at least 2.5 years for the full sample (and longer for families who enrolled in the study early on).
Ideally, the evaluation of a new rent policy would be tested on a nationally representative sample of the HCV population. It was not possible to do so, of course, because only Moving to Work PHAs were eligible to participate in the demonstration, and only a small number of those agencies could be included. Still, the selection process was intended to recruit agencies that would yield a sample of voucher holders who broadly reflected the relevant national population.
This goal was largely achieved. As this chapter shows, families in the demonstration PHAs, taken as a whole, have charac-teristics that, although not strictly representative, are roughly similar to those of the national population of working-age, nondisabled voucher holders. Among the most important dif-ferences are that the study sample appears to have somewhat lower incomes and to be somewhat less likely to be working. It is also important to note that some important differences are evident among study PHAs, such as in families’ employment rates, rates of receiving welfare, household compositions, races and ethnicities, rates of experiencing certain material hardships, and other characteristics. The variation in this demonstration captures some of the diversity that can be found across PHAs
at the national level and provides an opportunity to test the new rent policy for different types of voucher holders and in different contexts.
This chapter begins by describing the criteria that families had to meet in order to be eligible for the demonstration, and the procedures the PHAs followed to enroll families into the study. The chapter then compares the study families with the relevant national population of working-age, nondisabled voucher holders, using administrative records data available from PHAs and HUD. It next explores the ways the four study PHAs differ from each other, as shown in these data. Finally, it presents the results of a baseline survey administered to families as part of the study enrollment process. These survey data provide a fuller picture of the families participating in the study.
The Eligible Sample Because it was important to test whether the new rent policy would improve tenants’ employment and earnings, families had to meet the following core criteria to be eligible for the Rent Reform Demonstration.
• A family could not be classified as an elderly household and could not become elderly (age 62, according to HUD’s definition), over the course of the study. In other words, the head of household, spouse, and co-head had to be 56 years old or younger at the time of study enrollment.
• A family could not be defined as a disabled household (that is, one in which the head, co-head, or spouse is disabled).
The study also excluded a number of other types of voucher holders (see box 4.1 for the complete list of reasons for exclusion). For example, some families were not eligible because they held special vouchers governed by some regulations that did not apply to the vast majority of regular voucher holders. Families who were already participating in HUD’s Family Self- Sufficiency (FSS) and homeownership programs were also excluded, because the new rent rules would change some of the terms that those families had agreed to when they enrolled in those programs.73
72 See chapter 12 of HUD (2001) for guidelines on the recertification process. 73 The FSS program is a voluntary case-management and asset-building program that provides incentives to work. It enables families to increase their earnings and build savings while paying more in rent—the increase in a family’s share of rent is deposited into an interest-bearing “escrow account” maintained by the housing authority and paid to the participant when he or she completes the program. Under the new rent rules for the Rent Reform Demonstration, families are not required to report changes in their earned incomes, which would limit their ability to build escrow savings during the first 3-year period when TTP increases are capped. The Homeownership program enables a family to use its housing subsidy for a mortgage payment so that it can buy a home rather than rent a unit.

Reducing Work Disincentives in the Housing Choice Voucher Program
Rent Reform Demonstration Baseline Report
26
In addition, the demonstration excluded families who were currently receiving childcare deductions so that those families would not be forced to give up deductions they had come to rely on (childcare deductions are not a feature of the new policy). Most of the remaining families who were scheduled for a recertification during the study’s enrollment period were selected for the study.74
Enrolling the SampleThe procedures for enrolling families into the study sample for the Rent Reform Demonstration were incorporated into the regular recertification process used by each of the four PHAs, with some adaptations. Once the study’s eligibility criteria were set, the PHAs and the study team identified qualifying families who were being scheduled for upcoming recertifications. Ran-dom assignment procedures were then used to allocate those families either to a new rent rules group that would be subject to the new policy for the duration of the demonstration, or to an existing rent rules group (the study’s control group) that would continue to be subject to the traditional rent rules for voucher holders. With the exception of Louisville, enrollment in the demonstration was mandatory. Families had their total tenant payments (TTPs) for rent and utilities and their housing subsidy amounts calculated according to the rules of the rent policy group to which they were assigned, and remained subject to all of the rent rules applicable to their group for the duration of the demonstration. Although families could not opt out of the rent policy group to which they were assigned, they could refuse to allow their individually identified data to be shared with the researchers. However, only 14 families—or 0.2 percent of the sample—across the four PHAs chose to do so.75
The reason for not asking recertifying voucher holders to choose which rent policy would apply to them was to mimic the ways the new policy would be likely to operate in practice if it were to be adopted as a new government policy—in prac-tice, voucher holders would not be able to choose whether the new policy would apply to them. This decision ensures that the results of the study are not based on a sample of voucher holders who had volunteered for the new policy. Those who would have volunteered might have differed substantially from the types of families who would not have volunteered. (For
Box 4.1. Sample Eligibility Criteria at the Time of Random Assignment
• ThehouseholdhadavoucheradministeredundertheMoving to Work program. Veteran Affairs Supportive Housing, Moderate Rehabilitation, and Shelter Plus Care vouchers were excluded.
• Allmembersofthehouseholdhadlegalworkingstatusinthe United States.
• Thehouseholdwasnotclassifiedasdisabled.
• Thehouseholdwasnotclassifiedaselderly,andthehousehold would not become elderly over the course of the study. In other words, the head of household, spouse, and co-head were 56 years old or younger.
• Thehousehold’svoucherwasnotanEnhancedVoucheror a Project-Based Voucher.
• ThehouseholdwasnotparticipatingintheHomeowner-ship program.
• ThehouseholdwasnotparticipatingintheFamilySelf-Sufficiency Program.
• Thehouseholdwasnotreceivingachildcarededuction.
• ThehouseholdhadnotmovedtoanotherPHA’sjurisdic-tion. Households are allowed to move to another jurisdic-tion, and the new PHA that is responsible for vouchers in that new jurisdiction will do the household’s scheduled income reviews and calculate rent according to that PHA’s rules. In this case, a household that moved to another jurisdiction would not have rent calculated according to the new rent rules.
• ThehouseholdwasnotparticipatinginanyofthePHA’sspecial programs with partner agencies.
• Thehouseholddidnothaveazerohousingsubsidy.Typically, a household can hold on to its voucher for six months after achieving an income level high enough that the PHA does not pay any housing subsidy on its behalf. Waiting lists to receive vouchers from most PHAs are typically long.
example, volunteers might have been much more likely to be employed already.) If that were the case, the results of the study might not have accurately represented the policy’s effects on the broader group of voucher holders to whom the policy could be applied in the future. The fact that the new rent policy includes safeguards to minimize the risk of harm, while also creating opportunities for substantial benefits for those who are subject
74 The study did not include new voucher holders because it was expected that a substantial number would not successfully “lease up”—that is, find appropriate housing for which they could use the voucher within the time the PHAs gave them to do so. Because such families would forfeit their vouchers, they could not be subject to either the new or existing rent rules and, consequently, would not contribute to the goals of the evaluation. 75 Appendix table I.1 shows the number of families who opted out of data collection by PHA and research group. Supplementary appendix I is available at huduser.gov and www.mdrc.org.

Reducing Work Disincentives in the Housing Choice Voucher Program
Rent Reform Demonstration Baseline Report
27
to it, was among the reasons why this random assignment design was deemed to meet recognized ethical guidelines for human-subject research.76
As discussed later in this chapter, in Louisville, community concerns led to an agreement with the PHA that families assigned to the new rent rules group would be allowed to opt out of that policy and have their rent calculated using existing rules. The PHA, HUD, and study team entered into that agree-ment recognizing that, if many families made that choice, the findings from the evaluation’s analysis might not represent the new policy’s effects very accurately. In this case, the estimates of the effects of the new rules may be watered down, because some members of the “new rent rules group” would not actually be subject to the new policy.
Figure 4.1 outlines the enrollment processes for the study PHA. In general terms, the enrollment process involved a series of steps.
1. Identification of eligible families. The PHA identified the pool of eligible voucher families who were due for recertification during the study enrollment period.77
2. Random assignment. The study team or the PHA random-ly assigned eligible families to the new rent rules group or the existing rent rules group. The rent-calculation software used by three of the four study PHAs (those in Lexington, Louisville, and San Antonio) included a module that supported random assignment. The study team conducted random assignment for the PHA in Washington, D.C., as this module was not incorporated into its rent-calculation software.78
3. Advanced notification of study status. Following random assignment, families were informed of their rent-rules sta-tus in the recertification packets mailed to them by their respective PHAs in advance of their annual recertification
meetings. The recertification packets included limited information about the demonstration, but covered the documentation requirements for each rent rules group (for example, the new rent rules group families were told to bring pay stubs or other documents showing their incomes for the prior 12 months). Each family was also assigned a date and time for its recertification interview.79
4. Additional eligibility verification. To account for changes that could affect a family’s eligibility for the study, the staff reverified a family’s eligibility at the scheduled recertifi-cation interview. For example, some families had “ported out” (that is, they moved to a new location that was the responsibility of another PHA). If this move occurred be-tween the time a family’s recertification packet was mailed and the time its recertification interview was scheduled to take place, the family would become ineligible for the demonstration. Also, in some instances, updates to the PHA data used to identify voucher holders who were eligible for the study revealed that a family initially thought to be eligible was in fact not eligible (which could happen, for example, if the family’s preexisting disability status were not reflected in the data used for random assignment).80 These 566 families (or fewer than 8 percent of families randomly assigned) who were found to be ineligible were dropped from the research sample.
5. Income review. During the initial recertification meeting, staff members initiated an income review and discussed additional documents that might be necessary to complete the income-verification and recertification process. At this meeting, staff members reviewed with families in the new rent rules group the features of those new rules and the opportunities and safeguards they offered. PHAs also plan to followup with reminders to families about these opportunities and safeguards over the 3-year period until their next scheduled triennial recertifications.
76 The study team received approval from its Institutional Review Board to implement this research design. In addition, HUD determined that the design was compli-ant with Moving to Work regulations. 77 Families were excluded from random assignment if they did not meet the study’s eligibility criteria or, in the case of some PHAs, simply if too many families were eligible that month for the staff to be able to randomly assign them all. In Louisville, 5,031 families were considered for the study, and 2,136 were randomly assigned; in Lexington, 2,228 families were considered for the study, and 1,031 were randomly assigned; in San Antonio, 5,850 families were considered for the study, and 2,080 were randomly assigned. The number of families considered in Washington, D.C., is not available because of data limitations. 78 The software modifications funded by HUD enabled all four study PHAs to update their systems to implement the new rent rules. The PHA in Washington, D.C., uses a Yardi software program, whereas the other PHAs use one designed by Emphasys.79 Households enrolling in the study were required to attend the annual recertification meeting (or the biennial meeting in Washington, D.C.) in person. This was a shift for the PHAs that routinely had conducted annual recertifications by mail, but the meeting had to be held in person so that PHAs could complete certain required research procedures (for example, completing the baseline survey and informing families about the data collection) for both study groups, and so that they could orient those in the new rent rules group to the new policy. In Louisville, existing rent rules group households were not required to attend in-person meetings to complete their annual recertifications, and they were allowed to complete their scheduled income reviews by mail. They were, however, required to complete the baseline survey either in person or by telephone.80 As discussed in supplementary appendix I, a few additional exclusions were applied after sample enrollment ended.

Reducing Work Disincentives in the Housing Choice Voucher Program
Rent Reform Demonstration Baseline Report
28
Figure 4.1. Enrollment Flow Chart
1 In Louisville, households assigned to the new rent rules group received TPP estimates for both the new and the existing rent rules at their recertification meetings and were given 30 days to decide whether they wanted to opt out of the new rent policy.2 For households assigned to the new rent rules group in Louisville, the 30-day rent change notification letter was sent at the end of the 30-day opt-out period.

Reducing Work Disincentives in the Housing Choice Voucher Program
Rent Reform Demonstration Baseline Report
29
6. Research procedures and orientation to new policy. PHAs also used the initial recertification meeting to com-plete the required research procedures, which included informing participants about the research and having them complete a brief baseline survey. Each agency’s staff administered the survey using an online data-collection instrument developed by the study team. Families also received a study information sheet, which they reviewed with the specialists at the time of the recertification meeting. The information sheet described the study, the family’s role in the research, and how they could withdraw from the data-collection effort (and, in Louisville, from the new rent policy).81 Those assigned to the new rent rules group also watched a short video that further explained the new policy.
7. New effective date and rent notification. As a last step in the enrollment process, the staff completed the income- verification process and confirmed the family’s new TTP amount and effective date. As required by HUD, the PHAs then mailed the new TTP amount and effective date to families at least 30 days before the new TTP went into effect.
In Louisville, the opt-out option required the PHA staff and families to take some additional steps. Families assigned to the new rent policy were asked to mail their income information to the agency before the recertification meeting so that the staff could prepare estimates of their TTPs under the new rent rules and under the existing rent rules. These two estimates were then presented to families and discussed at the recertification meeting. After the recertification meeting, families were given 30 days to opt out of the new rent rules. Unless a family notified the PHA about its decision to opt out (which had to be communicated in writing using an official agency form), the new rent rules would apply. After the 30-day opt-out period ended, the PHA finalized the TTP and subsidy for each family and notified them.
The enrollment process took different amounts of time at the four PHAs, in part because the agencies had “recertification cycles” (the periods during which income recertifications had to be completed) of different lengths. The recertification cycles ranged from 90 days in Lexington to 180 days in Washington, D.C.82 The study team monitored the random assignment process closely.
Enrollment Timeframe
The timeframe for enrolling families into the study was de-signed to ensure that a substantial portion of sample members could be followed in the evaluation (which ends in 2019) for more than 3 years. That way, the study could capture some of the new policy’s effects after the new rent rules group com-pleted its next scheduled triennial recertification. For example, a family in the new rent rules group whose initial TTP at the beginning of study went into effect in June 2015 would have a triennial recertification 3 years later, with an updated TTP from that recertification becoming effective in June 2018.
Figure 4.2 presents the timeline for sample enrollment and TTP effective dates for the overall demonstration and each of the four study PHAs individually. As the figure shows, 7,255 families were randomly assigned for the Rent Reform Demon-stration, with the families’ TTP effective dates ranging from June 2015 through March 2016.83 A number of families were subsequently found to be ineligible for the study (according to the criteria described in box 4.1) and were excluded from the sample, yielding a final sample size of 6,660 families. In Washington, D.C., the effective dates fell between October and December 2015. For the PHAs in other cities, the effective dates stretched over a longer period, with San Antonio families being among the first to begin experiencing the new rent rules (in June 2015).
Table 4.1 shows the number of families enrolled by each PHA and the dates when their revised rents took effect. About 90 percent of families (6,034 of the 6,660 families) began paying their newly calculated rents by December 2015.84
81 An institutional review board approved the research design, research procedures, and materials shared with families about the study, including the study informa-tion sheet.82 Two PHAs, Lexington and Washington, D.C., agreed to recertify some households early (that is, to advance their annual recertifications) to try to meet the study’s sample-size goal within the preferred enrollment timeframe. For San Antonio, the enrollment period was extended by an additional 3 months to meet the study’s sample-size goals. 83 The original plan for this study called for a sample of 7,400 families. Original projections also assumed sample sizes of close to 2,000 families from three of the four PHAs, with the Lexington sample size at about 1,400 families (Lexington operates a smaller voucher program than the other PHAs in the demonstration and agreed to enroll all eligible families). As it turned out, a smaller number of families than the PHAs originally projected met the study’s eligibility criteria and could be processed within the designated enrollment period. 84 This count excludes 17 families (or 0.2 percent of the impact sample—15 families from Washington, D.C., and 2 from Louisville). At the time this report was writ-ten, the study team was still waiting to receive data from the PHAs on these cases. Once data on these families are received and verified, these records will be added to the analysis file.
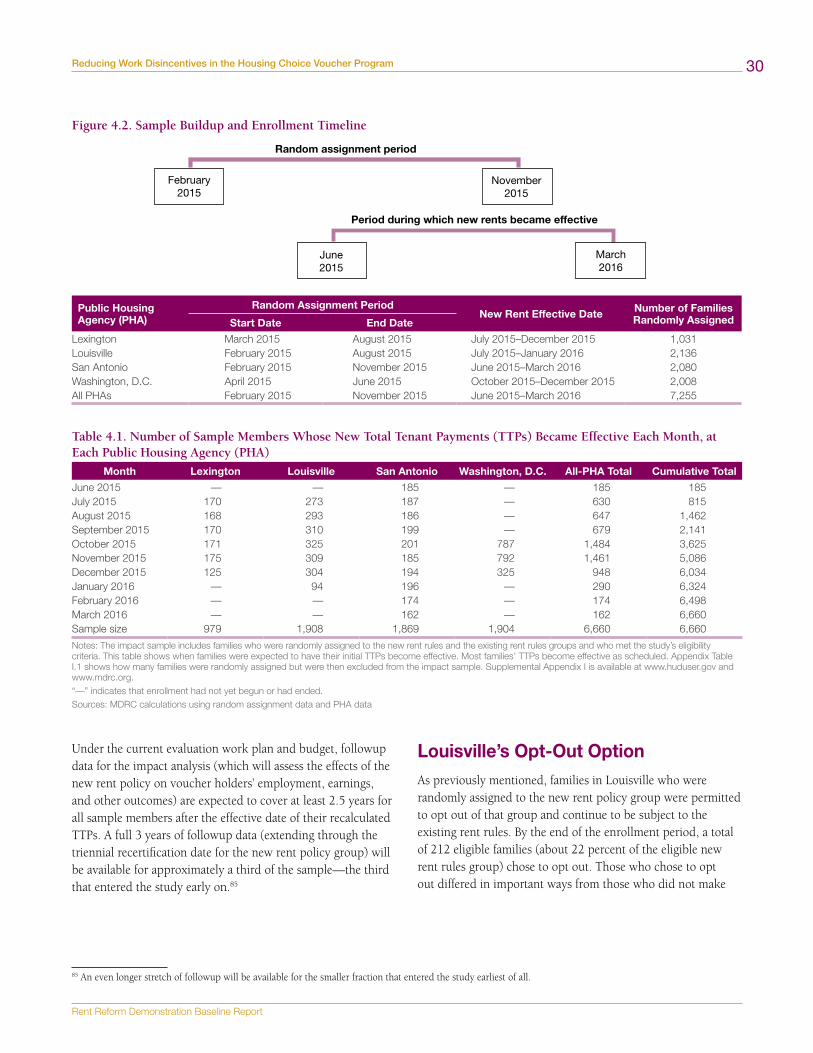
Reducing Work Disincentives in the Housing Choice Voucher Program
Rent Reform Demonstration Baseline Report
30
Figure 4.2. Sample Buildup and Enrollment Timeline
Random assignment period
Period during which new rents became effective
February2015
November2015
June2015
March2016
Public Housing Agency (PHA)
Random Assignment Period New Rent Effective Date Number of Families
Randomly AssignedStart Date End Date
Lexington March 2015 August 2015 July 2015–December 2015 1,031Louisville February 2015 August 2015 July 2015–January 2016 2,136San Antonio February 2015 November 2015 June 2015–March 2016 2,080Washington, D.C. April 2015 June 2015 October2015–December2015 2,008All PHAs February 2015 November 2015 June 2015–March 2016 7,255
Table 4.1. Number of Sample Members Whose New Total Tenant Payments (TTPs) Became Effective Each Month, at Each Public Housing Agency (PHA)
Month Lexington Louisville San Antonio Washington, D.C. All-PHA Total Cumulative Total
June 2015 — — 185 — 185 185July 2015 170 273 187 — 630 815August 2015 168 293 186 — 647 1,462September 2015 170 310 199 — 679 2,141October2015 171 325 201 787 1,484 3,625November 2015 175 309 185 792 1,461 5,086December 2015 125 304 194 325 948 6,034January 2016 — 94 196 — 290 6,324February 2016 — — 174 — 174 6,498March 2016 — — 162 — 162 6,660Sample size 979 1,908 1,869 1,904 6,660 6,660
Notes: The impact sample includes families who were randomly assigned to the new rent rules and the existing rent rules groups and who met the study’s eligibility criteria. This table shows when families were expected to have their initial TTPs become effective. Most families’ TTPs become effective as scheduled. Appendix Table I.1 shows how many families were randomly assigned but were then excluded from the impact sample. Supplemental Appendix I is available at www.huduser.gov and www.mdrc.org.“—”indicatesthatenrollmenthadnotyetbegunorhadended.Sources: MDRC calculations using random assignment data and PHA data
Under the current evaluation work plan and budget, followup data for the impact analysis (which will assess the effects of the new rent policy on voucher holders’ employment, earnings, and other outcomes) are expected to cover at least 2.5 years for all sample members after the effective date of their recalculated TTPs. A full 3 years of followup data (extending through the triennial recertification date for the new rent policy group) will be available for approximately a third of the sample—the third that entered the study early on.85
Louisville’s Opt-Out Option As previously mentioned, families in Louisville who were randomly assigned to the new rent policy group were permitted to opt out of that group and continue to be subject to the existing rent rules. By the end of the enrollment period, a total of 212 eligible families (about 22 percent of the eligible new rent rules group) chose to opt out. Those who chose to opt out differed in important ways from those who did not make
85 An even longer stretch of followup will be available for the smaller fraction that entered the study earliest of all.

Reducing Work Disincentives in the Housing Choice Voucher Program
Rent Reform Demonstration Baseline Report
31
this choice. For example, they were more likely to have lower household incomes and were less likely to have any earned income, both statistically significant differences. They also had somewhat lower TTPs (and somewhat higher housing subsi-dies) under the existing rules than they would have had under the new rent rules. In addition, the heads of these households tended to be older than the heads of those households who did not opt out. PHA staff members reported that some families simply favored whichever policy would leave them paying the lowest initial rent. Some families may not have expected to increase their earnings so as to benefit from the new policy. See appendix C for a detailed analysis comparing families in Louisville who opted out of the new rent policy with those who did not opt out.86
Characteristics of the Rent Reform SampleThe analysis of who enrolled in the Rent Reform Demonstra-tion relies on a combination of data from local and national housing authority records and the voluntary baseline survey administered to participants at study enrollment. Together, these data make it possible to provide a detailed description of the study sample and an assessment of how these families compare with the broader national pool of voucher holders.
At their recertification interviews, all families were invited to complete a voluntary baseline survey.87 The study team created an online system to collect responses to the survey, which tenants completed with PHA staff members. The survey covered a number of topics, including household composition, income, and well-being, as well as the employment status, perceived barriers to employment, and education levels of the heads of households. Overall, 79 percent of enrolled families completed the survey, and the response rates varied among
the PHAs (89 percent in Lexington, 82 percent in Louisville, 71 percent in San Antonio, and 79 percent in Washington, D.C.).
The PHAs also made available the data they normally collected on study families for the purpose of administering their vouch-ers.88 Among other measures, these data (which are available for 100 percent of the sample) include information on each household’s family composition and characteristics, income and income sources, TTP, and housing subsidy.89
In addition to these data, the study team obtained administra-tive data from HUD on the national population of working-age, nondisabled families receiving vouchers in September 2015. The data are used to compare the sample enrolled in the Rent Reform Demonstration with the relevant national voucher population.
Comparison of the Study Sample With the National Voucher Population
In order for the findings from the Rent Reform Demonstration to be relevant to the national debate over rent reform, it must test the new rent policy with families who would not be considered very different overall from the working-age, nondisabled families across the country who receive vouchers. At the same time, some of the differences in family characteristics among the demonstration’s four participating PHAs should reflect at least some of the kinds of diversity that can be found across PHAs nationally.
Tables 4.2 and 4.3 compare the household-level and individual- level background characteristics of families enrolled by the four study PHAs with the relevant national population of voucher holders.90 Although the national population used for this com parison excludes elderly and disabled households, it is important to note that other eligibility criteria that were used to exclude certain types of families from the Rent Reform
86 It is important to note that most families who opted out of the new rent policy did not choose to opt out of the evaluation. In order to minimize selection bias in the impact research sample, the evaluation still treats these families as members of the new rent rules group, although they are subject to the existing rent rules. This decision means that the evaluation’s estimated effects will be unbiased (in the sense that the initial characteristics of the new and existing rent rules groups remain similar), but that the estimated effects of the new rent policy may be somewhat diluted because not all members of the new rent rules group were exposed to the new policy. 87 A copy of the baseline survey instrument is included in supplementary appendix G of this report, which is available at huduser.gov and www.mdrc.org.88 For every family, a PHA is required to submit certification information to HUD for all fields on the HUD-50058 form. A Moving to Work housing authority is re-quired to submit a Moving to Work-50058 form to HUD that has fewer fields; however, the study team can get information beyond what is on the Moving to Work-50058 form by collecting data directly from the PHAs. In general, the 50058 form includes information about a household’s head, other members, income, rent, and housing subsidy. 89 Housing-subsidy data will be collected throughout the demonstration to describe families’ experiences under the two sets of rules and examine the new rules’ ef-fects on families’ TTPs and housing subsidies. The research team is also collecting additional information on the new rent rules group’s retrospective incomes and use of the grace period, interim recertifications, and hardship exemptions.90 For the Rent Reform Demonstration sample, the families are described according to the information about that family that was known to the PHAs at the time of random assignment.

Reducing Work Disincentives in the Housing Choice Voucher Program
Rent Reform Demonstration Baseline Report
32
Demonstration (shown in box 4.1) could not be applied to the national database, which may have influenced some of the differences discussed below.
The findings indicate that the Rent Reform Demonstration sample is roughly similar to the relevant national population of voucher holders, although some important differences do exist. For example, a somewhat smaller proportion of families in the demonstration sample (36 percent) than in the national voucher population (44 percent) has very young children (those
5 years old or younger). As discussed previously, families who were already receiving the childcare deduction under existing rent rules were excluded from the demonstration, and families with very young children may use the childcare deduction at a higher rate than those with older children. Overall, as table 4.2 shows, the average family size is slightly more than three in both the study sample and the national voucher population, and about one-third of households have more than one adult living in the home. About one-quarter of families have no children under the age of 18.
Table 4.2. Characteristics of Families in the Impact Sample and the National Housing Choice Voucher Program Population (1 of 2)
Characteristic Rent Reform Samplea National Housing Choice Voucher Programb
Average number of family members 3.4 3.2Adults 1.5 1.4Children 1.8 1.7
Families with more than one adult (%) 36.9 33.7
Number of children in the family (%)None 22.8 24.71 23.0 24.22 23.9 24.03 or more 30.3 27.1
Among families with children, age of the youngest child (%)0–5 years 36.2 43.86–12 years 41.9 38.513–17 years 21.9 17.7
Current/anticipated annual family incomec (%)$0 6.3 7.4$1–$4,999 31.7 18.6$5,000–$9,999 20.0 19.2$10,000–$19,999 25.0 29.3$20,000 or more 17.0 25.5
Income sourcesc, d (%)Wages 42.4 57.6Welfare 14.1 11.5Social Security/SSI/pensions 23.5 17.2Otherincomesources 40.0 36.8
No earned incomec, d (%) 57.6 42.4
Average annual income from wages, among families with any wage incomec, d ($)
18,275 17,454
Annual income from wagesc, d (%)$0 57.6 42.4$1–$4,999 4.0 5.5$5,000–$9,999 6.7 9.6$10,000–$19,999 15.9 23.0$20,000 or more 15.7 19.5
Average total tenant payment (TTP)e, f ($) 256 326
TTPe, f (%)$0 9.6 0.9$1–$99 22.5 24.4$100–$299 36.7 29.7$300–$699 24.6 35.3$700 or more 6.7 9.7
Average family sharee, g ($) 296 364

Reducing Work Disincentives in the Housing Choice Voucher Program
Rent Reform Demonstration Baseline Report
33
Table 4.2. Characteristics of Families in the Impact Sample and the National Housing Choice Voucher Program Population (2 of 2)
Characteristic Rent Reform Samplea National Housing Choice Voucher Programb
Family sharee, g (%)$0 7.8 1.6$1–$99 19.0 18.8$100–$299 35.3 29.2$300–$699 29.1 37.7$700 or more 8.8 12.6
Sample size 6,660 1,085,635a Rent Reform sample data were collected at the most recent recertification before random assignment.b The national column shows information current as of September 2015 for Moving to Work and non-Moving to Work public housing agencies (PHAs). Elderly and disabled households and project-based vouchers are excluded.c For the national Housing Choice Voucher Program column, income figures are calculated using earned income after exclusions and only include non-Moving to Work households.d Income-source categories are as defined on the HUD-50058 form. Wages include one’s own business, federal wages, PHA wages, military pay, and other wages. Welfareincludesgeneralassistance,annualimputedwelfareincome,andTemporaryAssistanceforNeedyFamilies.SSIisSupplementalSecurityIncome.Otherincome sources include child support, medical reimbursement, Indian trust/per capita, unemployment benefits, and other nonwage sources. e For the national Housing Choice Voucher Program column, TTP and family share for rent and utilities figures only include non-Moving to Work households.f TTP is the minimum amount a family must contribute toward rent and utilities regardless of the unit selected.g Family share is the family’s contribution toward the gross rent. It may be the TTP or higher, depending on the unit selected by the family.Notes: Sample sizes for specific outcomes may vary because of missing values. Rounding may cause slight discrepancies in calculating sums and differences.Sources: MDRC calculations using PHA and Inventory Management System/Public and Indian Housing Information Center data
Table 4.3. Characteristics of Heads of Households in the Impact Sample and the National Housing Choice Voucher Program Population
CharacteristicRent
Reform Samplea
National Housing Choice
Voucher Programb
Female (%) 94.0 89.4
Age (%)18–24 2.8 4.725–34 31.2 32.835–44 39.9 33.545–59 26.1 27.260 or older 0.0 1.8
Average age (years) 38.9 39.0
U.S. citizen (%) 97.8 94.9
Race (%)White 30.2 37.2Black/African-American 68.9 59.1American Indian/Alaska Native 0.4 1.1Asian 0.3 1.6NativeHawaiian/OtherPacificIslander 0.3 1.1More than 1 race 0.0 0.0
Ethnicity (%)Hispanic or Latino 22.5 18.5Not Hispanic or Latino 77.5 81.5
Sample size 6,660 1,085,635a Rent Reform sample data were collected at the most recent recertification before random assignment.b The National column shows information current as of September 2015 for Moving To Work and non-Moving To Work public housing agencies (PHAs). Elderly and disabled households and project-based vouchers are excluded.Notes: Sample sizes for specific outcomes may vary because of missing values. Rounding may cause slight discrepancies in calculating sums and differences. Sources: MDRC calculations using PHA and Inventory Management System/Public and Indian Housing Information Center data
The study sample includes more families with low incomes than the national voucher population; 58 percent of the study sample had annual family incomes of $0 to less than $10,000 compared with 37 percent nationally. At the same time, the study sample includes fewer families with annual incomes that exceed $20,000: 17 percent versus 26 percent nationally. The study sample also includes a smaller proportion of families with any income from wages (42 percent compared with 58 percent nationally). However, the proportion of families receiving cash welfare payments is fairly comparable—and low—across the two groups (14 percent compared with 12 percent nationally). The study sample also had a higher proportion of families who were paying zero rent (10 percent versus 1 percent nationally), possibly in part because two of the PHAs in the demonstration did not previously have a minimum TTP.
Families’ average TTP before enrolling in the demonstration is somewhat lower for the study sample than for the national population of voucher holders ($256 versus $326 nationally). This difference reflects the generally lower income levels of the study sample.
Table 4.3 shows that women head the vast majority of families in the Rent Reform Demonstration sample and in the national voucher population (94 and 89 percent, respectively). The age profiles were also similar; on average, household heads in each sample were about 39 years old. Although the majority of house -hold heads in both samples are Black or African-American, this group is more highly represented in the study sample (69 per cent versus 59 percent nationally). Hispanic or Latino heads of house-holds (of any race) also make up somewhat higher proportion of the study sample (23 percent versus 19 percent).

Reducing Work Disincentives in the Housing Choice Voucher Program
Rent Reform Demonstration Baseline Report
34
Comparison of Families Among Study PHAs
Tables 4.4 and 4.5 reveal considerable variation in family characteristics at the time of random assignment among the four PHAs participating in the demonstration. For example, the proportion of families with more than one adult in the household ranges from a low of 27 percent in Lexington to high of 50 percent in Washington, D.C. (table 4.4). The fam-ilies in Washington, D.C., are also the least likely to include children under the age of 18. Among families there, 35 percent
had no children under age 18, compared with 14 percent to 22 percent of the study families served by the other three PHAs. To some extent, this difference reflects the fact that the heads of households are older in Washington, D.C. For example, more than 40 percent are 45 years or older, compared with only 18 percent to 22 percent in that age bracket in the other three locations (table 4.5). At the same time, more than one-third of the families with children from all PHAs had children 5 years old or younger (table 4.4).
Table 4.4. Characteristics of Families in the Impact Sample, by Public Housing Agency (PHA) (1 of 2)
Characteristic Lexington Louisville San Antonio Washington, D.C.
Average number of family members 3.2 3.3 3.6 3.2Adults 1.3 1.4 1.4 1.8Children 1.9 1.9 2.2 1.4
Families with more than one adult (%) 26.6 33.9 32.7 49.5
Number of children in family (%)None 17.3 21.6 14.0 35.31 24.4 22.4 20.3 25.72 28.4 24.0 27.7 17.93 or more 29.9 32.0 38.1 21.1
Among families with children, age of youngest child (%)0–2 16.9 16.7 17.8 16.03–5 17.9 17.5 21.7 19.36–12 47.3 43.0 42.7 35.713–17 17.9 22.7 17.8 29.0
No earned income (%) 53.6 61.8 53.0 60.0
Current/anticipated annual family income (%)$0 1.5 4.0 0.6 16.6$1–$4,999 38.1 38.6 33.1 20.0$5,000–$9,999 17.9 18.7 28.3 14.4$10,000–$19,999 26.5 25.1 29.3 20.1$20,000 or more 16.0 13.7 8.7 28.9
Income sourcesa (%)Wages 46.4 38.2 47.0 40.0Welfare 5.1 5.8 3.2 37.7Social Security/SSI/pensions 19.4 25.8 23.0 23.9Otherincomesources 49.8 44.3 53.1 17.9
Child support 35.2 28.6 38.0 13.7Unemployment benefits 1.0 1.3 2.1 3.4Other 17.7 17.0 15.8 1.3
Area median family incomeb ($) 66,100 67,000 62,100 108,600
Average annual income from wages, among families with any wage incomea ($) 16,625 16,741 12,924 26,902
Annual income from wagesa (%)$0 53.6 61.8 53.1 60.0$1–$4,999 3.9 3.5 7.3 1.3$5,000–$9,999 7.8 5.8 11.1 2.8$10,000–$19,999 19.7 16.3 20.3 9.3$20,000 or more 15.0 12.6 8.2 26.5
Average total tenant payment (TTP)c ($) 266 212 212 336
TTPc (%)$0 0.0 17.0 0.0 16.6$1–$99 0.0 24.5 34.2 20.6$100–$299 69.7 30.0 41.0 21.9$300–$699 27.4 25.0 23.1 24.1$700 or more 3.0 3.4 1.8 16.8

Reducing Work Disincentives in the Housing Choice Voucher Program
Rent Reform Demonstration Baseline Report
35
Table 4.4. Characteristics of Families in the Impact Sample, by Public Housing Agency (PHA) (2 of 2)
Characteristic Lexington Louisville San Antonio Washington, D.C.
Average family shared ($) 304 256 257 369
Family shared (%)$0 1.2 12.9 0.0 13.8$1–$99 1.0 21.6 24.2 20.3$100–$299 60.1 29.4 42.6 21.4$300–$699 32.4 30.0 29.9 25.6$700 or more 5.3 6.0 3.3 18.9
Sample size (total = 6,660) 979 1,908 1,869 1,904a Income-source categories are as defined on the HUD-50058 form. Wages include one’s own business, federal wages, PHA wages, military pay, and other wages. Welfareincludesgeneralassistance,annualimputedwelfareincome,andTemporaryAssistanceforNeedyFamilies.SSIisSupplementalSecurityIncome.Otherincome sources include child support, medical reimbursement, Indian trust/per capita, unemployment benefits, and other nonwage sources. b The area median family income (MFI) figures are the fiscal year 2016 figures from HUD. HUD calculated fiscal year 2016 MFIs using 2009–2013 5-year American Community Survey data.c TTP is the minimum amount a family must contribute toward rent and utilities regardless of the unit selected.d Family share is the family’s contribution toward the gross rent. It may be the TTP or higher, depending on the unit selected by the family.Notes: Sample sizes for specific outcomes may vary because of missing values. Rounding may cause slight discrepancies in calculating sums and differences. Data were collected at the most recent recertification before random assignment.Source: MDRC calculations using PHA data
Table 4.5. Characteristics of Heads of Households in the Impact Sample, by Public Housing Agency (PHA)
Characteristic Lexington Louisville San Antonio Washington, D.C.
Female (%) 96.8 95.6 93.8 91.0
Age (%)18–24 3.5 0.9 5.7 1.425–34 39.0 32.3 38.9 18.535–44 39.8 44.7 35.6 39.545 or older 17.7 22.1 19.8 40.5
Average age (years) 36.9 38.7 36.7 42.2
U.S. citizen (%) 99.9 96.7 97.7 98.1
Race (%)White 18.6 18.2 77.0 2.1Black/African-American 81.1 80.3 22.2 97.2American Indian/Alaska Native 0.2 0.8 0.4 0.2Asian 0.0 0.1 0.2 0.6NativeHawaiian/OtherPacificIslander
0.1 0.6 0.2 0.1
More than 1 race 0.0 0.0 0.0 0.0
Ethnicity (%)Hispanic or Latino 1.9 1.2 74.9 3.2Not Hispanic or Latino 98.1 98.8 25.1 96.8
Sample size (total = 6,660) 979 1,908 1,869 1,904
Notes: Sample sizes for specific outcomes may vary because of missing values. Rounding may cause slight discrepancies in calculating sums and differences. Data were collected at the most recent recertification before random assignment.Source: MDRC calculations using PHA data
Across the PHAs, a bare majority of families had no earned income, ranging from 54 percent of families in San Antonio to 62 percent in Louisville. Even among families who did have earned income, earnings were generally low; average annual earnings (among families with earnings) ranged from about $13,000 in San Antonio to roughly $27,000 in Washington, D.C. The Washington, D.C., families were the most likely by far to receive cash welfare payments: 38 percent of them did, compared with fewer than 6 percent of the families from the other PHAs.
As expected, the race and ethnicity of the head of household varies from PHA to PHA (see table 4.5). In Washington, D.C., 97 percent of household heads are Black or African-American. In Lexington and Louisville, about 80 percent of household heads are Black or African-American, with most of the balance consisting of White heads of households. In San Antonio, 75 percent of the heads of households are Hispanic or Latino, and 22 percent are Black or African-American.

Reducing Work Disincentives in the Housing Choice Voucher Program
Rent Reform Demonstration Baseline Report
36
When the samples of all four PHAs are combined, only minor and inconsequential differences can be seen between the characteristics of families randomly assigned to the new rent rules group and those of families assigned to the existing rent rules group. Although a few of those differences are statistically significant, they are not substantively significant (indicating that, for the pooled sample, the random assignment process worked as expected). For most characteristics the two groups differ, if at all, by only a few percentage points. The same pattern is evident across the four study PHAs taken separately, although the new rent rules group and the existing rent rules group in San Antonio have somewhat larger differences.91
A Closer Look at the Study Families Using Baseline Survey Data The baseline survey captures details about the families enrolled in the Rent Reform Demonstration that are not captured in agency records. As previously mentioned, about 79 percent of enrolled families overall completed the baseline survey. However, response rates varied considerably from PHA to PHA, ranging from 71 percent in San Antonio to 89 percent in Lexington.92 A comparison of survey respondents with nonrespondents using data from PHA records for all families suggests that the two groups differed in a number of important ways, although the patterns varied by PHA. (Supplemental appendix J, available at huduser.gov and www.mdrc.org, provides a more complete survey-response analysis.)93 In Lexington, for example, survey respondents were less likely than nonrespondents to have earned income at baseline
(by about 12 percentage points), according to PHA records (appendix table J.2), but the opposite was the case in Louisville (by about 8 percentage points; appendix table J.3). In the other two PHAs, differences on this measure between respondents and nonrespondents were small and not statistically significant. In San Antonio, respondents were about 1 year younger than nonrespondents (appendix table J.4), and in Washington, D.C., respondents were somewhat less likely (by about 6 percentage points) to have more than one adult in their families, and they reported lower annual earned income on average than the nonrespondents ($26,416 versus $28,541; appendix table J.5).
These baseline survey results, and a number of other results presented in appendix J, suggest that the baseline survey sample is not exactly representative of the full impact sample. Nonetheless, the overall correspondence is high, and, for the purposes of describing the study sample and comparing the four study PHAs with each other in broad terms, the survey data provide a clear portrait of the families with information that is not available from any other data source.94
According to survey data, families in Washington, D.C., again emerge as distinctive in a number of ways, as they did from the housing authority data. As table 4.6 shows, compared with families from the other PHAs, those in Washington, D.C., were more likely to be receiving Temporary Assistance for Needy Families benefits, and had held their housing vouchers longer. In Washington, D.C., more than 59 percent of families had held their vouchers for 10 years or more, whereas at the low end only 23 percent of San Antonio’s families had held their vouchers for that long.
91 A regression analysis was conducted to determine whether background characteristics, taken together, are associated with a family’s likelihood of being assigned to the new rent rules group rather than the existing rent rules group. For the full sample from all PHAs combined, the association was not statistically significant. It also was not statistically significant for the PHAs separately, with the exception of San Antonio, possibly as the result of certain exclusions from the sample that had to be made after random assignment. (See supplemental appendix H, available at huduser.gov and www.mdrc.org.) In future reports, the impact analysis will apply standard statistical techniques to adjust for any measured background differences between the two research groups in estimating the effects of the new rent policy at each PHA and for all PHAs combined.92 The PHAs implemented various strategies to maximize survey response rates. Staff members were provided talking points to address concerns that families may have had about completing the baseline survey. They were also asked to make sure that families received a $25 gift card for completing the survey. Families who came in for late recertifications or who did not show up to their first appointments were allowed to complete the baseline survey when they did appear for their appointments. PHA staff members were also allowed to administer the baseline survey at another time after the initial interview (either in person or on the tele-phone), as long as it was completed before a family’s new rent went into effect. In San Antonio, the PHA had a supervisor talk to families who joined the study later in the enrollment period and who were concerned about taking the baseline survey to try to address their concerns. In Louisville, where existing rent rules group households were not required to attend in-person recertification meetings, the families were given the option to complete the baseline survey by telephone. Later in the enrollment period (for those whose rent became effective in December), families were given the option of completing the baseline survey on the phone with the research team. In addition, the study team began calling households directly, offering them another opportunity to complete the baseline survey. 93 See Johnson and Wislar (2012) and Cull et al. (2005) for discussions of alternative methods of assessing survey-response bias. 94 Supplementary appendix J also compares the characteristics of survey respondents in the new rent rules group with survey respondents in the existing rules group. For three of the four PHAs, very few differences are evident between these two groups. The differences are more pronounced in San Antonio, although here the two groups are much more similar than different. (See appendix tables J.6 through J.13.)
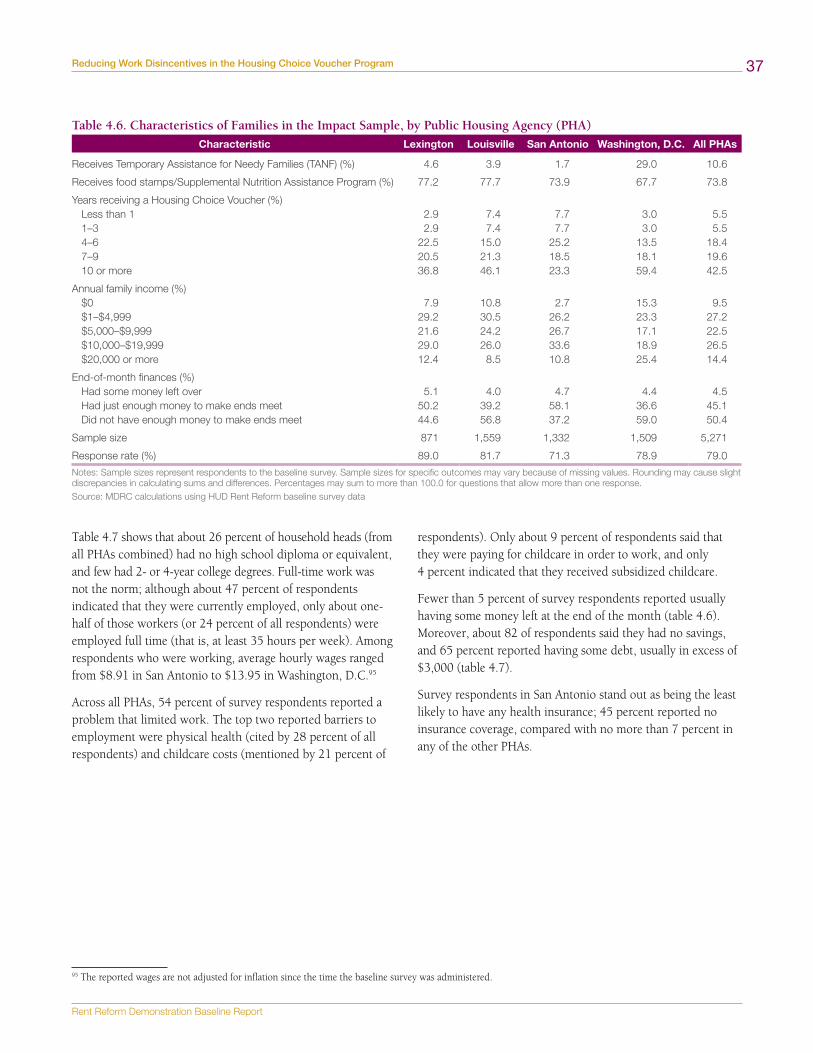
Reducing Work Disincentives in the Housing Choice Voucher Program
Rent Reform Demonstration Baseline Report
37
Table 4.6. Characteristics of Families in the Impact Sample, by Public Housing Agency (PHA)
Characteristic Lexington Louisville San Antonio Washington, D.C. All PHAs
Receives Temporary Assistance for Needy Families (TANF) (%) 4.6 3.9 1.7 29.0 10.6
Receives food stamps/Supplemental Nutrition Assistance Program (%) 77.2 77.7 73.9 67.7 73.8
Years receiving a Housing Choice Voucher (%)Less than 1 2.9 7.4 7.7 3.0 5.51–3 2.9 7.4 7.7 3.0 5.54–6 22.5 15.0 25.2 13.5 18.47–9 20.5 21.3 18.5 18.1 19.610 or more 36.8 46.1 23.3 59.4 42.5
Annual family income (%)$0 7.9 10.8 2.7 15.3 9.5$1–$4,999 29.2 30.5 26.2 23.3 27.2$5,000–$9,999 21.6 24.2 26.7 17.1 22.5$10,000–$19,999 29.0 26.0 33.6 18.9 26.5$20,000 or more 12.4 8.5 10.8 25.4 14.4
End-of-month finances (%)Had some money left over 5.1 4.0 4.7 4.4 4.5Had just enough money to make ends meet 50.2 39.2 58.1 36.6 45.1Did not have enough money to make ends meet 44.6 56.8 37.2 59.0 50.4
Sample size 871 1,559 1,332 1,509 5,271
Response rate (%) 89.0 81.7 71.3 78.9 79.0
Notes: Sample sizes represent respondents to the baseline survey. Sample sizes for specific outcomes may vary because of missing values. Rounding may cause slight discrepancies in calculating sums and differences. Percentages may sum to more than 100.0 for questions that allow more than one response.Source: MDRC calculations using HUD Rent Reform baseline survey data
Table 4.7 shows that about 26 percent of household heads (from all PHAs combined) had no high school diploma or equivalent, and few had 2- or 4-year college degrees. Full-time work was not the norm; although about 47 percent of respondents indicated that they were currently employed, only about one-half of those workers (or 24 percent of all respondents) were employed full time (that is, at least 35 hours per week). Among respondents who were working, average hourly wages ranged from $8.91 in San Antonio to $13.95 in Washington, D.C.95
Across all PHAs, 54 percent of survey respondents reported a problem that limited work. The top two reported barriers to employment were physical health (cited by 28 percent of all respondents) and childcare costs (mentioned by 21 percent of
respondents). Only about 9 percent of respondents said that they were paying for childcare in order to work, and only 4 percent indicated that they received subsidized childcare.
Fewer than 5 percent of survey respondents reported usually having some money left at the end of the month (table 4.6). Moreover, about 82 of respondents said they had no savings, and 65 percent reported having some debt, usually in excess of $3,000 (table 4.7).
Survey respondents in San Antonio stand out as being the least likely to have any health insurance; 45 percent reported no insurance coverage, compared with no more than 7 percent in any of the other PHAs.
95 The reported wages are not adjusted for inflation since the time the baseline survey was administered.

Reducing Work Disincentives in the Housing Choice Voucher Program
Rent Reform Demonstration Baseline Report
38
Table 4.7. Characteristics of Heads of Households in the Impact Sample, by Public Housing Agency (PHA) (1 of 2)
Characteristic Lexington Louisville San Antonio Washington, D.C. All PHAs
Average age (years) 36.9 39.0 36.4 42.3 39.0
Age (%)18–24 3.3 0.6 5.9 1.8 2.825–34 39.6 31.2 40.7 18.8 31.435–44 39.0 44.8 33.9 38.2 39.245 or older 18.0 23.4 19.5 41.3 26.6
Marital status (%)Married, living with spouse 3.7 4.1 5.8 3.2 4.2Cohabitating 0.1 0.3 5.1 0.3 1.5Single, never married 72.8 70.7 60.0 83.2 71.9Separated 10.5 10.2 13.6 5.0 9.6Divorced or widowed 13.0 14.8 15.5 8.4 12.8
U.S. citizen (%) 99.2 98.1 98.1 98.4 98.4
Education
Highest degree or diploma earned (%)High school equivalency 7.9 7.8 9.5 8.3 8.4High school diploma 17.3 21.2 25.9 39.1 26.8Some college 37.0 32.9 22.2 18.9 26.9Associate’s or 2-year college degree 15.3 13.3 6.0 3.7 9.14-year college or graduate degree 3.8 3.0 1.2 3.0 2.7None of the above 18.7 21.9 35.2 27.1 26.2
Highest degree is a high school diploma or equivalent (%) 62.2 61.9 57.6 66.3 62.1
Has a trade license or training certificate (%) 33.9 29.8 19.9 40.6 31.0
Currently attending college or vocational training (%) 9.9 10.7 8.2 21.1 12.9
Currently taking any training course or educational classes to aid in employment (%)
8.2 7.9 6.1 18.8 10.6
Currently receiving job-search assistance (%) 8.5 9.8 6.7 20.6 11.9
Employment status
Currently employed (%) 52.2 45.9 52.7 39.9 46.9
Currently working 35 hours or more per week (%) 23.1 21.6 25.6 24.1 23.6
Total weekly earnings (%)$0 52.9 58.1 49.2 68.2 57.7$1–$200 13.5 9.7 19.0 3.2 11.0$201–$400 22.2 20.3 21.5 9.5 18.0$401 or more 11.4 12.0 10.3 19.1 13.4
Average hours worked per week, among those currently employed 30 31 32 34 32
Average hourly wage, among those currently employed ($) 9.69 10.35 8.91 13.95 10.52
Average weekly earnings, among those currently employed ($) 302 327 277 483 339
Has more than one job (%) 2.9 1.5 2.4 1.1 1.8
Employment during the past year
Average number of months employed, among those who worked in the past 12 months
8.5 8.2 9.1 9.3 8.8
Number of months employed in the past year (%)0 32.3 32.3 33.5 52.5 38.21–6 21.8 25.1 18.8 12.2 19.47–11 16.5 14.6 12.3 7.4 12.312 29.5 28.0 35.5 27.9 30.1

Reducing Work Disincentives in the Housing Choice Voucher Program
Rent Reform Demonstration Baseline Report
39
Table 4.7. Characteristics of Heads of Households in the Impact Sample, by Public Housing Agency (PHA) (2 of 2)Characteristic Lexington Louisville San Antonio Washington, D.C. All PHAs
Financial status
Has an account at a bank or credit union (%) 36.6 37.4 34.0 30.4 34.4
Savings amount (%)$0 78.1 87.5 75.9 82.6 81.8$500 and less 20.0 10.9 20.1 14.7 15.6$501–$1,000 1.1 0.9 1.5 1.2 1.2$1,001–$3,000 0.6 0.4 1.8 1.0 0.9More than $3,000 0.1 0.3 0.8 0.6 0.5
Debt amount (%)$0 25.4 24.0 37.4 52.5 35.5$500 and less 7.4 7.6 12.5 7.7 8.8$501–$1,000 4.0 5.4 8.0 4.2 5.5$1,001–$3,000 6.1 6.6 9.8 5.6 7.1More than $3,000 57.1 56.5 32.4 30.0 43.1
Health insurance
Health insurance coverage (%)None 6.7 4.0 44.8 2.3 14.2Public health insurance 83.2 86.9 41.4 89.1 75.5Employer health insurance 7.1 8.8 9.7 7.4 8.3Otherhealthinsurance 3.0 0.4 4.1 1.2 2.0
Barriers to employment
Has any problem that limits worka (%) 54.4 62.9 56.2 41.8 53.8Physical health 27.0 33.1 23.4 25.5 27.5Emotional or mental health 12.3 15.1 14.4 13.8 14.1Child care cost 23.0 28.1 25.6 7.2 20.6Need to care for a sick or disabled family member 11.9 17.5 21.2 11.7 15.9Previously convicted of a felony 5.9 6.1 3.1 4.8 5.0
Has any physcial, emotional, or mental health problem that limits work (%) 31.2 37.0 27.6 28.8 31.3
Child care
Has a child under age 13 (%) 64.1 58.3 63.3 32.4 53.2
Any nonparental care (%) 24.6 28.9 17.5 12.7 20.8
Paid for any nonparental care (%) 10.6 11.6 7.9 4.6 8.6
Receives subsidized child care (%) 7.8 5.0 2.1 2.7 4.1
Sample size 871 1,559 1,332 1,509 5,271
Response rate (%) 89.0 81.7 71.3 78.9 79.0a More than one option could be selected, so subcategories may sum to more than the total just below. Notes: Sample sizes represent respondents to the baseline survey. Sample sizes for specific outcomes may vary because of missing values. Rounding may cause slight discrepancies in calculating sums and differences. Percentages may sum to more than 100.0 percent for questions that allow more than one response.Source: MDRC calculations using HUD Rent Reform baseline survey data
Table 4.8 presents findings on sample members’ reported material hardships. Almost 70 percent of survey respondents said that they had experienced one or more hardships in the last year. The most commonly reported hardships were an inability to pay the cost of utilities (mentioned by 46 percent of all respondents), telephone bills (cited by 34 percent), and food (cited by 28 percent). About 20 percent of respondents
indicated that they did not have enough money to pay rent sometime in the past year. For a small but nontrivial proportion of respondents, these material hardships were recurring. More than 41 percent of survey respondents in San Antonio reported not being able to see a doctor or get medical assistance in the past year because of cost, a finding related to the lower rates of health insurance among families there.

Reducing Work Disincentives in the Housing Choice Voucher Program
Rent Reform Demonstration Baseline Report
40
Table 4.8. Material Hardship During the 12 Months Preceding a Respondent’s Interview, by Public Housing Agency (PHA)
Characteristic Lexington Louisville San Antonio Washington, D.C. All PHAs
Family experienced at least one material hardship 64.6 77.6 73.0 62.0 69.9Not able to buy food 18.3 33.8 34.4 23.2 28.4Not able to pay telephone bill 33.2 35.1 37.2 31.3 34.3Not able to pay rent 13.8 26.2 22.7 12.8 19.5Not able to pay utility bill 35.4 54.8 47.8 41.5 46.1Not able to see a doctor or buy prescription drugs 17.2 19.3 42.1 12.6 22.8
Number of months unable to buy food0 81.7 66.2 66.0 77.1 71.81 to 3 12.5 15.6 19.9 15.9 16.34 to 6 3.1 6.6 8.3 4.0 5.77 or more 2.7 11.5 5.8 3.0 6.2
Number of months unable to pay telephone bill0 67.0 65.1 63.1 69.1 66.01 to 3 22.7 20.4 22.0 23.3 22.04 to 6 8.1 8.5 10.4 5.2 8.07 or more 2.2 6.0 4.6 2.4 4.0
Number of months unable to pay rent or utility bill0 58.5 38.2 46.8 54.0 48.21 to 3 34.0 39.1 35.3 33.9 35.94 to 6 6.2 13.5 12.2 8.0 10.47 or more 1.3 9.2 5.7 4.1 5.6
Not able to pay rent or utility bill 41.5 61.8 53.5 46.7 52.1
Sample size 871 1,559 1,332 1,509 5,271
Response rate (%) 89.0 81.7 71.3 78.9 79.0
Notes: Sample sizes represent respondents to the baseline survey. Sample sizes for specific outcomes may vary because of missing values. Rounding may cause slight discrepancies in calculating sums and differences. Percentages may sum to more than 100.0 for questions that allow more than one response.Source: MDRC calculations using HUD Rent Reform baseline survey data
ConclusionOverall, the voucher holders who make up the combined four-city sample for the Rent Reform Demonstration are roughly similar to the relevant national voucher population in their basic household characteristics and income levels. The groups are far more similar than different, but, across the four study PHAs, the families do vary in a number of areas, such as race and ethnicity, family composition, and income sources. Both factors make the sample a good one for testing the effects of the new rent policy.
The baseline survey provides additional insights into the study population. It highlights substantial variation among the four PHAs and among the families served by each PHA in families’ degrees of connection to the labor force, their levels of education, the barriers they face that make working difficult, and their financial circumstances and material hardships. It is noteworthy that even though this segment of the low-income population is fortunate in having access to housing subsidies, many of the people surveyed reported substantial difficulty making ends meet and were contending with important material hardships.
The next chapter examines the initial TTPs for the families enrolled in the demonstration.
Reducing Work Disincentives in the Housing Choice Voucher Program
Rent Reform Demonstration Baseline Report
41
Chapter 5. Making the Transition to the New Rent Policy and Its Implications for Housing SubsidiesImplementing the new rent policy placed substantial new de mands on the four participating public housing agencies (PHAs). All of the agencies had to institute new procedures for calculating rents and completing the recertification process, while con tinu-ing to operate their existing rent-subsidy systems. They had to implement major adaptations to their rent-calculation software to accommodate the new rules. Staff members needed to understand the policy intent behind the new rent rules and the operational details of those rules, and they needed to under-stand how to use the new software and how to describe to families the ways the new rules would benefit them and protect them. In addition, staff members needed to understand and comply with a number of special requirements and procedures associated with the random assignment evalua tion, and they had a short time to enroll and recertify the number of families needed to meet the evaluation’s sample-size requirements. Taken together, these operational challenges were daunting.
This chapter describes the main steps undertaken to prepare the PHAs to implement the new rent policy, and the ways the study team and its partners supported them in this process. It also explores the agencies’ early experiences in applying the new rules. It shows that, collectively, the PHAs successfully planned for and implemented recertifications for thousands of families under the new policy. They simultaneously completed recertifications under the existing policy for a comparable number of families in the existing rent rules group.
The chapter also examines the new rules’ effects on families’ expected total tenant payments (TTPs) for their rent and utilities in the first month in which these rules took effect for them. The analysis shows that, on average, these initial TTPs were somewhat lower for families in the new rent rules group than for families in existing rent rules group, which means that the PHAs were initially providing somewhat larger housing subsidies under the new policy. The analysis also shows that during the initial implementation period covered by this report, a sizable number of families qualified for and received temporary grace period TTPs, one of the safeguard provisions under the new rent policy. However, few of the families who might have qualified for TTP reductions under the policy’s hardship provision had yet received hardship remedies. Aware of this problem, the PHAs mailed additional information to the families in the new rent rules group reminding them about the
new policy’s safeguards, and reminding them of the financial benefits the policy offers if they increase their earnings. The mailing prompted some families to approach the PHAs and inquire about their eligibility for hardship remedies. Whether the number of families requesting and receiving hardship remedies grows over time as families become more familiar with the hardship process, or for other reasons, remains to be seen and will be a continuing focus of the evaluation.
Preparing Housing Agencies To Implement the New Rent PolicyAs the overall managers and evaluators of the demonstration, the study team and its partners worked closely with the four PHAs to specify the processes required to implement the new rent policy. The study team helped the agencies think through their staffing needs and software modifications, how they would integrate research procedures into recertification meetings, and how staff members would be trained in the procedures for calculating rent and utilities using a new set of rules. The team prepared a manual for each PHA describing these procedures and helped train housing specialists and their supervisors to apply them.96 In addition, the team observed recertification meetings, monitored implementation practices, and provided refresher training sessions on the use of interim recertifications and hardship remedies. The team continues to conduct regular-ly scheduled check-in meetings with managers at each PHA to discuss any challenges that the PHA is facing in implementing the new rent policy. The study team had no direct operational role in the administration of the new rent rules, however.
Staffing
Leading up to the launch of the demonstration, the PHAs confronted the operational complexities and challenges of operating dual rent-calculation systems (one for the new rent rules group and the one for the existing rent rules group) and explored the best way to organize and structure the demonstra-tion within their respective agencies. One of the first decisions PHAs had to make concerned staffing.
Three of the four PHAs dedicated staff members to work exclusively with the families assigned to the new rent policy. The PHA in San Antonio assigned a team of two housing
96 Copies of these manuals are available on request from MDRC.
Reducing Work Disincentives in the Housing Choice Voucher Program
Rent Reform Demonstration Baseline Report
42
specialists to conduct all the recertifications for families in the new rent rules group. The Louisville PHA devoted a team of four housing specialists, and the PHA in Washington, D.C., assigned eight housing specialists to this group. The Lexington PHA, on the other hand, devoted a team of seven to work on the Rent Reform Demonstration overall, with each specialist conducting recertifications for families drawn from both the new and existing rent rules groups. Staff assignments were guided by each agency’s assessment of the projected number of families eligible for recertification in each study-enrollment month (described in chapter 3), staff availability, and the desire to contain the number of staff members who would need to be trained to administer the new rent policy.
Each PHA assigned a dedicated manager or supervisor for the demonstration who worked closely with the specialists to oversee their day-to-day activities and who coordinated demonstration-related activities with the study team.
Customizing Housing Agency Software Systems
Implementing an alternative rent policy meant the PHAs had to modify their existing software to support the income- calculation rules of the new rent policy.97 To administer the new policy, the existing software systems needed to accommodate a 12-month retrospective income period, the elimination of deductions from income, changes in asset income calculations and utility payments, the transition from annual to triennial recertifications, and calculations to assess family eligibility for a grace-period TTP and other safeguards. The study team and the PHAs worked with their software vendors to create the system requirements and map out the modifications that would be necessary to their existing software to support rent calculations under the new rules. Using these specifications, the software vendors customized their proprietary software to support the project’s needs.
In November 2014, the PHAs were notified that HUD would compensate them for the costs associated with the system modifications. By March 2015, following initial testing, the software systems for the Louisville, Lexington, and San Anto-nio PHAs were operational. The Washington, D.C., system was operational by May 2015, closer to that PHA’s implementation of the new rent policy. A variety of software refinements followed the launch of the demonstration, as the PHAs shared their early implementation experiences and requested changes or adjustments.
Staff members assigned to work with families in the new rent rules group were oriented to the new rent policy and trained to use the modified rent-calculation software.98 The software developers and the study team conducted onsite, telephone, and web-based training, with the developers focusing on the technical aspects of the system modifications, helping staff members to understand the changes to data-entry screens and fields they were familiar with. Integrated into the systems training, the study team’s technical-assistance efforts focused on helping staff members understand how the modified software supported administration of the new rent policy. Throughout the study enrollment period, both the study team and the software developers continued to support staff members as they learned to navigate the modified software and use it to implement the new rent policy.
Communicating the New Policy to Families
How the alternative rent model is explained and communicated to voucher holders is critical. Families must understand the new rent rules if they are to change their work behaviors in response to the new policy’s financial incentives. The study team and PHAs reviewed the materials usually shared with tenants ahead of their recertification meetings and assessed how, if at all, those materials needed to be revised to explain the new policy to families. A multipronged communication approach emerged, with each element of the effort designed both to inform families about the new rent rules and to market the benefits of the new rent policy. This communication effort, which started with the initial recertification meeting, will continue through the end of the demonstration.
A first message, included in the recertification packet, focused on a family’s rent-rules status—that is, whether it would have its TTP calculated under the new rent policy or the existing rules—and the documents it needed to submit for recertification. This language was folded into each PHA’s official communica-tion to families about their upcoming recertifications. It did not carry detailed information—for example, it did not describe what it meant for the family to have its rent calculated under the new rules. The initial recertification meeting became the first opportunity to meet with the families in person and to explain the new policy to them. Reserving the details in this way allowed the housing specialists to clarify the implications of the new rules for each family’s particular circumstances.
97 The PHAs have contracts with software vendors to use their proprietary software to administer the voucher program and to report data to HUD. 98 Some PHAs had all the housing specialists oriented to the new policy. Doing so made all staff members aware of the basic features of the new rent policy. Even in these PHAs, however, only staff members assigned to work with families in the new rent rules group participated in detailed training to learn the new software.

Reducing Work Disincentives in the Housing Choice Voucher Program
Rent Reform Demonstration Baseline Report
43
Although each PHA conducted its recertification meetings with families differently, the housing specialist typically began by providing a brief synopsis of the Rent Reform Demonstration, pointing to the information on the demonstration that was included in the advance letter sent to families. The specialist also referred to the retrospective-income documents that the family needed to provide to have its new TTP calculated. The specialist then directed the family to a computer monitor to view a 13-minute orientation video that introduced the central features of the new rent policy.99 The video described the main ways the rent rules changed for families in the new rent rules group. For example, it explained that their TTPs would be based on 28 percent of their gross monthly incomes, that the PHA would determine their average monthly incomes using the income they had earned in the previous 12 months, and that they would be required to pay at least the minimum TTP to landlords. The video also highlighted the main benefits of the new rent rules—for example, that families would get to keep more of their earnings over 3 years (see figure 5.1) and that they would not have to report any increases in income
during that period to the PHA.100 Families also learned about the safeguards and hardship protections that might help them if they experience difficulty paying their rent. While families watched the video, specialists reviewed the information the families provided.
Understanding that families might have questions about the new rules after their initial recertification meetings, the PHAs prepared an orientation packet for families to take with them when they finished. The packet included several documents that described the features of the new rent policy in various levels of detail. A one-page brochure, for instance, highlighted the core features of the new rent policy. The packet also included a side-by-side comparison of the new and existing rent rules, allowing families to see how the new policy changed the way their TTPs and housing subsidies would be determined. A detailed Frequently Asked Questions form was designed to answer some of the questions that families were likely to raise about the new rent policy.101 During the recertification meeting, specialists generally handed these packets to families
Figure 5.1. Illustration From the Rent Reform Video for Participants
99 The institutional review board and PHAs reviewed the video script to ensure that the video would be appropriate for their Housing Choice Voucher families. A Spanish-language version of the video was also produced and was provided to Spanish-speaking families on request. 100 Across the PHAs, staff members reported and some study team members observed during onsite training visits that figure 5.1 often prompted the most positive reactions. The study team will provide a fuller assessment of families’ perspectives on the new rent policy in a later report.101 Documents in the Rent Reform orientation packet ranged from the ninth-grade reading level to the twelfth-grade reading level.

Reducing Work Disincentives in the Housing Choice Voucher Program
Rent Reform Demonstration Baseline Report
44
and described the contents. Some specialists spent more time reviewing specific parts of the packet. The Lexington PHA made this information more broadly available by putting the documents on its website (a common practice for this agency) and also handed out the same documents during the recertifi-cation meeting.
Beyond these initial communication efforts, the demonstration partners (the study team, the PHAs, and HUD) recognized the importance of continuing to market the financial incentives to families in the new rent rules group. They believed that this marketing and communication was needed to ensure that families understood the new rent policy’s incentives and safeguards, and their own new responsibilities (including the responsibility to make contact with the housing authority when their incomes declined, to determine whether they qualified for TTP reduc-tions). Under the 3-year recertification policy, many families may have had little or no contact with the agency until their next scheduled triennial recertifications. The ongoing com-munication effort was thus considered especially important to remind them of the policy’s incentives and protections.
Approximately 6 months after families had their TTPs calculated under the new rules, the PHAs mailed out the first communica-tions flyer, a simple one-page document (see figure 5.2). The flyer reminds families that if they increase their earnings they do not have to inform the PHA, that their TTPs will not increase because of an increase in earnings (before their triennial re certifications), and that they should reach out to their housing specialists if their incomes go down (because they may qualify for TTP reductions).
In the future, the PHAs will send additional communications materials to families in the new rent rules group. The expec-tation is that these materials will be mailed to families about once or twice a year, and will be used to emphasize both the financial incentives and the safeguards in the new rent policy. As part of the evaluation, the study team will monitor the communication strategies and mechanisms implemented by the PHAs, the messages and reminders offered to families, and families’ responses to these efforts.
Calculating Families’ Contributions to Their Housing Costs Under the New Policy Under traditional rent rules, the recertification process entails reassessing a family’s continued eligibility for the voucher
Figure 5.2. Rent Reform Flyer
pro gram, recalculating its expected contribution to its rent and utilities, and redetermining its housing subsidy. Under traditional rules, the process typically begins several months before the 1-year anniversary of the family’s current (soon-to-be-expiring) TTP. As explained in chapter 3, housing specialists collect and verify the information families submit on their incomes and on other subjects, enter data into the rent-calculation system, have the system estimate the TTPs, and notify families 30 days before their new rent effective dates—that is, the dates when their new TTPs go into effect.102 These recertification-related activities take different amounts of time at different PHAs, from about 90 days in Lexington to 180 days in Washington, D.C.
This process was modified under the new rent policy. Families assigned to the new rent rules group were required to docu ment the income they had received from jobs or other sources during a defined 12-month period leading up to their recertification meetings. This information was used to calculate the families’ retrospective incomes, which was necessary to determine their TTPs. Families were also required to report their current or anticipated incomes for the coming year. The retrospective or
102 As noted in previous chapters, the PHA in Louisville included an additional 30-day notification period to allow families the option of opting out of the new rent policy.

Reducing Work Disincentives in the Housing Choice Voucher Program
Rent Reform Demonstration Baseline Report
45
12-month “look-back” period ended the month before the family’s recertification interview. For example, if a family was scheduled for a recertification interview on February 21, 2015, the 12-month period used to determine retrospective income was February 1, 2014 to January 31, 2015.103
The Rent Reform Demonstration did not change the rules about what was or was not counted as income (except the amount of income from assets that was to be counted). Families were required to make a good-faith effort to provide proof of income for the requested period. When families were unable to provide appropriate income documentation, or when the PHAs were unable to verify past income using their standard methods,104 the PHAs followed agreed-upon procedures to im-pute gaps in reported household income. The study team and the PHAs anticipated scenarios where families would struggle to obtain the required income documents—for example, pay stubs from early in the retrospective period—and developed rules and guidance for staff members to use in such situations. Appendix D contains two imputation scenarios included in the operations guide customized for each PHA.
By March 2016, the four PHAs had completed income recerti-fications for all the families enrolled in the demonstration, both those subject to the new rent rules and those subject to the existing rent rules.
Differences in Estimated Income Under the Two Rent Policies
Families in the new rent rules group provided information on their retrospective gross incomes, and families in the existing rent rules group provided information on their current and anticipated adjusted incomes for the year ahead. In cases where certain safeguards were applied, particularly the grace period rent, families in the new rent rules group had their TTPs cal culated based on their current or anticipated gross incomes rather than their retrospective incomes.
Table 5.1 compares these two estimates of annual income, which are the foundation for calculating TTPs and housing subsidies (except for families required to pay the minimum TTP).105 It presents the results for all PHAs combined (top panel) and for each PHA separately. It also includes two panels of information for the Louisville PHA, the one where participants could opt out of the new rent policy and have their rents calculated under the traditional rent rules. For that PHA, the first panel shows the income calculations for all the families in the new rent rules group, including those who opted out. A second panel shows the same income calculations but excludes those who opted out of the new rent rules. The first panel leaves the participants in their original random assignment groups; it is useful because it shows income calculations for families based on their study groups. To reflect the fact that some of the families in the new rent rules group had their rents calculated under traditional rules, the second panel excludes those families.106
Table 5.1. Comparison of Income Considered in Determining Total Tenant Payment (TTP) Under the New Rent Rules and Existing Rent Rules at Initial Recertification, by Public Housing Agency (PHA) (1 of 2)
Outcome New Rent Rulesa Existing Rent Rulesb Difference
All PHAsAverage annual base family income ($) 11,717 12,104 – 387
Annual base family income (%)$0 10.1 12.7 – 2.5$1–$4,999 24.5 23.3 1.3$5,000–$9,999 21.4 18.7 2.7$10,000–$19,999 25.3 23.4 1.9$20,000 or more 18.6 21.9 – 3.3
Sample size (total = 6,208) 3,118 3,090
103 When at least part of recertification process was conducted by mail (in Louisville, for example), the retrospective period was the 12-month period that ended the month before the recertification packet was mailed.104 Retrospective income was verified using the HUD Verification Hierarchy and the guidance provided in HUD Notice PIH 2010-19 (HA) and the PHA Administra-tive Plan. Although it was a different procedure for PHAs to obtain past income data rather than estimating families’ current incomes, the hierarchy used and types of verification obtained complied with HUD requirements and allowed families to certify that they had or did not have certain types of income (self-certification).105 At the time of the analysis, PHA administrative data on the first certification under the new rent rules were available for 6,208 of the 6,660 households included in the impact sample. The remaining 452 households may not have data from a first certification because they were in the process of ending their voucher participation with the PHA, they were moving to an area administered by another PHA, or they were experiencing some other issue related to the certification process. Data ob-tained for future reports will be used to ascertain the initial certification statuses of these remaining households.106 Other tables in the chapter adopt a similar format and report information for the Louisville sample with and without the families who opted out of the new rules. However, the results for all PHAs combined always include the families in Louisville who opted out and had their TTPs calculated under traditional rules.

Reducing Work Disincentives in the Housing Choice Voucher Program
Rent Reform Demonstration Baseline Report
46
Table 5.1. Comparison of Income Considered in Determining Total Tenant Payment (TTP) Under the New Rent Rules and Existing Rent Rules at Initial Recertification, by Public Housing Agency (2 of 2)
Outcome New Rent Rulesa Existing Rent Rulesb Difference
LexingtonAverage annual base family income ($) 9,472 11,191 – 1,719
Annual base family income (%)$0 9.7 16.9 – 7.2$1–$4,999 29.6 20.7 8.9$5,000–$9,999 21.8 11.3 10.5$10,000–$19,999 26.8 18.2 8.6$20,000 or more 12.1 32.8 – 20.8
Sample size (total = 951) 473 478
Louisville (opt-outs included)c
Average annual base family income ($) 9,347 8,496 851
Annual base family income (%)$0 14.2 19.9 – 5.7$1–$4,999 24.5 24.7 – 0.2$5,000–$9,999 22.2 22.2 0.0$10,000–$19,999 26.5 21.0 5.5$20,000 or more 12.5 12.2 0.4
Sample size (total = 1,729) 891 838
Louisville (opt-outs excluded)c, d
Average annual base family income ($) 10,189 8,496 1,693
Annual base family income (%)$0 9.3 19.9 – 10.6$1–$4,999 23.7 24.7 – 1.0$5,000–$9,999 24.2 22.2 2.1$10,000–$19,999 28.4 21.0 7.4$20,000 or more 14.3 12.2 2.2
Sample size (total = 1,535) 697 838
San AntonioAverage annual base family income ($) 11,488 12,374 – 886
Annual base family income (%)$0 1.6 1.9 – 0.2$1–$4,999 25.2 24.2 1.0$5,000–$9,999 28.6 23.8 4.9$10,000–$19,999 28.2 29.2 – 1.0$20,000 or more 16.4 21.0 – 4.6
Sample size (total = 1,720) 857 863
Washington, D.C.Average annual base family income ($) 15,507 15,647 – 140
Annual base family income (%)$0 14.4 16.9 – 2$1–$4,999 21.2 20.7 0$5,000–$9,999 13.4 11.3 2$10,000–$19,999 20.5 18.2 2$20,000 or more 30.4 32.8 – 2
Sample size (total = 1,808) 897 911a Family income for the new rent rules group shows retrospective income or gross current/anticipated income. Under the new rent rules, TTP is generally based on retrospective income, but households who were under grace-period rents or had approved hardship remedies had their TTPs calculated based on their current/anticipated gross incomes. b Family income for the existing rent rules group shows adjusted current/anticipated income. c Louisville households who opted out (212) are families who were randomly assigned into the new rent rules group and remained in that group but chose to have their rent calculated according to the existing rent rules. d Louisville families who opted out of the new rent policy are excluded from the results for the new rent rules group in this panel.Notes: Sample sizes for specific outcomes may vary because of missing values. Rounding may cause slight discrepancies in calculating sums and differences.Source: MDRC calculations using PHA data
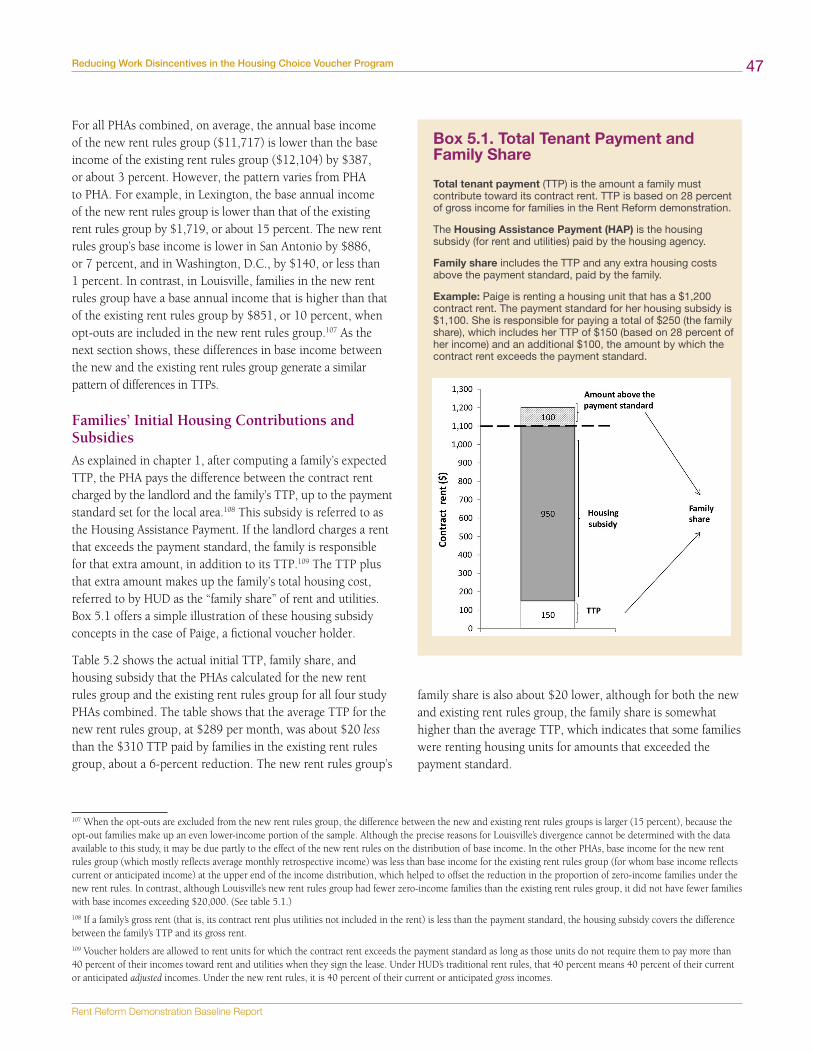
Reducing Work Disincentives in the Housing Choice Voucher Program
Rent Reform Demonstration Baseline Report
47
For all PHAs combined, on average, the annual base income of the new rent rules group ($11,717) is lower than the base income of the existing rent rules group ($12,104) by $387, or about 3 percent. However, the pattern varies from PHA to PHA. For example, in Lexington, the base annual income of the new rent rules group is lower than that of the existing rent rules group by $1,719, or about 15 percent. The new rent rules group’s base income is lower in San Antonio by $886, or 7 percent, and in Washington, D.C., by $140, or less than 1 percent. In contrast, in Louisville, families in the new rent rules group have a base annual income that is higher than that of the existing rent rules group by $851, or 10 percent, when opt-outs are included in the new rent rules group.107 As the next section shows, these differences in base income between the new and the existing rent rules group generate a similar pattern of differences in TTPs.
Families’ Initial Housing Contributions and Subsidies
As explained in chapter 1, after computing a family’s expected TTP, the PHA pays the difference between the contract rent charged by the landlord and the family’s TTP, up to the payment standard set for the local area.108 This subsidy is referred to as the Housing Assistance Payment. If the landlord charges a rent that exceeds the payment standard, the family is responsible for that extra amount, in addition to its TTP.109 The TTP plus that extra amount makes up the family’s total housing cost, referred to by HUD as the “family share” of rent and utilities. Box 5.1 offers a simple illustration of these housing subsidy concepts in the case of Paige, a fictional voucher holder.
Table 5.2 shows the actual initial TTP, family share, and housing subsidy that the PHAs calculated for the new rent rules group and the existing rent rules group for all four study PHAs combined. The table shows that the average TTP for the new rent rules group, at $289 per month, was about $20 less than the $310 TTP paid by families in the existing rent rules group, about a 6-percent reduction. The new rent rules group’s
Box 5.1. Total Tenant Payment and Family Share
Total tenant payment (TTP) is the amount a family must contribute toward its contract rent. TTP is based on 28 percent of gross income for families in the Rent Reform demonstration.
The Housing Assistance Payment (HAP) is the housing subsidy (for rent and utilities) paid by the housing agency.
Family share includes the TTP and any extra housing costs above the payment standard, paid by the family.
Example: Paige is renting a housing unit that has a $1,200 contract rent. The payment standard for her housing subsidy is $1,100. She is responsible for paying a total of $250 (the family share), which includes her TTP of $150 (based on 28 percent of her income) and an additional $100, the amount by which the contract rent exceeds the payment standard.
family share is also about $20 lower, although for both the new and existing rent rules group, the family share is somewhat higher than the average TTP, which indicates that some families were renting housing units for amounts that exceeded the payment standard.
107 When the opt-outs are excluded from the new rent rules group, the difference between the new and existing rent rules groups is larger (15 percent), because the opt-out families make up an even lower-income portion of the sample. Although the precise reasons for Louisville’s divergence cannot be determined with the data available to this study, it may be due partly to the effect of the new rent rules on the distribution of base income. In the other PHAs, base income for the new rent rules group (which mostly reflects average monthly retrospective income) was less than base income for the existing rent rules group (for whom base income reflects current or anticipated income) at the upper end of the income distribution, which helped to offset the reduction in the proportion of zero-income families under the new rent rules. In contrast, although Louisville’s new rent rules group had fewer zero-income families than the existing rent rules group, it did not have fewer families with base incomes exceeding $20,000. (See table 5.1.)108 If a family’s gross rent (that is, its contract rent plus utilities not included in the rent) is less than the payment standard, the housing subsidy covers the difference between the family’s TTP and its gross rent. 109 Voucher holders are allowed to rent units for which the contract rent exceeds the payment standard as long as those units do not require them to pay more than 40 percent of their incomes toward rent and utilities when they sign the lease. Under HUD’s traditional rent rules, that 40 percent means 40 percent of their current or anticipated adjusted incomes. Under the new rent rules, it is 40 percent of their current or anticipated gross incomes.

Reducing Work Disincentives in the Housing Choice Voucher Program
Rent Reform Demonstration Baseline Report
48
Table 5.2. Tenants’ Costs and Housing Subsidies at Initial Study Recertification
Outcome New Rent Rulesa Existing Rent Rulesb Difference
Average total tenant payment (TTP)a ($) 289 310 – 20
TTPa (%)$0 1.9 9.1 – 7.2$1–$50 5.8 11.5 – 5.7$51–$75 9.7 4.1 5.7$76–$100 9.0 3.3 5.7$101–$150 13.4 11.1 2.3$151–$300 25.3 20.9 4.4$301–$700 27.5 29.5 – 2.0$701 or more 7.4 10.5 – 3.1
TTP as a proportion of gross monthly incomeb, c (%)0%–10% 3.5 12.1 – 8.611%–20% 18.9 20.5 – 1.621%–30% 54.2 54.6 – 0.331%–40% 4.7 6.9 – 2.341%–50% 3.5 0.8 2.651% or more 7.5 3.1 4.4Unable to calculate (income = $0) 7.8 2.0 5.8
TTP exceeds 40% of gross monthly incomeb, c (%) 10.9 3.9 7.0
TTP exceeds 50% of gross monthly incomeb, c (%) 7.5 3.1 4.4
Family TTP relative to the local minimum TTPa (%)Paying below the minimum TTP 3.3 24.5 – 21.2Paying the minimum TTP 25.5 6.1 19.4Paying above the minimum TTP 71.2 69.4 1.8
Average family shared ($) 337 358 – 20
Family shared (%)$0 0.5 5.4 – 5.0$1–$50 1.7 8.4 – 6.7$51–$75 9.5 3.9 5.6$76–$100 6.6 3.6 2.9$101–$150 11.7 9.2 2.5$151–$300 26.3 22.2 4.1$301–$700 33.8 33.9 – 0.1$701 or more 10.0 13.4 – 3.4
Family share as a proportion of gross monthly incomeb, c (%)0%–10% 1.7 7.1 – 5.411%–20% 15.1 17.2 – 2.021%–30% 35.8 36.0 – 0.231%–40% 15.6 18.0 – 2.341%–50% 8.3 5.3 3.151% or more 14.2 10.8 3.5Unable to calculate (income = $0) 9.2 5.7 3.4
Family share exceeds 40% of gross monthly incomeb, c (%) 22.6 16.1 6.5
Family share exceeds 50% of gross monthly incomeb, c (%) 14.2 10.8 3.5
Housing subsidye ($) 834 813 21
Sample size (total = 6,208) 3,118 3,090a TTP is the minimum amount a family must contribute toward rent and utilities regardless of the unit selected. Under the new rent rules, TTP is 28 percent of prior year income and under existing rent rules TTP is 30 percent of adjusted income. b For the existing rent rules group, gross income is equal to current/anticipated income. For the new rent rules group, gross income is equal to retrospective income, unless the household is paying a grace-period TTP or has a hardship remedy. In these cases the new rent rules group’s gross income is current/anticipated income. cHouseholdswith$0incomeand$0TTParerepresentedinthe“0%–10%”category.Householdswith$0incomeandTTPsgreaterthan$0areinthe“unabletocalculate”category.HouseholdswithhighproportionsoftheirincomesgoingtowardTTPorfamilysharearemostlyhouseholdswithnear-zeromonthlyincomeswhohave minimum TTP payments. Lexington has a minimum TTP in place for both the existing and new rent rules groups.d Family share is the family’s contribution toward the gross rent. It may be the TTP or higher, depending on the unit selected by the family. e Housing subsidy is the full subsidy amount paid by the housing agency, and includes any utility allowance payments made to the tenant in addition to rent paid to the owner by the housing agency.Notes: Sample sizes for specific outcomes may vary because of missing values. Rounding may cause slight discrepancies in calculating sums and differences. Statisti-cal tests were not performed.Source: MDRC calculations using PHA data
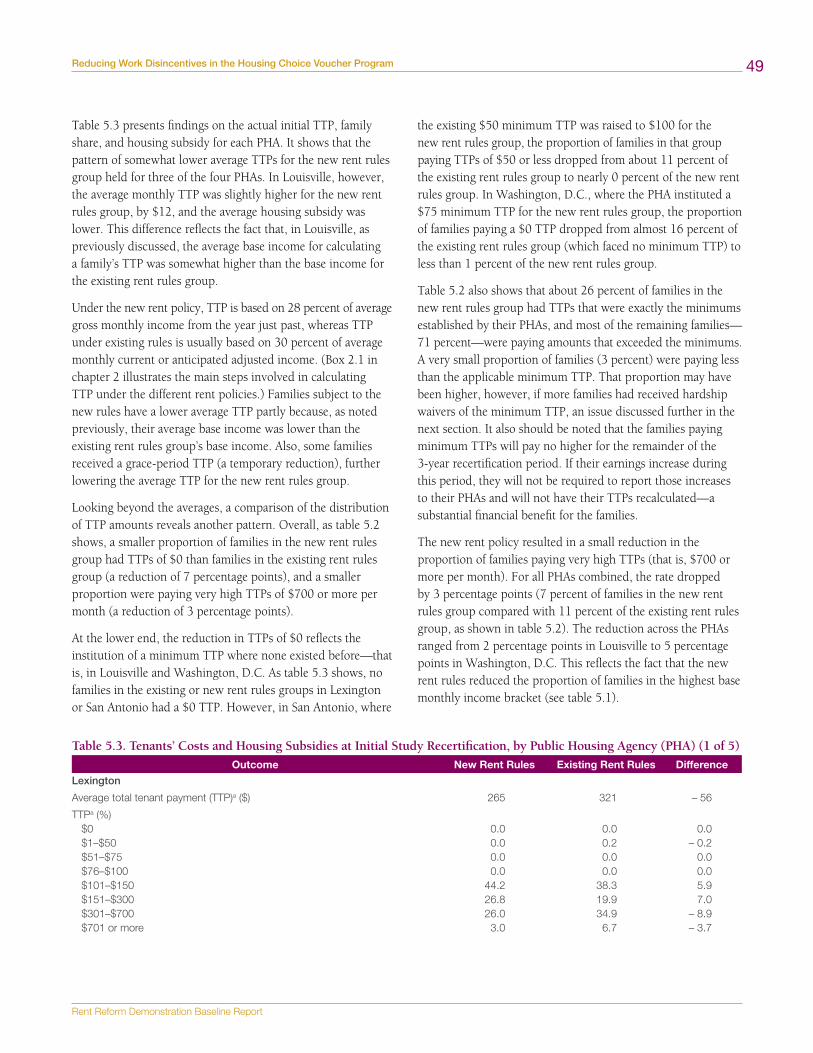
Reducing Work Disincentives in the Housing Choice Voucher Program
Rent Reform Demonstration Baseline Report
49
Table 5.3 presents findings on the actual initial TTP, family share, and housing subsidy for each PHA. It shows that the pattern of somewhat lower average TTPs for the new rent rules group held for three of the four PHAs. In Louisville, however, the average monthly TTP was slightly higher for the new rent rules group, by $12, and the average housing subsidy was lower. This difference reflects the fact that, in Louisville, as previously discussed, the average base income for calculating a family’s TTP was somewhat higher than the base income for the existing rent rules group.
Under the new rent policy, TTP is based on 28 percent of average gross monthly income from the year just past, whereas TTP under existing rules is usually based on 30 percent of average monthly current or anticipated adjusted income. (Box 2.1 in chapter 2 illustrates the main steps involved in calculating TTP under the different rent policies.) Families subject to the new rules have a lower average TTP partly because, as noted previously, their average base income was lower than the existing rent rules group’s base income. Also, some families received a grace-period TTP (a temporary reduction), further lowering the average TTP for the new rent rules group.
Looking beyond the averages, a comparison of the distribution of TTP amounts reveals another pattern. Overall, as table 5.2 shows, a smaller proportion of families in the new rent rules group had TTPs of $0 than families in the existing rent rules group (a reduction of 7 percentage points), and a smaller proportion were paying very high TTPs of $700 or more per month (a reduction of 3 percentage points).
At the lower end, the reduction in TTPs of $0 reflects the institution of a minimum TTP where none existed before—that is, in Louisville and Washington, D.C. As table 5.3 shows, no families in the existing or new rent rules groups in Lexington or San Antonio had a $0 TTP. However, in San Antonio, where
the existing $50 minimum TTP was raised to $100 for the new rent rules group, the proportion of families in that group paying TTPs of $50 or less dropped from about 11 percent of the existing rent rules group to nearly 0 percent of the new rent rules group. In Washington, D.C., where the PHA instituted a $75 minimum TTP for the new rent rules group, the proportion of families paying a $0 TTP dropped from almost 16 percent of the existing rent rules group (which faced no minimum TTP) to less than 1 percent of the new rent rules group.
Table 5.2 also shows that about 26 percent of families in the new rent rules group had TTPs that were exactly the minimums established by their PHAs, and most of the remaining families— 71 percent—were paying amounts that exceeded the minimums. A very small proportion of families (3 percent) were paying less than the applicable minimum TTP. That proportion may have been higher, however, if more families had received hardship waivers of the minimum TTP, an issue discussed further in the next section. It also should be noted that the families paying minimum TTPs will pay no higher for the remainder of the 3-year recertification period. If their earnings increase during this period, they will not be required to report those increases to their PHAs and will not have their TTPs recalculated—a substantial financial benefit for the families.
The new rent policy resulted in a small reduction in the proportion of families paying very high TTPs (that is, $700 or more per month). For all PHAs combined, the rate dropped by 3 percentage points (7 percent of families in the new rent rules group compared with 11 percent of the existing rent rules group, as shown in table 5.2). The reduction across the PHAs ranged from 2 percentage points in Louisville to 5 percentage points in Washington, D.C. This reflects the fact that the new rent rules reduced the proportion of families in the highest base monthly income bracket (see table 5.1).
Table 5.3. Tenants’ Costs and Housing Subsidies at Initial Study Recertification, by Public Housing Agency (PHA) (1 of 5)
Outcome New Rent Rules Existing Rent Rules Difference
Lexington
Average total tenant payment (TTP)a ($) 265 321 – 56
TTPa (%)$0 0.0 0.0 0.0$1–$50 0.0 0.2 – 0.2$51–$75 0.0 0.0 0.0$76–$100 0.0 0.0 0.0$101–$150 44.2 38.3 5.9$151–$300 26.8 19.9 7.0$301–$700 26.0 34.9 – 8.9$701 or more 3.0 6.7 – 3.7

Reducing Work Disincentives in the Housing Choice Voucher Program
Rent Reform Demonstration Baseline Report
50
Table 5.3. Tenants’ Costs and Housing Subsidies at Initial Study Recertification, by Public Housing Agency (PHA) (2 of 5)
Outcome New Rent Rules Existing Rent Rules Difference
TTP as a proportion of gross monthly incomeb, c (%)0%–10% 4.0 3.1 0.911%–20% 23.3 17.2 6.121%–30% 35.3 42.5 – 7.231%–40% 4.0 7.1 – 3.141%–50% 4.7 3.6 1.151% or more 19.2 18.6 0.6Unable to calculate (income = $0) 9.5 7.9 1.6
TTP exceeds 40% of gross monthly incomeb, c (%) 23.9 22.2 1.7
TTP exceeds 50% of gross monthly incomeb, c (%) 19.2 18.6 0.6
Average family shared ($) 315 372 – 57
Family shared (%)$0 0.0 0.0 0.0$1–$50 0.0 0.2 – 0.2$51–$75 0.0 0.0 0.0$76–$100 0.0 0.0 0.0$101–$150 21.1 19.9 1.3$151–$300 37.8 29.9 7.9$301–$700 36.8 39.5 – 2.8$701 or more 4.2 10.5 – 6.2
Family share as a proportion of gross monthly incomeb, c (%)0%–10% 3.6 2.3 1.311%–20% 20.7 15.9 4.821%–30% 20.5 24.7 – 4.231%–40% 15.4 20.7 – 5.341%–50% 6.1 4.2 1.951% or more 24.1 24.3 – 0.2Unable to calculate (income = $0) 9.5 7.9 1.6
Family share exceeds 40% of gross monthly incomeb, c (%) 30.2 28.5 1.8
Family share exceeds 50% of gross monthly incomeb, c (%) 24.1 24.3 – 0.2
Housing subsidye ($) 599 545 55
Sample size (total = 951) 473 478
Louisville (including opt-outs)f
Average TTPa ($) 225 213 12
TTPa (%)$0 6.1 16.1 – 10.0$1–$50 19.9 17.9 2.0$51–$75 5.7 5.5 0.2$76–$100 3.9 2.7 1.2$101–$150 7.1 5.3 1.8$151–$300 27.6 24.5 3.1$301–$700 27.5 23.9 3.6$701 or more 2.2 4.2 – 1.9
TTP as a proportion of gross monthly incomeb, c (%)0%–10% 9.4 22.6 – 13.111%–20% 23.0 20.4 2.621%–30% 52.3 52.6 – 0.331%–40% 3.6 4.4 – 0.841%–50% 1.7 0.0 1.751% or more 3.7 0.0 3.7Unable to calculate (income = $0) 6.3 0.0 6.3
TTP exceeds 40% of gross monthly incomeb, c(%) 5.4 0.0 5.4
TTP exceeds 50% of gross monthly incomeb, c (%) 3.7 0.0 3.7
Average family shared ($) 321 307 14

Reducing Work Disincentives in the Housing Choice Voucher Program
Rent Reform Demonstration Baseline Report
51
Table 5.3. Tenants’ Costs and Housing Subsidies at Initial Study Recertification, by Public Housing Agency (PHA) (3 of 5)
Outcome New Rent Rules Existing Rent Rules Difference
Family shared (%)$0 1.0 3.5 – 2.5$1–$50 5.8 10.5 – 4.7$51–$75 6.1 5.3 0.8$76–$100 5.5 5.4 0.1$101–$150 9.9 9.3 0.6$151–$300 26.0 23.7 2.3$301–$700 38.4 33.8 4.6$701 or more 7.3 8.6 – 1.3
Family share as a proportion of gross monthly incomeb, c (%)0%–10% 3.3 5.8 – 2.611%–20% 14.4 11.9 2.421%–30% 19.4 19.8 – 0.431%–40% 22.0 20.9 1.141%–50% 11.8 10.6 1.251% or more 18.2 18.3 – 0.1Unable to calculate (income = $0) 11.0 12.6 – 1.7
Family share exceeds 40% of gross monthly incomeb, c (%) 30.0 28.9 1.1
Family share exceeds 50% of gross monthly incomeb, c (%) 18.2 18.3 – 0.1
Housing subsidye ($) 678 688 – 10
Sample size (total = 1,729) 891 838
Louisville (excluding opt-outs)f, g
Average TTPa ($) 243 213 30
TTPa (%)$0 1.3 16.1 – 14.8$1–$50 19.8 17.9 1.9$51–$75 5.6 5.5 0.1$76–$100 4.0 2.7 1.3$101–$150 7.5 5.3 2.2$151–$300 28.8 24.5 4.4$301–$700 30.8 23.9 7.0$701 or more 2.2 4.2 – 2.0
TTP as a proportion of gross monthly incomeb, c (%)0%–10% 4.3 22.6 – 18.211%–20% 25.1 20.4 4.721%–30% 52.9 52.6 0.331%–40% 2.7 4.4 – 1.741%–50% 2.2 0.0 2.251% or more 4.7 0.0 4.7Unable to calculate (income = $0) 8.0 0.0 8.0
TTP exceeds 40% of gross monthly incomeb, c (%) 6.9 0.0 6.9
TTP exceeds 50% of gross monthly incomeb, c (%) 4.7 0.0 4.7
Average family shared ($) 334 307 27
Family shared (%)$0 0.4 3.5 – 3.0$1–$50 4.7 10.5 – 5.8$51–$75 5.5 5.3 0.2$76–$100 5.5 5.4 0.1$101–$150 9.6 9.3 0.3$151–$300 25.8 23.7 2.1$301–$700 40.5 33.8 6.7$701 or more 8.0 8.6 – 0.6

Reducing Work Disincentives in the Housing Choice Voucher Program
Rent Reform Demonstration Baseline Report
52
Table 5.3. Tenants’ Costs and Housing Subsidies at Initial Study Recertification, by Public Housing Agency (PHA) (4 of 5)
Outcome New Rent Rules Existing Rent Rules Difference
Family share as a proportion of gross monthly incomeb, c (%)0%–10% 2.9 5.8 – 3.011%–20% 16.8 11.9 4.921%–30% 20.8 19.8 1.031%–40% 23.0 20.9 2.141%–50% 12.2 10.6 1.651% or more 15.6 18.3 – 2.6Unable to calculate (income = $0) 8.8 12.6 – 3.9
Family share exceeds 40% of gross monthly incomeb, c (%) 27.8 28.9 – 1.0
Family share exceeds 50% of gross monthly incomeb, c (%) 15.6 18.3 – 2.6
Housing subsidye ($) 671 688 – 18
Sample size (total = 1,535) 697 838
San Antonio
Average TTPa ($) 279 311 – 32
TTPa (%)$0 0.0 0.0 0.0$1–$50 0.2 10.5 – 10.2$51–$75 0.0 6.2 – 6.2$76–$100 23.0 5.3 17.7$101–$150 10.7 8.6 2.1$151–$300 30.9 25.4 5.5$301–$700 31.2 37.2 – 6.0$701 or more 4.0 6.8 – 2.8
TTP as a proportion of gross monthly incomeb, c (%)0%–10% 0.0 0.9 – 0.911%–20% 20.0 24.0 – 4.021%–30% 60.2 64.8 – 4.631%–40% 7.2 6.8 0.441%–50% 3.6 1.0 2.651% or more 7.2 0.7 6.5Unable to calculate (income = $0) 1.8 1.7 0.0
TTP exceeds 40% of gross monthly incomeb, c (%) 10.9 1.7 9.1
TTP exceeds 50% of gross monthly incomeb, c (%) 7.2 0.7 6.5
Average family shared ($) 321 357 – 36
Family shared (%)$0 0.0 0.0 0.0$1–$50 0.1 6.6 – 6.5$51–$75 0.0 5.8 – 5.8$76–$100 12.5 4.0 8.5$101–$150 14.3 8.1 6.2$151–$300 29.9 25.2 4.7$301–$700 36.5 39.9 – 3.4$701 or more 6.7 10.5 – 3.8
Family share as a proportion of gross monthly incomeb, c (%)0%–10% 0.0 0.5 – 0.511%–20% 16.8 21.2 – 4.421%–30% 37.7 41.9 – 4.331%–40% 20.7 22.2 – 1.641%–50% 9.9 6.0 3.951% or more 13.2 6.4 6.8Unable to calculate (income = $0) 1.8 1.7 0.0
Family share exceeds 40% of gross monthly incomeb, c (%) 23.1 12.4 10.7
Family share exceeds 50% of gross monthly incomeb, c (%) 13.2 6.4 6.8
Housing subsidye ($) 665 622 43
Sample size (total = 1,720) 857 863

Reducing Work Disincentives in the Housing Choice Voucher Program
Rent Reform Demonstration Baseline Report
53
Table 5.3. Tenants’ Costs and Housing Subsidies at Initial Study Recertification, by Public Housing Agency (PHA) (5 of 5)
Outcome New Rent Rules Existing Rent Rules Difference
Washington, D.C.
Average TTPa ($) 376 392 – 15
TTPa (%)$0 0.6 16.1 – 15.5$1–$50 0.0 12.4 – 12.4$51–$75 28.2 2.9 25.3$76–$100 5.5 3.7 1.8$101–$150 6.0 4.5 1.5$151–$300 16.9 14.0 2.9$301–$700 24.6 24.6 0.0$701 or more 18.2 21.9 – 3.7
TTP as a proportion of gross monthly incomeb, c (%)0%–10% 0.7 17.8 – 17.111%–20% 11.4 18.9 – 7.521%–30% 60.4 53.0 7.431%–40% 3.6 9.2 – 5.741%–50% 4.5 0.0 4.551% or more 5.2 0.1 5.1Unable to calculate (income = $0) 14.3 1.0 13.3
TTP exceeds 40% of gross monthly incomeb, c (%) 9.7 0.1 9.6
TTP exceeds 50% of gross monthly incomeb, c (%) 5.2 0.1 5.1
Average family shared ($) 382 398 – 16
Family shared (%)$0 0.6 15.3 – 14.7$1–$50 0.0 12.6 – 12.6$51–$75 27.1 2.9 24.2$76–$100 5.4 3.5 1.8$101–$150 6.0 4.3 1.7$151–$300 17.0 13.8 3.2$301–$700 25.1 25.2 – 0.2$701 or more 18.9 22.3 – 3.4
Family share as a proportion of gross monthly incomeb, c (%)0%–10% 0.7 17.0 – 16.311%–20% 11.4 18.8 – 7.421%–30% 58.4 51.3 7.231%–40% 4.6 9.8 – 5.241%–50% 4.6 0.2 4.451% or more 6.1 1.0 5.1Unable to calculate (income = $0) 14.3 2.0 12.3
Family share exceeds 40% of gross monthly incomeb, c (%) 10.7 1.2 9.5
Family share exceeds 50% of gross monthly incomeb, c (%) 6.1 1.0 5.1
Housing subsidye ($) 1,275 1,249 26
Sample size (total = 1,808) 897 911a TTP is the minimum amount a family must contribute toward rent and utilities regardless of the unit selected. Under the new rent rules, TTP is 28 percent of prior-year income and under existing rent rules TTP is 30 percent of adjusted current/anticipated income. b For the existing rent rules group, gross income is equal to current/anticipated income. For the new rent rules group, gross income is equal to retrospective income, unless the household is paying a grace-period TTP or has a hardship remedy. In these cases, the new rent rules group’s gross income is current/anticipated income.cHouseholdswith$0incomeand$0TTParerepresentedinthe“0%–10%”category.Householdswith$0incomeandTTPsgreaterthan$0areinthe“unabletocalculate”category.HouseholdswithhighproportionsoftheirincomesgoingtowardTTPorfamilysharearemostlyhouseholdswithnear-zeromonthlyincomeswhohave minimum TTP payments. Lexington has a minimum TTP in place for both the existing and new rent rules groups.d Family share is the family’s contribution toward the gross rent. It may be the TTP or higher, depending on the unit selected by the family. e Housing subsidy is the full subsidy amount paid by the housing agency, including any utility allowance payments made to the tenant in addition to rent paid to the owner by the housing agency.f Louisville households who opted out (212) are families who were randomly assigned to the new rent rules group and remained in that group but chose to have their rent calculated according to the existing rent rules. g Louisville families who opted out of the new rent policy are excluded from the results for the new rent rules group in this panel.Notes: Sample sizes for specific outcomes may vary because of missing values. Rounding may cause slight discrepancies in calculating sums and differences. Statisti-cal tests were not performed.Source: MDRC calculations using PHA data

Reducing Work Disincentives in the Housing Choice Voucher Program
Rent Reform Demonstration Baseline Report
54
With the samples of all four PHAs combined, 77 percent of the families in the new rent rules group paid a TTP equal to or less than 30 percent of gross income (see table 5.2).110 Moreover, about 11 percent of families were paying TTPs that exceeded 40 percent of their incomes, and 8 percent were paying TTPs that exceeded 50 percent of their incomes. In the existing rent rules group, 4 percent of families paid TTPs exceeding 40 percent of their incomes, due largely to existing minimum TTP policies in Lexington and San Antonio. When considering family share (which includes housing costs above the payment standard), rather than TTP, the percentage of income paid toward rent and utilities is correspondingly higher for both groups. For example, among families in the new rent rules group, 23 percent paid family shares that exceeded 40 percent of their current or anticipated incomes, compared with 16 percent of the existing rent rules group.
The flip side of the lower average TTP for the new rent rules group is a somewhat larger housing subsidy. For the full sample combined (table 5.2), the PHAs paid an initial subsidy of $834 for the new rent rules group, compared with $813 for the existing rent rules group. It should be noted that although PHAs are picking up slightly more of the subsidy in the short run, they are projected to begin recouping some of those extra expenditures in later years—how much PHAs will recoup remains to be seen. The amount will depend on the number of families in the new rent rules group who increase their
earnings over the 3 years before their next triennial recertifi-cations. TTPs recalculated in year 4 will be higher if they are based on family incomes that are higher, on average, than those incomes were at the start of the new rent policy, and housing subsidies PHAs provide will consequently be lower.
Initial Experiences Implementing the Rent Safeguards
Grace-Period TTP
Some families may find that their retrospective gross incomes are substantially higher than their current or anticipated gross incomes at the time of their initial recertifications. The new rent policy includes a number of safeguards and hardship remedies (detailed in chapter 2 and summarized in box 5.2 and appendix E) to help protect such families from excessive rent burdens. The grace-period provision is one such safeguard. If, at the initial income recertification interview, a family’s current or anticipated gross income is more than 10 percent lower than its retrospective income, the family automatically qualifies for (and receives) a 6-month grace-period TTP, based on 28 percent of its current or anticipated gross income. The family would need to pay the minimum TTP if that grace-period TTP calculation is less than the minimum TTP threshold set by its housing authority. Only available at the beginning of the 3-year
Box 5.2. Safeguards Built Into the New Rent Policy Safeguard Can be used at... Household is eligible if… Modifiedtotaltenantpayment(TTP)willbe…
Grace-period TTP
...triennial certification. ...current or anticipated monthly income is more than 10 percent less than retrospective monthly income.
...based on the current or anticipated monthly income. The modified TTP lasts for 6 months and then automatically switches back to being based on retrospective income.
Interim recerti-fication
...voucher holder’s request, up to once per year.
...the household’s retrospective income at the time of the interim recertification is more than 10 percent below its previously established income.
...set at 28 percent of income based on the most recent 12 months.
Hardship remedies
...triennial certification or later during the 3-year period.
...TTP is more than 40 percent of current or anticipated monthly income or
the household is at risk of eviction.
...based on an additional interim recertification beyond the normal one-per-year option, or
set at the minimum TTP for up to 180 days (can be renewed), or
set at 28 percent of a family’s current gross income (which may be less than the minimum TTP, except in Lexington) for up to 180 days (can be renewed), or
supplementedwitha“transfervoucher”tohelpafamily move to a more affordable unit.
110 For the existing rent rules group, gross income is equal to current or anticipated income. For the new rent rules group, gross income is equal to retrospective income, unless the family is paying a grace-period TTP or has a hardship remedy. In the latter two cases, the new rent rules group’s gross income is current or antici-pated income.
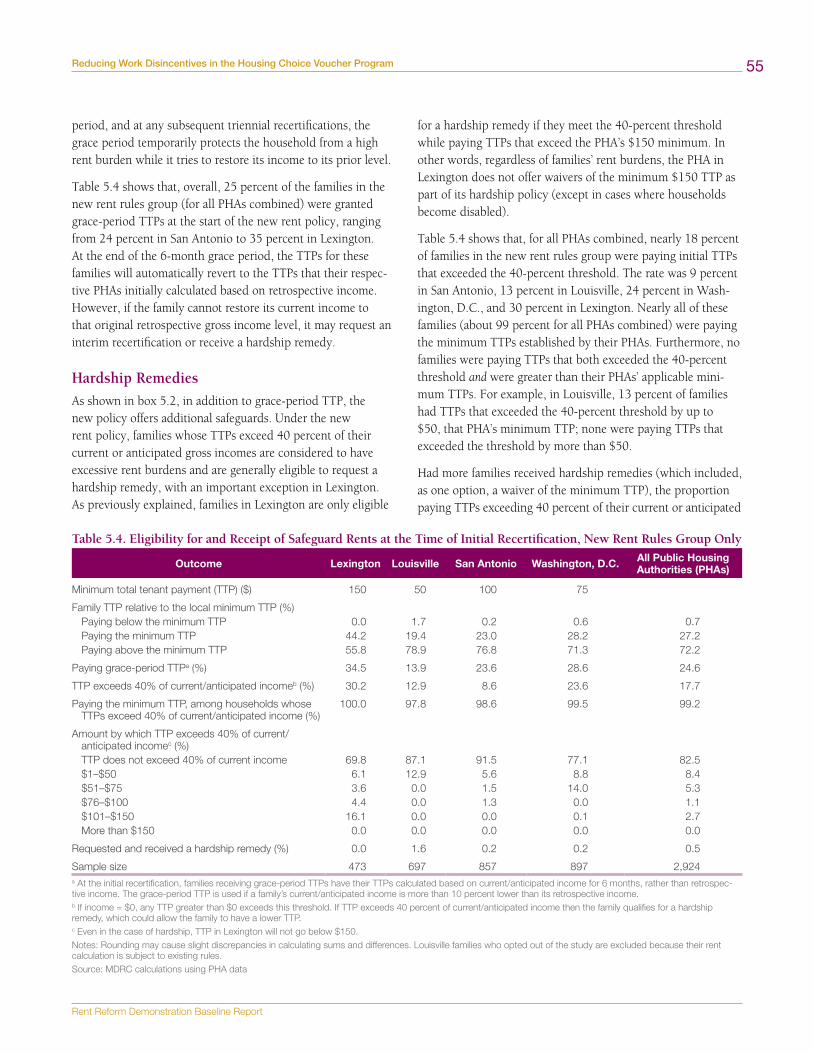
Reducing Work Disincentives in the Housing Choice Voucher Program
Rent Reform Demonstration Baseline Report
55
period, and at any subsequent triennial recertifications, the grace period temporarily protects the household from a high rent burden while it tries to restore its income to its prior level.
Table 5.4 shows that, overall, 25 percent of the families in the new rent rules group (for all PHAs combined) were granted grace-period TTPs at the start of the new rent policy, ranging from 24 percent in San Antonio to 35 percent in Lexington. At the end of the 6-month grace period, the TTPs for these families will automatically revert to the TTPs that their respec-tive PHAs initially calculated based on retrospective income. However, if the family cannot restore its current income to that original retrospective gross income level, it may request an interim recertification or receive a hardship remedy.
for a hardship remedy if they meet the 40-percent threshold while paying TTPs that exceed the PHA’s $150 minimum. In other words, regardless of families’ rent burdens, the PHA in Lexington does not offer waivers of the minimum $150 TTP as part of its hardship policy (except in cases where households become disabled).
Table 5.4 shows that, for all PHAs combined, nearly 18 percent of families in the new rent rules group were paying initial TTPs that exceeded the 40-percent threshold. The rate was 9 percent in San Antonio, 13 percent in Louisville, 24 percent in Wash-ington, D.C., and 30 percent in Lexington. Nearly all of these families (about 99 percent for all PHAs combined) were paying the minimum TTPs established by their PHAs. Furthermore, no families were paying TTPs that both exceeded the 40-percent threshold and were greater than their PHAs’ applicable mini-mum TTPs. For example, in Louisville, 13 percent of families had TTPs that exceeded the 40-percent threshold by up to $50, that PHA’s minimum TTP; none were paying TTPs that exceeded the threshold by more than $50.
Had more families received hardship remedies (which included, as one option, a waiver of the minimum TTP), the proportion paying TTPs exceeding 40 percent of their current or anticipated
Table 5.4. Eligibility for and Receipt of Safeguard Rents at the Time of Initial Recertification, New Rent Rules Group Only
Hardship Remedies
As shown in box 5.2, in addition to grace-period TTP, the new policy offers additional safeguards. Under the new rent policy, families whose TTPs exceed 40 percent of their current or anticipated gross incomes are considered to have excessive rent burdens and are generally eligible to request a hardship remedy, with an important exception in Lexington. As previously explained, families in Lexington are only eligible
Outcome Lexington Louisville San Antonio Washington, D.C. All Public Housing Authorities (PHAs)
Minimum total tenant payment (TTP) ($) 150 50 100 75
Family TTP relative to the local minimum TTP (%)Paying below the minimum TTP 0.0 1.7 0.2 0.6 0.7Paying the minimum TTP 44.2 19.4 23.0 28.2 27.2Paying above the minimum TTP 55.8 78.9 76.8 71.3 72.2
Paying grace-period TTPa (%) 34.5 13.9 23.6 28.6 24.6
TTP exceeds 40% of current/anticipated incomeb (%) 30.2 12.9 8.6 23.6 17.7
Paying the minimum TTP, among households whose TTPs exceed 40% of current/anticipated income (%)
100.0 97.8 98.6 99.5 99.2
Amount by which TTP exceeds 40% of current/anticipated incomec (%)TTP does not exceed 40% of current income 69.8 87.1 91.5 77.1 82.5$1–$50 6.1 12.9 5.6 8.8 8.4$51–$75 3.6 0.0 1.5 14.0 5.3$76–$100 4.4 0.0 1.3 0.0 1.1$101–$150 16.1 0.0 0.0 0.1 2.7More than $150 0.0 0.0 0.0 0.0 0.0
Requested and received a hardship remedy (%) 0.0 1.6 0.2 0.2 0.5
Sample size 473 697 857 897 2,924a At the initial recertification, families receiving grace-period TTPs have their TTPs calculated based on current/anticipated income for 6 months, rather than retrospec-tive income. The grace-period TTP is used if a family’s current/anticipated income is more than 10 percent lower than its retrospective income. b If income = $0, any TTP greater than $0 exceeds this threshold. If TTP exceeds 40 percent of current/anticipated income then the family qualifies for a hardship remedy, which could allow the family to have a lower TTP. c Even in the case of hardship, TTP in Lexington will not go below $150.Notes: Rounding may cause slight discrepancies in calculating sums and differences. Louisville families who opted out of the study are excluded because their rent calculation is subject to existing rules.Source: MDRC calculations using PHA data

Reducing Work Disincentives in the Housing Choice Voucher Program
Rent Reform Demonstration Baseline Report
56
gross incomes would have been lower (except in Lexington, where the minimum TTP could not be waived, except in cases of disability). It is not yet clear why PHAs and families did not use hardship remedies more often. Early observations of PHA practices and a preliminary review of PHA data, however, revealed that the PHAs initially took a fairly reactive approach in implementing the new rent policy’s hardship provision.
The PHAs’ software systems were programmed to identify families whose TTPs exceeded 40 percent of their current or anticipated incomes and provide a warning for staff members. Unlike the grace-period TTP, however, which was automatically granted, a family had to initiate a special hardship request and complete the necessary form to be considered for a hardship remedy. For the most part, final rent calculations were not completed in the presence of the families, so housing staff members did not necessarily have the opportunity to explain to families in person that they might be eligible for a hardship remedy. As a result, the agencies mostly relied on families to initiate a hardship request and usually did not inform specific households that they might qualify. For example, when informing families by mail of their new TTPs, they did not point out to those families whose TTPs exceeded 40 percent of their current or anticipated incomes that they might qualify for a hardship remedy. It is unclear why families that qualified for a hardship remedy did not request one; they may not have realized that they qualified or they may have chosen not to apply to avoid further interactions with the PHA.
When initial findings began to emerge on the number of families affected, the PHAs discussed this problem with HUD and the study team; they agreed to send letters to all families in the new rent rules group, reminding them that if they were ex-periencing difficulty meeting their rent obligations, they might qualify for hardship remedies or for interim recertifications to reduce their TTPs, and that they should make contact with the housing authority to find out. In addition, the agencies mailed a special notice to those families known to have initial TTPs that might qualify them for a hardship remedy, encouraging them to make contact with the PHA to see whether they did in fact qualify. (See appendix F for a sample version of this letter.) Of course, it is possible that not all families who qualify for a hardship remedy will want to apply for one, because doing so may require them to interact with the PHA more than they
might like. Future reports will examine whether the more active approach recently taken by PHAs increased the use of hardship remedies.
An analysis (not shown in this report) of baseline survey data for families in the new rent rules group, just before those rules took effect for them, found that those whose initial TTPs were set at the minimum level for their PHA were very similar to those paying more than the minimum TTP, in terms of the head of household’s background characteristics and the family’s material hardships. For example, their household heads were not less educated or more likely to have health problems that limited work, and their families were not more likely to have difficulty buying food or paying their rent or utilities. However, they were considerably less likely to be employed, and their families were more likely to be receiving Supplemental Nutrition Assistance Program benefits.
Similarly, an analysis of PHA data on families’ income sources at the time of recertification shows that families deemed to be potentially eligible for a hardship remedy under the new rent policy were less likely to be working. Specifically, only 20 percent of families (in all PHAs combined) who were paying TTPs exceeding 40 percent of gross income (the hardship standard) had any wage income. In contrast, more than 44 percent of families whose TTPs did not exceed that 40-percent threshold had at least some wage income.
Subgroup Variations Economic theory and evidence from other relevant studies of financial incentives that reward work among low-income populations, including voucher recipients, suggest that different types of families may respond to changes to the rent structure in different ways.111 Tenants who differ in terms of their human capital (for example, education and skill levels) and the wages they could command in their local labor markets, who face different costs associated with working (such as childcare), and who differ in terms of other personal and situational barriers to employment may, for those reasons, vary in their ability to take advantage of the lower implicit marginal tax on earnings offered by the new rent rules. For example, tenants who are not employed at the time of their initial recertifications may respond differently than tenants who are already working
111 The Work Rewards evaluation found that offering voucher holders participating in New York City’s Family Self-Sufficiency program financial incentives for sus-tained full-time work produced substantial positive effects on employment and earnings for tenants who were not already working when they entered the study, but had no effects on participants who were already employed (Nuñez, Verma, and Yang, 2015). Michalopoulos (2005) summarizes the longer-term results of four welfare reform experiments testing financial work incentives, and reports that, in general, the programs’ effects on employment and earnings were larger and more persistent for long-term welfare recipients with limited education and work experience. See also Hendra et al. (2011) for findings showing different effects on the target group of a services-plus-incentives workforce program for welfare recipients in the United Kingdom and Riccio and Miller (2016) for subgroup effects of a comprehensive conditional cash transfer program for low-income families in New York City.

Reducing Work Disincentives in the Housing Choice Voucher Program
Rent Reform Demonstration Baseline Report
57
full time, because it is often easier for individuals to increase their hours in work than for it is for those already working to advance to higher-wage jobs. Tenants with young children may have a more difficult time working than those without young children because of the childcare costs they may face.
The level of rent burden on families that the new rent policy imposes may also vary across different types of families. For example, it may increase the rent burden experienced by families in more precarious financial circumstances than that experienced by other families. The evaluation therefore aims to track how the new rent rules affect the TTPs that families in different circumstances are expected to pay.
Table 5.5 shows the initial TTPs for families who did and did not have income from earnings at the time of random assign-ment, and who did and did not have children younger than 5 at that time (families who did may be considered a more vulnerable group).112 Future reports will determine whether the new rent policy affects employment and other outcomes that vary among these and other subgroups, but the current analysis shows how the new policy affects these particular subgroups’ TTPs.
Overall, 58 percent of the families in the new rent rules group had no earned income at the time of random assignment, and about 34 percent were caring for one young child or more.113 (The corresponding proportions in the existing rent rules
group were roughly similar.) The top panel of table 5.5 shows that, for all PHAs combined, the new rent policy resulted in somewhat lower initial TTPs for all subgroups than existing rent rules. In other words, whether or not a family had earned income, and whether or not it was caring for a young child, it paid a somewhat lower TTP than it would have paid under existing rent rules. The reduction was somewhat greater among families in the new rent rules group who had some earned income, for whom the average TTP was lower by $35, or almost 8 percent, than the $458 paid by similar families in the existing rent rules group. Families in the new rent rules group with no earned income had an average TTP that was $6, or 3 percent, lower than the $198 paid by their counterparts in the existing rent rules group. The new rent policy also resulted in a lower average TTP both for families with young children and for those without young children.
Generally speaking, a similar pattern is evident at all PHAs except Louisville. At that PHA, families in the new rent rules group with no earned income had a somewhat higher initial average TTP under the new rent policy than under existing rent rules, as did families who were not caring for small children. This pattern is consistent with the overall pattern in Louisville, where the average annual base income and average monthly TTP for the full sample were higher for the new rent rules group than the existing rent rules group.
Table 5.5. Total Tenant Payment (TTP) at Initial Study Recertification, by Public Housing Agency (PHA) and Subgroup (1 of 2)
Outcome and Subgroup New Rent Rules Existing Rent Rules Difference
All PHAsAverage TTP ($)
Household has some earned incomeNo 192 198 – 6Yes 422 458 – 35
Household includes young childrenYes 262 290 – 28No 299 317 – 18
LexingtonAverage TTP ($)
Household has some earned incomeNo 201 240 – 40Yes 348 407 – 60
Household includes young childrenYes 246 288 – 42No 273 333 – 60
112 These groups are defined based on data in the files used to conduct random assignment. Some of these characteristics (income, for example) could have changed between random assignment and the initial recertification meeting. 113 These findings are based on sample sizes presented in table 5.6.

Reducing Work Disincentives in the Housing Choice Voucher Program
Rent Reform Demonstration Baseline Report
58
Table 5.5. Total Tenant Payment (TTP) at Initial Study Recertification, by Public Housing Agency (PHA) and Subgroup (2 of 2)
Outcome and Subgroup New Rent Rules Existing Rent Rules Difference
Louisville (including opt-outs)a
Average TTP ($)Household has some earned income
No 156 129 27Yes 331 348 – 16
Household includes young childrenYes 215 222 – 7No 229 210 19
Louisville (excluding opt-outs)a
Average TTP ($)Household has some earned income
No 169 129 39Yes 343 348 – 5
Household includes young childrenYes 227 222 5No 249 210 39
San AntonioAverage TTP ($)
Household has some earned incomeNo 223 252 – 30Yes 344 377 – 33
Household includes young childrenYes 236 268 – 31No 298 336 – 38
Washington, D.C.Average TTP ($)
Household has some earned incomeNo 199 201 – 2Yes 643 678 – 34
Household includes young childrenYes 365 396 – 31No 379 390 – 11
a Louisville households who opted out (212) are excluded from the second Louisville panel. These are families who were randomly assigned to the new rent rules group and chose to have their rents calculated according to the existing rent rules. Notes: See Table 5.6 for sample sizes. Sample sizes for specific outcomes may vary because of missing values. Rounding may cause slight discrepancies in calculating sums and differences. No tests of statistical significance have been performed. Household characteristics (earned-income status, child status) are determined at random assignment. Earned income refers to current or anticipated income. Young children refers to those 5 and younger. Source: MDRC calculations using PHA data
Subgroup Variation in the Use of Rent Safeguards
Table 5.6 examines how rent burdens and use of the new rent policy’s safeguards varied among subgroups. It shows, for example, that among families with no earned income from all the PHAs combined, 25 percent had TTPs that exceeded 40 percent of their current or anticipated gross incomes. This figure is substantially higher than the 8-percent rate among families who had some earned income. Families with no earned income were more likely to have excessive rent burdens in large part because they had less income overall and were more likely to be subject to the minimum TTP. Overall,
39 percent of the families with no earnings were paying the minimum TTPs established by their PHAs, and 61 percent were paying TTPs above the minimum. In contrast, among families with some earned income, only 12 percent were paying the minimum TTP, and 87 percent were paying TTPs above the minimum.
Whether a family did or did not have a child under 5 did not matter as much. For example, among families with young children, 16 percent were paying TTPs that exceeded 40 percent of their current or anticipated gross incomes, compared with 18 percent of families without young children.

Reducing Work Disincentives in the Housing Choice Voucher Program
Rent Reform Demonstration Baseline Report
59
Table 5.6. Eligibility for and Receipt of Safeguard Rents at the Time of Initial Recertification, by Subgroup and Public Housing Administration (PHA), New Rent Rules Group Only (1 of 2)
Outcome Lexington Louisville San Antonio Washington, D.C. All PHAs
No earned incomeFamily total tenant payment (TTP) relative to the local minimum TTP (%)
Paying above the minimum TTP 37.2 70.4 71.0 56.5 60.7Paying the minimum TTP 62.8 27.6 28.8 42.8 38.5Paying below the minimum TTP 0.0 2.0 0.2 0.7 0.8
Paying grace-period TTPa (%) 41.7 13.8 23.3 29.4 25.9
TTP exceeds 40% of current/anticipated incomeb (%) 45.1 17.8 8.4 35.1 25.2
Paying the minimum TTP, among households whose TTPs exceed 40% of current anticipated income (%)
100.0 97.2 97.4 100.0 99.3
Amount by which TTP exceeds 40% of current/anticipated incomec (%)TTP does not exceed 40% of current income 54.9 82.2 91.6 65.5 75.0$1–$50 7.9 17.8 5.7 13.5 11.5$51–$75 6.0 0.0 1.1 21.0 8.0$76–$100 6.0 0.0 1.5 0.0 1.4$101–$150 25.2 0.0 0.0 0.0 4.1More than $150 0.0 0.0 0.0 0.0 0.0
Requested and received a hardship remedy (%) 0.0 1.8 0.2 0.2 0.5
Sample size 266 399 459 540 1,664
Some earned incomeFamily TTP relative to the local minimum TTP (%)
Paying above the minimum TTP 79.7 90.3 83.4 93.5 87.3Paying the minimum TTP 20.3 8.4 16.3 6.2 12.2Paying below the minimum TTP 0.0 1.3 0.3 0.3 0.5
Paying grace-period TTPa (%) 25.1 14.1 23.9 27.5 22.8
TTP exceeds 40% of current/anticipated incomeb (%) 11.1 6.4 8.8 6.2 7.9
Paying the minimum TTP, among households whose TTPs exceed 40% of current/anticipated income (%)
100.0 100.0 100.0 94.7 98.9
Amount by which TTP exceeds 40% of current/anticipated incomec (%)TTP does not exceed 40% of current income 88.9 93.6 91.4 94.6 92.4$1–$50 3.9 6.4 5.5 1.7 4.4$51–$75 0.5 0.0 2.0 3.4 1.7$76–$100 2.4 0.0 1.0 0.0 0.7$101–$150 4.3 0.0 0.0 0.3 0.8More than $150 0.0 0.0 0.0 0.0 0.0
Requested and received a hardship remedy (%) 0.0 1.3 0.3 0.3 0.5
Sample size 207 298 398 357 1,260
Young children in the householdFamily TTP relative to the local minimum TTP (%)
Paying above the minimum TTP 51.1 77.7 71.4 74.0 69.9Paying the minimum TTP 48.9 22.3 27.8 25.5 29.7Paying below the minimum TTP 0.0 0.0 0.8 0.5 0.4
Paying grace-period TTPa (%) 34.0 14.4 21.4 40.5 26.8
TTP exceeds 40% of current/anticipated incomeb (%) 31.9 13.3 7.9 18.5 16.1
Paying the minimum TTP, among households whose TTPs exceed 40% of current/anticipated income (%)
100.0 96.0 95.2 100.0 98.4
Amount by which TTP exceeds 40% of current/anticipated incomec (%)TTP does not exceed 40% of current income 68.1 86.7 92.1 82.7 84.2$1–$50 7.8 13.3 6.0 15.7 10.5$51–$75 2.8 0.0 1.1 1.5 1.3$76–$100 3.5 0.0 0.8 0.0 0.9$101–$150 17.7 0.0 0.0 0.0 3.2More than $150 0.0 0.0 0.0 0.0 0.0
Requested and received a hardship remedy (%) 0.0 0.0 0.8 0.0 0.3
Sample size 141 188 268 200 797

Reducing Work Disincentives in the Housing Choice Voucher Program
Rent Reform Demonstration Baseline Report
60
Table 5.6. Eligibility for and Receipt of Safeguard Rents at the Time of Initial Recertification, by Subgroup and Public Housing Administration (PHA), New Rent Rules Group Only (2 of 2)
Outcome Lexington Louisville San Antonio Washington, D.C. All PHAs
No young children in the householdFamily TTP relative to the local minimum TTP (%)
Paying above the minimum TTP 57.8 79.4 79.2 70.5 73.0Paying the minimum TTP 42.2 18.3 20.8 29.0 26.2Paying below the minimum TTP 0.0 2.4 0.0 0.6 0.8
Paying grace-period TTPa (%) 34.6 13.8 24.5 25.2 23.8
TTP exceeds 40% of current/anticipated incomeb (%) 29.5 12.8 8.9 25.1 18.3
Paying the minimum TTP, among households whose TTPs exceed 40% of current/anticipated income (%)
100.0 98.5 100.0 99.4 99.5
Amount by which TTP exceeds 40% of current/anticipated incomec (%)TTP does not exceed 40 % of current income 70.5 87.2 91.3 75.5 81.9$1–$50 5.4 12.8 5.5 6.8 7.7$51–$75 3.9 0.0 1.7 17.6 6.8$76–$100 4.8 0.0 1.5 0.0 1.2$101–$150 15.4 0.0 0.0 0.1 2.5More than $150 0.0 0.0 0.0 0.0 0.0
Requested and received a hardship remedy (%) 0.0 2.2 0.0 0.3 0.6
Sample size 332 509 589 697 2,127a At the initial recertification, families receiving grace-period TTPs have their TTPs calculated based on current/anticipated income for 6 months, rather than retrospec-tive income. The grace-period TTP is used if a family’s current/anticipated income is more than 10 percent lower than its retrospective income. b If income = $0, any TTP greater than $0 exceeds this threshold. If TTP exceeds 40 percent of current/anticipated income then the family qualifies for a hardship remedy, which could allow the family to have a lower TTP. c Even in the case of hardship, TTP in Lexington will not go below $150.Notes: Rounding may cause slight discrepancies in calculating sums and differences. Family characteristics (income status, child status) are determined at random assignment. Earned income refers to current or anticipated income. Young children refers to those 5 and younger. Louisville households who opted out (212) are excluded from the table.Source: MDRC calculations using PHA data
ConclusionThis chapter has shown that the four PHAs involved in the Rent Reform Demonstration have fully implemented the new rent policy and are now operating two systems—one for the new rent rules group and one for the existing rent rules group (the evaluation’s control group). They will continue operating these two systems for the duration of the demonstration, and the evaluation will continue to study the PHAs’ experiences in operating the new rent policy as it matures.
The PHAs have completed the initial recertifications of all families in the demonstration, and the effect of the new rent policy on families’ initial TTPs is now clear. As this chapter has shown, the families in the new rent rules group began their next phase of voucher receipt having to contribute somewhat
less toward their rents and utilities than they would have had to contribute under their PHAs’ existing rent rules. Not all families have had to pay less, however. The new rent rules’ minimum TTP policies increased the TTPs of some of the lowest-income families. Moreover, hardship policies intended to protect those families from excessive rent burdens have been underused, prompting the PHAs to undertake new outreach efforts.
Families in the new rent rules group will not report to the PHA any earnings increases they achieve in the subsequent 3 years. Although those families able to increase their wage incomes will benefit financially as a result, the PHAs will also be paying more in subsidies for those families than they would otherwise. Whether the PHAs are able to recoup those extra expenditures in the longer term remains to be seen.

Reducing Work Disincentives in the Housing Choice Voucher Program
Rent Reform Demonstration Baseline Report
61
Chapter 6. Looking Ahead
The Rent Reform Demonstration has passed an important mile-stone, as each of the four participating public housing agencies (PHAs) has fully launched the demonstration. Each agency’s software system was modified so that total tenant payments (TTPs) and housing subsidies could be calculated under the new rules; agency staff members were trained in the new rules and procedures; and staff completed recertifications for the entire new rent rules group while continuing to administer the existing rent policy for the existing rent rules group. TTPs and subsidies under the new rent policy were in effect for all families by March 2016.
It is too soon to draw conclusions about the extent to which the new rent policy is achieving its important objectives of reducing administrative burdens and costs for public PHAs, in-creasing earned income among families, and reducing families’ reliance on housing subsidies and other government assistance. The evaluation will address those questions in forthcoming reports that are expected to be released in 2018 and 2019.
The findings in this report on the initial TTP calculations show that, on average, families in the new rent rules group have experienced an immediate benefit; the average TTP for that group is about 8 percent lower than it would have been for them under existing rules. Of course, this lower amount also means that the PHAs are paying more in subsidies than they would have for the same families under the existing rules. (As discussed in chapter 5, for all PHAs combined, the monthly housing subsidy for the first recertification after study enroll-ment was $817 for the new rent rules group compared with $790 for the existing rent rules group.) Because TTPs will be reassessed every 3 years under the new rent rules, families in the new rent rules group who increase their earnings will pay less toward their rent and utilities than they would pay during that time under the existing rent rules. It remains to be seen, however, whether they recognize this incentive to work and change their labor-market behavior in response.
Not all families are benefiting equally from the new rent rules so far. Compared with the existing rules, the new rent policy has reduced the proportion of families paying high TTPs (that is, more than $700 per month). At the same time, because each family must pay at least a minimum TTP under the new policy, many families who otherwise would have had $0 or very low TTPs are now paying more. Some of those families were eligible for TTP reductions through the new policy’s hardship
provision, but, for reasons that are uncertain, had not requested those reductions during the early stages of the new policy’s implementation. In an effort to ensure that lack of awareness was not the cause, all of the PHAs began to make extra efforts to contact families potentially eligible for hardship remedies, to remind them of the program’s safeguards and invite them to make contact with the agency. Future reports will estimate how many of those families later had their TTPs reduced.
In general, how well the new rent policy succeeds in promoting work and in protecting families from excessive rent payments will partly depend on how well families understand the new rules. For that reason, the PHAs have begun to send additional mailings to communicate to families both the incentives the new policy offers them to keep increasing their earned incomes and the safeguards it has against excessive rent burdens if their incomes fall. It will be important for the agencies to continue communicating the advantages and protections of the new policy throughout the demonstration.
This report has also described several important ways that the new rent policy should make it simpler for PHAs to compute TTPs. For example, PHAs no longer need to handle deductions or asset income in most cases, and the utilities policy is simpler. On the other hand, it could turn out to be onerous for PHAs to use retrospective income for their calculations, because they will have to verify each family’s monthly income over the course of 12 months. Of course, the amount of work involved depends heavily on how many families have incomes that are volatile, not fully captured by the Enterprise Income Verification system, and difficult to verify. (A similar challenge may arise with traditional rent rules, because income volatility can make anticipated income hard to estimate.) Under the new rent policy, PHAs could have additional administrative burdens, should many families make use of the new policy’s interim TTP adjust-ments and hardship remedies—or their overall administrative burdens may be reduced if the new policy reduces their overall volume of interim recertifications and staff-family encounters.
Future reports will explore how the agencies implement the new policy as it matures and how families respond to it, through a series of indepth interviews conducted in each city. The reports will also chart trends in TTP amounts for both the new and existing rent rules groups and the frequency with which TTPs are readjusted.

Reducing Work Disincentives in the Housing Choice Voucher Program
Rent Reform Demonstration Baseline Report
62
A report on the new rent rules’ early effects on families’ out comes (using other administrative databases) and on PHAs’ operating costs and Housing Assistance Payments is scheduled to be complete in 2018. A subsequent report in 2019 will examine
those effects over a longer time, a period of about 1 year after the next triennial recertification, including for the families who enrolled in the study early on.
Reducing Work Disincentives in the Housing Choice Voucher Program
Rent Reform Demonstration Baseline Report
63
Appendix A. The Housing Agency Selection Process
The process of recruiting public housing agencies (PHAs) for the demonstration began with joint efforts by the U.S. Department of Housing and Urban Development (HUD) and the study team to introduce the study through informational meetings and conference calls with Moving to Work agencies that had been identified as candidates for the project. These meetings included special informational sessions at conferences sponsored in 2013 by the Public Housing Directors Associa-tion and the Council of Large Public Housing Authorities.
Criteria for Housing Agency SelectionThe study team’s original proposal set out a number of guide lines for assembling a group of PHAs to participate in the study. These guidelines gave higher priority to Moving to Work agen-cies that had larger voucher programs and thus larger samples for a randomized trial, and those that had not progressed too far in implementing alternative rent policies of their own. Such agencies would be able to provide a control group that would represent the traditional national 30-percent-of-income rent policy. In addition, the study team and HUD sought agencies that together would reflect important dimensions of the diversity of voucher holders and local conditions found among PHAs across the country. It was important to reflect this diversity because one goal in evaluating the alternative rent policy is to determine whether it can be effective for different types of tenants and in different contexts. The study team and HUD therefore sought to recruit a pool of PHAs with diverse local housing markets, labor markets, tenant racial and ethnic profiles, and other local or household characteristics that could present different kinds of challenges in finding work. It was also critical that a PHA be willing to comply with random assignment and the other research demands of a rigorous demonstration, and to sustain both the alternative rent policy and its existing rent policy through the end of the demonstration.
The Selection Process
Step 1: Preliminary Data Collection on Moving to Work Agencies
Building on discussions with HUD and the study team’s own analysis of the 34 agencies with Moving to Work status at the time the demonstration’s initial Request for Proposals
was issued, the team initially identified 12 candidate PHAs, selected from a list of 14 that HUD’s Moving to Work office had recommended. Most of those agencies operated large Housing Choice Voucher (HCV) programs and were not in the midst of making extensive changes to their existing rent rules. At the start of the selection process (and with the agreement of the project’s Government Technical Representative), the study team excluded the four new Moving to Work PHAs that HUD announced in late 2012, because these agencies served very small numbers of voucher holders.
Step 2: Phone Reconnaissance With PHAs
By the end of 2012, following the live conference information sessions mentioned previously and a special HUD-initiated conference call with selected PHAs, the study team and HUD completed a series of one-on-one exploratory discussions by telephone with the 12 PHAs that were considered potentially appropriate for the study. These calls dealt with the PHAs’ current rent-policy reforms and plans and their willingness to be part of the demonstration. Based on these calls, the study team identified 8 agencies with which it undertook more indepth planning activities. These agencies served Baltimore, Cambridge, Chicago, Louisville, Massachusetts, San Antonio, Santa Clara, and Washington, D.C.
Step 3: Initial Planning Sessions
The study team conducted two separate daylong planning ses sions in Chicago with representatives of the 8 agencies in February and May 2013. The HUD Government Technical Representative participated in person in both sessions, and other HUD headquarters staff members joined by phone. These meetings were used to explore a variety of alternative rent policies and to try to identify a common set of approaches all of the candidate PHAs might be willing to adopt.
By the May 2013 Chicago meeting, the Santa Clara PHA withdrew itself from consideration for the demonstration. Because of funding reductions the agency confronted as a result of the federal budget sequestration process, it chose to adopt a differ-ent type of rent policy than the one that was gaining support from the other candidate PHAs. Santa Clara’s new policy would increase households’ share of rent and utilities (to 35 percent of gross income) in an attempt to immediately reduce the agency’s housing subsidy per household, which it viewed as the only

Reducing Work Disincentives in the Housing Choice Voucher Program
Rent Reform Demonstration Baseline Report
64
way it could avoid reducing the number of vouchers it could offer. Moreover, the agency determined that it could not meet its budget-reduction goals if it had to maintain the traditional rent policy for a control group.114
Step 4: PHA Analysis
Over the course of the year, the study team conducted exten-sive analyses of data on the PHAs and their cities drawn from the PHAs themselves and from other sources. Several of the PHAs subsequently withdrew themselves from consideration. Baltimore’s PHA was contending with vacancies in central leadership positions for the HCV program, and its officials believed they could not take on the requirements of the demon stration. The Chicago Housing Authority had advanced its plans to introduce a variety of Moving to Work reforms and believed that adding the new rent policies to the mix would interfere with a smooth implementation of these other reforms. The Massachusetts PHA eventually declined to participate because it was devoting attention to transforming its utilities policy—a transition that would demand large amounts of time from the same agency staff members who would also have to be responsible for rent reform. Finally, the Cambridge Housing Authority withdrew after it determined it did not have
a large enough staff to take on a rent-reform project while also handling the major capital-planning and resident-relocation challenges it would face as a new Rental Assistance Demonstra-tion site.
In the face of these withdrawals, the study team and HUD initiated conversations with PHAs in Columbus, Georgia; Lexington, Kentucky; and Philadelphia and Pittsburgh, Pennsylvania. Preliminary data analyses were conducted for the PHAs in Columbus and Philadelphia, but those agencies did not join the demonstration. An agreement was reached with the PHAs in Lexington, Louisville, San Antonio, and Washington, D.C. to join the planning effort and the demonstration.
Step 5: Moving to Work Activity Specification and Other Approvals
Leading up to the launch of the demonstration, the study team helped each PHA integrate the details of the new rent policy and the basic research design of the Rent Reform Demonstra-tion into its annual Moving to Work activity plan, which was then made available for public comment, PHA board review and approval, and HUD’s approval, all of which was necessary to finalize the PHA’s participation in the demonstration.
114 MDRC is conducting a separate evaluation of Santa Clara’s rent-reform policy using a comparative interrupted time-series design, as part of a larger ongoing evalu-ation of the Moving to Work demonstration that the Urban Institute is leading under contract to HUD.
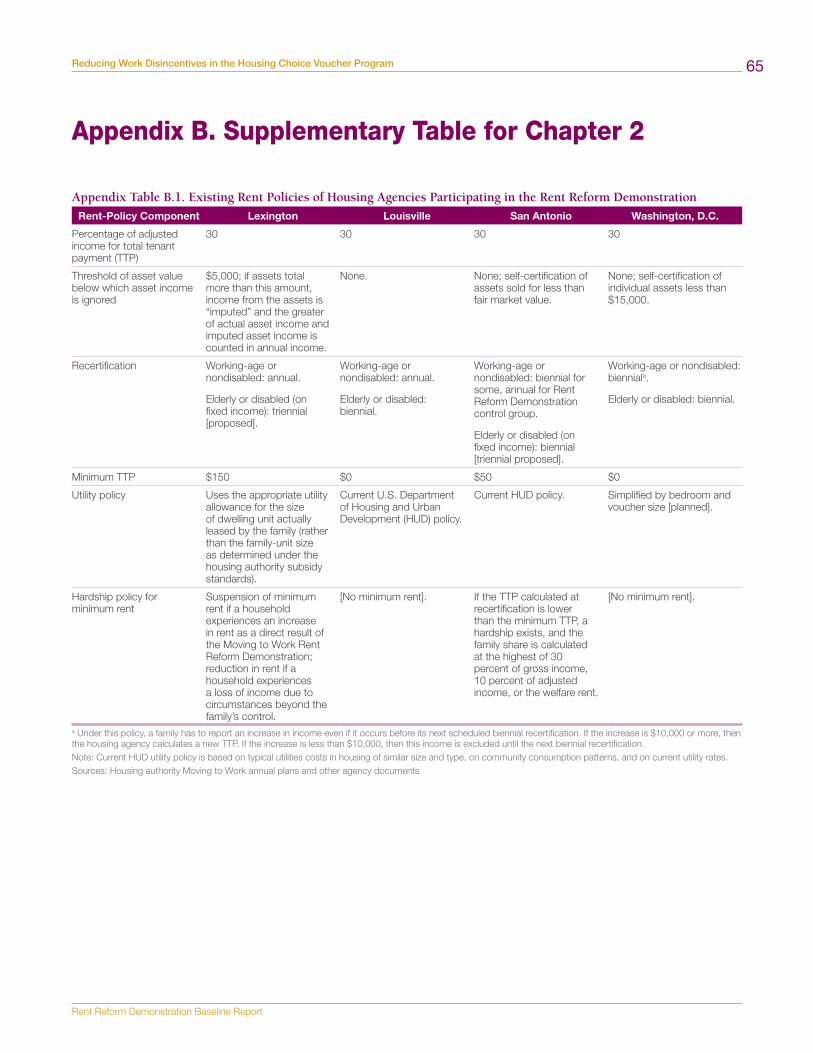
Reducing Work Disincentives in the Housing Choice Voucher Program
Rent Reform Demonstration Baseline Report
65
Appendix B. Supplementary Table for Chapter 2
Appendix Table B.1. Existing Rent Policies of Housing Agencies Participating in the Rent Reform Demonstration
Rent-Policy Component Lexington Louisville San Antonio Washington, D.C.
Percentage of adjusted income for total tenant payment (TTP)
30 30 30 30
Threshold of asset value below which asset income is ignored
$5,000; if assets total more than this amount, income from the assets is “imputed”andthegreaterof actual asset income and imputed asset income is counted in annual income.
None. None; self-certification of assets sold for less than fair market value.
None; self-certification of individual assets less than $15,000.
Recertification Working-age or nondisabled: annual.
Elderly or disabled (on fixed income): triennial [proposed].
Working-age or nondisabled: annual.
Elderly or disabled: biennial.
Working-age or nondisabled: biennial for some, annual for Rent Reform Demonstration control group.
Elderly or disabled (on fixed income): biennial [triennial proposed].
Working-age or nondisabled: bienniala.
Elderly or disabled: biennial.
Minimum TTP $150 $0 $50 $0
Utility policy Uses the appropriate utility allowance for the size of dwelling unit actually leased by the family (rather than the family-unit size as determined under the housing authority subsidy standards).
Current U.S. Department of Housing and Urban Development (HUD) policy.
Current HUD policy. Simplified by bedroom and voucher size [planned].
Hardship policy for minimum rent
Suspension of minimum rent if a household experiences an increase in rent as a direct result of the Moving to Work Rent Reform Demonstration; reduction in rent if a household experiences a loss of income due to circumstances beyond the family’s control.
[No minimum rent]. If the TTP calculated at recertification is lower than the minimum TTP, a hardship exists, and the family share is calculated at the highest of 30 percent of gross income, 10 percent of adjusted income, or the welfare rent.
[No minimum rent].
a Under this policy, a family has to report an increase in income even if it occurs before its next scheduled biennial recertification. If the increase is $10,000 or more, then the housing agency calculates a new TTP. If the increase is less than $10,000, then this income is excluded until the next biennial recertification. Note: Current HUD utility policy is based on typical utilities costs in housing of similar size and type, on community consumption patterns, and on current utility rates.Sources: Housing authority Moving to Work annual plans and other agency documents

Reducing Work Disincentives in the Housing Choice Voucher Program
Rent Reform Demonstration Baseline Report
66
Appendix C. Families in Louisville Who Opted Out of the New Rent PolicyAs described in chapter 4, families randomly assigned to the new rent rules group in Louisville were given the option of not being subject to the new rent rules. If they wanted to opt out of the new rent policy and instead have their total tenant payments (TTPs) determined using the existing rent rules, they could do so. To inform that decision, the families were shown what their TTPs would be under each set of rules. Once they received that information, they had 30 days to make contact with the public housing agency (PHA) to opt out of the new policy; if they did not, they were subject to it. However, families who chose to opt out of the new policy remained part of the research sample unless they asked the study team that their data not be used in the study (an option available to families served by all housing agencies in the demonstration).
In total, 212, or 22 percent, of the families in Louisville assigned to the new rent rules group chose to opt out—that is, to have their rent calculated using the existing rules. As shown in appendix table C.1, 32 percent of those who opted out would have been subject to the $50 minimum TTP had they remained subject to the new rent rules, unless they received hardship waivers. In Louisville, the existing rules do not include a minimum TTP. Even if all opt-out families who qualified for hardship remedies under the new rent policy had received them, 46 percent would still have paid higher TTPs under the new rules than under the existing rules, at least initially. (It is possible that, in the long term, they would have paid lower TTPs under the new rent rules than the existing rules if their earnings were to increase.) Conversely, 54 percent would not have paid higher TTPs initially (again, assuming that all families who qualified for hardship waivers received them). The vast majority of the families who would have paid more under the new rent rules would have had monthly increases of $50 or less. According to housing agency staff members, some of the families who opted out simply did not want to deal with a new set of rules.
As shown on appendix table C.2, the opt-out families had somewhat older heads of households, were less likely to have children, and were less likely to be working than families who chose to remain subject to the new rent rules. For example, the average head of the household in opt-out families was 41 years old, compared with 38 years old in the non-opt-out group. Opt-out families were also less likely to have children; 32 percent had no children under the age of 18, compared with 18 percent of non-opt-out group. Moreover, 29 percent
had three or more children, compared with 33 percent of the non-opt-out families. The opt-out families were substantially less likely to have any earned income (72 percent had no earned income, compared with 57 percent of the non-opt-out group). They were also paying lower monthly TTPs, on average, at the time of random assignment ($166 versus $234 for the non-opt-out group).
Appendix Table C.1. Comparison of Initial Total Tenant Payment (TTP) Estimates for Opt-Out Families in Louisville, New Rent Policy Versus Existing Policy
Characteristic Percentage
Optedoutofthenewrentrules 22.4
Sample size = 947
Opt-out families whose retrospective income data are available
Would have paid minimum TTP under the new rent rules, assuming no hardship review
31.8
TTP would have been higher under the new rent rules in the first month, assuming no hardship remedy was applied
74.2
$1–$50 higher 68.0$51–$75 higher 2.1$76–$100 higher 0.5$101–$150 higher 1.6$151 higher or more 2.1
TTP would have been higher under the new rent rules in the first month, even if hardship remedies were applied
46.4
$1–$50 higher 40.2$51–$75 higher 2.1$76–$100 higher 0.5$101–$150 higher 1.6$151 higher or more 2.1
Would have qualified for a grace-period TTP under the new rent rules
57.7
Sample size = 189
Opt-out families whose first recertification data are available
TTP under existing rent rules$0 23.2$1–$99 29.9$100–$299 28.9$300–$699 15.5$700 or more 2.6
Sample size = 194
Notes: For 189 families who opted out of the new rent rules (89 percent of those who opted out), retrospective income data were available. Those families are the ones analyzed in the top panel. For 194 families who opted out of the new rent rules (92 percent of those who opted out), data on their first recertifications under the study are available. Those are the families analyzed in the bottom panel. In total, 212 eligible households opted out. Rounding may cause slight discrepancies calculating sums and differences.Source: MDRC calculations using public housing agency data
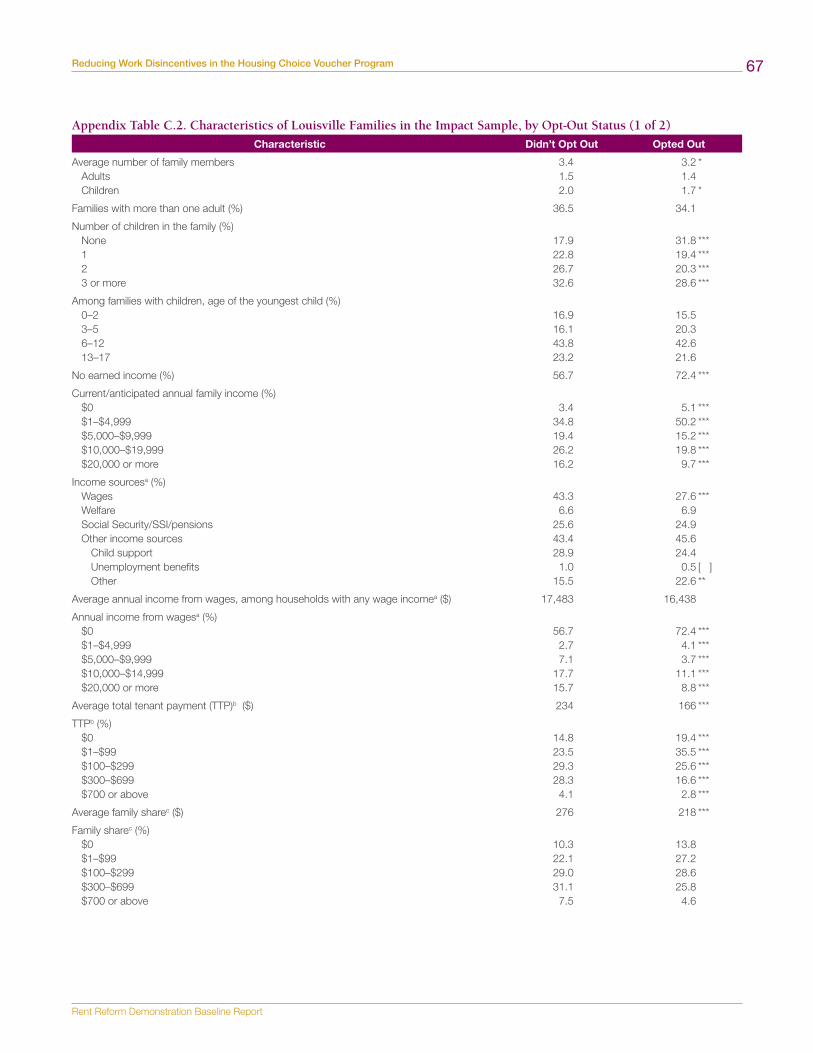
Reducing Work Disincentives in the Housing Choice Voucher Program
Rent Reform Demonstration Baseline Report
67
Appendix Table C.2. Characteristics of Louisville Families in the Impact Sample, by Opt-Out Status (1 of 2)
Characteristic Didn’t Opt Out Opted Out
Average number of family members 3.4 3.2 *Adults 1.5 1.4Children 2.0 1.7 *
Families with more than one adult (%) 36.5 34.1
Number of children in the family (%)None 17.9 31.8 ***1 22.8 19.4 ***2 26.7 20.3 ***3 or more 32.6 28.6 ***
Among families with children, age of the youngest child (%)0–2 16.9 15.53–5 16.1 20.36–12 43.8 42.613–17 23.2 21.6
No earned income (%) 56.7 72.4 ***
Current/anticipated annual family income (%)$0 3.4 5.1 ***$1–$4,999 34.8 50.2 ***$5,000–$9,999 19.4 15.2 ***$10,000–$19,999 26.2 19.8 ***$20,000 or more 16.2 9.7 ***
Income sourcesa (%)Wages 43.3 27.6 ***Welfare 6.6 6.9Social Security/SSI/pensions 25.6 24.9Otherincomesources 43.4 45.6
Child support 28.9 24.4Unemployment benefits 1.0 0.5 [ ]Other 15.5 22.6 **
Average annual income from wages, among households with any wage incomea ($) 17,483 16,438
Annual income from wagesa (%)$0 56.7 72.4 ***$1–$4,999 2.7 4.1 ***$5,000–$9,999 7.1 3.7 ***$10,000–$14,999 17.7 11.1 ***$20,000 or more 15.7 8.8 ***
Average total tenant payment (TTP)b ($) 234 166 ***
TTPb (%)$0 14.8 19.4 ***$1–$99 23.5 35.5 ***$100–$299 29.3 25.6 ***$300–$699 28.3 16.6 ***$700 or above 4.1 2.8 ***
Average family sharec ($) 276 218 ***
Family sharec (%)$0 10.3 13.8$1–$99 22.1 27.2$100–$299 29.0 28.6$300–$699 31.1 25.8$700 or above 7.5 4.6
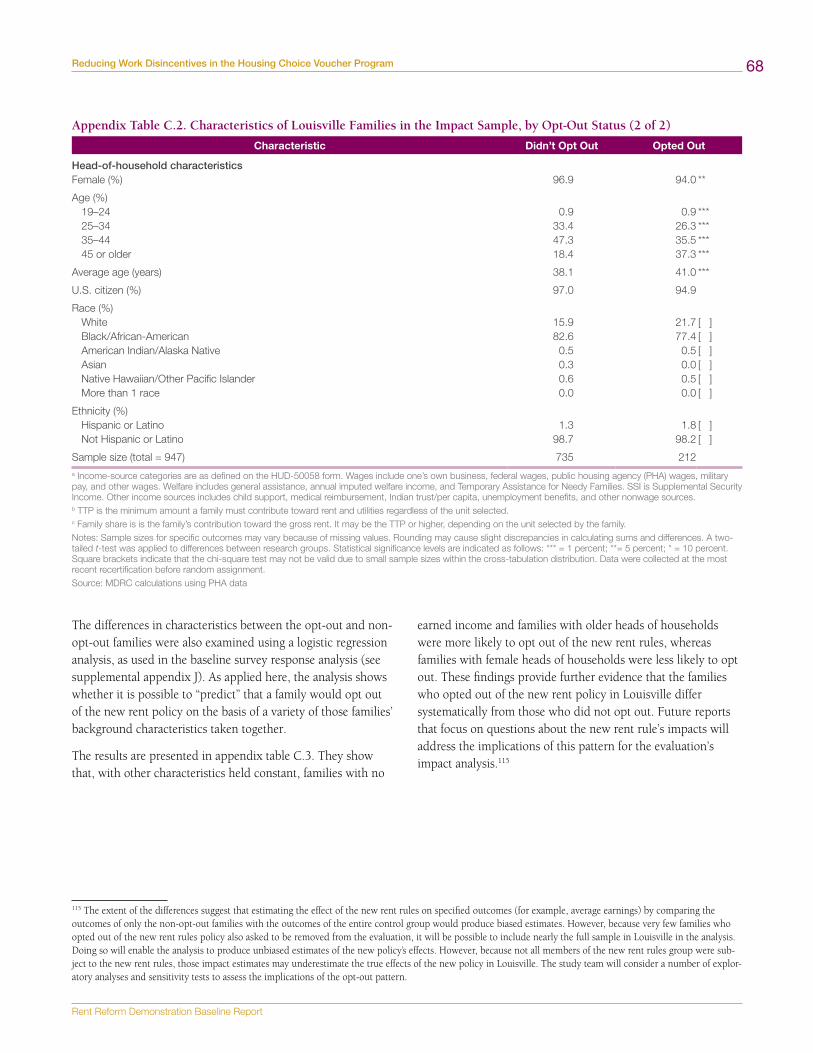
Reducing Work Disincentives in the Housing Choice Voucher Program
Rent Reform Demonstration Baseline Report
68
Appendix Table C.2. Characteristics of Louisville Families in the Impact Sample, by Opt-Out Status (2 of 2)
Characteristic Didn’t Opt Out Opted Out
Head-of-household characteristicsFemale (%) 96.9 94.0 **
Age (%)19–24 0.9 0.9 ***25–34 33.4 26.3 ***35–44 47.3 35.5 ***45 or older 18.4 37.3 ***
Average age (years) 38.1 41.0 ***
U.S. citizen (%) 97.0 94.9
Race (%)White 15.9 21.7 [ ]Black/African-American 82.6 77.4 [ ]American Indian/Alaska Native 0.5 0.5 [ ]Asian 0.3 0.0 [ ]NativeHawaiian/OtherPacificIslander 0.6 0.5 [ ]More than 1 race 0.0 0.0 [ ]
Ethnicity (%)Hispanic or Latino 1.3 1.8 [ ]Not Hispanic or Latino 98.7 98.2 [ ]
Sample size (total = 947) 735 212a Income-source categories are as defined on the HUD-50058 form. Wages include one’s own business, federal wages, public housing agency (PHA) wages, military pay, and other wages. Welfare includes general assistance, annual imputed welfare income, and Temporary Assistance for Needy Families. SSI is Supplemental Security Income.Otherincomesourcesincludeschildsupport,medicalreimbursement,Indiantrust/percapita,unemploymentbenefits,andothernonwagesources.b TTP is the minimum amount a family must contribute toward rent and utilities regardless of the unit selected.c Family share is is the family’s contribution toward the gross rent. It may be the TTP or higher, depending on the unit selected by the family.Notes: Sample sizes for specific outcomes may vary because of missing values. Rounding may cause slight discrepancies in calculating sums and differences. A two-tailed t-test was applied to differences between research groups. Statistical significance levels are indicated as follows: *** = 1 percent; **= 5 percent; * = 10 percent. Square brackets indicate that the chi-square test may not be valid due to small sample sizes within the cross-tabulation distribution. Data were collected at the most recent recertification before random assignment.Source: MDRC calculations using PHA data
The differences in characteristics between the opt-out and non-opt-out families were also examined using a logistic regression analysis, as used in the baseline survey response analysis (see supplemental appendix J). As applied here, the analysis shows whether it is possible to “predict” that a family would opt out of the new rent policy on the basis of a variety of those families’ background characteristics taken together.
The results are presented in appendix table C.3. They show that, with other characteristics held constant, families with no
earned income and families with older heads of households were more likely to opt out of the new rent rules, whereas families with female heads of households were less likely to opt out. These findings provide further evidence that the families who opted out of the new rent policy in Louisville differ systematically from those who did not opt out. Future reports that focus on questions about the new rent rule’s impacts will address the implications of this pattern for the evaluation’s impact analysis.115
115 The extent of the differences suggest that estimating the effect of the new rent rules on specified outcomes (for example, average earnings) by comparing the outcomes of only the non-opt-out families with the outcomes of the entire control group would produce biased estimates. However, because very few families who opted out of the new rent rules policy also asked to be removed from the evaluation, it will be possible to include nearly the full sample in Louisville in the analysis. Doing so will enable the analysis to produce unbiased estimates of the new policy’s effects. However, because not all members of the new rent rules group were sub-ject to the new rent rules, those impact estimates may underestimate the true effects of the new policy in Louisville. The study team will consider a number of explor-atory analyses and sensitivity tests to assess the implications of the opt-out pattern.
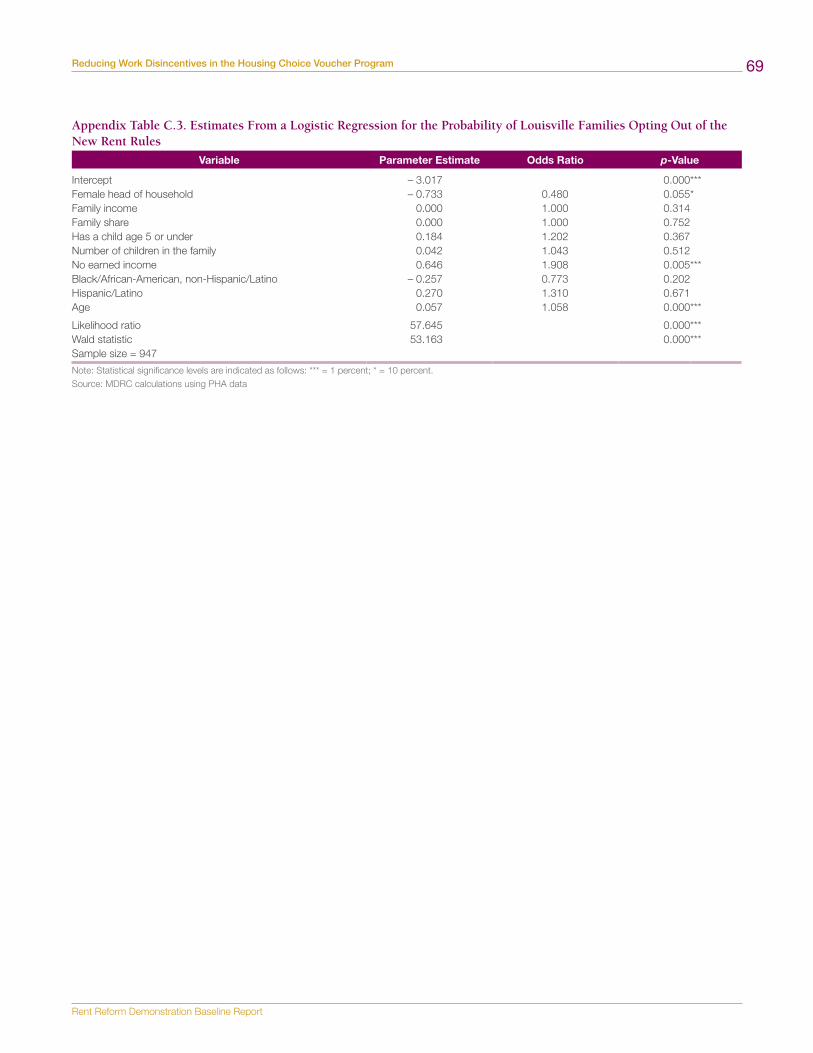
Reducing Work Disincentives in the Housing Choice Voucher Program
Rent Reform Demonstration Baseline Report
69
Appendix Table C.3. Estimates From a Logistic Regression for the Probability of Louisville Families Opting Out of the New Rent Rules
Variable Parameter Estimate Odds Ratio p-Value
Intercept – 3.017 0.000***Female head of household – 0.733 0.480 0.055*Family income 0.000 1.000 0.314Family share 0.000 1.000 0.752Has a child age 5 or under 0.184 1.202 0.367Number of children in the family 0.042 1.043 0.512No earned income 0.646 1.908 0.005***Black/African-American, non-Hispanic/Latino – 0.257 0.773 0.202Hispanic/Latino 0.270 1.310 0.671Age 0.057 1.058 0.000***
Likelihood ratio 57.645 0.000***Wald statistic 53.163 0.000***Sample size = 947
Note: Statistical significance levels are indicated as follows: *** = 1 percent; * = 10 percent.Source: MDRC calculations using PHA data

Reducing Work Disincentives in the Housing Choice Voucher Program
Rent Reform Demonstration Baseline Report
70
Appendix D. Calculating Retrospective Income When There Is a Gap in Income Verification
Retrospective Period: February 2014–January 2015
In this example, no income information is available for 2 months at the beginning of the retrospective period (February and March 2014).
Feb Mar Apr May June July Aug Sept Oct Nov Dec Jan$? $? $900 $900 $900 $900 $900 $900 $900 $900 $900 $900
Enterprise Income Verification (EIV) data for January through March of 2014 show income of $2,850 for that period. The housing specialist asks the head of the household if he or she earned about the same amount each month during that period.
a) If the head of household responds that the income was about the same in each of those months, $950 is entered as income for the months of February and March ($2,850/3 = $950/month).
Feb Mar Apr May June July Aug Sept Oct Nov Dec Jana. $950 $950 $900 $900 $900 $900 $900 $900 $900 $980 $980 $980
Using the income information for the 12-month retrospective period, the software calculates the average retrospective monthly income ($928.33).
b) If the head of the household says that he or she had a job, but lost it and had no income in March while looking for another job, the income for March is set to 0 (self-certified by the head of household) and, based on the EIV data, $1,425 for February. In other words—
The EIV for the quarter from January 2014 through March 2014 = $2,850.
The household reports having worked for 2 of the 3 months in the quarter (January and February), for a total income of $2,850.
$2,850/2 = $1,425 for January and February each, therefore $1,425 is counted for February.
Feb Mar Apr May June July Aug Sept Oct Nov Dec Janb. $1,425 $0 $900 $900 $900 $900 $900 $900 $900 $900 $900 $900
Using the income information for the 12-month retrospective period, the software calculates the average retrospective monthly income ($868.75).
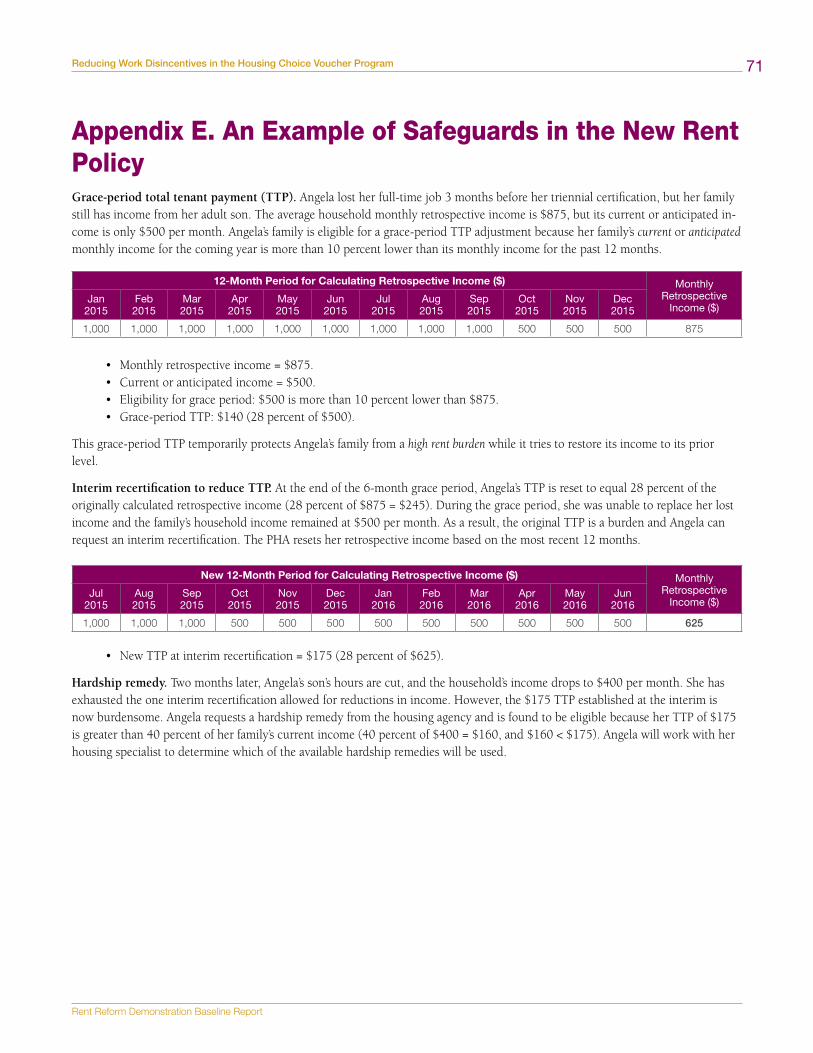
Reducing Work Disincentives in the Housing Choice Voucher Program
Rent Reform Demonstration Baseline Report
71
Appendix E. An Example of Safeguards in the New Rent PolicyGrace-period total tenant payment (TTP). Angela lost her full-time job 3 months before her triennial certification, but her family still has income from her adult son. The average household monthly retrospective income is $875, but its current or anticipated in-come is only $500 per month. Angela’s family is eligible for a grace-period TTP adjustment because her family’s current or anticipated monthly income for the coming year is more than 10 percent lower than its monthly income for the past 12 months.
12-Month Period for Calculating Retrospective Income ($) Monthly Retrospective
Income ($)Jan
2015Feb 2015
Mar 2015
Apr 2015
May 2015
Jun 2015
Jul 2015
Aug 2015
Sep 2015
Oct 2015
Nov 2015
Dec 2015
1,000 1,000 1,000 1,000 1,000 1,000 1,000 1,000 1,000 500 500 500 875
• Monthly retrospective income = $875.• Current or anticipated income = $500.• Eligibility for grace period: $500 is more than 10 percent lower than $875.• Grace-period TTP: $140 (28 percent of $500).
This grace-period TTP temporarily protects Angela’s family from a high rent burden while it tries to restore its income to its prior level.
Interim recertification to reduce TTP. At the end of the 6-month grace period, Angela’s TTP is reset to equal 28 percent of the originally calculated retrospective income (28 percent of $875 = $245). During the grace period, she was unable to replace her lost income and the family’s household income remained at $500 per month. As a result, the original TTP is a burden and Angela can request an interim recertification. The PHA resets her retrospective income based on the most recent 12 months.
New 12-Month Period for Calculating Retrospective Income ($) Monthly Retrospective
Income ($)Jul
2015Aug 2015
Sep 2015
Oct 2015
Nov 2015
Dec 2015
Jan 2016
Feb 2016
Mar 2016
Apr 2016
May 2016
Jun 2016
1,000 1,000 1,000 500 500 500 500 500 500 500 500 500 625
• New TTP at interim recertification = $175 (28 percent of $625).
Hardship remedy. Two months later, Angela’s son’s hours are cut, and the household’s income drops to $400 per month. She has exhausted the one interim recertification allowed for reductions in income. However, the $175 TTP established at the interim is now burdensome. Angela requests a hardship remedy from the housing agency and is found to be eligible because her TTP of $175 is greater than 40 percent of her family’s current income (40 percent of $400 = $160, and $160 < $175). Angela will work with her housing specialist to determine which of the available hardship remedies will be used.

Reducing Work Disincentives in the Housing Choice Voucher Program
Rent Reform Demonstration Baseline Report
72
Appendix F. Letter Sent to Families Who Qualified for Hardship Remedies
Appendix F. Letter Sent to Families Who Qualified for Hardship Remedies
Dear Rent Reform Participant,
As you know, you are one of the households in the LMHA Housing Choice Voucher Program Rent Reform demonstration program. Your rent has been calculated using a new method. We hope the program is working well for you. This letter is a reminder of the information you received at your recertification about your ability to request an interim or hardship and if you qualify, receive a reduced rent.
Depending upon your circumstances, you may qualify for one of the following:
1. A once-‐per-‐year interim reduction in your portion of rent: You may qualify for only one (1) interim reduction each year if your current household income decreases by more than 10% below your past income (used by LMHA in calculating your new rent portion).
2. A hardship: You may qualify for a hardship rent if LMHA determines that your tenant portion of rent (i.e., your “total tenant payment”) is more than 40% of your current household income, or if you can provide evidence to LMHA that you are at risk of court eviction because you have not been able to afford your new portion of rent or utilities.
Remember that you have the opportunity to find out whether you are eligible for a rent adjustment or hardship rent. For information about a rent adjustment, call the LMHA change line at (502) 569-‐6248. For information about a hardship, call your housing specialist at (502) 569-‐6060.
Sincerely,
Louisville Metro Housing Authority

Reducing Work Disincentives in the Housing Choice Voucher Program
Rent Reform Demonstration Baseline Report
73
References
Abt Associates Inc., the Urban Institute, and Applied Real Estate Analysis, Inc. 2010. Study of Rents and Rent Flexibility. Report prepared for the U.S. Department of Housing and Urban Development, Office of Public and Indian Housing. Washington, DC: U.S. Government Printing Office.
Berk, Richard A. 2005. “Randomized Experiments as the Bronze Standard,” Journal of Experimental Criminology 1 (4): 417–433.
Bloom, Howard. 2006. The Core Analytics of Randomized Experiments for Social Research. New York: MDRC.
Bloom, Howard, James Riccio, and Nandita Verma. 2005. Promoting Work in Public Housing: The Effectiveness of Jobs-Plus. New York: MDRC.
Carlson, Deven, Robert Haveman, Tom Kaplan, and Barbara Wolfe. 2012. “Long-Term Earnings and Employment Effects of Housing Voucher Receipt,” Journal of Urban Economics 71 (1): 128–150.
Cull, William L., Karen G. O’Connor, Sanford Sharp, and Suk-fong S. Tang. 2005. “Response Rates and Response Bias for 50 Surveys of Pediatricians,” Health Services Research 40 (1): 213–226.
Government Accountability Office. 2012. Housing Choice Vouchers: Options Exist To Increase Program Efficiencies. Wash-ington, DC: U.S. Government Printing Office.
Hendra, Richard, James A. Riccio, Richard Dorsett, David H. Greenberg, Genevieve Knight, Joan Phillips, Philip K. Robins, Sandra Vegeris, and Johanna Walter, with Aaron Hill, Kathryn Ray, and Jared Smith. 2011. Breaking the Low-Pay, No-Pay Cycle: Final Evidence From the UK Employment Retention and Advancement (ERA) Demonstration. Report 765. Leeds, United Kingdom: Department for Work and Pensions.
Hoynes, Hilary Williamson, and Diane Whitmore Schanzen-bach. 2010. Work Incentives and the Food Stamp Program. NBER Working Paper No. 16198. Cambridge, MA: National Bureau of Economic Research.
Jacob, Brian A., and Jens Ludwig. 2012. “The Effects of Hous-ing Assistance on Labor Supply: Evidence From a Voucher Lottery,” American Economic Review 102 (1): 272–304.
Johnson, Timothy P., and Joseph S. Wislar. 2012. “Response Rates and Nonresponse Errors in Surveys,” The Journal of the American Medical Association (JAMA) 307 (17): 1805–1806.
MDRC. 2015. Testing an Alternative Rent Policy for Housing Choice Voucher Recipients. Unpublished design paper submitted to the U.S. Department of Housing and Urban Development. New York: MDRC.
———. 2016. Rent Reform Data Collection and Analysis Plan. Unpublished design paper submitted to the U.S. Department of Housing and Urban Development. New York: MDRC.
Michalopoulos, Charles. 2005. Does Making Work Pay Still Pay? An Update on the Effects of Four Earnings Supplement Programs on Employment, Earnings, and Income. New York: MDRC.
Mills, Gregory, Daniel Gubits, Larry Orr, David Long, Judith Feins, Bulbul Kaul, Michelle Wood, Amy Jones and Associates, Cloudburst Consulting, and the QED Group. 2006. Effects of Housing Vouchers on Welfare Families: Final Report. Prepared for the U.S. Department of Housing and Urban Development, Office of Policy Development and Research. Cambridge, MA: Abt Associates, Inc.
Nuñez, Stephen, Nandita Verma, and Edith Yang. 2015. Building Self-Sufficiency for Housing Voucher Recipients: Interim Findings From the Work Rewards Demonstration in New York City. New York: MDRC.
Public Housing Authorities Directors Association. 2005. Rent Reform: Fair and Simple Solutions. Washington, DC: Public Housing Authorities Directors Association.
Riccio, James. 2010. Sustained Earnings Gains for Residents in a Public Housing Jobs Program: Seven-Year Findings From the Jobs-Plus Demonstration. New York: MDRC.
Riccio, James, and Cynthia Miller. 2016. New York City’s First Conditional Cash Transfer Program: What Worked, What Didn’t. New York: MDRC.
Shroder, Mark D. 2010. “Housing Subsidies and Work Incentives.” https://ssrn.com/abstract=1691112 or http://dx.doi.org/10.2139/ssrn.1691112.
U.S. Department of Housing and Urban Development (HUD). 2001. “Housing Choice Voucher Program Guidebook.” 7420.10G. portal.hud.gov/hudportal/HUD?src=/program_offices/administration/hudclips/guidebooks/7420.10G.
———. 2015. “Picture of Subsidized Households.” huduser.gov/portal/datasets/picture/yearlydata.html.