analysis of incentives and disincentives for cashew nuts ... · analysis of incentives and...
TRANSCRIPT

ANALYSIS OF INCENTIVES AND DISINCENTIVES FOR CASHEW NUTS IN THE UNITED REPUBLIC OF TANZANIA
DECEMBER 2012

This technical note is a product of the Monitoring African Food and Agricultural Policies project (MAFAP). It is a technical document intended primarily for internal use as background for the eventual MAFAP Country Report. This technical note may be updated as new data becomes available.
MAFAP is implemented by the Food and Agriculture Organization of the United Nations (FAO) in collaboration with the Organisation for Economic Co-operation and Development (OECD) and national partners in participating countries. It is financially supported by the Bill and Melinda Gates Foundation, the United States Agency for International Development (USAID), and FAO.
The analysis presented in this document is the result of the partnerships established in the context of the MAFAP project with governments of participating countries and a variety of national institutions.
For more information: http://www.fao.org/mafap
Suggested citation: Nkonya, N. & Barreiro-Hurle, J. 2013. Analysis of incentives and disincentives for cashew nuts in the United Republic of Tanzania. Technical notes series, MAFAP, FAO, Rome. © FAO 2013 FAO encourages the use, reproduction and dissemination of material in this information product. Except where otherwise indicated, material may be copied, downloaded and printed for private study, research and teaching purposes, or for use in non-commercial products or services, provided that appropriate acknowledgement of FAO as the source and copyright holder is given and that FAO’s endorsement of users’ views, products or services is not implied in any way. All requests for translation and adaptation rights, and for resale and other commercial use rights should be made via www.fao.org/contact-us/licence-request or addressed to [email protected]. FAO information products are available on the FAO website (www.fao.org/publications) and can be purchased through [email protected].
1

SUMMARY OF THE NOTE Product: Cashew nuts Period analyzed: 2005-2011 Trade status: The United Republic of Tanzania is a net exporter throughout the research period Cashew nuts represent a small portion of agricultural production in the United Republic of
Tanzania (URT), with an average of 300 000 has cultivated (2 percent of total area) producing approximately 100 000 tonnes per year. The production is mainly centered in the southern coastal regions.
Most of the production is exported making Cashew nut is one of the main agricultural exports in URT, second only to Coffee and Cotton, representing an average of 10 percent of total agricultural exports.
Exports of cashew nuts are subject to an export tax. Moreover, since 2008 a warehouse receipt system has been put in place which means that all cashew production has to be auctioned via cooperatives at an auction managed by the Cashew Board of Tanzania.
The observed Nominal Rate of Protection (NRP) (green line) indicates that cashew nut farmers have been receiving prices below what would be expected in the absence of public policy and with an efficiently functioning value chain. Most of the disincentives in the period before the introduction of the warehouse receipt system can be attributed to the export tax in place, however following the introduction of the WRS, the disincentives have increased. Therefore the WRS seems not to be working for the advantage of farmers, at least with regards to prices.
The adjusted NRP (blue line) captures the effects of market inefficiencies on farmers, showing that excessive port costs, district cess and margins along the value chain further reinforce the disincentives, however the overall impact of the WRS and the export tax are more important. Moreover, the increase of the export tax as of 2011 to promote processing of cashew nuts in the country does not seem to have delivered the expected results and the share of government revenue that is channeled back to the sector is below 20 percent.
The government of The United Republic of Tanzania should consider revoking the export tax or assure that a greater part of its revenue goes back to the sector, mainly to assure a better functioning of the WRS and increased processing opportunities.
-50%
-40%
-30%
-20%
-10%
0%
10%
20%
30%
2005 2006 2007 2008 2009 2010 2011
Observed nominal rate of protection at farm gate Adjusted nominal rate of protection at farm gate
2

CONTENTS SUMMARY OF THE NOTE ......................................................................................................................... 2
CONTENTS ............................................................................................................................................... 3
1. PURPOSE OF THE NOTE ................................................................................................................... 4
2. COMMODITY CONTEXT ................................................................................................................... 5
PRODUCTION ....................................................................................................................................... 5
CONSUMPTION/UTILIZATION ............................................................................................................. 7
MARKETING AND TRADE ..................................................................................................................... 7
DESCRIPTION OF THE VALUE CHAIN AND PROCESSING ...................................................................... 9
POLICY DECISSIONS AND MEASURES ................................................................................................ 10
3. DATA REQUIREMENTS, DESCRIPTION AND INDICATORS CALCULATION ...................................... 13
BENCHMARK PRICES .......................................................................................................................... 13
EXCHANGE RATES .............................................................................................................................. 13
DOMESTIC PRICES ............................................................................................................................. 14
ACCESS COSTS ................................................................................................................................... 16
QUANTITY AND QUALITY ADJUSTMENTS .......................................................................................... 19
BUDGET AND OTHER TRANSFERS ..................................................................................................... 19
CALCULATION OF THE INDICATORS .................................................................................................. 22
4. INTERPRETATION OF INDICATORS ................................................................................................ 25
5. PRELIMINARY CONCLUSIONS AND RECOMMENDATIONS ............................................................ 28
MAIN MESSAGE ................................................................................................................................. 28
PRELIMINARY RECOMMENDATIONS ................................................................................................. 28
LIMITATIONS ..................................................................................................................................... 28
FURTHER INVESTIGATION AND RESEARCH ....................................................................................... 28
BIBLIOGRAPHY ....................................................................................................................................... 29
ANNEX I: Methodology Used ................................................................................................................. 30
ANNEX II: Data and calculations used in the analysis ........................................................................... 31
3
1. PURPOSE OF THE NOTE This technical note aims to describe the market incentives and disincentives for cashew nut producers in The United Republic of Tanzania. The note is a technical document and serves as input for the MAFAP Country Report.
For this purpose, yearly averages of farm gate and wholesale prices are compared with reference prices calculated on the basis of the commodity price in the international market. The price gaps between the reference prices and the prices along the value chain indicate to which extent incentives (positive gaps) or disincentives (negative gaps) are present at the farm gate and wholesale level. In relative terms, the price gaps are expressed as Nominal Rates of Protection (NRP). These key indicators are used by MAFAP to highlight the effects of policy and market development gaps on prices.
The note starts with a brief review of the commodity’s production and consumption as well as trade and policies affecting the commodity. It also provides a detailed description of how the key components of the price analysis have been obtained. Using this data, the MAFAP indicators are then calculated and interpreted in light of existing policies and market characteristics. The analysis is commodity and country specific and covers the period 2005-2010. The indicators have been calculated using available data from different sources for this period and are described in Chapter 3.
The outcomes of this analysis can be used by those stakeholders involved in policy-making for the food and agricultural sector. They can also serve as input for evidence-based policy dialogue at the country or regional level.
This technical note is not to be interpreted as an analysis of the value chain or detailed description of production, consumption or trade patterns. All information related to these areas is presented merely to provide background on the commodity under review, help understand major trends and facilitate the interpretation of the indicators.
Additionally, all information is preliminary and still subject to review and validation.
4

2. COMMODITY CONTEXT
PRODUCTION Since the early 1990’s URT devotes approximately 100 000 ha to cashew nut production with an average production of 100 000 tonnes (Figure 1). The area under cashew nut production constantly increased from 1961 to the maximum of 240 000 ha in 1973. The cashew nut production tripled during the first decade of its independence (from 50 000 to 150 000 tonnes), this is due to the fact that the initial cashew varieties planted need 10 years to have the first harvest. Thus it was not until the late 1950’s that the first harvest was observed and production kept on increasing to the maximum level in the first decade after independence. This raise in production is also attributed to a stable institutional environment with private trading and strong co-operative unions. Following this peak production collapsed due to forced villagization, which moved farmers away from their farms, and other factors such as inefficiencies in the marketing system reaching a minimum of 35 000 ha in 1990 (Mitchell and Baregu, 2012). Besides, all co-operative unions were replaced by centrally controlled by crop authorities.
Since then area and production recovered, however they still far from the maximums reached in the 1970s. The last peak in production, mainly related to increased yields, is partly attributed to the farmers/buyers contracts and the warehouse receipt system which assured farmers of prices at the beginning of cropping seasons.
Figure 1: Area and production of cashew nuts in the United Republic of Tanzania (1945-2012)
Source: CBT (Production) and FAOSTAT (Area)
0
50
100
150
200
250
Thou
sand
s he
ctar
es a
nd t
ons
Production (tons) Area (ha)
5

Most of the production is concentrated in the southern coastal regions of Pwani, Lindi and Mtwara which account for over 80 percent of total area and production (Figure 2). Overall yields are less than one tonne per hectare, which makes the United Republic of Tanzania the most productive country in East Africa (Figure 3). However this yield is far from those obtained in West Africa (i.e. two tonnes in Nigeria) or in the most productive countries growing cashew nuts (i.e. three tonnes in Mexico, close to five in the Philippines and Peru).
Figure 2: Distribution of area (2004-2010; left) and production (1982-2010; right) of cashew nuts in the United Republic of Tanzania
Source: MAFC
Figure 3: Cashew nut yields in Tanzania and Kenya 1961-2010
Source: FAOSTAT, 2011
Mtwara57%
Lindi14%
Pwani13%
Others16%
Mtwara49%
Linid20%
Pwani14%
Others17%
-
0.20
0.40
0.60
0.80
1.00
1.20
1.40
1.60
1961
1962
1963
1964
1965
1966
1967
1968
1969
1970
1971
1972
1973
1974
1975
1976
1977
1978
1979
1980
1981
1982
1983
1984
1985
1986
1987
1988
1989
1990
1991
1992
1993
1994
1995
1996
1997
1998
1999
2000
2001
2002
2003
2004
2005
2006
2007
2008
2009
2010
Tons
per
hec
tare
Kenya Tanzania
6

CONSUMPTION/UTILIZATION
Most of the cashew nuts produced in URT are exported with domestic consumption representing a marginal share. Processing of cashew nuts is also limited, using data on production and exports and assuming that all production not exported is processed for domestic consumption on average since 2005 only 12 percent of total production was processed, with a maximum estimated processing of 30 000 tonnes in 2012 and a minimum of under 5 000 tonnes in 2011 (Figure 4).
Figure 4: Estimated processing of cashew nuts in the United Republic of Tanzania
Source: CBT and own elaboration.
Processing capacity of cashew nuts in URT stands at 136 700 tonnes in 25 plants with a size ranging from 300 to 12 000 tonnes (UNIDO, 2011). However in the season 2009/2010 only nine were operational with a total capacity of 42 800 tonnes which, according to our calculations, was being utilized only at 20 per cent.
Cashews are also consumed as a primary food item in villages where they are produced when prices are low relative to other food items. Since the collapse of mechanical processing in the 1980s, manual processing has begun in Tanzania but is not competitive with processing in India or Vietnam without government support. URT now exports about 80 percent of its raw cashew nuts, and processes about 20 percent locally using the manual technology developed in India. About 7 000 workers were engaged in manual shelling and peeling of the approximately 20 000 tonnes of raw nuts that were processed in URT in 2009 (Mitchell and Baregu, 2012).
MARKETING AND TRADE As mentioned, most of the production of cashew nuts in URT are exported without being shelled (Figure 5). The main destination of exports is India where raw cashew nuts are either shelled for export or used in (Figure 6). India is the major processor of cashew nuts in the world with a
0%
5%
10%
15%
20%
25%
0
5,000
10,000
15,000
20,000
25,000
30,000
35,000
2005 2006 2007 2008 2009 2010 2011 2012
% o
f tot
al p
rodu
ctio
n
Tons
Processed Cashew nuts % of total production
7

competitive processing industry and a policy environment which fosters imports of raw cashew nuts while protecting the internal market for processed ones with a significant import tariff and VAT (Mitchell and Baregu, 2012).
Figure 5: Export volumes of cashew nuts in shell and shelled from Tanzania (2005-12)
Source: CBT
0%
1%
2%
3%
4%
5%
6%
7%
8%
9%
0
20
40
60
80
100
120
140
2005 2006 2007 2008 2009 2010 2011 2012
Thou
sand
Ton
s
Ratio shelled / in shell In shell Shelled
8
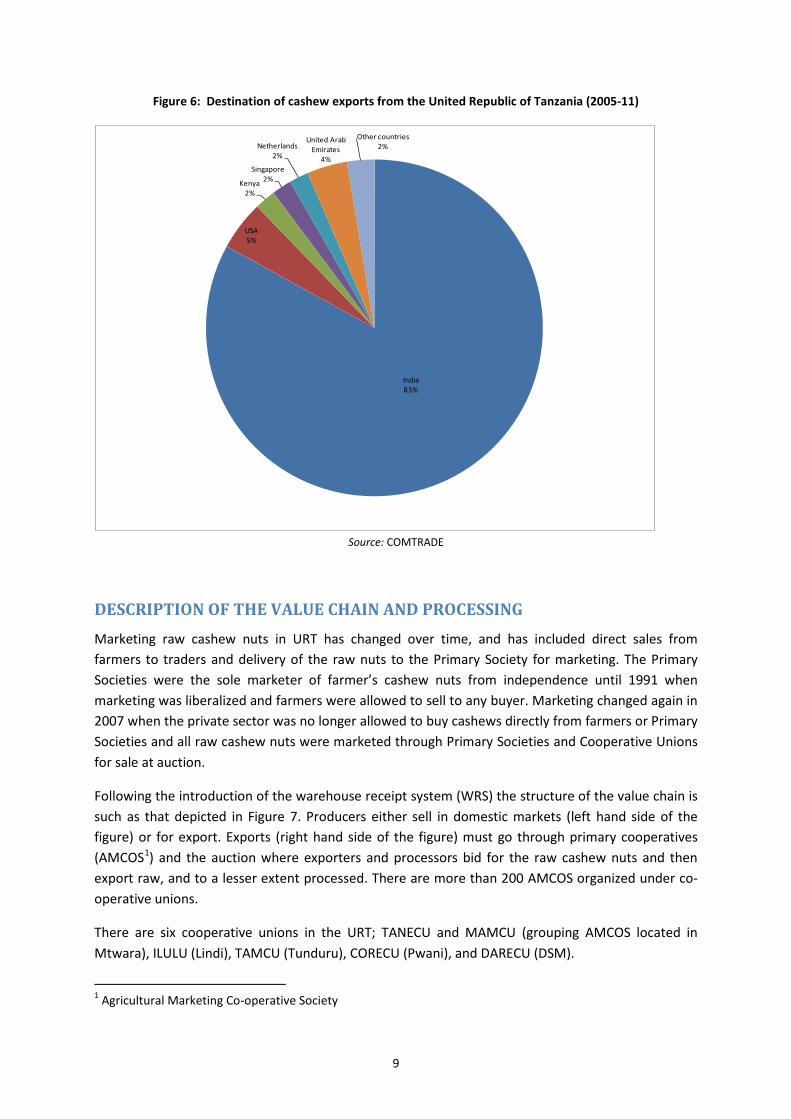
Figure 6: Destination of cashew exports from the United Republic of Tanzania (2005-11)
Source: COMTRADE
DESCRIPTION OF THE VALUE CHAIN AND PROCESSING Marketing raw cashew nuts in URT has changed over time, and has included direct sales from farmers to traders and delivery of the raw nuts to the Primary Society for marketing. The Primary Societies were the sole marketer of farmer’s cashew nuts from independence until 1991 when marketing was liberalized and farmers were allowed to sell to any buyer. Marketing changed again in 2007 when the private sector was no longer allowed to buy cashews directly from farmers or Primary Societies and all raw cashew nuts were marketed through Primary Societies and Cooperative Unions for sale at auction.
Following the introduction of the warehouse receipt system (WRS) the structure of the value chain is such as that depicted in Figure 7. Producers either sell in domestic markets (left hand side of the figure) or for export. Exports (right hand side of the figure) must go through primary cooperatives (AMCOS1) and the auction where exporters and processors bid for the raw cashew nuts and then export raw, and to a lesser extent processed. There are more than 200 AMCOS organized under co-operative unions.
There are six cooperative unions in the URT; TANECU and MAMCU (grouping AMCOS located in Mtwara), ILULU (Lindi), TAMCU (Tunduru), CORECU (Pwani), and DARECU (DSM).
1 Agricultural Marketing Co-operative Society
India83%
USA5%
Kenya2%
Singapore2%
Netherlands2%
United Arab Emirates
4%
Other countries2%
9
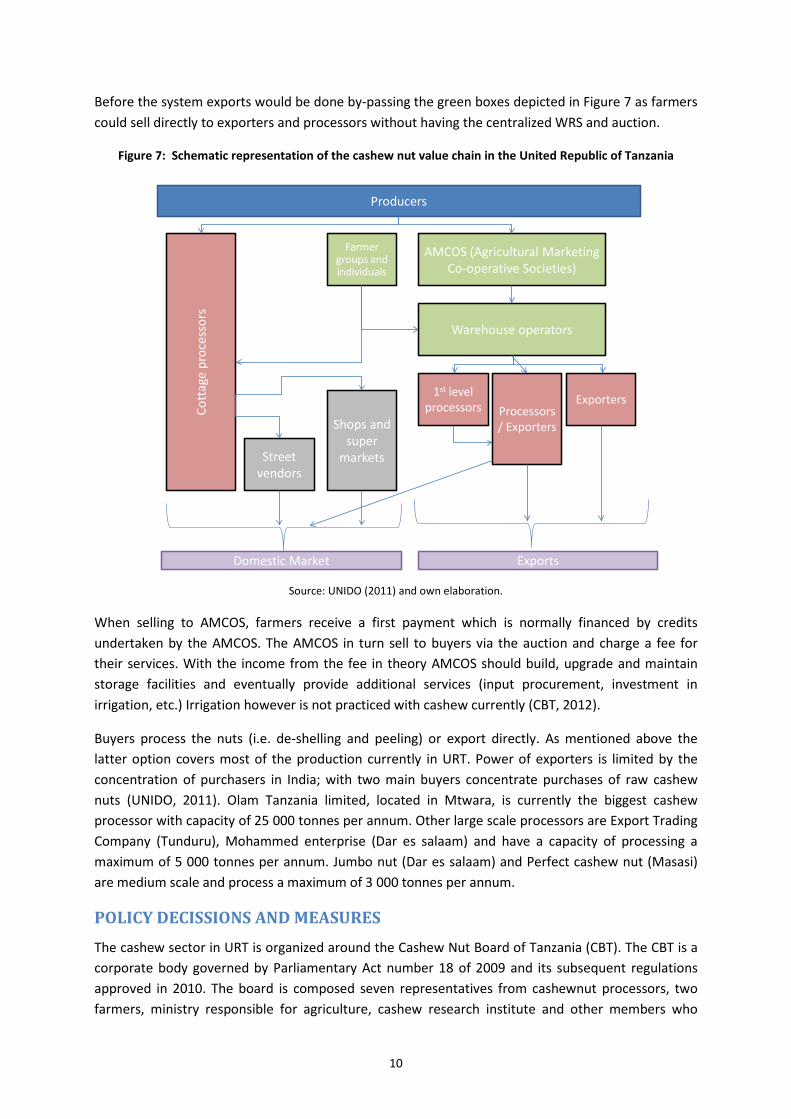
Before the system exports would be done by-passing the green boxes depicted in Figure 7 as farmers could sell directly to exporters and processors without having the centralized WRS and auction.
Figure 7: Schematic representation of the cashew nut value chain in the United Republic of Tanzania
Source: UNIDO (2011) and own elaboration.
When selling to AMCOS, farmers receive a first payment which is normally financed by credits undertaken by the AMCOS. The AMCOS in turn sell to buyers via the auction and charge a fee for their services. With the income from the fee in theory AMCOS should build, upgrade and maintain storage facilities and eventually provide additional services (input procurement, investment in irrigation, etc.) Irrigation however is not practiced with cashew currently (CBT, 2012).
Buyers process the nuts (i.e. de-shelling and peeling) or export directly. As mentioned above the latter option covers most of the production currently in URT. Power of exporters is limited by the concentration of purchasers in India; with two main buyers concentrate purchases of raw cashew nuts (UNIDO, 2011). Olam Tanzania limited, located in Mtwara, is currently the biggest cashew processor with capacity of 25 000 tonnes per annum. Other large scale processors are Export Trading Company (Tunduru), Mohammed enterprise (Dar es salaam) and have a capacity of processing a maximum of 5 000 tonnes per annum. Jumbo nut (Dar es salaam) and Perfect cashew nut (Masasi) are medium scale and process a maximum of 3 000 tonnes per annum.
POLICY DECISSIONS AND MEASURES The cashew sector in URT is organized around the Cashew Nut Board of Tanzania (CBT). The CBT is a corporate body governed by Parliamentary Act number 18 of 2009 and its subsequent regulations approved in 2010. The board is composed seven representatives from cashewnut processors, two farmers, ministry responsible for agriculture, cashew research institute and other members who
ProducersCo
ttag
e pr
oces
sors
Farmer groups and individuals
Street vendors
Shops and super
markets
AMCOS (Agricultural Marketing Co-operative Societies)
Warehouse operators
1st level processors Processors
/ Exporters
Exporters
Domestic Market Exports
10

posses experience and knowledge in the cashew nut industry. Its chair is held by a Presidential appointee.
The board has the following functions:
i. advise the Government on the policies and strategies for the development of cashewnut industry in order to improve the quality and increase in production competitiveness in local and international market;
ii. regulate and control the quality of cashew nuts, kernels and cashew nuts by-products; iii. collect, refine, maintain, use or disseminate information or data concerning the cashewnut
industry; iv. promote and facilitate the formation of associations; v. enforce the implementation of regulations in respect of farming, marketing, processing,
transporting and storage of cashew nuts; vi. represent the Government in local and international fora dealing with matters relating to
cashewnut industry; and vii. link efforts of stakeholders in expanding and modernizing the cashewnut industry in URT.
A registered farmer may, for the purpose of facilitating farming activities, enter into contract for farming with any cashew nut production financier, buyer, processor or any other person interested in sponsoring production and marketing of the farmer's produce. Every contract for farming made shall be submitted to the CBT for perusal and registration. The CBT shall have the mandate to monitor the implementation of contracts in order to protect interest of both parties. A person registered as a cashewnut buyer, seller, processor, exporter, importer, warehouse owner or operator shall be required to apply for a license
The CBT mandates is to be the regulator of the cashew industry and preparation to the market level. Regulates quality, processing. The law is silent on farmer protection. Stakeholders’ forum sets indicative prices. CBT convenes meetings and gives market indicators (CBT is a referee) and makes sure that dealers abide by the prices. Warehouses are mainly operated by private individuals and companies. Co-operative unions have started constructing warehouses. They are licensed and regulated by the warehouse licensing board (Act no 10 of 2005), however CBT regulates the cashew in the warehouse. According to part IX of the cashewnut regulations (2010), the indicative cashew nut farm gate prices are deliberated upon and determined by the stakeholders forum which is composed of representatives from MAFC, management, board of directors, buyers, The District Executive Director of Local Government Authorities of cashew growing districts, cashew nut co-operative unions, growers associations, regional & district commissioners in cashew growing regions, interested banks, input suppliers, PMO-RALG2, Ministry of Finance, Ministry of Industry and Trade, The Cashew Research Institute, the Agricultural Council of Tanzania, processors, the Tanzania Chamber of Commerce, Industry and Agriculture, the Cashew nut Industry Development Trust Fund and any other stakeholder as the board may determine.
The main policy decisions affecting the cashew nuts sector include an export tax, the support to cashew nut research and development and the cashew board. In addition local governments impose additional taxes to cashew production.
2 PMO-RALG = Prime minister’s office, regional administration and local governments
11

Cashew nut export tax: applied to all exports of raw cashew nuts to foster in country processing. It is applied at 10 percent of the FOB value and was increased to 15 percent in 2011. According to the CBT marketing officer, 35 percent export levy collected is deposited to the treasury. The remaining amount is used for different objectives as set by the stakeholders’ forum. Currently the export levy’s income not transferred to the treasury is used for agrochemicals subsidy (55 percent), research (10 percent), marketing & branding (10 percent), administration costs of the CBT (10 percent), Cashew Industry Development Trust fund (10 percent) and Local Government Authorities (5 percent).
Cashew nut research: the government of the United Republic of Tanzania funds the Naliendele Agricultural Institute (NARI) located in Mtwara. NARI is one of seven agricultural research zonal centers in URT under the Ministry of Agriculture, Food Security and Co-operatives. It covers two regions and one district in the south eastern corner of URT i.e. Mtwara, Lindi and Tunduru District in Ruvuma Region. It was established in 1970 and entrusted with a mandate to conduct agricultural research that addresses the needs and aspirations of the farmers, particularly improved crop productivity and quality. NARI coordinates Cashew and Oilseed crops at National level and collaborates within and outside URT in verifying research outputs.
Local taxes to cashew production: after a period when the taxes reached very high levels (Mitchell and Baregu, 2012) they are now stabilized around 5 percent of the farm gate price.
12
3. DATA REQUIREMENTS, DESCRIPTION AND INDICATORS CALCULATION
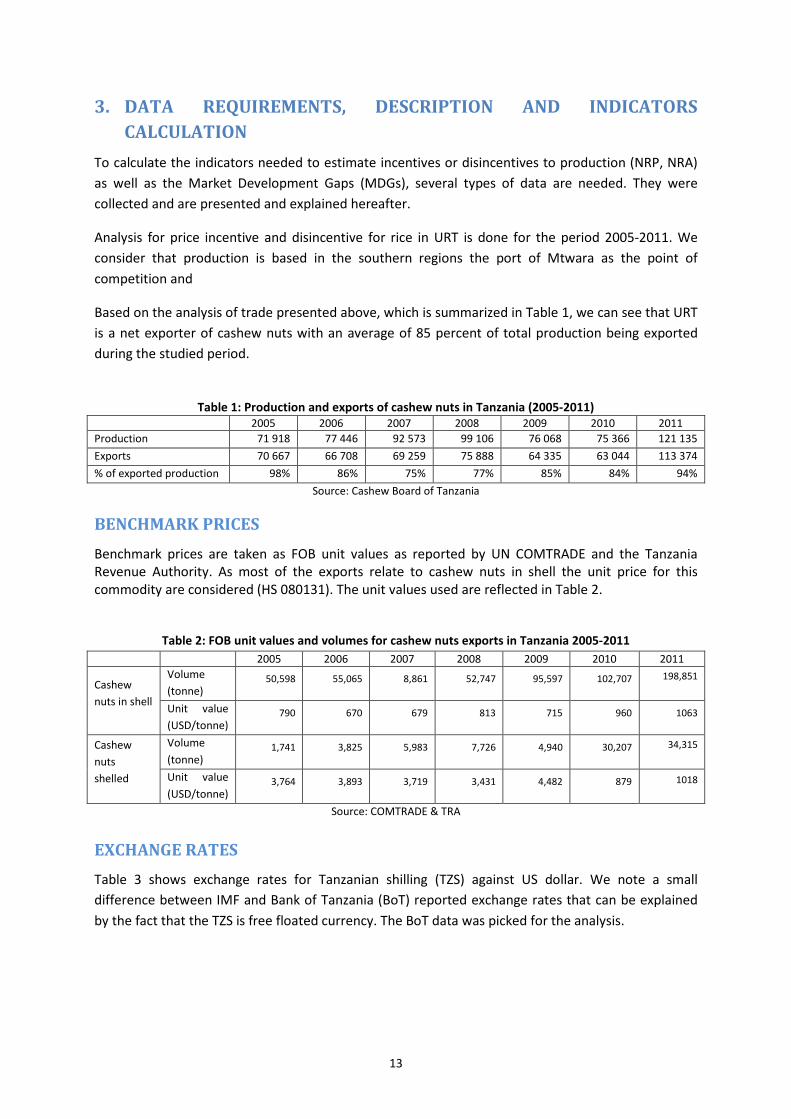
To calculate the indicators needed to estimate incentives or disincentives to production (NRP, NRA) as well as the Market Development Gaps (MDGs), several types of data are needed. They were collected and are presented and explained hereafter.
Analysis for price incentive and disincentive for rice in URT is done for the period 2005-2011. We consider that production is based in the southern regions the port of Mtwara as the point of competition and
Based on the analysis of trade presented above, which is summarized in Table 1, we can see that URT is a net exporter of cashew nuts with an average of 85 percent of total production being exported during the studied period.
Table 1: Production and exports of cashew nuts in Tanzania (2005-2011)
2005 2006 2007 2008 2009 2010 2011 Production 71 918 77 446 92 573 99 106 76 068 75 366 121 135 Exports 70 667 66 708 69 259 75 888 64 335 63 044 113 374 % of exported production 98% 86% 75% 77% 85% 84% 94%
Source: Cashew Board of Tanzania
BENCHMARK PRICES Benchmark prices are taken as FOB unit values as reported by UN COMTRADE and the Tanzania Revenue Authority. As most of the exports relate to cashew nuts in shell the unit price for this commodity are considered (HS 080131). The unit values used are reflected in Table 2.
Table 2: FOB unit values and volumes for cashew nuts exports in Tanzania 2005-2011 2005 2006 2007 2008 2009 2010 2011
Cashew nuts in shell
Volume (tonne)
50,598 55,065 8,861 52,747 95,597 102,707 198,851
Unit value (USD/tonne)
790 670 679 813 715 960 1063
Cashew nuts shelled
Volume (tonne)
1,741 3,825 5,983 7,726 4,940 30,207 34,315
Unit value (USD/tonne)
3,764 3,893 3,719 3,431 4,482 879 1018
Source: COMTRADE & TRA
EXCHANGE RATES Table 3 shows exchange rates for Tanzanian shilling (TZS) against US dollar. We note a small difference between IMF and Bank of Tanzania (BoT) reported exchange rates that can be explained by the fact that the TZS is free floated currency. The BoT data was picked for the analysis.
13

Table 3: Comparative Exchange rates Exchange rate (yearly average of monthly data)
2005 2006 2007 2008 2009 2010 2011
IMF 1,128 1,251 1,245 1,196 1,320 1,409 1,535 BOT 1,129 1,253 1,239 1,196 1,320 1,432 n.d.
Source: IMF and BOT
DOMESTIC PRICES Farm gate prices
Two sources of farm gate prices are available, those of the National Bureau of Statistics (NBS) and those of the Cashew Board of Tanzania. The former are reported quarterly and available since 2005 while the latter are reported since 2007 as yearly averages. Farm gate prices reported by the CBT is the price offered to farmers by the cashew AMCOS. Farmers are paid in installments. A first installment is paid using money obtained from banks (bank loans) before cashew nuts are sold to traders and the remaining part of the farm gate price is paid after auction. If auction prices are above expectations farmers are paid an additional price bonus (CBT, 2012).
Figure 8 compares both data sets.
Figure 8: Farm gate prices for cashew nuts in Tanzania according to data source (2005-11)
Source: CBT and NBS
Wholesale prices
As far as price at the point of competition (wholesale) is concerned in 2008 the warehouse receipt system started working in URT. This means that from 2008 the Cashew Board of Tanzania reports the prices paid at the centralized auction which deals with all sales. Before that we have no data point between the farm gate and the port of export and therefore have decided to estimate the indicators
-
200
400
600
800
1,000
1,200
TzSh
per
Kg
National Bureau of Statistics Cashew Board of Tanzania
14
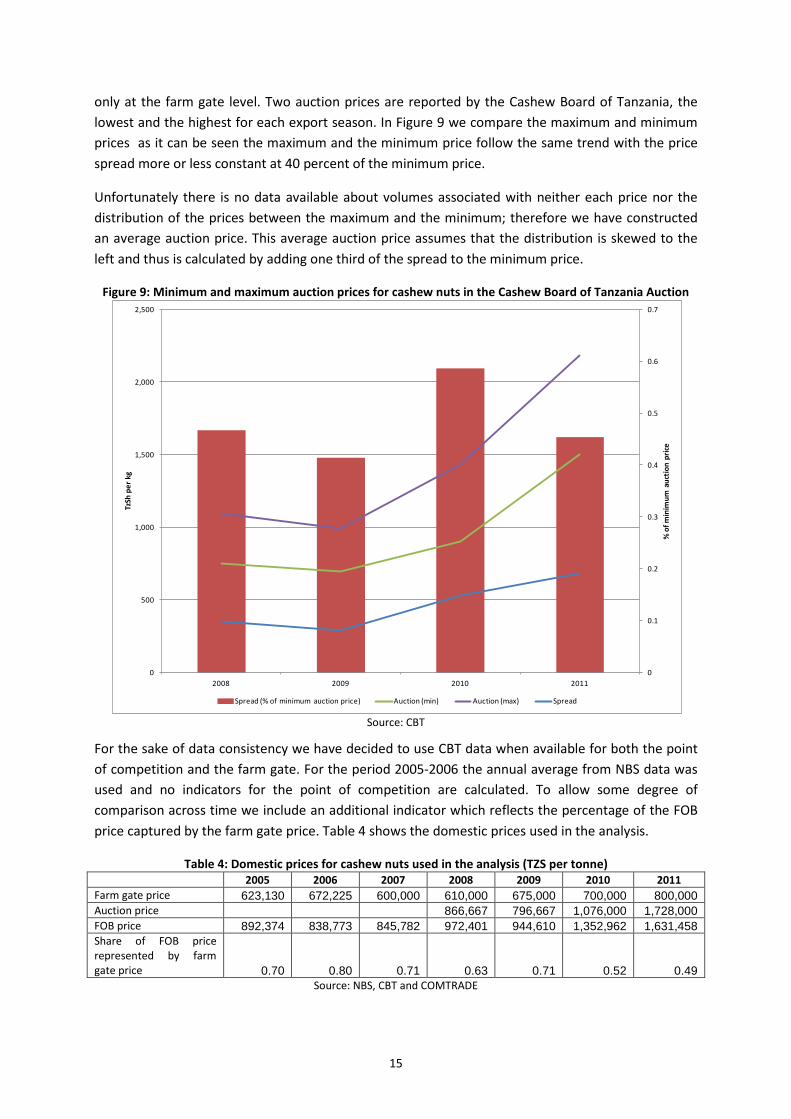
only at the farm gate level. Two auction prices are reported by the Cashew Board of Tanzania, the lowest and the highest for each export season. In Figure 9 we compare the maximum and minimum prices as it can be seen the maximum and the minimum price follow the same trend with the price spread more or less constant at 40 percent of the minimum price.
Unfortunately there is no data available about volumes associated with neither each price nor the distribution of the prices between the maximum and the minimum; therefore we have constructed an average auction price. This average auction price assumes that the distribution is skewed to the left and thus is calculated by adding one third of the spread to the minimum price.
Figure 9: Minimum and maximum auction prices for cashew nuts in the Cashew Board of Tanzania Auction
Source: CBT
For the sake of data consistency we have decided to use CBT data when available for both the point of competition and the farm gate. For the period 2005-2006 the annual average from NBS data was used and no indicators for the point of competition are calculated. To allow some degree of comparison across time we include an additional indicator which reflects the percentage of the FOB price captured by the farm gate price. Table 4 shows the domestic prices used in the analysis.
Table 4: Domestic prices for cashew nuts used in the analysis (TZS per tonne) 2005 2006 2007 2008 2009 2010 2011 Farm gate price 623,130 672,225 600,000 610,000 675,000 700,000 800,000 Auction price 866,667 796,667 1,076,000 1,728,000 FOB price 892,374 838,773 845,782 972,401 944,610 1,352,962 1,631,458 Share of FOB price represented by farm gate price 0.70 0.80 0.71 0.63 0.71 0.52 0.49
Source: NBS, CBT and COMTRADE
0
0.1
0.2
0.3
0.4
0.5
0.6
0.7
0
500
1,000
1,500
2,000
2,500
2008 2009 2010 2011
% o
f min
imum
auc
tion
price
TzSh
per
kg
Spread (% of minimum auction price) Auction (min) Auction (max) Spread
15
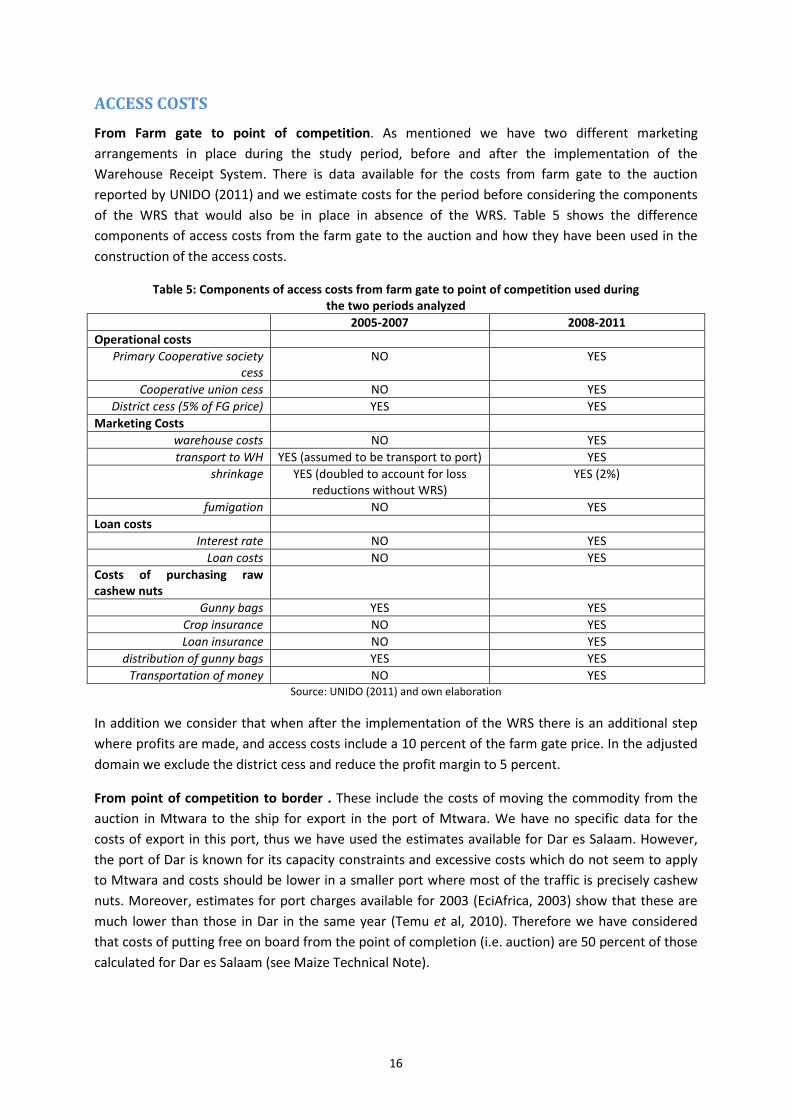
ACCESS COSTS From Farm gate to point of competition. As mentioned we have two different marketing arrangements in place during the study period, before and after the implementation of the Warehouse Receipt System. There is data available for the costs from farm gate to the auction reported by UNIDO (2011) and we estimate costs for the period before considering the components of the WRS that would also be in place in absence of the WRS. Table 5 shows the difference components of access costs from the farm gate to the auction and how they have been used in the construction of the access costs.
Table 5: Components of access costs from farm gate to point of competition used during the two periods analyzed
2005-2007 2008-2011 Operational costs
Primary Cooperative society cess
NO YES
Cooperative union cess NO YES District cess (5% of FG price) YES YES
Marketing Costs warehouse costs NO YES transport to WH YES (assumed to be transport to port) YES
shrinkage YES (doubled to account for loss reductions without WRS)
YES (2%)
fumigation NO YES Loan costs
Interest rate NO YES Loan costs NO YES
Costs of purchasing raw cashew nuts
Gunny bags YES YES Crop insurance NO YES Loan insurance NO YES
distribution of gunny bags YES YES Transportation of money NO YES
Source: UNIDO (2011) and own elaboration
In addition we consider that when after the implementation of the WRS there is an additional step where profits are made, and access costs include a 10 percent of the farm gate price. In the adjusted domain we exclude the district cess and reduce the profit margin to 5 percent.
From point of competition to border . These include the costs of moving the commodity from the auction in Mtwara to the ship for export in the port of Mtwara. We have no specific data for the costs of export in this port, thus we have used the estimates available for Dar es Salaam. However, the port of Dar is known for its capacity constraints and excessive costs which do not seem to apply to Mtwara and costs should be lower in a smaller port where most of the traffic is precisely cashew nuts. Moreover, estimates for port charges available for 2003 (EciAfrica, 2003) show that these are much lower than those in Dar in the same year (Temu et al, 2010). Therefore we have considered that costs of putting free on board from the point of completion (i.e. auction) are 50 percent of those calculated for Dar es Salaam (see Maize Technical Note).
16

The costs include:
• export levy: USD 60 per tonne or 15 percent of FOB price whichever is higher; • pre-inspection charges (fumigation supervision & certificate); • phytosanitary charges (Phytosanitary certificate charges); • port wharfage fees; • tally fee; • SUMATRA3 Booking fee; • documentation and agents fees; • loading and unloading and; • testing for health and food safety standards.
Data have been actualized for each year using the Consumer Price Index for URT as reported by the World Bank. In addition we assume a 10 percent margin for exporters which is applied to the auction price as of 2008 and to the farm gate price before then.
For adjusted access costs we assume a 5 percent profit margin and use lower estimates of loading and unloading costs as reported by WB (2009).
Table 6 shows the access costs considered in the analysis.
Table 6: Access costs considered in the analysis (TZS per tonne) Farm gate to point of competition Point of competition to border
Observed Adjusted Observed Adjusted
2005 122,119 90,963 68,161 53,373 2006 125,556 91,945 71,985 54,398 2007 120,500 90,500 69,616 50,897 2008 263,500 202,500 87,122 67,286 2009 317,000 249,500 87,442 62,892 2010 319,000 249,000 114,652 86,823 2011 316,250 236,250 168,317 125,562
Shaded cells represent the period prior to the implementation of the WRS Source: own elaboration
Figure 10 and Figure 11 show the relationship between the farm gate price and the FOB and Auction prices together with the total cost of taking the cashew nuts from the farm gate to the auction and the port (i.e. farm gate price plus access costs). As it can be seen the share of the farm gate price on FOB and auction prices saw a significant reduction in 2010 and 2011 mainly due to the lack of transmission of higher prices to the farmers.
3 SUMATRA = Surface and marine transport regulatory authority
17

Figure 10: Comparison of cashew nuts prices at the farm gate and the border
Source: NBS and CBT
Figure 11: Comparison of cashew nuts prices at the farm gate and the auction
Source: NBS and CBT
0%
10%
20%
30%
40%
50%
60%
70%
80%
90%
-
200
400
600
800
1,000
1,200
1,400
1,600
1,800
2005 2006 2007 2008 2009 2010 2011
Thou
sand
TzS
h pe
r ton
FG as % of FOB FOB FG FG + access costs
0
0.1
0.2
0.3
0.4
0.5
0.6
0.7
0.8
0.9
-
200
400
600
800
1,000
1,200
1,400
1,600
1,800
2,000
2005 2006 2007 2008 2009 2010 2011
Thou
sand
TzS
h pe
r ton
FG as % of Auction AUCTION FG FG + access costs
18

QUANTITY AND QUALITY ADJUSTMENTS Depending on quality, the quantity conversion factor from raw to shelled cashew is 4.5 to 5. As the prices used at all stages of the analysis refer to cashew nuts in shell no quantity adjustments have been made.
As nearly 80 percent of the cashew nut production is exported we assume that there are no quality differences between the exported nuts to which FOB prices refers to and the produced nuts to which FG prices refer to.
BUDGET AND OTHER TRANSFERS Building on the analysis from Komorowska et al. (2012) we have identified the commodity specific public expenditure for cashew nuts. This includes the budget allocated to the Cashew Board of Tanzania and the Naliendele Cashew nut Research Institute. Total expenditure has been divided by total production to obtain an estimate of the public expenditure per tonne.
19
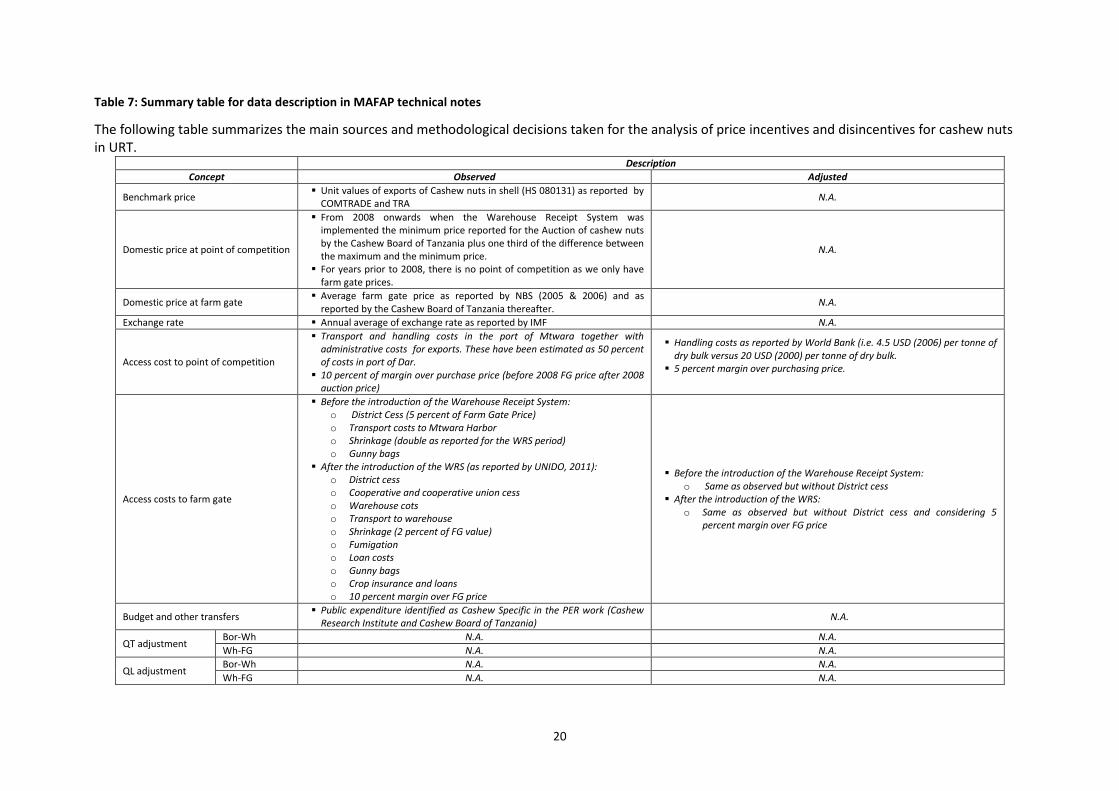
Table 7: Summary table for data description in MAFAP technical notes
The following table summarizes the main sources and methodological decisions taken for the analysis of price incentives and disincentives for cashew nuts in URT.
Description Concept Observed Adjusted
Benchmark price Unit values of exports of Cashew nuts in shell (HS 080131) as reported by COMTRADE and TRA N.A.
Domestic price at point of competition
From 2008 onwards when the Warehouse Receipt System was implemented the minimum price reported for the Auction of cashew nuts by the Cashew Board of Tanzania plus one third of the difference between the maximum and the minimum price.
For years prior to 2008, there is no point of competition as we only have farm gate prices.
N.A.
Domestic price at farm gate Average farm gate price as reported by NBS (2005 & 2006) and as reported by the Cashew Board of Tanzania thereafter. N.A.
Exchange rate Annual average of exchange rate as reported by IMF N.A.
Access cost to point of competition
Transport and handling costs in the port of Mtwara together with administrative costs for exports. These have been estimated as 50 percent of costs in port of Dar.
10 percent of margin over purchase price (before 2008 FG price after 2008 auction price)
Handling costs as reported by World Bank (i.e. 4.5 USD (2006) per tonne of dry bulk versus 20 USD (2000) per tonne of dry bulk.
5 percent margin over purchasing price.
Access costs to farm gate
Before the introduction of the Warehouse Receipt System: o District Cess (5 percent of Farm Gate Price) o Transport costs to Mtwara Harbor o Shrinkage (double as reported for the WRS period) o Gunny bags
After the introduction of the WRS (as reported by UNIDO, 2011): o District cess o Cooperative and cooperative union cess o Warehouse cots o Transport to warehouse o Shrinkage (2 percent of FG value) o Fumigation o Loan costs o Gunny bags o Crop insurance and loans o 10 percent margin over FG price
Before the introduction of the Warehouse Receipt System: o Same as observed but without District cess
After the introduction of the WRS: o Same as observed but without District cess and considering 5
percent margin over FG price
Budget and other transfers Public expenditure identified as Cashew Specific in the PER work (Cashew Research Institute and Cashew Board of Tanzania) N.A.
QT adjustment Bor-Wh N.A. N.A. Wh-FG N.A. N.A.
QL adjustment Bor-Wh N.A. N.A. Wh-FG N.A. N.A.
20

Table 8: Data used for the analysis
Year 2005 2006 2007 2008 2009 2010 2011 trade status m m m m m x X
DATA Unit Symbol
Benchmark Price
Observed USD/TONNE Pb(int$) 790 670 679 813 715 960 1,063 Adjusted USD/TONNE Pba
Exchange Rate Observed TZS/USD ERo 1,129 1,252 1,245 1,196 1,320 1,409 1,535 Adjusted TZS/USD ERa
Access costs border - point of competition
Observed TZS/TONNE ACowh 68,161 71,985 69,616 87,122 87,442 114,652 168,317 Adjusted TZS/TONNE ACawh 53,373 54,398 50,897 67,286 62,892 86,823 125,562
Domestic price at point of competition TZS/TONNE Pdwh 866,667 796,667 1,076,000 1,728,000 Access costs point of competition - farm gate
Observed TZS/TONNE ACofg 122,119 125,556 120,500 263,500 317,000 319,000 316,250 Adjusted TZS/TONNE ACafg 90,963 91,945 90,500 202,500 249,500 249,000 236,250
Farm gate price TZS/TONNE Pdfg 623,130 672,225 600,000 610,000 675,000 700,000 800,000 Externalities associated with production TZS/TONNE E Budget and other product related transfers TZS/TONNE BOT - - 11,993 5,731 11,029 15,859 7,961 Quantity conversion factor (border - point of competition) Fraction QTwh Quality conversion factor (border - point of competition) Fraction QLwh Quatity conversion factor (point of competition – farm gate) Fraction QTfg Quality conversion factor (point of competition – farm gate) Fraction QLfg
NOTES
21

CALCULATION OF THE INDICATORS The indicators and the calculation methodology used are described in Box 1. A detailed description of the calculations and data requirements is available in the MAFAP project website.
Box 1: MAFAP METHODOLOGY AND POLICY INDICATORS
MAFAP analysis uses four measures of market price incentives or disincentives. First, are the two observed nominal rates of protection one each at the wholesale and farm level. These compare observed prices to reference prices free from domestic policy interventions. Reference prices are calculated from a benchmark price such as an import or export price expressed in local currency and brought to the wholesale and farm levels with adjustments for quality, shrinkage and loss, and market access costs. The observed Nominal Rates of Protection - observed (NRPo) is the price gap between the domestic market price and the “observed” reference price divided by the reference price at both the farm and wholesale levels:
𝑃𝐺𝑜𝑓𝑔 = 𝑃𝑓𝑔 − 𝑅𝑃𝑜𝑓𝑔; 𝑁𝑅𝑃𝑜𝑓𝑔 =𝑃𝑓𝑔 − 𝑅𝑃𝑜𝑓𝑔
𝑅𝑃𝑜𝑓𝑔
𝑃𝐺𝑜𝑤ℎ = 𝑃𝑤ℎ − 𝑅𝑃𝑜𝑤ℎ; 𝑁𝑅𝑃𝑜𝑤ℎ =𝑃𝑤ℎ − 𝑅𝑃𝑜𝑤ℎ
𝑅𝑃𝑜𝑤ℎ
The NRPofg captures all trade and domestic policies, as well as other factors which impact on the incentive or disincentive for the farmer. The NRPowh helps identify where incentives and disincentives may be distributed in the commodity market chain. Second are the Nominal Rates of Protection - adjusted (NRPa) at both the wholesale and farm levels. The reference prices for these calculations are adjusted to eliminate distortions that are specific market supply change in developing countries. In particular MAFAP allows incorporating into the analysis distortions caused by market power, overvalued exchange rates, extraordinary levies and charges and excessive marketing costs. The equations to estimate the adjusted rates of protection, however, follow the same general pattern:
𝑃𝐺𝑎𝑓𝑔 = 𝑃𝑓𝑔 − 𝑅𝑃𝑎𝑓𝑔; 𝑁𝑅𝑃𝑎𝑓𝑔 =𝑃𝑓𝑔 − 𝑅𝑃𝑎𝑓𝑔
𝑅𝑃𝑎𝑓𝑔
𝑃𝐺𝑎𝑤ℎ = 𝑃𝑤ℎ − 𝑅𝑃𝑎𝑤ℎ; 𝑁𝑅𝑃𝑎𝑤ℎ =𝑃𝑤ℎ − 𝑅𝑃𝑎𝑤ℎ
𝑅𝑃𝑎𝑤ℎ
Comparison of the observed and adjusted rates of protection makes it possible to explain the incentives and disincentives due to market development gaps in developing country supply chains.
With the data described above we obtain the price gaps summarized in Table 9, nominal rates of protection in Table 10 and Market Development Gaps in Table 11.
22

Table 9: MAFAP price gaps for Cashew Nuts in Tanzania 2005-2010 (TZS per tonne) 2005 2006 2007 2008 2009 2010 2011
Observed price gap at wholesale -18,613 -60,502 -162,310 264,858
Adjusted price gap at wholesale -38,448 -85,052 -190,139 222,104
Observed price gap at farm gate -78,964 30,993 -55,665 -11,779 134,832 -219,310 -346,892
Adjusted price gap at farm gate -124,908 -20,206 -104,385 -92,615 42,782 -317,139 -469,646
Source: Own calculations using data as described above
Figure 12:MAFAP price gaps for Cashew nuts in Tanzania 2005-2011 (TZS per tonne)
(600)
(500)
(400)
(300)
(200)
(100)
-
100
200
300
400
2005 2006 2007 2008 2009 2010 2011
Thou
sand
TzS
h pe
r ton
Observed price gap at point of competition Adjusted price gap at point of competition
Observed price gap at farm gate Adjusted price gap at farm gate
23

Table 10: MAFAP nominal rates of protection (NRP) for maize in Tanzania 2005-2011 (%) 2005 2006 2007 2008 2009 2010 2011
Observed NRP at point of competition -2% -7% -13% 18%
Adjusted NRP at point of competition -4% -10% -15% 15%
Observed NRP at farm gate -11% 5% -8% -2% 25% -24% -30% Adjusted NRP at farm gate -17% -3% -15% -13% 7% -31% -37%
Source: Own calculations using data as described above.
Figure 13: MAFAP nominal rates of protection for Cashew nuts in Tanzania 2005-2011 (TZS per tonne)
Table 11: MAFAP Market Development Gaps for maize in Tanzania 2006-2010 (TZS per tonne) 2005 2006 2007 2008 2009 2010 2011
International markets gap (IRG)
Exchange policy gap (ERPG)
Access costs gap to point of competition
(ACGwh) -14,788 -17,587 -18,720 -19,836 -24,550 -27,829 -42,754 Access costs gap to farm gate (ACGfg) -31,157 -33,611 -30,000 -61,000 -67,500 -70,000 -80,000
Market Development GAP -6% -7% -7% -12% -15% -10% -10%
ND: No data available for calculation Source: Own calculations using data as described above.
-50%
-40%
-30%
-20%
-10%
0%
10%
20%
30%
2005 2006 2007 2008 2009 2010 2011
Observed nominal rate of protection at point of competition Adjusted nominal rate of protection at point of competition
Observed nominal rate of protection at farm gate Adjusted nominal rate of protection at farm gate
24

4. INTERPRETATION OF INDICATORS The results shown above put forward three clear messages.
First, the export tax in place (10 percent up to 2010 and 15 percent from 2011 onwards) reduces the prices of cooperatives (at the auction) and farmers (at the farm gate). For those years when the disincentives are transmitted along the value chain (i.e. 2005, 2007, 2008 , 2010 and 2011 at the farm gate and 2009 and 2010 at the auction) we see that before the introduction of the warehouse receipt system farmers would get a price the cost of the tax was not passed totally to farmers while in the latest years the disincentive is higher than the export tax (Figure 14). The same happens for wholesalers.
Figure 14: comparison of export tax and price gaps at different points in the value chain
Source: Own elaboration
Second, the introduction of the Warehouse Receipt System has led to an increase of disincentives to farmers and wholesalers. While our indicators are constructed using different access costs and that could be the reason behind the increase in disincentives from 2008 onwards, we can see that the share of farm gate price on export price is decreasing (see Figure 15) therefore the system does not seem to benefit farmers, even when it coincided with a period of increased benchmark prices. However, prices at the auction do seem to follow closer the evolution of the export prices. Thus the problem which led to the introduction of the WRS, abundance of middlemen and low farm gate prices (UNIDO, 2011), seems to remain even after the elimination of middlemen.
0%
5%
10%
15%
20%
25%
2,005 2,006 2,007 2,008 2,009 2,010 2,011
Export tax PG at FG as % of FOB PG at Auction as % of FOB
25

Figure 15: Evolution of share of FOB price represented by farm gate and auction prices for cashew nuts in Tanzania
Source: NBS and CBT
Third, the raise of the export tax in 2011 with the objective of promoting processing inside the country while leading to an increase of disincentives to farmers seems to have not delivered the expected results. While one year might be too short of a period to evaluate the measure, the figures for 2011 and 2012 show that the share of total exports covered by shelled cashew nuts have decreased (see Figure 4).
Last, we can compare the income that the export tax generates with the level of public expenditure we have identified in the public expenditure analysis (Komorowska et al., 2012). Figure 16 shows how only a small part of total revenue from export tax is channeled back into the sector (on average less than 10 percent). Even when considering that only 35 percent of total revenue is transferred to the Treasury, the part of the export levy transferred to the Treasury that reverts to the cashew nut sector is below 25 percent. In addition 35.75 percent of total revenues revert as input subsidies (55 percent of the 65 percent that is not transferred to the Treasury) so in the most optimistic case less than 50 cents of each TZS generated by the export levy goes back to farmers.
30%
40%
50%
60%
70%
80%
90%
100%
110%
2005 2006 2007 2008 2009 2010 2011
FG as % of FOB FG as % of Auction Auction as % of FOB Linear (FG as % of FOB)
26
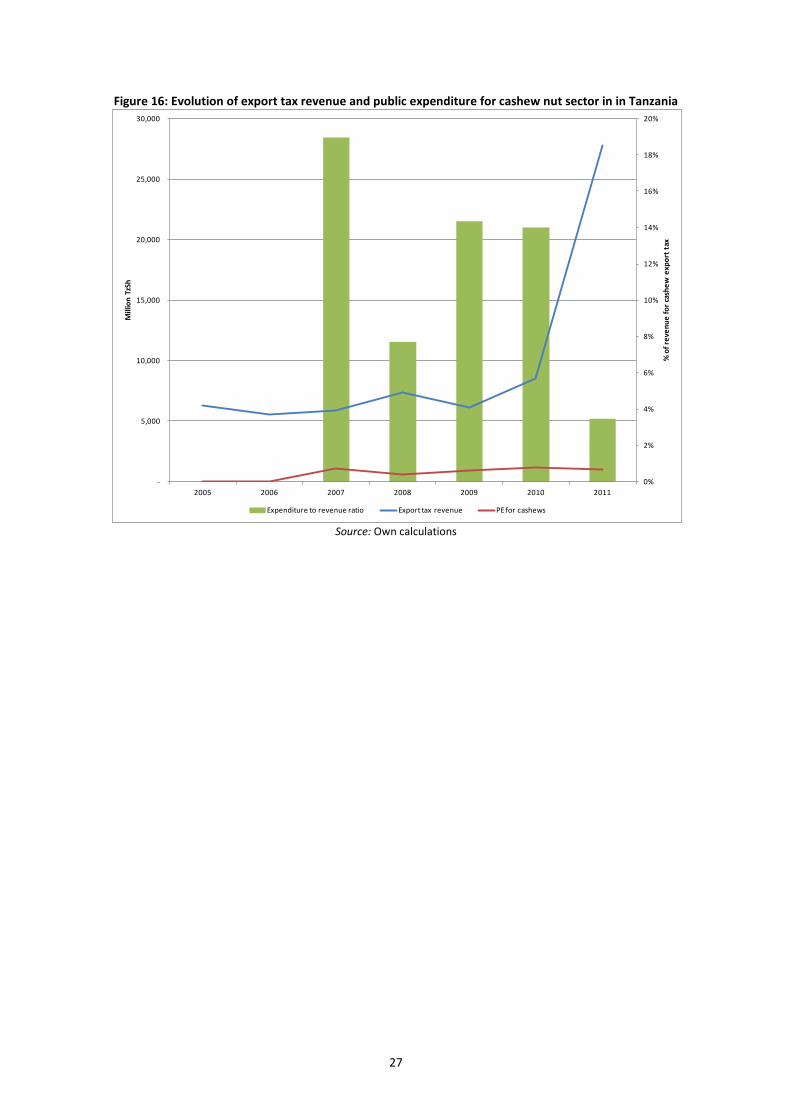
Figure 16: Evolution of export tax revenue and public expenditure for cashew nut sector in in Tanzania
Source: Own calculations
0%
2%
4%
6%
8%
10%
12%
14%
16%
18%
20%
-
5,000
10,000
15,000
20,000
25,000
30,000
2005 2006 2007 2008 2009 2010 2011
% o
f rev
enue
for c
ashe
w e
xpor
t tax
Mill
ion
TzSh
Expenditure to revenue ratio Export tax revenue PE for cashews
27

5. PRELIMINARY CONCLUSIONS AND RECOMMENDATIONS
MAIN MESSAGE Cashew nut growers in URT are disincentivized, thus they are receiving a lower price than that
they would in the absence of policy measures and well functioning value chains. The main driving force of the disincentives is the export tax on raw cashews.
The shift towards a centralized auction and warehouse receipt system has increased the disincentives to farmers, rather than getting farm gate prices closer to the export prices it seems it has induced higher transaction costs.
The increase of the export tax from 10 percent to 15 percent of FOB value to promote in country
processing has had limited effectiveness in the first two years of implementation.
The revenue of the export tax on cashew nuts reverts only marginally on the sector.
PRELIMINARY RECOMMENDATIONS Reduce the export tax and monitor the evolution of the indicators to see whether farmers get
higher prices. Consider alternative policy instruments to promote the processing of cashew nuts in URT. Provide additional support to the warehouse receipt system functioning to assure it delivers the
expected results.
LIMITATIONS The analysis is contingent on the quality of the data. Some years we observe positive price gaps for producers and wholesalers which would mean that part of the exports are made at a loss.
FURTHER INVESTIGATION AND RESEARCH Further analyze the structure of incentives and disincentives for processed cashew nuts to see how policy and value chain influences the performance of the processing sector and better understand why the increase on export tax for raw cashew nuts is not delivering the expected results.
28

BIBLIOGRAPHY EciAfrica (2003). Tanzania cashew nut sub-sector study. Development Alternatives Inc (DAI), Private Enterprise Support Activities Project Tanzania (PESA). Mitchell, D. and Baregu, M. (2012). The Tanzania cashew sector: why market reforms were not sustained. In Ataman-Sakoy (ed) African Agricultural Reforms: The Role of Consensus and Institutions. World Bank, Washington DC. Temu, A.; Manyama, A.; Temu, A. (2010). Maize trade and policy interventions in Tanzania. In Sarris and Morris (eds.) Food security in Africa. Market and trade policy for staple foods in Eastern and Southern Africa. FAO and Edward Elgar: 317-353. UNIDO (2011). Tanzania’s cashew value chain: a diagnostic. African Agribusiness and Agro-Industries Development Initiative. UNIDO, Vienna, Austria.
29

ANNEX I: Methodology Used A guide to the methodology used by MAFAP can be downloaded from the MAFAP website or by clicking here.
30

ANNEX II: Data and calculations used in the analysisYear 2005 2006 2007 2008 2009 2010 2011
DATA Unit Symbol trade status x x x x x x xBenchmark Price
1 Observed USD/TON Pb(int$) 790 670 679 813 715 960 1,063 1b Adjusted USD/TON Pba
Exchange Rate2 Observed TzSh/USD ERo 1,129 1,252 1,245 1,196 1,320 1,409 1,535
2b Adjusted TzSh/USD ERa
Access costs border - point of competition3 Observed TzSH/TON ACowh 68,161 71,985 69,616 87,122 87,442 114,652 168,317
3b Adjusted TzSH/TON ACawh 53,373 54,398 50,897 67,286 62,892 86,823 125,562 4 Domestic price at point of competition TzSH/TON Pdwh 866,667 796,667 1,076,000 1,728,000
Access costs point of competition - farm gate5 Observed TzSH/TON ACofg 122,119 125,556 120,500 263,500 317,000 319,000 316,250
5b Adjusted TzSH/TON ACafg 90,963 91,945 90,500 202,500 249,500 249,000 236,250 6 Farm gate price TzSH/TON Pdfg 623,130 672,225 600,000 610,000 675,000 700,000 800,000 7 Externalities associated w ith production TzSH/TON E8 Budget and other product related transfers TzSH/TON BOT - - 11,993 5,731 11,029 15,859 7,961
Quantity conversion factor (border - point of competition) Fraction QTwh
Quality conversion factor (border - point of competition) Fraction QLwh
Quantity conversion factor (point of competition - farm gate) Fraction QTfg
Quality conversion factor (point of competition - farm gate) Fraction QLfg
FG as % FOB 0.70 0.80 0.71 0.63 0.71 0.52 0.49 PG as % FOB (0.09) 0.04 (0.07) (0.01) 0.14 (0.16) (0.21)
CALCULATED PRICES Unit Symbol 2005 2006 2007 2008 2009 2010 2011Benchmark price in local currency
9 Observed TzSH/TON Pb(loc$) 892,374 838,773 845,782 972,401 944,610 1,352,962 1,631,458 10 Adjusted TzSH/TON Pb(loc$)a 892,374 838,773 845,782 972,401 944,610 1,352,962 1,631,458
Reference Price at point of competition11 Observed TzSH/TON RPowh 824,213 766,788 776,165 885,279 857,168 1,238,310 1,463,142 12 Adjusted TzSH/TON RPawh 839,001 784,375 794,885 905,115 881,718 1,266,139 1,505,896
Reference Price at Farm Gate 13 Observed TzSH/TON RPofg 702,094 641,232 655,665 621,779 540,168 919,310 1,146,892 14 Adjusted TzSH/TON RPafg 748,038 692,431 704,385 702,615 632,218 1,017,139 1,269,646
-2% -6% -12% 16%
INDICATORS Unit Symbol 2005 2006 2007 2008 2009 2010 2011Price gap at point of competition
15 Observed TzSH/TON PGowh (18,613) (60,502) (162,310) 264,858 16 Adjusted TzSH/TON PGawh (38,448) (85,052) (190,139) 222,104
Price gap at farm gate17 Observed TzSH/TON PGofg (78,964) 30,993 (55,665) (11,779) 134,832 (219,310) (346,892) 18 Adjusted TzSH/TON PGafg (124,908) (20,206) (104,385) (92,615) 42,782 (317,139) (469,646)
Nominal rate of protection at point of competition19 Observed % NRPowh -2% -7% -13% 18%20 Adjusted % NRPawh -4% -10% -15% 15%
Nominal rate of protection at farm gate21 Observed % NRPofg -11% 5% -8% -2% 25% -24% -30%22 Adjusted % NRPafg -17% -3% -15% -13% 7% -31% -37%
Nominal rate of assistance23 Observed % NRAo -11% 5% -7% -1% 27% -22% -30%24 Adjusted % NRAa -17% -3% -13% -12% 9% -30% -36%
Decomposition of PWAfg Unit Symbol 2005 2006 2007 2008 2009 2010 201125 International markets gap TzSH/TON IRG - - - - - - - 26 Exchange policy gap TzSH/TON ERPG - - - - - - - 27 Access costs gap to point of competition TzSH/TON ACGwh (14,788) (17,587) (18,720) (19,836) (24,550) (27,829) (42,754) ([3b]-[3])28 Access costs gap to farm gate TzSH/TON ACGfg (31,157) (33,611) (30,000) (61,000) (67,500) (70,000) (80,000) [5b]-[5]29 Externality gap TzSH/TON EG - - - - - - -
Market Development Gap TzSH/TON MDG (45,944) (51,199) (48,720) (80,836) (92,050) (97,829) (122,754) [25]+[26]+[27]+[28]+[29]Market Development Gap % MDG -6% -7% -7% -12% -15% -10% -10% MDG/RPafg
([17]+[8])/[13]([18]+[8])/[14]
Formula
[15]/[11][16]/[12]
[17]/[13][18]/[14]
[4]-[12]
[6]-[13][6]-[14]
[11]-[5][12]-[5b]
Formula
[4]-[11]
[1]*[2]
[9]-[3][10]-[3b]
Formula
[1]*[2]
FG NBS [Q3-Q2] / CBT as of 2007
From PE Analysis
Auction price as of 2007 (minimum plus 1/3 of differenc
CBT access cost to Auction (marketing fees) / Transpo Minus district cess
IMF
Port costs at Mtw ara (50% of adjused Dar)
Notes
Highest FOB cashew in shell COMTRADE / TRA
31
