analysis of incentives and disincentives
TRANSCRIPT
ANALYSIS OF INCENTIVES AND DISINCENTIVES FOR WHEAT IN ETHIOPIA
Draft version
APRIL 2013
This technical note is a product of the Monitoring African Food and Agricultural Policies project (MAFAP). It is a technical document intended primarily for internal use as background for the eventual MAFAP Country Report. This technical note may be updated as new data becomes available.
MAFAP is implemented by the Food and Agriculture Organization of the United Nations (FAO) in collaboration with the Organisation for Economic Co-operation and Development (OECD) and national partners in participating countries. It is financially supported by the Bill and Melinda Gates Foundation, the United States Agency for International Development (USAID), and FAO.
The analysis presented in this document is the result of the partnerships established in the context of the MAFAP project with governments of participating countries and a variety of national institutions.
For more information: www.fao.org/mafap
Suggested citation:
Demeke M., Di Marcantonio F., 2013. Analysis of incentives and disincentives for wheat in Ethiopia. Technical notes series, MAFAP, FAO, Rome.
© FAO 2013
FAO encourages the use, reproduction and dissemination of material in this information product. Except where otherwise indicated, material may be copied, downloaded and printed for private study, research and teaching purposes, or for use in non-commercial products or services, provided that appropriate acknowledgement of FAO as the source and copyright holder is given and that FAO’s endorsement of users’ views, products or services is not implied in any way.
All requests for translation and adaptation rights, and for resale and other commercial use rights should be made via www.fao.org/contact-us/licence-request or addressed to [email protected].
FAO information products are available on the FAO website (www.fao.org/publications) and can be purchased through [email protected].
2
SUMMARY OF THE NOTE Product: Wheat Period analyzed: 2005 – 2010 Trade status: Import in all years Wheat accounts for the fourth largest share of total cereal production. Ethiopia is the second largest wheat producer in sub-Saharan Africa, after South Africa Area under wheat cultivation expanded from 1.40 million ha in 2004/05 to 1.55 million in
2010/11 Wheat accounted for about 13 percent of the per capita calorie intake in 2004/05. Wheat is the single most important staple imported from abroad Most of the humanitarian food aid and commercial import takes the form of wheat. The whet value chain is very long and involves too many small operators.
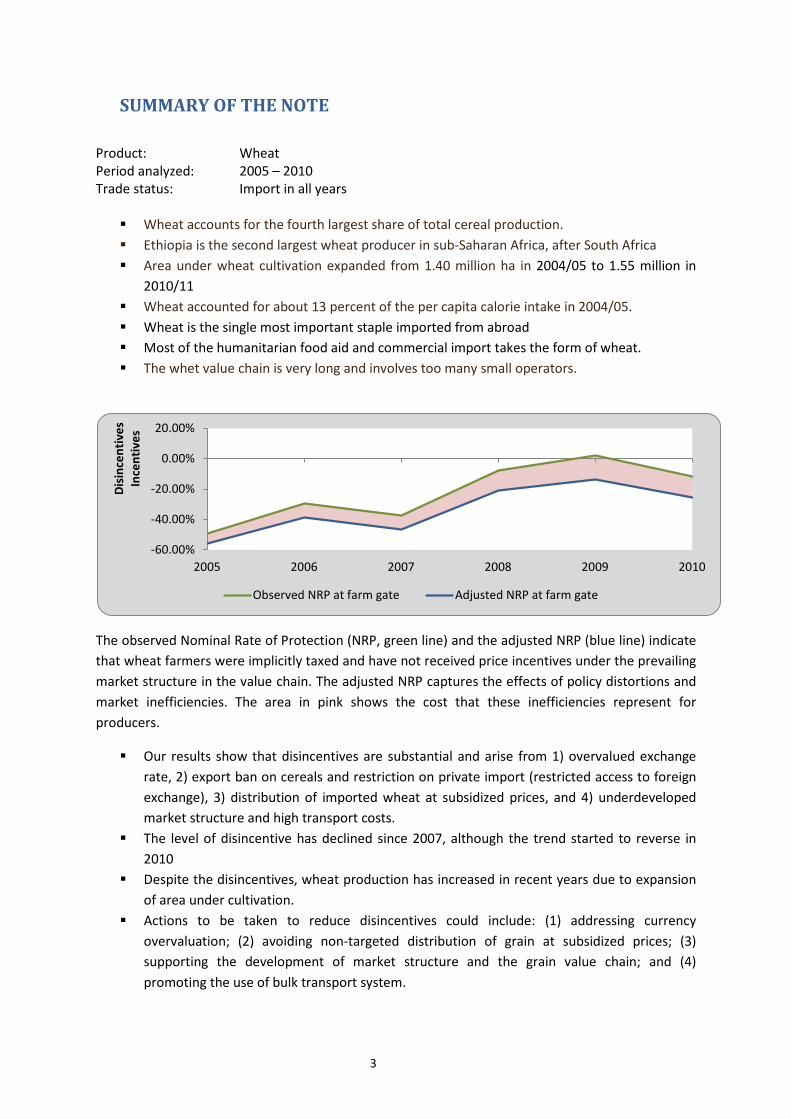
The observed Nominal Rate of Protection (NRP, green line) and the adjusted NRP (blue line) indicate that wheat farmers were implicitly taxed and have not received price incentives under the prevailing market structure in the value chain. The adjusted NRP captures the effects of policy distortions and market inefficiencies. The area in pink shows the cost that these inefficiencies represent for producers.
Our results show that disincentives are substantial and arise from 1) overvalued exchange rate, 2) export ban on cereals and restriction on private import (restricted access to foreign exchange), 3) distribution of imported wheat at subsidized prices, and 4) underdeveloped market structure and high transport costs.
The level of disincentive has declined since 2007, although the trend started to reverse in 2010
Despite the disincentives, wheat production has increased in recent years due to expansion of area under cultivation.
Actions to be taken to reduce disincentives could include: (1) addressing currency overvaluation; (2) avoiding non-targeted distribution of grain at subsidized prices; (3) supporting the development of market structure and the grain value chain; and (4) promoting the use of bulk transport system.
-60.00%
-40.00%
-20.00%
0.00%
20.00%
2005 2006 2007 2008 2009 2010
Disi
ncen
tives
Ince
ntiv
es
Observed NRP at farm gate Adjusted NRP at farm gate
3
1. CONTENTS
1. PURPOSE OF THE NOTE ................................................................................................................... 5
2. POLICY CONTEXT ............................................................................................................................. 6
Production ........................................................................................................................................... 6
Consumption ....................................................................................................................................... 8
Marketing and Trade ........................................................................................................................ 10
Description of the Value Chain and Processing ................................................................................ 13
Policy Decisions and Measures ......................................................................................................... 15
3. DATA REQUIREMENTS, DESCRIPTION AND CALCULATION OF INDICATORS ................................ 17
4. INTERPRETATION OF THE INDICATORS ......................................................................................... 27
5. PRELIMINARY CONCLUSIONS AND RECOMMENDATIONS ............................................................ 30
BIBILIOGRAPHY ..................................................................................................................................... 32
ANNEX I: Methodology Used ................................................................................................................ 35
ANNEX II: Data and calculations used in the analysis ........................................................................... 36
4
1. PURPOSE OF THE NOTEThis technical note aims to describe the market incentives and disincentives for wheat in Ethiopia.
For this purpose, yearly averages of farm gate and wholesale prices are compared with reference prices calculated on the basis of the price of the commodity in the international market. The price gaps between the reference prices and the prices along the value chain indicate to which extent incentives (positive gaps) or disincentives (negative gaps) are present at farm gate and wholesale level. In relative terms, the price gaps are expressed as Nominal Rates of Protection. These key indicators are used by MAFAP to highlight the effects of policy and market development gaps on prices.
The note starts with a brief review of the production, consumption, trade and policies affecting the commodity and then provides a detailed description of how the key components of the price analysis have been obtained. The MAFAP indicators are then calculated with these data and interpreted in the light of existing policies and market characteristics. The analysis that has been carried out is commodity and country specific and covers the period 2005-2010. The indicators have been calculated using available data from different sources for this period and are described in Chapter 3.
The outcomes of this analysis can be used by those stakeholders involved in policy-making for the food and agricultural sector. They can also serve as input for evidence-based policy dialogue at country or regional level.
This technical note is not to be interpreted as an analysis of the value chain or detailed description of production, consumption or trade patterns. All information related to these areas is presented merely to provide background on the commodity under review, help understand major trends and facilitate the interpretation of the indicators.
All information is preliminary and still subject to review and validation.
5

2. POLICY CONTEXT Ethiopia is the second largest wheat producer in sub-Saharan Africa, after South Africa. Although most of the wheat grown in Ethiopia is bread wheat, there is some durum wheat which is often grown mixed with bread wheat.
Wheat is among the most important crops in Ethiopia, ranking fourth in total cereals production (16 per cent) next to maize, sorghum and teff (CSA, 2009). It is grown as a staple food in the highlands at altitudes ranging from 1500 to 3000 masl. Nearly all wheat in country is produced under rain-fed conditions predominantly by small farmers. A few government owned large-scale (state) farms and commercial farms also produce wheat. Despite the recent expansion, Ethiopia falls short of being self-sufficient in wheat production, and is currently a net importer of wheat grain.
Production Wheat ranks fourth in terms of area production and yield among food crops (Table 1). Production of wheat increased from 2.2 (000 T) in 2004/2005 (CSA, 1998) to 2.8 (000 t) in 2010/2011 (CSA, 2000) an increase of 31 per cent. However, the share of wheat in total cereal area decreased (-12.4 percent) over the same period, mainly due to a shift in cropping patterns towards sorghum (Table 1). Wheat yield in Ethiopia is also lagging behind other major producers in Africa: average yield was 1.68 t ha−1 during the same period, about 32 per cent and 39 per cent below Kenyan and South African averages, respectively (FAOSTAT). The apparent low productivity can be attributed to several factors, including slow progress in developing wheat cultivars with durable resistance to diseases, and depleted soil fertility.
Table 1: Cereals area, production, yield and annual change (smallholder farms, Meher season), 2004/05-2010/11 2004/2005 2010/2011 Expansion rate
Area 000 ha
Productio
n 000 tonn
es
Yield (tonnes/ha)
Share in
Total Cereals
Area (%)
Area 000 ha
Production 000
tonnes
Yield (tonnes/ha)
Share in
Total Cereals Area
(%)
Area 000 ha
Production 000
tonnes
Yield (Tonnes/ha
)
Share in
Total Cerea
ls Area (%)
Grain 9811 1190
11823 20349 20.5 70.9
Cereals 7638 1003
9691 17761 26.9 77.1
Teff 2136 2026 0.95 28.0 2761 3483 1.26 28.5 29.3 72.0 33.0 1.9
Barley 1095 1328 1.21 14.3 1047 1703 1.63 10.8 -4.5 28.3 34.2 -24.7
Wheat 1398 2177 1.56 18.3 1553 2856 1.84 16.0 11.1 31.2 18.1 -12.4
Maize 1393 2394 1.72 18.2 1963 4986 2.54 20.3 40.9 108.3 47.8 11.1
Sorghum 1254 1716 1.37 16.4 1898 3960 2.09 19.6 51.4 130.8 52.4 19.3
Finger millet 313 333 1.06 4.1 408 635 1.56 4.2 30.4 90.8 46.3 2.8
Oats / ‘Aja’ 45 57 1.26 0.6 31 48 1.54 0.3 -31.6 -16.1 22.7 -46.1
Rice - - - - 30 90 3.03 0.3 - - - -
Source: Author’s computation using CSA data *Total Area cultivated and total production include: Grain, Vegetables, root crops, Fruit crops, Chat, Coffee and
Hops Climatic characterization of the existing wheat zone indicated that precipitation and minimum temperature during the three consecutive wettest months were the key determinants of potential
6
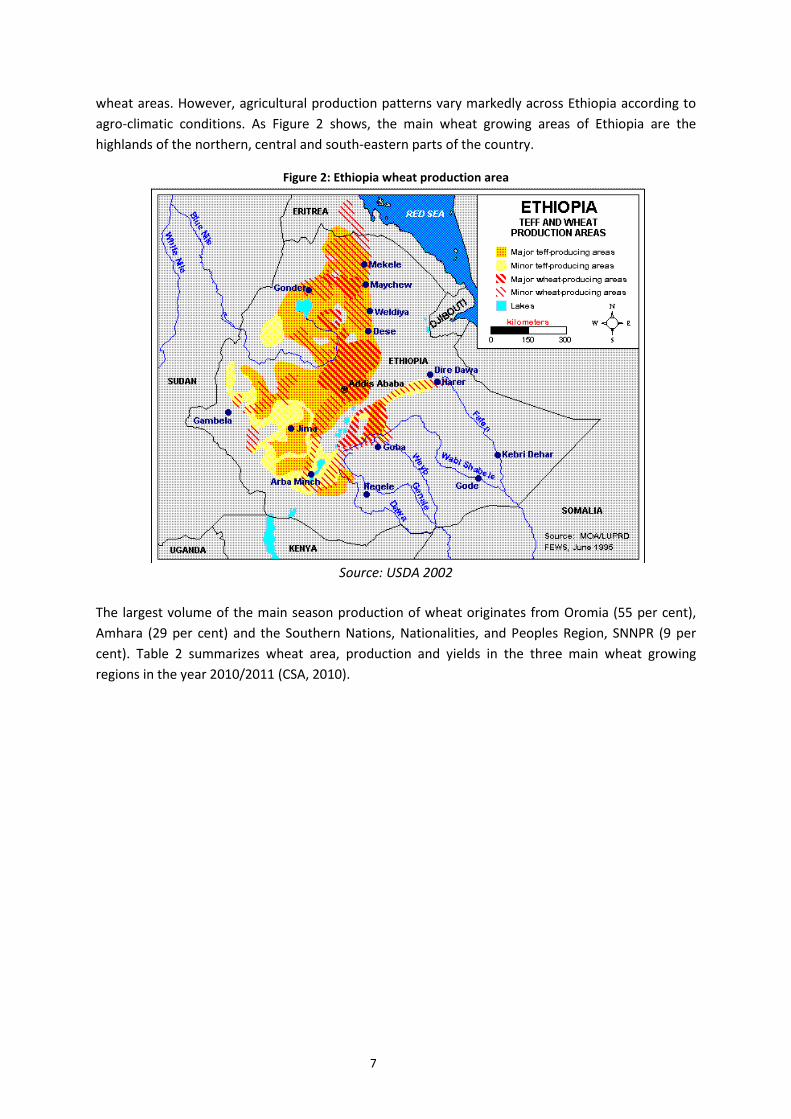
wheat areas. However, agricultural production patterns vary markedly across Ethiopia according to agro-climatic conditions. As Figure 2 shows, the main wheat growing areas of Ethiopia are the highlands of the northern, central and south-eastern parts of the country.
Figure 2: Ethiopia wheat production area
Source: USDA 2002
The largest volume of the main season production of wheat originates from Oromia (55 per cent), Amhara (29 per cent) and the Southern Nations, Nationalities, and Peoples Region, SNNPR (9 per cent). Table 2 summarizes wheat area, production and yields in the three main wheat growing regions in the year 2010/2011 (CSA, 2010).
7
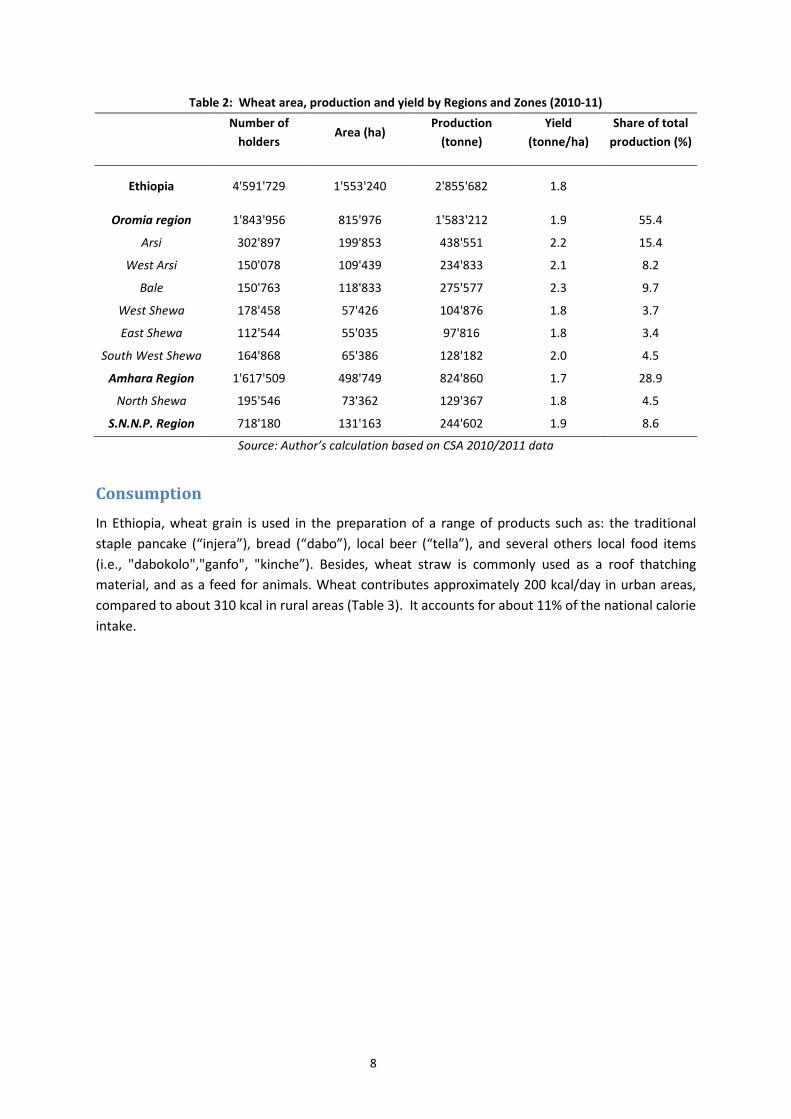
Table 2: Wheat area, production and yield by Regions and Zones (2010-11) Number of
holders Area (ha)
Production (tonne)
Yield (tonne/ha)
Share of total production (%)
Ethiopia 4'591'729 1'553'240 2'855'682 1.8
Oromia region 1'843'956 815'976 1'583'212 1.9 55.4
Arsi 302'897 199'853 438'551 2.2 15.4
West Arsi 150'078 109'439 234'833 2.1 8.2
Bale 150'763 118'833 275'577 2.3 9.7
West Shewa 178'458 57'426 104'876 1.8 3.7
East Shewa 112'544 55'035 97'816 1.8 3.4
South West Shewa 164'868 65'386 128'182 2.0 4.5
Amhara Region 1'617'509 498'749 824'860 1.7 28.9
North Shewa 195'546 73'362 129'367 1.8 4.5
S.N.N.P. Region 718'180 131'163 244'602 1.9 8.6
Source: Author’s calculation based on CSA 2010/2011 data
Consumption In Ethiopia, wheat grain is used in the preparation of a range of products such as: the traditional staple pancake (“injera”), bread (“dabo”), local beer (“tella”), and several others local food items (i.e., "dabokolo","ganfo", "kinche”). Besides, wheat straw is commonly used as a roof thatching material, and as a feed for animals. Wheat contributes approximately 200 kcal/day in urban areas, compared to about 310 kcal in rural areas (Table 3). It accounts for about 11% of the national calorie intake.
8
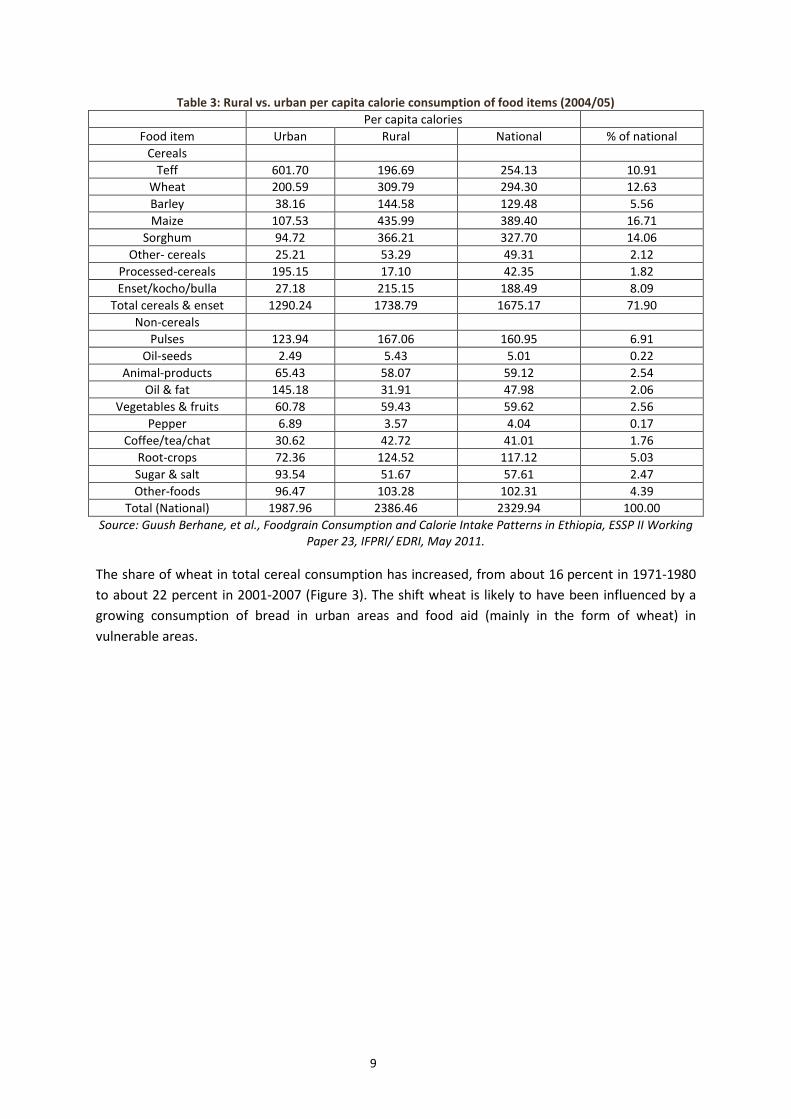
Table 3: Rural vs. urban per capita calorie consumption of food items (2004/05) Per capita calories
Food item Urban Rural National % of national Cereals
Teff 601.70 196.69 254.13 10.91 Wheat 200.59 309.79 294.30 12.63 Barley 38.16 144.58 129.48 5.56 Maize 107.53 435.99 389.40 16.71
Sorghum 94.72 366.21 327.70 14.06 Other- cereals 25.21 53.29 49.31 2.12
Processed-cereals 195.15 17.10 42.35 1.82 Enset/kocho/bulla 27.18 215.15 188.49 8.09
Total cereals & enset 1290.24 1738.79 1675.17 71.90 Non-cereals
Pulses 123.94 167.06 160.95 6.91 Oil-seeds 2.49 5.43 5.01 0.22
Animal-products 65.43 58.07 59.12 2.54 Oil & fat 145.18 31.91 47.98 2.06
Vegetables & fruits 60.78 59.43 59.62 2.56 Pepper 6.89 3.57 4.04 0.17
Coffee/tea/chat 30.62 42.72 41.01 1.76 Root-crops 72.36 124.52 117.12 5.03 Sugar & salt 93.54 51.67 57.61 2.47 Other-foods 96.47 103.28 102.31 4.39
Total (National) 1987.96 2386.46 2329.94 100.00 Source: Guush Berhane, et al., Foodgrain Consumption and Calorie Intake Patterns in Ethiopia, ESSP II Working
Paper 23, IFPRI/ EDRI, May 2011.
The share of wheat in total cereal consumption has increased, from about 16 percent in 1971-1980 to about 22 percent in 2001-2007 (Figure 3). The shift wheat is likely to have been influenced by a growing consumption of bread in urban areas and food aid (mainly in the form of wheat) in vulnerable areas.
9
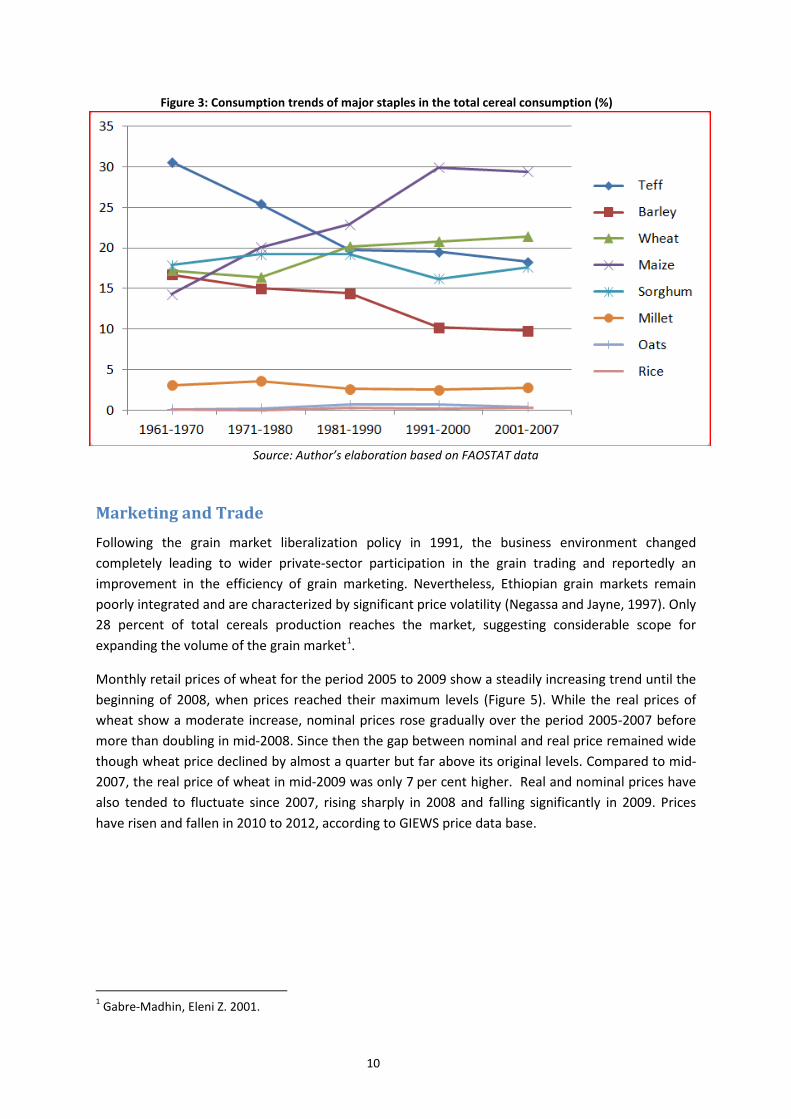
Figure 3: Consumption trends of major staples in the total cereal consumption (%)
Source: Author’s elaboration based on FAOSTAT data
Marketing and Trade Following the grain market liberalization policy in 1991, the business environment changed completely leading to wider private-sector participation in the grain trading and reportedly an improvement in the efficiency of grain marketing. Nevertheless, Ethiopian grain markets remain poorly integrated and are characterized by significant price volatility (Negassa and Jayne, 1997). Only 28 percent of total cereals production reaches the market, suggesting considerable scope for expanding the volume of the grain market1.
Monthly retail prices of wheat for the period 2005 to 2009 show a steadily increasing trend until the beginning of 2008, when prices reached their maximum levels (Figure 5). While the real prices of wheat show a moderate increase, nominal prices rose gradually over the period 2005-2007 before more than doubling in mid-2008. Since then the gap between nominal and real price remained wide though wheat price declined by almost a quarter but far above its original levels. Compared to mid-2007, the real price of wheat in mid-2009 was only 7 per cent higher. Real and nominal prices have also tended to fluctuate since 2007, rising sharply in 2008 and falling significantly in 2009. Prices have risen and fallen in 2010 to 2012, according to GIEWS price data base.
1 Gabre-Madhin, Eleni Z. 2001.
10
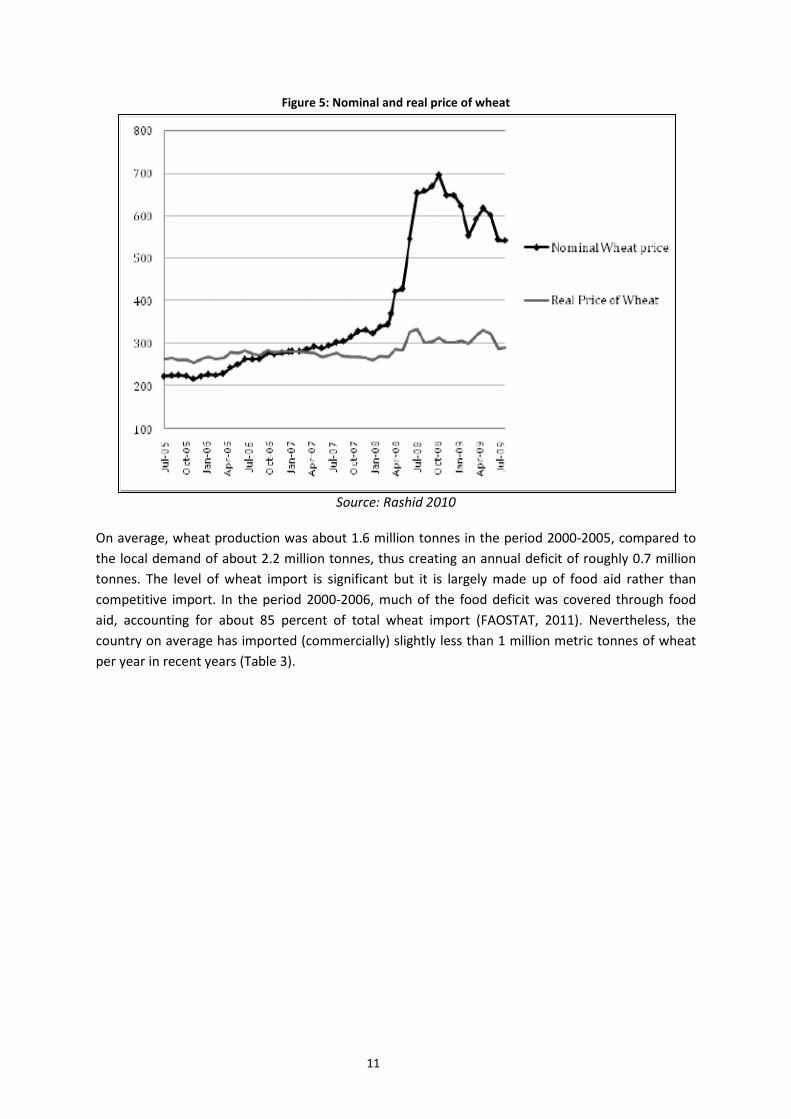
Figure 5: Nominal and real price of wheat
Source: Rashid 2010
On average, wheat production was about 1.6 million tonnes in the period 2000-2005, compared to the local demand of about 2.2 million tonnes, thus creating an annual deficit of roughly 0.7 million tonnes. The level of wheat import is significant but it is largely made up of food aid rather than competitive import. In the period 2000-2006, much of the food deficit was covered through food aid, accounting for about 85 percent of total wheat import (FAOSTAT, 2011). Nevertheless, the country on average has imported (commercially) slightly less than 1 million metric tonnes of wheat per year in recent years (Table 3).
11
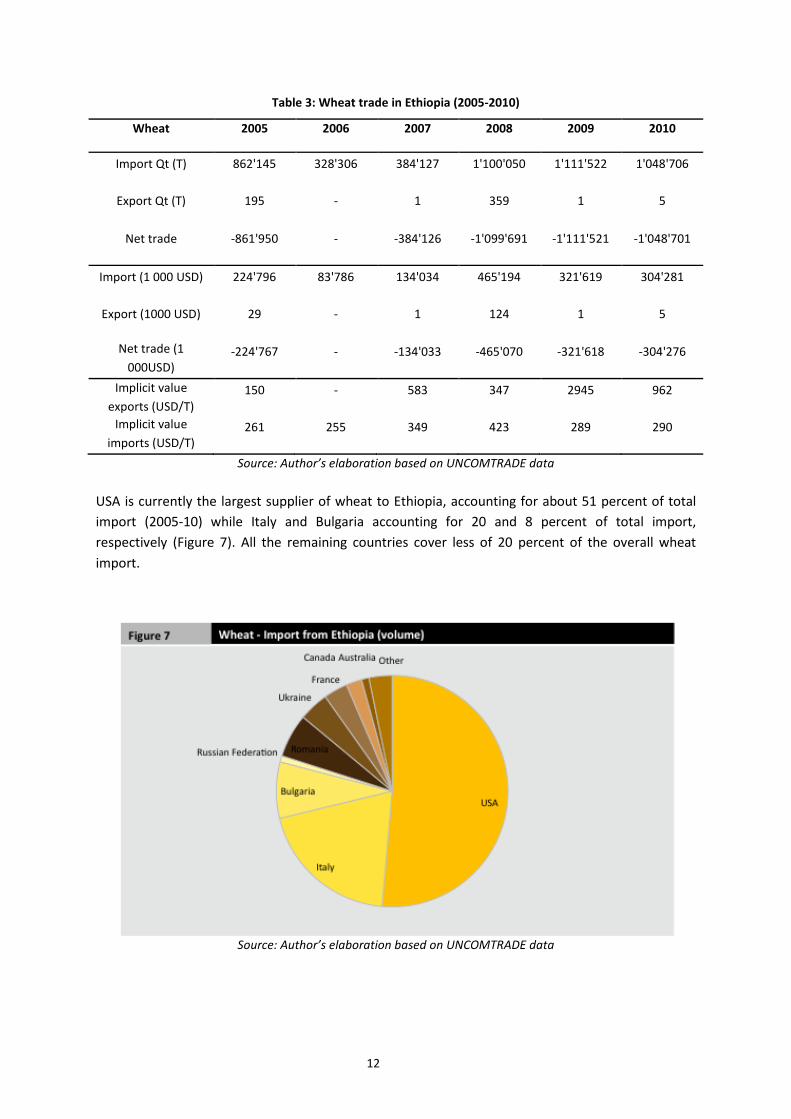
Table 3: Wheat trade in Ethiopia (2005-2010)
Wheat 2005 2006 2007 2008 2009 2010
Import Qt (T) 862'145 328'306 384'127 1'100'050 1'111'522 1'048'706
Export Qt (T) 195 - 1 359 1 5
Net trade -861'950 - -384'126 -1'099'691 -1'111'521 -1'048'701
Import (1 000 USD) 224'796 83'786 134'034 465'194 321'619 304'281
Export (1000 USD) 29 - 1 124 1 5
Net trade (1 000USD)
-224'767 - -134'033 -465'070 -321'618 -304'276
Implicit value exports (USD/T)
150 - 583 347 2945 962
Implicit value imports (USD/T)
261 255 349 423 289 290
Source: Author’s elaboration based on UNCOMTRADE data
USA is currently the largest supplier of wheat to Ethiopia, accounting for about 51 percent of total import (2005-10) while Italy and Bulgaria accounting for 20 and 8 percent of total import, respectively (Figure 7). All the remaining countries cover less of 20 percent of the overall wheat import.
Source: Author’s elaboration based on UNCOMTRADE data
12
Description of the Value Chain and Processing The grain marketing chain in Ethiopia is relatively short, primarily due to the low level of commercial grain processing and a lack of specialization of grain wholesalers, who are often engaged in retail and other types of trade (Walker and Wandschneider, 2005).
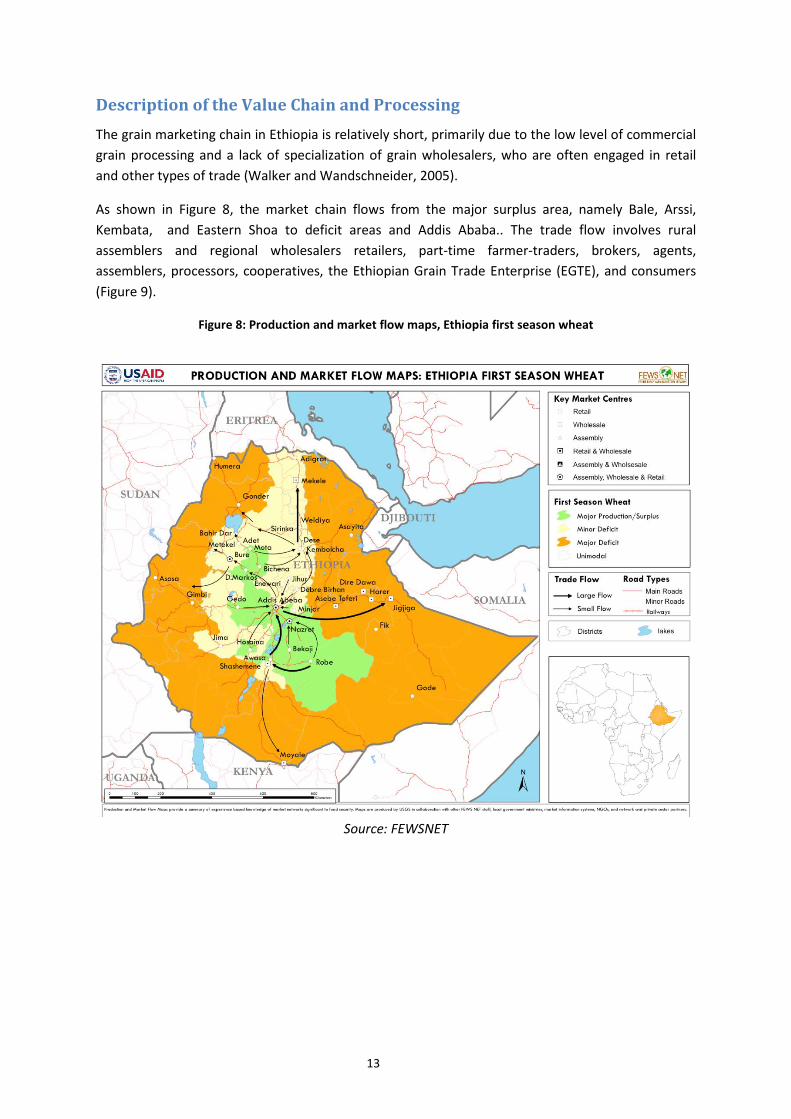
As shown in Figure 8, the market chain flows from the major surplus area, namely Bale, Arssi, Kembata, and Eastern Shoa to deficit areas and Addis Ababa.. The trade flow involves rural assemblers and regional wholesalers retailers, part-time farmer-traders, brokers, agents, assemblers, processors, cooperatives, the Ethiopian Grain Trade Enterprise (EGTE), and consumers (Figure 9).
Figure 8: Production and market flow maps, Ethiopia first season wheat
Source: FEWSNET
13
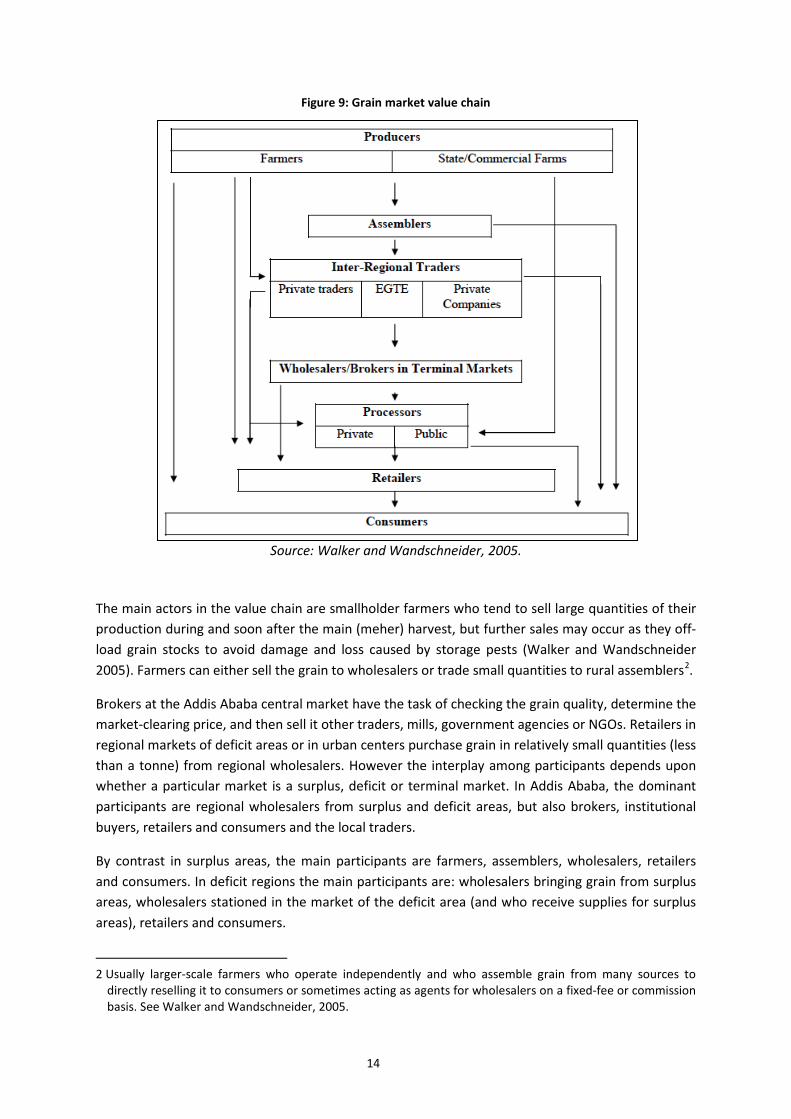
Figure 9: Grain market value chain
Source: Walker and Wandschneider, 2005.
The main actors in the value chain are smallholder farmers who tend to sell large quantities of their production during and soon after the main (meher) harvest, but further sales may occur as they off-load grain stocks to avoid damage and loss caused by storage pests (Walker and Wandschneider 2005). Farmers can either sell the grain to wholesalers or trade small quantities to rural assemblers2.
Brokers at the Addis Ababa central market have the task of checking the grain quality, determine the market-clearing price, and then sell it other traders, mills, government agencies or NGOs. Retailers in regional markets of deficit areas or in urban centers purchase grain in relatively small quantities (less than a tonne) from regional wholesalers. However the interplay among participants depends upon whether a particular market is a surplus, deficit or terminal market. In Addis Ababa, the dominant participants are regional wholesalers from surplus and deficit areas, but also brokers, institutional buyers, retailers and consumers and the local traders.
By contrast in surplus areas, the main participants are farmers, assemblers, wholesalers, retailers and consumers. In deficit regions the main participants are: wholesalers bringing grain from surplus areas, wholesalers stationed in the market of the deficit area (and who receive supplies for surplus areas), retailers and consumers.
2 Usually larger-scale farmers who operate independently and who assemble grain from many sources to directly reselling it to consumers or sometimes acting as agents for wholesalers on a fixed-fee or commission basis. See Walker and Wandschneider, 2005.
14
Policy Decisions and Measures Following the overthrow of the former military Government and the introduction of policy reforms in 1992, the market for wheat, along with other cereals, has been liberalized. The wheat market is characterized by small scale private traders operating along with large scale public (EGTE) and private companies which tend to be very active during periods of shortages and local purchase for food aid distributions.
The Ethiopian Commodity Exchange (ECX) was established in 2008 to provide a marketplace where buyers and sells can come together to trade. The Exchange has plans to expand its operation from export crops (coffee, sesame and haricot beans) to food crops, including wheat, in the near future.
There is a relatively strong wheat research program in Ethiopia. In particular, the Ethiopian Institute of Agricultural Research has a long history of wheat breeding program. Several varieties have been disseminated to farmers since the inception of wheat research. However, a substantial gap exists between yields on research fields and on farmers’ fields. Among the major technical constraints are lack of disease resistant and high yielding varieties adapted to a range of environments and poor crop management practices. Wheat farmers and breeders are in a constant race against the rust diseases, as resistant varieties become susceptible to new rust races3.
The Agricultural Transformation Agency (ATA) has been established (2010) to enhance productivity and production of smallholder farmers and pastoralists as part of the current Five year (2011-15) Growth and Transformation Plan (GTP). The primary aim is to promote agricultural sector transformation by supporting existing structures of government. The Agency has identified its priority crops and wheat is one of the eight commodities identified (the others are teff, maize, barley, pulses, oilseeds, rice and livestock) for special support.
The role of food aid and subsidized sale of imported public stock
As already noted, despite the increase in production, the quantity of wheat import remains high. However, wheat import data for Ethiopia includes food aid, which averaged more than half a million tons in 2008 (Rashid, 2010). Ethiopia is one of the largest recipient of food aid in Africa, receiving 27% of the global food aid to sub-Saharan Africa (Bezu and Holden, 2008)4. Government wheat import (through EGTE) has also increased significantly in response to the 2008 high food prices. Wheat imported by the government is sold to poor consumers in urban areas at subsidized prices.
In 2008, EGTE and WFP imported 520 and 515 thousand tons of wheat and maize, respectively, in 2008 (Rashid 2010). Undoubtedly, one of the major drawbacks of food aid to rural markets is that it may affect market prices by reducing the amount of grain that recipient households may otherwise have purchased in the market (thus reducing demand), and by potential sales of food aid onto markets (thus increasing supplies). Subsidized sale of imported staple has a direct impact on producers as it lowers market prices.
3 See for instance: http://www.cimmyt.org/en/newsletter/511-2011/1008-resistant-wheats-and-ethiopian-farmers-battle-deadly-fungus
4 Bezu, S and Holden, S. (2008) “Can food-for-work encourage agricultural production?”, Food Policy 33( 6) : 541-549.
15
Some authors have highlighted that large quantities of food aid, if poorly targeted, could depress market prices and reduce the incentive to increase production (Jayne and Molla 1995; Molla et al.1997). Bezu and Holden (2008) showed that food for work relieved liquidity constraint in one of the most vulnerable areas of Ethiopia (Tigray) and thereby encouraged adoption of fertilizer. On the other hand, a more comprehensive empirical analysis of the link between food aid shipments and food prices in Ethiopia over the period 1996-2006 confirmed the existence of substantial food aid effects on local food prices in Ethiopia. The study showed that, on average, a 1% increase in annual per capita food aid reduces monthly price by as much as 5% and the impact is slightly stronger for a market in major surplus producing area (Markos) (Tadesse and Shively, 2009)5. Combined with the sale of imported public stock at subsidized price, the disincentive impact on producers can be substantial. The problem is particularly serious when food is poorly targeted or when food aid distribution is not related local production situations6.
Exchange rate policies
The exchange rate in Ethiopia is characterized by managed floating with strong Government control. The National Bank of Ethiopia is the sole provider of foreign exchange and only authorized banks and investors who are able to bid for at least USD 0.5 million are allowed to participate in the weekly foreign exchange auction. The marginal rate of each auction (once a week) serves as the official rate until a new rate is established in the next round (a week later). It is believed that the domestic currency (Birr) was overvalued, especially in 2008, 2009 and 2010. The extent of overvaluation was estimated at 40 percent during this period and the Government was forced to devalue Birr by 25 percent in September 2010 (Rashid, 2010)7. Another study (Dorosh, et al., 2009)8, showed that real exchange rate appreciated by 9.7, 12.8, 14.9 and 33.8, 26.3 percent in July 2005, July 2006, July 2007, July 2008 and June 2009, respectively. High rate of inflation (relative to the low inflation rate among its trading partners) and increasing pressure on foreign exchange reserve are among the major cause of currency appreciation in Ethiopia.
Between 2005 and 2008, inflation rates hit double digits and then declined to 8.5 and 7 percent in 2009 and 2010, respectively. In 2007 and 2008, the foreign currency reserve fell short of the critical requirement of 12 weeks worth of imports and the Government instituted foreign exchange rationing (Rashid, 2010). In March 2008, access to foreign exchange for imports was restricted (rationed) to curb excessive drawdown of foreign exchange reserve. It is assumed that the local currency was, on average, 20 percent overvalued during the period 2005- 2010 and the exchange rate has been adjusted accordingly in our calculation of adjusted reference prices. The adjustment factor approximates the depreciation of the local currency had a more liberal policy been pursued.
5 Tadesse, G. and G. Shively (2009), Food Aid, Food Prices, and Producer Disincentives in Ethiopia, American Journal of Agricultural Economics, 91 (4), November, 942-955.
6 For instance, Nunn and Qian (2011) found that the amount of food aid shipment to Africa is correlated with the level of surpluses in the donor countries (e.g. US and EU). Nunn, Nathan and Nancy Qian (2011) "Aiding Conflict: The Unintended Consequences of U.S. Food Aid on Civil War," Working Paper, Duke University 7 Rashid S. (2010). Staple food prices in Ethiopia, prepared for the COMESA policy seminar on “Variation in staple food prices: Causes, consequence, and policy options”, Maputo, Mozambique, 25-26 January 2010. 8 Dorosh P, S. Robinson and H. Ahmed (2009), Economic Implications of Foreign Exchange Rationing in Ethiopia, IFPRI/EDRI ESSP2 Discussion Paper 009.
16
3. DATA REQUIREMENTS, DESCRIPTION AND CALCULATION OFINDICATORS
Trade status of wheat
Though Ethiopia used to be a net exporter of wheat (Gorfu et all., 1996), low and declining level of production and productivity transformed the country into a net importer of wheat. Furthermore, the rapidly increasing population in conjunction with changing consumption pattern did not allow the country to meet the growing demand for food. As a result, the level of wheat self-sufficiency at the national level in Ethiopia is estimated at only 55 per cent, necessitating importation to fill the gap.
Benchmark prices
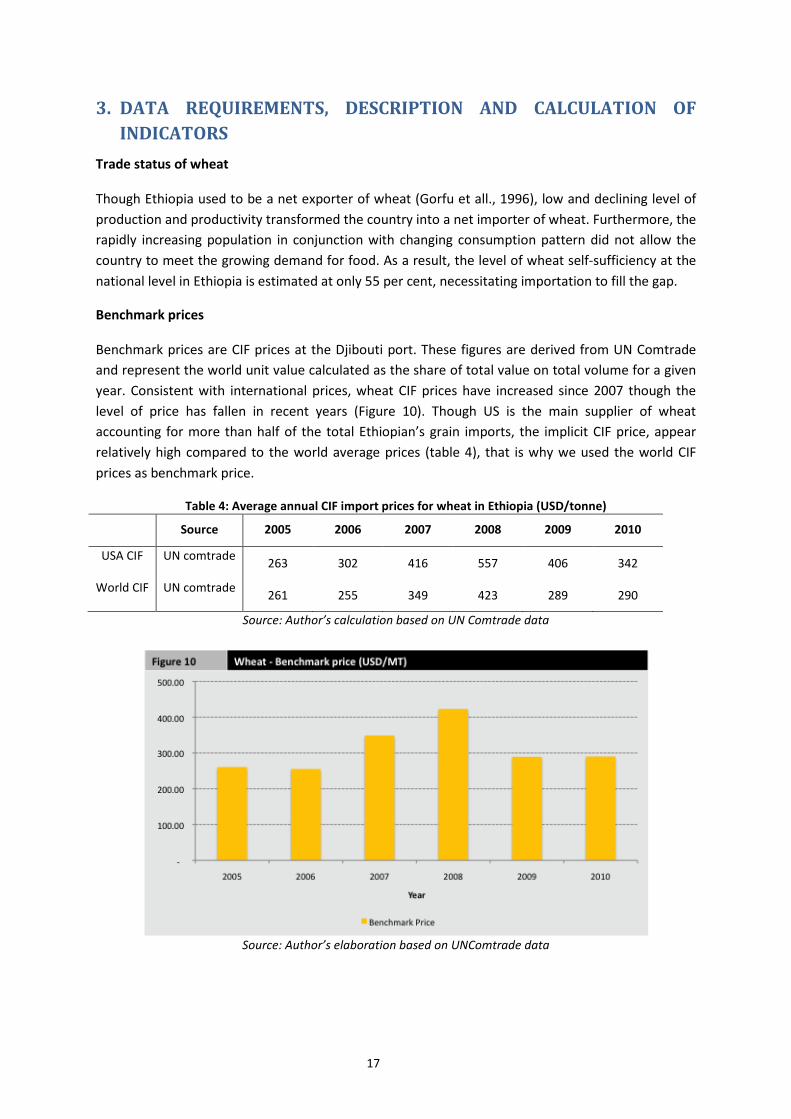
Benchmark prices are CIF prices at the Djibouti port. These figures are derived from UN Comtrade and represent the world unit value calculated as the share of total value on total volume for a given year. Consistent with international prices, wheat CIF prices have increased since 2007 though the level of price has fallen in recent years (Figure 10). Though US is the main supplier of wheat accounting for more than half of the total Ethiopian’s grain imports, the implicit CIF price, appear relatively high compared to the world average prices (table 4), that is why we used the world CIF prices as benchmark price.
Table 4: Average annual CIF import prices for wheat in Ethiopia (USD/tonne)
Source 2005 2006 2007 2008 2009 2010
USA CIF UN comtrade 263 302 416 557 406 342
World CIF UN comtrade 261 255 349 423 289 290
Source: Author’s calculation based on UN Comtrade data
Source: Author’s elaboration based on UNComtrade data
17

DOMESTIC PRICES
Observed
Domestic prices refer to both price at the point of competition and the farm gate price. Domestic price at the point of competition represent the price at the wholesale market where the domestic wheat produced competes with the imported wheat. In Ethiopia, the EGTE collects prices for Addis Ababa, which is considered the main central market, and several major markets in the country9. Addis Abeba is also considered the main point of competition for other main producing areas.
The average annual wholesale price of mixed wheat in Addis Ababa is considered as the wholesale price at the point of competition. As a proxy for farm gate price we used the wholesale price of white wheat in the rural market of Hossana.10 The Hossana price has been corrected for the price differences between mixed (generally fetches lower price) and white wheat (higher prices). On average, mixed wheat prices in Shashemene (one of the production area markets with both mixed and white wheat prices) is about 14 percent lower, hence the Hossana white wheat price has been reduced by 14% to arrive at mixed wheat price.
The second correction concerns the conversion of the Hossana wholesale to farm gate prices. Regional traders offer a lower price to farmers and assemblers in and around the Hossana market with the aim of either selling at a wholesale price in the Hossana market or transporting to Addis to sell at wholesale price in Addis Ababa. Their gross margin when selling in Hossana (at wholesale price) is assumed to be half of the estimated net margin obtained by selling in Addis. Therefore, we deducted this gross margin from the observed wholesale price in Hossana to arrive at the corresponding farm gate price (Table 5).
9 Monthly wholesale price data of major cereals, pulses and oilseeds are posted in EGTE’s website (http://egtemis.com/marketstat.asp).
10 Located at about 232 km south west of Addis, Hossana (Hosaena) represents one of the major wheat producing areas of Ethiopia. Assela is also located in one of the major wheat producing areas but there are no price data for Assela market. Nevertheless, traders in Addis were able to provide trading costs for Assela and these have been used to estimate marketing and transport costs for Hossana.
18
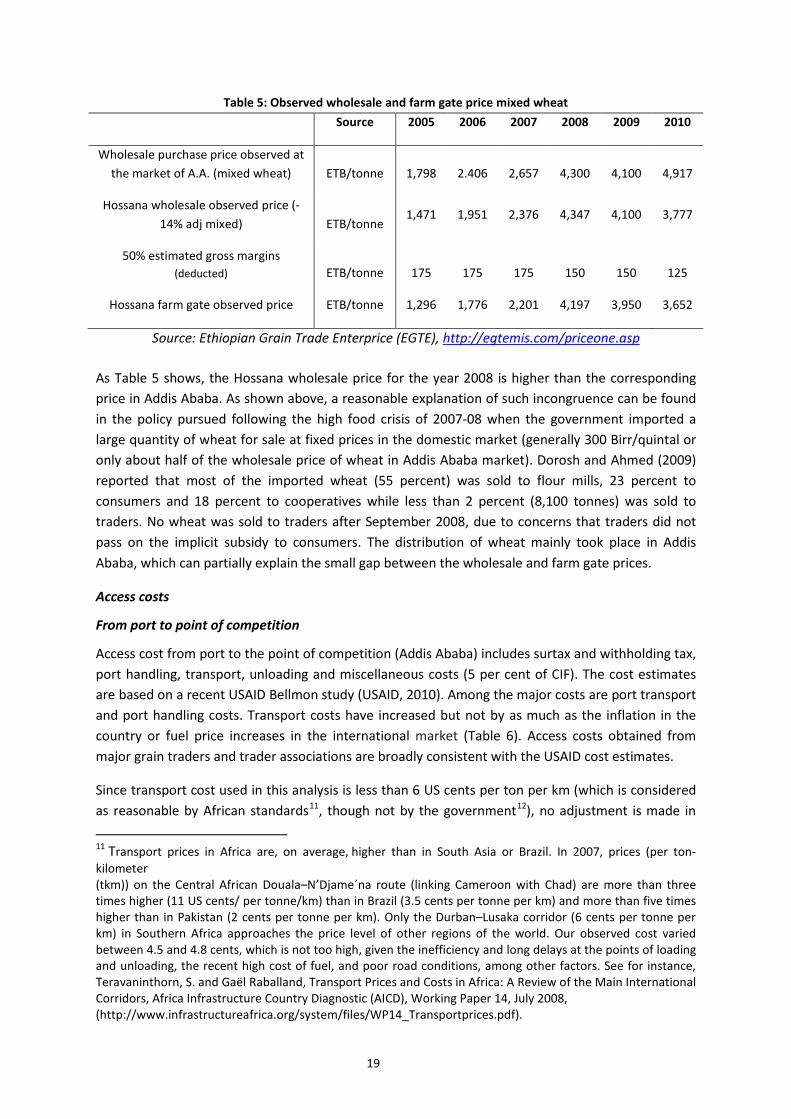
Table 5: Observed wholesale and farm gate price mixed wheat Source 2005 2006 2007 2008 2009 2010
Wholesale purchase price observed at the market of A.A. (mixed wheat) ETB/tonne 1,798 2.406 2,657 4,300 4,100 4,917
Hossana wholesale observed price (-14% adj mixed) ETB/tonne
1,471 1,951 2,376 4,347 4,100 3,777
50% estimated gross margins (deducted) ETB/tonne 175 175 175 150 150 125
Hossana farm gate observed price ETB/tonne 1,296 1,776 2,201 4,197 3,950 3,652
Source: Ethiopian Grain Trade Enterprice (EGTE), http://egtemis.com/priceone.asp
As Table 5 shows, the Hossana wholesale price for the year 2008 is higher than the corresponding price in Addis Ababa. As shown above, a reasonable explanation of such incongruence can be found in the policy pursued following the high food crisis of 2007-08 when the government imported a large quantity of wheat for sale at fixed prices in the domestic market (generally 300 Birr/quintal or only about half of the wholesale price of wheat in Addis Ababa market). Dorosh and Ahmed (2009) reported that most of the imported wheat (55 percent) was sold to flour mills, 23 percent to consumers and 18 percent to cooperatives while less than 2 percent (8,100 tonnes) was sold to traders. No wheat was sold to traders after September 2008, due to concerns that traders did not pass on the implicit subsidy to consumers. The distribution of wheat mainly took place in Addis Ababa, which can partially explain the small gap between the wholesale and farm gate prices.
Access costs
From port to point of competition
Access cost from port to the point of competition (Addis Ababa) includes surtax and withholding tax, port handling, transport, unloading and miscellaneous costs (5 per cent of CIF). The cost estimates are based on a recent USAID Bellmon study (USAID, 2010). Among the major costs are port transport and port handling costs. Transport costs have increased but not by as much as the inflation in the country or fuel price increases in the international market (Table 6). Access costs obtained from major grain traders and trader associations are broadly consistent with the USAID cost estimates.
Since transport cost used in this analysis is less than 6 US cents per ton per km (which is considered as reasonable by African standards11, though not by the government12), no adjustment is made in
11 Transport prices in Africa are, on average, higher than in South Asia or Brazil. In 2007, prices (per ton-kilometer (tkm)) on the Central African Douala–N’Djame´na route (linking Cameroon with Chad) are more than three times higher (11 US cents/ per tonne/km) than in Brazil (3.5 cents per tonne per km) and more than five times higher than in Pakistan (2 cents per tonne per km). Only the Durban–Lusaka corridor (6 cents per tonne per km) in Southern Africa approaches the price level of other regions of the world. Our observed cost varied between 4.5 and 4.8 cents, which is not too high, given the inefficiency and long delays at the points of loading and unloading, the recent high cost of fuel, and poor road conditions, among other factors. See for instance, Teravaninthorn, S. and Gaël Raballand, Transport Prices and Costs in Africa: A Review of the Main International Corridors, Africa Infrastructure Country Diagnostic (AICD), Working Paper 14, July 2008, (http://www.infrastructureafrica.org/system/files/WP14_Transportprices.pdf).
19

the observed transportation cost from port to point of competition. It should be noted that the margin/ profit for importers is included in the miscellaneous (5% of CIF). Surtax and withholding tax has been deducted from the observed total cost to arrive at the adjusted access cost from port to point of competition.
Table 6: Access costs from Djibouti to Addis Ababa
2005 2006 2007 2008 2009 2010 Surtax & Withholding tax ETB/quintal 5.14 6.20 8.27 11.85 9.74 9.22
Port Handling ETB/quintal 23.30 23.30 23.30 23.30 23.30 23.30 Transport costs ETB/quintal 38.00 38.00 38.67 43.75 52.75 57.00
Unloading ETB/quintal 3.20 3.20 3.20 3.20 3.20 3.20 Miscellaneous (5% of CIF) ETB/quintal
8.57 10.34 13.79 19.76 16.23 15.37 Total costs ETB/quintal 78.21 81.04 87.22 101.86 105.22 108.08
Total costs - observed ETB/tonne 782 810 872 1,019 1,052 1,081 Total costs – adjusted (less surtax and withholding tax)
ETB/tonne 731 748 790 900 955 989
Source: USAID, USAID Office of Food For Peace Ethiopia, Bellmon Estimation, Annex 1 Economic Data and Trends, September 2011.
From farm to point of competition
Marketing costs from Hossana to Addis are based on information on Assela gathered from group discussion with traders/ brokers and trader associations at the Addis Ababa central grain market, and include costs such as loading, transport, fees for brokers of truck, unloading, storage, losses, fees for brokers selling wheat in Addis and margins for traders (Table 7).
Transport costs represent the most significant component of the total access costs. Table 7 shows transport cost from Hossana to Addis Ababa. Transport costs per kg per tonne for Assela to Addis Ababa are used to calculate the observed transport cost for Hossana to Addis Ababa. There is a trend toward increased transportation costs, which have more than doubled between 2005 and 2010, mainly because of the high fuel cost and high rate of inflation in the country. On average the observed transport costs are 30 percent higher than those reported along the Djibouti – Addis Ababa stretch of road. The high cost is also related to the use of smaller trucks (often less than 10 tonnes capacity) rather than bigger trucks with lower costs per unit.
Estimated margins13 are relatively high but have tended to decline between 2005 and 2010. Traders have also indicated that profits as a proportion of sales value have declined. One recent study also
12 A recent government report indicated that the price/tonne/km of transporting commodities via the Djibouti corridor is very high compared to other countries: the price/tonne/km in Ethiopia is 6 US cents, compared to 2.3 cents in Pakistan or 4 cents in Brazil. The high cost is associated with excessive downtime and high inefficiency in fuel consumption. On average, a vehicle can make a maximum of 3 round trips per month, while it is possible to do 5.See for instance, The Reporter (newspaper), 11 February, 2012: http://www.thereporterethiopia.com/News/govt-to-tighten-grip-on-trade-logistics.htm
13 Traders believe that actual profit margins are not well known as purchase prices vary by the day and so is the sales price.
20
found that net margins declined significantly in 2008 compared to 1996 and 2002 (Rashid and Negassa, 2011). One possible reason is that prices are already too high and traders find it difficult to increase their margins. It is also possible that trade has become more competitive and margins have been squeezed. Traders have also indicated that profits decline with soaring prices as most customers cut back on their purchases. Profits increased sharply in 2010 but it appears that trade margins have not increased in proportion with increase in prices.
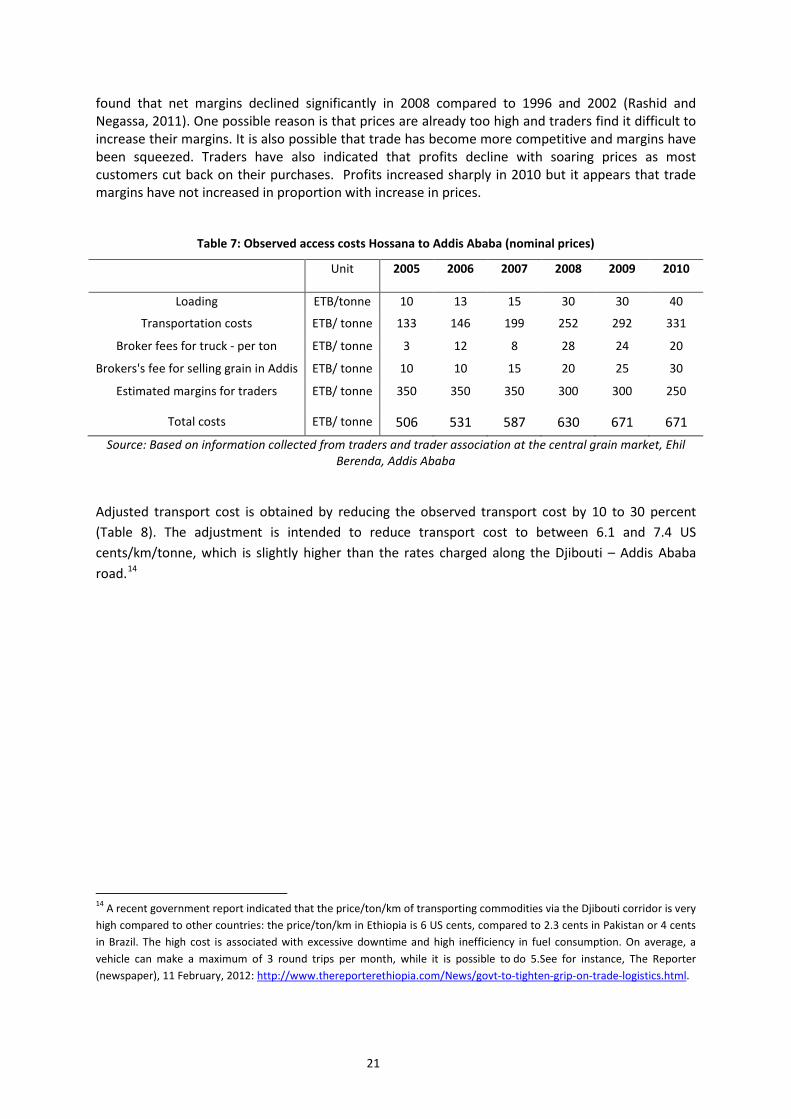
Table 7: Observed access costs Hossana to Addis Ababa (nominal prices)
Unit 2005 2006 2007 2008 2009 2010
Loading ETB/tonne 10 13 15 30 30 40
Transportation costs ETB/ tonne 133 146 199 252 292 331
Broker fees for truck - per ton ETB/ tonne 3 12 8 28 24 20
Brokers's fee for selling grain in Addis ETB/ tonne 10 10 15 20 25 30
Estimated margins for traders ETB/ tonne 350 350 350 300 300 250
Total costs ETB/ tonne 506 531 587 630 671 671
Source: Based on information collected from traders and trader association at the central grain market, Ehil Berenda, Addis Ababa
Adjusted transport cost is obtained by reducing the observed transport cost by 10 to 30 percent (Table 8). The adjustment is intended to reduce transport cost to between 6.1 and 7.4 US cents/km/tonne, which is slightly higher than the rates charged along the Djibouti – Addis Ababa road.14
14 A recent government report indicated that the price/ton/km of transporting commodities via the Djibouti corridor is very high compared to other countries: the price/ton/km in Ethiopia is 6 US cents, compared to 2.3 cents in Pakistan or 4 cents in Brazil. The high cost is associated with excessive downtime and high inefficiency in fuel consumption. On average, a vehicle can make a maximum of 3 round trips per month, while it is possible to do 5.See for instance, The Reporter (newspaper), 11 February, 2012: http://www.thereporterethiopia.com/News/govt-to-tighten-grip-on-trade-logistics.html.
21
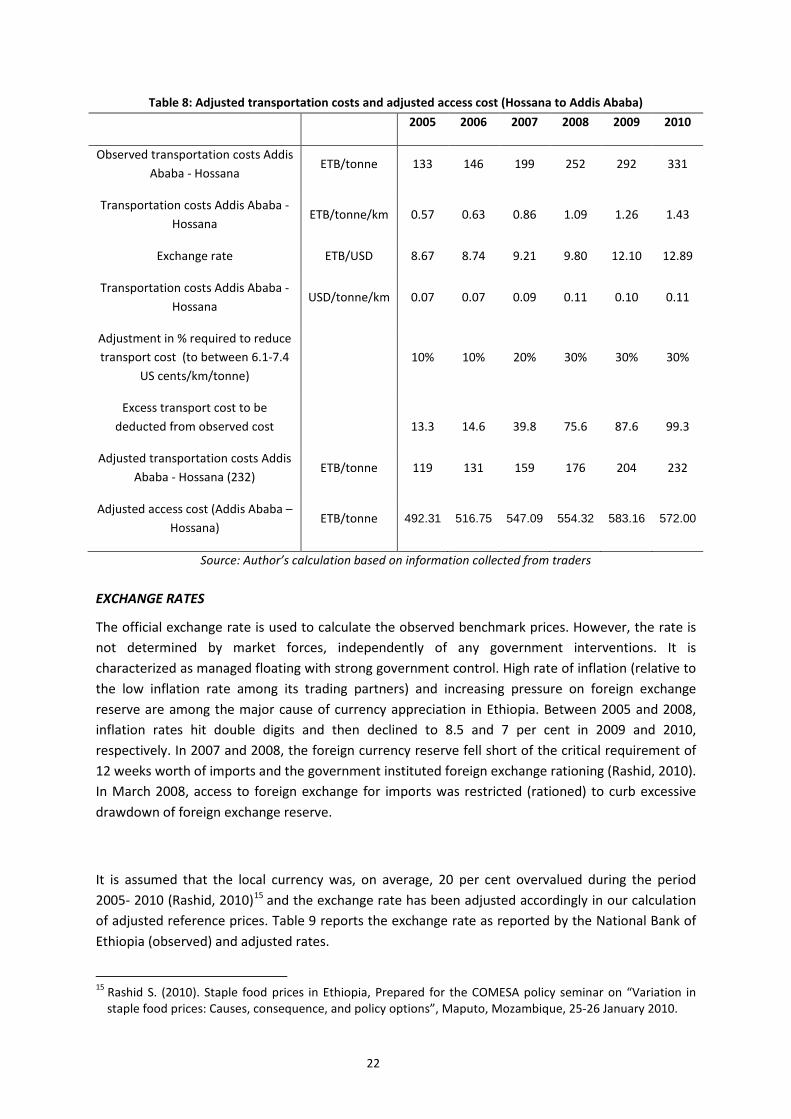
Table 8: Adjusted transportation costs and adjusted access cost (Hossana to Addis Ababa) 2005 2006 2007 2008 2009 2010
Observed transportation costs Addis Ababa - Hossana
ETB/tonne 133 146 199 252 292 331
Transportation costs Addis Ababa - Hossana
ETB/tonne/km 0.57 0.63 0.86 1.09 1.26 1.43
Exchange rate ETB/USD 8.67 8.74 9.21 9.80 12.10 12.89
Transportation costs Addis Ababa - Hossana
USD/tonne/km 0.07 0.07 0.09 0.11 0.10 0.11
Adjustment in % required to reduce transport cost (to between 6.1-7.4
US cents/km/tonne) 10% 10% 20% 30% 30% 30%
Excess transport cost to be deducted from observed cost 13.3 14.6 39.8 75.6 87.6 99.3
Adjusted transportation costs Addis Ababa - Hossana (232)
ETB/tonne 119 131 159 176 204 232
Adjusted access cost (Addis Ababa – Hossana)
ETB/tonne 492.31 516.75 547.09 554.32 583.16 572.00
Source: Author’s calculation based on information collected from traders
EXCHANGE RATES
The official exchange rate is used to calculate the observed benchmark prices. However, the rate is not determined by market forces, independently of any government interventions. It is characterized as managed floating with strong government control. High rate of inflation (relative to the low inflation rate among its trading partners) and increasing pressure on foreign exchange reserve are among the major cause of currency appreciation in Ethiopia. Between 2005 and 2008, inflation rates hit double digits and then declined to 8.5 and 7 per cent in 2009 and 2010, respectively. In 2007 and 2008, the foreign currency reserve fell short of the critical requirement of 12 weeks worth of imports and the government instituted foreign exchange rationing (Rashid, 2010). In March 2008, access to foreign exchange for imports was restricted (rationed) to curb excessive drawdown of foreign exchange reserve.
It is assumed that the local currency was, on average, 20 per cent overvalued during the period 2005- 2010 (Rashid, 2010)15 and the exchange rate has been adjusted accordingly in our calculation of adjusted reference prices. Table 9 reports the exchange rate as reported by the National Bank of Ethiopia (observed) and adjusted rates.
15 Rashid S. (2010). Staple food prices in Ethiopia, Prepared for the COMESA policy seminar on “Variation in staple food prices: Causes, consequence, and policy options”, Maputo, Mozambique, 25-26 January 2010.
22
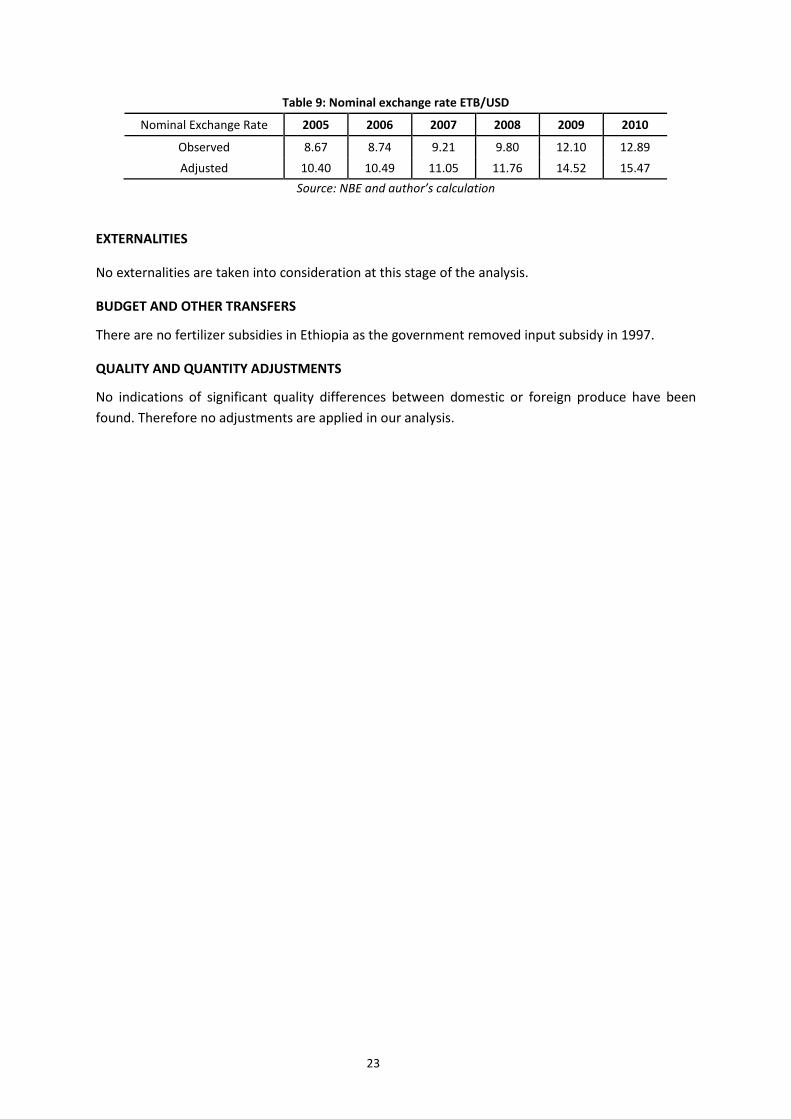
Table 9: Nominal exchange rate ETB/USD
Nominal Exchange Rate 2005 2006 2007 2008 2009 2010
Observed 8.67 8.74 9.21 9.80 12.10 12.89 Adjusted 10.40 10.49 11.05 11.76 14.52 15.47
Source: NBE and author’s calculation
EXTERNALITIES
No externalities are taken into consideration at this stage of the analysis.
BUDGET AND OTHER TRANSFERS
There are no fertilizer subsidies in Ethiopia as the government removed input subsidy in 1997.
QUALITY AND QUANTITY ADJUSTMENTS
No indications of significant quality differences between domestic or foreign produce have been found. Therefore no adjustments are applied in our analysis.
23
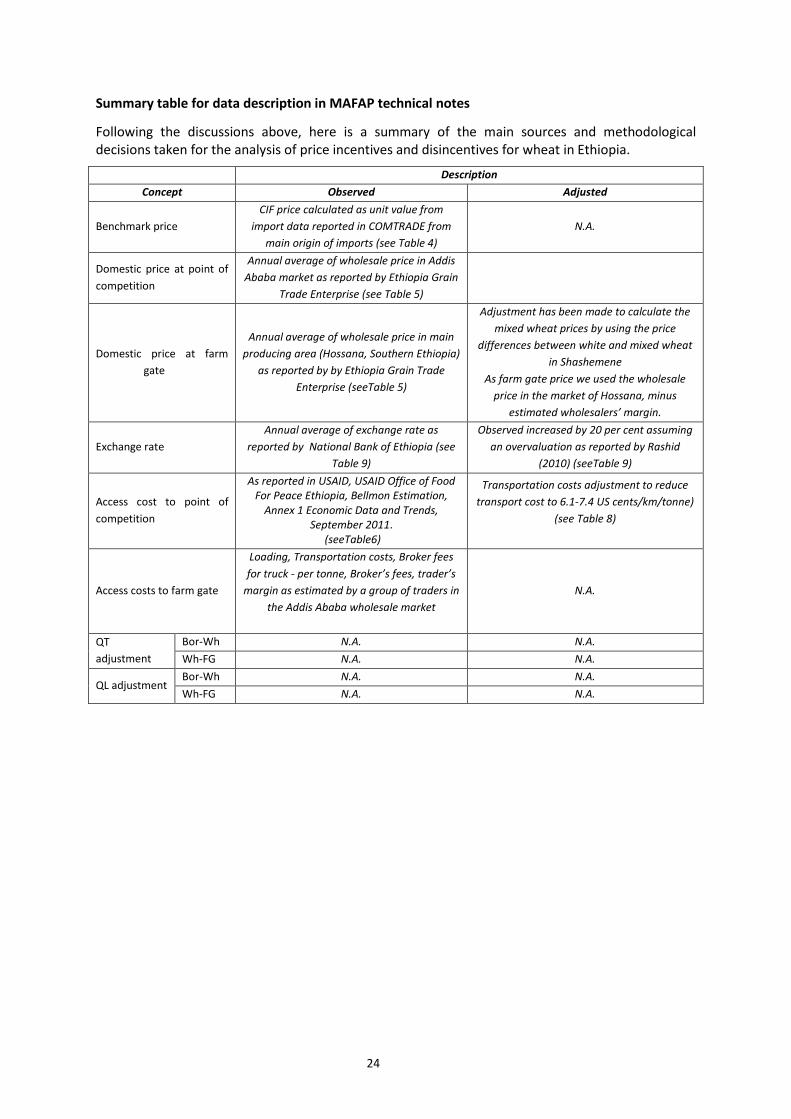
Summary table for data description in MAFAP technical notes
Following the discussions above, here is a summary of the main sources and methodological decisions taken for the analysis of price incentives and disincentives for wheat in Ethiopia.
Description Concept Observed Adjusted
Benchmark price CIF price calculated as unit value from
import data reported in COMTRADE from main origin of imports (see Table 4)
N.A.
Domestic price at point of competition
Annual average of wholesale price in Addis Ababa market as reported by Ethiopia Grain
Trade Enterprise (see Table 5)
Domestic price at farm gate
Annual average of wholesale price in main producing area (Hossana, Southern Ethiopia)
as reported by by Ethiopia Grain Trade Enterprise (seeTable 5)
Adjustment has been made to calculate the mixed wheat prices by using the price
differences between white and mixed wheat in Shashemene
As farm gate price we used the wholesale price in the market of Hossana, minus
estimated wholesalers’ margin.
Exchange rate Annual average of exchange rate as
reported by National Bank of Ethiopia (see Table 9)
Observed increased by 20 per cent assuming an overvaluation as reported by Rashid
(2010) (seeTable 9)
Access cost to point of competition
As reported in USAID, USAID Office of Food For Peace Ethiopia, Bellmon Estimation,
Annex 1 Economic Data and Trends, September 2011.
(seeTable6)
Transportation costs adjustment to reduce transport cost to 6.1-7.4 US cents/km/tonne)
(see Table 8)
Access costs to farm gate
Loading, Transportation costs, Broker fees for truck - per tonne, Broker’s fees, trader’s
margin as estimated by a group of traders in the Addis Ababa wholesale market
N.A.
QT adjustment
Bor-Wh N.A. N.A. Wh-FG N.A. N.A.
QL adjustment Bor-Wh N.A. N.A. Wh-FG N.A. N.A.
24
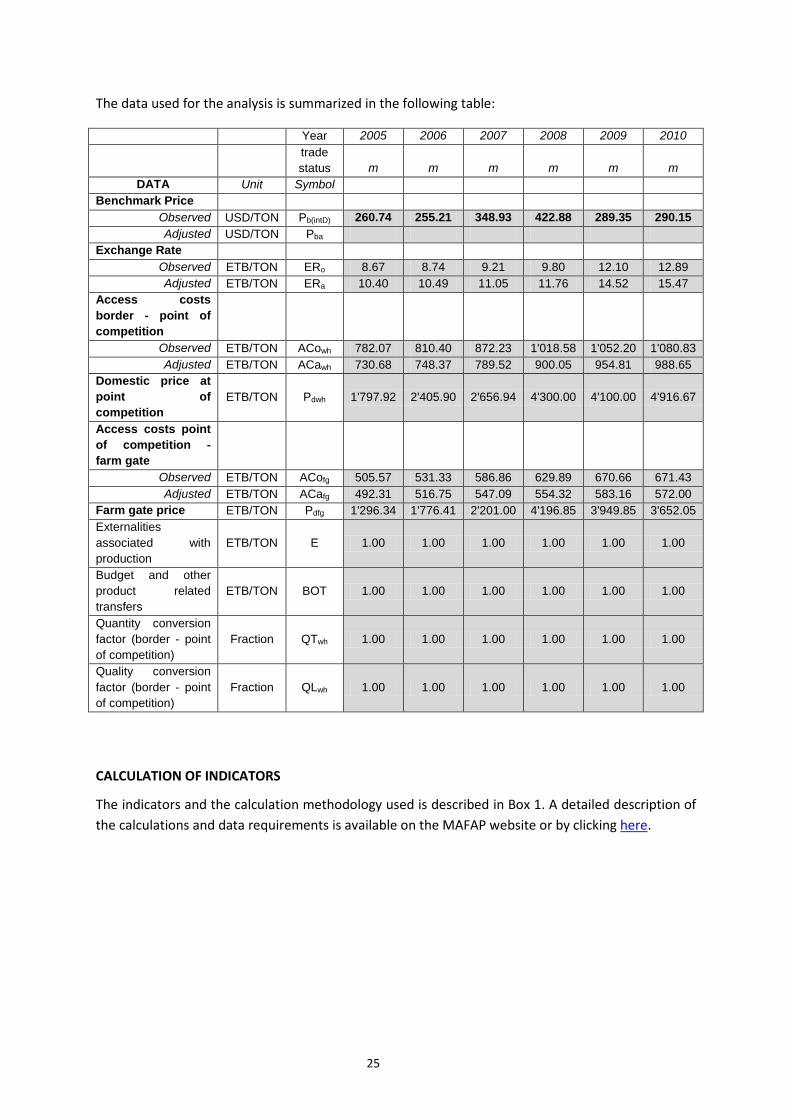
The data used for the analysis is summarized in the following table:
Year 2005 2006 2007 2008 2009 2010 trade status m m m m m m
DATA Unit Symbol Benchmark Price
Observed USD/TON Pb(intD) 260.74 255.21 348.93 422.88 289.35 290.15 Adjusted USD/TON Pba
Exchange Rate Observed ETB/TON ERo 8.67 8.74 9.21 9.80 12.10 12.89 Adjusted ETB/TON ERa 10.40 10.49 11.05 11.76 14.52 15.47
Access costs border - point of competition
Observed ETB/TON ACowh 782.07 810.40 872.23 1'018.58 1'052.20 1'080.83 Adjusted ETB/TON ACawh 730.68 748.37 789.52 900.05 954.81 988.65
Domestic price at point of competition
ETB/TON Pdwh 1'797.92 2'405.90 2'656.94 4'300.00 4'100.00 4'916.67
Access costs point of competition - farm gate
Observed ETB/TON ACofg 505.57 531.33 586.86 629.89 670.66 671.43 Adjusted ETB/TON ACafg 492.31 516.75 547.09 554.32 583.16 572.00
Farm gate price ETB/TON Pdfg 1'296.34 1'776.41 2'201.00 4'196.85 3'949.85 3'652.05 Externalities associated with production
ETB/TON E 1.00 1.00 1.00 1.00 1.00 1.00
Budget and other product related transfers
ETB/TON BOT 1.00 1.00 1.00 1.00 1.00 1.00
Quantity conversion factor (border - point of competition)
Fraction QTwh 1.00 1.00 1.00 1.00 1.00 1.00
Quality conversion factor (border - point of competition)
Fraction QLwh 1.00 1.00 1.00 1.00 1.00 1.00
CALCULATION OF INDICATORS
The indicators and the calculation methodology used is described in Box 1. A detailed description of the calculations and data requirements is available on the MAFAP website or by clicking here.
25
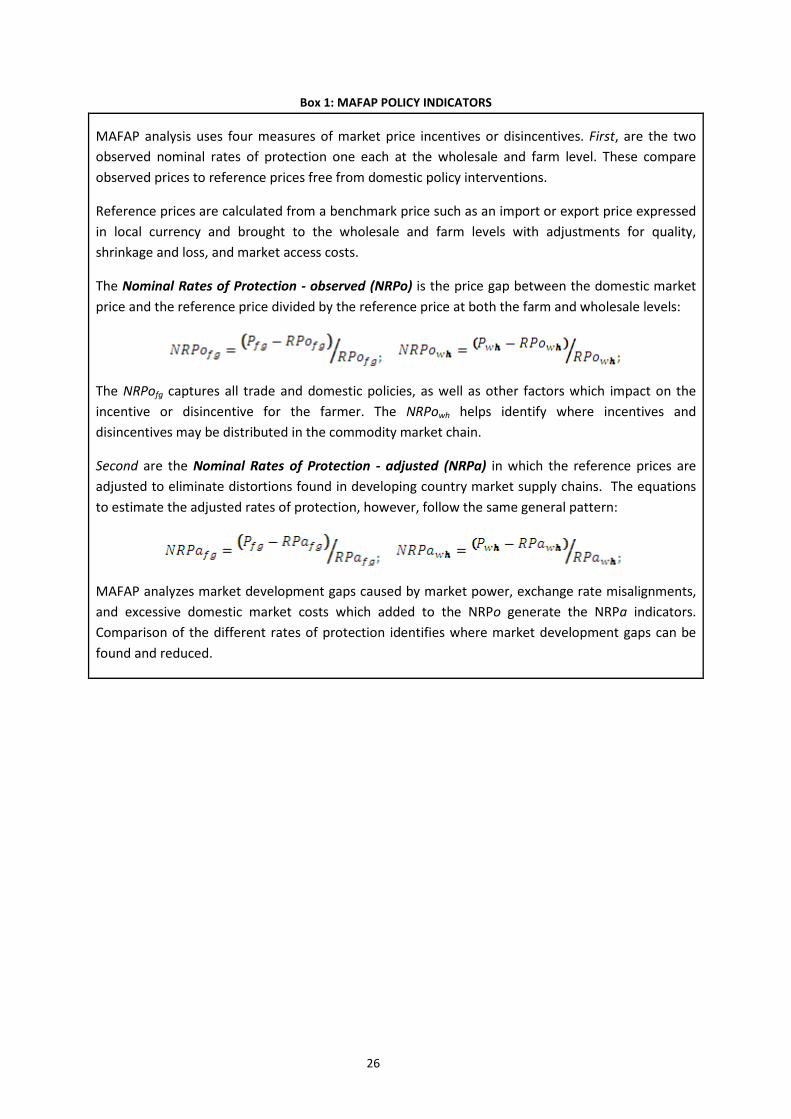
Box 1: MAFAP POLICY INDICATORS
MAFAP analysis uses four measures of market price incentives or disincentives. First, are the two observed nominal rates of protection one each at the wholesale and farm level. These compare observed prices to reference prices free from domestic policy interventions.
Reference prices are calculated from a benchmark price such as an import or export price expressed in local currency and brought to the wholesale and farm levels with adjustments for quality, shrinkage and loss, and market access costs.
The Nominal Rates of Protection - observed (NRPo) is the price gap between the domestic market price and the reference price divided by the reference price at both the farm and wholesale levels:
The NRPofg captures all trade and domestic policies, as well as other factors which impact on the incentive or disincentive for the farmer. The NRPowh helps identify where incentives and disincentives may be distributed in the commodity market chain.
Second are the Nominal Rates of Protection - adjusted (NRPa) in which the reference prices are adjusted to eliminate distortions found in developing country market supply chains. The equations to estimate the adjusted rates of protection, however, follow the same general pattern:
MAFAP analyzes market development gaps caused by market power, exchange rate misalignments, and excessive domestic market costs which added to the NRPo generate the NRPa indicators. Comparison of the different rates of protection identifies where market development gaps can be found and reduced.
26
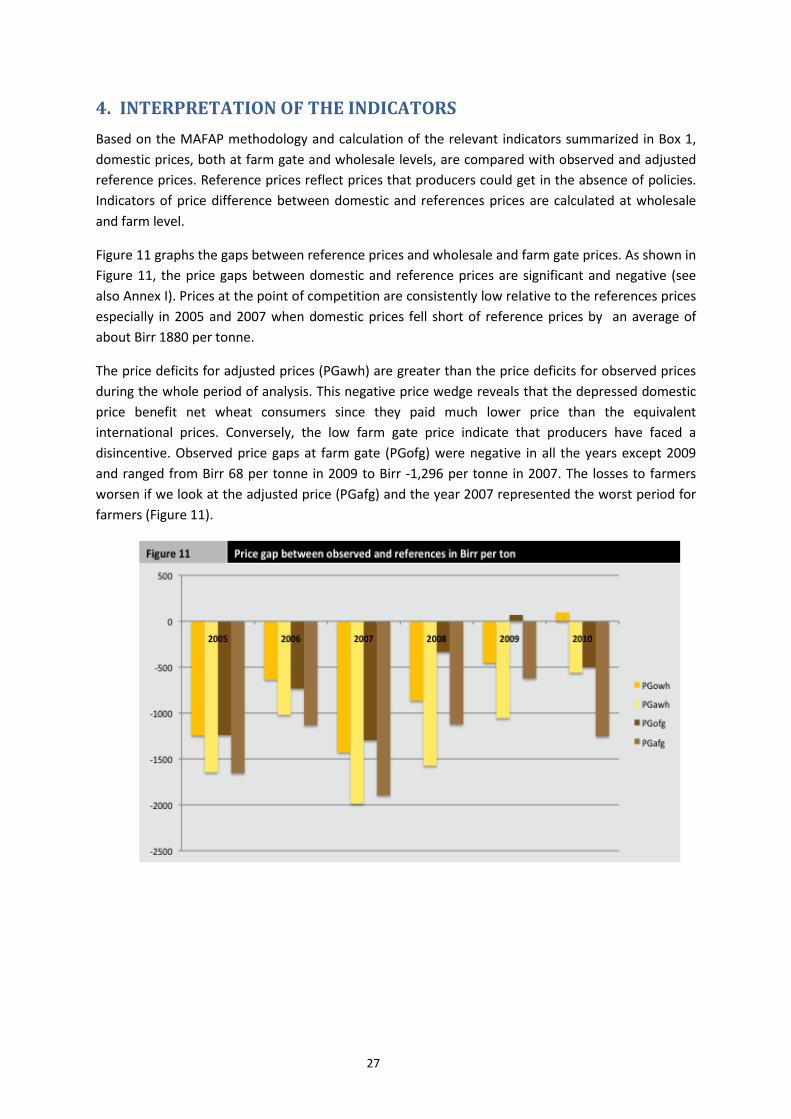
4. INTERPRETATION OF THE INDICATORSBased on the MAFAP methodology and calculation of the relevant indicators summarized in Box 1, domestic prices, both at farm gate and wholesale levels, are compared with observed and adjusted reference prices. Reference prices reflect prices that producers could get in the absence of policies. Indicators of price difference between domestic and references prices are calculated at wholesale and farm level.
Figure 11 graphs the gaps between reference prices and wholesale and farm gate prices. As shown in Figure 11, the price gaps between domestic and reference prices are significant and negative (see also Annex I). Prices at the point of competition are consistently low relative to the references prices especially in 2005 and 2007 when domestic prices fell short of reference prices by an average of about Birr 1880 per tonne.
The price deficits for adjusted prices (PGawh) are greater than the price deficits for observed prices during the whole period of analysis. This negative price wedge reveals that the depressed domestic price benefit net wheat consumers since they paid much lower price than the equivalent international prices. Conversely, the low farm gate price indicate that producers have faced a disincentive. Observed price gaps at farm gate (PGofg) were negative in all the years except 2009 and ranged from Birr 68 per tonne in 2009 to Birr -1,296 per tonne in 2007. The losses to farmers worsen if we look at the adjusted price (PGafg) and the year 2007 represented the worst period for farmers (Figure 11).
27
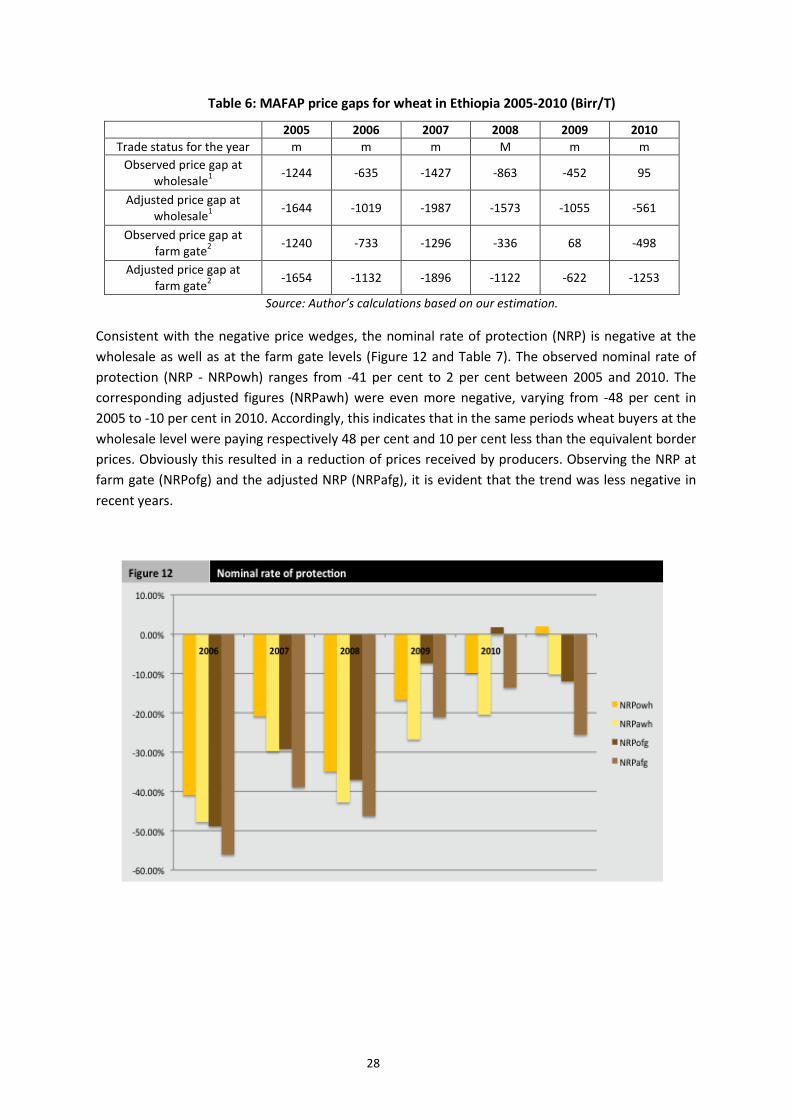
Table 6: MAFAP price gaps for wheat in Ethiopia 2005-2010 (Birr/T)
2005 2006 2007 2008 2009 2010 Trade status for the year m m m M m m
Observed price gap at wholesale1 -1244 -635 -1427 -863 -452 95
Adjusted price gap at wholesale1 -1644 -1019 -1987 -1573 -1055 -561
Observed price gap at farm gate2 -1240 -733 -1296 -336 68 -498
Adjusted price gap at farm gate2 -1654 -1132 -1896 -1122 -622 -1253
Source: Author’s calculations based on our estimation.
Consistent with the negative price wedges, the nominal rate of protection (NRP) is negative at the wholesale as well as at the farm gate levels (Figure 12 and Table 7). The observed nominal rate of protection (NRP - NRPowh) ranges from -41 per cent to 2 per cent between 2005 and 2010. The corresponding adjusted figures (NRPawh) were even more negative, varying from -48 per cent in 2005 to -10 per cent in 2010. Accordingly, this indicates that in the same periods wheat buyers at the wholesale level were paying respectively 48 per cent and 10 per cent less than the equivalent border prices. Obviously this resulted in a reduction of prices received by producers. Observing the NRP at farm gate (NRPofg) and the adjusted NRP (NRPafg), it is evident that the trend was less negative in recent years.
28
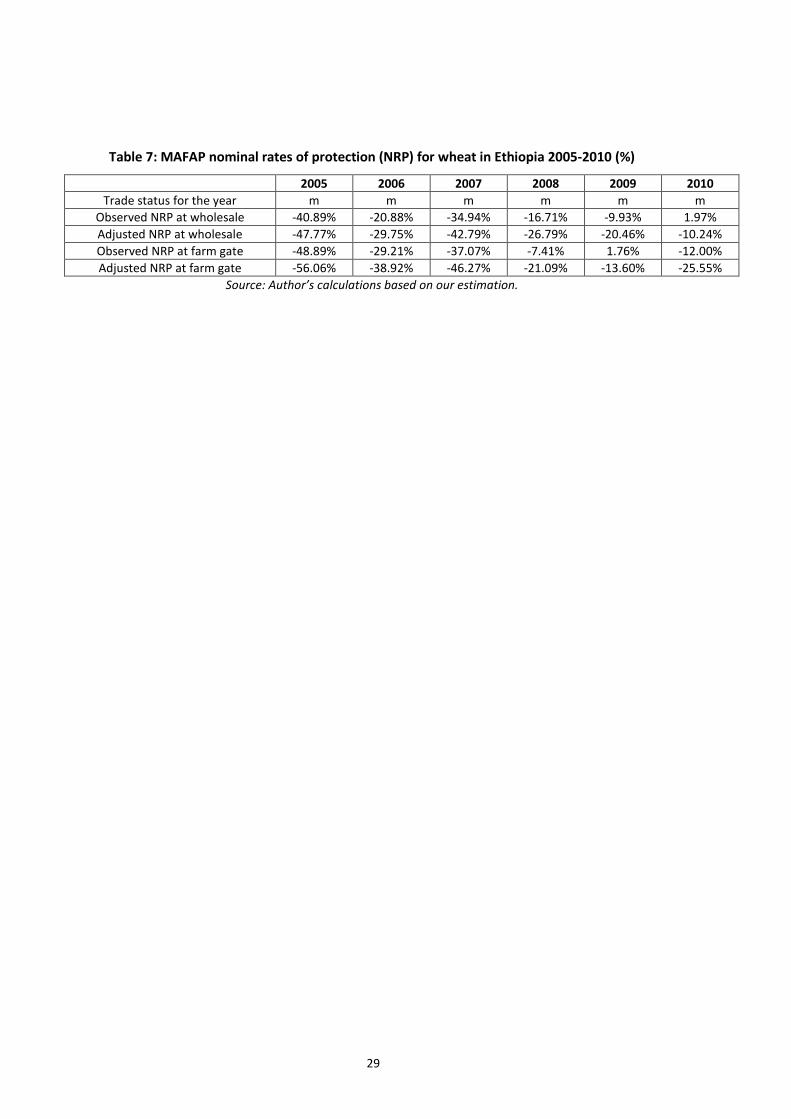
Table 7: MAFAP nominal rates of protection (NRP) for wheat in Ethiopia 2005-2010 (%)
2005 2006 2007 2008 2009 2010 Trade status for the year m m m m m m
Observed NRP at wholesale -40.89% -20.88% -34.94% -16.71% -9.93% 1.97% Adjusted NRP at wholesale -47.77% -29.75% -42.79% -26.79% -20.46% -10.24% Observed NRP at farm gate -48.89% -29.21% -37.07% -7.41% 1.76% -12.00% Adjusted NRP at farm gate -56.06% -38.92% -46.27% -21.09% -13.60% -25.55%
Source: Author’s calculations based on our estimation.
29
5. PRELIMINARY CONCLUSIONS AND RECOMMENDATIONSFrom 2005 through 2010, domestic prices of wheat in Addis Ababa were generally below benchmark prices. Observed price gaps at the wholesale and farm gate levels in 2005 and 2007 were particularly very high.
Adjusted nominal rates of protection at the farm gate were significantly negative, ranging -56 percent in 2005 to -13 percent in 2009. The adjusted nominal rate of protection tended to improve in 2008 and 2009 but the improvement was not sustained in 2010. While buyers or consumers benefited since they paid lower price than the equivalent international prices, wheat producers lost as they were paid much lower than the international prices.
The results of the MAFAP price indicators show that the level of disincentive to wheat farmers was considerable during the period 2005 to 2010. Ban of cereal export, overvalued exchange rates, underdeveloped markets, and distribution of imported wheat at subsidized prices (at times of high food prices) have kept domestic prices of wheat below the reference prices. Grain trading and associated transport and storage systems are based on inefficient and high costs small-scale transactions, thus contributing to low farm gate prices. Traders and millers operate with a very small amount of capital and inadequate equipment. Food aid, which is largely made up of wheat, accounts for a significant share of cereal consumption and this may have also contributed to the low domestic price levels16.
With improved policy environment and enhanced long term investment in wheat production, the country has the capacity to meet domestic demand. Wheat can be grown profitably in many parts of the country, especially in medium and high altitude areas. As observed in a recent study of several African countries, including Ethiopia, domestic production of wheat can be economically profitable and could be competitive with imports provided the government invests to enhance the utilization of existing technologies through improvements in seed production and supply, agricultural extension, marketing infrastructure to reduce marketing costs, among others (Shiferaw, et al., 2011).
Preliminary recommendations:
• It is important for policy makers to reconsider policies, including distribution of importedwheat at subsidized prices, currency overvaluation and export bans, that resulted in implicittaxation of agriculture;
• Because government interventions and food aid are often made up of wheat and areunpredictable, domestic wheat prices are low and volatile; hence, the government needs togive special attention to minimizing the impact of government imports and food aid on theincentive invest in wheat related activities by farmers, traders, millers and warehouseoperators.
• Though the government is upgrading to improve the overall level of infrastructure in thecountry, greater attention should be paid to introducing bulk transport systems, along withgrades and standards, to reduce transport and transaction costs and provide better
16 Food aid flows are estimated to have depressed domestic prices within the ranges of 2 to 26 percent for wheat, 3 to 13 percent for maize, and 2 to 11 percent for teff during the period 1981 to 2002 (Rashid, Assefa and Ayele, 2007).
30
incentives to farmers; this would also improve opportunities for wheat to be traded at the Ethiopian Commodity Exchange.
• government policy should be informed by the fact that low domestic prices are good forconsumers only in the short run. Long-term and sustained gain to consumers can only beachieved through improved incentive to producers that translate into increased production,hence lower prices in the long term.
Limitations
Though much effort has been paid to provide a reasonable representation of the situation on the ground, two main limitations were faced. First, data on CIF prices and access costs was hard to come by and the research team had to rely on indirect estimates and an assistant who collected primary data through interviews with a small number of traders and representatives of trader associations. The available data reveals a lot of interesting features of the wheat market but further investigation and consultations with relevant government and private organizations are required to validate the access data.
Second, distortions caused by food aid were not taken into account properly. Food aid can distort incentives both for farmers (through depressing farm prices) and for traders (by distorting their arbitrage opportunities in domestic and international markets). Thus if one took food aid as well as price and trade policies into account, one would conclude that farming has been discouraged even more in Ethiopia than our estimates suggest.
Further investigation and research
Farm gate prices were estimated based on wholesale prices observed in a town (Assela) located in major wheat producing area. We adjust these figures to obtain the Hossana prices. However, improvement of the results should include information on the actual farm gate prices for Hossana area as well as other locations in different wheat producing areas. More effort is also required to acquire CIF prices from cross-border trade.
31
BIBILIOGRAPHY Amanuel Gorfu, Douglas G. Tanner, Kefyalew Girma Asefa Taa and Duga Debele. 1996. . In: Tanner, D. G., Thomas, T. S., and Abdalla,O.S.eds. 1996. The Ninth Regional Workshop for Eastern, Central and Southern Africa. Addis Ababa, Ethiopia: CIMMYT.
Anderson, K. and W. Masters (eds.) 2009, Distortions to Agricultural Incentives in Africa, Washington DC: World Bank.
Awokuse, T. O., 2006. Assessing the Impact of Food Aid on Recipient Countries: A Survey” ESA Working Paper No. 06-11, Agricultural and Development Economics Division, FAO.
Barrett, C.B., 2006. Food Aid’s Intended and Unintended Consequences. ESA Working Paper No. 06-05, Agricultural and Development Economics Division, FAO.
Bekele, G. 2002. The Role of the Ethiopian Grain Trade Enterprise in Price Policy. In Agriculture Technology Diffusion and Price Policy in Addis Ababa, ed. T. Bonger, E. Gabre-Madhin, and S. Babu. Proceedings of a Policy Forum in Addis Ababa: 2020 Vision Network for East Africa Report 1. Addis Ababa: Ethiopian Development Research Institute and Washington, D.C.: International Food Policy Research Institute.
Bezu, S and Holden, S. (2008) “Can food-for-work encourage agricultural production?”, Food Policy 33( 6) : 541-549.
CIMMYT, 2000. The Eleventh Regional Wheat Workshop for Eastern. Central and Southern Africa. Addis Ababa, Ethiopia.
CSA. April 2011. Report on Area and Production of Major crops. Ethiopian Agricultural Sample Survey Private Peasant Holdings, Meher Season (2010/11 (2003 E.C.)) – Volume I. Statistical Bulletin. Addis Ababa: Central Statistical Agency. [various years and numbers]
CSA. September – December 2009. Report on Area and Production of Major crops. Ethiopian Agricultural Sample Survey Private Peasant Holdings, Meher Season (2009/10 (2002 E.C.)) – Volume IV. Statistical Bulletin 446. Addis Ababa: Central Statistical Agency. [various years and numbers]
CSA. June 2008. Report on Area and Production of Major crops. Ethiopian Agricultural Sample Survey Private Peasant Holdings, Meher Season 2007 / 2008 (2000 E.C.))– Volume I. Statistical Bulletin 417. Addis Ababa: Central Statistical Agency. [various years and numbers]
CSA. July 2006. Report on Area and Production of Major crops. Ethiopian Agricultural Sample Survey Private Peasant Holdings, Meher Season (2005 / 2006 (1998 E.C.)) – Volume I. Statistical Bulletin 361. Addis Ababa: Central Statistical Agency. [various years and numbers]
Dorosh, P., Robinson, S., & Ahmed, H. 2009. Economic implications of foreign exchange rationing in Ethiopia. ESSP2 Discussion Paper 9.
Gabre-Madhin, Eleni Z. 2001. Market Institutions, Transaction Costs, and Social Capital in the Ethiopian Grain Market. International Food Policy Research Institute. Washington, D. C.
Geda, A., Shimeles, A. Taxes and Tax Reform in Ethiopia, 1990-2003.Paper provided by World Institute for Development Economic Research (UNU-WIDER) in its series Working Papers with number RP2005/65. Available online: http://www.wider.unu.edu/stc/repec/pdfs/rp2005/rp2005-65.pdf
Hailu Gebre-Mariam. 1991. Wheat production and research in Ethiopia. In: Hailu Gebre-Mariam, D.G. Tanner, and M. Hulluka (eds.). Wheat Research in Ethiopia: A Historical Perspective. Addis Ababa: IAR/CIMMYT.
32
Jayne, T.S., Negassa, A., Myers, R.J., 1998. The Effect of Liberalization on Grain Prices and Marketing Margins in Ethiopia. Food Security International Development Working Papers 54681, Michigan State University, Department of Agricultural, Food, and Resource Economics.
Jayne, T.S., Molla, D., 1995. Toward a Research Agenda to Promote Household Access to Food in Ethiopia. Food Security Research Project Working Paper #2, Ministry of Economic Development and Cooperation, Addis Ababa.
Kuma, T. 2002. Trends in agricultural production, technology dissemination, and price movements of outputs and inputs. In T. Bonger, E. Gabre-Madhin, and S. Babu, eds., Agriculture technology diffusion and price policy. 2020 Vision Network for East Africa Report 1. Addis Ababa and Washington, DC: Ethiopian Development Research Institute and International Food Policy Research Institute.
Molla, D., Gebre, H., Jayne, T.S., Shaffer, J., 1997. Designing Strategies to Support a Transformation of Agriculture in Ethiopia. Grain Market Research Project Working Paper #4, Ministry of Economic Development and Cooperation, Addis Ababa.
Negassa, A. and Jayne, T.S. 1997. The response of Ethiopian grain markets to liberalisation. Working Paper No.6, Grain Marketing Research Project, Michigan State University, Addis Ababa, Ethiopia.
Nunn, Nathan and Nancy Qian (2011) "Aiding Conflict: The Unintended Consequences of U.S. Food Aid on Civil War," Working Paper, Duke University
Rashid, S. 2010. Staple food prices in Ethiopia, Prepared for the COMESA policy seminar on “Variation in staple food prices: Causes, consequence, and policy options”, Maputo, Mozambique, 25-26 January 2010.
Rashid, S., M. Assefa, and G. Ayele. 2007. Distortions to Agricultural Incentives in Ethiopia. Agricultural Distortions Working Paper 43. World Bank, Washington, DC.
Rashid, S., R. Cummings, and A. Gulati. 2005. Grain Marketing Parastatals in Asia: Why Do They Have to Change Now? Discussion Paper 80. International Food Policy Research Institute, Washington, DC.
Shiferaw, B., Asfaw Negassa, Jawoo Koo, Stanley Wood, Kai Sonder, Hans Joachim Braun, and Thomas Payne. 2011. Future of Wheat Production in Sub-Saharan Africa: Analyses of the Expanding Gap between Supply and Demand and Economic Profitability of Domestic Production.
http://addis2011.ifpri.info/files/2011/10/Paper_2B-Bekele-Shiferaw.pdf
Taffesse A. S., Dorosh P. and Asrat S. 2011. Crop Production in Ethiopia: Regional Patterns and Trends. ESSP II Working Paper 16. Addis Ababa, Ethiopia: International Food Policy Research Institute / Ethiopia Strategy Support Program II, available online:
http://www.ifpri.org/sites/default/files/publications/esspwp16.pdf (accessed 10 May 2012)
Teravaninthorn, S. and Gaël Raballand, Transport Prices and Costs in Africa: A Review of the Main International Corridors, Africa Infrastructure Country Diagnostic (AICD), Working Paper 14, July 2008 (http://www.infrastructureafrica.org/system/files/WP14_Transportprices.pdf)
Tesfaye, T. (2000). An overview of tef and durum wheat production in Ethiopia. Available online: http://www.eap.gov.et/content/files/Documents/EAP%20Documents/Agricultural%20Comodities/Crop/Cereals/Tef/Production/tef%20and%20dur um.pdf
Teshome, A. .2007. The Compatibility of Trade Policy with Domestic Policy Interventions in Ethiopia. Paper Presented at a Workshop on “Staple Food Trade and Market Policy Options for Promoting Development in Eastern and Southern Africa March 1-2, 2007. FAO – Rome, Italy. Available online:
33
http://www.fao.org/es/ESC/common/ecg/494/en/FINAL_TESHOME_Trade_Policy_Paper___Ethiopia.pdf.
Walker, D.J. and Wandschneider, T. 2005. Local Food Aid Procurement in Ethiopia. Case Study Report by Natural Resources Institute for EC-PREP, UK Department for International Development. Available online: http://www.ec-prep.org/components/download.aspx?siteId=bdc57615-7c5e- 4170-b5cf-c7d1fc50ea64&id=f57ae1a3-0851-431b-a8a2-7820d86c533a
White, JW., Tanner, DG., Corbett, JD. (2001) An agro-climatological characterization of bread wheat production areas in Ethiopia. Natural Resources Group-Geographic Information Systems Series 01-01. Mexico, D.F.: CIMMYT.
34

ANNEX I: Methodology Used
A guide to the methodology used by MAFAP can be downloaded from the MAFAP website or by clicking here
35
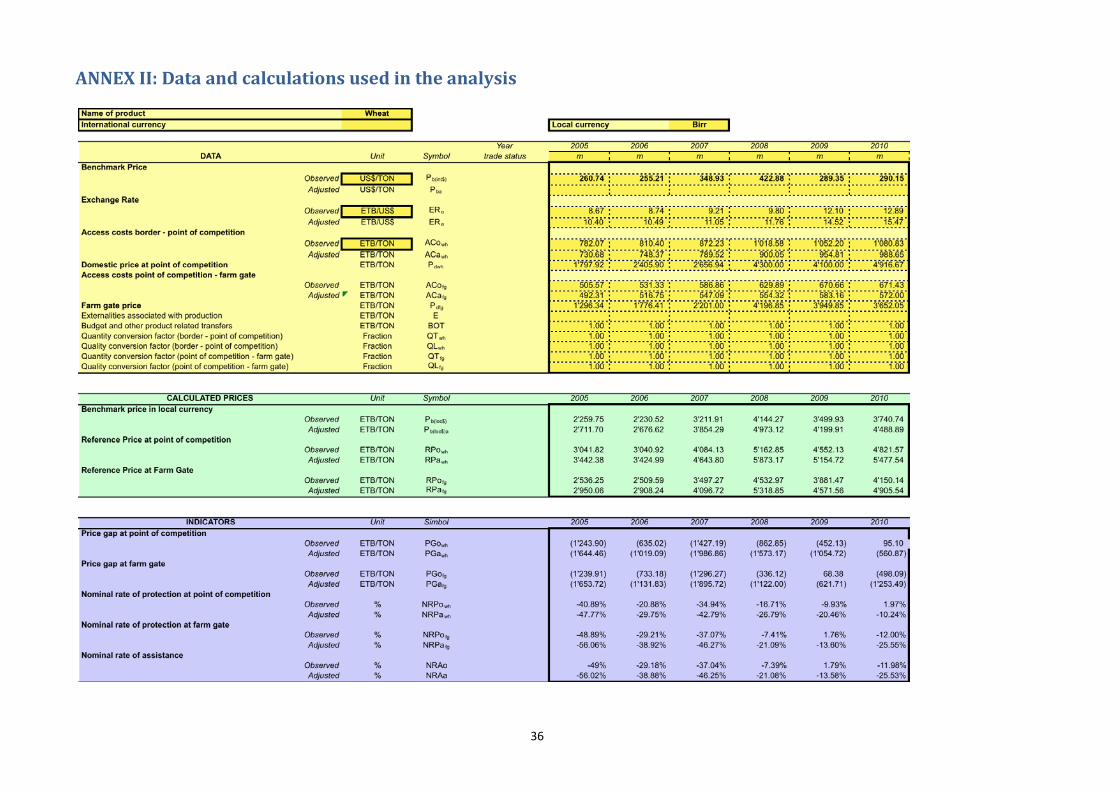
ANNEX II: Data and calculations used in the analysis
36