analysis of incentives and disincentives for cocoa … · analysis of incentives and disincentives...
TRANSCRIPT
ANALYSIS OF INCENTIVES AND DISINCENTIVES FOR COCOA IN GHANA
Draft Version
APRIL 2013
This technical note is a product of the Monitoring African Food and Agricultural Policies project (MAFAP). It is a technical document intended primarily for internal use as background for the eventual MAFAP Country Report. This technical note may be updated as new data becomes available.
MAFAP is implemented by the Food and Agriculture Organization of the United Nations (FAO) in collaboration with the Organisation for Economic Co-operation and Development (OECD) and national partners in participating countries. It is financially supported by the Bill and Melinda Gates Foundation, the United States Agency for International Development (USAID), and FAO.
The analysis presented in this document is the result of the partnerships established in the context of the MAFAP project with governments of participating countries and a variety of national institutions.
For more information: http://www.fao.org/mafap
Suggested citation:
Asante-Poku A., Angelucci F., 2013. Analysis of incentives and disincentives for cocoa in Ghana. Technical notes series, MAFAP, FAO, Rome.
© FAO 2013
FAO encourages the use, reproduction and dissemination of material in this information product. Except where otherwise indicated, material may be copied, downloaded and printed for private study, research and teaching purposes, or for use in non-commercial products or services, provided that appropriate acknowledgement of FAO as the source and copyright holder is given and that FAO’s endorsement of users’ views, products or services is not implied in any way.
All requests for translation and adaptation rights, and for resale and other commercial use rights should be made via www.fao.org/contact-us/licence-request or addressed to [email protected].
FAO information products are available on the FAO website (www.fao.org/publications) and can be purchased through [email protected].
SUMMARY OF THE NOTE Product: Cocoa Period analyzed: 2005 – 2010 Trade status: Export in all years Most important export crop 8.2 percent of the country’s GDP and 30 percent of total export
earnings in 2010. Total production from 450 000 tonnes in 2000 to 900 000 tonnes in 2010. Ninety per cent
grown by smallholder farms. All cocoa beans sold to Licensed Buying Companies (LBCs) which in turn sell to the only one
exporter in Ghana, the COCOBOD (Govt. Agency) or to domestic industries for local processing. Main export destinations: European Union, Japan and the United States.
Important commodity for the country’s foreign exchange earnings (around 25 percent in 2010), and subject to regular policy interventions by the Government, including export tax, licensing arrangements and input subsidies.
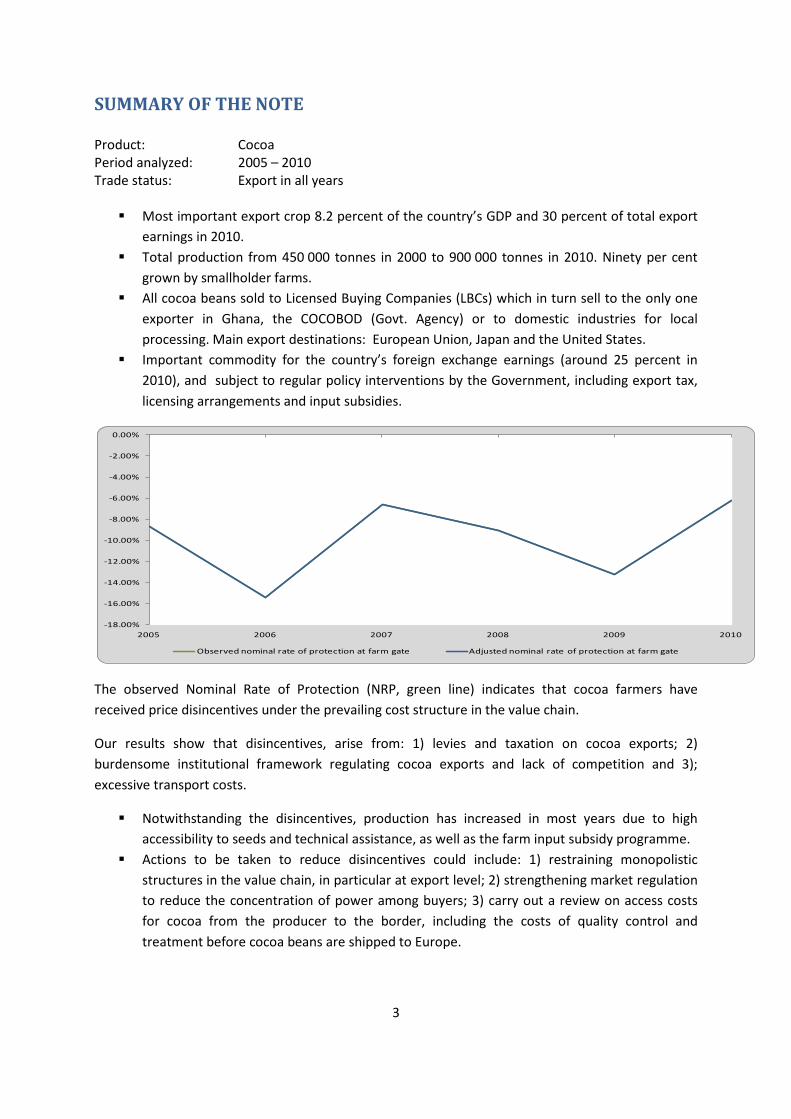
The observed Nominal Rate of Protection (NRP, green line) indicates that cocoa farmers have received price disincentives under the prevailing cost structure in the value chain.
Our results show that disincentives, arise from: 1) levies and taxation on cocoa exports; 2) burdensome institutional framework regulating cocoa exports and lack of competition and 3); excessive transport costs.
Notwithstanding the disincentives, production has increased in most years due to high accessibility to seeds and technical assistance, as well as the farm input subsidy programme.
Actions to be taken to reduce disincentives could include: 1) restraining monopolistic structures in the value chain, in particular at export level; 2) strengthening market regulation to reduce the concentration of power among buyers; 3) carry out a review on access costs for cocoa from the producer to the border, including the costs of quality control and treatment before cocoa beans are shipped to Europe.
-18.00%
-16.00%
-14.00%
-12.00%
-10.00%
-8.00%
-6.00%
-4.00%
-2.00%
0.00%
2005 2006 2007 2008 2009 2010
Observed nominal rate of protection at farm gate Adjusted nominal rate of protection at farm gate
3
CONTENTS
SUMMARY OF THE NOTE ............................................................................................................................... 3
1. PURPOSE OF THE NOTE ........................................................................................................................ 6
2. COMMODITY CONTEXT ........................................................................................................................ 2
PRODUCTION ......................................................................................................................................... 3
CONSUMPTION/UTILIZATION ................................................................................................................ 7
MARKETING AND TRADE ....................................................................................................................... 7
DESCRIPTION OF THE VALUE CHAIN AND PROCESSING ...................................................................... 12
POLICY DECISIONS AND MEASURES .................................................................................................... 16
3. DATA REQUIREMENTS, DESCRIPTION AND CALCULATION OF INDICATORS ...................................... 20
TRADE STATUS OF THE PRODUCTS ...................................................................................................... 20
BENCHMARK PRICES ............................................................................................................................ 20
DOMESTIC PRICES ................................................................................................................................ 21
EXCHANGE RATE .................................................................................................................................. 22
MARKET ACCESS COSTS ....................................................................................................................... 23
EXTERNALITIES ..................................................................................................................................... 24
BUDGET AND OTHER TRANSFERS ........................................................................................................ 24
QUALITY AND QUANTITY ADJUSTMENTS ............................................................................................ 24
DATA OVERVIEW ................................................................................................................................. 25
CALCULATION OF INDICATORS ............................................................................................................ 28
4. INTERPRETATION OF THE INDICATORS .............................................................................................. 30
5. PRELIMINARY CONCLUSIONS AND RECOMMENDATIONS ................................................................. 32
MAIN MESSAGE ................................................................................................................................... 32
PRELIMINARY RECOMMENDATIONS ................................................................................................... 32
LIMITATIONS: ....................................................................................................................................... 32
FURTHER INVESTIGATION AND RESEARCH ......................................................................................... 32
6. BIBLIOGRAPHY .................................................................................................................................... 33
4
ANNEX I: Methodology Used ....................................................................................................................... 36
ANNEX II: Data and calculations used in the analysis ................................................................................. 37
5
PURPOSE OF THE NOTE This technical note aims to describe the market incentives and disincentives for Cocoa in Ghana. The note is a technical document and serves as input for the MAFAP Country Report.
For this purpose, yearly averages of farm gate and wholesale prices are compared with reference prices calculated on the basis of the price of the commodity in the international market. The price gaps between the reference prices and the prices along the value chain indicate to which extent incentives (positive gaps) or disincentives (negative gaps) are present at farm gate and wholesale level. In relative terms, the price gaps are expressed as Nominal Rates of Protection. These key indicators are used by MAFAP to highlight the effects of policy and market development gaps on prices.
The note starts with a brief review of the production, consumption, trade and policies affecting the commodity and then provides a detailed description of how the key components of the price analysis have been obtained. The MAFAP indicators are then calculated with these data and interpreted in the light of existing policies and market characteristics. The analysis that has been carried out is commodity and country specific and covers the period 2005-2010. The indicators have been calculated using available data from different sources for this period and are described in Chapter 3.
Outcomes from this research can be used by stakeholders involved in policy-making in the Food and Agricultural Sector. They can also serve as input for evidence-based policy dialogue at country or regional level.
This technical note is not to be interpreted as an analysis of the value chain or detailed description of production, consumption or trade patterns. All information related to these areas is presented merely to provide background on the commodity under review, help understand major trends and facilitate the interpretation of the indicators.
All information is preliminary and still subject to review and validation.
6
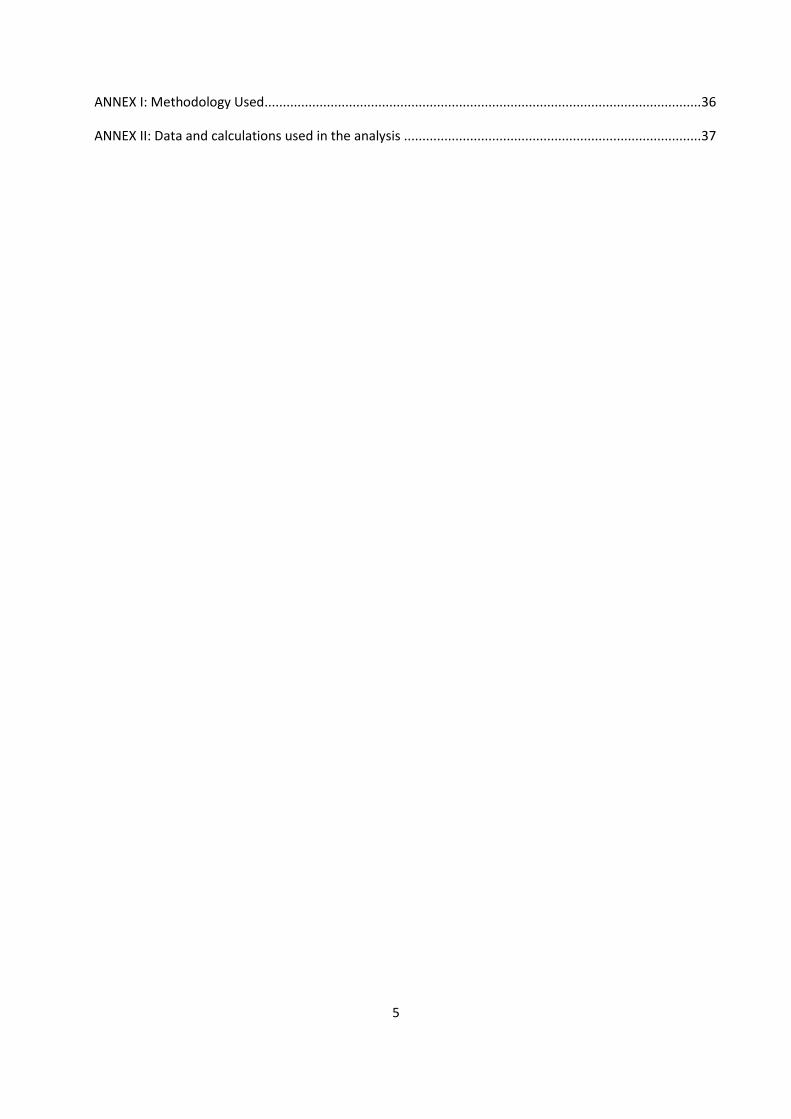
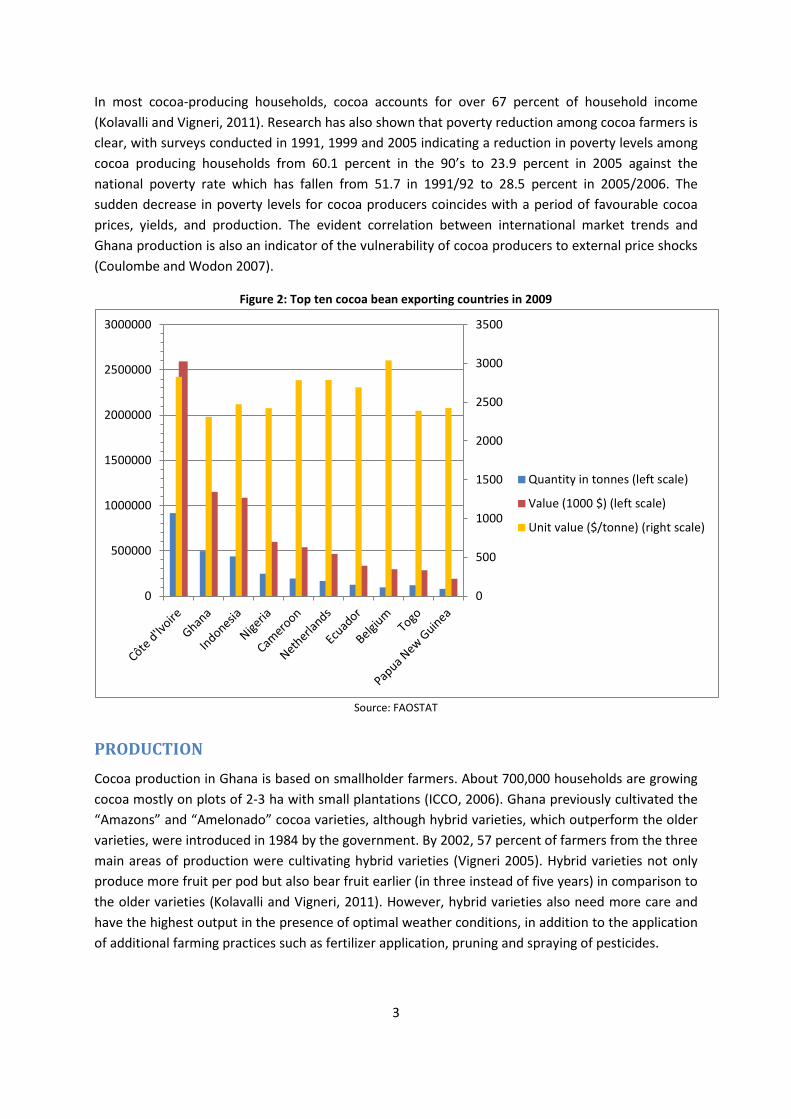
COMMODITY CONTEXT Ghana is the world’s third largest producer (Figure 1) and the second largest exporter of cocoa beans after Cote d’Ivoire (Figure 2). It has been estimated that in 2010/2011 Ghana’s exports of cocoa reached 1 004 000 MT (GAIN, 2012). In terms of world cocoa exports, Ghana has maintained its position as the 2nd largest exporter (by quantity) of cocoa beans for the period of 2005-2011. The country ranked 8th, 9th and 7th in cocoa butter export in 2005, 2006 and 2009, respectively, while cocoa paste exports have decreased such that Ghana was no longer ranked among the top 9 exporters of cocoa paste worldwide in 2008 and 2009 although between 2005 and 2007, Ghana ranked in the 3rd or 4th position.
Moreover, in 2010 exports of cocoa butter and paste to the USA increased dramatically from 32 million USD to 86 million USD, most likely because of the higher quality of cocoa products produced in Ghana (GAIN, 2012).
Cocoa is considered to be the highest export crop earner for Ghana accounting for 8.2 percent of the country’s GDP and 30 percent of total export earnings in 2010 (Ghana Statistical Service, 2010; GAIN, 2012).
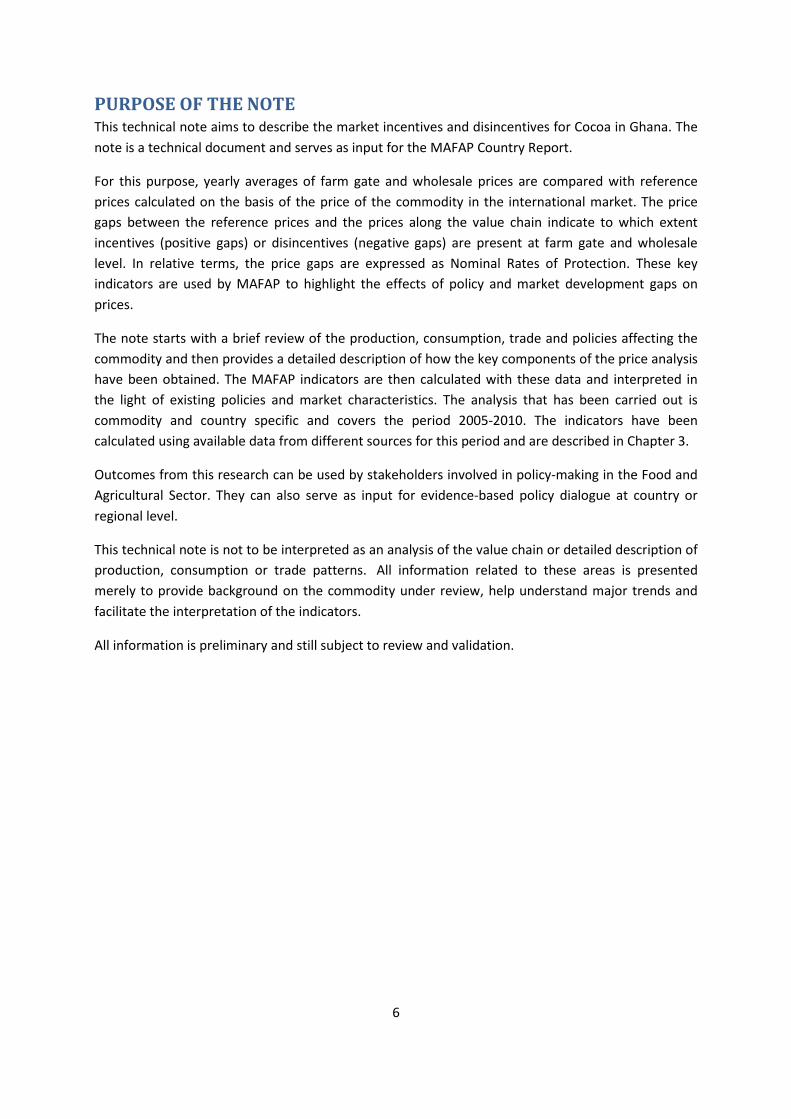
Figure 1: Top ten cocoa producing countries in 2010 (USD, tonne).
Source: FAOSTAT
Ghana is the only cocoa producing country which has a controlled marketing system. The gradual reform process of the cocoa sub-sector, started in the early 90s, has led to the liberalization of internal marketing, privatization of input market and reform of extension services. However, external marketing is controlled by the state owned Cocoa Marketing Board (Laven, 2007). In terms of employment, the livelihood of about six million people (25-30 percent of the population) depends on the cocoa sector (Anthonio and Aikins, 2009).
0
200000
400000
600000
800000
1000000
1200000
1400000
Production (Int $1000)
Production (MT)
In most cocoa-producing households, cocoa accounts for over 67 percent of household income (Kolavalli and Vigneri, 2011). Research has also shown that poverty reduction among cocoa farmers is clear, with surveys conducted in 1991, 1999 and 2005 indicating a reduction in poverty levels among cocoa producing households from 60.1 percent in the 90’s to 23.9 percent in 2005 against the national poverty rate which has fallen from 51.7 in 1991/92 to 28.5 percent in 2005/2006. The sudden decrease in poverty levels for cocoa producers coincides with a period of favourable cocoa prices, yields, and production. The evident correlation between international market trends and Ghana production is also an indicator of the vulnerability of cocoa producers to external price shocks (Coulombe and Wodon 2007).
Figure 2: Top ten cocoa bean exporting countries in 2009
Source: FAOSTAT
PRODUCTION Cocoa production in Ghana is based on smallholder farmers. About 700,000 households are growing cocoa mostly on plots of 2-3 ha with small plantations (ICCO, 2006). Ghana previously cultivated the “Amazons” and “Amelonado” cocoa varieties, although hybrid varieties, which outperform the older varieties, were introduced in 1984 by the government. By 2002, 57 percent of farmers from the three main areas of production were cultivating hybrid varieties (Vigneri 2005). Hybrid varieties not only produce more fruit per pod but also bear fruit earlier (in three instead of five years) in comparison to the older varieties (Kolavalli and Vigneri, 2011). However, hybrid varieties also need more care and have the highest output in the presence of optimal weather conditions, in addition to the application of additional farming practices such as fertilizer application, pruning and spraying of pesticides.
0
500
1000
1500
2000
2500
3000
3500
0
500000
1000000
1500000
2000000
2500000
3000000
Quantity in tonnes (left scale)
Value (1000 $) (left scale)
Unit value ($/tonne) (right scale)
3
With hybrid varieties, farmers are also required to make more harvest rounds at the beginning and at the end of the season, a practice, they find inconvenient as it can conflict with complementary farming or trading responsibilities (Bohaene, 1999; Bloomfield and Lass, 1992).
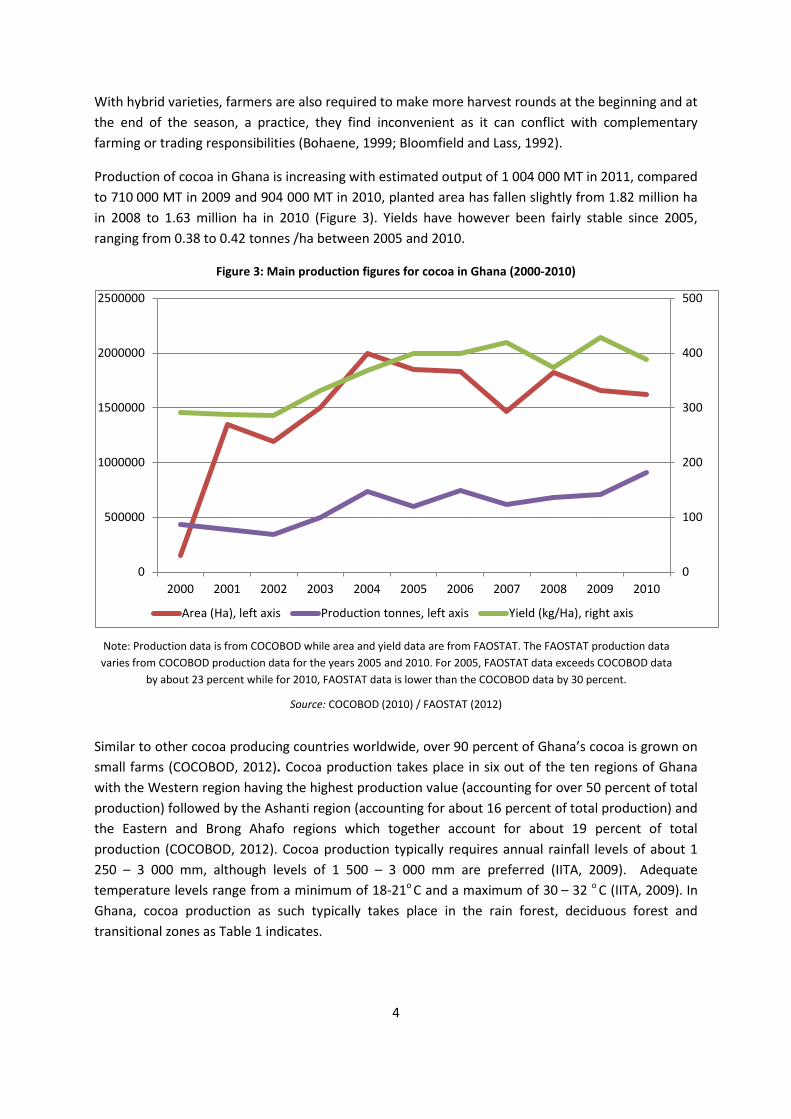
Production of cocoa in Ghana is increasing with estimated output of 1 004 000 MT in 2011, compared to 710 000 MT in 2009 and 904 000 MT in 2010, planted area has fallen slightly from 1.82 million ha in 2008 to 1.63 million ha in 2010 (Figure 3). Yields have however been fairly stable since 2005, ranging from 0.38 to 0.42 tonnes /ha between 2005 and 2010.
Figure 3: Main production figures for cocoa in Ghana (2000-2010)
Note: Production data is from COCOBOD while area and yield data are from FAOSTAT. The FAOSTAT production data varies from COCOBOD production data for the years 2005 and 2010. For 2005, FAOSTAT data exceeds COCOBOD data
by about 23 percent while for 2010, FAOSTAT data is lower than the COCOBOD data by 30 percent.
Source: COCOBOD (2010) / FAOSTAT (2012)
Similar to other cocoa producing countries worldwide, over 90 percent of Ghana’s cocoa is grown on small farms (COCOBOD, 2012). Cocoa production takes place in six out of the ten regions of Ghana with the Western region having the highest production value (accounting for over 50 percent of total production) followed by the Ashanti region (accounting for about 16 percent of total production) and the Eastern and Brong Ahafo regions which together account for about 19 percent of total production (COCOBOD, 2012). Cocoa production typically requires annual rainfall levels of about 1 250 – 3 000 mm, although levels of 1 500 – 3 000 mm are preferred (IITA, 2009). Adequate temperature levels range from a minimum of 18-21o C and a maximum of 30 – 32 o C (IITA, 2009). In Ghana, cocoa production as such typically takes place in the rain forest, deciduous forest and transitional zones as Table 1 indicates.
0
100
200
300
400
500
0
500000
1000000
1500000
2000000
2500000
2000 2001 2002 2003 2004 2005 2006 2007 2008 2009 2010
Area (Ha), left axis Production tonnes, left axis Yield (kg/Ha), right axis
4
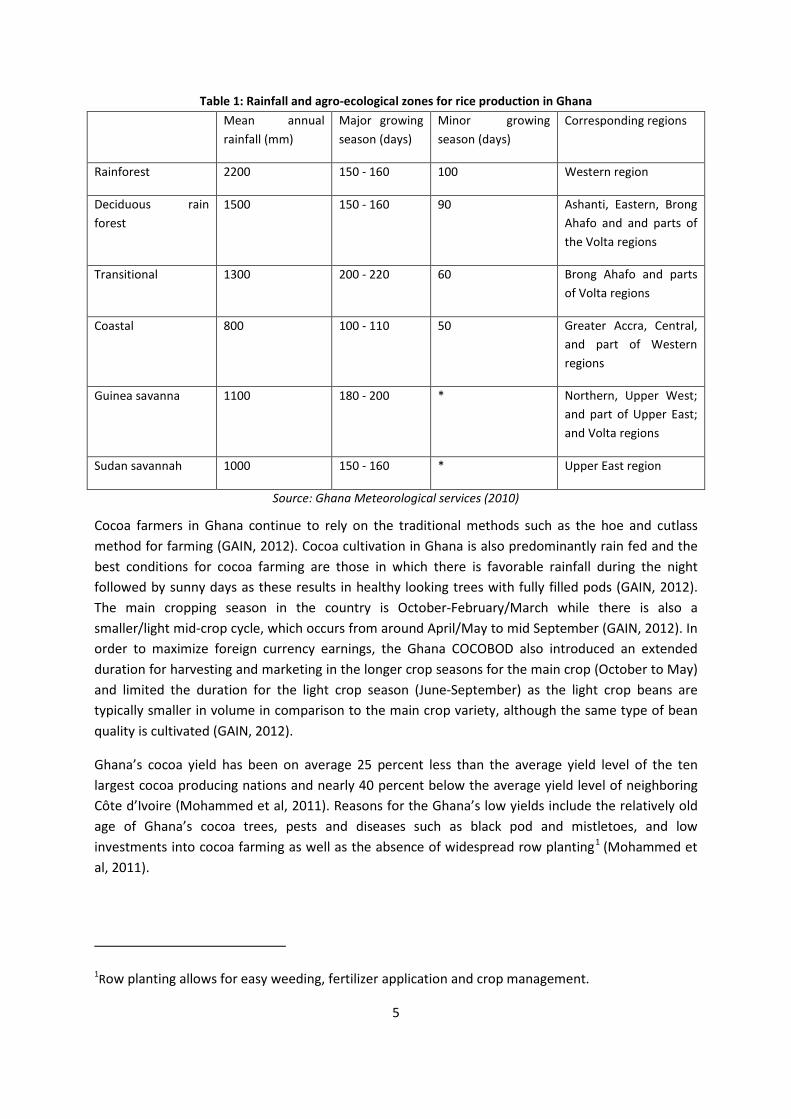
Table 1: Rainfall and agro-ecological zones for rice production in Ghana Mean annual
rainfall (mm) Major growing season (days)
Minor growing season (days)
Corresponding regions
Rainforest 2200 150 - 160 100 Western region
Deciduous rain forest
1500 150 - 160 90 Ashanti, Eastern, Brong Ahafo and and parts of the Volta regions
Transitional 1300 200 - 220 60 Brong Ahafo and parts of Volta regions
Coastal 800 100 - 110 50 Greater Accra, Central, and part of Western regions
Guinea savanna 1100 180 - 200 * Northern, Upper West; and part of Upper East; and Volta regions
Sudan savannah 1000 150 - 160 * Upper East region
Source: Ghana Meteorological services (2010)
Cocoa farmers in Ghana continue to rely on the traditional methods such as the hoe and cutlass method for farming (GAIN, 2012). Cocoa cultivation in Ghana is also predominantly rain fed and the best conditions for cocoa farming are those in which there is favorable rainfall during the night followed by sunny days as these results in healthy looking trees with fully filled pods (GAIN, 2012). The main cropping season in the country is October-February/March while there is also a smaller/light mid-crop cycle, which occurs from around April/May to mid September (GAIN, 2012). In order to maximize foreign currency earnings, the Ghana COCOBOD also introduced an extended duration for harvesting and marketing in the longer crop seasons for the main crop (October to May) and limited the duration for the light crop season (June-September) as the light crop beans are typically smaller in volume in comparison to the main crop variety, although the same type of bean quality is cultivated (GAIN, 2012).
Ghana’s cocoa yield has been on average 25 percent less than the average yield level of the ten largest cocoa producing nations and nearly 40 percent below the average yield level of neighboring Côte d’Ivoire (Mohammed et al, 2011). Reasons for the Ghana’s low yields include the relatively old age of Ghana’s cocoa trees, pests and diseases such as black pod and mistletoes, and low investments into cocoa farming as well as the absence of widespread row planting1 (Mohammed et al, 2011).
1Row planting allows for easy weeding, fertilizer application and crop management.
5
Cocoa harvesting is labor intensive and requires that farmers carefully cut the pods from the tree so as to prevent damaging the entire tree (ICCO, 2012). Pods also have to be cut open carefully to avoid damaging the beans. Although mechanized systems have been developed to ease the labor burden, this often damages the beans and hence is not very popular among farmers (ICCO, 2012). After the pulp and seeds have been removed, they are put together to ferment in a process called sweating, which is important for the development of the bitter taste of the beans (Abenyega, 2003). The fermented pulp is left to trickle away leaving the seeds; in Ghana however, the Cocoa research institute has started distilling the liquefied pulp into alcohol (Abenyega, 2003). The fermented seeds are then dried, typically on raised bamboo mats, to reduce the moisture content to about 7.5 percent of its original moisture content (ICCO, 2012).
At this stage, the beans are either exported or further processed via sorting, cleaning and roasting (at temperature of 120oC to 149oC) to develop the color and flavor (ICCO, 2012). The beans are then crushed to release the nib from the shell and then winnowed (blown) through a tunnel to separate the nib and shell. After this, the nibs are crushed into a mass, which is then heavily pressed until the mass is separated into butter (55- 60 percent) and a powder (COCOBOD, 2012). The International Cocoa Standards require cocoa of tradable quality to be fermented, thoroughly dried, free from smoky beans, abnormal or foreign odor and free from any evidence of adulteration (GAIN, 2012). The beans must be fairly free from living insects, broken beans, and fragments; pieces must also be seasonably uniform in size. In the world cocoa market, cocoa beans are most valued for their flavor (GAIN, 2012). Ghana cocoa beans, which are richer in Theobromine and Flavonoids, which render the beans their unique, mild and rounded flavor has become the world’s standard against which all cocoa is measured (GAIN, 2012).
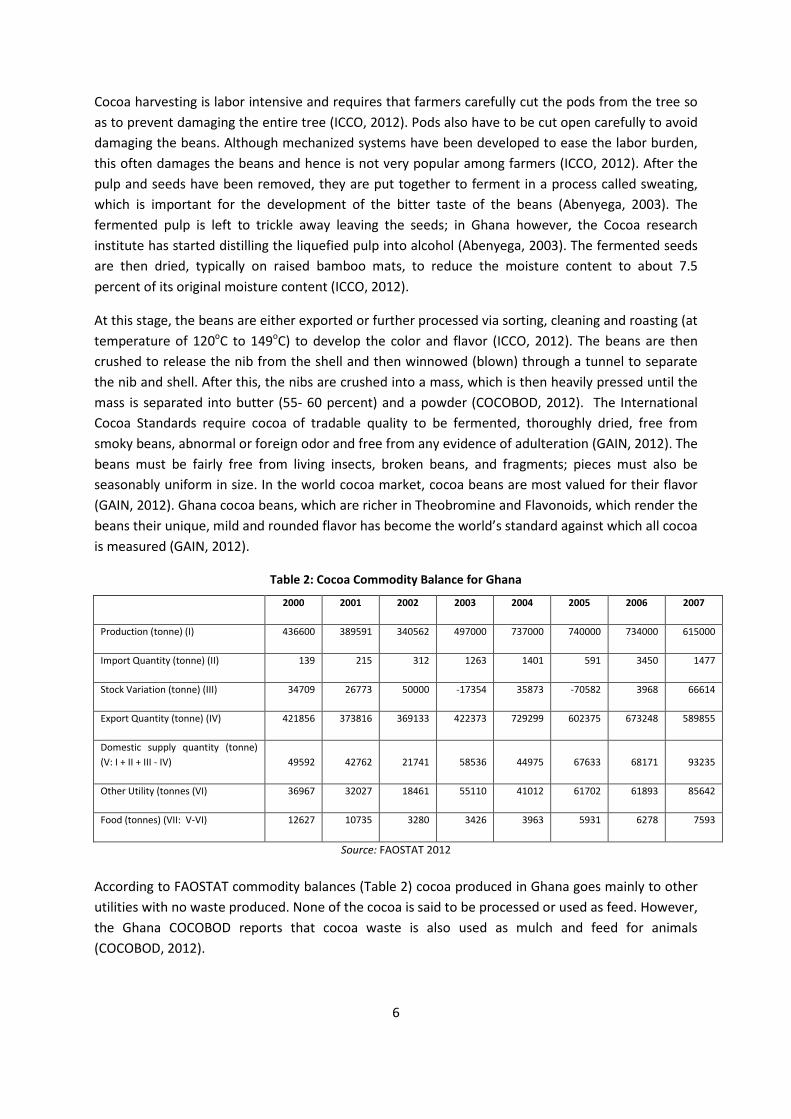
Table 2: Cocoa Commodity Balance for Ghana
2000 2001 2002 2003 2004 2005 2006 2007
Production (tonne) (I) 436600 389591 340562 497000 737000 740000 734000 615000
Import Quantity (tonne) (II) 139 215 312 1263 1401 591 3450 1477
Stock Variation (tonne) (III) 34709 26773 50000 -17354 35873 -70582 3968 66614
Export Quantity (tonne) (IV) 421856 373816 369133 422373 729299 602375 673248 589855
Domestic supply quantity (tonne) (V: I + II + III - IV) 49592 42762 21741 58536 44975 67633 68171 93235
Other Utility (tonnes (VI) 36967 32027 18461 55110 41012 61702 61893 85642
Food (tonnes) (VII: V-VI) 12627 10735 3280 3426 3963 5931 6278 7593
Source: FAOSTAT 2012
According to FAOSTAT commodity balances (Table 2) cocoa produced in Ghana goes mainly to other utilities with no waste produced. None of the cocoa is said to be processed or used as feed. However, the Ghana COCOBOD reports that cocoa waste is also used as mulch and feed for animals (COCOBOD, 2012).
6
CONSUMPTION/UTILIZATION National consumption of cocoa by-products is negligible if we consider that only a small quantity of the light crop is sold by COCOBOD to local processing companies. There are four major cocoa processing companies in Ghana that process the cocoa beans into primary products, such as, liquor, butter, powder and cake. Only 10 percent of the locally processed cocoa is used for the production of confectionary products for the local market. In Ghana, there are about ten companies that produce cocoa confectionery products, such as, chocolate, cocoa beverages, cocoa powder and other chocolate candies, ice cream, and chocolate drinks for local consumption.
MARKETING AND TRADE Over 90 percent of the cocoa produced in Ghana is of grade 1 quality (Kolavalli and Vigneri, 2011). In Ghana, cocoa producer price is not liberalized and is fixed by the COCOBOD (Kolavalli and Vigneri, 2011). Ghana exports most of the cocoa it produces in advance of the harvest season via forward contracts; this also allows COCOBOD to set yearly producer prices in advance of the harvest season (Kolavalli and Vigneri, 2011). Cocoa prices in Ghana are fixed in the following manner: the government fixes the producer price upwards by making adjustments to the cocoa price each time there is an improvement in the world market price, consequently, the price is also lowered in response to world market prices (GAIN, 2012). The producer price is adjusted based on world market price adjustments. In Ghana, the producer prices are typically announced at the commencement of the cocoa season in October (GAIN, 2012). The peak shipping season is from November to April (Kolavalli and Vigneri, 2011). One goal of the government is to reach producer price levels of 70 percent of the Free On Board (FOB) price, which was achieved in 2010/2011 (COCOBOD, 2012).
At present, there are about 26 licensed buying companies (LBCs) buying cocoa from farmers at the village level and sell to the Ghana COCOBOD (USDA, 2012), which in turn exports it through its subsidiary, the Cocoa Marketing Company Limited; the Cocoa Marketing Company Limited is the sole exporter of cocoa in Ghana (COCOBOD, 2012), and although a minimum tonnage requirement criterion was also set for LBCs to export, only 9 out of the 26 companies met the criteria, with none of them actually exporting cocoa to date (World Bank, 2009). Therefore, the Cocoa Marketing Company Limited is currently the only cocoa exporter in Ghana.
The quality control guaranteed by the government is carried out by the Quality Control Division (QCD) which undertakes grading and sealing of cocoa into export sacks.
The cocoa is transported from the producing areas to metal roofed sheds where it is weighed on certified scales. A thorough check of quality and moisture content is ensured by the manager of the storage facility who usually provides a cheque to the farmer and keeps a detailed payment record. The marketing system in Ghana ensures a form of traceability of the product which is founded on the requirement that cocoa bags are officially graded and sealed by QCD as close to the farm as possible, in the village buying sheds. Cocoa can then remain in villages for some weeks until an adequate quantity of sealed cocoa and transport is available. The buyer will then move the sealed bags to the 'hand over point' where the cocoa is sold to the government owned Cocoa Marketing Company (CMC) at a fixed price. The cocoa is purchased by CMC through the Licensed Buying Companies (LBCs)
7
and placed into large piles in airy warehouses close to the port from which vessels are loaded after fumigation. Most of the cocoa is dried at port in order to prevent mold from forming (Traoré, 2009).
Port handling is also quite lengthy. In 2006 it took 47 days for exports to leave the factory and clear the port of exit. This number of days is much longer than the benchmark, the port of Sweden, where it takes 5 days for both exports and imports, but also as compared to other African countries such as Cote d’Ivoire, Nigeria, Senegal or Togo (World Bank, 2007).
At present, rather than price competition for cocoa purchase from farmers as prices are pre-determined by the government; rather, License Buying Companies (LBCs) compete for volumes purchased. In Ghana, as opposed to other cocoa producing countries in the Western and Central Africa regions, cocoa marketing costs are relatively high at 15 percent, and the costs and margins of profit of the COCOBOD and its subsidiaries account for around 5 percent of the price of cocoa (Traoré, 2009). In Ghana, margins paid by the government to traders is said to be among the lowest in the subregion due to the large exporter margins and taxes the industry has to pay to the government (Vigneri and Santos, 2007). The cocoa value chain in Ghana can be more costly due to the increased attention paid to quality. As such, the handling cost is increased due to the intensive quality assessment (GAIN, 2012).
8
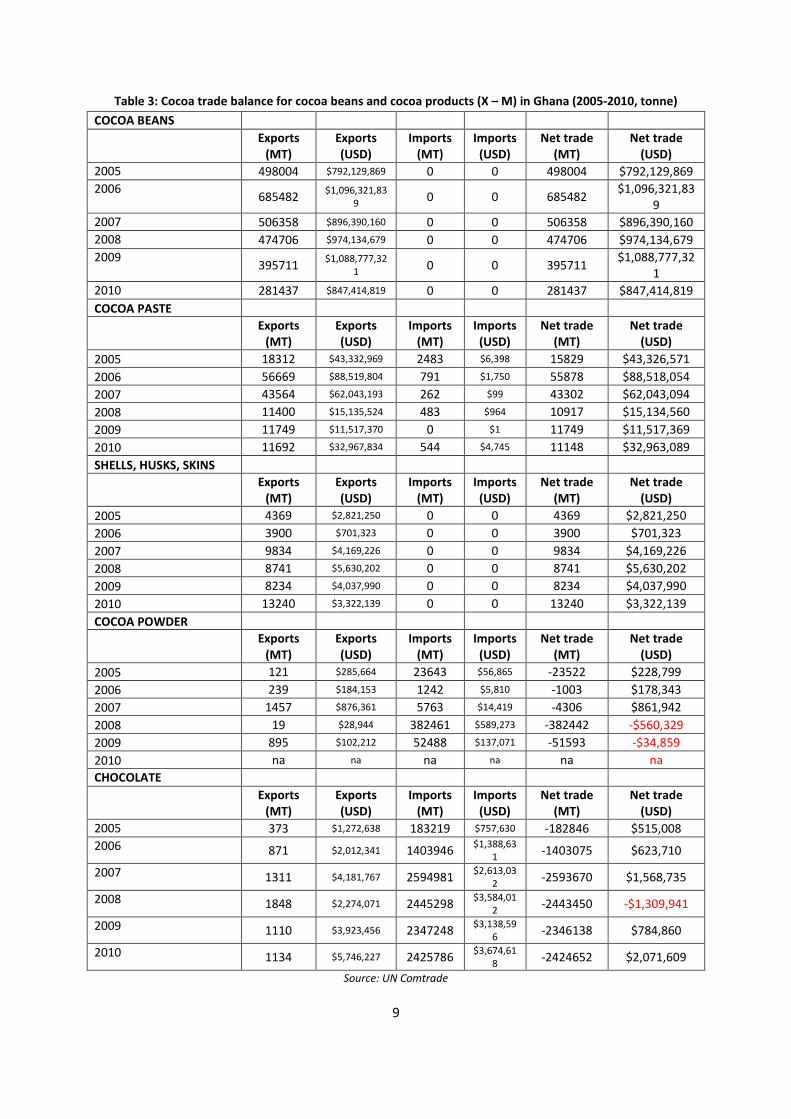
Table 3: Cocoa trade balance for cocoa beans and cocoa products (X – M) in Ghana (2005-2010, tonne) COCOA BEANS Exports
(MT) Exports (USD)
Imports (MT)
Imports (USD)
Net trade (MT)
Net trade (USD)
2005 498004 $792,129,869 0 0 498004 $792,129,869 2006 685482 $1,096,321,83
9 0 0 685482 $1,096,321,839
2007 506358 $896,390,160 0 0 506358 $896,390,160 2008 474706 $974,134,679 0 0 474706 $974,134,679 2009 395711 $1,088,777,32
1 0 0 395711 $1,088,777,321
2010 281437 $847,414,819 0 0 281437 $847,414,819 COCOA PASTE
Exports
(MT) Exports (USD)
Imports (MT)
Imports (USD)
Net trade (MT)
Net trade (USD)
2005 18312 $43,332,969 2483 $6,398 15829 $43,326,571 2006 56669 $88,519,804 791 $1,750 55878 $88,518,054 2007 43564 $62,043,193 262 $99 43302 $62,043,094 2008 11400 $15,135,524 483 $964 10917 $15,134,560 2009 11749 $11,517,370 0 $1 11749 $11,517,369 2010 11692 $32,967,834 544 $4,745 11148 $32,963,089 SHELLS, HUSKS, SKINS
Exports
(MT) Exports (USD)
Imports (MT)
Imports (USD)
Net trade (MT)
Net trade (USD)
2005 4369 $2,821,250 0 0 4369 $2,821,250 2006 3900 $701,323 0 0 3900 $701,323 2007 9834 $4,169,226 0 0 9834 $4,169,226 2008 8741 $5,630,202 0 0 8741 $5,630,202 2009 8234 $4,037,990 0 0 8234 $4,037,990 2010 13240 $3,322,139 0 0 13240 $3,322,139 COCOA POWDER
Exports
(MT) Exports (USD)
Imports (MT)
Imports (USD)
Net trade (MT)
Net trade (USD)
2005 121 $285,664 23643 $56,865 -23522 $228,799 2006 239 $184,153 1242 $5,810 -1003 $178,343 2007 1457 $876,361 5763 $14,419 -4306 $861,942 2008 19 $28,944 382461 $589,273 -382442 -$560,329 2009 895 $102,212 52488 $137,071 -51593 -$34,859 2010 na na na na na na CHOCOLATE
Exports
(MT) Exports (USD)
Imports (MT)
Imports (USD)
Net trade (MT)
Net trade (USD)
2005 373 $1,272,638 183219 $757,630 -182846 $515,008 2006 871 $2,012,341 1403946 $1,388,63
1 -1403075 $623,710
2007 1311 $4,181,767 2594981 $2,613,032 -2593670 $1,568,735
2008 1848 $2,274,071 2445298 $3,584,012 -2443450 -$1,309,941
2009 1110 $3,923,456 2347248 $3,138,596 -2346138 $784,860
2010 1134 $5,746,227 2425786 $3,674,618 -2424652 $2,071,609
Source: UN Comtrade
9
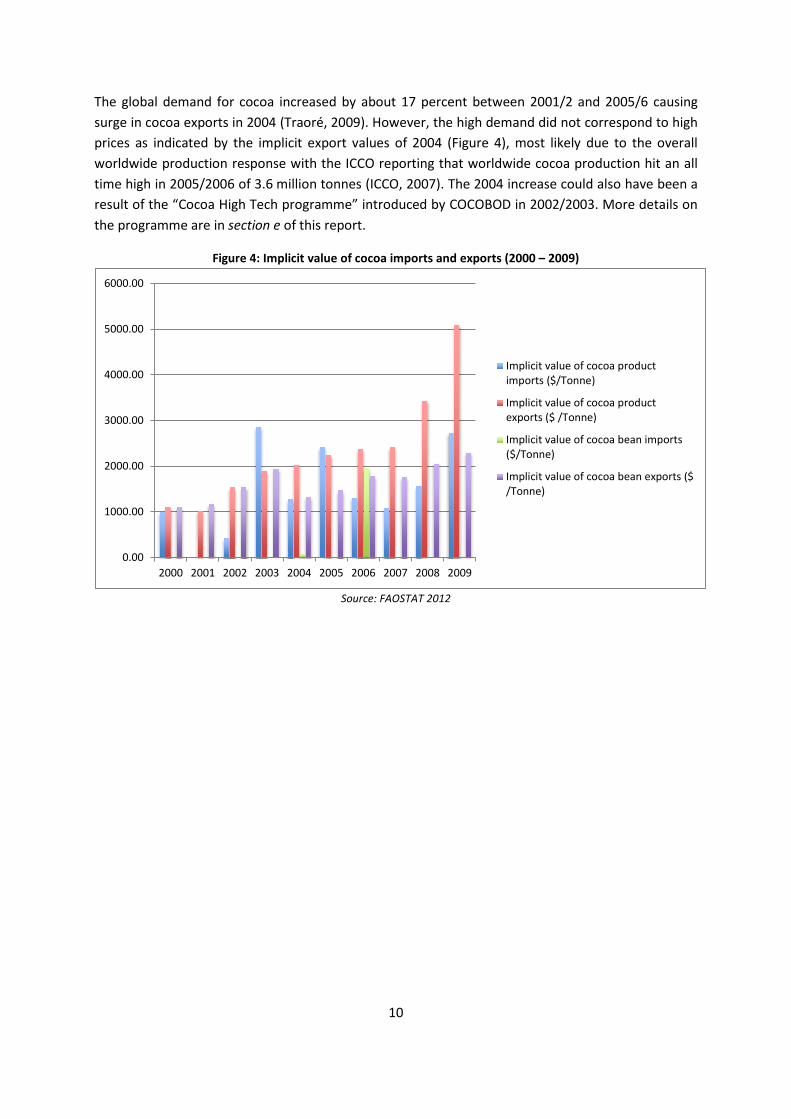
The global demand for cocoa increased by about 17 percent between 2001/2 and 2005/6 causing surge in cocoa exports in 2004 (Traoré, 2009). However, the high demand did not correspond to high prices as indicated by the implicit export values of 2004 (Figure 4), most likely due to the overall worldwide production response with the ICCO reporting that worldwide cocoa production hit an all time high in 2005/2006 of 3.6 million tonnes (ICCO, 2007). The 2004 increase could also have been a result of the “Cocoa High Tech programme” introduced by COCOBOD in 2002/2003. More details on the programme are in section e of this report.
Figure 4: Implicit value of cocoa imports and exports (2000 – 2009)
Source: FAOSTAT 2012
0.00
1000.00
2000.00
3000.00
4000.00
5000.00
6000.00
2000 2001 2002 2003 2004 2005 2006 2007 2008 2009
Implicit value of cocoa productimports ($/Tonne)
Implicit value of cocoa productexports ($ /Tonne)
Implicit value of cocoa bean imports($/Tonne)
Implicit value of cocoa bean exports ($/Tonne)
10
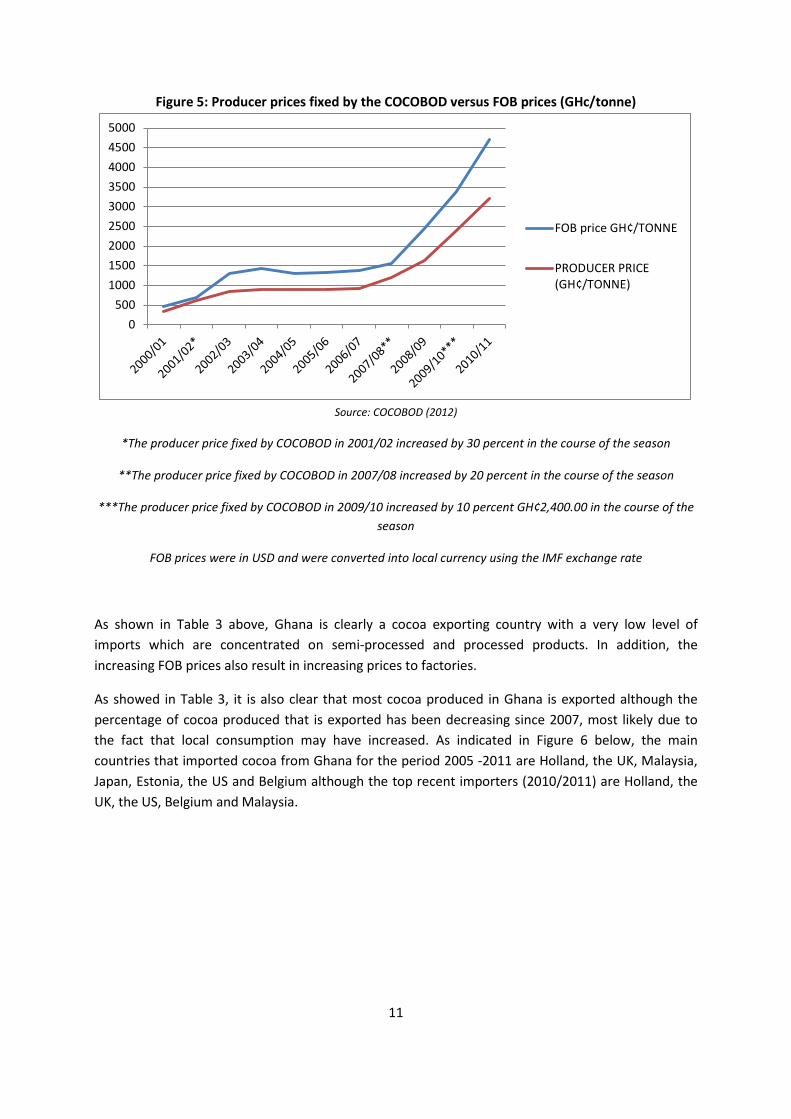
Figure 5: Producer prices fixed by the COCOBOD versus FOB prices (GHc/tonne)
Source: COCOBOD (2012)
*The producer price fixed by COCOBOD in 2001/02 increased by 30 percent in the course of the season
**The producer price fixed by COCOBOD in 2007/08 increased by 20 percent in the course of the season
***The producer price fixed by COCOBOD in 2009/10 increased by 10 percent GH¢2,400.00 in the course of the season
FOB prices were in USD and were converted into local currency using the IMF exchange rate
As shown in Table 3 above, Ghana is clearly a cocoa exporting country with a very low level of imports which are concentrated on semi-processed and processed products. In addition, the increasing FOB prices also result in increasing prices to factories.
As showed in Table 3, it is also clear that most cocoa produced in Ghana is exported although the percentage of cocoa produced that is exported has been decreasing since 2007, most likely due to the fact that local consumption may have increased. As indicated in Figure 6 below, the main countries that imported cocoa from Ghana for the period 2005 -2011 are Holland, the UK, Malaysia, Japan, Estonia, the US and Belgium although the top recent importers (2010/2011) are Holland, the UK, the US, Belgium and Malaysia.
0500
100015002000250030003500400045005000
FOB price GH¢/TONNE
PRODUCER PRICE(GH¢/TONNE)
11
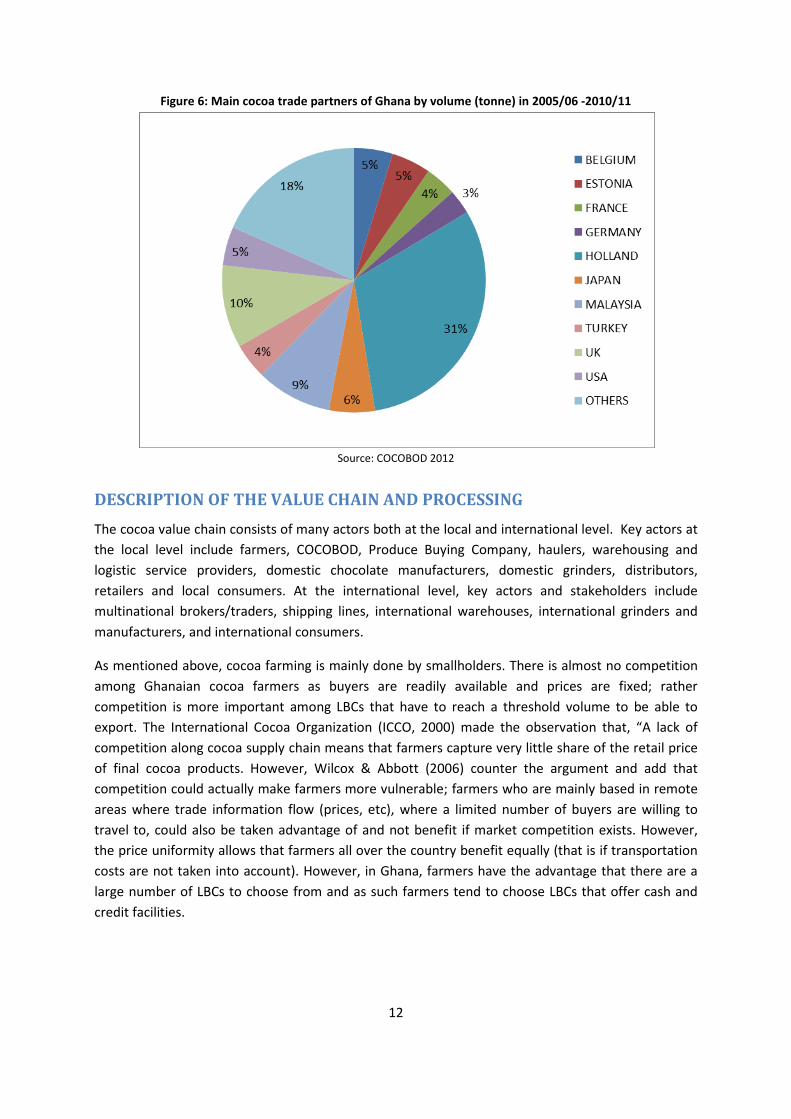
Figure 6: Main cocoa trade partners of Ghana by volume (tonne) in 2005/06 -2010/11
Source: COCOBOD 2012
DESCRIPTION OF THE VALUE CHAIN AND PROCESSING The cocoa value chain consists of many actors both at the local and international level. Key actors at the local level include farmers, COCOBOD, Produce Buying Company, haulers, warehousing and logistic service providers, domestic chocolate manufacturers, domestic grinders, distributors, retailers and local consumers. At the international level, key actors and stakeholders include multinational brokers/traders, shipping lines, international warehouses, international grinders and manufacturers, and international consumers.
As mentioned above, cocoa farming is mainly done by smallholders. There is almost no competition among Ghanaian cocoa farmers as buyers are readily available and prices are fixed; rather competition is more important among LBCs that have to reach a threshold volume to be able to export. The International Cocoa Organization (ICCO, 2000) made the observation that, “A lack of competition along cocoa supply chain means that farmers capture very little share of the retail price of final cocoa products. However, Wilcox & Abbott (2006) counter the argument and add that competition could actually make farmers more vulnerable; farmers who are mainly based in remote areas where trade information flow (prices, etc), where a limited number of buyers are willing to travel to, could also be taken advantage of and not benefit if market competition exists. However, the price uniformity allows that farmers all over the country benefit equally (that is if transportation costs are not taken into account). However, in Ghana, farmers have the advantage that there are a large number of LBCs to choose from and as such farmers tend to choose LBCs that offer cash and credit facilities.
12
Description of main features of cocoa value chain in Ghana
The key institutional players in the internal marketing structure in Ghana are the Licensed Buying Companies (LBCs), which are located in each of the cocoa growing regions in Ghana except the Volta Region where the Produce Buying Company, which was the former subsidiary of COCOBOD operates (Anthonio and Aikins, 2009). There are about 3000 cocoa buying societies or centers (villages, hamlets, cottages etc) from which the LBCs buy cocoa. Farmers send their produce to the buying societies or centers typically on foot, as road networks are not well-established (COCOBOD, 2012).The LBCs employ purchasing clerks who buy the cocoa from the centers on behalf of LBCs. The LBCs purchase cocoa from the farmers using the Akuafo check 2(Anthonio and Aikins, 2009) designed specifically to pay farmers. The checks are submitted by LBCs to the banks for authentication and reissued for use in exchange for produce sold by farmers. It bears the name of the farmer and weight in kilograms of cocoa sold (Anthonio and Aikins, 2009). The Akuafo Cheque implementation scheme has the objective to increase banking and savings in rural areas.
2 The Akuafo Cheque system was introduced at the beginning of the cocoa season in 1982 with the purpose of paying the farmers for their cocoa bean supplies with Government printed checks instead of cash and/or Government chits/vouchers. The vouchers presented a problem for the farmers due to their slow redemption and consequent lack of liquidity. It was within this framework that the check system was introduced. As part of the programme every cocoa farmer was required to have a savings account to be able to change the check into cash.
13
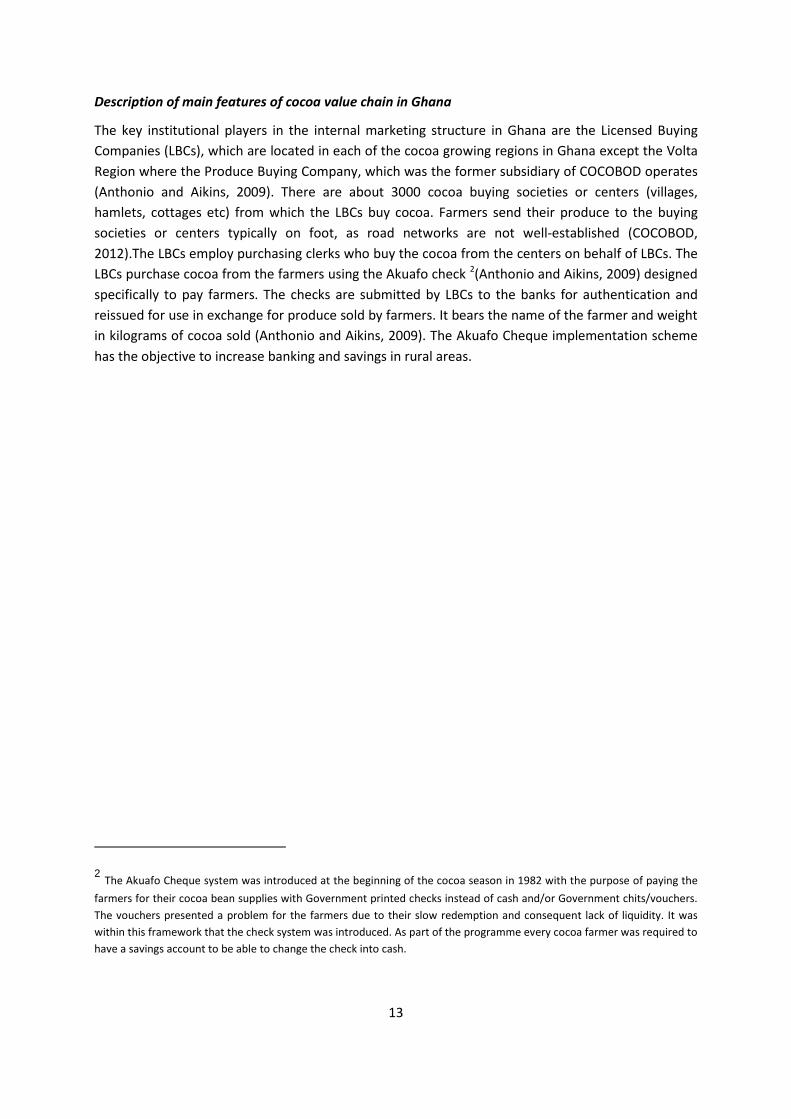
Figure 7: Value Chain for cocoa in Ghana
Source: Mohammed, 2011
The purchasing clerks after buying the cocoa, bag it at the acceptable weight and prepare it for grading and sealing. The Ghana COCOBOD and other private parties also offer warehousing and storage facilities, which they offer to purchasing clerks and farmers. The cocoa is then transported to one of the three take-over points or inland ports (Takoradi, Tema, and Kumasi) (Anthonio and Aikins, 2009). Typically, higher quality cocoa beans are exported while lower grade cocoa beans are sold to local processors and confectionary manufacturers who in turn sell manufactured products to retailers (GAIN, 2012).
Processing at origin however has certain disadvantages such as transport costs to end-users, shipment of cocoa liquor and butter in solid form in contrast to shipment by processors in consumer
14
countries in liquid and heated form, tariff escalation, and competition from industrialized-country processors, who ship on a just- in-time basis, in contrast to producers nations who have less control over the delivery date (Kolavalli and Vigneri, 2011). Many in-country processing companies have not met quality and hygiene standards demanded by end-users in Ghana.
At the international level, shipping lines may either sell cocoa beans and cocoa products to multi-national traders/brokers or to grinders. Warehouses and grinders also sell the cocoa beans to international manufacturers for the production of confectionaries, cosmetics and alcohol.
Internationally, there are three companies – Cargill, ADM, and Barry Callebaut – grinding 40 per cent of the world’s cocoa, although Singapore-based company, Olam, has joined the top four cocoa grinders (Traoré, 2009). The Netherlands is the world’s leading cocoa grinder and largest exporter of cocoa paste (24 percent of the total), cocoa powder (28 percent) and cocoa butter (30 percent). Relative a new comer, Olam, based in Singapore, is now one of the top four cocoa grinders (Fairtrade, 2011).
While the Cocoa Board has often been hailed as being key to the success of Ghana’s current cocoa status, authors such as Teal and Zeitlin (2006) attribute the country’s success to the overall high price incentives globally and criticize that COCOBOD has not been effective in removing production constraints and introducing measures that enhance productivity. However, there are several predictions that cocoa will continue to remain crucial to Ghana’s economy. In addition to the overall increase in consumer appeal for cocoa due to its reported scientific benefits, the World Bank (2007) predicts that global market prices for cocoa will remain high (ICCO, 2007; World Bank, 2007). In addition, as shown in Figure 8 in comparison to other leading cocoa producing nations, Ghana is still operating below its potential yield levels and hence still has room for growth (FAO 2005; ICCO 2007). The government also continues to support productivity enhancements in the cocoa sector, as evidenced by an increase in producer prices, partial liberalization of internal marketing, putting in place of a price stabilization system, government-backed spraying programs, fertilizer credits, and improvements in extension systems, and the privatization of input distribution (ICCO 2007; Laven 2007).
15
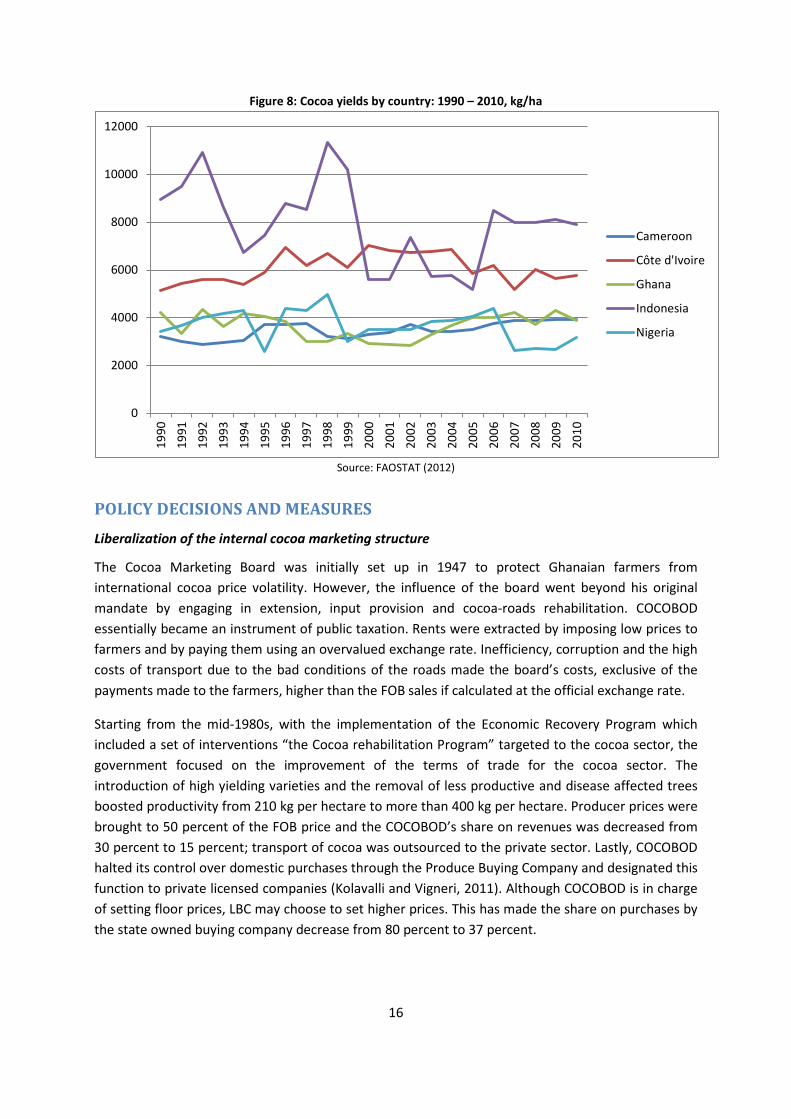
Figure 8: Cocoa yields by country: 1990 – 2010, kg/ha
Source: FAOSTAT (2012)
POLICY DECISIONS AND MEASURES Liberalization of the internal cocoa marketing structure
The Cocoa Marketing Board was initially set up in 1947 to protect Ghanaian farmers from international cocoa price volatility. However, the influence of the board went beyond his original mandate by engaging in extension, input provision and cocoa-roads rehabilitation. COCOBOD essentially became an instrument of public taxation. Rents were extracted by imposing low prices to farmers and by paying them using an overvalued exchange rate. Inefficiency, corruption and the high costs of transport due to the bad conditions of the roads made the board’s costs, exclusive of the payments made to the farmers, higher than the FOB sales if calculated at the official exchange rate.
Starting from the mid-1980s, with the implementation of the Economic Recovery Program which included a set of interventions “the Cocoa rehabilitation Program” targeted to the cocoa sector, the government focused on the improvement of the terms of trade for the cocoa sector. The introduction of high yielding varieties and the removal of less productive and disease affected trees boosted productivity from 210 kg per hectare to more than 400 kg per hectare. Producer prices were brought to 50 percent of the FOB price and the COCOBOD’s share on revenues was decreased from 30 percent to 15 percent; transport of cocoa was outsourced to the private sector. Lastly, COCOBOD halted its control over domestic purchases through the Produce Buying Company and designated this function to private licensed companies (Kolavalli and Vigneri, 2011). Although COCOBOD is in charge of setting floor prices, LBC may choose to set higher prices. This has made the share on purchases by the state owned buying company decrease from 80 percent to 37 percent.
0
2000
4000
6000
8000
10000
12000
1990
1991
1992
1993
1994
1995
1996
1997
1998
1999
2000
2001
2002
2003
2004
2005
2006
2007
2008
2009
2010
Cameroon
Côte d'Ivoire
Ghana
Indonesia
Nigeria
16
Since then, production of cocoa has been positively correlated with the number of licensed buying companies at the village level (Zeitlin, 2006). In addition, the farmers have mentioned that via the introduction of LBCs, payments have become more reliable and corrupt practices have decreased greatly (Kolavalli and Vigneri, 2011). LBCs also sometimes offer farmers incentives in the form of bonuses, input subsidies and/or credit facilities in order to attract and maintain relations with farmers (Laven, 2007). LBCs also purchase cocoa with cash, which enables resource-constrained farmers to gain better access to production inputs (Kolavalli and Vigneri, 2011).
In addition to liberalizing the internal marketing structure of the cocoa industry in Ghana, heavy staff cuts within the COCOBOD, from 10 400 in 1995 to about 5 200 in 2004, have been made (World Bank, 2009).
The cocoa rehabilitation program has contributed to enhance the country reputation for high quality cocoa beans because of their slightly higher butter content and low levels of spoiled beans. In addition to these features the cocoa marketing company which is a government division in charge of export is internationally renowned for ensuring consistency, reliability and high quality export beans Cocoa beans from Ghana, as a result, receive a premium of 3-5 percent on international markets if compared to Cote d’Ivoire, the world largest producer (Gilbert, 2009).
However, quality control on exported cocoa beans and cocoa products, monopsonic price setting to the producers and external marketing by the COCOBOD are still in place (World Bank, 2011). Even though new licensed buying companies are operating and purchasing from the farmers they are not entitled to export as they are not large enough to reach the required minimum amounts.
Essentially, the institutional arrangement that governs the cocoa sector and cocoa external marketing has an essential role in ensuring a price premium for the Ghanaian cocoa sector on the international market. Other emerging cocoa exporters such as Malaysia and Indonesia do not have such institutional frameworks which ensure tight monitoring on cocoa exports. However, considering the increasing competition on the international markets, Ghana would need a long term strategy which should rely more heavily on the private sector especially on farmer associations. The need to review the institutional set up of the sector has arisen also in light of recent shifts by a significant number of farmers to crops other than cocoa mainly, cassava, oil palm and maize which are generating higher returns as compared to cocoa (World Bank, 2011)
Productivity increasing investments
The supply of inputs to producers continues to be carried out by COCOBOD. Although inputs were subsidized until 1993 (Shepherd and Farolfi, 1999), it usually did not reach remote regions. In 1996, the subsidies were however withdrawn. Following pressure from farmer-based organizations, the government intervened by subsidizing the price of insecticides and fungicides. In 2002/2003 growing season, COCOBOD introduced the “Cocoa High-Tech” programme. In the programme, fertilizers were supplied to farmers on credit so as to encourage farmers apply a minimum of two fertilizer bags per acre of land cultivated (COCOBOD, 2012). The programme however failed due to the low repayment rate by farmers.
17
To revive fertilizer application among farmers, a privately- funded programme known as Cocoa Abrabopa Association was introduced by an input provider, Wienco Ghana Ltd, to offer input packages and monetary loans to farmer groups on revolving credit terms, with education and training also provided to farmers as part of the package. Farmer groups were jointly liable for repayment. Repayment was to be made in cash (Opoku et al, 2009). As of 2008, the scheme had 10 000 registered members (Opoku et al, 2009), however it has been documented that 40 percent of the farmers dropped the programme (World Bank, 2011)).
To control capsid and black pod disease spread, the Cocoa National Disease and Pest Control Committee was formed in 2001 to develop disease control strategies (COCOBOD, 2012). Upon the recommendation of the committee, the COCOBOD sprays all cocoa fields free of charge for producers (COCOBOD, 2012). COCOBOD attributes the 2003/2004 and subsequent years production success to the programme. The programme has also been said to encourage farmers to take up additional pest control measures.
In addition to these programmes, COCOBOD also supports research efforts through the Cocoa Research Institute and continues to supply planting material to producers so as to phase out older tree varieties (COCOBOD, 2012). COCOBOD also provides infrastructure to farmers by constructing feeder roads, which connect to major roads for the transport of produce to transit points and to ensure pricing uniformity among farmers (reduction in transportation costs) (COCOBOD, 2012).
The Ghana Strategy Support Programme (GSSP), which was initiated in 2005, also has a cocoa support strategy (GSSP, 2005). The strategy is mainly targeted at improving the cocoa sector via the introduction of a high tech package consisting of hybrid seeds, fertilizers, pesticides and fungicides, which is also in line with the 2001 COCOBOD strategy (GSSP, 2005).
In order to improve market measures, the GSSP has also put in place a policy to develop a comprehensive value chain for cocoa. One aim of the strategy is to increase the percentage of locally processed cocoa to 50 percent as was stated in the 2007 budget statement (GSSP, 2005).
Specific strategies being presently applied in cocoa sub-sector include:
• promotion of research on the commercialization of substandard cocoa and cocoa wastes to enhance value addition;
• improvement in internal and external marketing strategies of cocoa through competition and equal access to COCOBOD's storage and crop financing facilities;
• rehabilitation of roads in cocoa-growing areas to facilitate the evacuation of the crop;
• maintaining the quality control responsibility within the public institution.
18
Trade Policy
Cocoa exports attract the following duties and taxes3:
• export tax for cocoa is presently set at approximately 25 percent (Kolavalli and Vigneri, 2011). The level of taxation on cocoa exports is established annually by the Minister of Finance and Economic Planning and accounts for the export duty and the COCOBOD’s marketing costs. Taxes are collected by the COCOBOD and then transferred to the government. Export tax payments declined from an average 40-50 percent of fob earnings to less than 10 percent in 2004. Receipts from cocoa export taxation currently account for a share of 4 to 5 percent of total government tax receipts (OECD, 2008);
• import duty: to protect the domestic market, Ghana applies a duty of 20 percent on cocoa imports.
Import tariffs applied by main destination countries
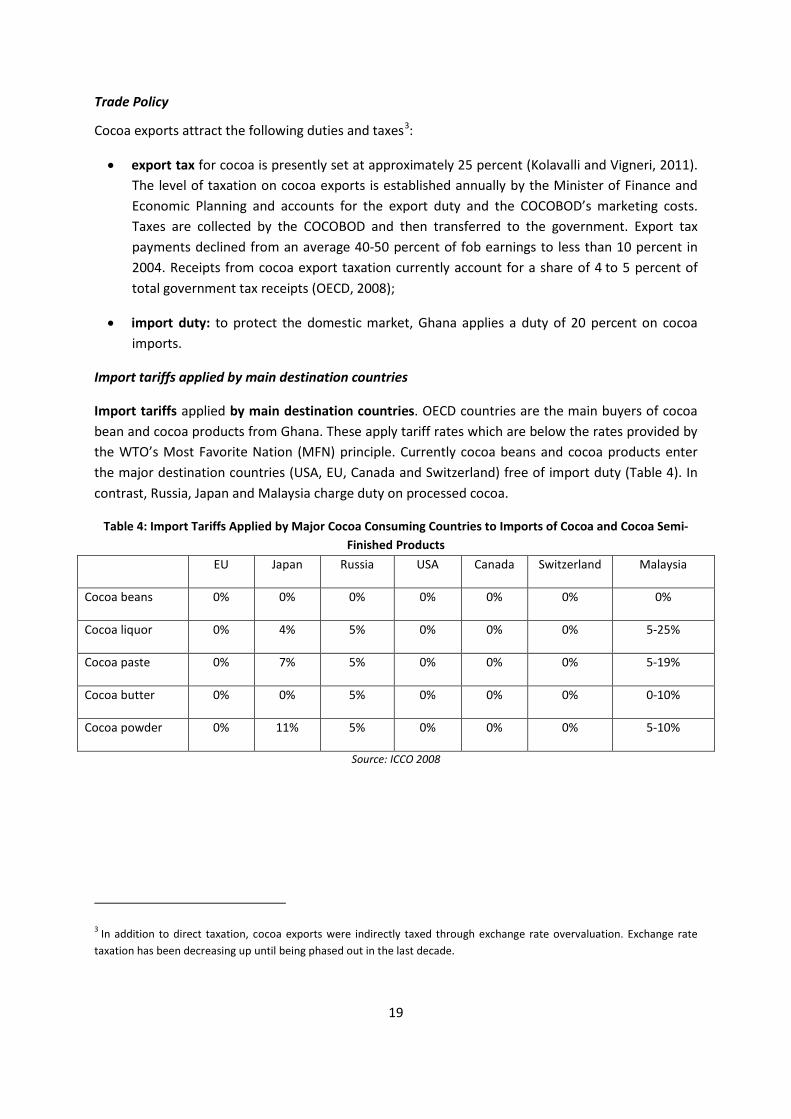
Import tariffs applied by main destination countries. OECD countries are the main buyers of cocoa bean and cocoa products from Ghana. These apply tariff rates which are below the rates provided by the WTO’s Most Favorite Nation (MFN) principle. Currently cocoa beans and cocoa products enter the major destination countries (USA, EU, Canada and Switzerland) free of import duty (Table 4). In contrast, Russia, Japan and Malaysia charge duty on processed cocoa.
Table 4: Import Tariffs Applied by Major Cocoa Consuming Countries to Imports of Cocoa and Cocoa Semi-Finished Products
EU Japan Russia USA Canada Switzerland Malaysia
Cocoa beans 0% 0% 0% 0% 0% 0% 0%
Cocoa liquor 0% 4% 5% 0% 0% 0% 5-25%
Cocoa paste 0% 7% 5% 0% 0% 0% 5-19%
Cocoa butter 0% 0% 5% 0% 0% 0% 0-10%
Cocoa powder 0% 11% 5% 0% 0% 0% 5-10%
Source: ICCO 2008
3 In addition to direct taxation, cocoa exports were indirectly taxed through exchange rate overvaluation. Exchange rate taxation has been decreasing up until being phased out in the last decade.
19
DATA REQUIREMENTS, DESCRIPTION AND CALCULATION OF INDICATORS
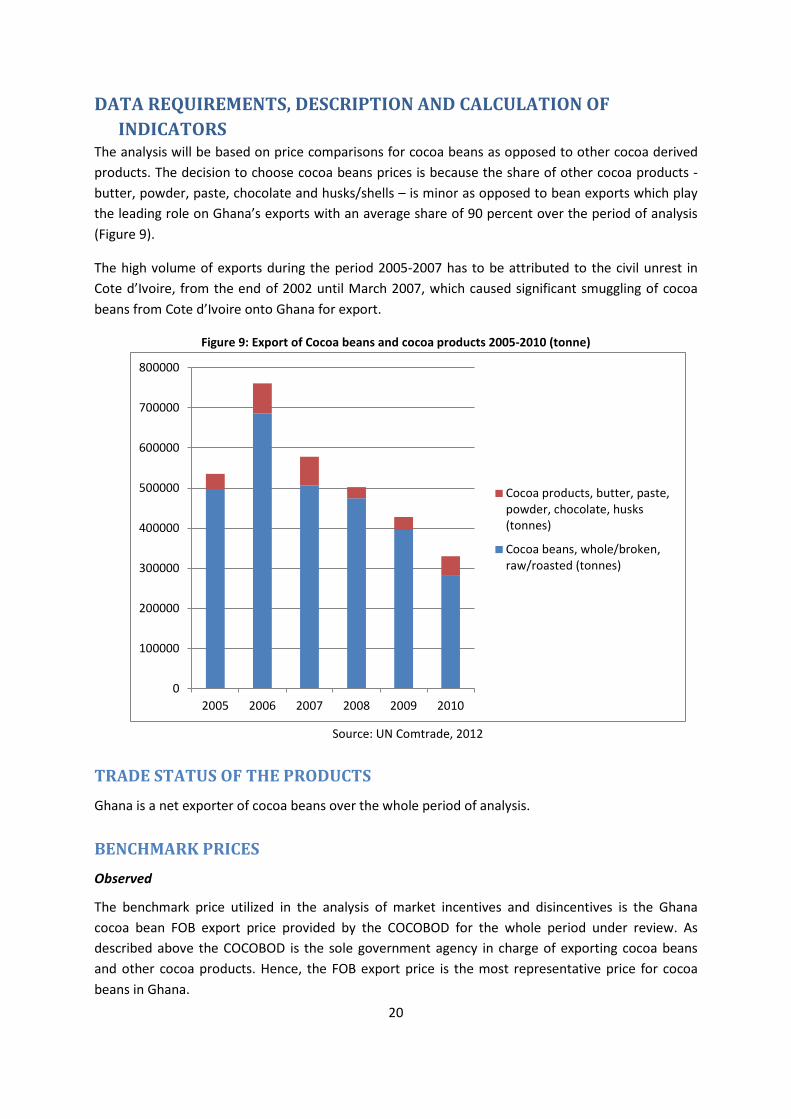
The analysis will be based on price comparisons for cocoa beans as opposed to other cocoa derived products. The decision to choose cocoa beans prices is because the share of other cocoa products - butter, powder, paste, chocolate and husks/shells – is minor as opposed to bean exports which play the leading role on Ghana’s exports with an average share of 90 percent over the period of analysis (Figure 9).
The high volume of exports during the period 2005-2007 has to be attributed to the civil unrest in Cote d’Ivoire, from the end of 2002 until March 2007, which caused significant smuggling of cocoa beans from Cote d’Ivoire onto Ghana for export.
Figure 9: Export of Cocoa beans and cocoa products 2005-2010 (tonne)
Source: UN Comtrade, 2012
TRADE STATUS OF THE PRODUCTS Ghana is a net exporter of cocoa beans over the whole period of analysis.
BENCHMARK PRICES Observed
The benchmark price utilized in the analysis of market incentives and disincentives is the Ghana cocoa bean FOB export price provided by the COCOBOD for the whole period under review. As described above the COCOBOD is the sole government agency in charge of exporting cocoa beans and other cocoa products. Hence, the FOB export price is the most representative price for cocoa beans in Ghana.
0
100000
200000
300000
400000
500000
600000
700000
800000
2005 2006 2007 2008 2009 2010
Cocoa products, butter, paste,powder, chocolate, husks(tonnes)
Cocoa beans, whole/broken,raw/roasted (tonnes)
20
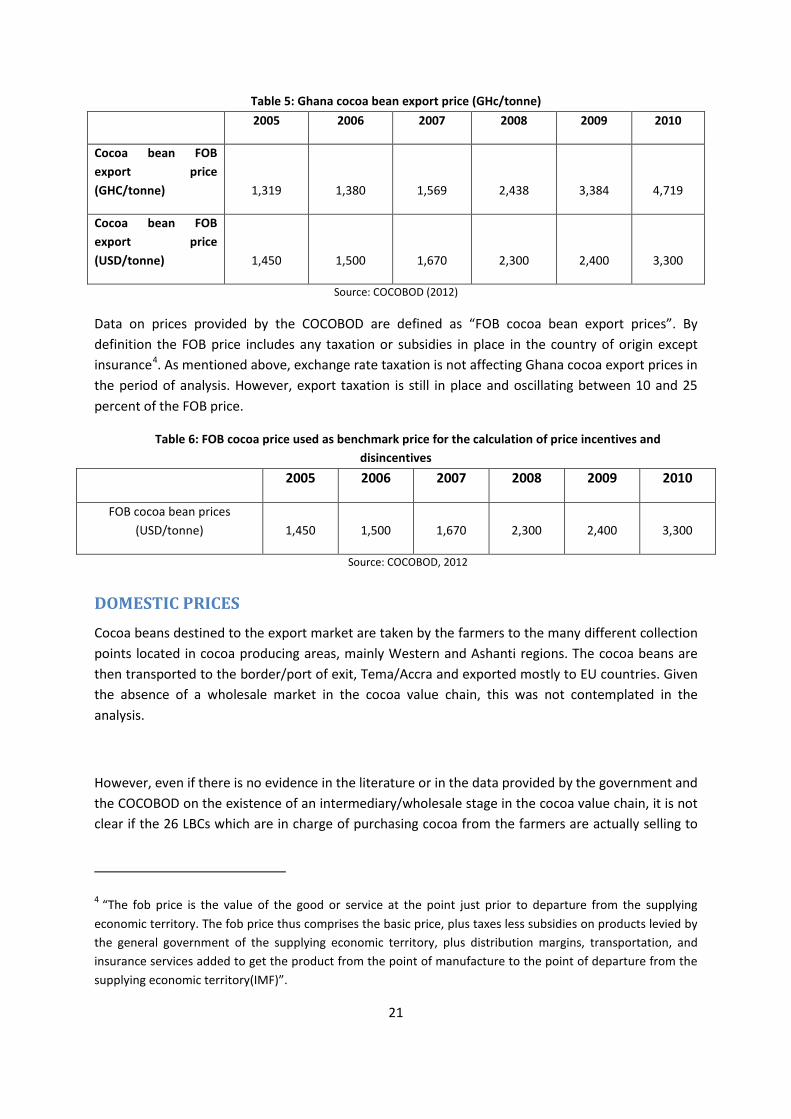
Table 5: Ghana cocoa bean export price (GHc/tonne) 2005 2006 2007 2008 2009 2010
Cocoa bean FOB export price (GHC/tonne) 1,319 1,380 1,569 2,438 3,384 4,719
Cocoa bean FOB export price (USD/tonne) 1,450 1,500 1,670 2,300 2,400 3,300
Source: COCOBOD (2012)
Data on prices provided by the COCOBOD are defined as “FOB cocoa bean export prices”. By definition the FOB price includes any taxation or subsidies in place in the country of origin except insurance4. As mentioned above, exchange rate taxation is not affecting Ghana cocoa export prices in the period of analysis. However, export taxation is still in place and oscillating between 10 and 25 percent of the FOB price.
Table 6: FOB cocoa price used as benchmark price for the calculation of price incentives and disincentives
2005 2006 2007 2008 2009 2010
FOB cocoa bean prices (USD/tonne) 1,450 1,500 1,670 2,300 2,400 3,300
Source: COCOBOD, 2012
DOMESTIC PRICES Cocoa beans destined to the export market are taken by the farmers to the many different collection points located in cocoa producing areas, mainly Western and Ashanti regions. The cocoa beans are then transported to the border/port of exit, Tema/Accra and exported mostly to EU countries. Given the absence of a wholesale market in the cocoa value chain, this was not contemplated in the analysis.
However, even if there is no evidence in the literature or in the data provided by the government and the COCOBOD on the existence of an intermediary/wholesale stage in the cocoa value chain, it is not clear if the 26 LBCs which are in charge of purchasing cocoa from the farmers are actually selling to
4 “The fob price is the value of the good or service at the point just prior to departure from the supplying economic territory. The fob price thus comprises the basic price, plus taxes less subsidies on products levied by the general government of the supplying economic territory, plus distribution margins, transportation, and insurance services added to get the product from the point of manufacture to the point of departure from the supplying economic territory(IMF)”.
21
COCOBOD. In this case, the existence of a wholesale market would need to be assumed where the “wholesale” price under consideration would be the one paid by the COCOBOD to the LBCs.
Given the unavailability of information on LBCs selling prices to the COCOBOD, the border will be considered as the point of competition in the analysis.
Observed
Farm gate prices
The producer price is set by the Producer Price Committee which is composed of representatives from the COCOBOD, the government, cocoa buyers, the national cocoa farmers ‘association, haulers and transporters.
Farm gate prices used in the analysis have been provided by COCOBOD resulting from consultations occurring at the beginning of the harvest season when COCOBOD has a reliable estimate on the forecasted production and sells 70 percent of the expected production through forward contracts.
This price can be considered as the most representative cocoa producer price in Ghana for those cocoa beans destined to exports. However, it has to be noted that the other Licensed Buying Companies are free to set their own price to producers as well as the amount of an eventual premium. Data on alternative prices and premiums by non Governmental Licensed Buying companies is unavailable.
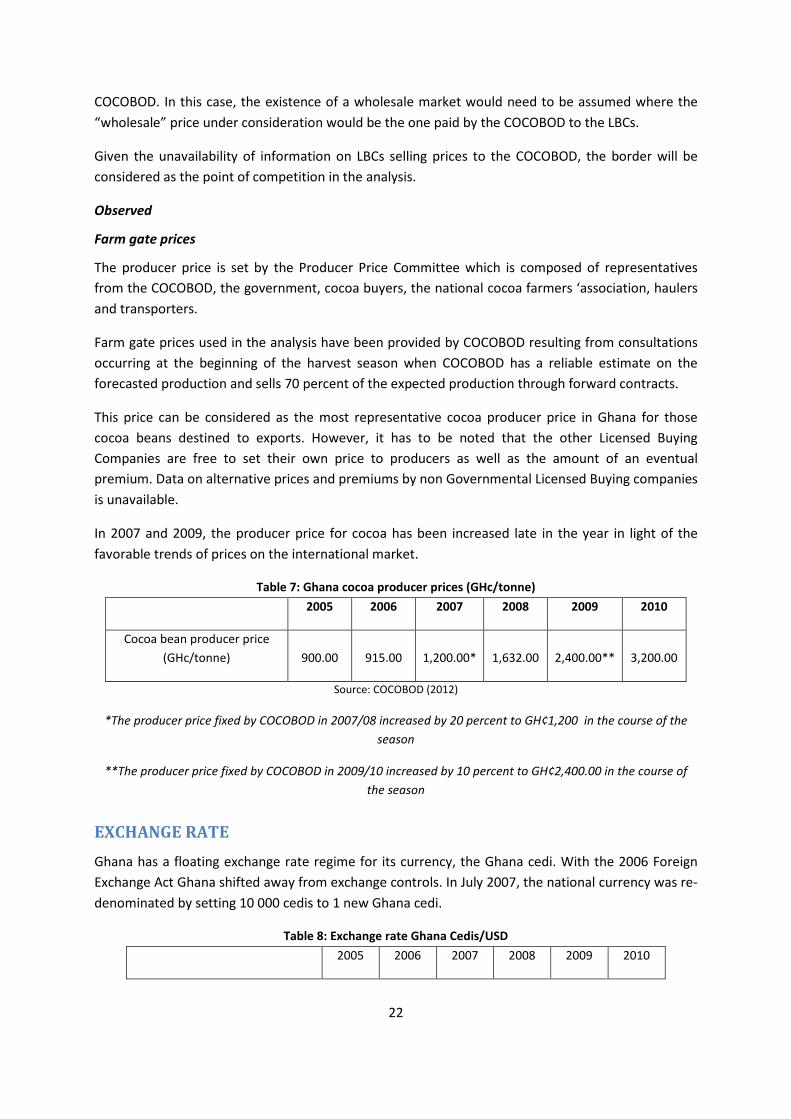
In 2007 and 2009, the producer price for cocoa has been increased late in the year in light of the favorable trends of prices on the international market.
Table 7: Ghana cocoa producer prices (GHc/tonne)
2005 2006 2007 2008 2009 2010
Cocoa bean producer price (GHc/tonne) 900.00 915.00 1,200.00* 1,632.00 2,400.00** 3,200.00
Source: COCOBOD (2012)
*The producer price fixed by COCOBOD in 2007/08 increased by 20 percent to GH¢1,200 in the course of the season
**The producer price fixed by COCOBOD in 2009/10 increased by 10 percent to GH¢2,400.00 in the course of the season
EXCHANGE RATE Ghana has a floating exchange rate regime for its currency, the Ghana cedi. With the 2006 Foreign Exchange Act Ghana shifted away from exchange controls. In July 2007, the national currency was re-denominated by setting 10 000 cedis to 1 new Ghana cedi.
Table 8: Exchange rate Ghana Cedis/USD
2005 2006 2007 2008 2009 2010
22
National Currency per US Dollar (principal rate, period average) 0.91 0.92 0.94 1.06 1.41 1.43
Source: IMF
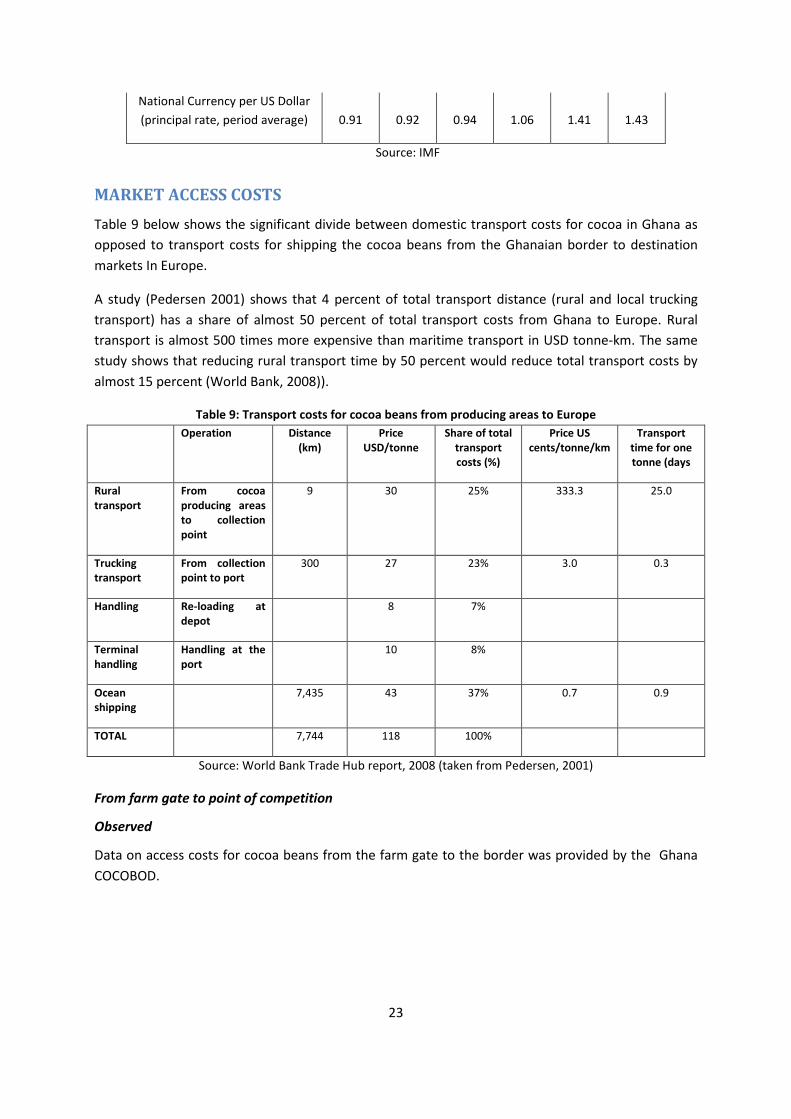
MARKET ACCESS COSTS Table 9 below shows the significant divide between domestic transport costs for cocoa in Ghana as opposed to transport costs for shipping the cocoa beans from the Ghanaian border to destination markets In Europe.
A study (Pedersen 2001) shows that 4 percent of total transport distance (rural and local trucking transport) has a share of almost 50 percent of total transport costs from Ghana to Europe. Rural transport is almost 500 times more expensive than maritime transport in USD tonne-km. The same study shows that reducing rural transport time by 50 percent would reduce total transport costs by almost 15 percent (World Bank, 2008)).
Table 9: Transport costs for cocoa beans from producing areas to Europe Operation Distance
(km) Price
USD/tonne Share of total
transport costs (%)
Price US cents/tonne/km
Transport time for one tonne (days
Rural transport
From cocoa producing areas to collection point
9 30 25% 333.3 25.0
Trucking transport
From collection point to port
300 27 23% 3.0 0.3
Handling Re-loading at depot
8 7%
Terminal handling
Handling at the port
10 8%
Ocean shipping
7,435 43 37% 0.7 0.9
TOTAL 7,744 118 100%
Source: World Bank Trade Hub report, 2008 (taken from Pedersen, 2001)
From farm gate to point of competition
Observed
Data on access costs for cocoa beans from the farm gate to the border was provided by the Ghana COCOBOD.
23
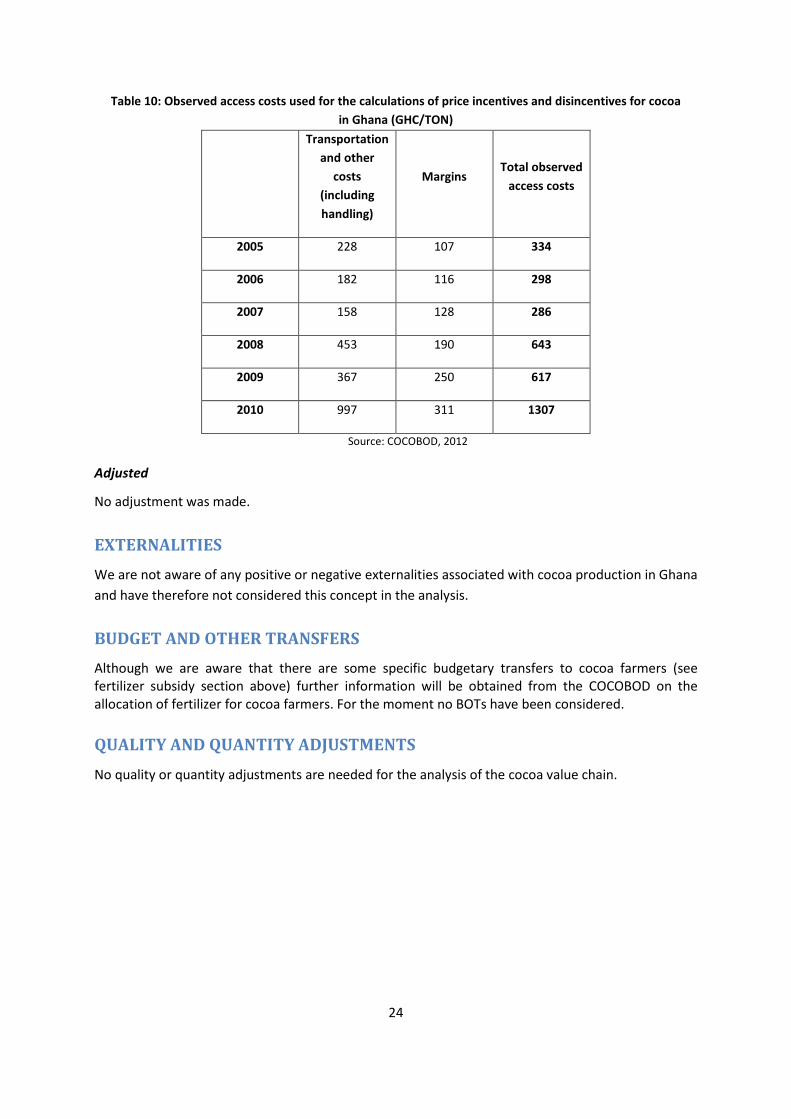
Table 10: Observed access costs used for the calculations of price incentives and disincentives for cocoa in Ghana (GHC/TON)
Transportation and other
costs (including handling)
Margins Total observed
access costs
2005 228 107 334
2006 182 116 298
2007 158 128 286
2008 453 190 643
2009 367 250 617
2010 997 311 1307
Source: COCOBOD, 2012
Adjusted
No adjustment was made.
EXTERNALITIES We are not aware of any positive or negative externalities associated with cocoa production in Ghana and have therefore not considered this concept in the analysis.
BUDGET AND OTHER TRANSFERS Although we are aware that there are some specific budgetary transfers to cocoa farmers (see fertilizer subsidy section above) further information will be obtained from the COCOBOD on the allocation of fertilizer for cocoa farmers. For the moment no BOTs have been considered.
QUALITY AND QUANTITY ADJUSTMENTS
No quality or quantity adjustments are needed for the analysis of the cocoa value chain.
24
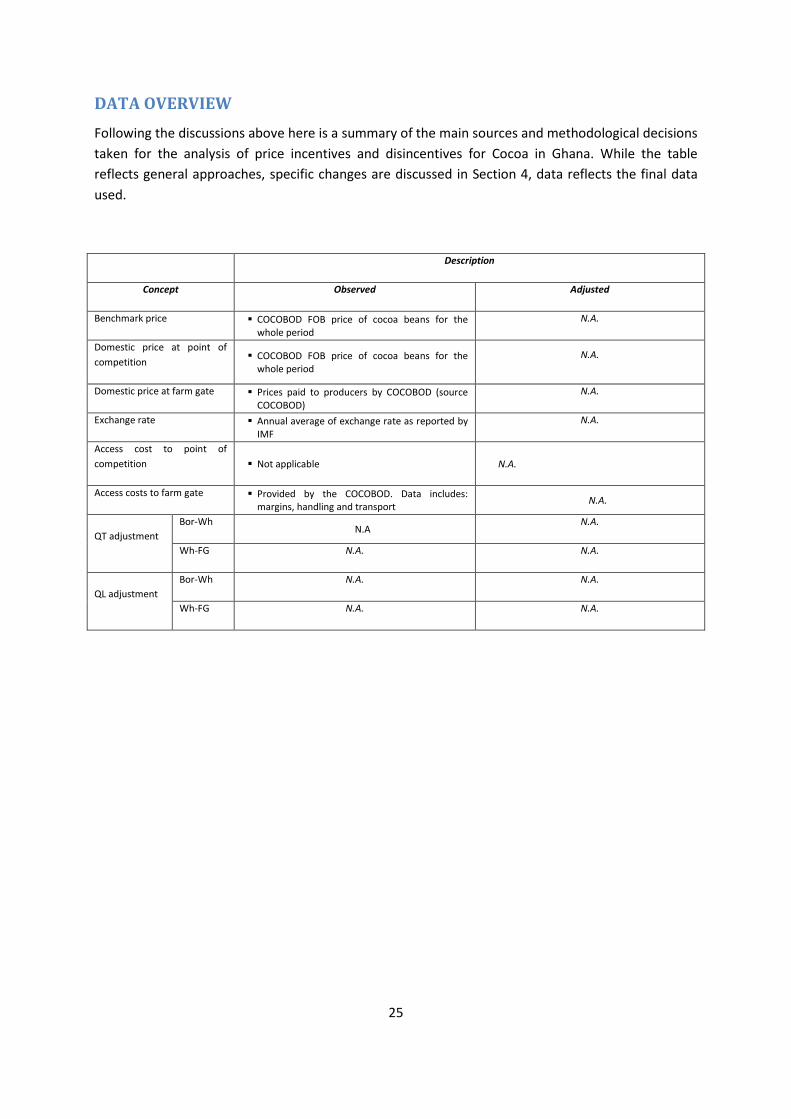
DATA OVERVIEW Following the discussions above here is a summary of the main sources and methodological decisions taken for the analysis of price incentives and disincentives for Cocoa in Ghana. While the table reflects general approaches, specific changes are discussed in Section 4, data reflects the final data used.
Description
Concept Observed Adjusted
Benchmark price COCOBOD FOB price of cocoa beans for the whole period
N.A.
Domestic price at point of competition COCOBOD FOB price of cocoa beans for the
whole period N.A.
Domestic price at farm gate Prices paid to producers by COCOBOD (source COCOBOD)
N.A.
Exchange rate Annual average of exchange rate as reported by IMF
N.A.
Access cost to point of competition Not applicable N.A.
Access costs to farm gate Provided by the COCOBOD. Data includes: margins, handling and transport N.A.
QT adjustment Bor-Wh
N.A N.A.
Wh-FG N.A. N.A.
QL adjustment Bor-Wh N.A. N.A.
Wh-FG N.A. N.A.
25
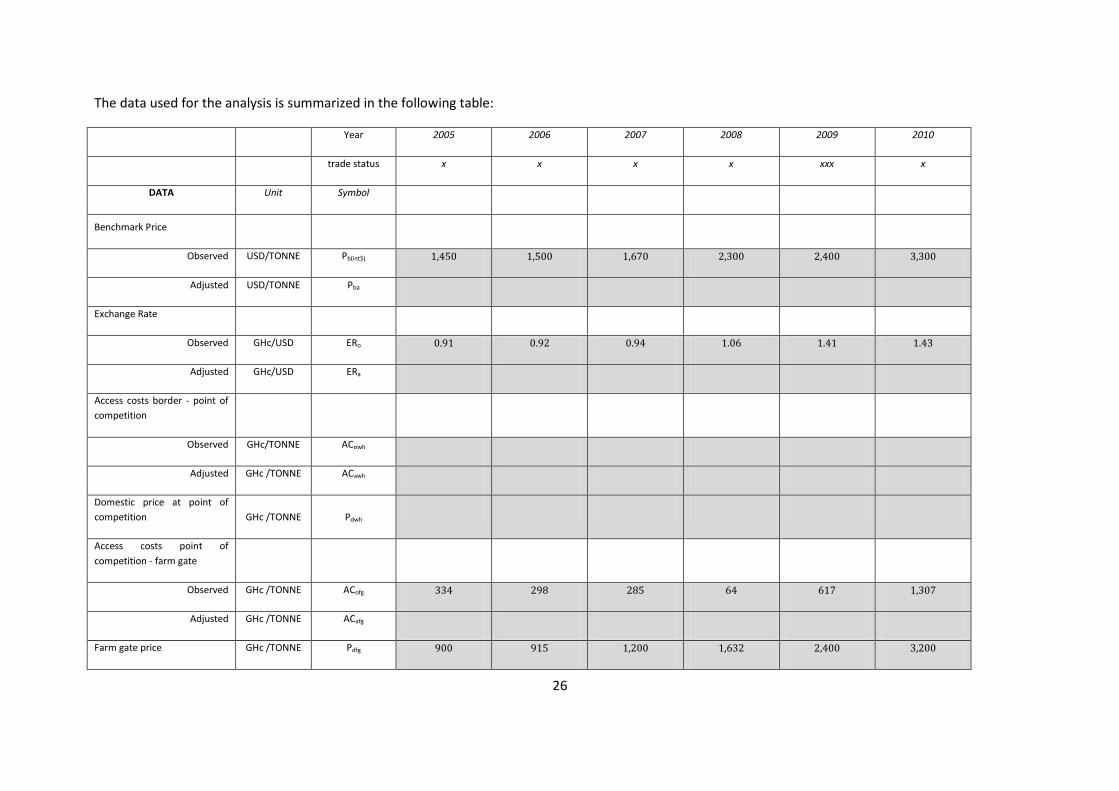
The data used for the analysis is summarized in the following table:
Year 2005 2006 2007 2008 2009 2010
trade status x x x x xxx x
DATA Unit Symbol
Benchmark Price
Observed USD/TONNE Pb(int$) 1,450 1,500 1,670 2,300 2,400 3,300
Adjusted USD/TONNE Pba
Exchange Rate
Observed GHc/USD ERo 0.91 0.92 0.94 1.06 1.41 1.43
Adjusted GHc/USD ERa
Access costs border - point of competition
Observed GHc/TONNE ACowh
Adjusted GHc /TONNE ACawh
Domestic price at point of competition GHc /TONNE Pdwh
Access costs point of competition - farm gate
Observed GHc /TONNE ACofg 334 298 285 64 617 1,307
Adjusted GHc /TONNE ACafg
Farm gate price GHc /TONNE Pdfg 900 915 1,200 1,632 2,400 3,200
26
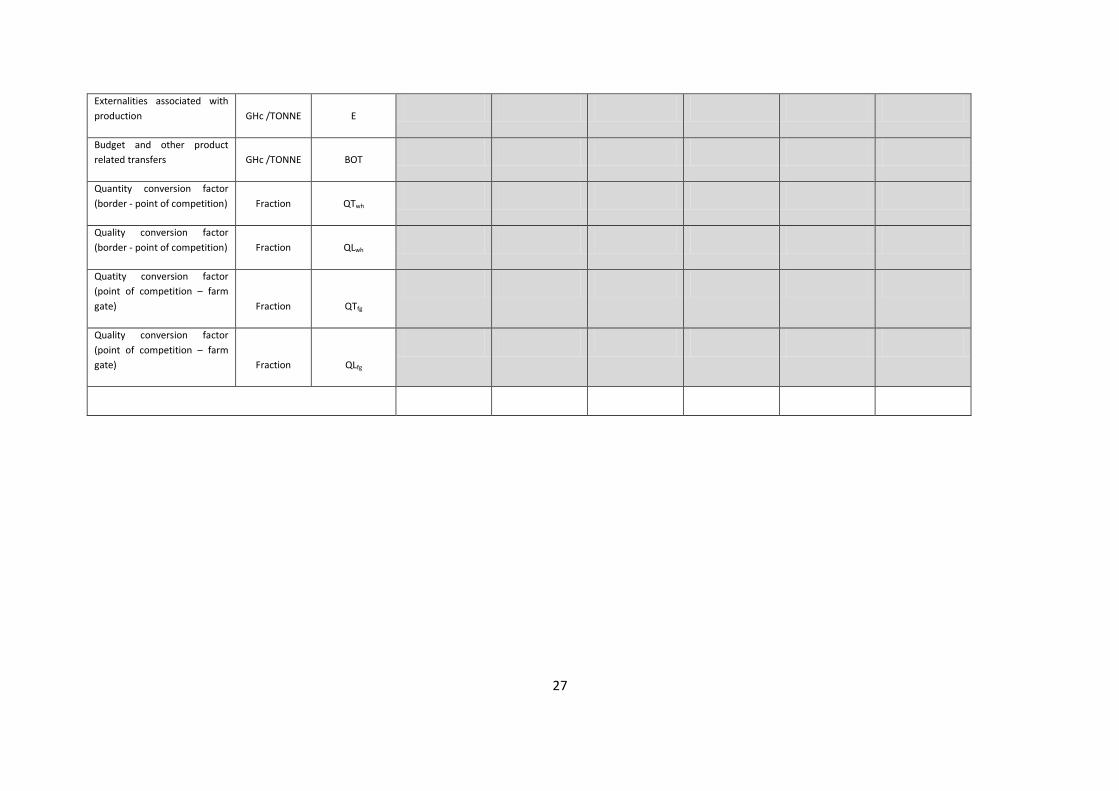
Externalities associated with production GHc /TONNE E
Budget and other product related transfers GHc /TONNE BOT
Quantity conversion factor (border - point of competition) Fraction QTwh
Quality conversion factor (border - point of competition) Fraction QLwh
Quatity conversion factor (point of competition – farm gate) Fraction QTfg
Quality conversion factor (point of competition – farm gate) Fraction QLfg
27
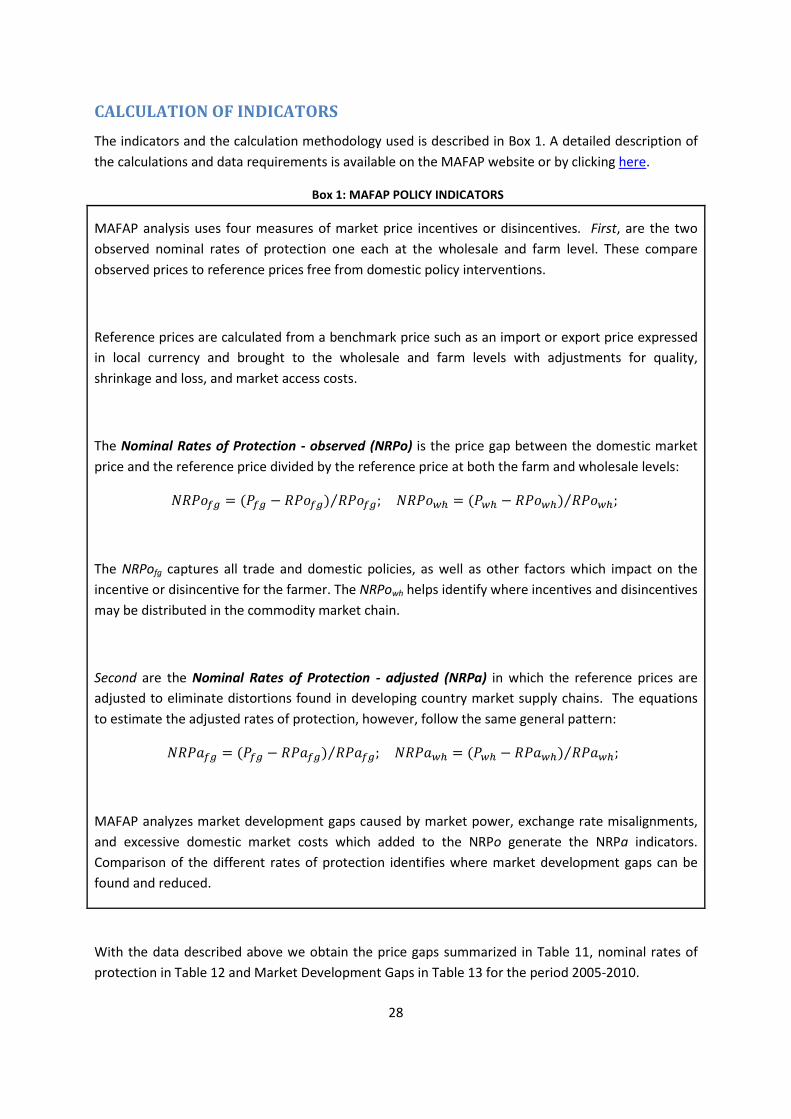
CALCULATION OF INDICATORS The indicators and the calculation methodology used is described in Box 1. A detailed description of the calculations and data requirements is available on the MAFAP website or by clicking here.
Box 1: MAFAP POLICY INDICATORS MAFAP analysis uses four measures of market price incentives or disincentives. First, are the two observed nominal rates of protection one each at the wholesale and farm level. These compare observed prices to reference prices free from domestic policy interventions.
Reference prices are calculated from a benchmark price such as an import or export price expressed in local currency and brought to the wholesale and farm levels with adjustments for quality, shrinkage and loss, and market access costs.
The Nominal Rates of Protection - observed (NRPo) is the price gap between the domestic market price and the reference price divided by the reference price at both the farm and wholesale levels:
𝑁𝑅𝑃𝑜𝑓𝑔 = (𝑃𝑓𝑔 − 𝑅𝑃𝑜𝑓𝑔) 𝑅𝑃𝑜𝑓𝑔; ⁄ 𝑁𝑅𝑃𝑜𝑤ℎ = (𝑃𝑤ℎ − 𝑅𝑃𝑜𝑤ℎ) 𝑅𝑃𝑜𝑤ℎ; ⁄
The NRPofg captures all trade and domestic policies, as well as other factors which impact on the incentive or disincentive for the farmer. The NRPowh helps identify where incentives and disincentives may be distributed in the commodity market chain.
Second are the Nominal Rates of Protection - adjusted (NRPa) in which the reference prices are adjusted to eliminate distortions found in developing country market supply chains. The equations to estimate the adjusted rates of protection, however, follow the same general pattern:
𝑁𝑅𝑃𝑎𝑓𝑔 = (𝑃𝑓𝑔 − 𝑅𝑃𝑎𝑓𝑔) 𝑅𝑃𝑎𝑓𝑔; ⁄ 𝑁𝑅𝑃𝑎𝑤ℎ = (𝑃𝑤ℎ − 𝑅𝑃𝑎𝑤ℎ) 𝑅𝑃𝑎𝑤ℎ; ⁄
MAFAP analyzes market development gaps caused by market power, exchange rate misalignments, and excessive domestic market costs which added to the NRPo generate the NRPa indicators. Comparison of the different rates of protection identifies where market development gaps can be found and reduced.
With the data described above we obtain the price gaps summarized in Table 11, nominal rates of protection in Table 12 and Market Development Gaps in Table 13 for the period 2005-2010.
28
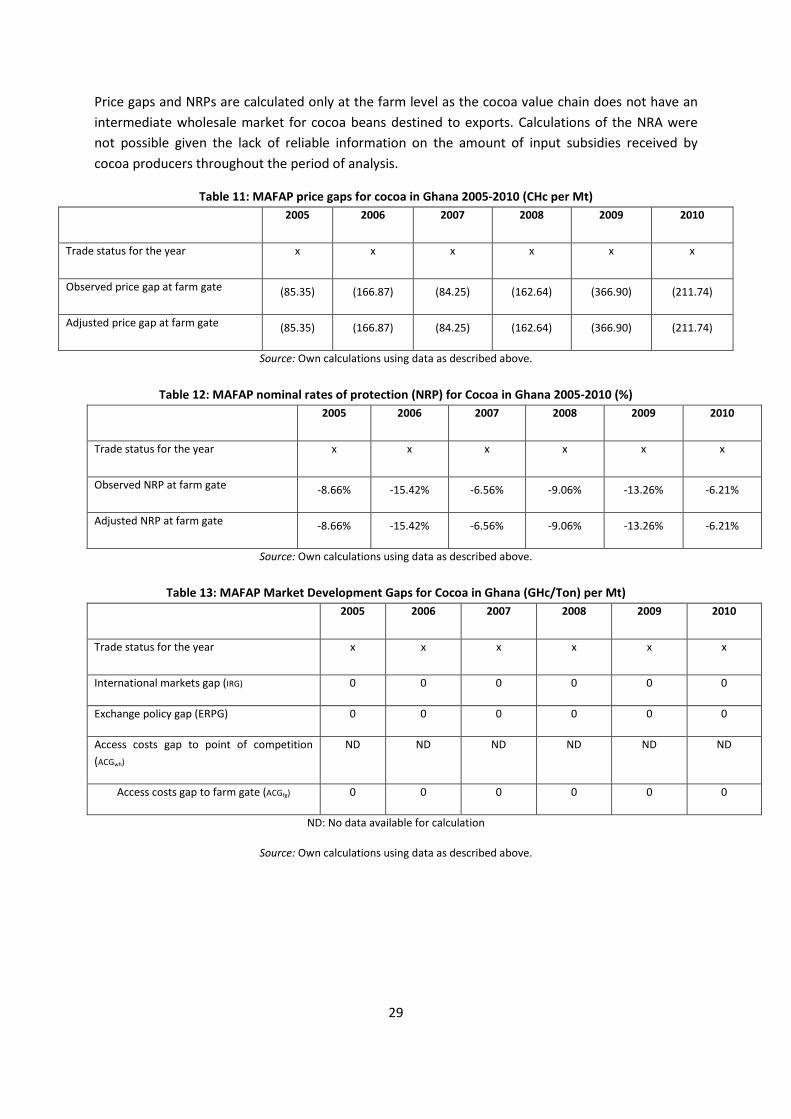
Price gaps and NRPs are calculated only at the farm level as the cocoa value chain does not have an intermediate wholesale market for cocoa beans destined to exports. Calculations of the NRA were not possible given the lack of reliable information on the amount of input subsidies received by cocoa producers throughout the period of analysis.
Table 11: MAFAP price gaps for cocoa in Ghana 2005-2010 (CHc per Mt) 2005 2006 2007 2008 2009 2010
Trade status for the year x x x x x x
Observed price gap at farm gate (85.35) (166.87) (84.25) (162.64) (366.90) (211.74)
Adjusted price gap at farm gate (85.35) (166.87) (84.25) (162.64) (366.90) (211.74)
Source: Own calculations using data as described above.
Table 12: MAFAP nominal rates of protection (NRP) for Cocoa in Ghana 2005-2010 (%) 2005 2006 2007 2008 2009 2010
Trade status for the year x x x x x x
Observed NRP at farm gate -8.66% -15.42% -6.56% -9.06% -13.26% -6.21%
Adjusted NRP at farm gate -8.66% -15.42% -6.56% -9.06% -13.26% -6.21%
Source: Own calculations using data as described above.
Table 13: MAFAP Market Development Gaps for Cocoa in Ghana (GHc/Ton) per Mt) 2005 2006 2007 2008 2009 2010
Trade status for the year x x x x x x
International markets gap (IRG) 0 0 0 0 0 0
Exchange policy gap (ERPG) 0 0 0 0 0 0
Access costs gap to point of competition (ACGwh)
ND ND ND ND ND ND
Access costs gap to farm gate (ACGfg) 0 0 0 0 0 0
ND: No data available for calculation
Source: Own calculations using data as described above.
29
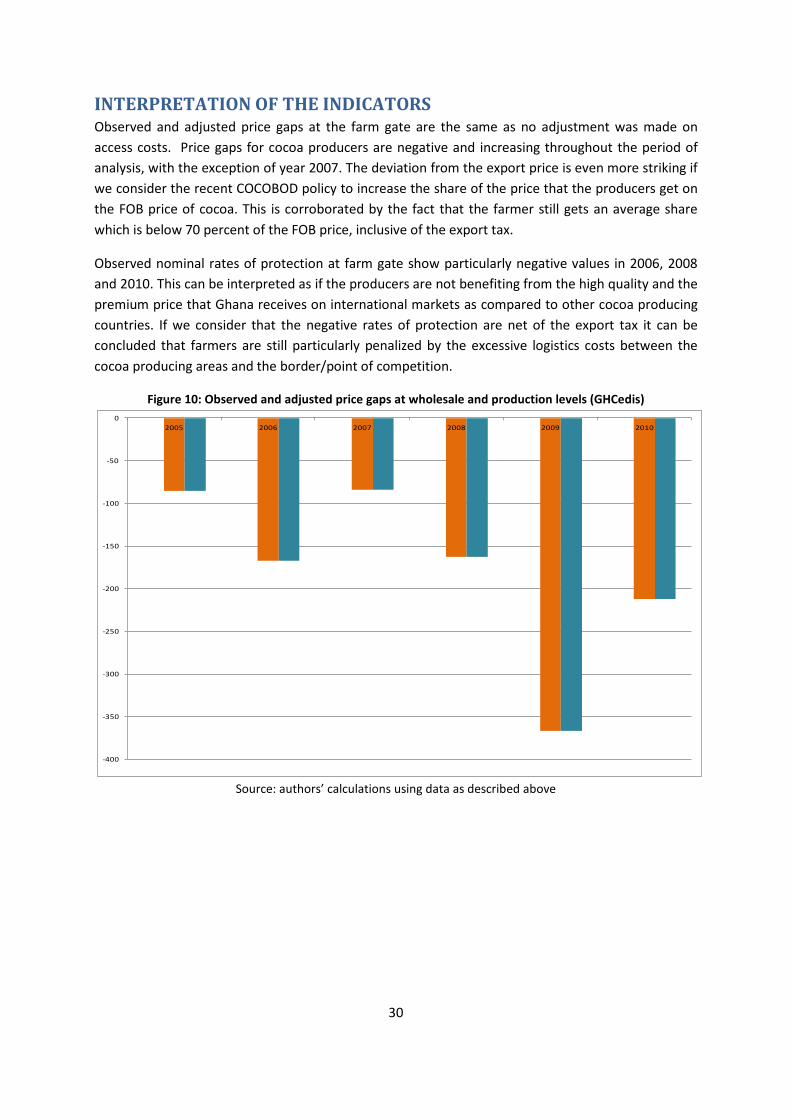
INTERPRETATION OF THE INDICATORS Observed and adjusted price gaps at the farm gate are the same as no adjustment was made on access costs. Price gaps for cocoa producers are negative and increasing throughout the period of analysis, with the exception of year 2007. The deviation from the export price is even more striking if we consider the recent COCOBOD policy to increase the share of the price that the producers get on the FOB price of cocoa. This is corroborated by the fact that the farmer still gets an average share which is below 70 percent of the FOB price, inclusive of the export tax.
Observed nominal rates of protection at farm gate show particularly negative values in 2006, 2008 and 2010. This can be interpreted as if the producers are not benefiting from the high quality and the premium price that Ghana receives on international markets as compared to other cocoa producing countries. If we consider that the negative rates of protection are net of the export tax it can be concluded that farmers are still particularly penalized by the excessive logistics costs between the cocoa producing areas and the border/point of competition.
Figure 10: Observed and adjusted price gaps at wholesale and production levels (GHCedis)
Source: authors’ calculations using data as described above
-400
-350
-300
-250
-200
-150
-100
-50
02005 2006 2007 2008 2009 2010
30
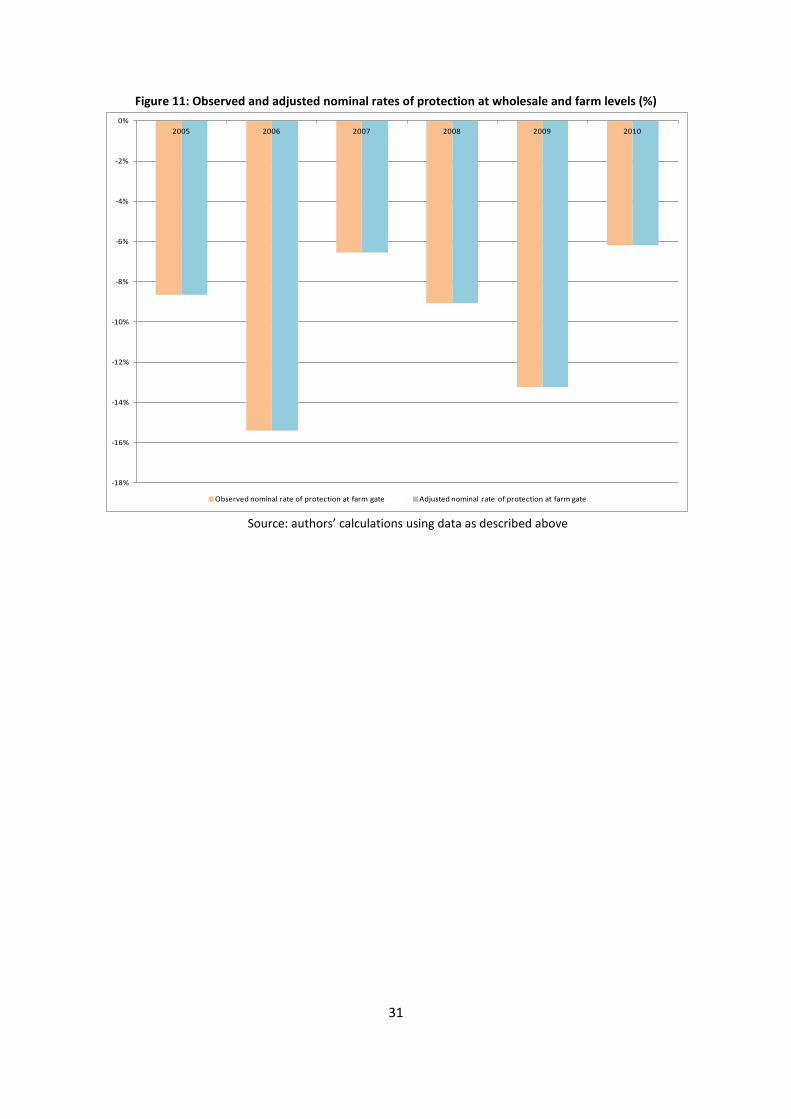
Figure 11: Observed and adjusted nominal rates of protection at wholesale and farm levels (%)
Source: authors’ calculations using data as described above
-18%
-16%
-14%
-12%
-10%
-8%
-6%
-4%
-2%
0%2005 2006 2007 2008 2009 2010
Observed nominal rate of protection at farm gate Adjusted nominal rate of protection at farm gate
31
PRELIMINARY CONCLUSIONS AND RECOMMENDATIONS
MAIN MESSAGE Despite the high quality of cocoa beans exported by Ghana there is a negative incentive for producers to continue producing cocoa. The results from the analysis of incentives and disincentives for cocoa producers corroborates some of the conclusions reached by recent field surveys undertaken in Ghana that raised the issue of an increasing number of cocoa producers shifting from cocoa production to more profitable crops. Furthermore, the quality premium received by Ghana cocoa on the international market does not seem to be transferred to the producers.
Once more detailed data are obtained concerning the effective amount of the export tax per year over the period of analysis a more accurate estimate could be made on the nature of the excessive costs and margins that are affecting producers incentives and hence the costs of maintaining the current institutional set up in the cocoa sector in Ghana.
PRELIMINARY RECOMMENDATIONS The growing competition on the international markets by countries with higher productivity and a sustained renewal of cocoa plantations calls for more pronounced interventions on the productivity and production aspects in Ghana.
It is not clear if the costs of maintaining the current organizational structure are really compensated by the benefits at least in terms of revenues generated at the producer level as it appears that the advantages of producing high quality cocoa is not transferred to the farmers.
LIMITATIONS:
• the lack of information on prices given to cocoa producers by nongovernmental LBCs, if different from the official COCOBOD producer prices;
• the lack of information on market transactions occurring between LBCs and COCOBOD;
• Finally, the partial information on the amount of fertilizer and pesticide subsidy given to farmers by the COCOBOD.
FURTHER INVESTIGATION AND RESEARCH Another relevant and still missing piece of information is the share of COCOBOD on the export tax and hence a reliable estimate on COCOBOD margins in order to carry out an in-depth analysis of the impact of the trade policy for cocoa and the costs of the current institutional framework that sees COCOBOD providing a number of services that could maybe delivered in a more efficient manner.
Further information on the amount of subsidies received by cocoa producers in Ghana will need to be gathered.
32
BIBLIOGRAPHY Abenyega, O. and J. Gockowski (2003). “Labour practices in the cocoa sector of Ghana with a special focus on the role of children”. International Institute of Tropical Agriculture. pp. 10–11.
Anthonio, D. C. and E. D. Aikins (2009). “Reforming Ghana ́s cocoa sector - an evaluation of private participation in marketing” Luleå University of Technology, Master Thesis, Continuation Courses Marketing and e-commerce Department of Business Administration and Social Sciences Division of Industrial marketing and e-commerce
Bloomfield, E. M., and R. A. Lass. 1992. “Impact of Structural Adjustment and Adoption of Technology on Competitiveness of Major Cocoa Producing Countries.” Working Paper 69. Paris: Organisation for Economic Cooperation and Development.
Boahene, K., T. A. B. Snijders, and H. Folmer (1999). “An Integrated Socio Economic Analysis of Innovation Adoption: The Case of Hybrid Cocoa in Ghana.” Journal of Policy Modeling 21 (2): 167 – 84.
Dewbre, J. and A. Borot de Battisti (2008), “Agricultural Progress in Cameroon, Ghana and Mali: Why It Happened and How to Sustain It”, OECD Food, Agriculture and
Fisheries Working Papers, No. 9, OECD Publishing. doi: 10.1787/241275631215
Fairtrade Foundation, “Fairtrade and Cocoa”, Commodity Briefing 2011
FAO Fertilizer use by crop in Ghana FOOD AND AGRICULTURE ORGANIZATION OF THE UNITED NATIONS Rome, 2005 Land and Plant Nutrition Management Service Land and Water Development Division
Ghana Cocoa Board (COCOBOD) (2012)
Ghana Statistical Service (2010)
Ghana Strategy Support Programme (GSSP) (2005).
Global Agricultural Information Network (GAIN) (2012). “Cocoa Annual Report”
International Cocoa Organization (ICCO). (2012). http://www.icco.org/ (Accessed: 2nd May, 2012).
International Cocoa Organization (ICCO) (2007).“Quarterly Bulletin.” London.
Banful Afua Branoah Operational Details of the 2008 Fertilizer Subsidy in Ghana—Preliminary Report Ghana Strategy Support Program (GSSP) May, 2009 IFPRI
Institute of International Tropical Agriculture ((IITA) (2009). “Climate Change and Cocoa”
Kolavalli, S. and Marcella Vigneri (2011). “Cocoa in Ghana: Shaping the Success of an Economy”. The World Bank.
33
Laven, A. (2007). “Marketing Reforms in Ghana’s Cocoa Sector: Partial Reforms, Partial Benefits?” Background Note, Overseas Development Institute, London. http://www.odi.
org.uk/resources/download/420.pdf.
Mohammed, D., D. Asamoah and F. Asiedu-Appiah (2011). “Cocoa Value Chain - Implication for the Smallholder Farmer in Ghana” Department of Information Systems and Decision Sciences, KNUST School of Business, Kwame Nkrumah University of Science & Technology, Ghana.
Opoku, E., R. Dzene, S. Caria, F. Tea, and A. Zeitlin. 2009. “Improving Productivity through Group Lending: Report on the Impact Evaluation of the Cocoa Abrabopa Initiative.” Centre for the Study of African Economies, University of Oxford, Oxford, United Kingdom. http:// www.csae.ox.ac.uk/output/reports/pdfs/rep2008-01.pdf.
Shepherd, A.W., and S. Farolfi. (1999). “Export Crop Liberalization in Africa: A Review.” Agricultural Services Bulletin 135, FAO, Rome.
Smallholder Farmer in Ghana” Department of Information Systems and Decision Sciences, KNUST School of Business, Kwame Nkrumah University of Science & Technology, Ghana.
Teal, F., Zeitlin, A. and Maamah, H. (2006). “Ghana Cocoa Farmers Survey 2004: Report to Ghana Cocoa Board”. Centre for the Study of African Economies, Oxford University (http://www.gprg.org/pubs/reports/ pdfs/2006-04-teal-zeitlin-maamah.pdf).
Traoré, D. (2009). “Cocoa and Coffee Value Chains in West and Central Africa: Constraints and Options for Revenue-Raising Diversification” AAACP Paper Series – No. 3
Vigneri M., and P. Santos (2008). “What Does Liberalization without Price Competition Achieve? The Case of Cocoa Marketing in Rural Ghana.” IFPRI-GSSP Background Paper 14. International Food Policy Research Institute, Washington, DC.
Vigneri M., F. Teal, and H. Maamah (2004). “Coping with Market Reforms: Winners and Losers among Ghanaian Cocoa Farmers.” Report to the Ghana Cocoa Board, Accra.
Vigneri M. (2005). “Trade Liberalisation and Agricultural Performance: Micro and Macro Evidence on Cash Crop Production in Sub-Saharan Africa.” DPhil thesis, University of Oxford, Oxford, UK.
Wolter, D. Ghana: Agriculture is becoming a Business. OECD publications “Business for Development”, 2008 www.oecd.org/ dev/publications/businessfordevelopment
Worldbank (2007). “Ghana: Meeting the Challenge of Accelerated and Shared Growth.” Country Economic Memorandum, World Bank, Washington, DC.
World Bank. (2007). “World Development Report: Agriculture for Development.” Washington, DC: World Bank”.
World Bank (2008). “Country Brief: Ghana.” World Bank, Washington DC.
34
Zeitlin, A. (2006).“Market Structure and Productivity Growth in Ghanaian Cocoa Production.” Unpublished paper, Centre for the Study of African Economies, University of Oxford, Oxford, U.K.
35
ANNEX I: Methodology Used
A guide to the methodology used by MAFAP can be downloaded from the MAFAP website or by clicking here.
36
ANNEX II: Data and calculations used in the analysis
37
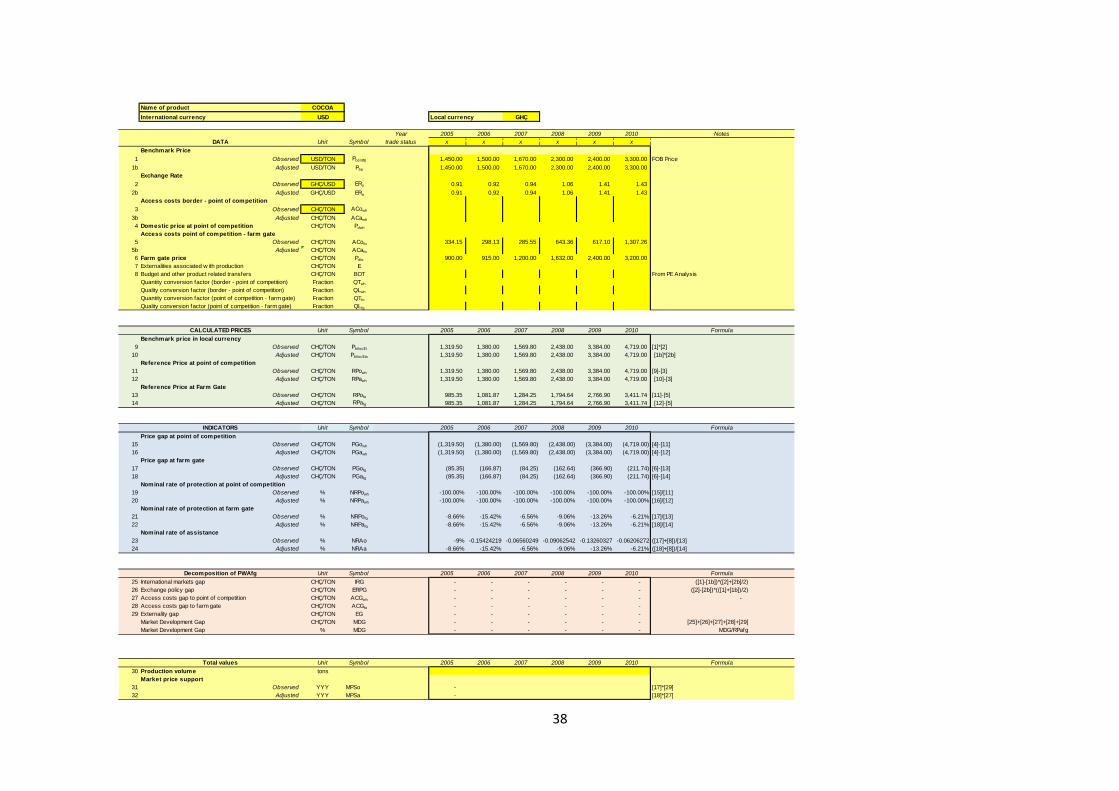
Name of product COCOAInternational currency USD Local currency GHÇ
Year 2005 2006 2007 2008 2009 2010DATA Unit Symbol trade status x x x x x x
Benchmark Price1 Observed USD/TON Pb(int$) 1,450.00 1,500.00 1,670.00 2,300.00 2,400.00 3,300.00
1b Adjusted USD/TON Pba 1,450.00 1,500.00 1,670.00 2,300.00 2,400.00 3,300.00 Exchange Rate
2 Observed GHÇ/USD ERo 0.91 0.92 0.94 1.06 1.41 1.43 2b Adjusted GHÇ/USD ERa 0.91 0.92 0.94 1.06 1.41 1.43
Access costs border - point of competition3 Observed CHÇ/TON ACowh
3b Adjusted CHÇ/TON ACawh
4 Domestic price at point of competition CHÇ/TON Pdwh
Access costs point of competition - farm gate5 Observed CHÇ/TON ACofg 334.15 298.13 285.55 643.36 617.10 1,307.26
5b Adjusted CHÇ/TON ACafg
6 Farm gate price CHÇ/TON Pdfg 900.00 915.00 1,200.00 1,632.00 2,400.00 3,200.00 7 Externalities associated w ith production CHÇ/TON E8 Budget and other product related transfers CHÇ/TON BOT
Quantity conversion factor (border - point of competition) Fraction QTwh
Quality conversion factor (border - point of competition) Fraction QLwh
Quantity conversion factor (point of competition - farm gate) Fraction QTfg
Quality conversion factor (point of competition - farm gate) Fraction QLfg
CALCULATED PRICES Unit Symbol 2005 2006 2007 2008 2009 2010Benchmark price in local currency
9 Observed CHÇ/TON Pb(loc$) 1,319.50 1,380.00 1,569.80 2,438.00 3,384.00 4,719.00 10 Adjusted CHÇ/TON Pb(loc$)a 1,319.50 1,380.00 1,569.80 2,438.00 3,384.00 4,719.00
Reference Price at point of competition11 Observed CHÇ/TON RPowh 1,319.50 1,380.00 1,569.80 2,438.00 3,384.00 4,719.00 12 Adjusted CHÇ/TON RPawh 1,319.50 1,380.00 1,569.80 2,438.00 3,384.00 4,719.00
Reference Price at Farm Gate 13 Observed CHÇ/TON RPofg 985.35 1,081.87 1,284.25 1,794.64 2,766.90 3,411.74 14 Adjusted CHÇ/TON RPafg 985.35 1,081.87 1,284.25 1,794.64 2,766.90 3,411.74
INDICATORS Unit Symbol 2005 2006 2007 2008 2009 2010Price gap at point of competition
15 Observed CHÇ/TON PGowh (1,319.50) (1,380.00) (1,569.80) (2,438.00) (3,384.00) (4,719.00) 16 Adjusted CHÇ/TON PGawh (1,319.50) (1,380.00) (1,569.80) (2,438.00) (3,384.00) (4,719.00)
Price gap at farm gate17 Observed CHÇ/TON PGofg (85.35) (166.87) (84.25) (162.64) (366.90) (211.74) 18 Adjusted CHÇ/TON PGafg (85.35) (166.87) (84.25) (162.64) (366.90) (211.74)
Nominal rate of protection at point of competition19 Observed % NRPowh -100.00% -100.00% -100.00% -100.00% -100.00% -100.00%20 Adjusted % NRPawh -100.00% -100.00% -100.00% -100.00% -100.00% -100.00%
Nominal rate of protection at farm gate21 Observed % NRPofg -8.66% -15.42% -6.56% -9.06% -13.26% -6.21%22 Adjusted % NRPafg -8.66% -15.42% -6.56% -9.06% -13.26% -6.21%
Nominal rate of assistance23 Observed % NRAo -9% -0.15424219 -0.06560249 -0.09062542 -0.13260327 -0.0620627224 Adjusted % NRAa -8.66% -15.42% -6.56% -9.06% -13.26% -6.21%
Decomposition of PWAfg Unit Symbol 2005 2006 2007 2008 2009 201025 International markets gap CHÇ/TON IRG - - - - - - ([1]-[1b])*([2]+[2b]/2)26 Exchange policy gap CHÇ/TON ERPG - - - - - - ([2]-[2b])*(([1]+[1b])/2)27 Access costs gap to point of competition CHÇ/TON ACGwh - - - - - - - 28 Access costs gap to farm gate CHÇ/TON ACGfg - - - - - - 29 Externality gap CHÇ/TON EG - - - - - -
Market Development Gap CHÇ/TON MDG - - - - - - [25]+[26]+[27]+[28]+[29]Market Development Gap % MDG - - - - - - MDG/RPafg
Total values Unit Symbol 2005 2006 2007 2008 2009 201030 Production volume tons
Market price support 31 Observed YYY MPSo - 32 Adjusted YYY MPSa -
[17]*[29][18]*[27]
Formula
([17]+[8])/[13]([18]+[8])/[14]
Formula
[15]/[11][16]/[12]
[17]/[13][18]/[14]
[4]-[12]
[6]-[13][6]-[14]
[11]-[5][12]-[5]
Formula
[4]-[11]
[1b]*[2b]
[9]-[3][10]-[3]
Formula
[1]*[2]
From PE Analysis
Notes
FOB Price
38