analysis of incentives and disincentives - food … · · 2014-02-12analysis of incentives and...
TRANSCRIPT
ANALYSIS OF INCENTIVES AND DISINCENTIVES FOR PALM OIL IN NIGERIA
.
JULY 2013
This technical note is a product of the Monitoring African Food and Agricultural Policies project (MAFAP). It is a technical document intended primarily for internal use as background for the eventual MAFAP Country Report. This technical note may be updated as new data becomes available.
MAFAP is implemented by the Food and Agriculture Organization of the United Nations (FAO) in collaboration with the Organisation for Economic Co-operation and Development (OECD) and national partners in participating countries. It is financially supported by the Bill and Melinda Gates Foundation, the United States Agency for International Development (USAID), and FAO.
The analysis presented in this document is the result of the partnerships established in the context of the MAFAP project with governments of participating countries and a variety of national institutions.
For more information: http://www.fao.org/mafap
Suggested citation:
Gourichon H, 2013. Analysis of incentives and disincentives for Palm Oil in Nigeria. Technical notes series, MAFAP, FAO, Rome.
© FAO 2013
FAO encourages the use, reproduction and dissemination of material in this information product. Except where otherwise indicated, material may be copied, downloaded and printed for private study, research and teaching purposes, or for use in non-commercial products or services, provided that appropriate acknowledgement of FAO as the source and copyright holder is given and that FAO’s endorsement of users’ views, products or services is not implied in any way.
All requests for translation and adaptation rights, and for resale and other commercial use rights should be made via www.fao.org/contact-us/licence-request or addressed to [email protected].
FAO information products are available on the FAO website (www.fao.org/publications) and can be purchased through [email protected].
2
SUMMARY OF THE NOTE
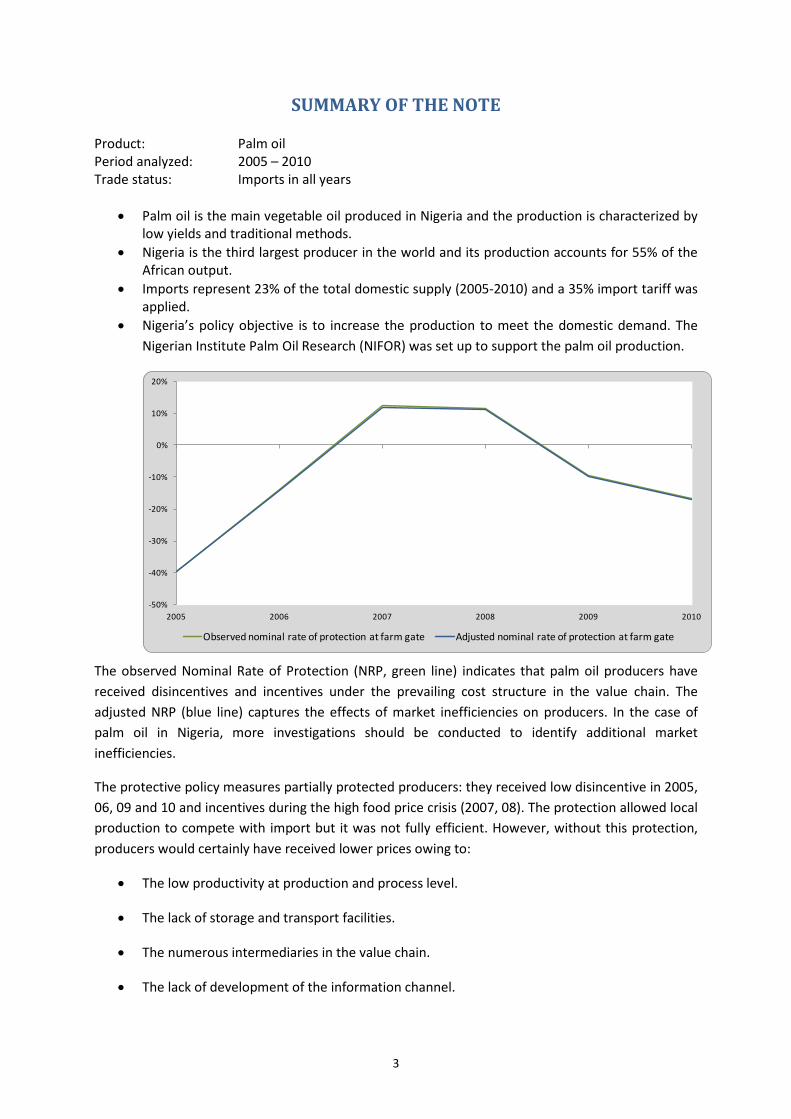
Product: Palm oil Period analyzed: 2005 – 2010 Trade status: Imports in all years
• Palm oil is the main vegetable oil produced in Nigeria and the production is characterized by low yields and traditional methods.
• Nigeria is the third largest producer in the world and its production accounts for 55% of the African output.
• Imports represent 23% of the total domestic supply (2005-2010) and a 35% import tariff was applied.
• Nigeria’s policy objective is to increase the production to meet the domestic demand. The Nigerian Institute Palm Oil Research (NIFOR) was set up to support the palm oil production.
The observed Nominal Rate of Protection (NRP, green line) indicates that palm oil producers have received disincentives and incentives under the prevailing cost structure in the value chain. The adjusted NRP (blue line) captures the effects of market inefficiencies on producers. In the case of palm oil in Nigeria, more investigations should be conducted to identify additional market inefficiencies.
The protective policy measures partially protected producers: they received low disincentive in 2005, 06, 09 and 10 and incentives during the high food price crisis (2007, 08). The protection allowed local production to compete with import but it was not fully efficient. However, without this protection, producers would certainly have received lower prices owing to:
• The low productivity at production and process level.
• The lack of storage and transport facilities.
• The numerous intermediaries in the value chain.
• The lack of development of the information channel.
-50%
-40%
-30%
-20%
-10%
0%
10%
20%
2005 2006 2007 2008 2009 2010
Observed nominal rate of protection at farm gate Adjusted nominal rate of protection at farm gate
3
TABLE OF CONTENTS
SUMMARY OF THE NOTE .......................................................................................................................... 3
1. PURPOSE OF THE NOTE .................................................................................................................... 5
2. COMMODITY CONTEXT .................................................................................................................... 6
PRODUCTION ........................................................................................................................................ 6
CONSUMPTION/UTILIZATION .............................................................................................................. 8
MARKETING AND TRADE ....................................................................................................................11
DESCRIPTION OF THE VALUE CHAIN AND PROCESSING .....................................................................14
POLICY DECISIONS AND MEASURES ...................................................................................................18
3. DATA REQUIREMENTS, DESCRIPTION AND CALCULATION OF INDICATORS ..................................20
TRADE STATUS OF THE PRODUCTS ....................................................................................................20
BENCHMARK PRICES ...........................................................................................................................20
DOMESTIC PRICES ..............................................................................................................................21
EXCHANGE RATES ...............................................................................................................................21
ACCESS COSTS ....................................................................................................................................22
EXTERNALITIES ...................................................................................................................................23
BUDGET AND OTHER TRANSFERS ......................................................................................................24
QUALITY AND QUANTITY ADJUSTMENTS ...........................................................................................24
DATA OVERVIEW ................................................................................................................................25
CALCULATION OF INDICATORS ...........................................................................................................27
4. INTERPRETATION OF THE INDICATORS ..........................................................................................29
5. PRELIMINARY CONCLUSIONS AND RECOMMENDATIONS .............................................................33
MAIN MESSAGE ..................................................................................................................................33
PRELIMINARY RECOMMENDATIONS ..................................................................................................33
LIMITATIONS ......................................................................................................................................33
FURTHER INVESTIGATION AND RESEARCH ........................................................................................34
BIBLIOGRAPHY ........................................................................................................................................35
ANNEX I: Methodology Used ..................................................................................................................37
ANNEX II: Data and calculations used in the analysis ............................................................................38
4
1. PURPOSE OF THE NOTE
This technical note aims to describe the market incentives and disincentives for palm oil in Nigeria. The note is a technical document and serves as input for the MAFAP Country Report.
For this purpose, yearly averages of farm gate and wholesale prices are compared with reference prices calculated on the basis of the price of the commodity in the international market. The price gaps between the reference prices and the prices along the value chain indicate to which extent incentives (positive gaps) or disincentives (negative gaps) are present at farm gate and wholesale level. In relative terms, the price gaps are expressed as Nominal Rates of Protection. These key indicators are used by MAFAP to highlight the effects of policy and market development gaps on prices.
The note starts with a brief review of the production, consumption, trade and policies affecting the commodity and then provides a detailed description of how the key components of the price analysis have been obtained. The MAFAP indicators are then calculated with these data and interpreted in the light of existing policies and market characteristics. The analysis that has been carried out is commodity and country specific and covers the period 2005-2010. The indicators have been calculated using available data from different sources for this period and are described in Chapter 3.
The outcomes of this analysis can be used by those stakeholders involved in policy-making for the food and agricultural sector. They can also serve as input for evidence-based policy dialogue at country or regional level.
This technical note is not to be interpreted as an analysis of the value chain or detailed description of production, consumption or trade patterns. All information related to these areas is presented merely to provide background on the commodity under review, help understand major trends and facilitate the interpretation of the indicators.
All information is preliminary and still subject to review and validation.
5
2. COMMODITY CONTEXT
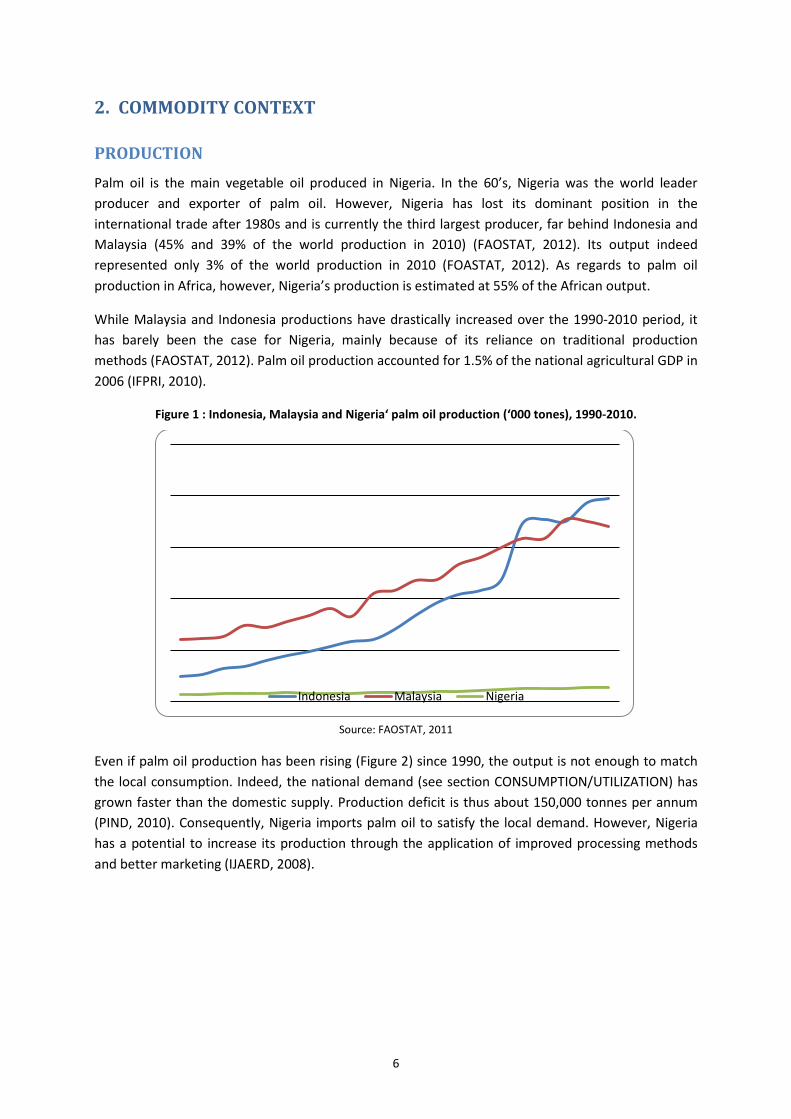
PRODUCTION Palm oil is the main vegetable oil produced in Nigeria. In the 60’s, Nigeria was the world leader producer and exporter of palm oil. However, Nigeria has lost its dominant position in the international trade after 1980s and is currently the third largest producer, far behind Indonesia and Malaysia (45% and 39% of the world production in 2010) (FAOSTAT, 2012). Its output indeed represented only 3% of the world production in 2010 (FOASTAT, 2012). As regards to palm oil production in Africa, however, Nigeria’s production is estimated at 55% of the African output.
While Malaysia and Indonesia productions have drastically increased over the 1990-2010 period, it has barely been the case for Nigeria, mainly because of its reliance on traditional production methods (FAOSTAT, 2012). Palm oil production accounted for 1.5% of the national agricultural GDP in 2006 (IFPRI, 2010).
Figure 1 : Indonesia, Malaysia and Nigeria‘ palm oil production (‘000 tones), 1990-2010.
Source: FAOSTAT, 2011
Even if palm oil production has been rising (Figure 2) since 1990, the output is not enough to match the local consumption. Indeed, the national demand (see section CONSUMPTION/UTILIZATION) has grown faster than the domestic supply. Production deficit is thus about 150,000 tonnes per annum (PIND, 2010). Consequently, Nigeria imports palm oil to satisfy the local demand. However, Nigeria has a potential to increase its production through the application of improved processing methods and better marketing (IJAERD, 2008).
Indonesia Malaysia Nigeria
6
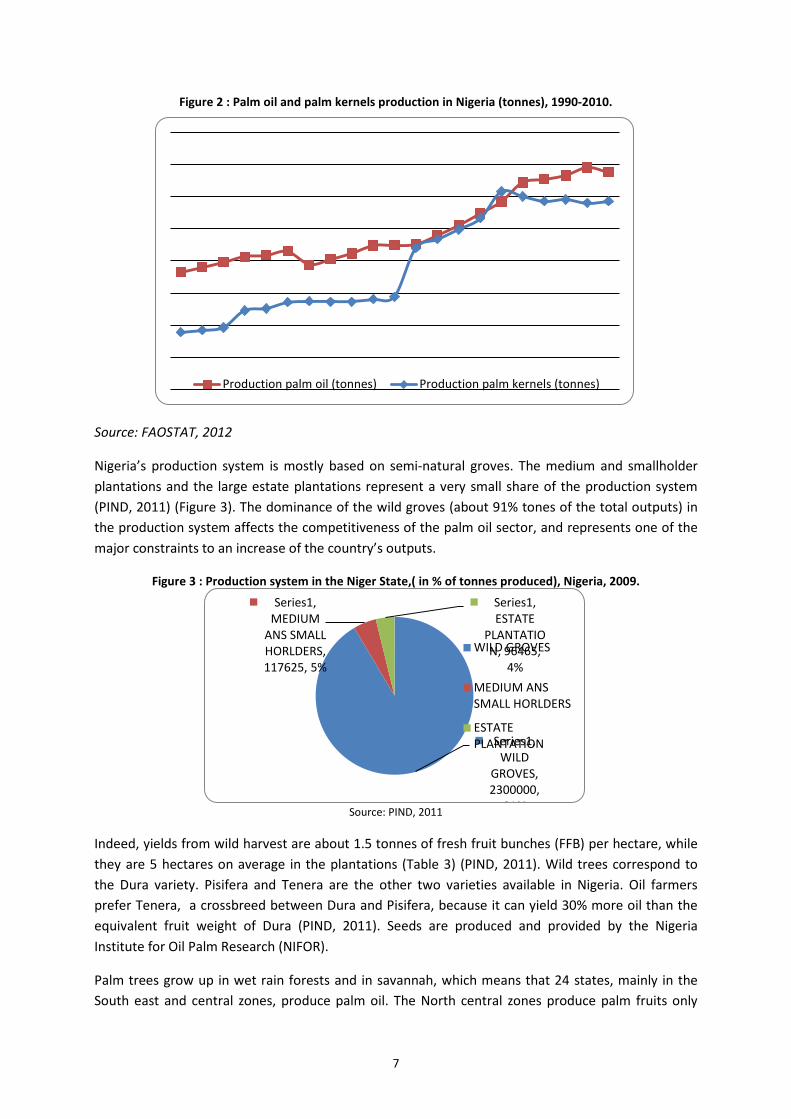
Figure 2 : Palm oil and palm kernels production in Nigeria (tonnes), 1990-2010.
Source: FAOSTAT, 2012
Nigeria’s production system is mostly based on semi-natural groves. The medium and smallholder plantations and the large estate plantations represent a very small share of the production system (PIND, 2011) (Figure 3). The dominance of the wild groves (about 91% tones of the total outputs) in the production system affects the competitiveness of the palm oil sector, and represents one of the major constraints to an increase of the country’s outputs.
Figure 3 : Production system in the Niger State,( in % of tonnes produced), Nigeria, 2009.
Source: PIND, 2011
Indeed, yields from wild harvest are about 1.5 tonnes of fresh fruit bunches (FFB) per hectare, while they are 5 hectares on average in the plantations (Table 3) (PIND, 2011). Wild trees correspond to the Dura variety. Pisifera and Tenera are the other two varieties available in Nigeria. Oil farmers prefer Tenera, a crossbreed between Dura and Pisifera, because it can yield 30% more oil than the equivalent fruit weight of Dura (PIND, 2011). Seeds are produced and provided by the Nigeria Institute for Oil Palm Research (NIFOR).
Palm trees grow up in wet rain forests and in savannah, which means that 24 states, mainly in the South east and central zones, produce palm oil. The North central zones produce palm fruits only
Production palm oil (tonnes) Production palm kernels (tonnes)
Series1, WILD
GROVES, 2300000,
91%
Series1, MEDIUM
ANS SMALL HORLDERS, 117625, 5%
Series1, ESTATE
PLANTATION, 96465,
4% WILD GROVES
MEDIUM ANSSMALL HORLDERS
ESTATEPLANTATION
7
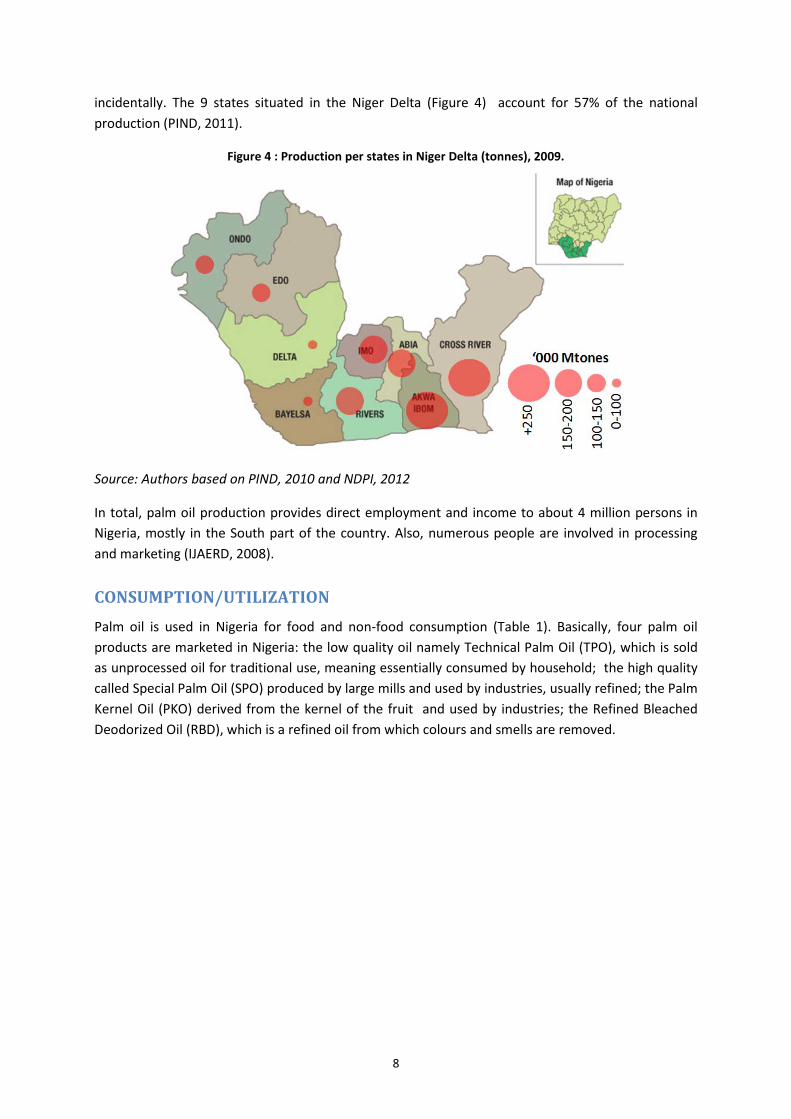
incidentally. The 9 states situated in the Niger Delta (Figure 4) account for 57% of the national production (PIND, 2011).
Figure 4 : Production per states in Niger Delta (tonnes), 2009.
Source: Authors based on PIND, 2010 and NDPI, 2012
In total, palm oil production provides direct employment and income to about 4 million persons in Nigeria, mostly in the South part of the country. Also, numerous people are involved in processing and marketing (IJAERD, 2008).
CONSUMPTION/UTILIZATION Palm oil is used in Nigeria for food and non-food consumption (Table 1). Basically, four palm oil products are marketed in Nigeria: the low quality oil namely Technical Palm Oil (TPO), which is sold as unprocessed oil for traditional use, meaning essentially consumed by household; the high quality called Special Palm Oil (SPO) produced by large mills and used by industries, usually refined; the Palm Kernel Oil (PKO) derived from the kernel of the fruit and used by industries; the Refined Bleached Deodorized Oil (RBD), which is a refined oil from which colours and smells are removed.
8
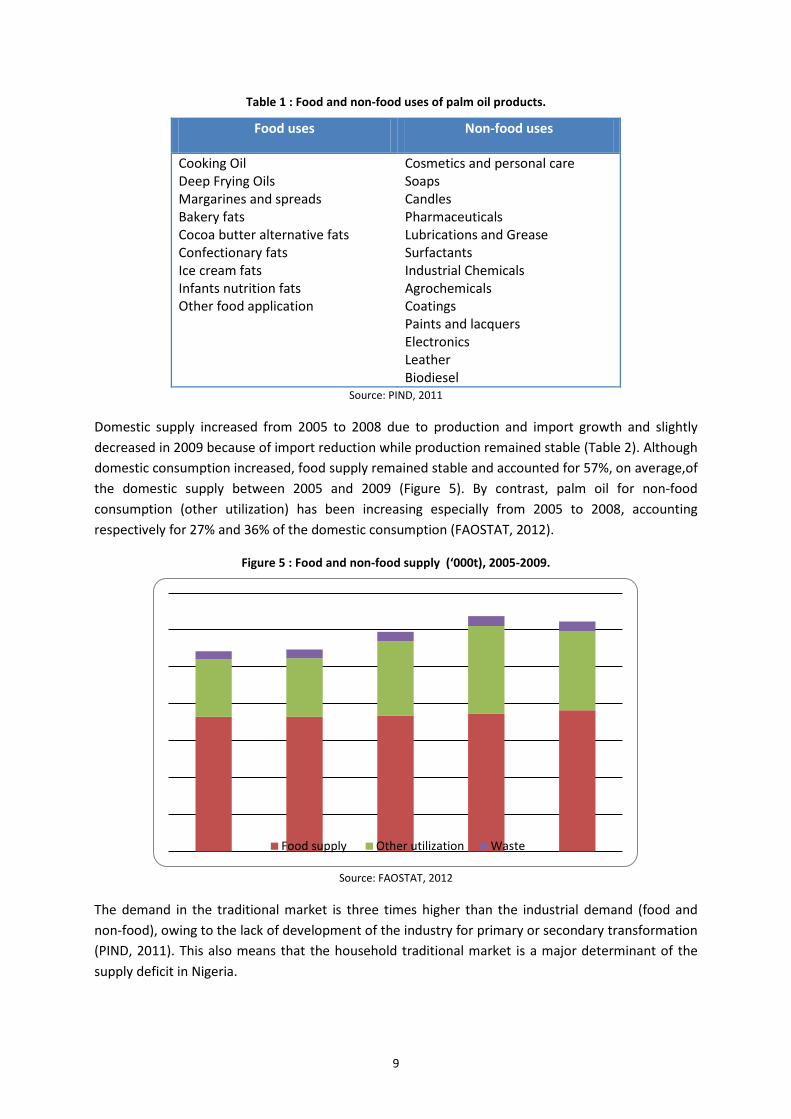
Table 1 : Food and non-food uses of palm oil products.
Food uses Non-food uses
Cooking Oil Deep Frying Oils Margarines and spreads Bakery fats Cocoa butter alternative fats Confectionary fats Ice cream fats Infants nutrition fats Other food application
Cosmetics and personal care Soaps Candles Pharmaceuticals Lubrications and Grease Surfactants Industrial Chemicals Agrochemicals Coatings Paints and lacquers Electronics Leather Biodiesel
Source: PIND, 2011
Domestic supply increased from 2005 to 2008 due to production and import growth and slightly decreased in 2009 because of import reduction while production remained stable (Table 2). Although domestic consumption increased, food supply remained stable and accounted for 57%, on average,of the domestic supply between 2005 and 2009 (Figure 5). By contrast, palm oil for non-food consumption (other utilization) has been increasing especially from 2005 to 2008, accounting respectively for 27% and 36% of the domestic consumption (FAOSTAT, 2012).
Figure 5 : Food and non-food supply (‘000t), 2005-2009.
Source: FAOSTAT, 2012
The demand in the traditional market is three times higher than the industrial demand (food and non-food), owing to the lack of development of the industry for primary or secondary transformation (PIND, 2011). This also means that the household traditional market is a major determinant of the supply deficit in Nigeria.
Food supply Other utilization Waste
9
Box 1: The major food products companies buying SPO and PKO (PIND, 2011)
• De-United Industries (manufacturers of market leading Indomie noodles),
• May&Baker (manufacturers of Mimi noodles),
• Honeywell foods (manufacturers of O-noodles),
• Chikki Foods (manufacturers of Chilkki noodles),
• UAC Foods (general food products and users of palm olein and palm stearin)
• Sumal Foods (special oil blends)
• Nasco Foods (buyers of palm stearin)
• Unilever (general users of palm stearin)
• Consolidated Foods (general users of palm stearin)
• Okin Biscuit (users of palm stearin as ingredient for biscuit making)
• Standard Biscuit (users of palm stearin as ingredient for biscuit making)
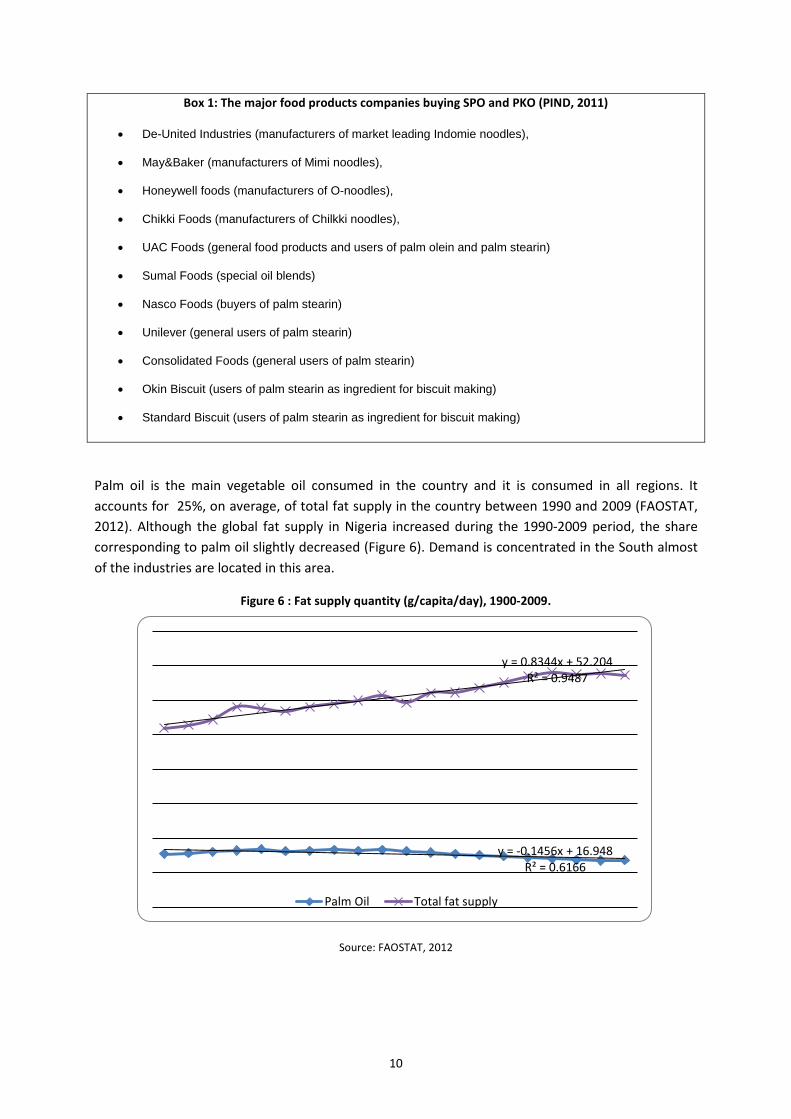
Palm oil is the main vegetable oil consumed in the country and it is consumed in all regions. It accounts for 25%, on average, of total fat supply in the country between 1990 and 2009 (FAOSTAT, 2012). Although the global fat supply in Nigeria increased during the 1990-2009 period, the share corresponding to palm oil slightly decreased (Figure 6). Demand is concentrated in the South almost of the industries are located in this area.
Figure 6 : Fat supply quantity (g/capita/day), 1900-2009.
Source: FAOSTAT, 2012
y = -0.1456x + 16.948 R² = 0.6166
y = 0.8344x + 52.204 R² = 0.9487
Palm Oil Total fat supply
10
MARKETING AND TRADE Nigeria is a net importer of palm oil. Palm oil is the third food commodity imported in terms of quantity, after sugar and wheat, accounting for 9% of the total agricultural imports volume in 2010 (FAOSTAT, 2012). Imports increased steadily between 2005 and 2009 and represented on average 23% of the total domestic supply (FAOSTAT, 2012).
Table 2 : Palm oil production and trade, 2005-2009.
Unit 2005 2006 2007 2008 2009
1 Production 1000t 1170 1287 1309 1330 1380
2 Imports 1000t 310.7 316.9 404.2 476.6 427.2
3 Exports 1000t 10 5 15 25 10
4=(1 +2)-3
Domestic supply 1000t 1470.7 1598.9 1698.2 1781.6 1797.2
=2/4 Share of imports in the domestic supply
% 21.13% 19.82% 23.80% 26.75% 23.77%
=3/4 Share of exports in the domestic supply
% 0.7% 0.3% 0.9% 1.4% 0.6%
Source: FAOSTAT, 2012
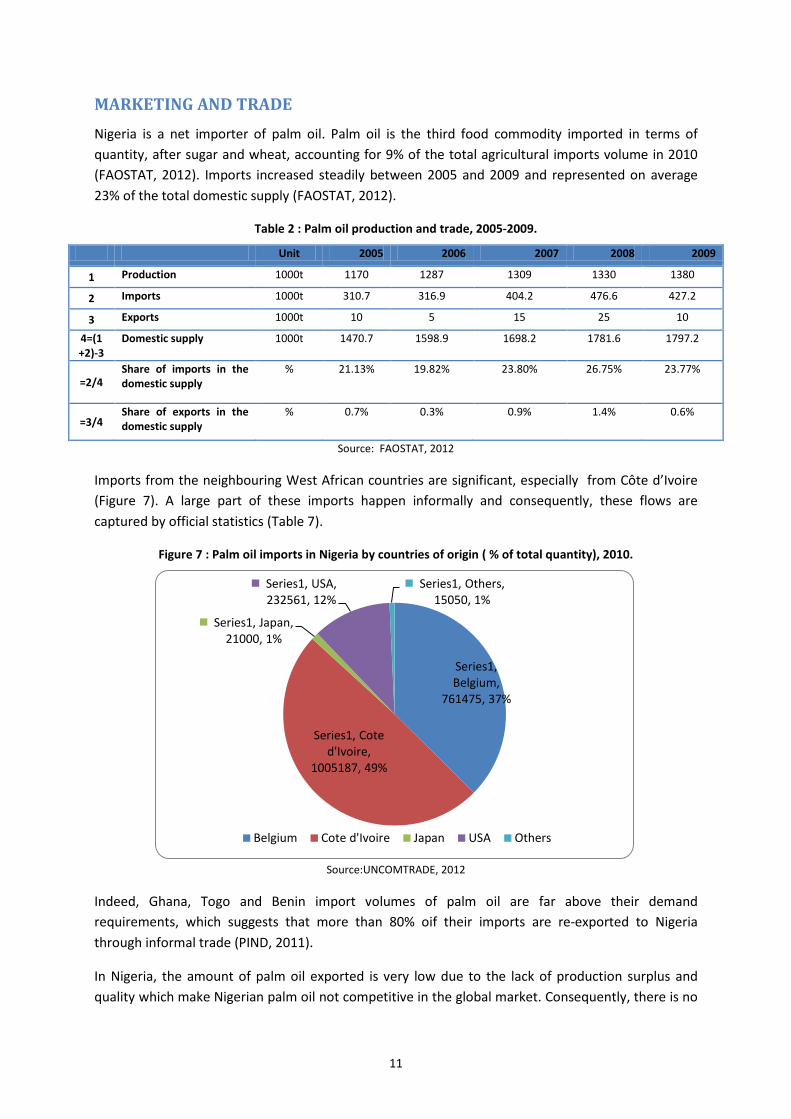
Imports from the neighbouring West African countries are significant, especially from Côte d’Ivoire (Figure 7). A large part of these imports happen informally and consequently, these flows are captured by official statistics (Table 7).
Figure 7 : Palm oil imports in Nigeria by countries of origin ( % of total quantity), 2010.
Source:UNCOMTRADE, 2012
Indeed, Ghana, Togo and Benin import volumes of palm oil are far above their demand requirements, which suggests that more than 80% oif their imports are re-exported to Nigeria through informal trade (PIND, 2011).
In Nigeria, the amount of palm oil exported is very low due to the lack of production surplus and quality which make Nigerian palm oil not competitive in the global market. Consequently, there is no
Series1, Belgium,
761475, 37%
Series1, Cote d'Ivoire,
1005187, 49%
Series1, Japan, 21000, 1%
Series1, USA, 232561, 12%
Series1, Others, 15050, 1%
Belgium Cote d'Ivoire Japan USA Others
11
incentive to export the commodity (JAD, 2012). Exports remain low, representing on average less than 1% of the domestic supply between 2005 and 2009 (Table 2).
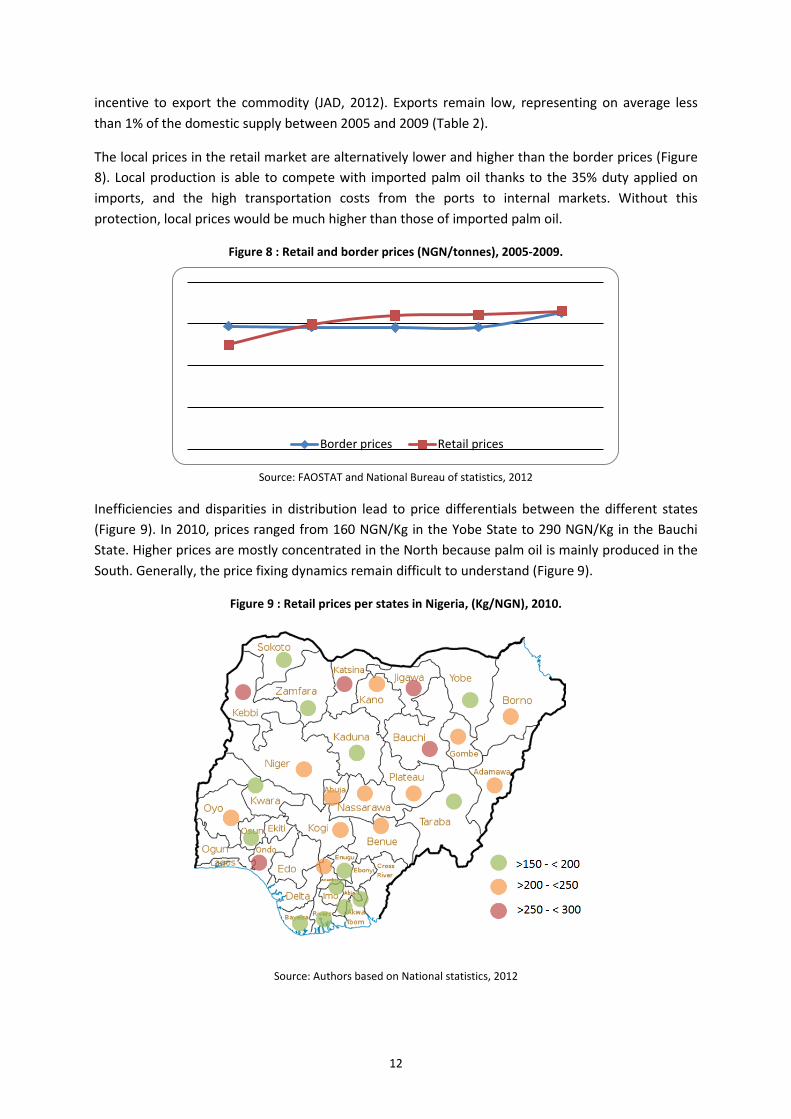
The local prices in the retail market are alternatively lower and higher than the border prices (Figure 8). Local production is able to compete with imported palm oil thanks to the 35% duty applied on imports, and the high transportation costs from the ports to internal markets. Without this protection, local prices would be much higher than those of imported palm oil.
Figure 8 : Retail and border prices (NGN/tonnes), 2005-2009.
Source: FAOSTAT and National Bureau of statistics, 2012
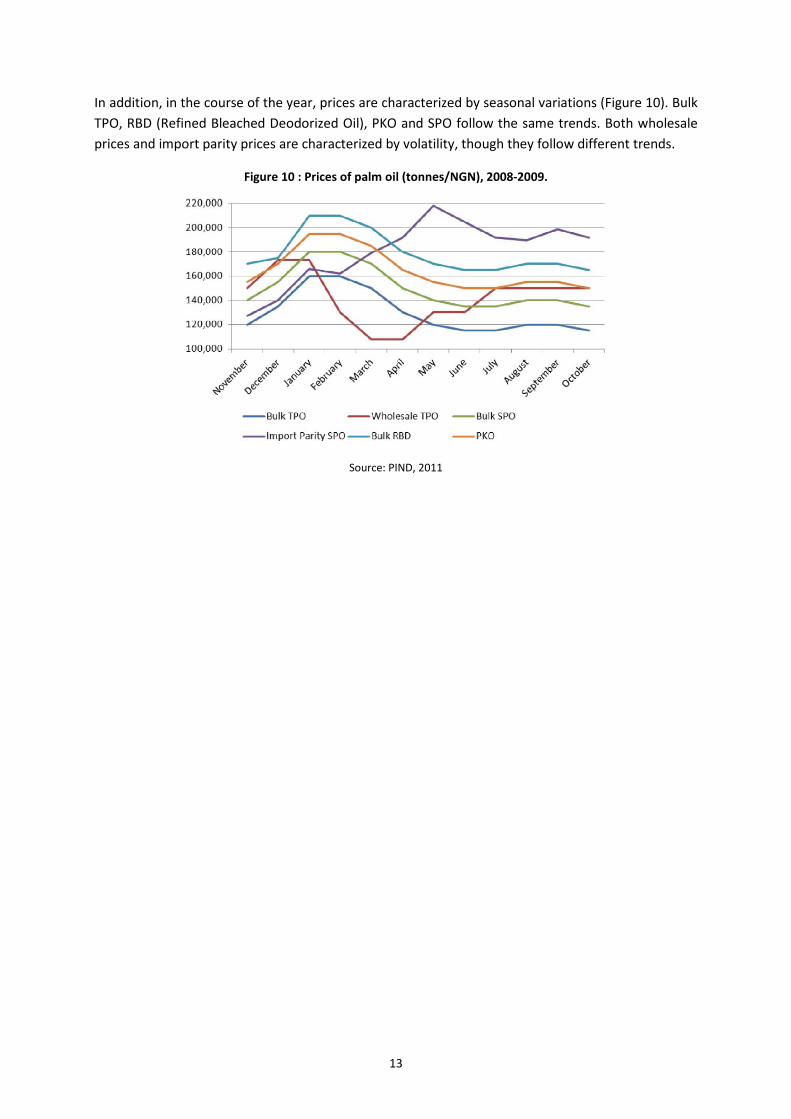
Inefficiencies and disparities in distribution lead to price differentials between the different states (Figure 9). In 2010, prices ranged from 160 NGN/Kg in the Yobe State to 290 NGN/Kg in the Bauchi State. Higher prices are mostly concentrated in the North because palm oil is mainly produced in the South. Generally, the price fixing dynamics remain difficult to understand (Figure 9).
Figure 9 : Retail prices per states in Nigeria, (Kg/NGN), 2010.
Source: Authors based on National statistics, 2012
Border prices Retail prices
12
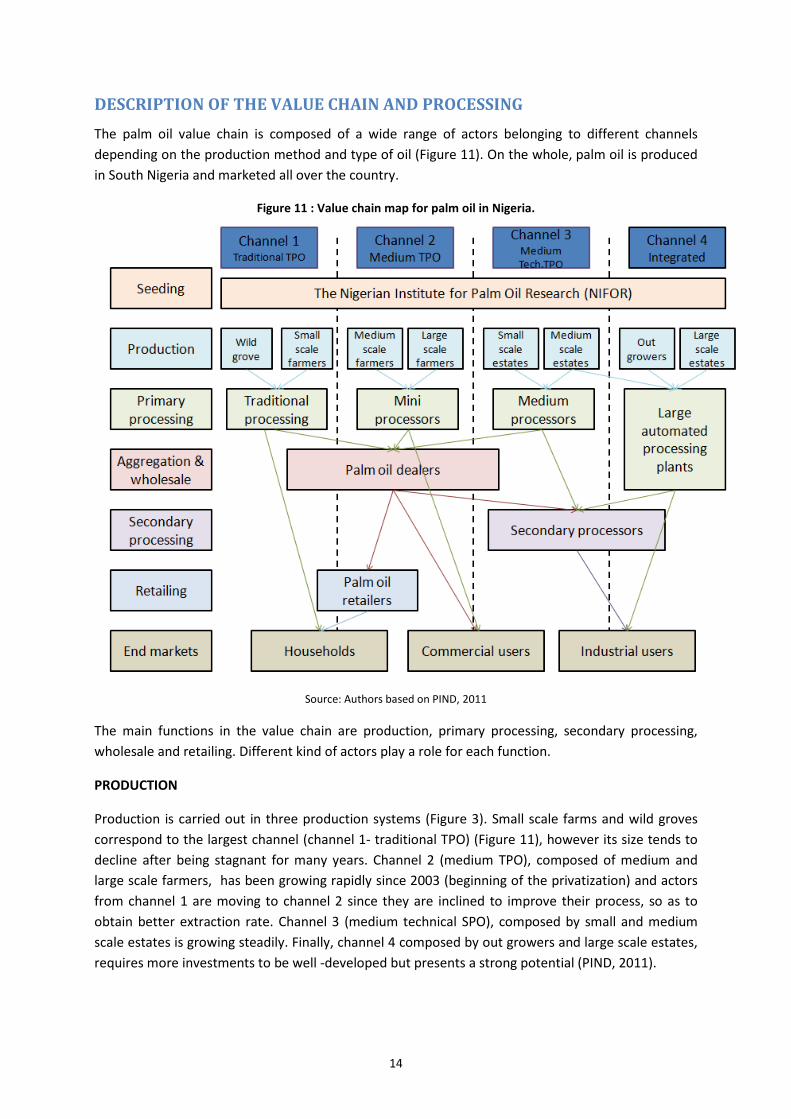
In addition, in the course of the year, prices are characterized by seasonal variations (Figure 10). Bulk TPO, RBD (Refined Bleached Deodorized Oil), PKO and SPO follow the same trends. Both wholesale prices and import parity prices are characterized by volatility, though they follow different trends.
Figure 10 : Prices of palm oil (tonnes/NGN), 2008-2009.
Source: PIND, 2011
13
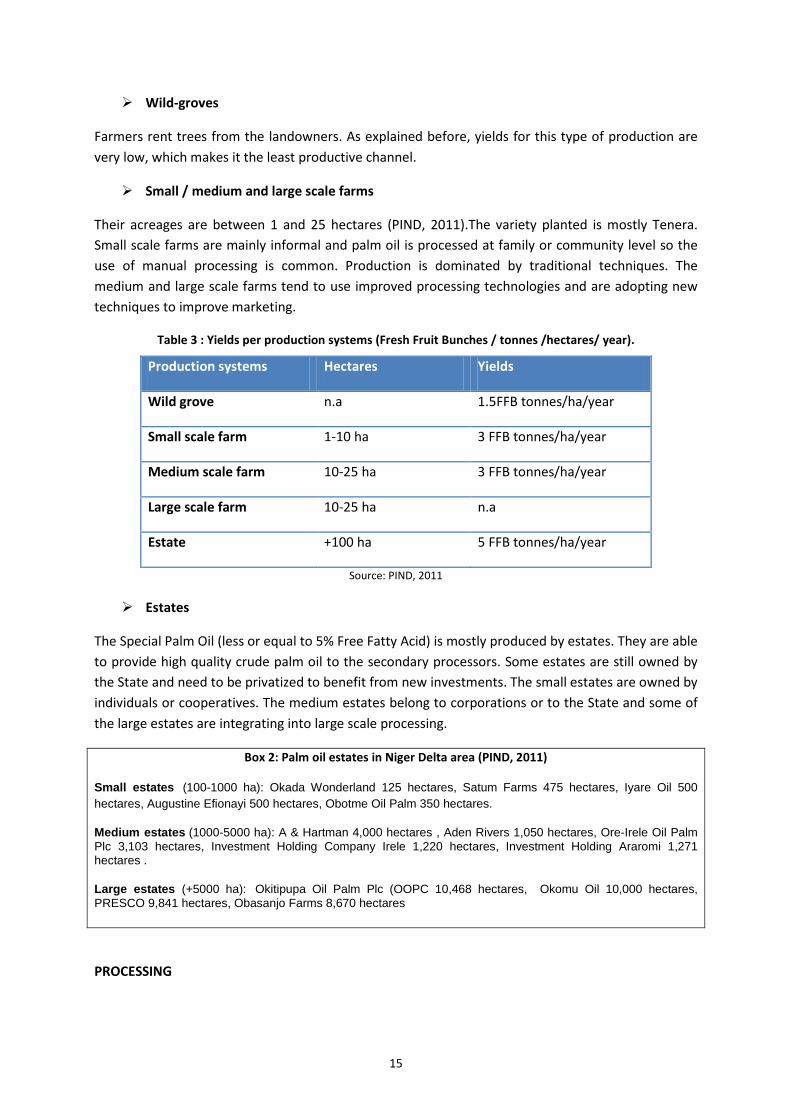
DESCRIPTION OF THE VALUE CHAIN AND PROCESSING The palm oil value chain is composed of a wide range of actors belonging to different channels depending on the production method and type of oil (Figure 11). On the whole, palm oil is produced in South Nigeria and marketed all over the country.
Figure 11 : Value chain map for palm oil in Nigeria.
Source: Authors based on PIND, 2011
The main functions in the value chain are production, primary processing, secondary processing, wholesale and retailing. Different kind of actors play a role for each function.
PRODUCTION
Production is carried out in three production systems (Figure 3). Small scale farms and wild groves correspond to the largest channel (channel 1- traditional TPO) (Figure 11), however its size tends to decline after being stagnant for many years. Channel 2 (medium TPO), composed of medium and large scale farmers, has been growing rapidly since 2003 (beginning of the privatization) and actors from channel 1 are moving to channel 2 since they are inclined to improve their process, so as to obtain better extraction rate. Channel 3 (medium technical SPO), composed by small and medium scale estates is growing steadily. Finally, channel 4 composed by out growers and large scale estates, requires more investments to be well -developed but presents a strong potential (PIND, 2011).
14
Wild-groves
Farmers rent trees from the landowners. As explained before, yields for this type of production are very low, which makes it the least productive channel.
Small / medium and large scale farms
Their acreages are between 1 and 25 hectares (PIND, 2011).The variety planted is mostly Tenera. Small scale farms are mainly informal and palm oil is processed at family or community level so the use of manual processing is common. Production is dominated by traditional techniques. The medium and large scale farms tend to use improved processing technologies and are adopting new techniques to improve marketing.
Table 3 : Yields per production systems (Fresh Fruit Bunches / tonnes /hectares/ year).
Production systems Hectares Yields
Wild grove n.a 1.5FFB tonnes/ha/year
Small scale farm 1-10 ha 3 FFB tonnes/ha/year
Medium scale farm 10-25 ha 3 FFB tonnes/ha/year
Large scale farm 10-25 ha n.a
Estate +100 ha 5 FFB tonnes/ha/year
Source: PIND, 2011
Estates
The Special Palm Oil (less or equal to 5% Free Fatty Acid) is mostly produced by estates. They are able to provide high quality crude palm oil to the secondary processors. Some estates are still owned by the State and need to be privatized to benefit from new investments. The small estates are owned by individuals or cooperatives. The medium estates belong to corporations or to the State and some of the large estates are integrating into large scale processing.
Box 2: Palm oil estates in Niger Delta area (PIND, 2011)
Small estates (100-1000 ha): Okada Wonderland 125 hectares, Satum Farms 475 hectares, Iyare Oil 500 hectares, Augustine Efionayi 500 hectares, Obotme Oil Palm 350 hectares.
Medium estates (1000-5000 ha): A & Hartman 4,000 hectares , Aden Rivers 1,050 hectares, Ore-Irele Oil Palm Plc 3,103 hectares, Investment Holding Company Irele 1,220 hectares, Investment Holding Araromi 1,271 hectares . Large estates (+5000 ha): Okitipupa Oil Palm Plc (OOPC 10,468 hectares, Okomu Oil 10,000 hectares, PRESCO 9,841 hectares, Obasanjo Farms 8,670 hectares
PROCESSING
15
According to the method used, the levels of oil extraction varies widely. Indeed, in the traditional channel, most of the palm oil is produced by women using manual traditional methods namely mortar and pestle. Oil extracted usually reaches only 25% of the available oil in the fruit (PIND, 2011). Some small farmers use mini–improved processing units which are semi-mechanized. The medium scale processors process the fruit with a screening machine, boiler, digester, press, clarifier and generator. They employ around 10 persons to operate. The large scale processors attached to the estate mills offer high yields of 75% oil extracted of the available oil (PIND, 2011). However, more than 75% of the crude palm oil produced in Nigeria is still obtained thanks to traditional methods.
SECONDARY PROCESSING
SPO and PKO are the main inputs for secondary processing. The SPO production is not enough to match the refined company capacities as it is able to supply less than 50% for production. As a result, some companies source palm oil internationally through imports.
Box3: Companies processors of SPO (PIND, 2011)
• Golden Oil Industries Ltd, 15A harbour industrial Estate, Onitsha
• Envoy oil Industries Ltd, PokoBros Avenue, Onitsha
• Sudit Oil & Chemical Ltd, Ibadan
• Presco PLC, Obaretin Estate, Km 22 Benin / Sapele road, Benin-city
WHOLESALE
There are four categories of traders in the value chain (PIND, 2011).
Community palm oil dealer association
They purchase palm oil from plantation estates in plastic jerry cans (20l), drums (200l) or in tankers and they bulk-buy it on a regular basis.
Peddlers
They buy crude palm oil from farmers and millers and sell it to oil dealers, getting a commission. They are organized in union or association to create a barrier between smallholders and dealers.
Oil merchants
They source oil from local traders and middlemen and they bulk-buy in drums to deliver it to the Northern states. They have their own distribution stores and benefit from a wide network of retailers, wholesalers and industrial markets.
Speculators
They purchase palm oil during the high supply period and store it in order to send it later to major dealers during the period of scarcity. Sometimes, farmers store oil themselves .
16
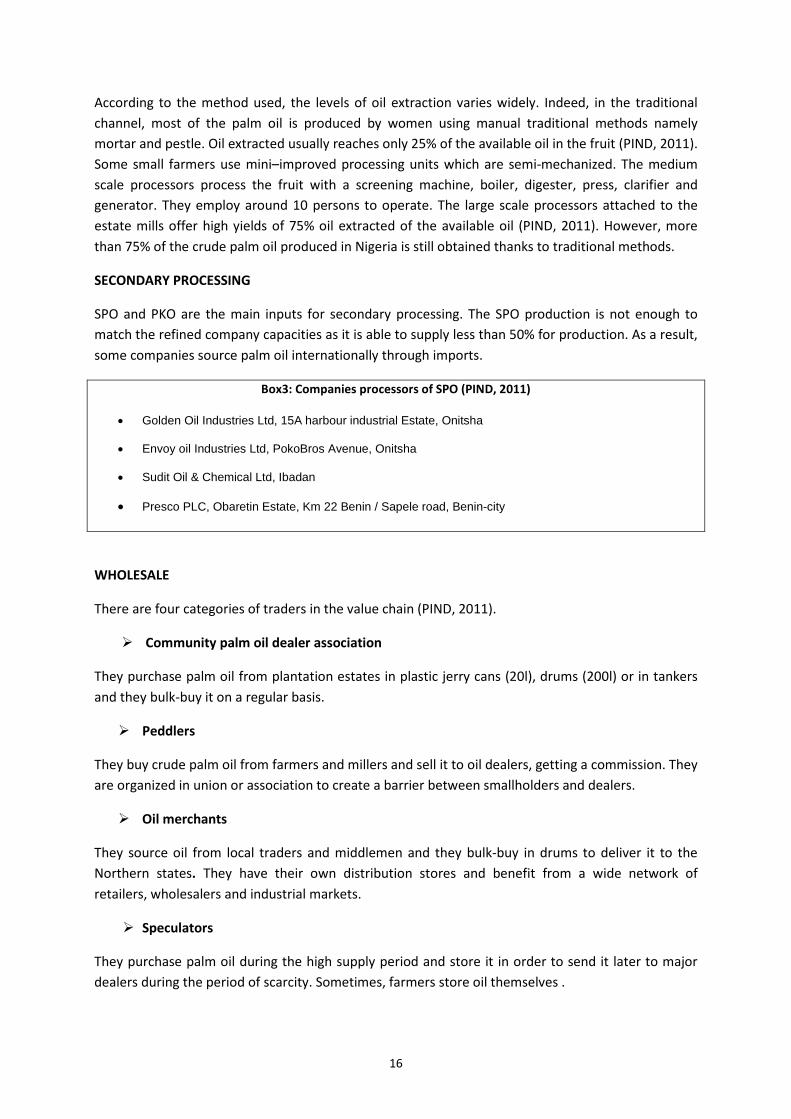
With regards to margins distribution within the value chain from seed production to distribution, agents who are receiving the largest benefits are the producers and the millers (Figure 12). Wholesalers are not included in the following figure. Village agents, oil peddlers and oil dealers are in charge of the distribution. Margins corresponding to seeds production are negative, since this activity is financed by public funds i.e NIFOR (section:
POLICY DECISIONS AND MEASURES) and seed distribution is a part of the extension services.
Figure 12 : Oil Palm Value added in Abia State (NGN/Tonne), 2009.
Source: e-Gen, 2009
RETAILING
Retail can take place in road sides, local/periodic market centers and stands as well as wholesale (AJMM, 2011). Each retail point is characterized by activities of trading associations, consequently the retail market is restricted as it does not allow free entry into the business. Indeed, distributors have to be registered by paying a large amount of money to the associations. The members fix the price of palm oil (AJMM, 2011).
INEFFICIENCIES OF THE VALUE CHAIN
Each function of the value chain faces challenges. The major constraints are the supply of inputs, the inefficiency of processing methods, the low quality of the output, the lack of infrastructure and inefficient distribution.
Seeds and fertilizers are often adulterated and unimproved (STA). Some farmers use imported seed material obtained from research institutions without the corresponding application packages. Moreover, the use of fertilizers is not common and if this is available, it is expensive and not appropriate. These issues lead to the proliferation of adulterated seeds and seedlings.
With regards to production, the traditional method is dominant, so yields remain low. Moreover, this method is very tedious and laborious compared to mechanical methods and requires a substantial proportion of labor force (IJAERD, 2008). Milling cost of production is high, which results in high prices. For instance, in Indonesia, costs of production are about 20USD per tones of oil, compared to 70USD in Nigeria (e-Gen, 2009). Concerning wild grove production methods, as farmers do not own
17
the trees, they are not encouraged to invest in them, which leads to a negative impact in terms of yields (JAD, 2012). Undeveloped methods of production are reflected in the high prices.
Companies sometimes reject palm oil because of its poor quality due to the high level of Free Fatty Acids (FFA). Moreover, there is no policy support like a quality monitoring to develop the production of quality palm oil in Nigeria therefore there is no improvement of the quality.
The lack of infrastructure such as storage facilities, transportation systems, access roads, communication channels are also sources of inefficiencies in the value chain (JAD, 2012). As a result, smallholders prefer to farm in cottage or cooperative mills or sell crops via middlemen to take the advantage of evacuation, storage and transport (UNIDO, 2010). Processors’ revenue could increase dramatically if high transportation costs were to be reduced (IJAARD, 2008).
Finally, as seen above, there are numerous actors and intermediaries in the production, processing and marketing and most of all in the distribution function, which leads to a fragmented relation between the actors at each level. One of the challenges for the sector is to achieve a better internal coordination.
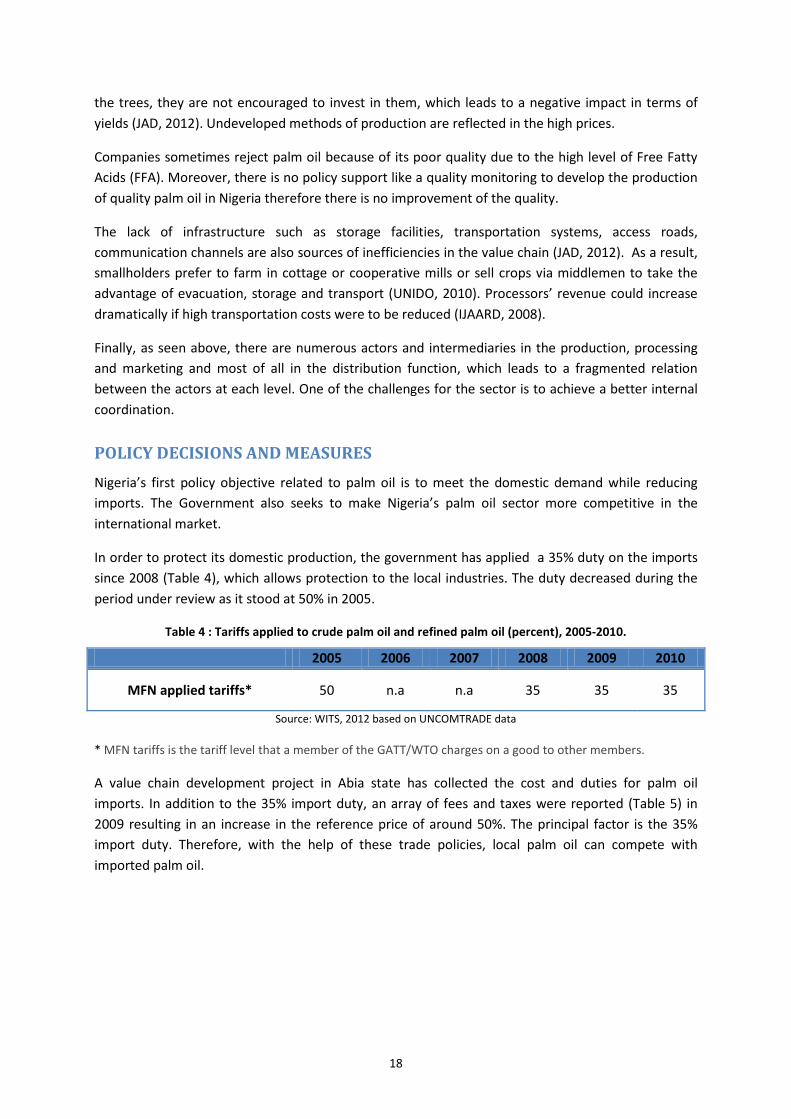
POLICY DECISIONS AND MEASURES Nigeria’s first policy objective related to palm oil is to meet the domestic demand while reducing imports. The Government also seeks to make Nigeria’s palm oil sector more competitive in the international market.
In order to protect its domestic production, the government has applied a 35% duty on the imports since 2008 (Table 4), which allows protection to the local industries. The duty decreased during the period under review as it stood at 50% in 2005.
Table 4 : Tariffs applied to crude palm oil and refined palm oil (percent), 2005-2010.
2005 2006 2007 2008 2009 2010
MFN applied tariffs* 50 n.a n.a 35 35 35
Source: WITS, 2012 based on UNCOMTRADE data
* MFN tariffs is the tariff level that a member of the GATT/WTO charges on a good to other members. A value chain development project in Abia state has collected the cost and duties for palm oil imports. In addition to the 35% import duty, an array of fees and taxes were reported (Table 5) in 2009 resulting in an increase in the reference price of around 50%. The principal factor is the 35% import duty. Therefore, with the help of these trade policies, local palm oil can compete with imported palm oil.
18
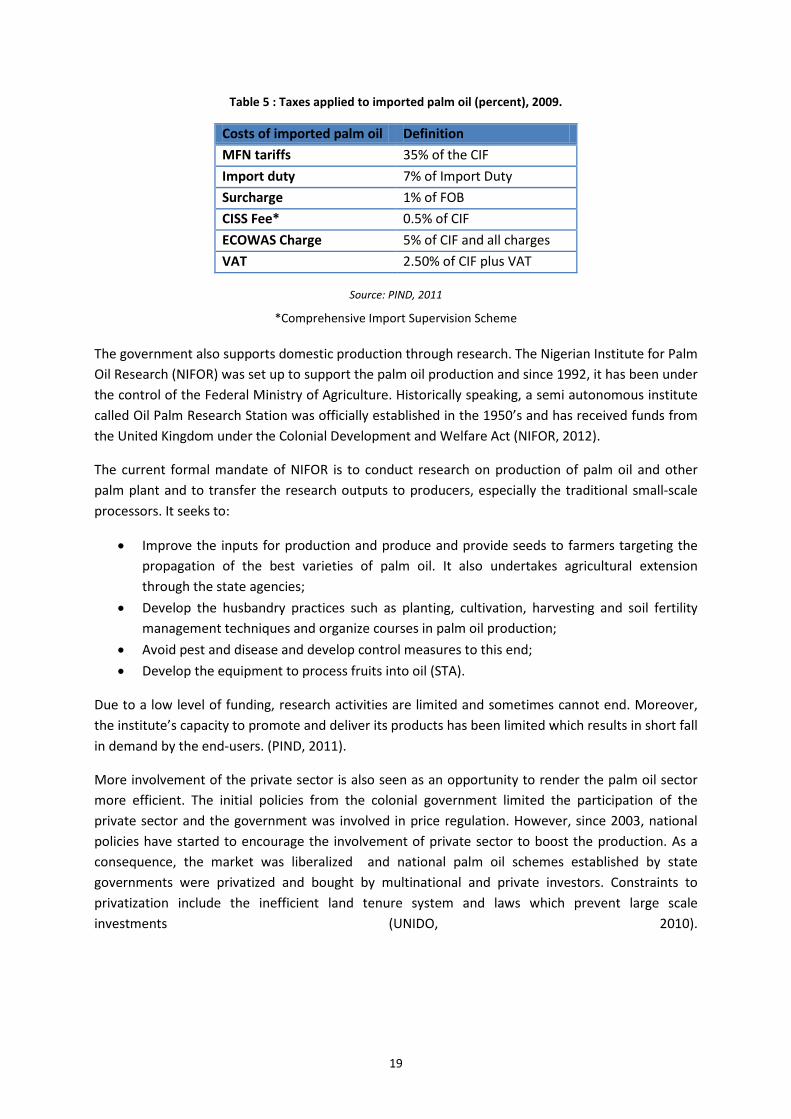
Table 5 : Taxes applied to imported palm oil (percent), 2009.
Source: PIND, 2011
*Comprehensive Import Supervision Scheme
The government also supports domestic production through research. The Nigerian Institute for Palm Oil Research (NIFOR) was set up to support the palm oil production and since 1992, it has been under the control of the Federal Ministry of Agriculture. Historically speaking, a semi autonomous institute called Oil Palm Research Station was officially established in the 1950’s and has received funds from the United Kingdom under the Colonial Development and Welfare Act (NIFOR, 2012).
The current formal mandate of NIFOR is to conduct research on production of palm oil and other palm plant and to transfer the research outputs to producers, especially the traditional small-scale processors. It seeks to:
• Improve the inputs for production and produce and provide seeds to farmers targeting the propagation of the best varieties of palm oil. It also undertakes agricultural extension through the state agencies;
• Develop the husbandry practices such as planting, cultivation, harvesting and soil fertility management techniques and organize courses in palm oil production;
• Avoid pest and disease and develop control measures to this end; • Develop the equipment to process fruits into oil (STA).
Due to a low level of funding, research activities are limited and sometimes cannot end. Moreover, the institute’s capacity to promote and deliver its products has been limited which results in short fall in demand by the end-users. (PIND, 2011).
More involvement of the private sector is also seen as an opportunity to render the palm oil sector more efficient. The initial policies from the colonial government limited the participation of the private sector and the government was involved in price regulation. However, since 2003, national policies have started to encourage the involvement of private sector to boost the production. As a consequence, the market was liberalized and national palm oil schemes established by state governments were privatized and bought by multinational and private investors. Constraints to privatization include the inefficient land tenure system and laws which prevent large scale investments (UNIDO, 2010).
Costs of imported palm oil Definition MFN tariffs 35% of the CIF Import duty 7% of Import Duty Surcharge 1% of FOB CISS Fee* 0.5% of CIF ECOWAS Charge 5% of CIF and all charges VAT 2.50% of CIF plus VAT
19
3. DATA REQUIREMENTS, DESCRIPTION AND CALCULATION OF INDICATORS
In order to calculate the indicators required for the MAFAP analysis and to estimate incentives and/or disincentives (see ANNEX I: Methodology Used) for palm oil production, several types of data are needed. They were collected and are presented and explained hereafter.
TRADE STATUS OF THE PRODUCTS As explained below, Nigeria was a net importer of palm oil during the period under review. Imports have been increasing between 2005 and 2009. On average 23% of consumption comes from imports especially from West Africa (Table 2).
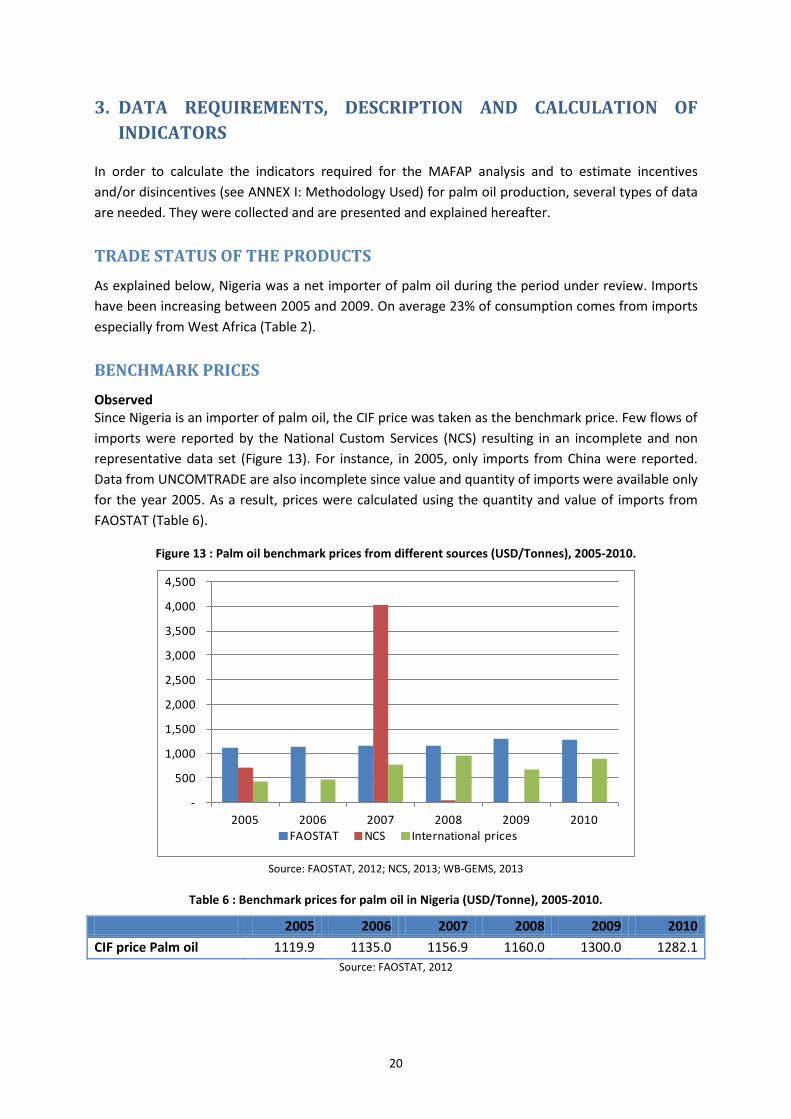
BENCHMARK PRICES Observed Since Nigeria is an importer of palm oil, the CIF price was taken as the benchmark price. Few flows of imports were reported by the National Custom Services (NCS) resulting in an incomplete and non representative data set (Figure 13). For instance, in 2005, only imports from China were reported. Data from UNCOMTRADE are also incomplete since value and quantity of imports were available only for the year 2005. As a result, prices were calculated using the quantity and value of imports from FAOSTAT (Table 6).
Figure 13 : Palm oil benchmark prices from different sources (USD/Tonnes), 2005-2010.
Source: FAOSTAT, 2012; NCS, 2013; WB-GEMS, 2013
Table 6 : Benchmark prices for palm oil in Nigeria (USD/Tonne), 2005-2010.
2005 2006 2007 2008 2009 2010 CIF price Palm oil 1119.9 1135.0 1156.9 1160.0 1300.0 1282.1
Source: FAOSTAT, 2012
-
500
1,000
1,500
2,000
2,500
3,000
3,500
4,000
4,500
2005 2006 2007 2008 2009 2010FAOSTAT NCS International prices
20
Adjusted No adjustments to the benchmark price have been made.
DOMESTIC PRICES Observed wholesale prices Prices at wholesale level namely palm oil dealer prices were available only for 2011 from a value chain analysis in the Niger Delta (PIND, 2011) (Table 7). Few information on the import market are available but we identified that a large part of palm oil processed by the refineries (secondary processors mainly located in the Niger Delta) is imported, this could be explained by their need of high quality palm oil. As a result, the point of competition in our analysis is not at the palm oil dealer level but at the processor level. However, prices at processor level were not available thus the analysis will focus only on incentives and disincentives received by producers.
Table 7 : Prices in the palm oil sector, for the River State, (NGN/Tonne), 2011.
Agents Prices
Farm/processor 119438
Wholesaler 151288
Retailer 166075
Source: PIND, 2011
Observed farm gate prices Farm gate prices were collected through a national survey conducted by the Ministry of Agriculture, the National Bureau of Statistics (NBS) and the Central Bank of Nigeria. As prices reported correspond to national average price, they do not reflect the regional price gap.
Table 8 : Farm gates prices (NGN/Tonne), 2005-2010.
2005 2006 2007 2008 2009 2010
Farm gate prices 90470 128490 167380 166910 151750 64500
Source: Min. of Ag., NBS, Central Bank of Nigeria, 2013
EXCHANGE RATES In this case, we applied the exchange rate between US dollar and Naira (NGN) as the benchmark price is in USD.
Table 9 : Exchange rate (NGN/USD), 2005-2010.
2005 2006 2007 2008 2009 2010 Echange rate NGN per USD
131 129 126 119 149 150
Source: World Bank, 2012
21
ACCESS COSTS Observed
Access costs from the farm gate to the wholesale
Access costs reflect the cost of transporting the commodity from farm gate to the wholesale markets. They were reported in a field survey in the Imo state in 2010 which is one of the largest producing state in the Niger Delta where the main secondary processors are. In Imo state, two kinds of surveys were conducted, one for processors and one for non-processors. As the farm gate prices used in our analysis already correspond to palm oil rather than fruits, cost incurred by non-processors were used. Access costs reported include: labour, transportation, rent, levies, security/preservatives and interests. Since only data for 2010 were available, data for previous years were calculated using the Consumer price index.
Table 10 : Observed access costs from producers to wholesale (NGN/tonne), 2005-2010.
2005 2006 2007 2008 2009 2010 Labour 408.5 442.0 466.1 520.0 580.1 659.3
Transportation 1293.6 1399.7 1476.0 1646.8 1836.9 2087.9
Rent 1191.5 1289.2 1359.5 1516.8 1691.9 1923.1
Levies 340.4 368.3 388.4 433.4 483.4 549.5
Securities /preservatives 510.6 552.5 582.6 650.0 725.1 824.2
Interest 4709.8 5096.0 5373.9 5995.6 6687.9 7601.6
TOTAL 8454.5 9147.8 9646.6 10762.6 12005.4 13645.6
Source: Authors based on AJMM, 2011
Access costs from the border to the wholesale
Access costs from the border to the wholesale were obtained from a value chain analysis in Abia State (PIND, 2011) in the Niger Delta. The main port is Port Harcourt also located in the Niger Delta. Since only data for 2009 were reported, the previous and the following years were calculated using the Consumer price index.
22
Table 11 : Observed access costs from border to wholesale (NGN/tonne), 2005-2010.
2005 2006 2007 2008 2009 2010
Clearing agent cost 2072.4 2242.4 2364.6 2638.2 2942.8 3344.9
Finance cost 7190.0 7779.5 8203.7 9152.8 10209.7 11604.6
Brokers fee 1058.4 1145.2 1207.7 1347.4 1503.0 1708.3
Road transport 1175.9 1272.3 1341.7 1497.0 1669.8 1897.9
TOTAL 11496.7 12439.5 13117.8 14635.4 16325.4 18555.7
Source: Authors based on PIND, 2011
Adjusted
Access costs from the farm gate to the wholesale
Adjusted access costs from producers to wholesalers reflect the cost of transporting, in an efficient or well-functioning market. As a consequence, the adjusted access costs omit levies. Interest (i.e margins) reported accounted for 7% of the farm gate prices on average, thus no adjustment was made.
Table 12 : Adjusted access costs from producers to wholesale (NGN/tonne), 2005-2010.
2005 2006 2007 2008 2009 2010
Labour 408.5 442.0 466.1 520.0 580.1 659.3
Transportation 1293.6 1399.7 1476.0 1646.8 1836.9 2087.9
Rent 1191.5 1289.2 1359.5 1516.8 1691.9 1923.1
Levies 0.0 0.0 0.0 0.0 0.0 0.0
Securities /preservatives 510.6 552.5 582.6 650.0 725.1 824.2
Interest 4709.8 5096.0 5373.9 5995.6 6687.9 7601.6
TOTAL 8114.1 8779.5 9258.2 10329.2 11522.0 13096.2
Source: Authors based on AJMM, 2011
Access costs from the border to the wholesale
No adjustment are calculated as the value chain analysis available did not report additional inefficiencies such as excessive margins or illegal cost or taxes.
EXTERNALITIES No externalities have been taken into account in the palm oil analysis.
23
BUDGET AND OTHER TRANSFERS No budget and other transfers have been considered.
QUALITY AND QUANTITY ADJUSTMENTS Price reported and used for the analysis correspond to palm oil and not fruit, therefore no quantity adjustment was used here.
With regards to the quality of import palm oil and locally produced palm oil, we do not apply any conversion factor in this analysis. Indeed, a survey conducted in Abia State (Niger Delta, Figure 4) has demonstrated that the quality of palm oil samples investigated in 3 major markets were within the standards recommended by the Standard Organization of Nigeria (Standards for edible refined palm oil and its process forms -2000) and by the Nigerian Industrial Standards (Standard for edible vegetable oil- 1992) (Agro-science, 2007).
24
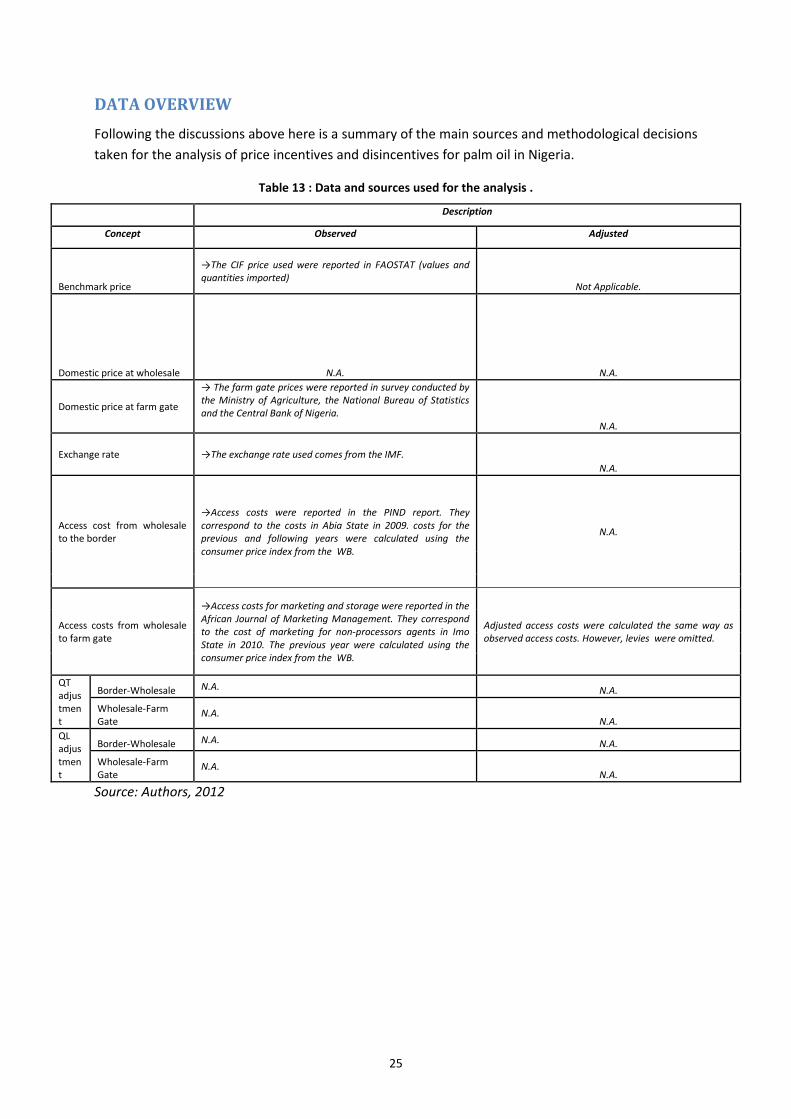
DATA OVERVIEW Following the discussions above here is a summary of the main sources and methodological decisions taken for the analysis of price incentives and disincentives for palm oil in Nigeria.
Table 13 : Data and sources used for the analysis .
Description
Concept Observed Adjusted
Benchmark price
→The CIF price used were reported in FAOSTAT (values and quantities imported)
Not Applicable.
Domestic price at wholesale N.A. N.A.
Domestic price at farm gate
→ The farm gate prices were reported in survey conducted by the Ministry of Agriculture, the National Bureau of Statistics and the Central Bank of Nigeria. N.A.
Exchange rate →The exchange rate used comes from the IMF. N.A.
Access cost from wholesale to the border
→Access costs were reported in the PIND report. They correspond to the costs in Abia State in 2009. costs for the previous and following years were calculated using the consumer price index from the WB.
N.A.
Access costs from wholesale to farm gate
→Access costs for marketing and storage were reported in the African Journal of Marketing Management. They correspond to the cost of marketing for non-processors agents in Imo State in 2010. The previous year were calculated using the consumer price index from the WB.
Adjusted access costs were calculated the same way as observed access costs. However, levies were omitted.
QT adjustment
Border-Wholesale N.A. N.A.
Wholesale-Farm Gate
N.A. N.A.
QL adjustment
Border-Wholesale N.A. N.A.
Wholesale-Farm Gate
N.A. N.A.
Source: Authors, 2012
25
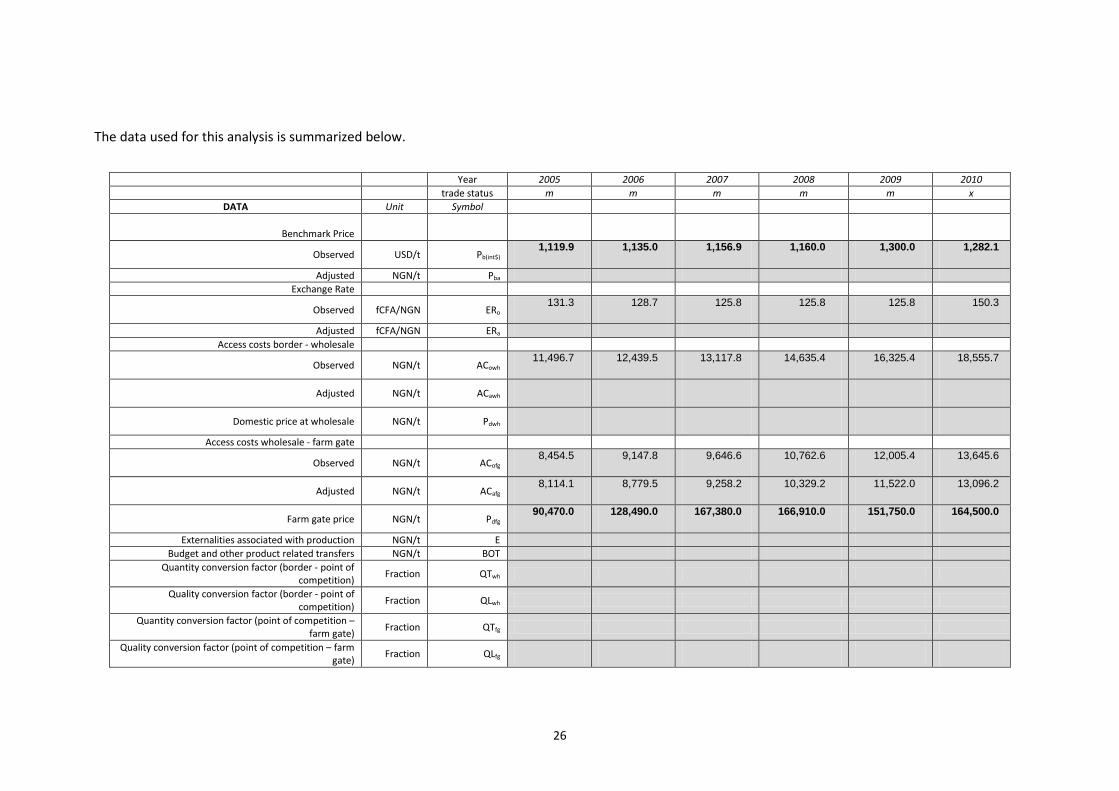
The data used for this analysis is summarized below.
Year 2005 2006 2007 2008 2009 2010 trade status m m m m m x
DATA Unit Symbol
Benchmark Price
Observed USD/t Pb(int$) 1,119.9 1,135.0 1,156.9 1,160.0 1,300.0 1,282.1
Adjusted NGN/t Pba Exchange Rate
Observed fCFA/NGN ERo 131.3 128.7 125.8 125.8 125.8 150.3
Adjusted fCFA/NGN ERa Access costs border - wholesale
Observed NGN/t ACowh 11,496.7 12,439.5 13,117.8 14,635.4 16,325.4 18,555.7
Adjusted NGN/t ACawh
Domestic price at wholesale NGN/t Pdwh
Access costs wholesale - farm gate
Observed NGN/t ACofg 8,454.5 9,147.8 9,646.6 10,762.6 12,005.4 13,645.6
Adjusted NGN/t ACafg 8,114.1 8,779.5 9,258.2 10,329.2 11,522.0 13,096.2
Farm gate price NGN/t Pdfg 90,470.0 128,490.0 167,380.0 166,910.0 151,750.0 164,500.0
Externalities associated with production NGN/t E Budget and other product related transfers NGN/t BOT
Quantity conversion factor (border - point of competition) Fraction QTwh
Quality conversion factor (border - point of competition) Fraction QLwh
Quantity conversion factor (point of competition – farm gate) Fraction QTfg
Quality conversion factor (point of competition – farm gate) Fraction QLfg
26
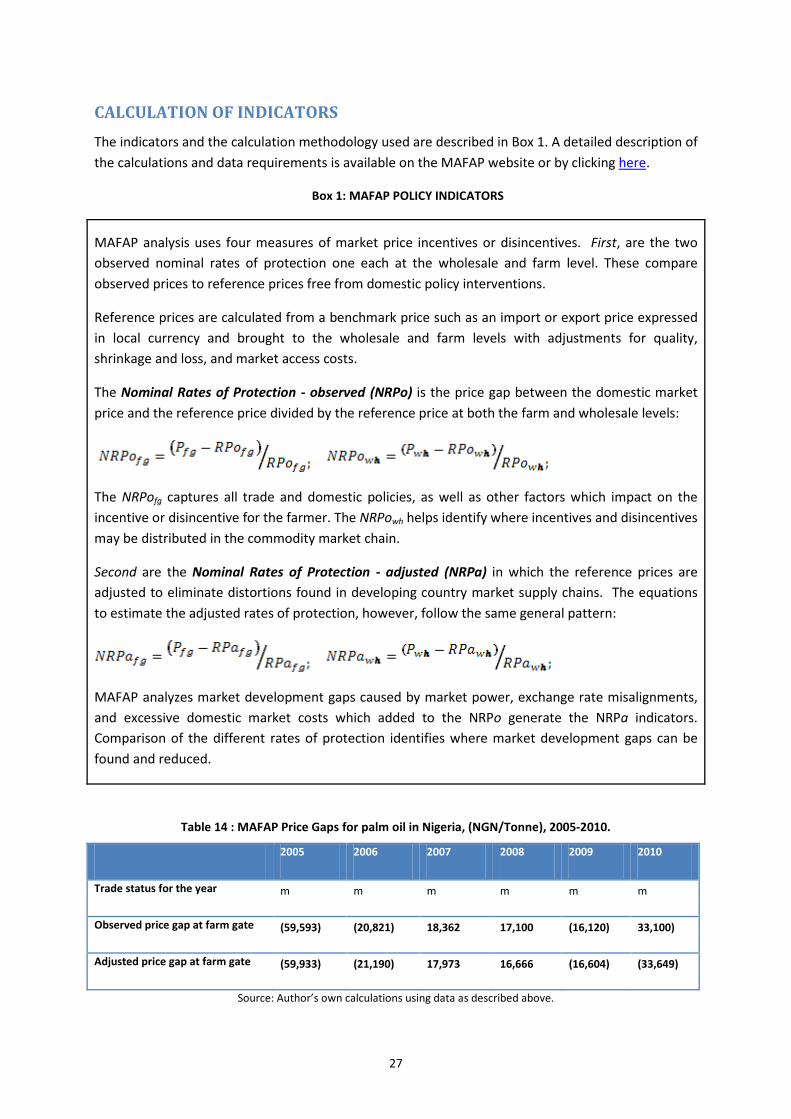
CALCULATION OF INDICATORS The indicators and the calculation methodology used are described in Box 1. A detailed description of the calculations and data requirements is available on the MAFAP website or by clicking here.
Box 1: MAFAP POLICY INDICATORS
MAFAP analysis uses four measures of market price incentives or disincentives. First, are the two observed nominal rates of protection one each at the wholesale and farm level. These compare observed prices to reference prices free from domestic policy interventions.
Reference prices are calculated from a benchmark price such as an import or export price expressed in local currency and brought to the wholesale and farm levels with adjustments for quality, shrinkage and loss, and market access costs.
The Nominal Rates of Protection - observed (NRPo) is the price gap between the domestic market price and the reference price divided by the reference price at both the farm and wholesale levels:
The NRPofg captures all trade and domestic policies, as well as other factors which impact on the incentive or disincentive for the farmer. The NRPowh helps identify where incentives and disincentives may be distributed in the commodity market chain.
Second are the Nominal Rates of Protection - adjusted (NRPa) in which the reference prices are adjusted to eliminate distortions found in developing country market supply chains. The equations to estimate the adjusted rates of protection, however, follow the same general pattern:
MAFAP analyzes market development gaps caused by market power, exchange rate misalignments, and excessive domestic market costs which added to the NRPo generate the NRPa indicators. Comparison of the different rates of protection identifies where market development gaps can be found and reduced.
Table 14 : MAFAP Price Gaps for palm oil in Nigeria, (NGN/Tonne), 2005-2010.
2005 2006 2007 2008 2009 2010
Trade status for the year m m m m m m
Observed price gap at farm gate (59,593) (20,821) 18,362 17,100 (16,120) 33,100)
Adjusted price gap at farm gate (59,933) (21,190) 17,973 16,666 (16,604) (33,649)
Source: Author’s own calculations using data as described above.
27
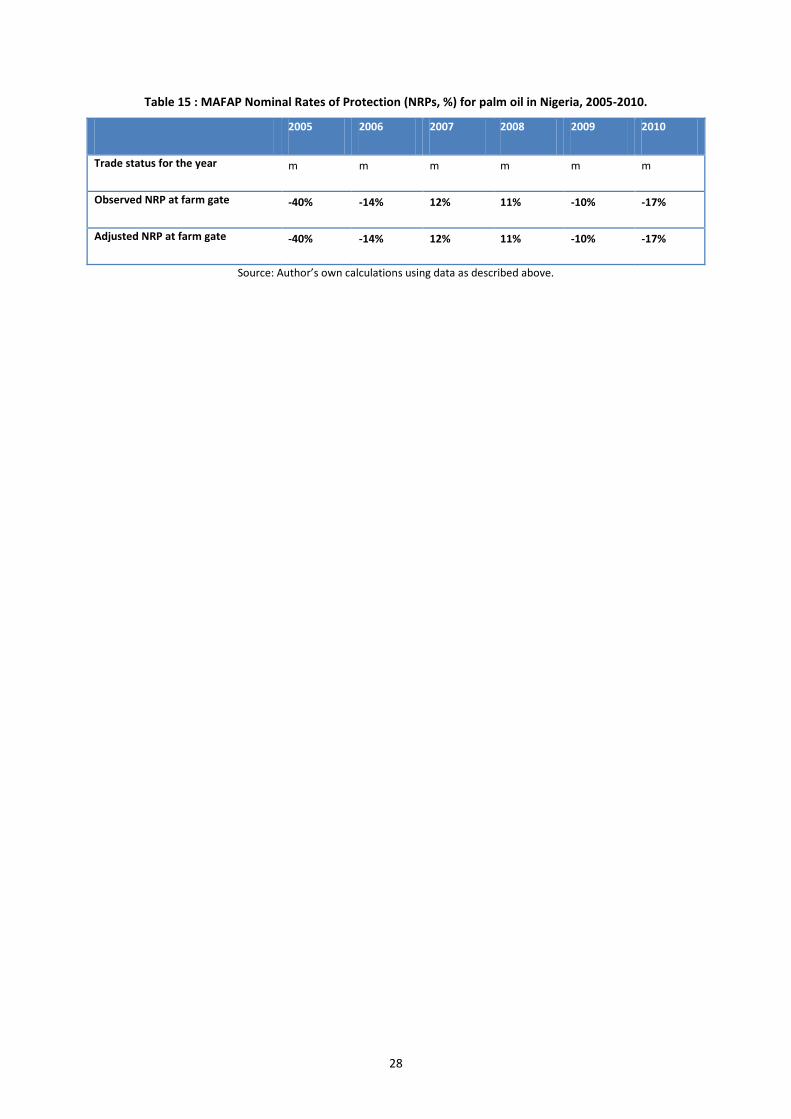
Table 15 : MAFAP Nominal Rates of Protection (NRPs, %) for palm oil in Nigeria, 2005-2010.
2005 2006 2007 2008 2009 2010
Trade status for the year m m m m m m
Observed NRP at farm gate -40% -14% 12% 11% -10% -17%
Adjusted NRP at farm gate -40% -14% 12% 11% -10% -17%
Source: Author’s own calculations using data as described above.
28
4. INTERPRETATION OF THE INDICATORS
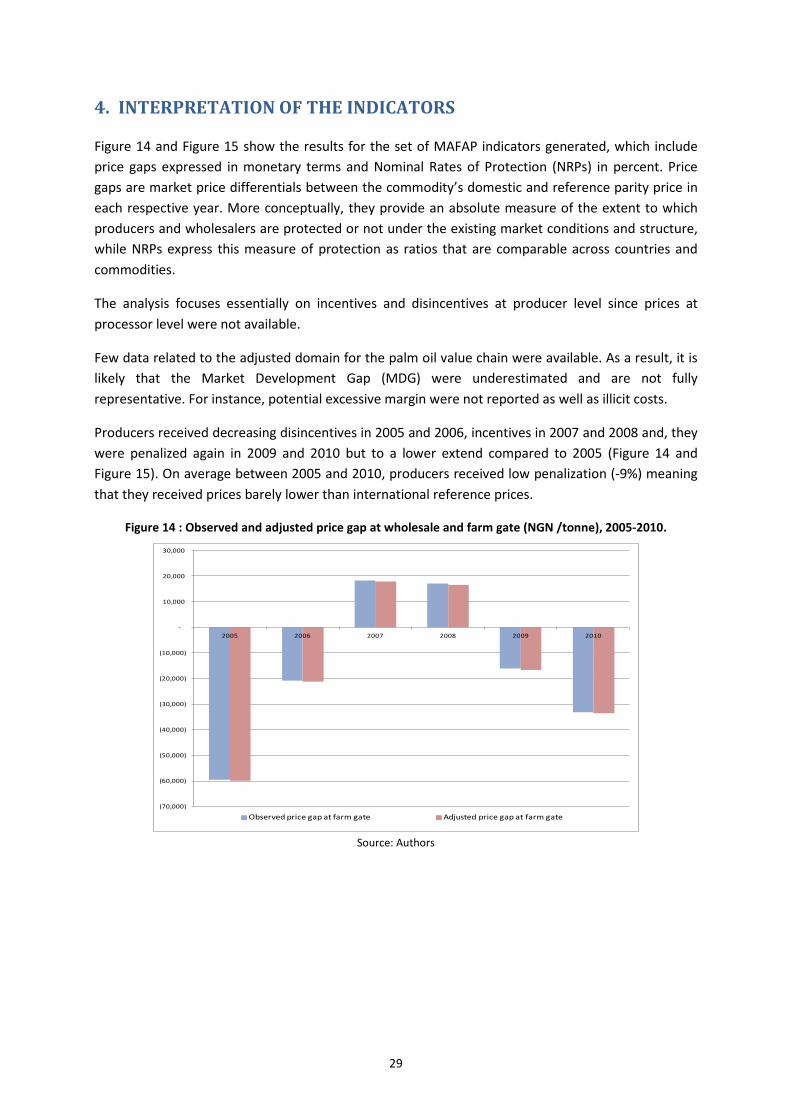
Figure 14 and Figure 15 show the results for the set of MAFAP indicators generated, which include price gaps expressed in monetary terms and Nominal Rates of Protection (NRPs) in percent. Price gaps are market price differentials between the commodity’s domestic and reference parity price in each respective year. More conceptually, they provide an absolute measure of the extent to which producers and wholesalers are protected or not under the existing market conditions and structure, while NRPs express this measure of protection as ratios that are comparable across countries and commodities.
The analysis focuses essentially on incentives and disincentives at producer level since prices at processor level were not available.
Few data related to the adjusted domain for the palm oil value chain were available. As a result, it is likely that the Market Development Gap (MDG) were underestimated and are not fully representative. For instance, potential excessive margin were not reported as well as illicit costs.
Producers received decreasing disincentives in 2005 and 2006, incentives in 2007 and 2008 and, they were penalized again in 2009 and 2010 but to a lower extend compared to 2005 (Figure 14 and Figure 15). On average between 2005 and 2010, producers received low penalization (-9%) meaning that they received prices barely lower than international reference prices.
Figure 14 : Observed and adjusted price gap at wholesale and farm gate (NGN /tonne), 2005-2010.
Source: Authors
(70,000)
(60,000)
(50,000)
(40,000)
(30,000)
(20,000)
(10,000)
-
10,000
20,000
30,000
2005 2006 2007 2008 2009 2010
Observed price gap at farm gate Adjusted price gap at farm gate
29
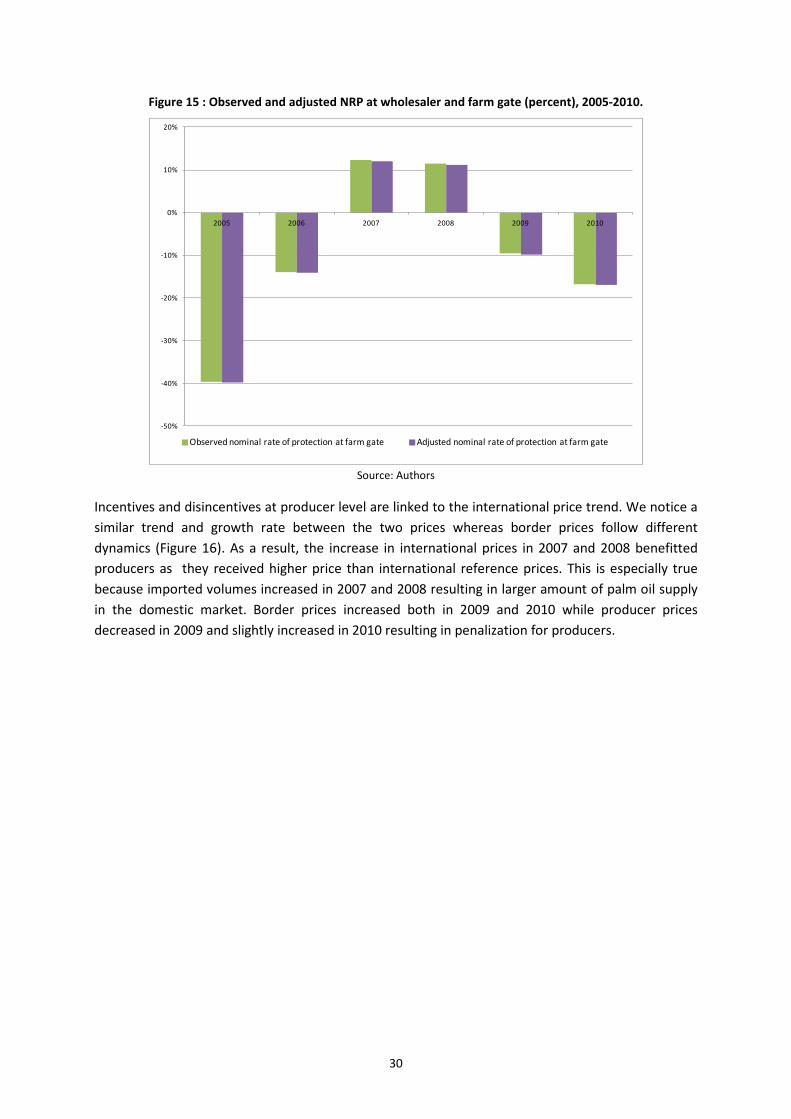
Figure 15 : Observed and adjusted NRP at wholesaler and farm gate (percent), 2005-2010.
Source: Authors
Incentives and disincentives at producer level are linked to the international price trend. We notice a similar trend and growth rate between the two prices whereas border prices follow different dynamics (Figure 16). As a result, the increase in international prices in 2007 and 2008 benefitted producers as they received higher price than international reference prices. This is especially true because imported volumes increased in 2007 and 2008 resulting in larger amount of palm oil supply in the domestic market. Border prices increased both in 2009 and 2010 while producer prices decreased in 2009 and slightly increased in 2010 resulting in penalization for producers.
-50%
-40%
-30%
-20%
-10%
0%
10%
20%
2005 2006 2007 2008 2009 2010
Observed nominal rate of protection at farm gate Adjusted nominal rate of protection at farm gate
30
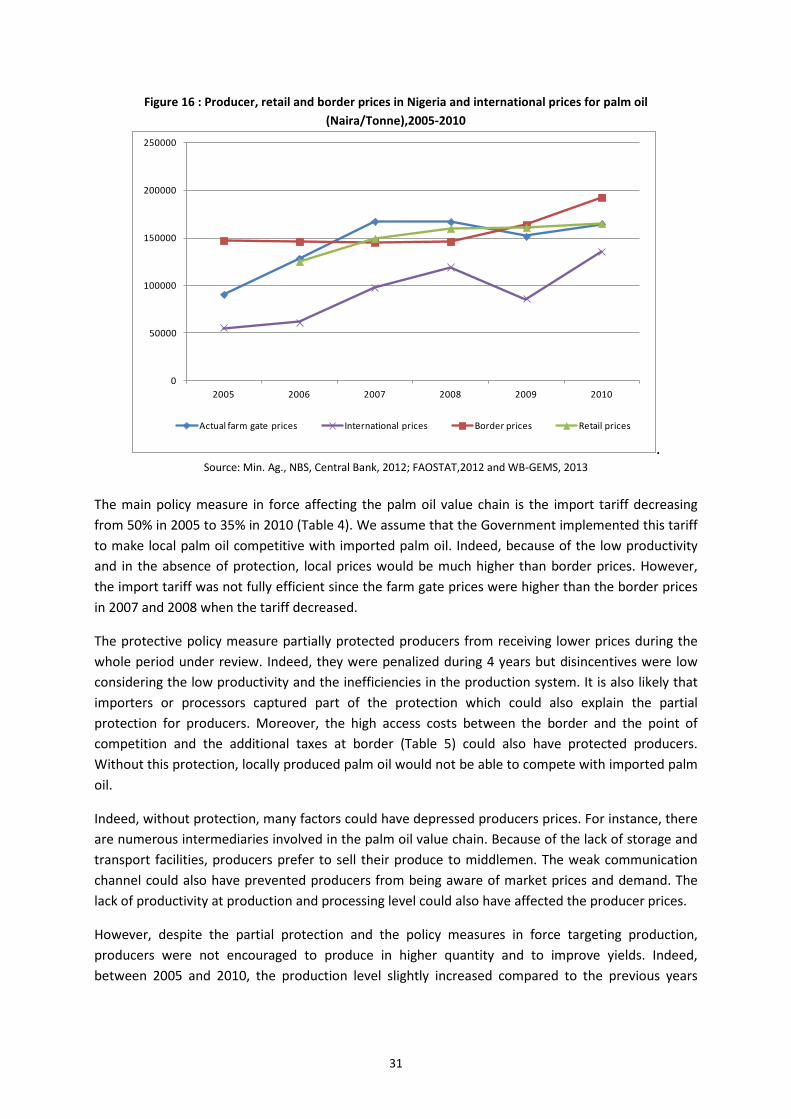
Figure 16 : Producer, retail and border prices in Nigeria and international prices for palm oil (Naira/Tonne),2005-2010
. Source: Min. Ag., NBS, Central Bank, 2012; FAOSTAT,2012 and WB-GEMS, 2013
The main policy measure in force affecting the palm oil value chain is the import tariff decreasing from 50% in 2005 to 35% in 2010 (Table 4). We assume that the Government implemented this tariff to make local palm oil competitive with imported palm oil. Indeed, because of the low productivity and in the absence of protection, local prices would be much higher than border prices. However, the import tariff was not fully efficient since the farm gate prices were higher than the border prices in 2007 and 2008 when the tariff decreased.
The protective policy measure partially protected producers from receiving lower prices during the whole period under review. Indeed, they were penalized during 4 years but disincentives were low considering the low productivity and the inefficiencies in the production system. It is also likely that importers or processors captured part of the protection which could also explain the partial protection for producers. Moreover, the high access costs between the border and the point of competition and the additional taxes at border (Table 5) could also have protected producers. Without this protection, locally produced palm oil would not be able to compete with imported palm oil.
Indeed, without protection, many factors could have depressed producers prices. For instance, there are numerous intermediaries involved in the palm oil value chain. Because of the lack of storage and transport facilities, producers prefer to sell their produce to middlemen. The weak communication channel could also have prevented producers from being aware of market prices and demand. The lack of productivity at production and processing level could also have affected the producer prices.
However, despite the partial protection and the policy measures in force targeting production, producers were not encouraged to produce in higher quantity and to improve yields. Indeed, between 2005 and 2010, the production level slightly increased compared to the previous years
0
50000
100000
150000
200000
250000
2005 2006 2007 2008 2009 2010
Actual farm gate prices International prices Border prices Retail prices
31
(Figure 2) and imports increased (Table 2). The inefficiencies (mentioned above) in the value chain and the partial protection could have prevented producers from investing in palm oil production.
32
5. PRELIMINARY CONCLUSIONS AND RECOMMENDATIONS
MAIN MESSAGE Palm oil producers in Nigeria received, on average, low disincentives between 2005-2010 and they even received incentives in 2007 and 2008. They were partially protected by the import tariff in force (from 50% in 2005 to 35% in 2010). Indeed, without this protective measure, producers would have been even more penalized owing to issues related to the market and production conditions.
Palm oil production is characterized by low productivity at production level (wild grove) and processor level (traditional processing). The lack of storage and marketing facilities and the numerous intermediaries involved in the value chain could have also strongly depressed producer prices.
The protective policy measures prevent producers from being strongly penalized. However, they were not encouraged to increase production in terms of quantity and quality and this despite the policy measures targeting production. The observed inefficiencies in the value chain could have prevented producers from investing in palm oil production.
PRELIMINARY RECOMMENDATIONS The protective policy measures in force resulted in limited penalization for palm oil producers in Nigeria despite the inefficiencies in the value chain. To ensure a sustainable development of the palm oil production and to render local production competitive, the MAFAP analysis suggests:
Continue with the policy efforts targeting productivity namely providing improved inputs and services;
Increase productivity at processor level by facilitating the use of modern equipment ;
Improve the transport and storage facilities to limit the number of intermediaries in the value chain.
LIMITATIONS Prices at point of competition need to be collected as well as more detailed access costs. The border prices need also to be further investigated.
Because of a lack of data, the adjusted domain were not properly analyzed.
The analysis does not take into account geographic and seasonal variation. As seen above, such variations are significant and might change the results. So far, we have selected a representative region of production and the average prices during the year.
Marketing pathways could be identified more precisely and the information on the import market are not sufficient.
Furthermore, we could not take into account the informal trade which seems to be significant and might have an impact on the price transmission.
33
FURTHER INVESTIGATION AND RESEARCH Additional research should be focused on prices at point of competition, border and farm gate level as well on access costs and especially on margins and unofficial costs.
Studies documenting production costs exist but there are few on commercialization and import market. More investigation should be conducted on this aspect.
34
BIBLIOGRAPHY
African Journal of Marketing Management Vol 3(10) Nwauwa Linus Onyeka Ezealaji (Oct 2011). Economics of palm oil storage and market in Imo State, Nigeria
Agro-science Vol.16 (2) (2007) Udensi, E.A and Iroegbu, F.C. Quality assessment of palm oil sold in major markets in Abia State, Nigeria
E.gen, Andrew Beveridge (2009), Abia State Palm oil Value Chain Development project
Foundation for partnership in the Niger Delta (PIND) (2011). Palm Oil Value Chain Analysis in the Niger Delta.
IFPRI (2010). A 2006 Social Accounting Matrix for Nigeria, Methodology and results IPPA, Initiative for Public Policy Analysis (2010). African Case Study: Palm oil and Economic development in Nigeria and Ghana; Recommandations for the World Bank’s 2010 Palm Oil Strategy International Journal of Agricultural Economics and Rural Development, Nigeria Olagunju, F (2008). Economics of Palm Oil processing in Southwestern Nigeria
International Monetary Fund, Data and statistics (2012). World Economic Outlook Databases http://www.imf.org/external/ns/cs.aspx?id=28
Journal of Agriculture and Development VOL2(1) (Jan 2012). Palm oil marketing and distribution pattern in Imo State, Nigeria: An application of linear programming model.
NIFOR, Nigerian Institute for oil research (2012), www.nifor.org
Pharmacopée et Médecine traditionnelle Africaines, 15: 11-17 (2008) Monde AA… . Teneur en acides gras et en antioxydants de l’huile de palme en Cote d’Ivoire.
Port Harcourt (2012). Economy, http://www.portharcourt.com/
Synposium Thematic Area (STA)- Dynamics of Innovation in Developing Countries: Innovation Outcomes, Boladale O. Abiola Adebowale. Innovation Policies Institutions and Performance: Why Malaysia overtook Nigeria in the Oil Palm Industry
UN. Food and Agriculture Organization (FAO) (2012). Trade data base, Production data base http://faostat.fao.org/
UN. Food and Agriculture Organization (FAO)(2012). Giews Food price Data and Analysis Tool http://www.fao.org/giews/pricetool/
UN. Commodity Trade Statistics (2012). Database http://comtrade.un.org/db/
UNIDO, Central Bank of Nigeria, Bank of Industry (September 2010). Unleashing Agricultural Development in Nigeria through Value Chain Financing
35
World bank, World Development Indicators and Global Development finance (2012) World Data Bank http://databank.worldbank.org/ddp/home.do?Step=1&id=4
36

ANNEX I: Methodology Used
A guide to the methodology used by MAFAP can be downloaded from the MAFAP website or by clicking here.
37
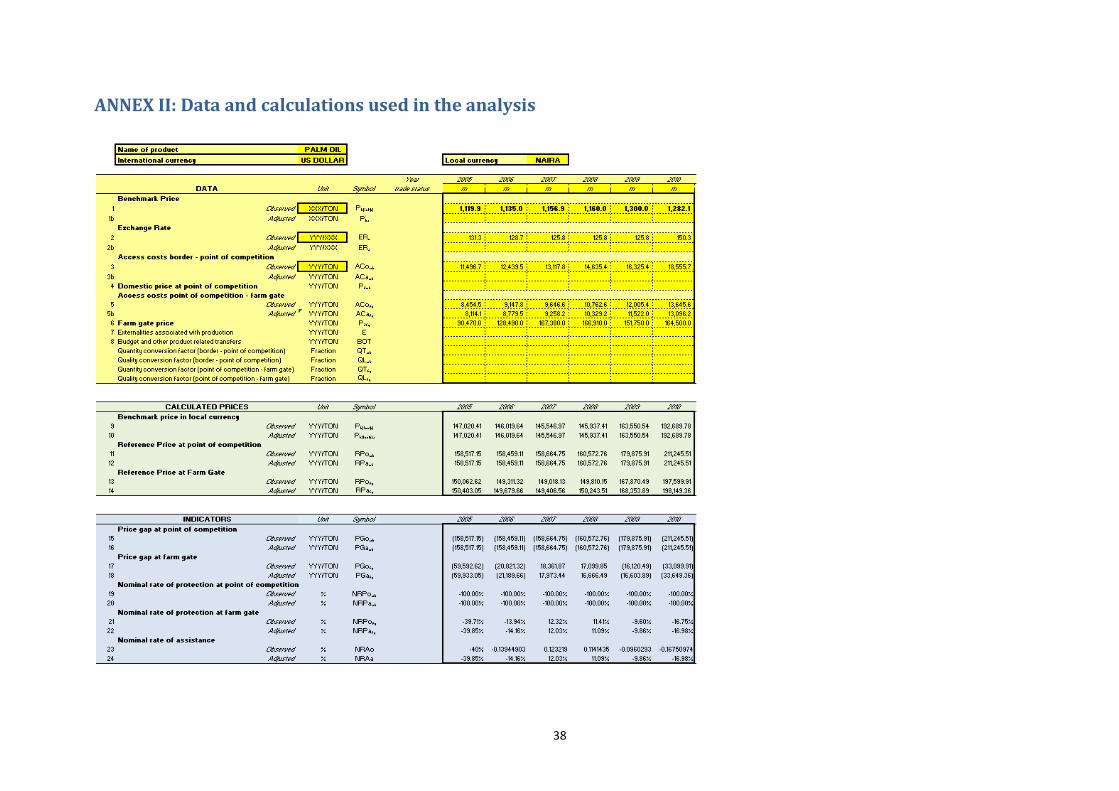
ANNEX II: Data and calculations used in the analysis
38