incentives and disincentives for … and disincentives for conserving renosterveld remnants and the...
TRANSCRIPT
INCENTIVES AND DISINCENTIVES FOR CONSERVING
RENOSTERVELD REMNANTS AND THE POTENTIAL IMPACTS OF PROPERTY RATE REBATES
SUSAN RUTH PARKER
PERCY FITZPATRICK INSTITUTE UNIVERSITY OF CAPE TOWN
February 2006
SUBMITTED IN FULFILMENT OF THE REQUIREMENTS FOR THE DEGREE OF
MASTER OF SCIENCE IN CONSERVATION BIOLOGY
SUPERVISORS : J K Turpie & M Botha
The copyright of this thesis rests with the University of Cape Town. No
quotation from it or information derived from it is to be published
without full acknowledgement of the source. The thesis is to be used
for private study or non-commercial research purposes only.
Univers
ity of
Cap
e Tow
n

i
ACKNOWLEDGEMENTS
As always there are too many people to thank.
Specific thanks must be given to my supervisors Jane Turpie and Mark Botha, whose
collective input has been invaluable. Thank you.
Thank you too to Sue Milton without whom this project would never have been started
and who organised the sponsorship of this research.
I am also grateful to the following people for their various valuable contributions: David
Retief, Ilse Eigelaar-Meets, Lorraine Gerrans, Andrew Balmford, Nick Lindenberg,
Morné du Plessis, Connie Krug, Sue Winter, Conrad Savy, Chris Tobler, Lionel
Mansfield, Jacques de Wet, Beatrice Conradie, Sandy Paterson, Sediqa Khatieb, Andrew
Taylor and all at the Fitz. Thank you too Margaret Sandwith, Anna Crowe and Hilary
Buchanan for all your help and support.
Special thanks to my cousins Louisa and Cathy and to all my friends who helped and
encouraged me, especially Pia, Sally, Ted, Charlie, Simon, Mo, Caro, Tobea and Patsy.
Last but not least my own family, Ollo, Andrew, Richard and Chris – you have been
marvellous.
This dissertation was supported by the National Research Foundation of
South Africa under Grant number 2053674.

ABSTRACT
Renosterveld is a critically threatened ecosystem. Eighty percent of the remaining
fragments are located, mainly on privately-owned farms, in Cape Floristic Region, South
Africa. Fifty-eight landowners were interviewed about their opinion towards incentives
for preserving the renosterveld on their farms, from which it was concluded that a suite of
conservation incentives are needed to conserve renosterveld, rather than a single
incentive or group of similar incentives. All landowners suggested that they were likely
to conserve the renosterveld on their farms. Although opportunity costs exist, both the
perceived opportunity cost of renosterveld and the current cost of conserving renosterveld
are low; renosterveld should therefore not be regarded as threatened. However, the
remaining renosterveld fragments remain at risk if land-use is changed and protective
legislation is not adhered to.
A property rate rebate as an incentive for the conservation of renosterveld would only
marginally be of financial benefit to landowners. It would be an important incentive in
the symbolic and psychological message it gives to landowners that the local government
is both appreciative of their conservation efforts and serious about conservation. The cost
to local municipalities of offering a property rebate is minimal, but the challenge is to
convince municipalities of the need to offer such a rebate in spite of the numerous urgent
social issues they face.
Motivational incentives such as support through the agricultural extension system, public
acknowledgement and education would be of benefit, but the farmer’s sense of heritage,
family and connection to the land as well as social approval, have potentially a large role
to play in motivating people actively to collaborate in the conservation of this indigenous
flora. The importance of these incentives in conserving renosterveld should not be
underestimated.
ii

CONTENTS ACKNOWLEDGEMENTS .......................................................................................................................... i ABSTRACT ii 1. CHAPTER 1: INTRODUCTION.................................................................................................... 1 2. CHAPTER 2: A REVIEW OF INCENTIVES AS A MECHANISM FOR ACHIEVING
CONSERVATION ON PRIVATE LANDS..................................................................................... 5 2.1 Introduction........................................................................................................................................ 5 2.2 Incentives in the global context......................................................................................................... 7 2.3 Incentives in the local context ......................................................................................................... 10 3. CHAPTER 3: A REVIEW OF CURRENT POLICIES AND LEGISLATION RELEVANT TO
THE CONSERVATION OF RENOSTERVELD ......................................................................... 12 3.1 Introduction...................................................................................................................................... 12 3.2 Land-use planning ........................................................................................................................... 13 3.3 Invasive aliens .................................................................................................................................. 16 3.4 Property rates................................................................................................................................... 16 4. CHAPTER 4: METHODS ............................................................................................................. 19 4.1 Study area......................................................................................................................................... 19 4.2 Identifying farms with renosterveld............................................................................................... 22 4.3 Sampling Strategy............................................................................................................................ 24 4.3.1 Sampling 24 4.3.2 Establishing contact details of private landowners....................................................................... 24 4.4 Survey Methods ............................................................................................................................... 25 4.4.1 Questionnaire survey ....................................................................................................................... 25 4.4.2 Questionnaire structure .................................................................................................................. 25 4.5 Analysis 27 4.5.1 Analysis of quantitative data: ......................................................................................................... 28 4.5.2 Analysis of qualitative data:............................................................................................................ 28 4.6 Limitations of the Study .................................................................................................................. 32 4.6.1 Sampling 32 4.6.2 Financial data................................................................................................................................... 33 4.6.3 Recording/Language........................................................................................................................ 33 4.6.4 Inter-disciplinary research.............................................................................................................. 33 5. CHAPTER 5 : RESULTS ............................................................................................................... 34 5.1 Opportunity costs of maintaining renosterveld............................................................................. 34 5.1.1 Characteristics of renosterveld farms ............................................................................................ 34 5.1.2 The direct costs of maintaining renosterveld................................................................................. 35 5.1.3 The economic potential of renosterveld fragments ....................................................................... 40 5.1.4 Landowner perceptions of potential income from renosterveld areas ........................................ 42 5.1.5 Estimated opportunity costs of maintaining renosterveld............................................................ 45 5.2 Private land conservation incentives .............................................................................................. 52 5.3 Implications of a property rate rebate for local government ....................................................... 61 5.3.1 Rates as revenue............................................................................................................................... 61 5.3.2 Property rates as an incentive for conservation ............................................................................ 64 5.4 What motivates private landowners to conserve........................................................................... 66 6. CHAPTER 6: DISCUSSION AND CONCLUSION.................................................................... 71 7. REFERENCES ................................................................................................................................ 87 8. APPENDIX..................................................................................................................................... 102 8.1 Abbreviations ................................................................................................................................. 102 8.2 Identified renosterveld sites .......................................................................................................... 103 8.3 Questionnaire survey ..................................................................................................................... 107 8.4 NVivo Categories............................................................................................................................ 110
iii

1
1. CHAPTER 1: INTRODUCTION
The Cape Floristic Region (CFR) is a biodiversity hotspot (Myers et al., 2000) and has a
serial World Heritage Site comprising of eight natural properties. The CFR has high
endemism and unexpectedly high species richness (Linder, 2003) and the importance of
its conservation and the strategies and action plans to do so are well documented
(Gelderblom et al., 2003; Cowling et al., 2003a; Pressey et al., 2003).
Cape Lowlands Renosterveld, a highly threatened ecosystem within the CFR, occurs in
the more fertile lowlands where the relatively more nutrient rich soils have for centuries
been ploughed for agriculture (Adamson, 1938). Generally economically productive areas
are less preserved (Pressey, 1994) and renosterveld has less than 4% remaining and less
than 2% protected (Rebelo, 1992a; Kemper et al., 2000; von Hase et al., 2003). The
subsidisation of cereals in the 1980s and the more recent expansion of the wine industry
has meant further loss of renosterveld (Fairbanks et al., 2004) which is now considered
‘100% irreplaceable’ and a high priority area for conservation (Pressey et al., 1993;
Cowling et al., 2003b; Rebelo, 1992a).
There is no common definition of renosterveld but it is best described as small leaved
shrublands dominated by Electropappus rhinocerotis (renosterbos) (Boucher, 1980) with
a prevalence of annuals and geophytes, but with lower endemism than the fynbos
shrublands of the CFR (Cowling & Holmes, 1992; Moll et al., 1984; Rebelo, 1992b).
Renosterveld has some local traditional plant use and it is believed there is potential
cosmetic and medicinal value, but its value lies mainly in biodiversity and existence
value.
Habitat loss through change in land use is one of the biggest threats to biodiversity loss
(Cowling et al., 2003c) and in the CFR, agriculture is by far the most significant agent of
habitat transformation (Latimer et al., 2004). Invasive alien vegetation is also a main
threat to biodiversity loss with dense stands of woody aliens having transformed 1.6% of
the CFR (Richardson et al., 2002). Apart from extensive transformation by agriculture

and alien vegetation infestation, renosterveld is also threatened by urbanisation and
population growth, unsustainable harvesting and inappropriate land-use planning
(Rebelo, 1992b; Rouget et al., 2003; Kemper et al., 1999; von Hase et al., 2003) and
potentially climate change (Bomhard et al., 2005).
There are approximately 53 533 hectares of Cape lowland renosterveld in the CFR and an
estimated total of 18 000 remnants with most of them smaller than a hectare (von Hase et
al., 2003). Irrespective of whether 2% (Low & Jones, 1994), 3% (McDowell, 1988) or
4% of the original area of renosterveld remains, it is critical to conserve all remnants of
renosterveld regardless of their size (Cowling et al., 2003c). Spontaneous regeneration on
old fields, after 35 years, indicated lower species richness and diversity than adjacent
intact habitat (Krug et al., 2004b).
More than 80% of these remaining renosterveld fragments are on private lands, mainly
belonging to farmers (McDowell, 1988; Wynberg, 2002). If we wish to keep what little
remains, incentives must be sought to encourage these private landowners to conserve it.
The need for conservation outside nature reserves on private lands is well recognised
(Hale & Lamb, 1997) but on private lands the challenge lies in accommodating both the
rights of landowners to be economically productive, while at the same time protecting
biodiversity (Norton, 2000). Conservation biologists need to play a critical role in private
land conservation (Knight, 1999) and while it is believed that an ethical appeal should be
made to private landowners to expand their duty of care as custodians of nature
(Heydenrych et al., 1995; Gelderblom et al., 2003), Australian farmers believe that they
have demonstrated a stewardship with the land for generations (National Farmers
Federation Australia (NFF), 2003). Private landowners feel that they should not be
expected to bear all the costs for what essentially is a benefit for public good and the
broader community (Doremus, 2003).
Conservation on private lands initially failed to meet all objectives because it did not
understand the views of private landowners nor appreciate the implications of regulating
their private land and limiting their opportunities (Brook et al., 2003; Tikka & Kauppi,
2

2003). More recently an attempt has been made to try and understand these views and to
ascertain what motivates private landowners to retain their natural lands. Private
landowners are motivated by intrinsic factors such as aesthetic appreciation, having an
attachment to their land and giving the impression their farm is well managed (Erickson
et al., 2002, Ryan et al., 2003). Farming is described as an emotional enterprise
‘governed by a complex set of values, experience and perceptions, including a strong
emotional component’ where farmers are connected to the sense of place, ‘passed on and
usually deepened from generation to generation’ (Koelle & Oettle, 2003).
In South Africa the advent of the new government saw the deregulation of control and the
virtual elimination of subsidies (Pence et al., 2003). Conservation in agriculture changed
from soil conservation to broader concepts of conservation supporting ecological farming
practises (Donaldson, 2002; Gelderblom et al., 2003). In addition to this, a contentious
issue facing private landowners is the Government Land Reform Programme. Land is an
issue in South Africa as land ownership favours a racial minority and land tenure issues
are not fully resolved (Wynberg, 2002; Milton et al., 2003). On private lands it is “not
ecological challenges which lie ahead but socio-political challenges which may be a
bigger hurdle to overcome” (MacDonald, 1994).
The necessity to conserve the renosterveld is well documented but is not evident to most
private landowners. Private landowners are not encouraged to leave their virgin land
unploughed nor to restore their lands (Milton et al., 2003). While several types of
incentives are possible to induce South African farmers to conserve renosterveld, one
possibility that has received much attention is that of using a property rate rebate (Botha,
2001). The Local Government Property Rates Act [No 6 of 2004] was introduced to
standardise the way properties are valued for rating purposes and to regulate the power of
a municipality to impose rates on property. This provides an opportunity for local
governments to exempt or rebate property taxes as an incentive for land set aside for
conservation. Any subsidies or tax exemptions to landowners for conservation would be
significant, as there are few, if any, economic incentives for private land conservation.
3

The aim of this study was to investigate the current financial and motivational incentives
and disincentives for conserving renosterveld on private farm lands. The following four
key questions were addressed:
1. What proportion of farmers with renosterveld fragments plan to keep or transform these fragments?
2. What are the direct and indirect opportunity costs of maintaining these fragments?
3. What incentives would motivate farmers to conserve fragments?
4. Are property rate rebates or exemptions a viable incentive tool for conservation from the perspective of both local government and the private landholder?
Chapter 2 reviews the viability and relevance of private land incentives, as well as
property tax as a viable conservation incentive (key questions 3 and 4). Chapter 3
provides the background to understanding the policies and legislation that protect
renosterveld and their relevance in answering the key questions. Chapter 4 describes the
methodology used. In Chapter 5 the results of the quantitative analysis are presented, with
each key question addressed sequentially. The findings of the qualitative analysis are
addressed within the broad context of private land owners, motivation and incentives.
Chapter 6 debates the incentives issue and draws final conclusions.
4

2. CHAPTER 2: A REVIEW OF INCENTIVES AS A MECHANISM FOR
ACHIEVING CONSERVATION ON PRIVATE LANDS
2.1 Introduction
While conservation has traditionally been approached through regulatory measures in the
past, there has been a recent shift in South African policy and regulation to adopt
incentive schemes to achieve conservation aims. This chapter addresses two of the key
questions. Firstly the definition and role of incentives in both the global and local context
are reviewed in addressing the key question: “what incentives would motivate or
influence a landowners’ decision to conserve?” Secondly tax and more specifically
property rate tax are reviewed in addressing the key question: “is a property rate rebate or
exemption a viable incentive measure for conservation?”
An incentive is something that arouses feeling, or incites to action (Shorter Oxford
English Dictionary) and conservation incentives are rewards which encourage actions
(Crosthwaite, 2000). A disincentive discourages good conservation behaviour, while a
perverse incentive encourages undesirable behaviour (McNeely, 1988).
Economic incentives were initially proposed because institutions, research and legislation
were failing to achieve conservation goals (McNeely, 1988). Economic incentives have
been widely researched and are one approach to conserving biodiversity on private lands
and have developed because they can achieve conservation actions on private land at a
lower cost to government than traditional regulatory approaches (McNeely, 1988;
Bateson, 2001; Langholz et al., 2000; Doremus, 2003). Incentives should be integrated
into a legislated and supportive institutional framework (Wells, 1998; OECD, 2004).
Economic disincentives such as polluter taxes discourage environmentally undesirable
behaviour (Anderson et al., 1977; Constanzo & Daly, 1992) although green taxes are
often fiscally biased and ‘too low compared to the externalities they should price’
(Anderson, 2003).
5
Conservation has usually not been achieved through heavy-handed legislation, which
often violates private property rights (Farrier, 1995; Wu & Babock, 1999; Michael,
2003). In some instances regulation has proved to be a disincentive for conservation
because regulations are often ineffective, unaffordable, frustrate and anger landholders
and result in less public good conservation (McDowell, 1988; Turpie et al., 2003a;
Doremus, 2003; Causley, 2001; Polasky & Doremus, 1998; Michael, 2003, Parkhurst et
al., 2002).
Incentives for agriculture such as encouraging land clearing in tropical forests are
perverse incentives for conservation. Many tax incentives have been perverse,
encouraging landholders to develop rather than to conserve indigenous vegetation
(Binning & Young, 2003; McDowell, 1988). Perverse incentives for conservation such as
taxing protected areas and forest clearing have, in recent years, in many cases been
removed.
Conservation incentives are well described and include; financial incentives (subsidies,
direct payments or tax relief), development incentives (tradable or transferable
development rights), property right mechanisms (easements and revolving funds),
motivational incentives (education, local awards, community recognition, technical
support, materials, juridical protection against land invasions), framework incentives
(institution building and stakeholder involvement) and a host of other supporting
mechanism such as water subsidies in arid environments (Botha 2001; Michael, 2003;
Shogren et al., 2003; Swift et al., 2003; Langholz 1999; Bateson, 2001; OECD, 2004) or
relaxation of other regulations for property owners who protect biodiversity (Doremus,
2003).
However although many different conservation incentives are proposed they could all be
described as either economic or motivational conservation incentives. Economic
incentives are any form of direct or indirect payment such as subsidies, tax relief, labour
costs or any mechanism which could be reduced to cost. Economic conservation
incentives are commonly financial mechanisms to encourage private landowners to enter
into property rights agreements that restrict the use of their land (easements).
6

Motivational conservation incentives are all non-financial measures that influence the
way that people think and act towards conservation, such as public recognition, juridical
protection, information, institution building or the prospect of belonging to a group or
scheme.
Incentive based conservation is under-utilised and inefficiency has resulted from
‘insufficient promotion and sporadic delivery of incentives by government’ (Langholz et
al., 2000). The literature describes numerous incentive projects and it would seem that
private land conservation is best achieved when a mix of incentives (Bateson, 2001) or
set of mechanisms in combination with other conservation measures are used
(Crosthwaite, 2000). Few discuss which incentives are most effective (Michael, 2003) or
what mix of incentives are best delivered (McKee et al., 2005).
2.2 Incentives in the global context
Farming in the European Union (EU) is subsidized by farm price support and
compensation schemes with a well established Agri-Environmental Policy (AEP)
bringing acres of land under conservation (Morris & Potter, 1995). The common
agricultural policy (CAP) accounts for about 50% of the total EU budget (around EUR 40
billion), and although the EU receives a small and declining contribution to GDP from
farming (European Environmental Agency, 2002), the EU contributes over $2.7 billion to
European farmers (Green et al., 2005).
In the United States of America over sixty percent of land is privately owned.
Conservation easements, now offered in fifty states, have been adopted as the basic legal
land conservation tool (Swift et al., 2003; Shogren et al., 2003). Voluntary conservation
agreements have doubled in the past decade (Shogren et al., 2003) and are becoming
increasingly important in implementing the contentious Endangered Species Act, which
initially failed to protect endangered species (Brook et al., 2003; Langpap & Wu, 2004).
These voluntary policies ‘make it difficult for policymakers to target the properties with
7
the highest conservation value’ and an attempt needs to be made to ensure ‘that
landowners with the lowest opportunity costs own the most ecologically valuable
property’ (Michael, 2003). Conservation incentives are usually in the form of some type
of direct payment or tax relief, but include education and technical support (Shogren et
al., 2003). An extra bonus, an agglomeration bonus (Parkhurst et al., 2002) has been
proposed for land retired adjacent to any other retired land to encourage one ‘contiguous
area’ (Shogren et al., 2003). The Farm Security and Rural Investment Act of 2002 and
the newly created Conservation Security Program (CSP) has changed US environmental
policy from providing incentives to retire agricultural land, to paying producers to adopt
and maintain good conservation practice. US$ 17 billion has been budgeted for incentives
for conservation on agricultural lands over five years (Parkhurst et al., 2002; Shogren et
al., 2003; USDA, 2003; Kurkalova et al., 2003). In both America and Europe much of
conservation appears to be a question of financial compensation and considering the huge
subsidies given for agriculture, it is in some respects probably cheaper to compensate
conservation than to subsidise agriculture.
Australia recognised the importance of private land conservation (Hale and Lamb, 1997)
and has been instrumental in developing incentives for private land conservation such as
the tax incentive (Binning & Young, 2003). The role that local governments can play in
facilitating community involvement in conservation has been well recognised and
municipalities have introduced incentive schemes providing both financial and non
financial incentives (Bateson, 2001; Binning &Young, 1999). Australia has a huge body
of farmers who have expressed dissatisfaction that ‘farmers should be compensated if
their ability to farm is compromised with legislation in the public interest’ (NFF
Australia, 2005). Private landholders have reservations about conservation easements
(Kabii, 2003) and this contributed to initial poor participation in conservation schemes
(James, 2002). Conservation schemes have become increasingly popular with landholders
who enter into voluntary conservation agreements since tax incentives are in existence
(Kemp, 2003). The Environment Protection and Biodiversity Conservation Act (1999)
relies on self-regulation with heavy penalties for actions that significantly negatively
impact the environment and this is meeting with success (B Talbot, pers. comm.).
8

Most countries in Latin America have more than 80% of their land in private ownership
but this conservation is hampered by lack of institutional capacity and adequate legal
tools (Swift et al., 2003). No Latin American countries have a national law authorizing
conservation easements (Swift et al., 2003). A perverse conservation incentive has been
that tenancy laws have required landowners to make adequate socio-economic use of
their land or to face expropriation or invasion and although these laws have been
repealed, perceptions about land use are tainted (Swift et al., 2003). Increasing the
juridical security of land to protect private owners from having their land taken has been
limited to Costa Rica, but this could potentially be a major incentive offered by
governments (Swift et al., 2003) and particularly in countries where land invasions are
prevalent. Costa Rica has promoted the best system of incentives for private land
conservation offering significant economic incentives through property tax exemptions
and a successful financial incentives program with payments for environmental services
of approximately $50 per hectare per year (Langholz, 1999; Swift et al., 2003). The only
other country to offer economic incentives for private landowners is Brazil which has
strong laws for private ownership but these are rarely enforced (Swift et al., 2003).
Property tax exemptions have been withdrawn from Ecuador, Guatemala, and Bolivia,
due to the current financial crisis and given the limited budgets of most Latin American
countries, ‘the future of economic and tax incentives to promote private land conservation
is not promising.’ (Swift et al., 2003). Property tax exemptions on official, conserved
private land may be offered but ‘rural property taxes are traditionally very low and the tax
collection systems are weak, this form of incentive has not been highly attractive to
private landowners.’ (Swift et al., 2003).
Eco-labelling is an international conservation initiative and is a voluntary method of
environmental performance certification. Eco-labelling creates a market-driven approach
to achieve environmental goals by providing environmental information and enabling
consumers to choose those products that have less impact on the environment (Clark &
Downes, 1995; Grote, 2002). In South Africa certain eco-labelling has been successful
such as badger-friendly honey. There is an increased effort to use eco-labelling both
locally and internationally such as the Integrated Production of Wine Conformance
Certification for the marketing of wines. Consumers in the developed world are
9
increasingly willing to pay a premium on produce produced by environmentally sensitive
initiatives (Donald, 2004) but support for such products is more difficult to initiate in
developing countries where most consumers are less affluent.
2.3 Incentives in the local context
Part of this study was formulated around the need to understand the extent to which
incentives, and particularly a property rate rebate, could influence private landowners to
conserve the renosterveld on their farms. Although incentive policies for conservation on
private land are probably the most cost-effective approach to achieve the CFR
conservation targets (Gelderblom et al., 2003; Pence et al., 2003; Frazee et al., 2003),
incentives are limited and few exist. A Stewardship Program was developed by Cape
Nature Conservation and the Botanical Society of South Africa to promote private sector
involvement in biodiversity conservation, whereby land of conservation value is
committed into one of three contract options offering differing levels of assistance and
incentives. The contracts distinguish between; a conservation area such as a conservancy;
a negotiated legal co-operation agreement (easement or covenant); and a contract nature
reserve, which binds the land in perpetuity, but allows the owner to retain the title of the
land. Contracts can offer some incentives such as limited alien clearing subsidies
(Heydenrych et al., 1999; Botha, 2001; Pence et al., 2003) but as yet farmers making a
conservation effort are not offered tax concessions, fuel rebates or other benefits (Milton
et al., 2003).
Delivering public policy via tax measures is complex (Chudleigh & Simpson, 2000) but
the strength of a tax program is it’s ‘accessibility and capacity to reinforce the
motivations of landholders to privately invest in public goods’ (Binning & Young, 2003).
Tax incentives are easier to administer and at an effectively smaller cost to government
when compared to other conservation incentives (Pence et al., 2003; Binning, 2000;
Chudleigh & Simpson, 2000). The tax system in South Africa is under utilised as such a
mechanism (Botha, 2002) but tax exemptions for donations to conservation are being
considered (Manuel, 2005).
10

In investigating property tax as a conservation incentive in South Africa one needs to
understand The Property Rates Act which provides the legal capacity for local
governments to reduce or abolish property taxes on lands that have complied with certain
regulations or been secured in perpetuity for conservation. Each municipality can
stipulate their own rates policy with differential rate levies, but the legislation leaves this
detail to the municipality because situations vary in different parts of the country (P van
Ryneveld, rates consultant, pers. comm.). This potentially enables rebates or exemptions
for preservation of renosterveld.
The City of Cape Town (CCT) adopted an 80% rates exemption for all agricultural
properties in rural areas (CCT Draft Rates Rebate Scheme, 2002). Bitou Municipality, by
way of example, offers, on written application, a 90% rebate on assessment rates to
agricultural zoned land if they have complied with National Veld and Forest Fire
Act,1993 and the Conservation of Agricultural Resources Act, Act 43 of 1983 (CARA) (M
Botha, pers. comm.). This provides an incentive for Bitou private landowners to control
invasive aliens and prepare fire breaks and this creative rates policy differs from that in
the CCT where conservation land with unrestricted land use is not yet considered for rate
rebates. The CCT as yet does not give rate rebates for conservation even if the land is
secured in perpetuity and virgin land that is not zoned for agriculture is subject to full
property rates taxation. This is a perverse conservation incentive as it discourages
conservation by exempting agricultural land that has been developed while taxing pristine
conserved land that is undeveloped.
‘Conservation oriented landowners are the greatest asset to protecting nature on private
lands, and effective policy needs to maximize the value of this scarce resource’ (Michael
2003). Internationally motivational and economic incentives are on offer for private land
conservation, with an increasing number of voluntary easements. In South Africa,
property tax is a viable conservation incentive and should be developed together with
other conservation incentives.
11

3. CHAPTER 3: A REVIEW OF CURRENT POLICIES AND LEGISLATION
RELEVANT TO THE CONSERVATION OF RENOSTERVELD
3.1 Introduction
Land conservation is ultimately influenced by financial and politically based decisions
(Newburn et al., 2005). This chapter aims to address the key questions, specifically
“whether a property rate is a viable conservation incentive?” In order to determine
whether current legislation could influence renosterveld conservation, the possibilities of
a rate rebate as a conservation incentive are explored. Policies relating to land use
planning, invasive aliens and the Local Government Property Rates Act [No 6 of 2004]
are discussed but with a focus on the Western Cape and more specifically the Cape
Metropolitan Area (CMA).
South Africa is a signatory to a number of international agreements and conventions
promoting sustainable resource use and management. The 1992 UN Conference on
Environment and Development (UNCED) in Rio de Janeiro, brought environmental
issues into focus with adoption of Agenda 21 promoting sustainable development.
The White Paper of the Conservation and Sustainable Use of South Africa’s Biological
Diversity (1997) supported the introduction of conditions and incentives (e.g. tax relief)
to strengthen the involvement of the private sector in the conservation and sustainable use
of biodiversity. The recommendations of the White Paper culminated in National
Environmental Management Act (NEMA), [Act 107 of 1998], which focuses on
environmental management and promotes a national environmental interest “by laying
down the institutional structures and legal mechanisms to champion the environmental
cause” (Glazewski, 2005). NEMA (Chapter 6) stipulates South Africa’s environmental
obligations in the broader international context (Glazewski, 2005). The National
Environmental Management Biodiversity Act (2003) within the framework of NEMA, has
established a South African National Biodiversity Institute, which is responsible for the
12

promotion of the sustainable use, conservation and appreciation relating to the rich
biodiversity of South Africa for the benefit of all people.
In South Africa, the more than 200 environmental laws and regulations enforced by
numerous different government agencies, mainly at provincial level, have meant a
plethora of fragmented legislation (Barnard, 2002). Difficulties with complying with
Section 24 of the Constitution promoting conservation has resulted (Gelderblom et al.,
2003) and environmental issues have persisted due to lack of implementation of
environmental laws and regulations (Glazewski, 2005). It is essential that biodiversity
conservation is part of state planning policy and that ‘implementing organisations and
other inheritor stakeholders’ must be effectively considered during planning process if
effective conservation goals are to be achieved (Pierce et al., 2005).
3.2 Land-use planning
As one of the major causes of biodiversity loss is habitat degradation, sound land-use
planning is of vital importance as many environmental concerns arise from decisions
around land use. Paterson (2005) describes land-use planning legislation being bound by
three mechanisms; national and provincial laws prescribing land-use planning, laws for
the establishment of protected areas and laws to ensure environmental impact assessment
before development. There is legislation in place that should restrain further development
of renosterveld namely; The Environment Conservation Act 73 of 1989 (ECA) which
controls environmentally unsound land-use change and CARA which provides legislation
for the protection of natural vegetation; the cultivation of virgin land being subject to
prior approval. Although NEMA promotes a national biodiversity interest, the National
Department of Agriculture had never turned downed an application to cultivate virgin soil
in the Western Cape Province, over-ruling the Provincial agricultural decisions by
provincial-level agricultural authorities (CAPE conference participant, 2004) and many
lands have been ploughed without permits. In reality legislation was rarely enforced due
to lack of capacity in local government and the involvement of all spheres of government
in local affairs (Rural Management Framework, 2002; Cowling et al., 2003c).
13

Many cities in South Africa have developed their own strategies for conservation. The
CMA includes areas of renosterveld which are therefore influenced by policies relating to
the City of Cape Town. The proposed Rural Management Framework for the City of
Cape Town, (2002), recognised the threat of rapid urbanisation and loss of indigenous
vegetation and regarded the facilitation of conservation practices by private landowners
as a key environmental management issue. Land use planning ensures that land is put to
optimal use, taking into account the different effects that land-uses can have in relation to
social, political, economic and environmental concerns (Wise Land Use, 2001). The
definition of a strong urban edge, defining the outer limit to urban development in the
CMA is needed, and although the City of Cape Town Urban Edge Structure Plan was
approved as policy in 2001, it has not to date been adopted by the CCT (S. Nicks, CNdV
Africa, pers. comm.).
Local zoning plans are a critical tool for private land conservation (Newburn et al., 2005)
and the use of land is controlled by a Zoning scheme. Every property is assigned a Use
Zone in accordance with the Land Use Ordinance, No 15 of 1985. The Constitution and
Municipal Structures Act, (No. 117 of 1998), make plan-making and land use applications
the responsibility of the local municipality (Wise Land Use, 2001). Legislation around
land development has changed because it used to require permission from different
authorities which in some instances led to ‘costly duplication, institutional conflict and a
confused public’ (Wise Land Use, 2001). In the CCT land use permission is now required
from one single municipal structure and an Integrated Zoning Scheme is currently being
compiled (S. Nicks, pers. comm.).
In South Africa land-use planning policy is determined by the Provincial Spatial
Development Framework (PSDF) which essentially demonstrates how that province
should develop. The Western Cape Department of Environmental Affairs, Economic
Development and Development Planning is in the final stage of adopting the PSDF which
has the protection of biodiversity and agricultural resources as one of the nine principles.
Legislation now requires each municipality to adopt an Integrated Development Plan
(IDP) to provide the strategies, projects and budgets for the municipality for that year
(Local Government: Municipal Systems Act, 2000) and spatial development is defined by
14

the local government Spatial Development Framework (SDF). One of the aims of the
PSDF is to provide the guidelines to inform and direct land use management and this
occurs through the zoning schemes for which the local municipality is responsible, in
both rural and urban areas (Western Cape Draft PSDF, July 2005). Provincial Spatial
Development Frameworks should be aligned with the IDPs and budgets.
The implications for conservation are that municipalities, guided by the PSDFs and IDPs
will ultimately have the legislative1 ability to place biodiversity conservation strongly on
their agenda with sound zonation schemes which veto development of farm land on urban
fringes and other environmentally insensitive developments.
The implementation of the PSDF and the IDP budgets require a strong political support
but a real potential exists for local governments to be assisted in the IDP process and
thereby encouraged to incorporate good conservation planning into their IDPs. This
process has been initiated in the Subtropical Thicket Biome, whereby local governments
are given maps and guidelines to assist them in environmentally sustainable decisions
(Pierce et al., 2005).
Farms with good agricultural potential have theoretically been placed in green belt areas
to ensure that they are only sold as viable agricultural units but nevertheless have a huge
potential for commercial development. Evidence of corrupt interference in land-use
decisions in the past, by provincial or national departments, has led some farmers on the
urban fringes to believe that their agricultural land could potentially sell for commercial
use, in spite of legislated agricultural zoning schemes. These factors influence the way in
which private landowners around the urban fringe perceive the potential commercial land
value of their renosterveld fragments. Irregularities (such as ploughing of renosterveld
without permission) exist to avoid legislative complications in the process of land
rezoning and although it is illegal to plough or develop virgin land, legislation has not yet
proved a deterrent.
1 PSDF legislative ability is currently under debate (S. Nicks, pers comm.)
15

3.3 Invasive aliens
CARA (amended, 2001) provides a statutory obligation for landowners to keep their land
free of invasive alien plants, while NEMA aims to prevent, manage, control and eradicate
alien and invasive species. Landowners are bound by the National Veld and Forest Fire
Act 1998, Act 101 and have a duty to prepare and maintain fire breaks, to provide
equipment and have available personnel to fight fires.
The economic consequences of alien vegetation infestation are vast (Van Wilgen et al.,
2002) and many private landowners have little or no incentives to clear their alien
vegetation. Regulatory mechanisms could bankrupt landowners who are simply unable to
afford the costs of alien clearing (Pence et al., 2003) and this could act as a perverse
incentive to farmers to plough alien-invaded land (Turpie & Heydenrych 2000).
3.4 Property rates
The Constitution of the Republic of South Africa,1996 (s229) guarantees ‘rates on
property’ as a source of revenue for local government. The Katz Commission of Inquiry
recommended that a national land tax should not be implemented but rather a rural land
tax ‘in the local sphere’ that finances local government (Katz, 1998). Government policy
and legislation have defined municipalities as the primary point of delivery.
The CCT has 422 registered farms with a total land value of R804,355,280 and property
rates levied on these farm properties are R11,367,149 (CCT Draft Rates Rebate Scheme,
2002). Property rates contributed to about 23.82% of the income of the CCT 2003/2004
operating budget but 17.2% of the 2004/2005 budget (City of Cape Town Annual Report,
2003/2004).
The Property Rates Act [No 6 of 2004] states that the amount due for rates is determined
by the improved value of the property and the local government rates policy. No
municipality may grant relief in respect of payment of a rate other than by way of an
exemption, a rebate (a discount on the amount of rate payable) or a reduction (the
16

lowering of the amount for which the property was valued). The rates of farm properties
used for ‘agricultural purpose’ may be rebated, reduced or exempt but this excludes the
use of property for eco-tourism, game-trading and game-hunting. This delinking of
ecotourism and agriculture could be problematic (R. Franzsen, in litt.) because
renosterveld on farms that use their renosterveld for eco-tourism purposes could
potentially be excluded from potential conservation incentives offered to farmers.
Private land contractually bound into a national or provincial protected area, in
contradiction of the NEMA, initially received no exemption from municipal property rate
taxes, but this has now been amended. The Property Rates Act (2004) 17(1) now states
under other impermissible rates that a municipality may not levy a rate on e) those parts
of a special nature reserve, national park or nature reserve within the meaning of
Protected Areas Act, or of a national botanical garden within the meaning of the
National Environmental Management: Biodiversity Act, 2004, which are not developed
or used for commercial, business, agricultural or residential purpose’. Land placed into
protected areas may not be levied and provides the opportunity for private land owners
who choose to cede their conservation worthy land into protected areas, to be exempt
from those rates. However, the special nature reserve status may be withdrawn if the
private landowners decides to withdraw or the state decides to withdraw because of a
breach of agreement by the private landowner and the owner is then liable for rates in
arrears (Property Rates Act, 2004).
There is provision for the Minister of Finance to set a maximum rate for agriculture in
relation to residential property (P van Ryneveld, pers. comm.) and cognizance needs to be
taken of the fact that over-taxing agricultural land may disturb the viability balance of
farms (I Palmer, Palmer Development, pers. comm.). However there is provision for this
in the act which states that ‘(4) When considering the criteria to be applied in respect of
any exemptions, rebates and reductions on properties used for agricultural purposes, a
municipality must take into account- … (b) the contribution of agriculture to the local
economy;(c) the extent to which agriculture assists in meeting the service delivery and (d)
the contribution of agriculture to the social and economic welfare of farms’. Most
municipalities have considerably reduced the property rates on agricultural land which
17

reduces the threat of crippling property taxes, but also reduces the potential financial
reward for conservation incentives. A rate rebate would be a small price to pay for
conservation, but local authorities may not be able to bear the costs given other social
needs which have a greater priority (Milton et al., 2003; Frazee et al., 2003).
In conclusion this chapter has established that current policies and legislation could
influence the sound protection of renosterveld and that a property rate is a viable
conservation incentive. Although an opportunity exists for local government to provide
incentives to private land-owners for conservation, compliance from both legislators and
private landowners is not guaranteed.
18

4. CHAPTER 4: METHODS
In answering the key questions, fifty eight private landowners were interviewed, the
results of which provided both qualitative and quantitative data. In order to select a
sample of appropriate private landowners, a study area was established, farms with
renosterveld were identified and appropriate private landowners approached.
4.1 Study area
This study focuses on renosterveld on private farmlands within the Cape Metropolitan
Area (CMA) and three conservancies (countryside set aside in a negotiated legal co-
operation agreement between private land owners) outside the CMA. There are 6433
hectares of renosterveld in the CMA and the rationale for selecting this area is because
renosterveld is highly threatened due to agricultural expansion and rapidly expanding
urban development.
The restructuring of the CMA meant that the (City of Cape Town) CCT was expanded to
incorporate six previous municipalities but the exact boundary of the CMA was unclear.
The CCT urban edge is now defined but has not yet been adopted by the City (Urban
Edge Report, 2004). Three conservancies included in the study were the Bottelary Hills,
the Renosterveld and Agtergroenberg Conservancies. Bottelary Hills Conservancy was
initially part of the CCT but is now excluded. This exclusion meant that there were no
conservancies within the boundaries of the CMA. It was felt thought that the views of
landowners in existing conservancies are important and for this reason landowners from
conservancies outside the CMA were included in the study area.
19

a)
b)
Figure 1: Maps of South Africa showing a) the original extent of renosterveld and b) the present total remaining area (Krug, 2004a). The dark green represents Cape Lowland Renosterveld.
20

Figure 2: Map showing the existing renosterveld in the Cape Metropolitan Area and the three other municipalities included in this study namely: Stellenbosch, Drakenstein and Swartland.
21

4.2 Identifying farms with renosterveld
In order to ascertain which landholders to interview, properties on which renosterveld
fragments occur needed to be identified, as well as the landowners and their contact
details.
In order to establish which private landowners have renosterveld on their farms a
complex file of registered farms as per the Land Surveyors report was obtained from the
CCT. The Land Surveyors farm number (the cadastral number) and sometimes the farm
name were determined from these records. The Deeds Office data base (National Register
of Property Transactions in Cape Town) was accessed in the hope of obtaining the
current farm name and current landowner, using the cadastral number from the Land
Surveyors report. However the Deeds Office data base has no link to the cadastral
number except through a 21 digit code that was not readily available. The implications
were that as the cadastral number was the source of reference to farms (Land Surveyors
report), the current landowners’ name and current farm name were not accessible from
the Deeds Office data and this data source was therefore not utilised.
Farms with renosterveld were then identified with the aid of Geographic Information
System (GIS) data which provided the spatial data on the renosterveld. The following
GIS data were used.
1. GIS biodiversity remnant data, where the shape file for ‘CAPE remnants’ was
identified as renosterveld, supplied by the CCT, Dept. of Environment.
2. GIS cadastral numbers used to identify farms, supplied by the Land Surveyors
General Office but obtained from the CCT, Dept. of Environment.
3. GIS 1:50 000 map of the Western Cape, compiled by The Chief Directorate:
Surveys and Mapping, obtained from University of Cape Town Geomatics Dept.
22

4. GIS lowlands renosterveld data which provided renosterveld GIS for areas outside
the CMA where ‘CAPE remnants’ and some ‘natural vegetation’ shape files were
considered renosterveld, supplied by the Conservation Planning Unit, Botanical
Society of South Africa.
GIS renosterveld and cadastral data were transposed onto the GIS 1:50 000 Western Cape
map. GIS renosterveld data for areas outside the CMA were then added. All GIS
renosterveld data within the known cadastral numbers (farm number from the Land
Surveyor General) was used to compile a complete list of renosterveld sites (Appendix
8.2). This was then compared to the established list of registered farms.
An initial attempt was made to use landowners to accurately ground-truth the
renosterveld data on their farms. This was not pursued because landowners found the GIS
map difficult to understand. Two GIS areas were inaccurate as the data omitted the
renosterveld remnant on the Durbanville Race Course but depicted a large (899.3 ha)
renosterveld remnant (labelled Radio 918) which is fragmented around the expanded
town of Klipheuwel. However, as neither of these remnants were on farms and therefore
did not influence the selected study site, it is assumed that the GIS data used for this
study were valid. This assumption is further supported by the fact that landowners’ were
able to accurately estimate the hectares of natural vegetation remaining on their farms and
that these remnants were visible or shown to the researcher.
The average fragment size in this study area is 134 ha, but excluding a large game farm
of 3000 ha, the average size is reduced to 82 ha with 57% of these fragments < 50 ha.
23
4.3 Sampling Strategy
4.3.1 Sampling
All farms with renosterveld in the CMA were targeted. However, interviews ultimately
depended on the ability to determine the renosterveld site and the contactability and
availability of farmers. The study was then expanded to include a sample of land owners
from three conservancies outside the CMA and more rural farmers.
4.3.2 Establishing contact details of private landowners
Farm owners and their contact details were established by contacting farmer associations
and conservancy participants but chiefly by asking other farmers in the area. The criterion
for identifying private landowners to interview was that landowners must have at least
one fragment of renosterveld on their land.
In the CMA, of the eighty seven renosterveld sites identified, ten sites are municipal and
nine sites are either unidentified or the owner is unknown. Of these remaining sixty eight
sites, some private landowners have more than one farm and some farms have more than
one remnant of renosterveld, so only fifty four private landowners with renosterveld on
their farms were ultimately identified.
As there were potentially only fifty four landowners in the CMA, three conservancy areas
outside the CMA were included; Agtergroenberg Conservancy, Bottelary Hills
Conservancy and the Klapmuts Renosterveld Conservancy. The survey later included
farmers from Malmesbury and Heidelberg in order to include some farmers perceived to
be from more rural areas outside the CMA.
24

4.4 Survey Methods
4.4.1 Questionnaire survey
Data were collected through a structured interview. The interview was guided by a
questionnaire which was developed to record both qualitative and quantitative data.
A questionnaire was developed and a pilot study initiated which involved interviewing
five private land owners. The questionnaire was then redesigned and resulted in the final
questionnaire (Appendix 8.3) which was then translated into Afrikaans. Interviews in the
form of this questionnaire were conducted at a pre-arranged time by the primary
researcher, in the language preference and home/office of the informant. The interview
was recorded manually, word for word where possible and in the language of the
respondent. No recording equipment was used as it was thought to be intrusive.
A total of eighty private landowners were contacted in the CMA, conservancies and more
rural areas. Only fifty eight interviews were used in the final analysis, although sixty two
private landowners were interviewed. Interviews with four farmers were not used; three
interviews were discarded because virgin renosterveld no longer existed on those farms
and one farmer interviewed became too paranoid to answer the questions. Four farmers
refused interviews and sixteen private landowners were contacted or attempted to be
contacted but not interviewed due to their being not available.
Ultimately of the fifty eight interviews used, forty five farmers interviewed were from the
CMA and the remaining thirteen were from rural areas and conservancies outside the
CMA.
4.4.2 Questionnaire structure
The revised questionnaire consisted of four sections outlined below.
25
1. Section A: Biographic data and nature of farming.
i) Biographic data: farmer and farm details
ii) Nature of farming: Q1 relates to the type of farming and Q2 asks how long
the farm has been in the business or family. Although conservation
practices have been known to correlate with various factors such as level
of education, affluence, and language (McDowell, 1988; Winter, 2003),
the researcher was not interested in exploring whether level of education,
affluence or language could explain attitudes or behaviour as these factors
were deemed inappropriate in an incentives program.
2. Section B: Retaining natural vegetation.
Closed questions were used to elicit a single answer.
i) Q3 – 6 was set to investigate the area and nature of virgin land
ii) Q7 – 8 explored the management of alien vegetation
iii) Q9 – 15 requested the cost involved in conserving natural vegetation
3. Section C: Incentives for saving indigenous vegetation.
i) Q16 was structured using a five point Likert scale and assessed the
farmers perceptions regarding incentive measures and conservation
ii) Q17 asked farmers to rank fifteen potential incentives using a ranking
scale (one to ten) with a score of ten being a good incentive
SPSS statistics is a software package used to gain greater insight into the actions,
attributes, and attitudes of people. In order to measure the farmer’ attitudes to
municipal rebates, the questionnaire was originally designed using a five point
26

Likert Scale for SPSS software analysis. However an SPSS analysis was not used
because the researcher felt that when the questions were grouped together they did
not accurately portray the farmers’ perceptions. The data were therefore analysed
by grouping the Likert scores into ‘agreed’ or ‘disagreed’ or ‘did not know’ and
calculated as percentages.
4. Section D: Motivation to conserve renosterveld.
Seven questions were designed using Appreciative Inquiry questions and analysed
using Grounded Theory (Glaser & Strauss, 1967). This analysis was first
conducted on the qualitative data transcribed from the interviews of nineteen
farmers and was subsequently repeated and improved using the transcribed
qualitative data from the fifty eight land owners.
The interview questions (Appendix 8.3) were based on The Appreciative Inquiry
Method (Cooperrider & Srivastva, 1987) which does not focus or inquire about
problems but focuses on what is appreciated. Appreciative Inquiry searches for
and accentuates the positive. This method was chosen as in the absence of any
current incentives, it must be positive factors that motivate farmers to conserve.
These appreciative inquiry questions were designed to elicit and explore stories
because it is ultimately stories that are able to inspire and from which constructive
action can be taken (Liz Mellish, Liz Mellish & Associates, pers. comm.).
Although this method was chosen to elicit positive responses the questions were
sufficiently open ended to enable farmers to be critical and express dissatisfaction
where appropriate.
4.5 Analysis
This study used both quantitative and qualitative techniques.
27

4.5.1 Analysis of quantitative data:
The quantitative data items from the questionnaire were collated and analysed. EXCEL
produced charts that compared the contribution of each value to the total or to the values
across categories. EXCEL was used to determine the Net Present Values (NPV) and
Internal Rates of Return (IRR). STATISTICA 7 used the Kruskal-Wallis ANOVA to
determine the significant differences between incentives.
All property valuations used were determined by using experienced property valuers as
they provide sound estimates (Van Zyl, 2005).
4.5.2 Analysis of qualitative data:
The analysis of this research proved to be difficult, as a qualitative approach tends to be
more subjective and is contrary to the more empirical approach of quantitative methods
(Gibbs, 2002). The data were analysed using the Computer Assisted Qualitative Data
Analysis software program QSR NVivo Version1.2 142. The merits of computer assisted
qualitative data analysis have been debated (McLard et al., 2003; Lee & Fielding, 1996)
but can be effective if the analytic procedures are transparent (de Wet & Erasmus, 2005).
In qualitative analysis the data exists in expressions which need to be understood in
context and ‘seeks to take account of the views of those involved and the subjective and
social constructs of their world’ (Flick et al., 2004). The concern is that renosterveld is a
threatened eco-system which needs protection, but what would motivate private
landowners to conserve it needs to be fully understood. Renosterveld grows on more
fertile soils generally suitable for agriculture and although some farmers are not fully
aware of its value or of the threats, renosterveld continues to decline. The legislation that
protects it is ignored because the opportunity costs are too high and legislation is not
enforced. The new South African government abolished subsidies, legislated labour and
tenancy laws and farmers see themselves as ‘scapegoats for apartheid’ (Koelle & Oettle,
2003). Land reform issues place additional pressure and insecurity and cause farmers to
be wary about the present government. Government extension used to be well connected
28
to farmers but is now non existent in parts, although farmers have good informal network
systems. Farmers have not always collaborated with governmental conservation groups,
although this is changing.
The qualitative data were transcribed from interviews of fifty eight landowners and were
analysed using grounded theory (Glaser & Strauss, 1967). Grounded theory is usually
associated with exploratory research and used extensively across social science
disciplines (Gibbs, 2002). ‘The grounded theory approach is a qualitative research
method that uses a systematic set of procedures to develop an inductively derived
grounded theory about a phenomenon.’ (Strauss & Corbin, 1990). Qualitative analysis
using grounded theory involves two main procedures, namely coding and adjunctive
procedures. Coding procedures include open coding, axial coding and selective coding
and require questions to be asked and comparisons to be made, while adjunctive
procedures are memos, general comments that are made while coding (Strauss & Corbin,
1990).
The focus of inquiry in the interview revolved around two issues, namely what farmers
like about the renosterveld and how they suggest it is preserved, should they wish to.
Private landowners were asked what they value about renosterveld but were not directly
asked what motivates them to conserve as this would preconceive the emergence of data,
rather than allowing the theory to inductively arise from the data. Conservation must be
understood from the private landowners’ perspective as it is not in their best financial
interest to set aside land for conservation.
The steps followed in the grounded theory were as follows:
1. Familiarise data by close reading.
2. Label the incidents and categorise data segments to create relevant categories (Dey,
1993).
29

3. Compare and link coded categories to form a core category from which the theory
emerges.
4. Reflect and assess the validity of the process.
STEP 1 : Familiarise the data by close reading
Qualitative data analysis begins with in depth reading of the interview and provides the
forum for issues to ‘arise’ out of the data.
STEP 2 : Label the incidents (data) and categorize data segments to create relevant
categories
Grounded theory begins with coding and in the open coding process data were reread to
bring together ideas about the data. Data segments were gathered, relevant information
labelled, conceptualised and segments of the text were placed into 14 relevant node
categories (Appendix 8.4). The data relevant to each category were scrutinized and
examined for deeper connotations in a process known as the ‘constant comparison
method’. Categories should consider ‘sociological constructs’ and ‘in vivo codes’
(Glaser, 1992). Many older farmers understand the word ‘conservation’ to be ‘soil
erosion’ and questions about conservation are answered in terms of contour banks and
preventing erosion. ‘Soil erosion’ is therefore an in vivo code for ‘conservation’.
Categories are not exclusive and data segments can be attributed to several incidents or
observations (Strauss & Corbin, 1990). Ideas, thoughts, reasons, motivations should
continually be recorded during this process in ‘memos’. For example when annotating
‘neighbour relationships’ one might memo that a farmer, who was part of a nature
conservancy, refused to be interviewed because he did not care for conservation and
claimed only to have joined the conservancy to please his neighbour. This memo may
then be visited later when looking at why farmers join conservancies.
30

STEP 3 : Compare and link coded categories to form a core category from which the
theory emerges.
The analysis continued to axial coding where categories are fine tuned, revisited, clarified
and compared and put back together in new ways after open coding (Fielding & Lee,
1998). The relationships of categories were explored, finding connections between them
and ‘the idea is that each element in turn has a causal influence on the next’ (Gibbs,
2002). For example ‘links with the past’ influences the ‘emotional connection’, which in
turn influences constructive attributes and so on and in this way themes should start
emerging and concepts develop.
The final stage of coding is selective coding which produces the core category around
which all others are related (Strauss & Corbin, 1990). The themes from the final network
of relationships between categories, determined the main claims of the resulting analysis
and theory. This stage is mostly analytical and theoretical and is the process by which ‘a
fully grounded theory emerges’ (Strauss & Corbin,1990; Gibbs, 2002).
STEP 4 : Reflexivity and assessment of validity
This final step involved a further reassessment of the whole process of analysis.
‘Reflexivity’ is in part ‘consideration of the process of research and its possible
implications for the validity of the main claims and conclusions of a study’ (Hammersley
& Atkinson, 1983) as there are always potential sources of error.
The interviews were recorded in the researchers own hand. Although a tape-recorded
interview may have provided more data through re-listening for nuances and emphases, a
manual recording method was selected to provide a less threatening atmosphere.
‘Nodes are not merely a simple categorization of passages of the text’ (Gibbs, 2002) and
in this qualitative analysis the researcher thought the categories represented too many
facts and not enough phrases that could indicate more psychological meaning. The
categorization of nodes is perhaps a weakness in this analysis, although the researcher
31

found these more abstract categories difficult to create. Some farmers found the questions
in the interviews difficult to answer and many answered ‘nou vra jy my vas’ (that’s
difficult to answer). Questions were repeated using different synonyms and this enabled
some farmers to eventually divulge their thoughts. Farmers are not usually asked why
they conserve renosterveld and some answers became reiterations of what the interviewer
had said earlier. Some data provided by statements such as ‘get together and talk about it’
were omitted because they did not fulfil a category. In grounded theory data that are not
coded, are at some stage discarded and this is a recognised problem, because significant
information is sometimes overlooked.
The validity and reliability of qualitative research analysis will remain in debate because
‘the issue of whether the representations of the objects of qualitative research are valid
cannot be escaped’ (Gibbs, 2002).
4.6 Limitations of the Study
4.6.1 Sampling
The purposive sampling of farms with renosterveld fragments introduced a sampling bias.
However, this was counteracted by the planned interviewing of all farmers with
renosterveld in the CMA.
Although attempts were made to interview all fifty four farmers with renosterveld in the
CMA, only forty four were ultimately interviewed as the remaining ten were either not
contactable or refused to be interviewed. The study site was thus expanded to include
further private landowners outside the CMA in conservancies and more rural areas.
No comparisons were made between farmers in the CMA, conservancies and more rural
areas. A larger sample size (more farmers) would have enabled comparison. Sample size
may thus be regarded as a limitation in this research.
32

4.6.2 Financial data
This research requires financial data and although confidentiality is offered, the financial
data provided by the private landowner may not always be accurate and could impact on
the results of the analysis.
4.6.3 Recording/Language
The fact that both English and Afrikaans are used may mean that data are lost in
translation. An inherent bias exists when manually recording the interview because
although the researcher attempts to record all that is said, some things are unwillingly
excluded that may have been of importance.
4.6.4 Inter-disciplinary research
Conservationists have alluded to the necessity ‘to legitimize and encourage disciplinary
boundary crossings’ (Orr, 1994). Interdisciplinary teaching has become more integrated
over time (Niesenbaum et al., 2003) and although mixing social science with natural
science has been suggested, it has not often been pursued (Orr, 1994). In this research
there was an attempt to investigate incentives from both science perspectives. Although
qualitative data suggest subjective interpretation, this ‘inductively derived’ data lend
richness to understanding the human perspective of motivation. The researcher struggled
with amalgamating the qualitative and quantitative results into coherent theory and
conclusion and this was not adequately addressed.
33

5. CHAPTER 5 : RESULTS
5.1 Opportunity costs of maintaining renosterveld
In addressing the key question whether farmers will keep or transform these fragments,
renosterveld is considered both in terms of the direct cost of conserving renosterveld and
the foregone income or opportunity costs.
5.1.1 Characteristics of renosterveld farms
One of the characteristics of the farms in the CMA is that many farms have been in the
family for generations and some of these farms have been in existence for over 300 years.
Of the landowners interviewed 49% had farms that had been in their family for 51 years
or longer, while 23% had family farms for 21 to 50 years. Only 9% of landowners had
been farming for less than 6 years.
Vineyard
GrainDairy
Mixed Other Beef/SheepFruit & Veg
0
5
10
15
20
25
30
Vineya
rdGrain
DairyMixe
dOthe
r
Beef/S
heep
Fruit & V
eg
Num
ber o
f far
mer
s (n
=57)
Figure 3 : Main type of farming income of landowners interviewed
34

Almost half the farms had vineyards as the main source of income (Figure 3); while grain
and dairy were the major source of income for a third of the farmers, less than a quarter
of the farmers had other main types of farming. As most farmers had vineyard as their
main type of farming, a focus was given to issues surrounding wine farmers.
5.1.2 The direct costs of maintaining renosterveld
McDowell (1988) describes ecosystem conservation expenses as capital expenses and
running expenses. Running expenses include fire management, alien clearing, fencing
and security. The cost of maintaining renosterveld was documented in these categories
and a further category added which included other expenses such as conservancy fees.
These categories are presented as a percentage of the total cost (Figure 4). Alien
vegetation clearing is the greatest expense, while security is the lowest expense.
security4%
alien vegetation clearing
63%
fire8%
fencing20%
other5%
Figure 4: Categories of conservation management costs as a percentage of the total cost
35
19
267
36
85
22
0
50
100
150
200
250
300
security alien vegetationclearing
fire fencing other
Cost category (n=56)
Ran
d ha
-1 y
-1
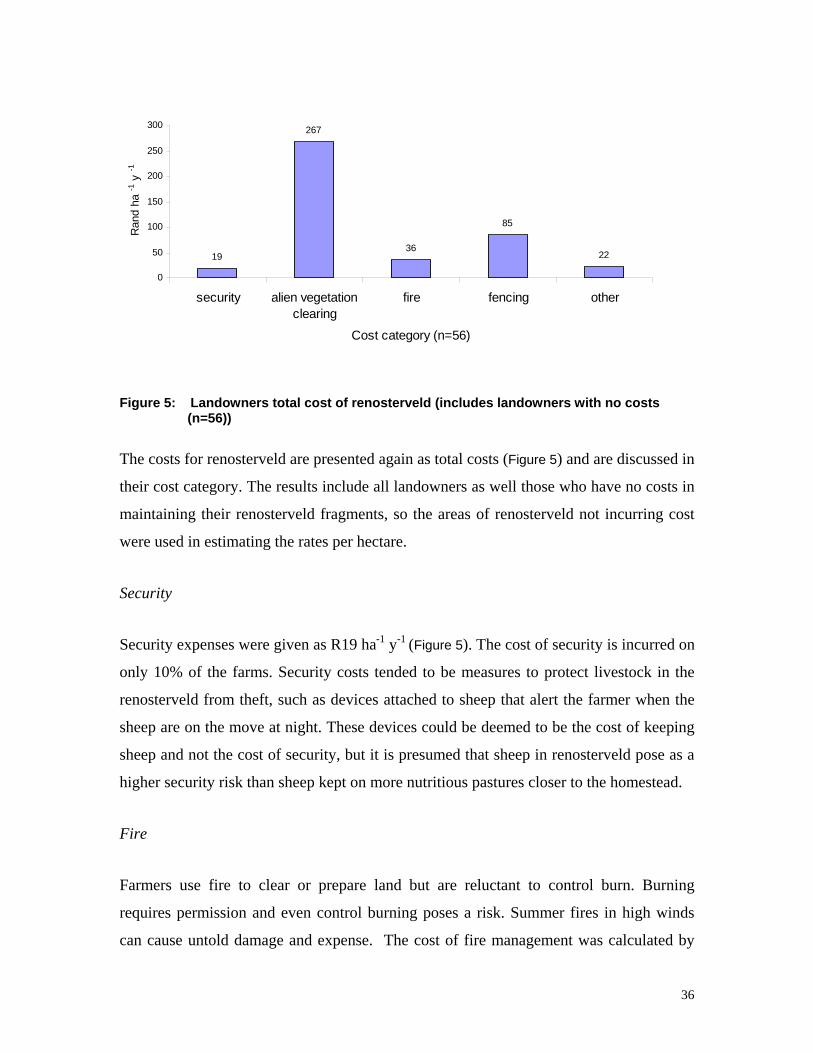
Figure 5: Landowners total cost of renosterveld (includes landowners with no costs (n=56))
The costs for renosterveld are presented again as total costs (Figure 5) and are discussed in
their cost category. The results include all landowners as well those who have no costs in
maintaining their renosterveld fragments, so the areas of renosterveld not incurring cost
were used in estimating the rates per hectare.
Security
Security expenses were given as R19 ha-1 y-1 (Figure 5). The cost of security is incurred on
only 10% of the farms. Security costs tended to be measures to protect livestock in the
renosterveld from theft, such as devices attached to sheep that alert the farmer when the
sheep are on the move at night. These devices could be deemed to be the cost of keeping
sheep and not the cost of security, but it is presumed that sheep in renosterveld pose as a
higher security risk than sheep kept on more nutritious pastures closer to the homestead.
Fire
Farmers use fire to clear or prepare land but are reluctant to control burn. Burning
requires permission and even control burning poses a risk. Summer fires in high winds
can cause untold damage and expense. The cost of fire management was calculated by
36

totalling the annual estimated cost of fire management provided by each farmer and
dividing this by the number of hectares of renosterveld on their farm. The mean value of
the cost of fire management on all farms was calculated as R36 ha-1 y-1 (Figure 5). Fire
management costs are largely proactive cost for fire breaks.
Only 23% of the farmers provided fire management costs and severe fire costs are
possibly only reflected when an infrequent fire occurs. The cost of a serious fire can be
extremely high. Fire stations respond to calls (especially in urban areas) and charge a fee
per incident type. An incident type increases depending on the severity of the fire (a
house is incident type 1; a shop = incident type 2; a major fire = incident type 3). Costs
are then doubled or tripled according to the incident type (Mr Bosch, Goodwood Central
Fire Station, pers. comm.). A major fire appliance costs R198 per 15 minutes (or part
thereof). For example a major fire lasting two hours with 2 fire engines would cost
R9 504.
Fencing
Farmers wishing to conserve a remnant of renosterveld or establish a conservancy are
faced with fencing costs which vary depending on the type of fencing required. Fencing
costs were calculated by using the estimated annual cost of fencing provided by each
farmer and dividing this by the number of hectares of renosterveld on their farm. Fencing
is given as the second highest cost of maintaining renosterveld and the mean value of the
cost of fencing was calculated as R85 ha-1 y-1.
Farm fencing costs are estimated at R70 m-2 for low wire and R80 m-2 for high wire (1.8 -
2 m) (M. Willemse, WPK Malmesbury recommended fencer, pers. comm.). WPK
Durbanville quoted R70–R100 m-2 depending. Cost for stock fencing (7 strands of barbed
wire at 1.2m, with wooden straining, intermediate posts and steel droppers) is given at
R29 m-2 (JJ Fencing, Blackheath, pers. comm.). Game fencing is generally more
expensive than stock fencing and requires a minimum of 22 plain wires (R15 m-1
excluding labour) as opposed to the 7 strands of barbed wire for stock fencing.
37
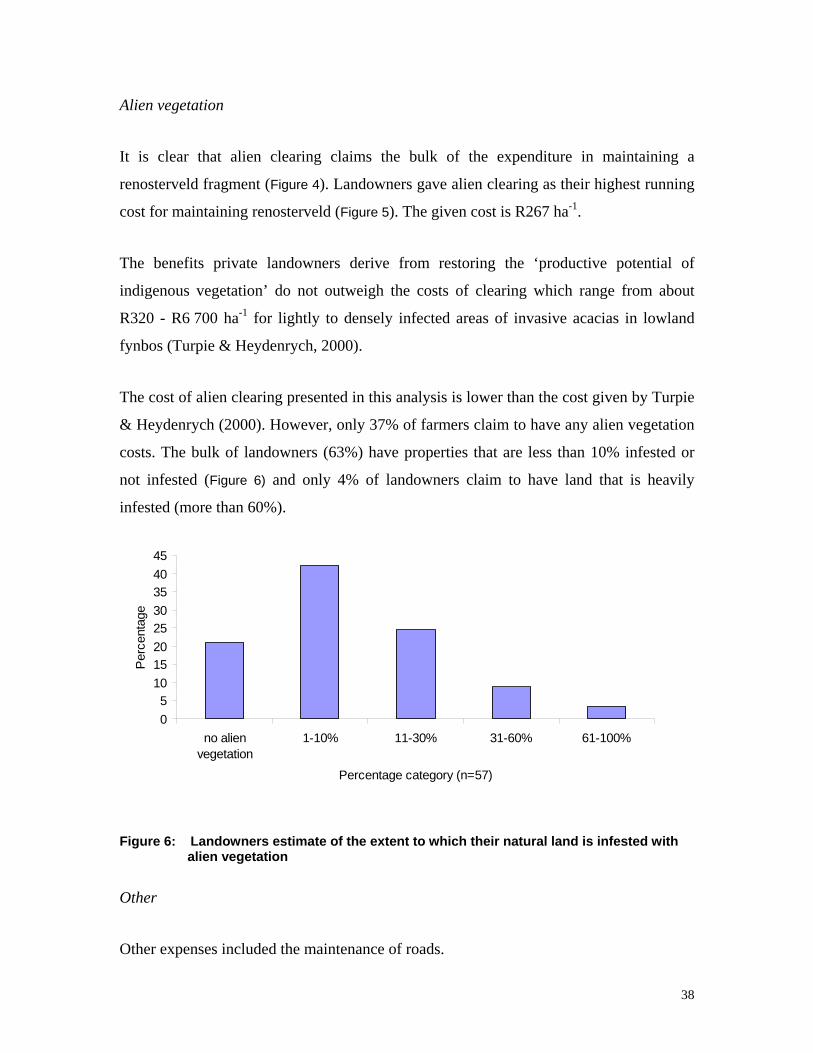
Alien vegetation
It is clear that alien clearing claims the bulk of the expenditure in maintaining a
renosterveld fragment (Figure 4). Landowners gave alien clearing as their highest running
cost for maintaining renosterveld (Figure 5). The given cost is R267 ha-1.
The benefits private landowners derive from restoring the ‘productive potential of
indigenous vegetation’ do not outweigh the costs of clearing which range from about
R320 - R6 700 ha-1 for lightly to densely infected areas of invasive acacias in lowland
fynbos (Turpie & Heydenrych, 2000).
The cost of alien clearing presented in this analysis is lower than the cost given by Turpie
& Heydenrych (2000). However, only 37% of farmers claim to have any alien vegetation
costs. The bulk of landowners (63%) have properties that are less than 10% infested or
not infested (Figure 6) and only 4% of landowners claim to have land that is heavily
infested (more than 60%).
05
1015202530354045
no alienvegetation
1-10% 11-30% 31-60% 61-100%
Percentage category (n=57)
Per
cent
age
Figure 6: Landowners estimate of the extent to which their natural land is infested with alien vegetation
Other
Other expenses included the maintenance of roads.
38

spare time - own labour
(n=12)22%
woodcutters (n=3)5%
outside contractor
(n=6)11%
funded removal (n=2)
4%
do not clear (n=16)29%
planned removal - own labour (n=16)
29%
Figure 7 : Landowners indication of current removal of alien vegetation (n=55)
The majority of farmers (62%) are paying for their alien vegetation to be cleared. 29% of
landowners do not clear their alien vegetation although some landowners claim not to
have alien vegetation in their renosterveld (Figure 7) Landowners (4%) have funded
removal and 5% have alien vegetation cleared by woodcutters. The bulk of clearing
(51%) is done by the landowners either in their spare time or planned time using their
own labour.
39

5.1.3 The economic potential of renosterveld fragments
Land prices
Land-use change is seen as one of the biggest threats to renosterveld, both in terms of
agricultural expansion and urban development around the fringes of the CMA. The areas
that might affect land-use change are explored.
Developed agricultural land sells for more than undeveloped land set aside for
conservation and these property prices have a major impact on natural environment issues
(McDowell, 1988). The price of agricultural land in the Western Cape is influenced by
climate, topography, production capability and other variables such as size,
untransformed land and population density (Mcosano, 2005). There is a huge discrepancy
in price range and properties close to town, in a perceived desired locality, can command
disproportional prices from local and overseas buyers.
The price of agricultural land in the CMA varies considerably, ranging from about
R45 000 - R1 000 000 per hectare (Pam Golding, Agricultural consultants, pers. comm.).
The estimates for agricultural potential vineyard land in the CMA are valued at R250 000
– R450 000 per hectare. Developed agricultural land tends to accommodate the cost of
developing that land, which is an estimated additional R100 000 ha-1 for irrigated
vineyard (Pam Golding Agricultural consultants, pers. comm.). Large tracts of low
potential land for grazing occurring mainly outside the CMA, may sell for an estimated
R250 - R500 per hectare (H. van Niekerk, Land Bank, pers. comm.). 2
Commercial land, residential land and agricultural land command different prices.
Agricultural land rezoned for commercial purposes commands prices of approximately
R50 000 to R1 000 000 per ha (Pam Golding Commercial consultants, pers. comm.) but
2 Six estate agents were asked the average cost of agricultural land in the CMA. Based on their estimates, agricultural land prices vary from R1000 000 ha-1 for vineyard to R2 500 ha-1 for more rural pastures. This discrepancy makes the cost of agricultural land difficult to estimate. The ‘going rate’ in the CMA is R45 000 ha-1 (the municipal market value for agricultural land) and R350 000 ha-1 for prime vineyard.
40
the best current estimate is about R1 000 000 ha-1 (A. Realty, pers. comm.). Commercial
land fetches high prices in both high density and low density areas because although low
density areas are more sought after, high density construction produces greater income.
Generally agricultural land is estimated to be worth about half, or in some instances, one
third the value of residential land. Agricultural land for vineyard around the CMA is
R350 000 ha-1 (mean value), and the value would therefore be estimated at R700 000 –
R1 050 000 ha-1, which approximates the estimates for commercial land.
Existing revenue from renosterveld
Only 19% (n=11) of the farmers interviewed received any remuneration from their
renosterveld and their current income, ranged from R35 ha-1 to R46 429 ha-1 with a
geometric mean of R235.98 ha-1 . The geometric mean was used because the results
would have otherwise been skewed by a profitable commercial game lodge venture. The
income provided by the landowners was gross income not net income and so the
commercial game lodge venture does not reflect the initial costs of establishing this
lodge.
The main use of renosterveld, currently generating an income, is for grazing (n=5) but
other uses include game and tourism (n=4), buchu (n=1) and wild flower harvesting
(n=1). These data are presented as the mean actual income per hectare (Figure 11). This
reflects the data supplied by landowners who had an income or estimated incomes and
landowners who did not provide information were excluded. The game lodge and tourist
ventures generated the largest income but the average income per hectare was reduced as
these ventures were on larger renosterveld fragments (> 400 hectares of renosterveld).
41

Existing revenue from similar soils
0
5000
10000
15000
20000
25000
30000
vineyard grazingstock
other dairy grain
Ran
ds h
a -1
y -1
Figure 8 : Existing revenues from areas of similar soils
The income from similar soils shows that vineyard is producing the highest gross income
and grain the lowest (Figure 8). One amount of R15 833 ha-1 y-1 for dairy was given as
income from similar soil types. This is unrealistic revenue from renosterveld because
supplementary feeding can allow numerous cows on a small area (Farmers X, dairy
farmer, pers. comm.).
5.1.4 Landowner perceptions of potential income from renosterveld
areas
Landowners were asked what they thought was the best use for the renosterveld on their
farm, other than its current use. Landowners provided estimates of potential income but
indicated that they had not researched alternative uses for the renosterveld on their farms.
42

Only 75% of landowners suggested another use and the remaining 25% thought that
renosterveld had no other use or not one that they could use on their farms. The results
are summarised using data supplied by the farmers who gave an alternative use (n=44).
0
5
10
15
20
25
30
35
game/eco-tourism
other grazing olives vineyard buchu
perc
enta
ge
Figure 9 : Landowners’ suggested best use of the renosterveld on their farm (n=44)
Eight one percent of landowners receive no income from their renosterveld. All the
landowners were asked to estimate what they thought would be the best use for their
renosterveld, other than its current use. The majority of landowners (58%) thought
agriculture would be the best use for their renosterveld, which included grazing, olives,
vineyard and buchu (Figure 9). An equal proportion (36%) of landowners listed
game/tourism and cultivation as the best use for renosterveld.
43

0100020003000400050006000700080009000
eco-tourism(n=3)
mining(n=1)
totalagriculture
(n=20)
olives (n=5) buchu (n=3) vineyard(n=3)
grazing(n=6)
other crops(n=3)
Ran
d ha
-1 y -
1
Figure 10 : Landowners’ estimated gross income ha -1 from the best use (other than the current use) of renosterveld on their farm (n=24)
Landowners were reluctant to estimate income for the best use of renosterveld but
perceive eco-tourism as having the greatest opportunity cost. Landowners suggested that
eco-tourism would be both the best use of renosterveld (Figure 9) and would produce the
highest income (Figure 10) but only three landowners, all involved with eco-tourism,
estimated an eco-tourism income. One of these landowners estimated he could multiply
his current eco-tourism income by 10. The mean estimated gross income per hectare for
eco-tourism was R7 749 (Figure 10) and it is clear that eco-tourism is perceived as
profitable. Eco-tourism requires larger fragments of renosterveld3 and about half the
fragments of renosterveld in this study area are on steep hills.
Although grazing was suggested as the second highest best use (Figure 9), it was not
perceived as generating much income (Figure 10). The income from farmers who are
currently receiving income from grazing their renosterveld (n=5) is R199 ha -1 y -1.
After grazing, olives are perceived as the best use for renosterveld (Figure 9) but after eco-
tourism, olives were estimated as generating the next largest income (Figure 10) of R4246
per hectare per annum. Buchu is not perceived as generating a good income although one
3 Of 18 000 remaining fragments of renosterveld in the CFR more than half are less than one hectare (von Hase et al., 2003).
44

farmer suggested an income of R20 000 per hectare per annum but it is suggested as the
fifth best use for renosterveld. There are farmers who suggest vineyard as the best use
(n=4) and this suggests that not all renosterveld is perceived to be on marginal ground.
5.1.5 Estimated opportunity costs of maintaining renosterveld
One of the perceptions of renosterveld is that it is only found steep hilltops or on land
unsuitable for agriculture or ‘uitvalgrond’ (Winter, 2003), but there are opportunity costs
because renosterveld does exist on some land that has the potential for further agricultural
development.
The opportunity cost is the major cost of protection and is a measure of the alternative
income sacrificed in the alternative use of agricultural land (Mohr & Fourie, 1995;
Sinden, 2004). Michael (2003) argues that opportunity costs are frequently calculated as
‘the lost revenue from restricting current land use, ignoring the fact that landowners may
have non-commodity values for the land in its protected state’. Michael (2003) defines
opportunity costs as ‘the difference between the market values of the property in its
restricted and unrestricted states’.
Opportunity cost is essentially what is being lost by investing in conservation rather than
development. There are overlaps between the economic potential and opportunity costs
but in financial terms they are essentially different.
The opportunity cost of renosterveld in the CMA and surrounds is explored in terms of
income generated from the main types of farming namely; vineyard, wheat, olives,
grazing, cattle and buchu. Eco-tourism is discussed. Three incomes from renosterveld are
used to explore the viability of renosterveld. These incomes are the actual income, the
perceived income generated from the suggested best use for renosterveld and the actual
average opportunity costs (income from similar soils) of renosterveld.
The net present value (NPV) is the difference between the present value of cash inflows
and the present value of cash outflows and is a standard method for evaluating whether a
proposed long-term investment is profitable. A project with a positive NPV should be
undertaken. The NPV (Table 1) compares the value of vineyard today to the value of that
45

same vineyard in the future, taking inflation and returns into account and indicates that a
positive NPV is profitable. A higher discount rate can be used to assess the profitability
of more risky projects. The Internal Rate of Return (IRR) is a measure used to determine
the rate of return on investments (i.e. the interest rate that makes net present value of all
cash flow equal zero). An investment with a higher IRR is therefore favoured.
TABLE 1 : The net present value and internal rate of return for vineyard and superior quality vineyard
VINEYARD SUPERIOR QUALITY VINEYARDYEAR Running Income Net Running Income Net
Cost Expected Income Cost Expected Income
YEAR 1 67,776 0 -67,776 74,961 0 -74,961YEAR 2 14,966 0 -14,966 14,966 0 -14,966YEAR 3 17,030 1,312 -15,718 17,030 32,500 15,470YEAR 4 20,643 21,139 496 20,643 52,000 31,357YEAR 5 20,643 26,424 5,781 20,643 65,000 44,357YEAR 6 20,643 26,424 5,781 20,643 65,000 44,357YEAR 7 20,643 26,424 5,781 20,643 65,000 44,357YEAR 8 20,643 26,424 5,781 20,643 65,000 44,357YEAR 9 20,643 26,424 5,781 20,643 65,000 44,357
YEAR 10 20,643 26,424 5,781 20,643 65,000 44,357
TOTAL 244,273 180,995 -63,278 251,458 474,500 223,042
Net Present Value at 5% -67,153 Net Present Value at 5% 139,420Net Present Value at 10% -68,257 Net Present Value at 10% 84,474Internal Rate of return -15.34% Internal Rate of return 26.77%
Vineyard
A recent surge in the wine industry in South Africa has meant the development of a large
number of vineyard plantings. The total area under wine grape vineyards (excluding
sultanas) has increased 16 % over the past decade (1994-2004) but by 20% in 2005. The
total hectares under wine grapes in 2004 was 100 207 hectares, which increased to 124
749 hectares in 2005 (SAWIS statistics, 2005). This indicates a large increase (20%) in
the recent number of plantings.
46

The average income per ton of grapes in 2004 was R2 126 (SAWIS statistics, 2005) and
vineyards generally produce 10-13 tons of grapes per hectare (VinPro, 2006), but
generally 10 tons is the estimate for superior quality grapes (M. Carmichael-Green,
Winning Wines Consultancy, pers. comm.). This means that for each hectare of
cultivatable renosterveld, the gross income is potentially an estimated R21 260 – R27 638
per hectare and production costs are high (Table 1). These statistics includes inferior
quality grapes from the more marginalised areas and is not a true reflection of income in
the CMA and surrounds because good quality grapes fetch on average about R45 000 per
hectare.
The drivers of vineyard expansion are seen to be world consumption of wine and the US
Dollar/SA Rand exchange rate (Fairbanks et al., 2004). The wine market in the short term
outlook indicates that the global industry is growing and WOSA’s (Wines of South
Africa) predict that ‘South Africa’s future growth is likely to be hampered by a lack of
wine supply, most particularly in premium quality segments’ (SAWIS, Production and
Market Estimates 2004-2008).
Predictions for the smaller wine producers who do not have premium grapes are not good
(VinPro, 2006). Lower income grapes are estimated to be unprofitable (IRR = -15.34%),
while premium quality grapes estimates have a more favourable economic outlook (IRR=
26.77%) (Table 1).
47

TABLE 2 : The net present value and internal rate of return for olives and wheat
OLIVES WHEATYEAR Running Income Net Running Income Net
Cost Expected Income Cost Expected Income
YEAR 1 28,694 0 -28,694 2,700 1,584 -1,116YEAR 2 3,212 0 -3,212 2,700 1,584 -1,116YEAR 3 3,212 0 -3,212 2,700 1,584 -1,116YEAR 4 5,662 4,000 -1,662 2,700 1,584 -1,116YEAR 5 7,162 8,000 838 2,700 1,584 -1,116YEAR 6 8,662 12,000 3338 2,700 1,584 -1,116YEAR 7 11,062 16,000 4938 2,700 1,584 -1,116YEAR 8 14,062 24,000 9938 2,700 1,584 -1,116YEAR 9 15,562 28,000 12,438 2,700 1,584 -1,116
YEAR 10 17,062 32,000 14,938 2,700 1,584 -1,116
TOTAL 114,352 124,000 9,648 27,000 15,840 -11,160
Net Present Value at 5% -3,811 Net Present Value at 5% -8,617 Net Present Value at 10% -11,680 Net Present Value at 10% -6,857 Internal Rate of return 3.29%
Wheat
The Malmesbury district has suffered a severe drought over the past two years with the
average yield ha -1 at 2.6 tons and an average price R1 200 ton -1 in 2002-2005 (A Fourie,
Grain SA, pers. comm.). The price per ton in the Swartland increased to R 1035.14 ton -1
in 2005, but the yields were lower at 1.53 tons ha -1. These yields are not a true reflection
of wheat production in the Swartland as some farmers ‘saai dam’4. Costs for this type of
wheat production are low and yields are very low but a bumper year produces good long
term profitability (S. Stein, Malmesbury farmer, pers. comm.). Wheat is unprofitable
with a Net Present Value (NPV) at 10% = - R 6857 (Table 2) with no returns.
Olives
The gross income per hectare of olives varies according to different topography, olive
tree varieties etc. Olives can be planted on slopes where vineyard cultivation could be
4 ‘Saai dam’: the practice of planting wheat in marginal low lying land and involves the diverting of river water. Excellent yields or no yields are produced depending on weather quality.
48

more difficult and rumours abound with returns of R57 000 ha -1 being claimed, but the
estimated IRR = 3.29% (Table 2). The claim that there are good perceived profits from
olives is probably based on income from the marketing of olives rather than the
production of olives.
Grazing cattle
Dairy is not considered as an opportunity cost of renosterveld because dairy cows can be
kept on small lots. The carrying capacity of beef varies considerably but an estimate for
renosterveld was given as 10 cows ha -1 at an income of @R3.80 per day per cow.
Renosterveld has only 3 months of grazing available annually and gross income would
amount to R2280 ha -1 y -1 (Farmer B, dairy and cattle farmer, pers. comm.).
TABLE 3 : The net present value and internal rate of return for buchu and for buchu with a fire after five years
BUCHU BUCHU POST FIREYEAR Running Income Net Running Income Net
Cost Expected Income Cost Expected Income
YEAR 1 47,420 0 -47,420 47,420 0 -47,420YEAR 2 8,420 0 -8,420 8,420 0 -8,420YEAR 3 15,020 75,000 59,980 15,020 75,000 59,980YEAR 4 15,070 125,000 109,930 15,070 125,000 109,930YEAR 5 14,970 200,000 185,030 14,970 200,000 185,030YEAR 6 15,120 250,000 234,880 47,420 0 -47,420YEAR 7 15,120 300,000 284,880 8,420 0 -8,420YEAR 8 15,120 350,000 334,880 15,020 75,000 59,980YEAR 9 15,120 350,000 334,880 15,070 125,000 109,930YEAR 10 15,120 350,000 334,880 14,970 200,000 185,030
TOTAL 176,500 2,000,000 1,823,500 201,800 800,000 598,200
Net Present Value at 5% 1,260,273 Net Present Value at 5% 418,111 Net Present Value at 10% 891,097 Net Present Value at 10% 299,820 Internal Rate of return 105.12% Internal Rate of return 83.40%
Buchu
Cowling & Richardson (1995) estimated buchu income as R18 000 - 25 000 ha-1 and an
estimate of 20 000 ha-1 is the figure supplied by one farmer but profits at present are large
49
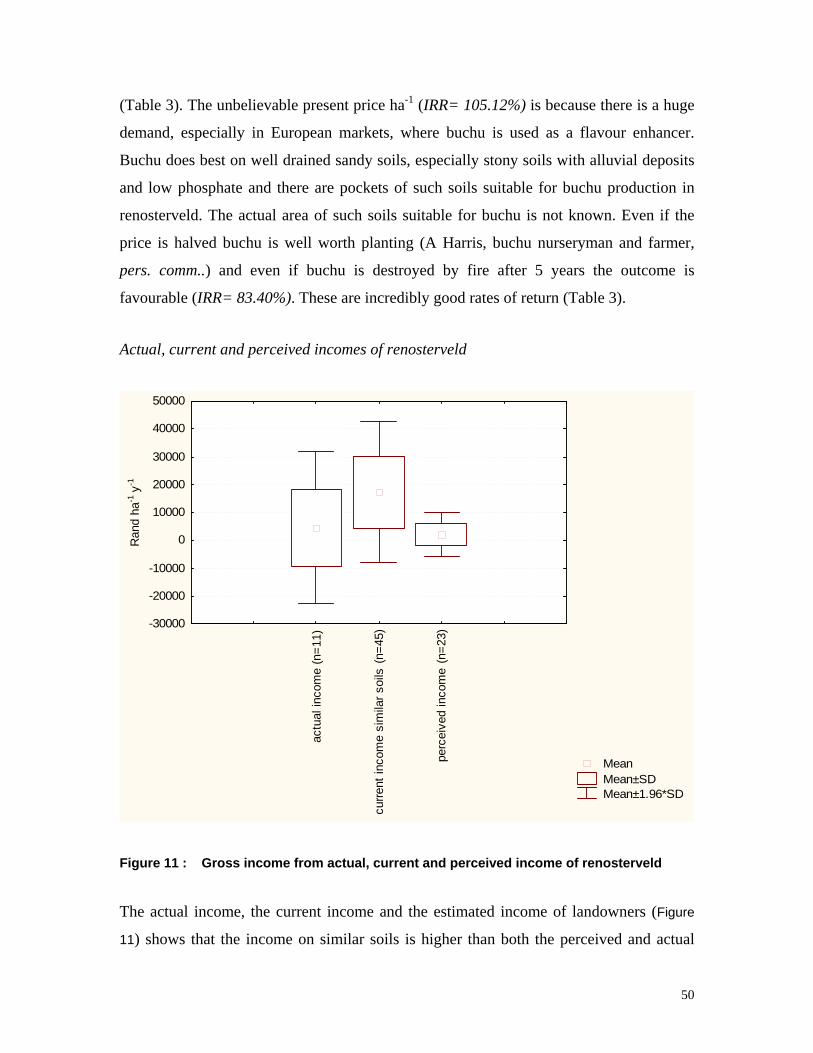
(Table 3). The unbelievable present price ha-1 (IRR= 105.12%) is because there is a huge
demand, especially in European markets, where buchu is used as a flavour enhancer.
Buchu does best on well drained sandy soils, especially stony soils with alluvial deposits
and low phosphate and there are pockets of such soils suitable for buchu production in
renosterveld. The actual area of such soils suitable for buchu is not known. Even if the
price is halved buchu is well worth planting (A Harris, buchu nurseryman and farmer,
pers. comm..) and even if buchu is destroyed by fire after 5 years the outcome is
favourable (IRR= 83.40%). These are incredibly good rates of return (Table 3).
Actual, current and perceived incomes of renosterveld
Mean Mean±SD Mean±1.96*SD
actu
al in
com
e (n
=11)
t inc
ome
sim
ilar s
oils
(n=4
5)
perc
eive
d in
com
e (n
=23)
curre
n
-30000
-20000
-10000
0
10000
Ran
d h
20000
000
40000
50000
a-1 y
30
-1
Figure 11 : Gross income from actual, current and perceived income of renosterveld
The actual income, the current income and the estimated income of landowners (Figure
11) shows that the income on similar soils is higher than both the perceived and actual
50

income of renosterveld. The landowners estimated (perceived) income which might
intuitively be based on what is possible on similar soils is lower than the actual income.
The actual income is generally much lower than the income from similar soils, except
rarely, as in eco-tourism lodge for example. It is unlikely that the eco-tourism lodge
would be viably replicated. The opportunity costs are not that high unless areas are
rezoned for commercial use.
Eco-tourism
The opportunity cost of eco-tourism is not estimated in this analysis because firstly
estimating the cost of tourism is complicated when the initial costs vary considerably
according to the type of tourist venture pursued and secondly because tourism is not
generally seen as a threat to renosterveld, as it conserves rather than develops
renosterveld. However, tourist chalets located in a patch of renosterveld which require a
‘no burn’ policy may have a negative impact. Developing small game eco-tourism
ventures is expensive and on average even the most successful game ranch requires at
least R6 in capital outlay for every R1 generated annually, taking about 6 to 10 years for
um
breeding herds. (WildlifeCampus ABSA report, 2005). Other tourist ventures, such a
a small ranch to reach its economic carrying capacity when starting with minim
lodge, also require huge capital outlay and are dependent on factors such as if there is
another lodge in the area.
51

5.2 Private land conservation incentives
“Regardless of how descriptively precise, reliable, and theoretically rigorous
a measure might be, it is likely to be ignored or ineffective at influencing
conservation decisions if it fails to reflect environmental qualities society
understands and cares about.”
Robertson & Hull, 2001
addressing the key question whether a property rate is a viable incentive for
conservation, private landowners were asked questions relating to property rates and
conservation. In trying to ascertain which incentives would encourage landowners to
conserve renosterveld, landowners were presented with fifteen incentives and asked to
rate these incentives on a scale of one to ten. This addresses in part the key question what
incentives would motivate or influence a landowner’s decision to conserve.
Property rate as an incentive to landowners
90% of private landowners considered 100% municipal tax rebate to be a conservation
incentive (Figure 12) and landowners think that a property rate rebate would be more of an
incentive than free fire protection and alien clearing (48% agreed, 14% unsure,38%
disagreed).
Private property owners who have property with special nature reserve status are not
levied rates at this stage. Farmers were asked whether they are prepared to co-opt their
lands into a contractual conservation agreement and 60% of farmers agreed. However it
was not stated that this land would have to be conserved in perpetuity (Figure 12).
86% of landowners said that a rebate for conservation would impress them that the local
government is making a conservation effort.
In
52

Landowners were previously only liable for Regional Service Levies and the Property
has increased the rates that farmers have to pay. 47% of the farmers said they
Figure 12). There is a
belief that farmers should not pay municipal rates because they do not receive municipal
services.
Rates Act
were unhappy about the 80% agricultural exemption (19% unsure)(
0% 10% 20% 30% 40% 50% 60% 70% 80% 90% 100%
80% property rate rebate that the City of Cape Town is givingfor agricultural land is suffucient
A 100% municipal tax rebate (for renosterveld) is an incentiveto save natural vegetation on farms
than a municipal rate rebateFree fire protection & alien clearing is more of an incentive
Rate rebates for conservation would impress me that the localgovernment is making a conservation effort
To qualinfy for a rate rebate, I am prepared to co-opt myatural land into a contractural agreement
% AGREED % DID NOT KNOW % DISAGREED
Figure 12 : The extent to which landowners agreed or disagreed with the statements (n=58)
0
100
alie
n cl
earin
g
mun
icip
al ra
tere
bate
inco
me
tax
dedu
ctio
n
gran
t or s
ubsi
dy
mor
e in
form
atio
n
free
lega
lco
nser
vatio
nad
vice
eco-
labe
l for
reno
ster
veld
subs
ided
fenc
ing
cost
s
exte
nsio
n of
ficer
conf
eren
ce/c
ours
e
extra
farm
sec
urity
assi
ted
fire
man
agem
ent
Cap
enat
ure
perk
s
publ
i re
cogn
ition
din
ner w
ithpr
izes
incentives
200
600c
annu
al
to
300
400
500
tal r
ated
sco
re
Figure 13 : Total score for each incentive (score rated by landowners on a scale of 1-10)
53

Incentives were rated by the landowner on a scale of 1-10. Financial incentives were
expected to be more popular than other incentives, but landowners differed in their
incentive preferences. There is not one prominent incentive preferred over the others.
The least popular incentive was an annual dinner with prizes.
The incentive that had the highest rating score was assistance with alien clearing (Figure
13). This is surprising in that alien clearing does not appear to pose as a huge problem on
these farms with 63% of landowners having no alien vegetation or properties that are less
than 10% infested (Figure 4).
Landowners are not likely to get substantial financial property rebates, but they give a
municipal rate rebate a high rank as a conservation incentive. A property rebate as an
incentive is only marginally less than alien clearing assistance. A grant or subsidy and
income tax deductions are both economic incentives and were rated as the next preferred
incentive. Each incentive has some appeal to a landowner.
Kruskal-Wallace ANOVA was used to test the null hypothesis that there was no
difference in the score allocated to different incentives. There is evidence of significant
differences between the incentives (H = 81.882, df 14, p = <0.001). A significant
difference exists (Table 2) between the incentives with the highest score and those with
the lowest score. Assistance with alien clearing was the incentive with the most
significant differences. The majority of incentives were not significantly different (88 had
no differences).
A
54

T(H=
ABLE 4 : The Kruskal-Wallis One Way Analysis of Variance on each individual incentive 81.882 with 14 degrees of freedom (P = < 0.001) There is a statistically significant difference
(P = < 0.001))*
All Pairwise Multiple Comparison Procedures (Dunn's Method):
Comparison ofVARIABLE 1 VARIABLE 2 Q' P<0.05
alien clearing annual dinner with prizes 5.601 significant
c recognition 4.367 significant e perks 3.850 significant
income tax deductions annual dinner with prizes 4.931 significant
*3 pairs were not significantly different and 87 were not tested
alien clearing public recognition 4.605 significant alien clearing Capenature perks 4.088 significant alien clearing course eco-mangement 3.626 significant alien clearing assisted fire management 3.566 significant municipal rate rebate annual dinner with prizes 5.362 significant municipal rate rebate publimunicipal rate rebate Capenatur
income tax deductions public recognition 3.936 significant grant or subsidy annual dinner with prizes 4.744 significant grant or subsidy public recognition 3.749 significant more information annual dinner with prizes 3.836 significant free legal advice annual dinner with prizes 3.684 significant renosterveld eco-label annual dinner with prizes 3.523 significant
The incentives were grouped together in an attempt to establish whether economic factors
were considered more important to landowners.
Financial incentives attained the highest score, representing 24% of the total (Table 5),
while public recognition was the lowest scored group. The grouped incentives are
presented as both a pie chart (Figure 14) and as means (Figure 15).
55

information/extension20%
public recognition17%
management incentives
20%
financial incentives
24%
other (legal advice,security,Capenature perks)
19%
Figure 14 : Groups incentives as percentages of the total
56

Mean Mean±SD Mean±1.96*SD
finan
cial
man
agem
ent
publ
ic re
cogn
ition
-100
0
100
200
300
400
500
600
700
800
900
grou
p m
ean
info
rmat
ion/
exte
nsio
n
othe
r
group
Figure 15 : Grouped Incentives
A Kruskal-Wallace ANOVA was used to compare differences between the groups (H =
43.914, df 4, p = <0.001). The pairwise multiple comparisons (Table 5) show that there
were significant differences.
The financial group had a higher score than the other groups and was significantly
different from all groups except management. Management was significantly different
from public recognition but not from any of the other groups.
57

TABLE 5 : The Kruskal-Wallis One Way Analysis of Variance on each group of incentives (H = 43.914 with 4 degrees of freedom (P < 0.001). There is a statistically significant difference (P = <0.001)).
ant ant ant ant
All Pairwise Multiple Comparison Procedures (Dunn's Method):
Comparison ofVARIABLE 1 VARIABLE 2 Q' P<0.05
financial public recognition 6.073 significfinancial other 4.265 significfinancial extension/information 3.773 significfinancial management 2.484 not significmanagement public recognition 3.589 significant management other 1.781 not significant management extension/information 1.289 no testextension/information public recognition 2.300 not significant extension/information other 0.492 no testother public recognition 1.808 no test
Stewardship programs have been initiated in certain areas in the Western Cape and
options depend on management and land use rights. Landowners were asked their view
wished to participate in a conservation
The majority (60%) would be happy for Cape Nature to
anage the natural fynbos on their property but would not be prepared to sell this land to
on conserving renosterveld and whether they
scheme.
All landowners (one unsure) believe that they are likely to save the renosterveld on their
farms in any case (Figure 16).
m
a conservation agency (76%). Most landowners believe farmers do not have extra
finances needed to manage their natural vegetation (69%) but that most farmers are
conservationists at heart (60%).
58
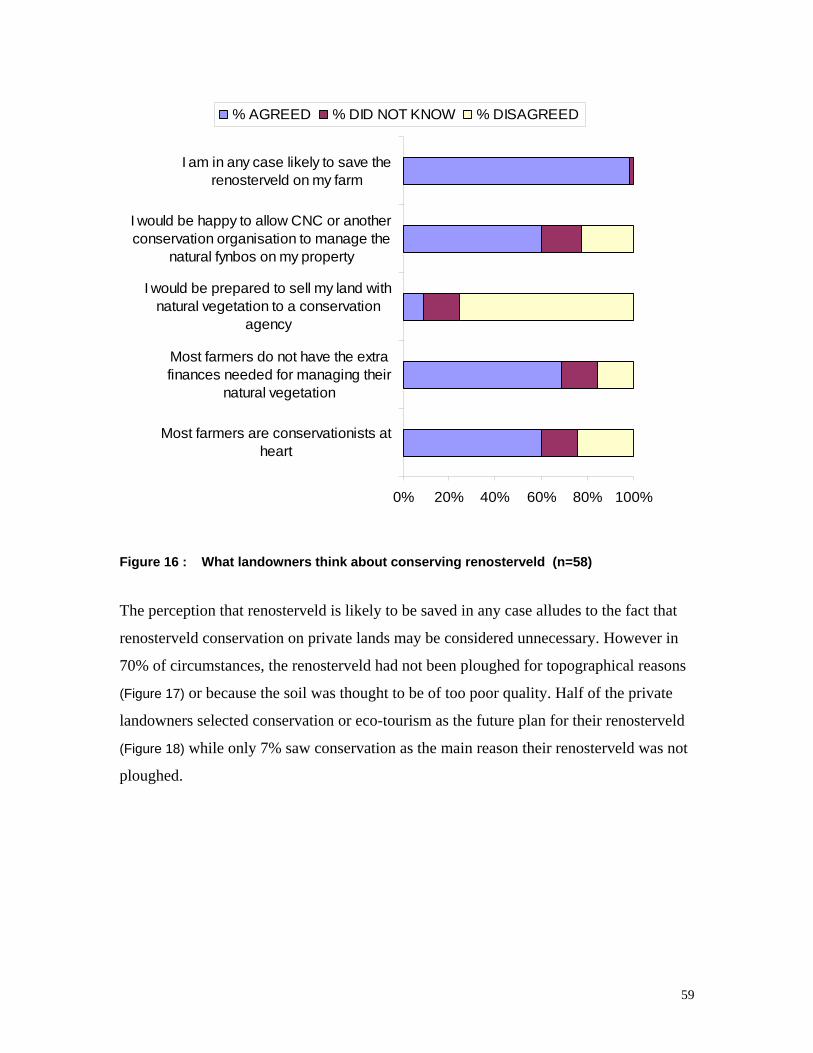
0% 20% 40% 60% 80% 100%
Most farmers are conservationists atheart
Most farmers do not have the extrafinances needed for managing their
natural vegetation
I would be prepared to sell my land withnatural vegetation to a conservation
agency
I would be happy to allow CNC or anotherconservation organisation to manage the
natural fynbos on my property
I am in any case likely to save therenosterveld on my farm
% AGREED % DID NOT KNOW % DISAGREED
Figure 16 : What landowners think about conserving renosterveld (n=58)
The perception that renosterveld is likely to be saved in any case alludes to the fact that
renosterveld conservation on private lands may be considered unnecessary. However in
70% of circumstances, the renosterveld had not been ploughed for topographical reasons
(Figure 17) or because the soil was thought to be of too poor quality. Half of the private
landowners selected conservation or eco-tourism as the future plan for their renosterveld
(Figure 18) while only 7% saw conservation as the main reason their renosterveld was not
ploughed.
59

0
10
20
30
40
50
60
70
80
poor quality soil(n=6)
used for grazing(n=3)
topographical(slope/mountain)
(n=39)
kept forconservation
(n=4)
developmentplans in process
(n=1)
other (n=3)
perc
enta
ge
Figure 17 : Main reason natural vegetation has not been developed on landowners’ farm
30tag
0
10
20
no plans - leave asis (n=21)
conservation / eco-tourism (n=28)
other (n=3) grazing (n=4)
pe
Figure 18 : Priv
40
50
60
rcen
e
ate landowners perceived future use for renosterveld on their land
60

5.3 Implications of a property rate rebate for local government
“We have a responsibility, a responsibility of making sure that we are
accountable to our communities, a responsibility of making sure that we hear
the footsteps of the people behind us.”
Nomaindia Mfeketeo, Mayor of Cape Town
Local governments can have a significant impact on private land conservation by offering
plemented.
In South Africa, the instigation of the Property Rates Act has meant that property tax is
regulated nationally but is taxed in both the urban and rural environment, which now fall
under wall to wall municipalities (Paterson, 2005). Local governments are empowered to
set their own property taxes and this provides an opportunity for local governments to
reduce or abolish property taxes on lands that have complied with certain regulations or
been secured in perpetuity for conservation. In examining whether a property rate is a
viable incentive for conservation it is necessary to understand both the economic
implications for the municipality and the likelihood of municipalities instigating such a
rate rebate or exemption is done with specific reference to the CCT.
5.3.1 Rates as revenue
nd the
primary means through which local councils raise revenue from their local communities.
The CCT levies rates on both land and improvements and has a planned regular property
valuation every four years. The 2005-2006 draft budget sources of revenue totals
R13,969 million with rates providing 17.1% (R2,390 million) and the RSC levies 6.6%
(R928 million). Arrears for the City were 2.4 billion and this led to the formulation of
new indigent policies offering poverty relief to those unable to afford rates and service
charges (City of Cape Town Annual Budget Review 2003). Revenue from rates has varied
tax and other incentives and in some countries incentive programmes which exempt,
rebate or reduce property rates have been successfully im
Property taxes provide the largest source of tax revenue for local governments a
61
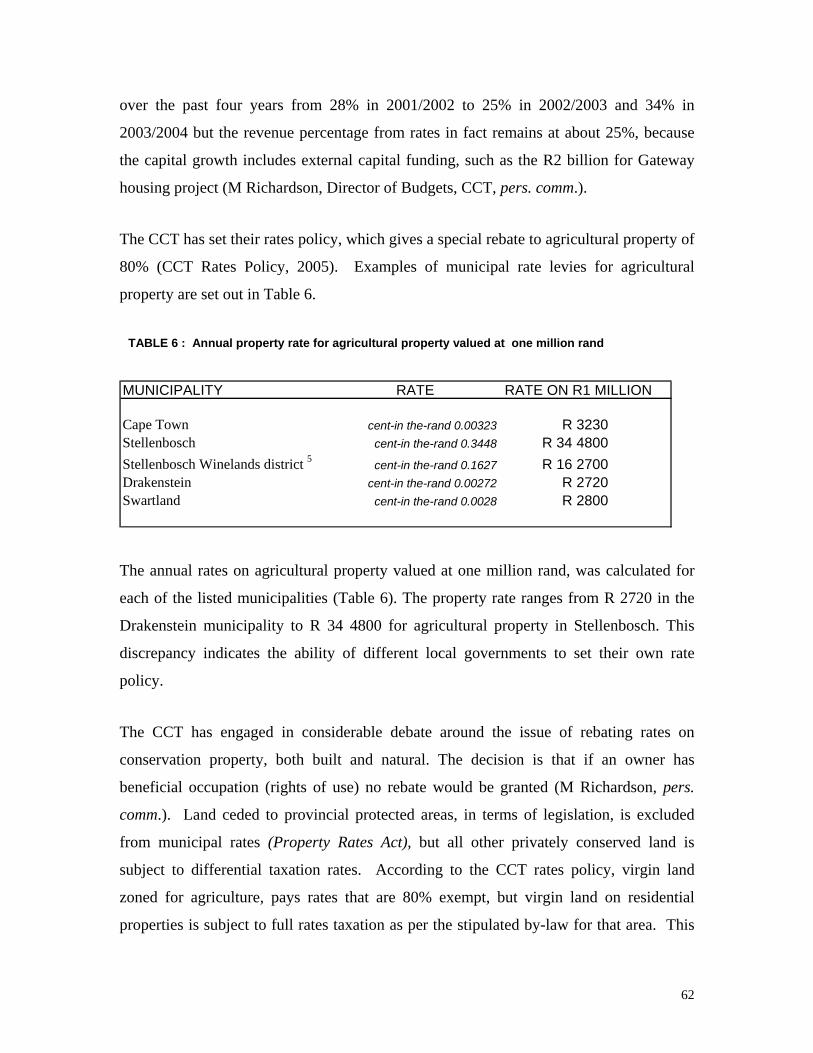
over the past four years from 28% in 2001/2002 to 25% in 2002/2003 and 34% in
the capital growth includes external capital
housing project (M R
The CCT ha
80% (CCT Rates Policy, 2005). Examples of
property are set out in Table 6.
2003/2004 but the revenue percentage from rates in fact remains at about 25%, because
funding, such as the R2 billion for Gateway
ichardson, Director of Budgets, CCT, pers. comm.).
s set their rates policy, which gives a special rebate to agricultural property of
municipal rate levies for agricultural
TABLE 6 : Annual property rate for agricultural property valued at one million rand
MUNICIPALITY RATE RATE ON R1 MILLION
Cape Town cent-in the-rand 0.00323 R 3230Stellenbosch cent-in the-rand 0.3448 R 34 4800Stellenbosch Winelands district 5 cent-in the-rand 0.1627 R 16 2700Drakenstein cent-in the-rand 0.00272 R 2720Swartland cent-in the-rand 0.0028 R 2800
The annual rates on agricultural property valued at one million rand, was calculated for
each of the listed municipalities (Table 6). The property rate ranges from R 2720 in the
Drakenstein municipality to R 34 4800 for agricultural property in Stellenbosch. This
discrepancy indicates the ability of different local governments to set their own rate
policy.
The CCT has engaged in considerable debate around the issue of rebating rates on
conservation property, both built and natural. The decision is that if an owner has
beneficial occupation (rights of use) no rebate would be granted (M Richardson, pers.
comm.). Land ceded to provincial protected areas, in terms of legislation, is excluded
from municipal rates (Property Rates Act), but all other privately conserved land is
subject to differential taxation rates. According to the CCT rates policy, virgin land
zoned for agriculture, pays rates that are 80% exempt, but virgin land on residential
properties is subject to full rates taxation as per the stipulated by-law for that area. This
62

rate policy is reviewed annually but unless there is considerable intervention the existing
rebate policy will generally be ratified (M Richardson, pers. comm.)
The CCT Spatial Development Framework identifies the need to address the inequitable
access to nature, but the bulk of the CCT capital expenditure (63.4%) is allocated for
to private land conservation.
City of Cape Town : Calculating the potential rates loss
The CCT has 422 registered farms with a land value of R617,038,280 an improvement
value of R187,317,000 and a total value of R804,355,280 (CCT Draft Rates Rebate
Scheme, 2002). The total property rates levied on these farm properties are R11,367,149
and an 80% exemption for all agricultural properties, means an annual rates loss of
R9,093,719 (CCT Draft Rates Rebate Scheme, 2002). This R9,093,719 reflects the rates
ental Dept, GIS data) and this includes farms on the
Bottelary Hills (now excluded from the CMA). In estimating the potential financial loss
creating integrated human settlements (2005-2006 draft Capital Budget, IDP theme). The
implications of this are that the emphasis in municipalities is on social issues and it is the
inequitable access to nature that is funded rather than nature itself; no funding is allocated
loss from the agricultural rebate currently in effect. The financial implications of a
potential further exemption for conserved land in the CMA are examined.
In the CMA there are approximately 132 remnants of renosterveld on 6433 ha of
renosterveld (CCT Environm
the CCT would get from a rate rebate for conserved land, renosterveld remnants known to
be developed or to belong to the CCT and totalling 1580.9 hectares, were excluded.
According to the Property Rates Act, 2004, the rates on these properties depend on the
market value of the property. In the CMA, agricultural property values vary considerably
and so annual property rates of the remaining renosterveld were calculated using both a
high and a low estimated property value (Table 7). These annual property rates are
compared and both include and exclude Bottelary Hills.
63
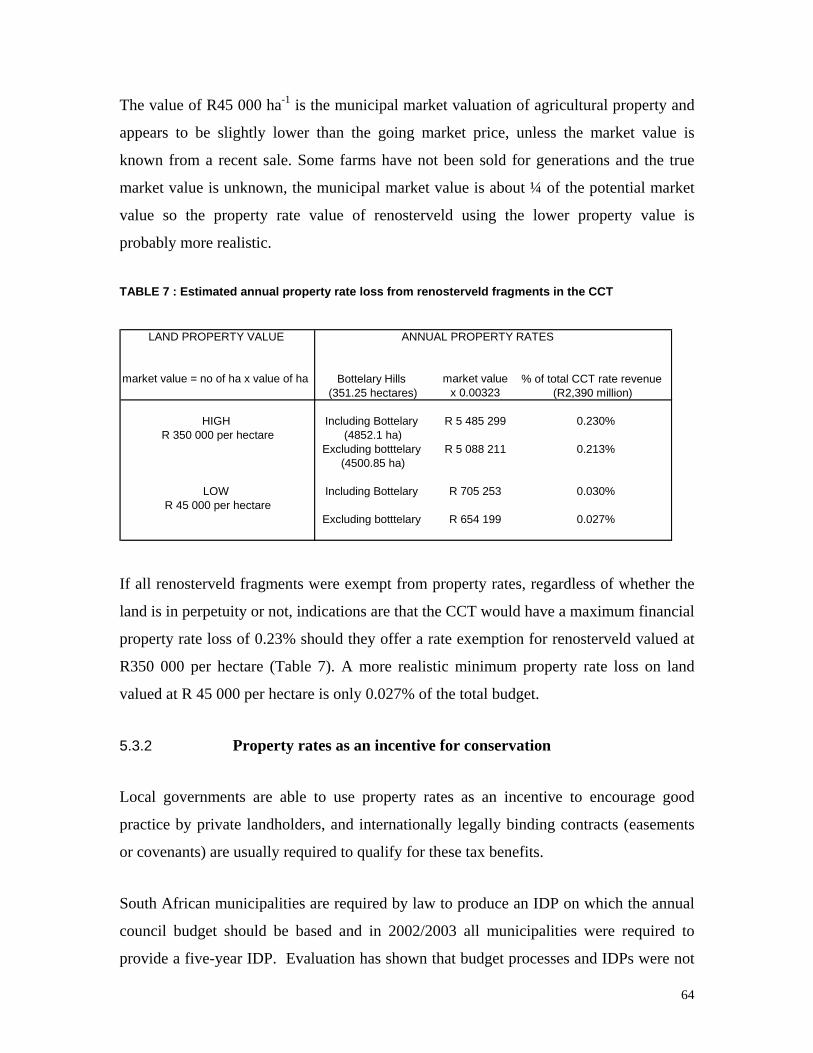
The value of R45 000 ha-1 is the municipal market valuation of agricultural property and
appears to be slightly lower than the going market price, unless the market value is
known from a recent sale. Some farms have not been sold for generations and the true
market value is unknown, the municipal market value is about ¼ of the potential market
value so the property rate value of renosterveld using the lower property value is
probably more realistic.
TABLE 7 : Estimated annual property rate loss from renosterveld fragments in the CCT
LAND PROPERTY VALUE ANNUAL PROPERTY RATES
lue % of total CCT rate revenue (351.25 hectares) x 0.00323 (R2,390 million)
market value = no of ha x value of ha Bottelary Hills market va
HIGH Including Bottelary R 5 485 299 0.230%R 350 000 per hectare (4852.1 ha)
Excluding botttelary R 5 088 211 0.213%(4500.85 ha)
LOW Including Bottelary R 705 253 0.030%R 45 000 per hectare
Excluding botttelary R 654 199 0.027%
If all renosterveld fragments were exempt from property rates, regardless of whether the
land is in perpetuity or not, indications are that the CCT would have a maximum financial
uce an IDP on which the annual
council budget should be based and in 2002/2003 all municipalities were required to
provide a five-year IDP. Evaluation has shown that budget processes and IDPs were not
property rate loss of 0.23% should they offer a rate exemption for renosterveld valued at
R350 000 per hectare (Table 7). A more realistic minimum property rate loss on land
valued at R 45 000 per hectare is only 0.027% of the total budget.
5.3.2 Property rates as an incentive for conservation
Local governments are able to use property rates as an incentive to encourage good
practice by private landholders, and internationally legally binding contracts (easements
or covenants) are usually required to qualify for these tax benefits.
South African municipalities are required by law to prod
64
integrated and therefore the IDPs have had little meaningful impact on budgets (Carter,
2004). These two budgets are difficult to align, as the operating budget is structured in a
way that reflects what, not where, money has been spent (M Richardson, pers. comm.).
The importance of IDPs are that they are guided by the PSDF which have, at least in the
Western Cape, taken biodiversity planning into consideration and this in turn influences
the local government SDF which could in turn influence the municipal rate policy.
llected by
municipalities and the “causes of this are economic, structural and, in some instances,
political” (Carter, 2004). Municipalities have other tax options namely a Regional Service
Tax (RSC), a business tax or a local fund tax. RSC taxes are currently levied but will be
abolished and replaced with possibly a more obvious business tax, but these taxes are
seen as more of revenue generating tool than to be of potential benefit to conservation
(M Richardson, pers. comm.).
One concern is that not all revenue due from communities is being co
65

5.4 What motivates private landowners to conserve
Overexploitation and habitat degradation are serious problems, but they
require thoughtful solutions that run with the grain of human nature
(Henderson & Sutherland, 1997)
The key question “what would motivate a landowner to conserve?” is addressed in this
group of people with different values that are ‘not bound
by a single land philosophy’ (James, 2002), demanded further investigation in order to
understand what would motivate private landowners to conserve. This understanding
could inform the development of appropriate motivational incentives.
The results of the qualitative data were difficult to present as such. Grounded theory was
applied to the data. Thematic categories (nodes) were related and reassembled to
construct links in an attempt to understand the social phenomena of farmers. In this
analysis it emerged that a sense of heritage plays the central role in influencing farmers to
conserve. This sense of heritage was a theme that continuously emerged from the data
and much of what the farmers said was ultimately linked to heritage.
Heritage impacts on how farmers perceive their world and although ‘people will always
discount the future to some degree (Penn, 2003), farming communities are more aware of
future generations because many farmers have inherited their farms and envisage their
children as farmers. Some farmers are utilitarian and have a ‘more economic, exploitative
view and act largely to maximize profit’ (James, 2002), but many farms have been in
families for generations and this connects farmers to their past and to their children’s
section. Motivational incentives, described as measures that influence the way that people
think and vital as part of a package of strategies to promote conservation, are a complex
challenge, especially in developing countries. In developing countries, economic
incentives are less likely because finances tend to be allocated to necessary social needs,
unless considerable donor funding is available for conservation.
Rural landowners as a diverse
66
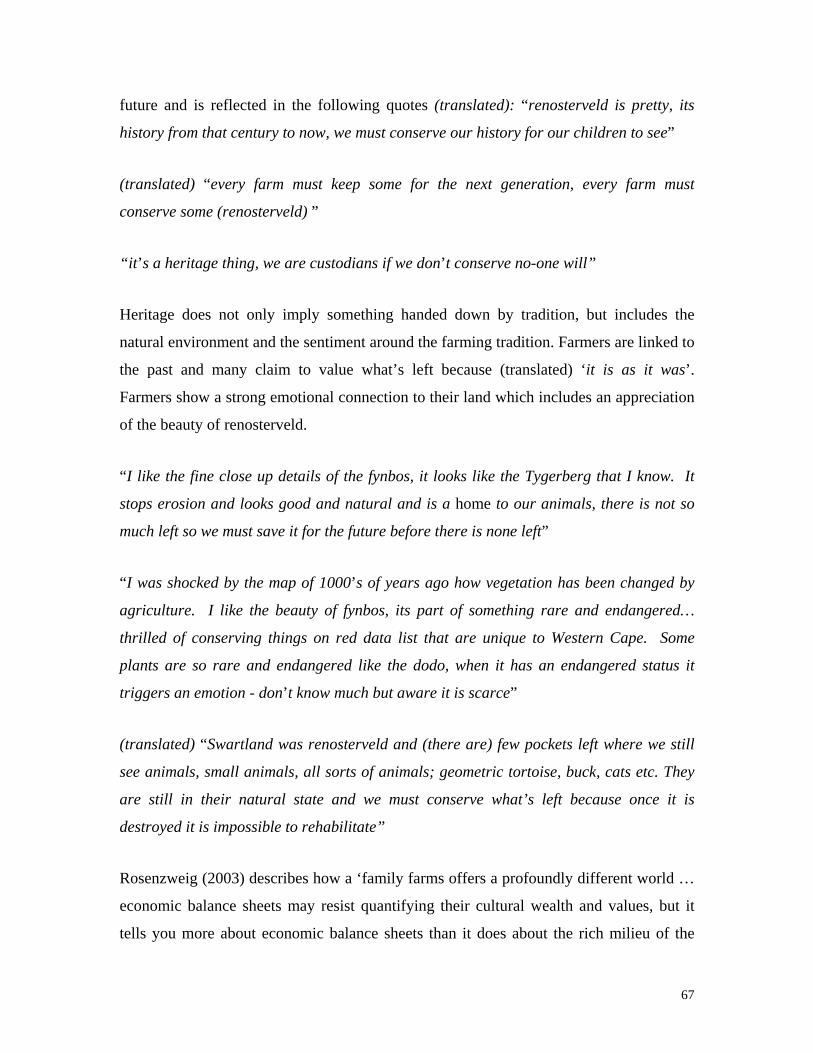
future and is reflected in the following quotes (translated): “renosterveld is pretty, its
”
(translated)
conserve s
“it’s a heritage thing, we are custodians if we don’t conserve no-one will”
“I was shocked by the map of 1000’s of years ago how vegetation has been changed by
left where we still
see animals, small animals, all sorts of animals; geometric tortoise, buck, cats etc. They
history from that century to now, we must conserve our history for our children to see
“every farm must keep some for the next generation, every farm must
ome (renosterveld) ”
Heritage does not only imply something handed down by tradition, but includes the
natural environment and the sentiment around the farming tradition. Farmers are linked to
the past and many claim to value what’s left because (translated) ‘it is as it was’.
Farmers show a strong emotional connection to their land which includes an appreciation
of the beauty of renosterveld.
“I like the fine close up details of the fynbos, it looks like the Tygerberg that I know. It
stops erosion and looks good and natural and is a home to our animals, there is not so
much left so we must save it for the future before there is none left”
agriculture. I like the beauty of fynbos, its part of something rare and endangered…
thrilled of conserving things on red data list that are unique to Western Cape. Some
plants are so rare and endangered like the dodo, when it has an endangered status it
triggers an emotion - don’t know much but aware it is scarce”
(translated) “Swartland was renosterveld and (there are) few pockets
are still in their natural state and we must conserve what’s left because once it is
destroyed it is impossible to rehabilitate”
Rosenzweig (2003) describes how a ‘family farms offers a profoundly different world …
economic balance sheets may resist quantifying their cultural wealth and values, but it
tells you more about economic balance sheets than it does about the rich milieu of the
67

family farm’. Koelle and Oettle (2003) elaborate about the farmers’ sense of place,
which is often not recognized ‘in the analysis of conditional values’, but can influence
management decisions and connect the farmer to his personal and family history.
s a linkage with the past. I grew up with a woodstove ….
I hanker after simpler times and links with tradition, it means something that the “heart
ome… we just
grit our teeth because we want to save some for the family … you need a link”
the air”
reiterated by private
landowners everywhere and farmers have been burdened with ‘duty of care’.
). Meaningful interactions are often made on
visits to farms and the landowners involvement ‘allows the worth of research to extend
“I want to preserve it, it provide
of family” sentiment lies with renosterveld, (over and) above a practical inc
“it’s the only place on the farm that for centuries has not been ploughed and worked, it’s
hundreds of years of pure nature as it was, my oupa and ouma came and sat here too,
there is so little natural veld left in the Western Cape we must keep it, it looks good and
the landscape (looks good) from
Farmers made only a few references to finances such as “needing subsidies for viable
(conservation) propositions”. One farmer said “society must pay – (conservation) cannot
be borne by individual landowners”, which is a statement much
Transparency is also important to farmers where it was commented, “don’t make empty
promises eg rates, on the whole be realistic” Clear and concise conservation options need
to be offered in a simple but flexible plan, because conservation measures have often in
the past been tied in complicated bureaucratic red tape and been ineffective (Wentworth
Model, 2003).
Farmers in this research often expressed a need for conservation extension. The
importance of good extension is well recognized and maintaining good relationships
which improve landholder public relations is hugely beneficial and indeed crucial for
attaining good conservation (Winter, 2003
beyond its intrinsic value’ (Hilty & Merenlender, 2003) because personal interactions
have ‘a far greater potential for persuading individual subjects than has any other
68

medium’ (McDowell et al., 1998). This is reflected in the farmers’ statements about
extension.
“a chap with veld should be visited by people if they have time…. a morning with coffee
“someone responsible must come to farms and talk to people staying on the farms (about)
“high turnover of (extension) personal is frustrating”
“teach people about fynbos and the herbal uses of it so people can get an interest in it”
is a month’s work and he (the farmer) is inspired to do (conservation) work”
“make it (conservation) worthwhile in combination with extension”
why its necessary to conserve”
(translated)”(someone must) go and talk to people and encourage them”
Although landholder education regarding the scarcity of coastal renosterveld is
recognized as a necessity (Winter, 2003) it is again evident that farmers want more
information because they expressed the necessity of educating everyone about
renosterveld.
“people must be told what fynbos is and keep it clean like years ago”
“educate people staying here about the value of the veld”
The merits of education are important but ‘are most effective for triggering change when
it shows how the destruction of the environment harms individual interests’ (Penn,2003).
In other words if elimination of renosterveld can be shown to affect the individual interest
of the farmer, by for example, emphasizing that if renosterveld continues to decline, their
grandchildren will not have the privilege of experiencing renosterveld, then the
possibility of that farmer conserving his land is more likely.
69

The farmers’ link to the past was established through; their children and grandchildren,
the appreciation that renosterveld was always there and emotional connections such as
the beauty of the renosterveld spring. This led to the conclusion that a sense of heritage
tanding the
farmers motivation.
emerged as the most important contribution to farmers’ appreciation of renosterveld and
their motivation to conserve it. Heritage developed as the theme in unders
70

6. CHAPTER 6: DISCUSSION AND CONCLUSION
“Nature conservation is a complex and diverse challenge, and successful nature
conservation is ultimately not about biological and technical issues. It is about
people, about community attitudes and actions, about political and economic
issues, and about the actions of professionals and the organisations charged
with responsibility for nature conservation.’
(Bennett et al., 1995)
The diverse challenge of nature conservation implies that the answers to the key
questions addressed in this research are complex. Although the larger proportion of
landowners with renosterveld fragments perceive that they will keep the renosterveld
fragments on their farms this does not imply conservation complacency.
The issue of land-use change as a continuing threat to renosterveld is explored as are
property rate rebates. Participation in conservation by both landowners and local
government needs significant motivation. Motivational incentives as a conservation
incentive are potentially powerful but further investigation and an improved
understanding of these motivational incentives is required.
Private landowners’ perceptions and opportunity costs of renosterveld
In this research what is of most importance is that all farmers perceive that they will keep
the renosterveld on their farms and the majority had not thought of any alternative land
use. Most farmers perceive that the reason their renosterveld is not used for agriculture is
topographical and they predict that if they developed their renosterveld their income
would be much lower than the income obtained from the other agricultural lands on their
farm. These perceptions should indicate that landowners in the CMA and surrounds are
unlikely to develop their renosterveld in future but no assumptions should be made unless
all threats to renosterveld are removed.
71

There are perceived and real opportunity costs for renosterveld in the studied area.
lly threaten the remaining
remnants. Fairbanks
preserving biodiversity in the CF
market. Indications are that
indeed expanding rapidly in international m
wine exports in 2006 are expected to double in
wine consumer (S. Birch, WOSA in litt.). Smaller producers are advised that ‘if you are
a small player, you will need a premium price to be profitable’ in
litt.).
uality grapes is
somewhat gloomier. The predicted plantings in 2008 will not exceed estimated
prime terroir and secondly
y are tax breaks
for other businesses, and therefore may seek undeveloped or uneconomic slopes for
ble but can grow on marginal stony ground. This
perception may be particularly attractive for farmers who need to utilise every spare piece
of land.
Although low, the major concern is that these potentia
et al., (2004) suggest that the wine industry does not pose a threat to
R, unless the local wine industry expands into the world
the South African wine industry in premium quality grapes is
arkets; by way of example, South African
the USA, which is the world’s largest
(T. Rands, Vinimark,
Over eighty percent of producers produce less than 500 tons of grapes (P Spies, VinPro in
litt.). Whereas prospects for smaller wine producers currently look good for those
producing premium quality grapes, the outlook for producers of lesser q
uprootings for both red and white wines (SAWIS, Production and Market Estimates
2004-2008). Although this suggests that land for vineyards will not need to be extended,
renosterveld is nevertheless threatened by these developments. This is firstly because
premium varieties such as sauvignon blanc seek higher, cooler, southerly facing slopes,
where much of the remaining renosterveld exists on such
because some boutique wineries can afford to run at a loss, because the
vines.
Landowners estimated that olives would produce the second highest income per hectare,
and rumours about potential olive prices abound. Although olive crops are extremely
variable and good money can potentially be made from marketing olive products, olives
are not expected to produce good returns within the first ten years after planting. Olives
may potentially pose a greater threat to renosterveld, in that there is a perception amongst
landowners that they are not only profita
72
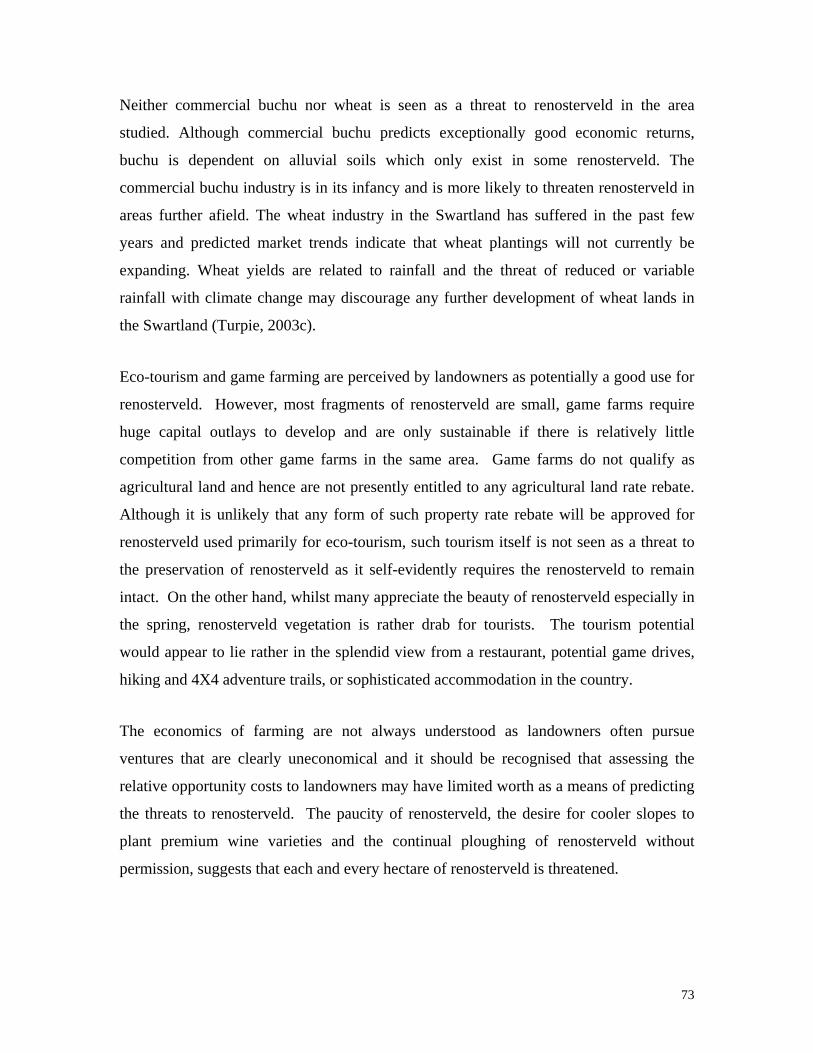
Neither commercial buchu nor wheat is seen as a threat to renosterveld in the area
studied. Although commercial buchu predicts exceptionally good economic returns,
buchu is dependent on alluvial soils which only exist in some renosterveld. The
commercial buchu industry is in its infancy and is more likely to threaten renosterveld in
areas further afield. The wheat industry in the Swartland has suffered in the past few
years and predicted market trends indicate that wheat plantings will not currently be
expanding. Wheat yields are related to rainfall and the threat of reduced or variable
rainfall with climate change may discourage any further development of wheat lands in
the Swartland (Turpie, 2003c).
Eco-tourism and game farming are perceived by landowners as potentially a good use for
The economics of farming are not always understood as landowners often pursue
renosterveld. However, most fragments of renosterveld are small, game farms require
huge capital outlays to develop and are only sustainable if there is relatively little
competition from other game farms in the same area. Game farms do not qualify as
agricultural land and hence are not presently entitled to any agricultural land rate rebate.
Although it is unlikely that any form of such property rate rebate will be approved for
renosterveld used primarily for eco-tourism, such tourism itself is not seen as a threat to
the preservation of renosterveld as it self-evidently requires the renosterveld to remain
intact. On the other hand, whilst many appreciate the beauty of renosterveld especially in
the spring, renosterveld vegetation is rather drab for tourists. The tourism potential
would appear to lie rather in the splendid view from a restaurant, potential game drives,
hiking and 4X4 adventure trails, or sophisticated accommodation in the country.
ventures that are clearly uneconomical and it should be recognised that assessing the
relative opportunity costs to landowners may have limited worth as a means of predicting
the threats to renosterveld. The paucity of renosterveld, the desire for cooler slopes to
plant premium wine varieties and the continual ploughing of renosterveld without
permission, suggests that each and every hectare of renosterveld is threatened.
73

Threats to renosterveld - land use change
Climate change, alien infestation and land use change were suggested as the three main
threats to renosterveld. Climate change is not addressed. As few farmers indicated serious
alien infestation in their renosterveld, possibly, because alien infestations such as alien
grasses are not recognised, only land-use change as a threat is discussed.
Agriculture is the biggest cause of land use change in the CFR (Latimer et al., 2004).
With renosterveld mainly situated on agricultural land, land-use change is therefore the
biggest threat to renosterveld and any further land-use change needs to be prevented.
everely
limit understanding the determinants and effects of incentives’. Indeed, previous
as a group are clearly more attractive than
the other groups and although there are significant differences between incentives there is
Biodiversity strategies are beginning to be incorporated into planning policy such as the
Western Cape PDSF. Albeit land prices for commercial land are attractive, a defined
urban edge and the new PDSF, once both are adopted and implemented, should halt
further rezoning of any agricultural land with renosterveld and development of these
areas should then be prevented. There is also a perception by both developers and farmers
that Provincial Government is strictly enforcing EIA recommendations for biodiversity
conservation (A. Beukes, Firstplan Town Planners, pers. comm.), from which it may be
inferred that developers and farmers are more likely in future to respect the laws that
protect renosterveld.
Conservation incentives for private landowners
Fehr and Falk (2002) argue that the ‘narrow view of human motivation may s
assumptions about what landowners want have meant that private biodiversity protection
was ‘uncoordinated with the interest of the landowners’ (Tikka & Kauppi, 2003). If
conservation incentives are to be used to promote private conservation, clearly we need to
know which incentives private landowners want. Private landowners conserving
renosterveld are positively affecting biodiversity and any motivational or economic
incentive that encourages conservation of renosterveld would be worth pursuing.
This research suggests that financial incentives
74

no single incentive that is more desirable than any others. This lends support to the
conclusions of others that a suite of incentives is more likely to be effective (Bateson,
In South Africa, apart from Working for Water, which operates mainly on state land, and
uld also serve the goal of maximising benefits to society” (Turpie et
al., 2003a). In wealthier and more developed countries, financial incentives are often
veloped countries social issues are often
prioritized above conservation issues and financial incentives need to be supported with
most all
the farmers interviewed felt that assistance with dealing with alien vegetation clearing
2001; Crosthwaite, 2000).
Economic incentives
other projects which incorporate a strong focus on the provision of jobs or poverty
alleviation, economic incentives for private land conservation are limited or non existent.
South Africa has suffered with racial discriminations in the past as a result of which the
development of redressive socio-economic infrastructure places the greatest claim on
public finances. Finances for conservation, which for many appear an unnecessary
luxury, compete with glaring social issues. There is simply not enough money for
substantial compensation for conservation of renosterveld, but small compensations, like
that of a property rate rebate, could have a symbolic psychological significance.
“No matter how sophisticated, conservation planning cannot afford to ignore economic
forces at play and sho
supplied by affluent philanthropists, but in less de
foreign funds (Scherr & McNeely, 2002). Nevertheless financial mechanisms are
powerful drivers for changing the way that people farm (Halweil, 2002) and financial
rewards that meet or surpass the opportunity costs of developing renosterveld would no
doubt encourage private landowners to conserve.
Alien clearing as an incentive
Although very few farms bore obvious signs of infestation by alien vegetation, al
would be a significant incentive. This can be attributed to the fact that many farmers
75

deploy significant labour and time resources towards maintaining their lands free of alien
vegetation. Indeed, landowners not only identified alien clearing costs as the most
expensive maintenance cost in conserving renosterveld, but ranked assistance with alien
vegetation clearing as the most popular incentive. Most landowners moreover believe
e extra finances needed to manage their natural vegetation.
Assistance, whether financial or by way of other support (labour, poison or equipment)
Agriculture, Working for Water and World Wildlife Fund for Nature. Money is available
islation
would be effective in practice. Apart from the unaffordable expense (Pence et al., 2003),
ervices to support conservation initiatives, for example
making available to landowners existing municipal resources to assist with fire
they do not have th
with alien vegetation clearing therefore has the potential to be a good conservation
incentive and indeed is currently offered under some circumstances. Money for alien
vegetation clearing is available under certain circumstances, from the Department of
for clearing water catchments, but the process of obtaining funding for alien clearing is
not transparent to farmers. Conservancies that motivate for funding may receive alien
clearing assistance usually in the form of herbicide and this in itself is an incentive to join
a conservancy.
It is unclear to what extent a more vigorous enforcement of alien clearing leg
landowners perceive that local government does not itself comply with legislation, but
rather adopts a position of ‘do as I say but not as I do’. The perceived inequity of
enforcement in these circumstances is evidently a factor in discouraging compliance by
landowners with the existing formal legal system. Local government would do well to
clear Schedule 1-3 declared weeds off municipal properties within their jurisdiction as a
clear indication of its own commitment to the law and the importance it places generally
on conservation.
Other municipal services as an incentive
The use of other municipal s
management, fencing and security, would promote a collaborative public-private culture
of conservation. Municipal assistance with fire management and alien clearing are
currently been offered by at least one local government. The cost to the private landowner
76

of utilising a public good service such as fire-fighting and prevention are very high.
Making available such services to private landowners for conservation purposes would
face the same difficulties as the introduction of a property tax rebate system, namely lack
of funding, the need to convince local government that conservation incentives are
necessary and the capacity within the local government to instigate them.
A property rate rebate as an incentive
A property rate rebate or exemption is highly recommended as a conservation incentive
because any economic gain could help reduce the costs of conservation and deliver a
good conservation message. Three issues are reviewed in trying to determine the extent to
which a rate rebate would be an incentive for private landowners, namely: (i) the
identification of what would persuade farmers to participate, (ii) the need to convince
municipalities of the benefit and (iii) the question of land value.
i) Identification of what would persuade landowners to participate in conservation
uctions already permitted for capital expenditure incurred in
agricultural development, the overall potential financial gain for the farmers, using such a
wever the symbolic significance for landowners
of a rebate system should not be overlooked.
Landowners rated a municipal property rate rebate highly as a conservation incentive,
confirming that a tax rebate for conserved land would convey the message that local
government is committed to conservation, even though the financial gain from any such
municipal rebate would only provide a marginal financial benefit to the farmer.
Since most renosterveld is remnant vegetation and in any event levied as agricultural
land, the rates of which have already been significantly reduced and after taking into
account the tax ded
property rebate system, would be low. Ho
It may be concluded that, however financially minimal, such a property rate rebate
system would have an important symbolic significance in demonstrating the local
government’s appreciation for the conservation efforts of landowners and public
commitment to addressing conservation. In addition, it would go some way towards
77

addressing the perception of many farmers that the new government is not committed to
supporting the agricultural industry, an impression gained since the removal of
agricultural subsidies and what are often seen as restrictive labour law and tenancy
regulations.
Combining fragments into conservancies would be more beneficial than individual efforts
in perpetuity. Placing conserved land into co-
operation agreements is a complex issue because such agreements are binding on future
reement because
race
under-utilised and accordingly available for expropriation and redistribution purposes (O.
of
hose
DF’s. ‘If
ministered through various government
departments or agencies and hence more difficult to redistribute for socio-political
but conservancies do not bind land
landowners (Merenlender et al., 2004). The majority of landowners in this research were
prepared to co-opt their natural land into a contractual conservation agreement and were
happy for Cape Nature to manage the natural fynbos on their property, but expressed a
strong unwillingness to sell this land to a conservation agency. Most were unaware that
such land would have to be conserved in perpetuity. It was also clear that most
landowners are reluctant to place their land under any legally-binding ag
they feel insecure about present land reform policies.
The majority of farms in South Africa are owned by the white minority population group.
The government is committed to redistributing thirty percent of farming land to other
groups by 2014 (Didiza, 2004). Some private landowners expressed concern that setting
aside land for conservation might indicate to government that these lands are unused and
Parker, farmer, pers. comm.). Landowners need to be reassured that all levels
government have a constitutitional mandate to protect the environment and that t
areas of conservation importance are now identified in the provincial and local S
conservation land is rezoned as a protected area through the correct procedures, any
resettlement without consideration of the biodiversity provisions would be in
contravention of multiple regulations ad
reasons’ (C Martens, pers. comm.).
78
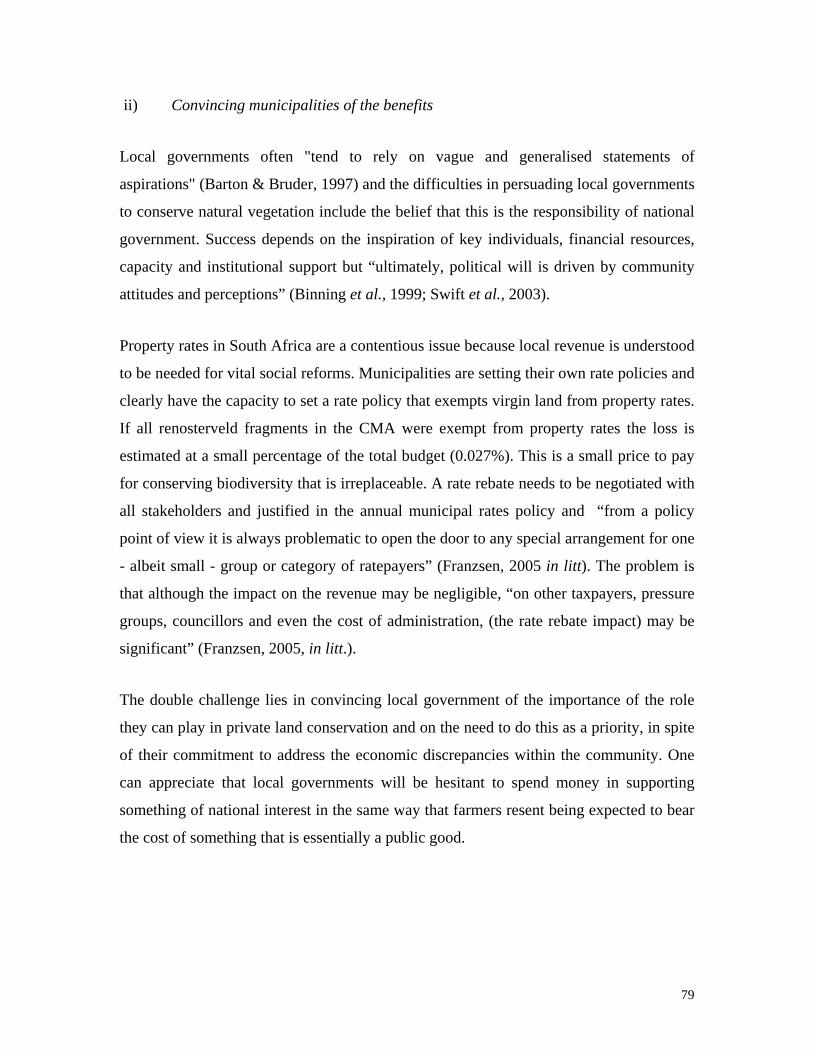
ii) Convincing municipalities of the benefits
Local governments often "tend to rely on vague and generalised statemen
aspirations" (
ts of
Barton & Bruder, 1997) and the difficulties in persuading local governments
to conserve natural vegetation include the belief that this is the responsibility of national
rebate needs to be negotiated with
all stakeholders and justified in the annual municipal rates policy and “from a policy
government. Success depends on the inspiration of key individuals, financial resources,
capacity and institutional support but “ultimately, political will is driven by community
attitudes and perceptions” (Binning et al., 1999; Swift et al., 2003).
Property rates in South Africa are a contentious issue because local revenue is understood
to be needed for vital social reforms. Municipalities are setting their own rate policies and
clearly have the capacity to set a rate policy that exempts virgin land from property rates.
If all renosterveld fragments in the CMA were exempt from property rates the loss is
estimated at a small percentage of the total budget (0.027%). This is a small price to pay
for conserving biodiversity that is irreplaceable. A rate
point of view it is always problematic to open the door to any special arrangement for one
- albeit small - group or category of ratepayers” (Franzsen, 2005 in litt). The problem is
that although the impact on the revenue may be negligible, “on other taxpayers, pressure
groups, councillors and even the cost of administration, (the rate rebate impact) may be
significant” (Franzsen, 2005, in litt.).
The double challenge lies in convincing local government of the importance of the role
they can play in private land conservation and on the need to do this as a priority, in spite
of their commitment to address the economic discrepancies within the community. One
can appreciate that local governments will be hesitant to spend money in supporting
something of national interest in the same way that farmers resent being expected to bear
the cost of something that is essentially a public good.
79

iii) Clarifying the question of conservation land value
aly, 1992) and the
potential global benefits compared to cost of nature conservation are vast (Balmford et
ling and Heijnis 2001) with a defined rating scale
could provide the conservation value to natural vegetation. Determining a rate rebate on
hould land with a higher market
value receive greater financial compensation for a hectare of alien-infested renosterveld
an a hectare of land of a lower market value where the farmer has paid to keep the
fragment clean. The prevention of overcompensation or misuse of exemptions has been
ddressed in the literature (Michael, 2003).
The issue of defining value is important because one of the big concerns about the rebate
route is how to determine the extent of the rebate (R Franzsen, 2005 in litt.). This raises
the question of conservation value, which is essential both in determining what land is
worthy of conservation and how this conservation value is defined.
Biodiversity is valued in terms of its natural capital (Constanza & D
al., 2002). Natural capital uses special methods to estimate value, such as contingent
valuation WTP (willingness to pay) and relatively high existence values were found for
biodiversity in South Africa with WTP in the fynbos biome approximately R21.50 ha-1
year-1 (Turpie et. al., 2003a). Value is described in different ways and Sinden (2004)
describes the indirect gains of conserving biodiversity having existence values, bequest
value and option values. Zhang & Li (2005) refer to value as “use-value or exchange-
value. “Exchange-value can be exchanged for a good to an individual, the WTP, or it can
be the exchange-value of a good to society, the price, and these two economic values are
often confused”.
Defining value is important as there is a need to determine a simple and robust value
scale. Biodiversity Habitat Units (Cow
agricultural land with differences in potential profitability and therefore a different
market value becomes complicated when both lands have a high conservation value. The
definition of conservation value in robust economic terms then becomes problematic.
Logically land of high conservation value should qualify for the lowest rural tax. If, by
way of example, the property rate for renosterveld were to be rebated on two fragments
of renosterveld of equally high conservation value, s
th
a
80

A rate rebate scheme could be guided by the municipal plan which accounts for every
hectare of land. The positive impact of a rate rebate for conservation far outweigh the
ety.
I. Promoting existing motivational incentives
extension service has “unfulfilled potential
difficulties in setting up such a scheme. It is recognised that local governments have a
responsibility to the community and the environment (Bateson, 2001). The challenge in
South Africa will be to persuade both local government and private landowners that all
biodiversity has a conservation value that will ultimately benefit soci
Motivational incentives
Motivational incentives that promote conservation have not yet been fully explored. Non-
financial motives shape human behaviour such as the desire to reciprocate, the desire to
gain social approval (Fehr & Falk, 2002), and ‘intrinsic satisfaction’ (De Young, 2000).
These motives can “interact with pecuniary incentives and can provide a deeper
understanding of the effects of pecuniary incentives and an understanding of how
psychological forces constitute incentives” (Fehr & Falk, 2002). Three aspects are
reviewed, namely: (i) promoting existing motivational incentives, (ii) linking biodiversity
to land reform and (iii) understanding motivational conservation behaviour.
Social research has recognized the importance of good extension officers on the ground
(NRF, Australia, 2004) and ‘nothing can surpass personal co-operation with private
landowners through direct extension in order to overcome misunderstandings,
communicate relevant information and to determine ways of satisfying varied individual
needs’ (McDowell, 1988).
Local research on the attitudes of farmers towards conservation has suggested that
landholders need more information and extension (McDowell, 1988; Winter, 2003). This
has been advocated for many years, but apart from pilot projects little or no regular
conservation extension presently exists. “One extension officer on the ground does more
than ten people in an office” (W Bester, farmer, pers. comm.) and although on the ground
conservation is time consuming an outgoing
81

for winning the hearts and minds of even the most “difficult” of landowners” (Mc
Dowell, 1988).
A ‘duty of care’ is expected from landowners. There is, however, a conservation ethic
among landowners who generally perceive themselves as conservationists at heart and
‘stewards’ of the land (Shogren, 2003). The Conservation Stewardship Project in
conjunction with the Department of Agriculture Area-Wide Planning initiative is
stewardship ethic on private lands (The
Conservation Stewardship Project, 2003). The Biodiversity and Wine Initiative (BWI)
his has been
recognized by conservation groups who try to ‘identify the champion’. Admired
nd expound the merits of conserving
renosterveld to neighbours, would have a far greater influence than other conservation
sted but not persued. A coordinated effort is needed to make
an eco-label effective in biodiversity marketing and the “growing and novel sources of
endeavouring to tie limited incentives to this
and Wines of South Africa (WOSA) have suggested to all grape farmers that the
promotion of biodiversity and sustainable wine production would be a good international
marketing tool and is in their best interest. The concept is an excellent one, but “BWI has
been slow in roll-out because we're trying to do it credibly” (T Hansen, in litt., 2005).
Although this strategy encourages farmers to protect and promote their renosterveld,
there are many private landowners with renosterveld who do not export wine and would
need the encouragement of other farmers to participate. The most efficient way to
influence landowners is to get other landowners to influence them and t
landowners who could claim conservation rebates a
efforts.
A ‘renosterveld friendly’ eco type label or a branded flagship species could be initiated
for all products produced by landowners participating in a renosterveld conservation
scheme and has been sugge
support; private philanthropy, premium pricing for biodiversity related goods via
certification schemes, need to tackle thorny issues of accountablility” (Balmford &
Whitten, 2003).
82
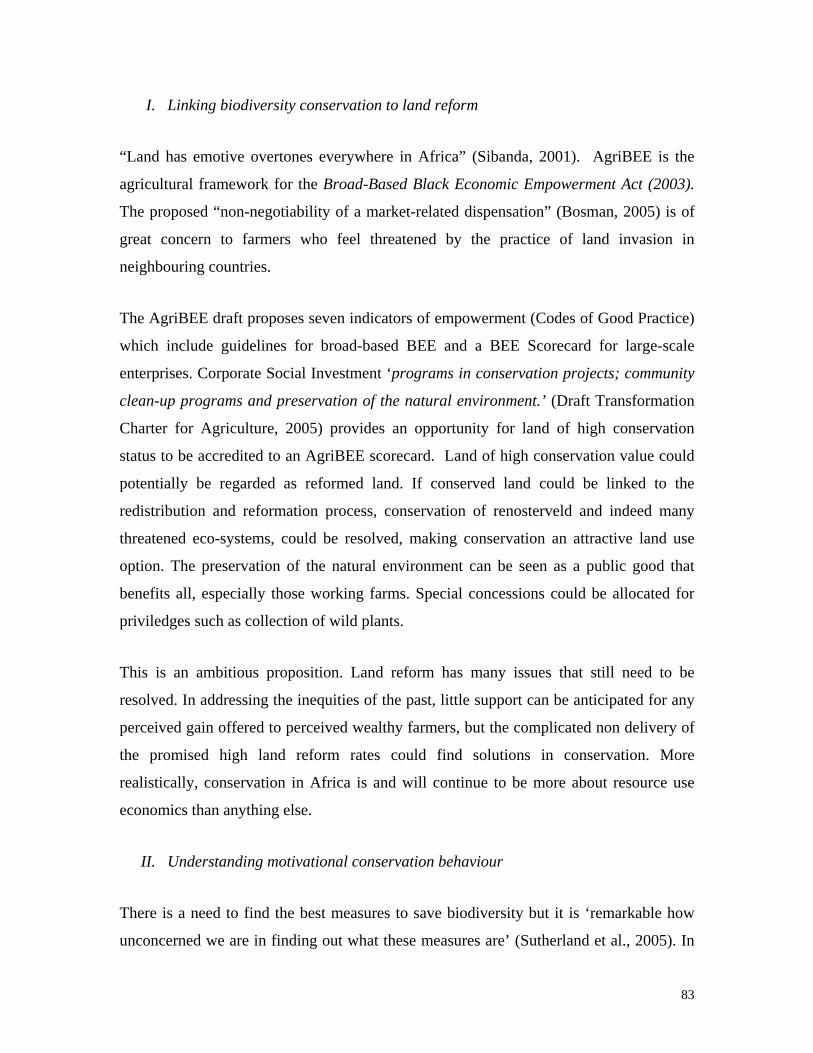
I. Linking biodiversity conservation to land reform
“Land has emotive overtones everywhere in Africa” (Sibanda, 2001). AgriBEE is the
This is an ambitious proposition. Land reform has many issues that still need to be
nding motivational conservation behaviour
There is a need to find the best measures to save biodiversity but it is ‘remarkable how
unconcerned we are in finding out what these measures are’ (Sutherland et al., 2005). In
agricultural framework for the Broad-Based Black Economic Empowerment Act (2003).
The proposed “non-negotiability of a market-related dispensation” (Bosman, 2005) is of
great concern to farmers who feel threatened by the practice of land invasion in
neighbouring countries.
The AgriBEE draft proposes seven indicators of empowerment (Codes of Good Practice)
which include guidelines for broad-based BEE and a BEE Scorecard for large-scale
enterprises. Corporate Social Investment ‘programs in conservation projects; community
clean-up programs and preservation of the natural environment.’ (Draft Transformation
Charter for Agriculture, 2005) provides an opportunity for land of high conservation
status to be accredited to an AgriBEE scorecard. Land of high conservation value could
potentially be regarded as reformed land. If conserved land could be linked to the
redistribution and reformation process, conservation of renosterveld and indeed many
threatened eco-systems, could be resolved, making conservation an attractive land use
option. The preservation of the natural environment can be seen as a public good that
benefits all, especially those working farms. Special concessions could be allocated for
priviledges such as collection of wild plants.
resolved. In addressing the inequities of the past, little support can be anticipated for any
perceived gain offered to perceived wealthy farmers, but the complicated non delivery of
the promised high land reform rates could find solutions in conservation. More
realistically, conservation in Africa is and will continue to be more about resource use
economics than anything else.
II. Understa
83
trying to understand what incentives would motivate or influence a private landowners’
decision to conserve, social psychological research tries to understand human behaviour
Interdisciplinary research is slowly emerging and fields such as ecological economics and
s have a strong emotional connection and
attachment to their land and that future generations are important. Penn (2003) states that
project depends not only on ecological data but social
mechanisms (Mathevet & Mauchamp, 2005). Alcoa World Aluminium in Australia
ot only because of changing
community attitudes and expectations but because people within the workforce did not
and the way in which it influences individuals. The challenge in conservation is to try and
positively change the way that people behave, in a way that benefits conservation. This is
critical in a world where there is ‘a dwindling awareness of biodiversity among the
citizenry of most countries’ (Cowling, 2004).
environmental psychology are addressing environmental issues (Penn, 2003).
Conservation psychology is trying to understand why people act in an environmentally
unsustainable way (Clayton & Brook, 2005) and until recently this has not been a focus
of conservationists. Clayton & Brook (2005) propose that ‘behaviour impacting the
natural environment is a product of a person’s situational context, past experiences, and
motivations’ and if actions are clearly understood, more environmentally friendly
behaviour can be promoted.
There is an individualistic side to human behaviour, but ‘people are generally influenced
by the larger spheres within which they are embedded, such as ethnic groups, professions,
communities and states’ (Hanna et al., 1996). This research emphasises the importance of
heritage to farmers and suggests that farmer
‘humans place greater emphasis on their family than the common good’ and this is
important when promoting conservation, because appeals should be made to landowners
to conserve for their children and future generations, rather than to save biodiversity for
the population at large.
The success of a conservation
relinquished some of their bauxite reserves for biodiversity, n
want to work for a company that does not care for the environment (Gardner &
Stoneman, 2003; C Grant, Alcoa World Aluminium, pers. comm.). More communication
84

should be channelled through social or informal networks (Brook et al., 2003) and in this
research it was interesting how many farmers were motivated by the prospect of joining a
conservancy, not only because of the funding benefits, but because it pleased their
neighbours and brought them together.
Farmers are very influenced by their networks, by traditions and by other farmers. These
undefined networks drive social pressure. People’s ‘attitudes and behaviour towards the
pact that social pressure can have on conservation is not yet
fully appreciated or explored (Penn, 2003 ; Fehr & Falk, 2002) and understanding the
. Conservationist need to urgently communicate the problem of
biodiversity loss to a world that is influenced by television and advertising and does not
natural world will remain intimately influenced by their social structures’ (Hamilton,
2001) and ‘being better than the Jones’’ is an important motivation in human nature. If
motivational incentives could be constructed in a way that influences landowners and
those in their social network to believe that because they conserve renosterveld they are
‘better than the Jones,’’ conservationists would be a great deal closer to achieving
conservation goals. Penn (2003) states that “humans are highly social animals that care
about their reputation, and social pressure appears to provide a strong incentive to change
behaviour”. The powerful im
way that farmers think about conservation, or what motivates them to conserve and then
changing their behaviour so that they want to conserve, opens a new ambit of research.
Social marketing provides another strategy to change the way that people think about
conservation (Kotler et al., 2002). “Perhaps the biodiversity sector needs to take a leaf out
of the advertising manual and start investing in using the media more effectively to
change human behaviour”(Cowling, 2004). As Penn (2003) suggests “advertisers are
fuelling runaway consumption by exploiting our instinctive desires to maintain status in
society and attract mates”
appreciate that there is a problem and indeed many landowners are unaware that
renosterveld is in need of conservation. Advertising needs to exert social pressure to the
benefit of conservation.
85

In Summary
If we want to manage the natural world successfully for the long-term benefit of all
people, we need to understand why humans behave in the way that they do (Siegfried,
2002). This ultimately depends on “a good appreciation of the reality of the human
s
identified as decisive in motivating landowners to conserve but rather, a raft of
condition” (Hamilton, 2001). If private landowners are to keep the renosterveld on their
farms, they must want to save renosterveld.
Whilst opportunity costs for preserving renosterveld do exist, landowners’ actual and
perceived income benefit from utilising existing renosterveld for other purposes is lower
than their current income. For this reason, unless renosterveld is rezoned for other land
use or current legislative protections in place continue to be ignored, it is at present not
highly threatened.
Long-term reliance cannot be placed on the present situation continuing and given the
paucity of renosterveld, every effort should be made to preserve the remaining fragments.
Whilst landowners generally indicate that they will keep the existing renosterveld on their
land, they need to be motivated with incentives to do so. No single incentive wa
incentives, both financial and motivational.
On the financial side, a municipal property rebate system is clearly attractive to farmers;
however, while local government has the power to initiate this, its capacity to do so at
present is uncertain. Any financial incentive would therefore also need to be supported
by social and psychological motivators: public acknowledgement of prior stewardship,
clear communication channels and an uncomplicated national commitment to
conservation are all factors which this research suggests could provide the necessary
support to conserve renosterveld.
86

87
7. REFERENCES
Economic Incentives. John Hopkins
Adamson, R.S. (1938) The Vegetation of South Africa. Monographs of British Empire Vegetation. London.
Anderson, F.R., A.V. Kneese, P.D. Reed, S. Taylor and R.B. Stevenson. (1977) Environmental Improvement throughUniversity Press. USA.
Anderson, M.S. (2003) The Use of Economic Instruments for Environmental Policy - a Half Hearted Affair. Accessed on 15/11/06 at: http:/www.iisd.ca/linkages/consume/skou.html
Balmford, A., A. Bruner, P. Cooper, R. Costanza, S. Farber, R.E. Green, M. Jenkins, P. Jefferiss, V. Rayment, S.
Jessamy, J. Madden, K. Munro, N. Myers, S. Naeem, J. Paavola, M. Rosendo, J. Roughgarden, K. Trumper and R. Kerry Turner. (2002)
Economic Reasons for Conserving Wild Nature. Science 297 (5583) 950-953.
essed on 18/08/2003 at : http://www.envirolaw.co.za/Envirolaw/Background
Balmford, A. and T. Whitten. (2003) Who should pay for tropical conservation, and how should the costs be met. Oryx 37 (2) 238-250.
Barton, H., and N. Bruder. (1997) A guide to local environmental auditing. Earthscan Publication Ltd, London.
Barnard, D. (2002) Environmental Law. Acc
Binning, C. and M. Young. (1999) Conservation Hindered: The impact of local government rates and State land taxes on the conservation of native vegetation. CSIRO Wildlife & Ecology, Research & Development Corporation, Canberra.
Bateson, P. (2001) Incentives for Sustainable Land Management: Community cost sharing to conserve biodiversity on private lands. A guide for local government. Revised edition. Environment Australia, Canberra and Environs Australia, Melbourne.
Bennett, A., G. Blackhouse and T. Clark. (1995) People and Nature Conservation Perspectives on Private Land Use and Endangered Species Recovery. Transactions of the Royal Zoological Society of New South Wales, Australia.

Binning, C. (2000) Thinking Bush : Science for managing native vegetation in Australian
Binning, C. and M. Young. (2003) Talking to the taxman about Nature Conservation.
tive vegetation. CSIRO Wildlife & Ecology, Research & Development Corporation, Canberra.
Bomha , M. Rouget, and W. Thuiller. (2005) Potential impacts of
future land use and climate change on the Red List status of the Proteaceae in the
Bosma
landscapes.
Proposals for the introduction of tax incentives for the protection of high conservation value na
rd, B., D.M. Richardson, J.S. Donaldson, G.O. Hughes, G.F. Midgley, D.C.Raimondo, A.G. Rebelo
Cape Floristic Region, South Africa. Global Change Biology 11 (9) 1452.
n, L. (2005) Agri SA will look soberly at Land Summit demands. Accessed on 20/01/06 at http://www.agriinfo.co.za/
Botha,
Africa, Claremont, Cape Town.
7.
Brook, A., M. Zint and R. de Young. (2003) Some psychological aspects of an n behaviour.
et
M. (2001) Incentives for conservation on private lands: options and opportunities. Cape Conservation Unit, Botanical Society of South Africa, Claremont, Cape Town.
Botha, M. (2002) Tax Amendment Proposals to facilitate conservation. Cape Conservation Unit, Botanical Society of South
Boucher, C. (1980) Notes on the use of the term “Renosterveld”. Bothalia 13 (1&2) 23
endangered species act listing: Private landowners’ conservatioConservation Biology 17: 1638-1649.
Carter, J. (2004) Integrating planning and budgeting at the local level. IDASA budgwatch. Accessed on 20/01/06 at: www.idasa.org.za/gbOutputFiles. asp?WriteContent=Y&RID=690
Causley, I. (2001) Public Good Conservation: Our Challenge for the 21st Century. House
Chudleigh, P. and S. Simpson. (2000) Review of the Landcare Taxation Rebate. Agtrans
Clark, Conservation in the United States. (republished in 11 Journal of Environmental
of Representatives, Standing Committee on Environment and Heritage. Parliament of the Commonwealth of Australia. Canberra, Australia.
Research, Brisbane, Australia.
D. and D. Downes. (1995) What Price Biodiversity? Economics and Biodiversity
88

Law & Litigation 9: 1996) [BW96-8]. Accessed on 15/10/04 at http://www.ciel.org/Publications/summary.html
) 87-
Constanza, R. and H.E. Daly. (1992) Natural Capital and Sustainable development.
Coopernd
Development. Greenwich, CT: JAI Press. 1: 129-169.
Cowlin & Vegetation, in: Cowling, R.M. (Ed.) The Ecology of Fynbos. Nutrients, Fire & Diversity. Oxford University Press,
Cowling, R.M., and D.M. Richardson. (1995) Fynbos: South Africa’s Unique floral Kingdom. Fernwood Press.
Cowlinbiodiversity entities for a systematic conservation planning in the Cape Florisitc
Cape
Cowling, R.M. and R.L. Pressey. (2003b) The expert or the algorithm? – comparison of
2: 147-167.
Cowling, R.M., R.L. Pressey, M. Rouget, and A.T. Lombard. (2003c) A conservation
Cowling, R.M. (2004) The process of mainstreaming: conditions, constraints and
Conservation – Impact of Environmental Measures Imposed on Landholders,
Clayton, S. and A. Brook. (2005) Can Psychology Help Save the World? A Model for Conservation Psychology. Analysis of Social Issues and Public Policy 5 (1102.
Conservation Biology 6: 37-46.
rider, D.L. and S. Srivastva. (1987) Appreciative Inquiry into Organizational Life. In W. Pasmore and R. Woodman (Eds.) Research in Organization Change a
g, R.M. and P.M. Holmes, (1992) Flora
Cape Town. 23-61.
g. R.M. and C.E. Heijnis. (2001) The identification of broad habitat units as
Region. South African Journal of Botany 67: 15-38.
Cowling, R.M. (2003a) Introduction to systematic conservation planning in the Floristic Region. Biological Conservation 112: 1-13.
priority conservation areas in the Cape Floristic Region identified by park managers and reserve selection software. Biological Conservation 11
plan for a global diversity hotspot- the Cape Floristic Region, South Africa. Biological Conservation 112: 191-216.
prospects. Innovating Conservation. Cape Partners conference, Kirstenbosch, Newlands, South Africa.
Crosthwaite, J. (2000) Farmer Land Stewardship : A Pillar to Reinforce Natural ResourceManagement? Australian Conservation Foundation. Inquiry into Public Good
89

House of Representatives Standing Committee on Environment Australia.
and Heritage,
De Wet, J. and Erasmus, Z. (2005) Towards Rigour in Qualitative Analysis. Qualitative
De Young, R. (2000) New ways to promote environmental Behavior: Expanding and
Didiza, A.T. (2004) AgriBEE: Broad-Based Black Economic Empowerment Framework
Dey, I. (1993) Managing data, Creating categories, and assigning categories. In Qualitative Data Analysis: A User-friendly Guide for Social Scientists 75-82.
Research Journal 15 (1).
Evaluating Motives for Environmentally Responsible Behavior. Journal of Social Science 56 (3) 509-526.
for Agriculture. Department of Agriculture. Accessed on 16/08/05 at: http://www.nda.agric.za/
Donald, P.F. (2004) Biodiversity Impacts of Some Agricultural Commodity Production
Donaldson, J.S. (2002) Biodiversity and Conservation Farming in the Agricultural Sector rica.
SA.
.
1/06
Systems. Conservation Biology 18: 17-37.
in: Mainstreaming Biodiversity in Development: Case Studies from South AfPierce, S. M., R. M. Cowling, T. Sandwith, and K. MacKinnon. (Eds.) The WorldBank Environment Dept. 818 H Street, Washington, U
Doremus, H. (2003) A Policy Portfolio approach to biodiversity protection on private lands. Environmental Science and Policy 6 (3) 217-232
Draft Transformation Charter for Agriculture. (2005) Broad-Based Black Economic Empowerment. AgriBEE. AgriBEE Steering Committee. Accessed on 20/0at: http://www.nda.agric.za/docs/agribee/AgriBEECharter.pdf
Erickson, D.L., R.L. Ryan, and R. De Young. (2002) Woodlots in the rural landscape: landowner management attitudes in a Michigan (USA) case study. LandscapUrban Planning 58: 101-112.
e and
90

Europe ental Agency. (2002) Environmental Signals 2002, Benchmarking the Millenium. Environmental Assessment Report No 9. (Office for the
)
02-chap06.pdf
Fairbanks, D.H.K., C.J. Hughes and J.K. Turpie. (2004) Potential impact of viticulture
Farrier, D. (1995) Conserving biodiversity on private land: incentives for management or compensation for lost expectations? Accessed on 16/03/05 at:
an Environm
Publications of the European Communities, Copenhagen, Demnark, 2002Accessed on 16/08/05 at: http://reports.eea.eu.int/environmental_assessment_report_2002_9/en/signals20
expansion on habitat types in the Cape Floristic Region, South Africa. Biodiversity and Conservation 13: 1075-1100.
http://www.lib.ttu.edu/playa/rights/r995-04.htm
Fehr, E. and A. Falk. (2002) Psychological foundations of incentives. European
Fieldin omputer Analysis and Qualitative Research, Sage, London. pp. 21-55.
Fieldin
.
e
s:
siness/mining/paperjgardner.pdf
Economic Review 46: 687-724.
g, N. and R. Lee. (1998) Approaches to Qualitative Analysis: In C
g, N. and R. Lee. (1998) Managing Data in CAQDAS. Computer Analysis and Qualitative Research, Sage, London. pp. 86-118.
Flick, U., E. von Kardoof and I. Steinke. (2004) A Companion to Qualitative ResearchSage Publications. London.
Frazee, S.R., R.M. Cowling, R.L. Pressey, J.K. Turpie and N. Lindenberg. (2003) Estimating the costs of conserving a biodiversity hotspot: a case-study of the CapFloristic Region, South Africa. Biological Conservation 112: 275-290.
Gardner, J.H., and G. Stoneman. (2003) Rehabilitating mines to meet land use objectiveBauxite Mining and Conservation of the Jarrah Forest in South-West Australia. Unasylva, 207: 3-8. Accesed on 20/01/06 at : http://www.iucn.org/themes/bu
Gelderblom, C.M., B.W. van Wilgen, J.L. Nel, T. Sandwith, M. Botha and M. Hauck. (2003) Turning strategy into action: implementing a conservation action plan in the Cape Floristic Region. Biological Conservation 112: 291-297.
Gibbs, G.R. (2002) Qualitative Data Analysis – Exploration with NVivo. Open University Press. Buckingham. UK.
91

Glaser, B. (1992) Basics of Grounded Theory Analysis. Mill Valley: Sociology Press.
Glaser, gies
Glazewski, J. (2005) Environmental Law in South Africa. 2 Ed. Lexis Nexis Butterworth, Durban, South Africa.
e
versity: towards sustainable agriculture in
B. G., and A. L. Strauss. (1967) The Discovery of Grounded Theory. Stratefor Qualitative Research. Aldine Publishing Co, Chicago, Il, USA.
nd
Green, R.E., S.J. Cornell, J.P.W. Scharlemann and A. Balmford. (2005) Farming and thFate of Wild Nature. Science 307 (5709) 550-555.
Grote, U. (2002) Eco-labelling in the agricultural sector: an international perspective. High-level Pan-European Conference on Agriculture and Biodiintegrating biological and landscape diversity forEurope. Maison de l'Unesco, Paris, France. Accessible on 11/10/03 at: www.nature.coe.int/conf_agri_2002/agri08e.01.doc
mb. (1997) ConservatiHale, P. and D. La on Outside Nature Reserves. Centre for
Halweil, B. (2002) State of the World 2002. Worldwatch Institute. WW Norton & Co.,
Hamilton, A. (2001) Hum
Hammersley, M. and P. Atkinson. (1983) Ethnography. Principles in Practise, London,
Hanna,nd Press,
Heyden 5) The sustainable use of the ymposium. Flora
from the Agulhas Plain at the southern tip of Africa. Oryx 33: 256-269.
Conservation Biology, University of Queensland, Australia.
500 5th Ave, New York.
an Nature and the Natural World. Watkiss Studios Ltd, Biggleswade, Beds, New Millennium, United Kingdom.
Tavistock.
S., C. Folke and K-G. Maler. (1996) Rights to Nature Ecological, Economic, Cultural, and Political Principles of Institutions for the Environment. IslaWashington DC, USA.
rych, B.J., C. Burger and C. Oberholtzer. (199western cape lowlands. Can this be achieved? Proceedings of a sConservation Committee. Botancial Society of South Africa.
Heydenrych, B.J., R.M. Cowling and T.H. Trinder-Smith. (1999) Strategic conservationinterventions in a region of high biodiversity and high vulnerability: a case study
Hilty, J. and A.M. Merenlender. (2003) Studying Biodiversity Private Lands. Conservation Biology 17 (1) 132-137.
92

James, S.M. (2002) Bridging the Gap between Private Landowners and Conservationists. Conservation Biology 16: 269-271.
Kabii, ure Conservation on Private Lands, Australia. Accessed on 11/03/06 at:
T. (2003) Forum presentation Notes to the National Trust Forum Nat
http://www.ntwa.com.au/forum/paperTKabii.pdf
Katz Commission (1998) The Implications of Introducing a Land Tax in South Africa. 8th Interim Report of the Commission of Inquiry into certain aspects of the Tax Structure of South Africa.
Kemp, D. (2003) Tax incentives for conservation extended. Joint media release, Commonwealth Minister for Environment and Heritage (D Kemp), Commonwealth Minister for Revenue. Accessed on 15/08/04 at: http://assistant.treasurer.gov.au/atr/content/pressreleases/2003/008.asp
Kemper, J., R.M. Cowling and D.M. Richardson. (1999) Fragmentation of South African ation
Austral Ecology 25: 179-186.
ccessed on 10/01/06 at: 0Le
renosterveld shrublands: effects on plant community structure and conservimplication. Biological Conservation 90: 103-111.
Kemper, J., R.M. Cowling, D.M. Richardson, D.D. Forsyth and D.H. McKelly. (2000) Landscape fragmentation in South Coast Renosterveld, South Africa, in relation to rainfall and topography.
Knight, R.L. (1999) Private Lands, The Neglected Geography. Conservation Biology 13 (2) 223-224.
Koelle, B.R.I., and N.M. Oettle. (2003) Myths, Legends and Nature … Farming as an emotional enterprise. Ahttp://www.nbi.ac.za/consfarm/cfdownloads/Koelle,%20Oettle%20Myths,%2gends%20and%20Nature.pdf
.L. Roberto, N. Roberto and N. Kotler, P., E Lee. (2002) Social Marketing: Improving the
Krug, C
Quality of Life. Sage Publications Inc.
.B. (2004a) Practical Guidelines for the Restoration of Renosterveld. University of Stellenbosch, South Africa.
Krug, C. B., R.M. Krug, D.M. Iponga, B.A. Walton and S.J. Milton. (2004b) Restoration of West Coast Renosterveld: facilitating the return of a highly threatened vegetation type. Proceedings 10th Medecos Conference, Rodes, Greece. Arianoutsou & Papanastasis (Eds.) Millpress, Rotterdam.
93

Kurkalova, L., C. Kling and J. Zhao. (2003) Green Subsidies in Agriculture: Estimating the Adoption Costs of Conservation Tillage from Observed Behavior. Working paper 01-WP 286. Center for Agricultural and Rural Development. Iowa State
Langho ned Parks and the Protection of Tropical Biodiversity. PhD Thesis. Cornell University, USA.
Langhoe Refuge Program. Conservation Biology 1735-1743.
hen does ental
Latimer, A.M., J.A. Silander, A.E. Gelfand, A.G. Rebelo and D.M. Richardson. (2004)
:
Comment on Coffey,Holbrook and Atkinson’. Sociological Research Online 1 (4). Accessed on 15/11/05 at:
University, USA.
lz, J. (1999) Conservation Cowboys: Privately-Ow
lz, J., J. Lassolie and J. Schelas. (2000) Incentives for Biological Conservation: Costa Rica's Private Wildlif
Langpap, C. and J. Wu. (2004) Voluntary conservation of endangered species: wno regulatory assurance mean no conservation? Journal of EnvironmEconomics and Management 47: 435–45.
Quantifying threats to biodiversity from invasive alien plants and other factors: a case study from the Cape Floristic Region. South African Journal of Science 10081.
LAW, 2003. Arrangements to Enhance the Effective Use of Incentive Mechanisms in Natural Resource Management. Land and Water Australia Research Project AGT13.
Lee, R. M & Fielding, N. (1996) ‘Qualitative Data Analysis: Representations of a Technology:A
http://www.socresonline.org.uk/socresonline/1/4/1.f.html
H.P. (2003) The radiation of the Cape Flora, southern Africa. Biological Reviews. Cambridge Universit
Linder,y Press. 78: 597-638.
ristic Region. Proceedings of a Symposium. FCC report 1995/4. Botanical Society of South Africa, Kirstenbosch,
MacDonald, I. (1994) In: An Overview of The Importance of Conserving Natural
Manue 05.
Low, A.B. and F.E. Jones. (Eds.) (1994) The sustainable Use and Management of Renosterveld Remnants in the Cape Flo
Cape Town.
Remnant Vegetation. Low & Jones (Eds.) Proceedings of a Symposium. FCC report 1995/4. Botanical Society of South Africa, Kirstenbosch, Cape Town.
l, T. (2005) Mid-term budget speech, Cape Times 27 Oct 20
94
Mathevet, R. and A. Mauchamp. (2005) Evidence-based conservation: dealing with social issues. Trends in Ecology 20 (8) 422-423.
McDowell, C.F. (1988) Legal strategies to optimize conservation of natural ecosystems by private landowners – Economic incentives. PhD Thesis. Fitzpatrick Institute
McDowell, C.F., R. Sparks, J. Grindley and E. Moll. (1998) Persuading the landowner to
sense.pdf
Library, UCT.
conserve natural ecosystems through effective communication. Journal of Environmental Management 28: 211-225.
McClard, A.,D. & S. Pettit-Brown. (2003) Making sense of qualitative results: a systematic approach. Doxus LLC. Atlanta, Georgia. Accessed at: ttp://www.doxus.com/attachments/Making_
McKee, J., D. Kristy, W. Moss and L. Pullen. (2005) “From developed grants … to babysitting. Broadening the horizon of incentives.” Accessed on 10/02/06 at: http://www.agric.uwa.edu.au/ARE/AARES/Conf2005/PapersPDF/DaltonAARES2005.pdf
Mcosano, O.P.M. (2005) Estimating the Opportunity Costs of Biodiversity Conservation
Merenl . (2004) Land Trusts and Conservation Easements: Who Is Conserving What for Whom? Conservation
Michael, J.A. (2003) Efficient habitat protection with diverse landowners and fragmented
Miltonral capital in southern African rangelands. Frontiers in Ecological
Environment 1 (5) 247-254.
Mohr,
McNeely, J.A. (1988) Economics and Biological Diversity: Developing and Using Economic Incentives to Conserve Biological Resources. IUCN, Switzerland.
in Western Cape, South Africa. MSc Thesis, Percy FitzPatrick Institute, University of Cape Town, South Africa.
ender, A.M., G.G. Huntsinger, G. Guthey and S. K. Fairfax
Biology 18: 65-75.
landscapes. Environmental Science and Policy 6: 243-251.
, S.J., W.R.J. Dean and D. M. Richardson. (2003) Economic Incentives for restoring natu
P.J. and L.J. Fourie, (1995) Economics for South African Students. UNISA, Pretoria, South Africa.
95

Moll, E.J., B.M. Campbell, R.M. Cowling, L. Bossi, M. L. Jarman and C. Boucher. (1984) A description of major vegetation categories in and adjacent to the Fynbos biome. South African National Scientific Programmes Report No 83.
Morris n mental Schemes in the U.K. Journal of Rural Studies (1) 51-63.
National Farmers Federation, Australia (NFF). (2002) Accessed on 11/04/04 at :
, C. and C. Potter. (1995) Recruiting the New Conservationists: Farmers’ Adoptioof Agri-Environ
Myers, N., R.A. Mittermeier, C.G. Mittermeier, G.A.B. da Fonseca and J. Kent. (2000) Biodiversity hotspots for conservation priorities. Nature 403: 853-858.
http://www.nff.org.au/pages/policies.html#en
rn, D., S. Reed, P. Berck and A. Merenlender. (2005) ENewbu conomics and Land-Use Change in Prioritizing Private Land Conservation. Conservation Biology 19:
Niesenlinary Is Our Teaching? Conservation Biology 17 (1) 6-10.
Parkhu en, C. Bastian, P. Kivi, J. Donner, and R.B.W. Smith. (2002)
n Planet Institute pp. 31-52.
and strategies for the Agulhas Plain, South Africa: a financial
perspective. Biological Conservation 112: 253-273.
1411-1420.
baum, R.A. and T. Lewis. (2003) Ghettoization in Conservation Biology: How Interdiscip
Norton, D.A. (2000) Conservation Biology and Private Land: Shifting the Focus. Conservation Biology 14 (5) 1221-1223.
OECD (2004) Recommendations of the Council on the Use of Economic Instruments in Promoting the Conservation and Sustainable Use of Biodiversity.
Orr, D.W. (1994). Professionalism and the Human Prospect. Conservation Biology 8 (1) 9-11.
rst, G.M., J.F. ShogrAgglomeration Bonus: an incentive mechanism to reunite fragmented habitat for biodiversity conservation. Ecological Economics (41) 305-328.
Paterson, S. (2005) “Property Tax: A friend or Foe to Landscape Protection in South Africa’. Paper presented at 9th International Environmental Law Conference, SauPaulo,Brazil and published in Landscape Nature and Law (Conference Proceedings), Law for a Gree
Pence, G.Q.K., M.A. Botha, and J.K. Turpie. (2003) Evaluating combinations of on-off-reserve conservation
96
Penn, D.J. (2003) The Evolutionary Roots of our Environmental Problems: TowardsDarwinian Ecology. The Quarterly Review of Biology 78 (3) 275-301.
a
Pierce, S.M., R.M. Cowling, A.T. Knight, A.T. Lombard, M. Rouget and T.Wolf. (2005)
conomics and Management 25: 22-47.
Pressey ne-Wright, and P.H. Williams (1993) Beyond Opportunism: Key Principles for Systematic Reserve Selection.
Pressey, R.C. (1994) Ad Hoc Reservation:Forward or Backward Steps in Developing Representative Reserve Systems? Conservation Biology 8 (3) 662-668.
Pressey targets for biodiversity pattern and process in the Cape Floristic Region, South Africa.
Rebelo, A.G. (1992a) Red Data Book Species in the Cape Floristic Region: Threats,
Systematic conservation planning products for land-use planning: Interpretation for implementation. Biological Conservation 125 (4) 441-458.
Polasky, S. and H. Doremus. (1998) When the Truth Hurts: Endangered Species Policy on Private Land with Imperfect Information. Journal of Environmental E
, R.L., C.J. Humphries, C.R, Margules, R.I. Va
Tree 8 (4) 124-128.
, R.L., R.M. Cowling and R. Rouget. (2003) Formulating conservation
Biological Conservation 112: 99-127.
priorities and target species. Transactions of Royal Society, South Africa. 48: Part 1.
Rebelo, A.G. (1992b) Preservation of biotic diversity in: Cowling, R.M. (Ed.) The Ecology of Fynbos. Nutrients, Fire & Diversity. Oxford University Press, Cape Town. pp. 309-344.
Richardson, D., M. Rouget, R.M. Cowling and J.W. Lloyd. (2002) Current Patterns of Habitat Transformation and Future Threats to Biodiversity in Terrestrial Ecosystems of The Cape Floristic Region, South Africa. Accessed on 29/11/04 at: http://www.conbio.org/scb/Activities/Meetings/2002/abstracts/symposia/sympseven.cfm
son, D.P., and R.B. Hull. (2001) Beyond Biology: toward a More Publicfor Conservation. Conservation Biology 15: 970-979.
Robert Ecology
Rosenzweig, M.L. (2003) Win-Win Ecology. How the Earth’s Species Can Survive in the Midst of Human Enterprise. Oxford University Press, Oxford.
97

Rouget, M., D.M. Richardson, R.M. Cowling, J.W. Lloyd, and A.T. Lombard. (2003) Current patterns of habitat transformation and future threats to biodiversity in terrestrial ecosystems of the Cape Floristic Region. Biological Conservation 112:
Rural M t: Townhttp//www.capetown.gov.za/planning/rural/pdf/rural.pdf
Ryan, Riparian zones in a Midwestern agricultural
watershed. Journal of Environmental Planning and Management 46 (1) 19-37.
Savy, Cth Africa: Attitudes, economics and potential incentives.
MSc. Thesis. University of Cape Town.
SAWISProduction and Market Estimates 2004-2008. A publication of SAWIS. Paarl,
SAWIS ormation and Market estimates. A Publication of SAWIS. Paarl, South Africa.
Scherr,h Challenges of "Ecoagriculture". The Equator Initiative. IIED.
Accessed on 15/08/04 at: www.undp.org/equatorinitiative/docs/egoagriculture.doc
63-85.
anagement Framework for the City of Cape. (2002) Accessed a
., D. Erikson, R. De Young. (2003) Farmers’ motivations for adopting conservation practices along r
. (2003) Conserving Wattled Crane (Grus carunculatus) on private land in KwaZulu-Natal, Sou
(2003) South Africa Wine Industry Information and Market estimates.
South Africa.
(2005) South Africa Wine Industry Inf
S.J., and J.A. Mc Neely (2002) Reconciling Agriculture and Biodiversity:Policy and Researc
Seely, in y conservation. Journal of Arid Environments 54: 155-164.
ental
Sibanda, S. (2001) Land Reform and Poverty Alleviation in South Africa. Paper presented at the SARPN conference on Land Reform and Poverty Alleviation in
M.K., J. Zeidler, J.R. Henschel and P. Barnard. (2003) Creative problem solving support of biodiversit
Shogren, J.F., G.M. Parkhurst and C. Settle (2003) Integrating economics and ecology toprotect nature on private lands: models, methods, and mindsets. EnvironmScience and Policy 6: 233-242.
Southern Africa, HSRC, Pretoria. Accessed on 20/01/06 at: www.sarpn.org.za/Eventpapers/Land/20010604Sibanda
Siegfried, R. (2002) Keeping the Rainbow. The Environmental Challenge for Africa and the World. Africa Geographic. Cape Town, South Africa.
98
Sinclair, A.R.E., D. Ludwig and C. W. Clark. (2000) Conservation in the Real World. Science 289 (5486) 1875.
Sinden, J.A. (2003) Estimating the opportunity costs of biodiversity protection in the
Brigalow Belt, New South Wales. Journal of Environmental Management 70:
Strauss, A. and J. Corbin. (1990) Basics of Qualitative Research: Grounded Theory
SunderMathevet and Mauchamp: Evidence-based conservation: dealing with social
Swift, B., S. Bass, L. Castelli, A. Akella, E. Corcuera, F. Fahsen, X. d. l. Macorra, D. Janzen, M. Orellana, K. Mott, P. Boland, J.J. Dada, J. Langholz, L. Paulson, S.
and aw
e on
Turpie, J.K., B.L. Heyde
erest,
Turpie, J.K. (2003c) An Ecological-econom
351-362.
Procedures and Techniques, Sage, Newbury Park, CA, USA.
land, W.J., A.S. Pullin, P.M. Dolman and T. M. Knight. (2005) Response to
issues. Trends in Ecology 20 (8) 424-425.
Yeatman and C. Chacón. (2003) Legal Tools and Incentives for Private LConservation in Latin America: Building Models for Success. Environmental LInstitute. Washington, DC, USA.
Tikka, P. M. and R. Kauppi. (2003) Introduction to special issue: Protecting NaturPrivate Land-from Conflicts to Agreements. Environmental Science and Policy 6 (3) 193-194.
Turpie, J.K. and Heydenrych, B. (2000) Economic consequences of alien infestation of the CFK fynbos’ vegetation. In The Economics of Agricultural Invasions. Perrings, Williamson, M. Dalmazzone, (Eds.) Edward Elgar, Cheltenham, England.
nrych and S. J. Lamberth. (2003a) Economic value of terrestrial and marine biodiversity in the Cape Floristic Region: implication for defining effective and socially optimal conservation strategies. Biological Conservation 112: 233-251.
Turpie, J.K. (2003b) The existence value of biodiversity in South Africa: how intexperience, knowledge, income and perceived level of threat influence local willingness to pay. Ecological Economics 46: 199-216.
ic appraisal of conservation on commercial farm land in four areas of South Africa. Final Report of the Ecological-Economic Research Component of the Conservation Farming Project. National Botanical Institute, South Africa.
99

Urban Edge Report. (2004) Accessed on 13/11/05 at: http://www.capetown.gov.za/edgeguidelinesmanual/UrbanEdgeGuidelinesManualmay2004.pdf.
USDA.nrcs.usda.gov/programs/farmbill/2002/funding.html
:United States Department of Agriculture (2003) accessed on 11/08/05 at: http://www
in-ainstreaming
Biodiversity in Development. Case Studies from South Africa. World Bank, 1818
von Ha (2003) Fine-Scale Conservation Plan for Cape Lowlands Renosterveld:Technical Report. Cape Conservation Unit,
Van Zy
omics, University of Cape Town, South Africa.
Van Wilgen, B.W., C. Marais, D. Magadlela, N. Jelie and D. Stevens. (2002) Win-wwin: South Africa’s Working for Water Programme in: 2002 M
High St. Washington, D.C., U.S.A.
se, A., M. Rouget, K. Maze and N. Helme.
Botanical Society of South Africa.
l, H. (2005) The use of property value approaches to value urban freshwater environments: case studies and their management implications for Cape Town. Draft Ph.D Thesis, School of Econ
VinPro. (2006) South African wine farmers' service organisation. Accessed on 10/01/06 at: http://vinpro.co.za/
Wells, P. (1998) Institutions and incentives for biodiversity conservation. Biodiversity and Conservation 7: 815-835.
orth Group of Concerned Scientists. (2003) A New Model for Landscape Conservation in New South Wales, WWF, Australia.
Wentw
co
WildlifeCampus. (2005). The trend towards game ranching in South Africa. Game Ranch Economics with ABSA. Accessed on 03/02/06 at : http://www.wildlifecampus.com/Courses/GameRanchEconomics/GameRanchEnomics/UpfrontCostofGameRanches/892.pdf
Wilson, G.A. (1996) Farmer environmental attitudes and ESA participation. Geoforum 27: 115-131.
of landholders towards Winter, S.J. (2003) Attitudes and behaviour the conservation of
Wise Lnd Land affairs. Accessed on 08/08/04 at:
http://www.gov.za/whitepaper/2001/spatialplanning.htm
Overberg Coastal Renosterveld, a threatened vegetation type in the Cape Floral Kingdom. MSc. University of Stellenbosch.
and Use, 2001. White paper on spatial planning and land use management, Ministry of agriculture a
100

Wu, J., and B.A. Babock. (1999) The Relative EfficienEnvironmental Regulation. Journal of Environmental Economics and Management 38
cy of Voluntary vs Mandatory
: 258-175.
: World Summit
on Sustainable Development. South African Journal of Science 98: 233-242.
Zhang,
Wynberg, R. (2002) A decade of biodiversity conservation and use in South Africatracking progress from the Rio Earth Summit to the Johannesburg
Y. and Y. Li. (2005) Valuing or pricing natural and environmental resources?Environmental Science and Policy 8: 179-186.
101
102
8. APPENDIX
8.1 Abbreviations
Conservation of Agricultural Resources Act CARA
EUIS Geographic Information System
IDP Integrated Development PlanNEMA National Environmental ActNFF National Farmers FederationPSDF Provincial Spatial Development Framework
G
CCT City of Cape TownCMA Cape Metropolitan Area
European Union

8.2 Identified renosterveld sites
MUNICIPALITY CAPE TOWN
SITE NAME CONTACT Klipvlei C Starke Springfontein A Beukes Zondagsfontein A Louw Uitkyk AJ Herold Vrymansfontein B Naude Uitkamp Boetie Louw Tierhoogte C Starke Corona 480 County Fair Karnemelksvlei County Fair - R Briers Meerendal D Adriaanse De Goede Ontmoeting 180 D Herholdt Rondeberg 1373 D Loubser Welgelegen / Koelenhof F Bonthuys Goedgewag F Brink Remhoogte H de Kok Ongegund 158 H de Villiers Leeuwendans 937 H Slabbert Oliphantskop H Stofberg La farge Quarry Tygerberg H van Zyl Berg-en-dal Haman Joostenberg Kloof I Warner Bloemendal J Coetzee Draaihoek J Herold Fredericks kraal 71 J Herold Langerug J Herold Matjeskuil J Lategan Mariedal 63 J van der Spuy Clara Annafontein Justin Basson Klipheuwel K Blackenberg Morgenster K de Villiers Altona K Loubser Bottelfontein Karstars Ouskip Koeberg coast
103

SITE NAME CONTACT Contermanskloof L & C Stark Kuiperskraal Loubser Broers Kuyperskraal 180 Loubser broers Mosselbank 906 broers Loubser Swellengift oubser broers L Welgeg oubser Broers und L Koeberg M de Kok Koebergplaas 110 M de Kok Oortmanspost 49 M de Kok Welvergenoegd M de Kok/Loubser Diemersdal M Louw Groenekloof Mamre Nature reserve Durbanville Golf Course Municipality Durbanville Race Course Municipality North Pine Municipality Sonstraal Municipality Stikland Municipality Tygerberg Nature Reserve Municipality Van Riebeecksplaas Municipality Melkbosstrand open space Municipality Altydgedacht r O & J Parke Hillcrest farm P Inglis Blaauwblommekloof P Kitshopf Matjeskuil P Louw Oliphantskop P van der Spuy Groot Phesantekraal R Brink Hercules Pillar S de Wit Goedgedacht S Hamman Rondeboschjes Berg S Hugo Spes Bona S Hugo Matjeskuil S Olding Hoogekraal 1413 S Scher De Grendel Sir D Graaf Radio 918 Small holdings Spieka T Enting Dassenvaley T Mostert Dasvlei T Mostert Mosselbank V Loubscher Hubertskuil W Bester Leeuwenkuil 937 W Dryer
104

SITE NAME CONTACT Oatlands W Louw Platrug W Melk Rondeberg Farm WS Pretorious Dassenburg not known Klein Zoute Rivier not known Kliprug not known Langerug not known Magrug not known Nooitgedacht not known Slagtersdam 470 not known Spuitfontein not known The Farm 1419 not known Van Schoorsdrif not known
S
TELLENBOSCH ry Hills and Renosterveld Conservancies MUNICIPAL
ITY - Bottela
Sterhuis A Kruger Overgaauw B van Velden Jordan Winery C & G Jordan Bellevue D Morkel Amperbo D Smit Kaapzicht D Steytler La Provence F Joubert Langverwacht F le Roux Biebleblom F v d Merve Neetlingshof H van Zyl - manager Muldersbosch Hydro Holdings - M Dobrovic Fransmanskraal J Carinus Zevenwacht J Johnson Skoonheid J Van der Westhuizen Bonfoi J Van der Westhuizen Morgenson L'Émigré Kastaiinberg M Neetling Warwick M Ratcliffe Wolfkloof M Scholtz North Pine ty Municipali Saxenbeurg N van der Merwe By Den Weg P Andrag Tabanana P Bacon Goede Hoop P Bestbier
105

SITE NAME CONTACT Wolwedans P Fasen Hazendal e R de Lang Fort Simon R Uys Avalon S Esterhuizen Le Bonheur S Kotze Koopmanskloof S Smit Delheim/Delvera S Sperling Mooiplaas T & L Roos De Goede Sukses not known
D
RAKENSTEIN M Groenagterberg Conservancy
s
UNICIPALIT
Y -
Sonder Twyfel B & S Smut Lupinvale C Dickinson Lemietrivier F Turner Palmiet Vallet Harris I Somchem Krantzkop Factory J du Toit Rooshoek M Bester Elandsberg Farms M Gregor Foxenberg Estate M Hemmes Kruishof Restante S Japp Boplaas S Power
MALMESBURY M UNICIPALITY
Rotzenburg
B Doman
Kanonberg D Koch Swavelberg G Damp Malansdam J Koch Boschmanskloof Malmesbury Brakfontein Malmesbury Goudmyn se Berg Malmesbury Hartebeeesfontein Malmesbury Henninsberg Malmesbury Hoogeleggen Malmesbury Kasteeelberg Malmesbury Klipfontein Malmesbury Leewenkop Malmesbury Nooitgedacht Malmesbury Swartberg Malmesbury Wolfkop Malmesbury
106

8.3 Questionnaire survey
107

110
8.4 NVivo Categories
NVivo revision 1.2.142 Licensee: Ruth Parker Project: My Project User: Administrator Date: 2006/02/13 - 09:03:07 AM NODE LISTING Nodes in Set: All Free Nodes Created: 2005/11/07 - 08:24:22 AM Modified: 2005/11/07 - 08:24:22 AM Number of Nodes: 14 1 appreciate the beauty Description: I wanted to get a sense of whether farmers appreciate what they have 2 connection to farm Description: I wanted to see how often farmers refer back their farms 3 consequences biodiversity loss Description: to try and establish how often farmers refer to biodiversity loss and or the consequences. Is this important to them? 4 conservation or preservation Description: wonder how often farmers refer to conserve or preserve or if it is a loaded word they avoid 5 could tell a story Description: a code added since my last analysis and I wanted to include things that could be elaborated into a story - its the stories we need to know to inspire people 6 educate & public awareness Description: I wanted to get a sense of whether there is a perceived need that everyone should not only be educated, but made aware - does this relate to wanting more info 7 emotional connection Description: this code gives me a sense of whether the farmer is connected to renosterveld or not - of course it is entirely subjective and is based on the sense I got when I interviewed the farmers 8 fauna and flora Description: an indication of whether it is flowers and animals that are mentioned or more fynbos in general 9 future generations Description: trying to get a sense of heritage - do farmers want to preserve their land for future generations - developed because many farmers talk about 'die nageslag'
10 links with past :
nservation is preventing soil erosion to some farmers - I wanted to get a sense of whether uc t still is merely seen as soil erosion
want to do anything to try and save renosterveld
the botanical side of their renosterveld. Stunning renosterveld to be presented to farmers - is it of
Descriptionwhat links farmers to the past - apart from previous generations
11 soil erosion Description: cofarmers that conservation is m h broader or whether i 12 specific activity to save renosterveld Description: s for itself - are farmers ing peaks do or 13 specific plants Description: want to know how many farmer are interested in flowers in the spring is often the first thing in interest to them? 14 financial details Description: any mention of money - people always believe that is all farmers want and I needed to get an idea of how money minded they are
111