probabilistic design of landfill final cover systems – 14311 · probability-based, its...
TRANSCRIPT
WM2014 Conference, March 2-6, 2014, Phoenix, Arizona, USA
Probabilistic Design of Landfill Final Cover Systems – 14311
Kevin Foye, Ph.D., P.E., Mohammad Kabalan, Ramya Rajan, Te-Yang Soong, Ph.D., P.E., Morgan Subarayan, P.E.
CTI and Associates, Inc., 51331 W. Pontiac Trail, Wixom, MI 48393 USA, phone: 248-486-5100 ABSTRACT The long-term reliability of landfill disposal facilities’ final cover systems – and therefore the overall waste containment – depends on the distortions imposed on these systems by differential settlement/subsidence. Deterministic approaches to long-term final cover settlement prediction are not able to capture the spatial variability in the waste mass and subgrade properties, especially discontinuous inclusions, which control differential settlement. An alternative, probabilistic solution is to use a stochastic model of buried structures’ lifetime performance and spatial arrangement to capture the non-uniform collapse of buried structures and the subsequent effect of that collapse on the final cover system. To be able to assess the performance of the final cover based on the results of the probabilistic analysis, a performance criterion needs to be determined. The percent flooded (inundated) area provides a method to quantify the final cover’s ability to maintain drainage of the site. Based on typical prescriptive landfill design guidelines, an acceptable criterion based on post-settlement percent inundated area is determined. The application of this design criterion is demonstrated within the framework of the proposed subsidence model. INTRODUCTION Final cover systems are essential to the proper long-term function of landfills – they limit water infiltration that could cause the migration to the environment of contaminants from within the landfill. One critical feature of final cover systems needed to fulfill this role is their ability to effectively drain stormwater by gravity. Distortions to the final cover system that prevent drainage can be caused by differential settlement of the cover system and underlying waste mass. Differential settlement within landfills is caused by inconsistent compaction, non-uniform void space and debris distribution, collapsing buried structures, variable waste material stiffness, variable compressibility of the surrounding soil matrix, uneven long-term creep settlement of the soil matrix, etc. The evaluation of differential settlement is challenging because of the heterogeneity of the waste mass and buried structure placement. Deterministic approaches are poorly suited to treat the problem posed by these highly variable parameters, particularly since it is impossible to fully characterize the mechanical parameters of waste in-place at every point. Probabilistic models, however, are able to capture the spatial variability associated with imperfect information as well as non-uniform waste characteristics, placement, and backfill. These models can be used to predict the likely future performance of the final cover system in terms of its ability to drain stormwater and prevent infiltration into the waste mass. The cover thickness, inclusion of reinforcement, and final slope can be designed accordingly to limit the occurrence of poor performing areas of the final cover to a prescribed design value (i.e., an acceptable performance criterion). Because the model is probability-based, its predictions encompass several different possible simulated outcomes resulting from the highly variable conditions within the waste mass. For every single simulation, the resulting map of waste properties is used to calculate settlement at all points above the settling waste. The effectiveness of a post-settlement final cover system in maintaining drainage across a site can then be evaluated through the determination of the percent inundated area for each simulation. This probabilistic capability is important since simultaneous, uniform subsidence throughout the waste mass, as in deterministic models,
1
WM2014 Conference, March 2-6, 2014, Phoenix, Arizona, USA
would result in less adverse (less conservative) predictions of final cover performance (i.e., uniform collapse would result in a more uniform settlement profile). Deterministic approaches to settlement analysis typically would not indicate any differential settlement or resulting ponding in areas of the landfill with consistent waste fill height. In contrast, because of the ability to capture the variable nature of the waste, these inundated areas can be simulated and quantified using probabilistic approaches. Accordingly, a quantitative probabilistic design criterion for an acceptable percent inundated area is needed. This criterion must be developed probabilistically since comparable deterministic design criteria do not address the variable nature of the waste fill. The application of the probabilistic differential settlement model to a landfill cover and the determination of an acceptable percent inundated area criterion are discussed in this paper. Existing prescriptive landfill design guidelines that exhibit currently acceptable levels of performance are considered in this analysis. The resulting probabilistic criterion therefore represents the level of performance implied by these existing prescriptive designs. METHODOLOGY Probabilistic Settlement Model The following methodology, while applicable to other landfill configurations, is primarily focused on the problem of final cover settlement resulting from the subsidence of waste within discrete trenches. The volume loss model is an efficient method for estimating ground settlement due to volume loss at depth. Originally developed to model subsidence over tunnels, this model can also be applied to final covers over waste trenches [6]. The basic equations to calculate settlement at the surface due to volume loss at depth is given in equations 1 and 2.
2
21
2
−∆
=∆ ixx
i
v ex
vFz
π (Eq. 1)
𝑥𝑖 = 𝑘𝐻 (Eq. 2)
where Δz is the settlement at the ground surface at a point at a horizontal distance x from the void, Fv is the fraction of void volume loss ΔV expressed at the ground surface, xi is a scaling parameter for the horizontal distribution of settlement, and k is a scaling parameter that relates xi to the height H of soil above the void.
The model is applied to an entire site to estimate post-settlement final cover surface elevations. The total settlement at each point of the surface is the sum of settlement due to void collapse at all points within the underlying trench. The settlement at each surface point is thus calculated as
∆𝑧𝑘 = �𝐹𝑣 ∙ ∆𝑉𝑗𝑥𝑖√2𝜋
𝑒−12�𝑥𝑗𝑘𝑥𝑖
�2𝑛
𝑗=1
(Eq. 3)
Where: ∆zk = Total settlement at node k along final cover ∆Vj = Volume loss at node j of the waste trench xjk = Horizontal distance between nodes j and k
n = Number of nodes along final cover within influence radius
2
WM2014 Conference, March 2-6, 2014, Phoenix, Arizona, USA
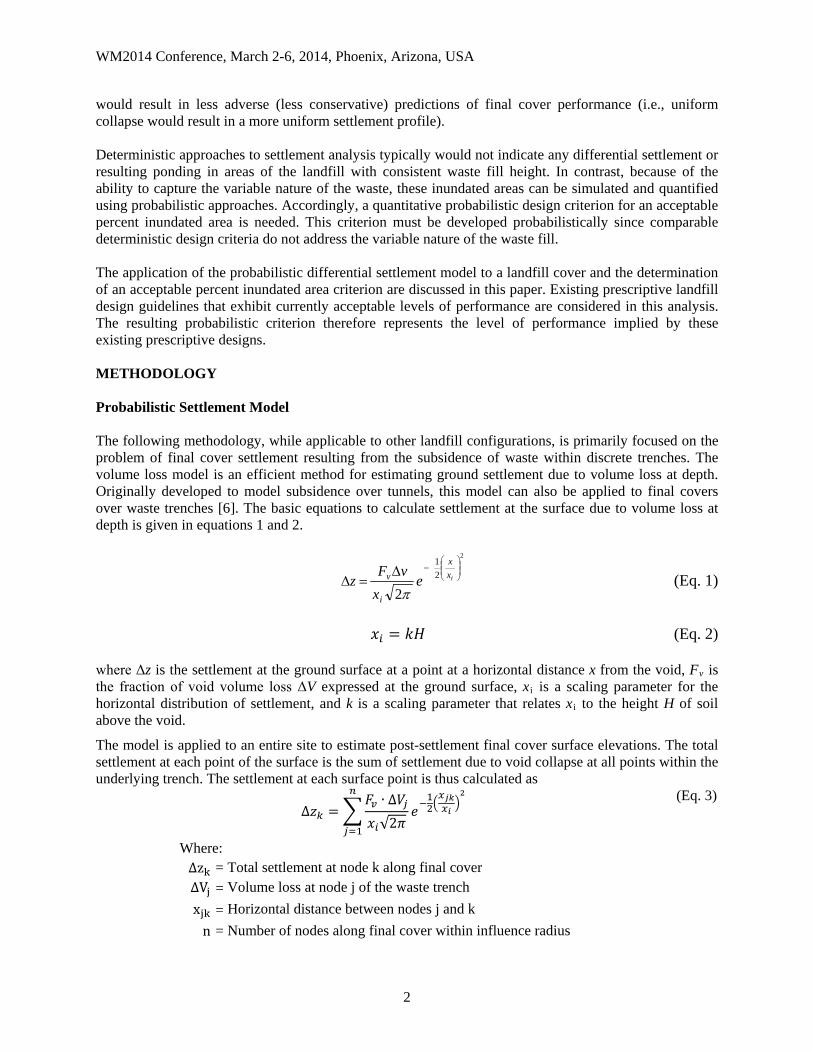
To make the computation more efficient, a radius of influence is defined around each point on the surface. Points at depth outside of this radius will not have any effect on settlement at the point on the surface and are therefore excluded from the analysis of settlement at that point. The procedure to apply the volume loss model to an entire site and the concept of the radius of influence are illustrated in Figure 1.
Fig. 1. Typical procedure to apply volume loss model to waste trenches over a large area
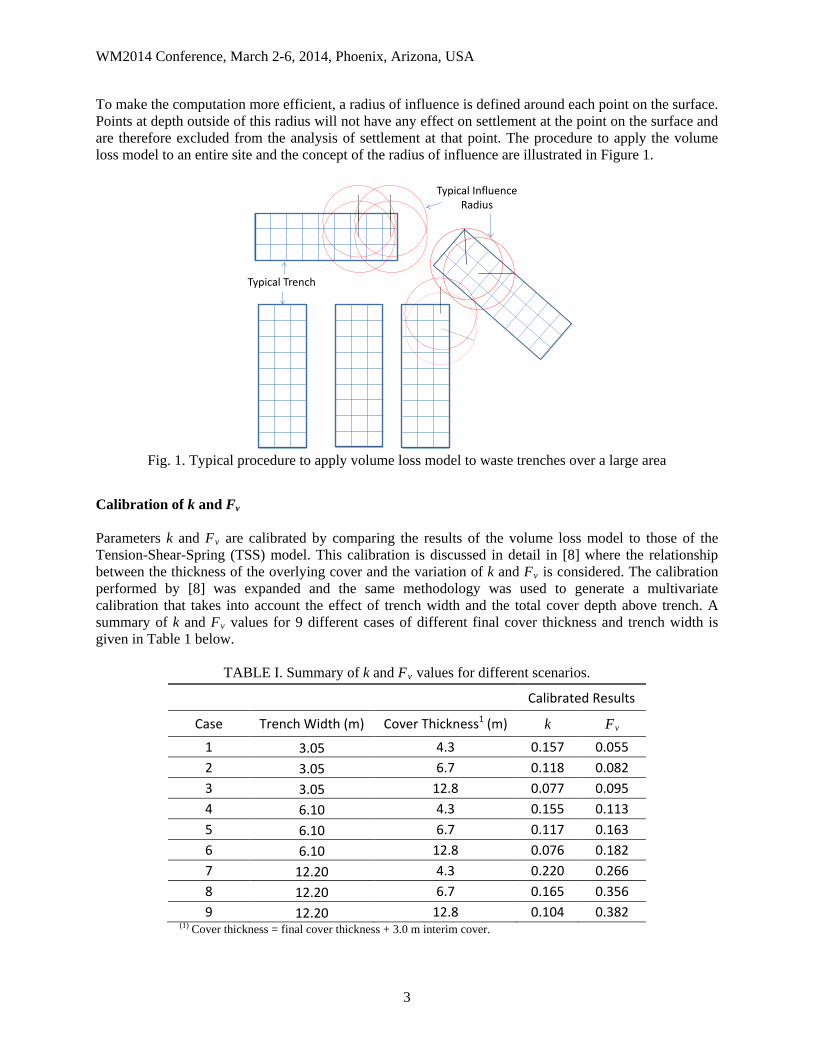
Calibration of k and Fv Parameters k and Fv are calibrated by comparing the results of the volume loss model to those of the Tension-Shear-Spring (TSS) model. This calibration is discussed in detail in [8] where the relationship between the thickness of the overlying cover and the variation of k and Fv is considered. The calibration performed by [8] was expanded and the same methodology was used to generate a multivariate calibration that takes into account the effect of trench width and the total cover depth above trench. A summary of k and Fv values for 9 different cases of different final cover thickness and trench width is given in Table 1 below.
TABLE I. Summary of k and Fv values for different scenarios.
Calibrated Results
Case Trench Width (m) Cover Thickness1 (m) k Fv 1 3.05 4.3 0.157 0.055 2 3.05 6.7 0.118 0.082 3 3.05 12.8 0.077 0.095 4 6.10 4.3 0.155 0.113 5 6.10 6.7 0.117 0.163 6 6.10 12.8 0.076 0.182 7 12.20 4.3 0.220 0.266 8 12.20 6.7 0.165 0.356 9 12.20 12.8 0.104 0.382
(1) Cover thickness = final cover thickness + 3.0 m interim cover.
Typical Trench
Typical Influence Radius
3
WM2014 Conference, March 2-6, 2014, Phoenix, Arizona, USA
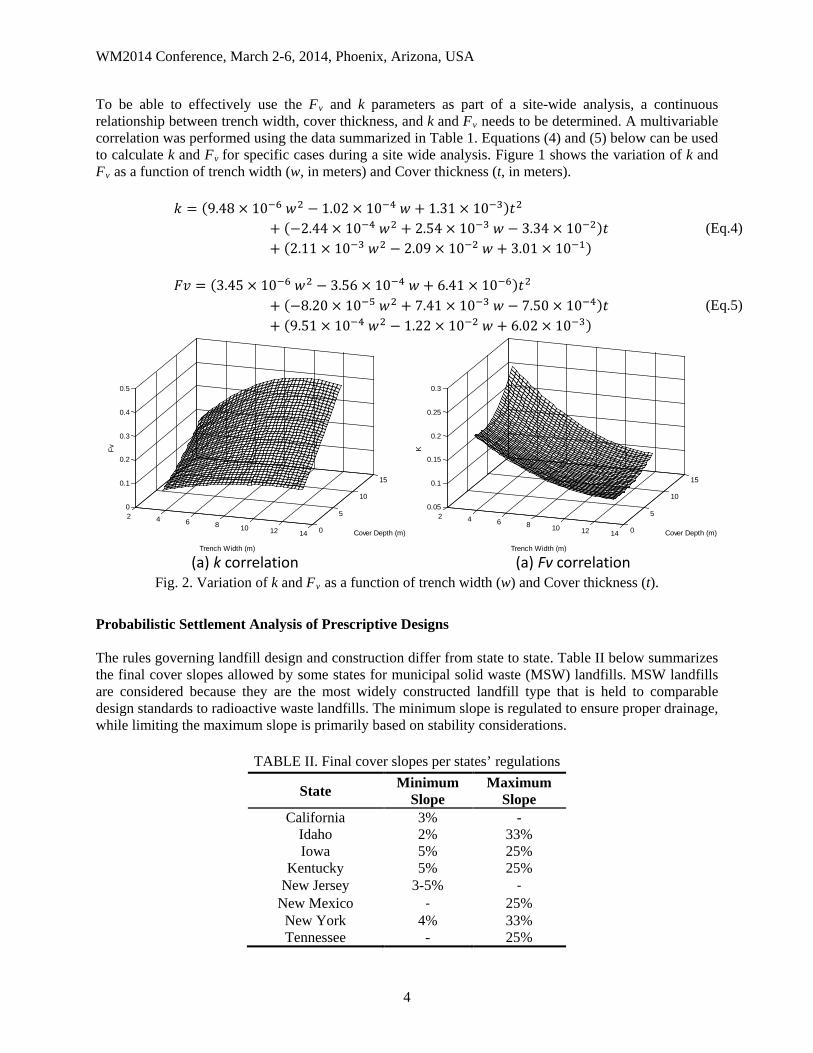
To be able to effectively use the Fv and k parameters as part of a site-wide analysis, a continuous relationship between trench width, cover thickness, and k and Fv needs to be determined. A multivariable correlation was performed using the data summarized in Table 1. Equations (4) and (5) below can be used to calculate k and Fv for specific cases during a site wide analysis. Figure 1 shows the variation of k and Fv as a function of trench width (w, in meters) and Cover thickness (t, in meters).
𝑘 = (9.48 × 10⁻⁶ 𝑤2 − 1.02 × 10⁻⁴ 𝑤 + 1.31 × 10⁻³)𝑡2
+ (−2.44 × 10⁻⁴ 𝑤2 + 2.54 × 10⁻³ 𝑤 − 3.34 × 10⁻²)𝑡+ (2.11 × 10⁻³ 𝑤2 − 2.09 × 10⁻² 𝑤 + 3.01 × 10⁻¹)
(Eq.4)
𝐹𝑣 = (3.45 × 10⁻⁶ 𝑤2 − 3.56 × 10⁻⁴ 𝑤 + 6.41 × 10⁻⁶)𝑡2
+ (−8.20 × 10⁻⁵ 𝑤2 + 7.41 × 10⁻³ 𝑤 − 7.50 × 10⁻⁴)𝑡+ (9.51 × 10⁻⁴ 𝑤2 − 1.22 × 10⁻² 𝑤 + 6.02 × 10⁻³)
(Eq.5)
Fig. 2. Variation of k and Fv as a function of trench width (w) and Cover thickness (t).
Probabilistic Settlement Analysis of Prescriptive Designs The rules governing landfill design and construction differ from state to state. Table II below summarizes the final cover slopes allowed by some states for municipal solid waste (MSW) landfills. MSW landfills are considered because they are the most widely constructed landfill type that is held to comparable design standards to radioactive waste landfills. The minimum slope is regulated to ensure proper drainage, while limiting the maximum slope is primarily based on stability considerations.
TABLE II. Final cover slopes per states’ regulations
State Minimum Slope
Maximum Slope
California 3% - Idaho 2% 33% Iowa 5% 25%
Kentucky 5% 25% New Jersey 3-5% -
New Mexico - 25% New York 4% 33% Tennessee - 25%
(a) k correlation (a) Fv correlation
2 4 6 8 10 12 14 0
5
10
15
0.05
0.1
0.15
0.2
0.25
0.3
Cover Depth (m)
Trench Width (m)
K
2 4 6 8 10 12 14 0
5
10
15
0
0.1
0.2
0.3
0.4
0.5
Cover Depth (m)
Trench Width (m)
Fv
4
WM2014 Conference, March 2-6, 2014, Phoenix, Arizona, USA
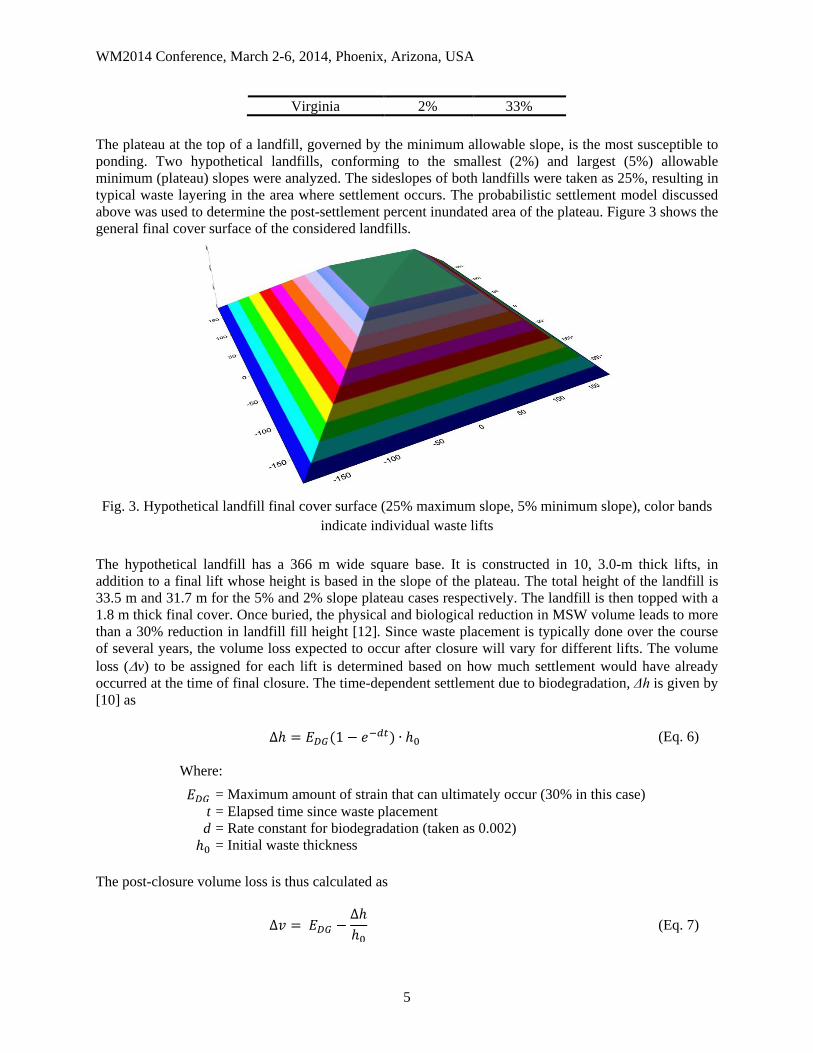
Virginia 2% 33% The plateau at the top of a landfill, governed by the minimum allowable slope, is the most susceptible to ponding. Two hypothetical landfills, conforming to the smallest (2%) and largest (5%) allowable minimum (plateau) slopes were analyzed. The sideslopes of both landfills were taken as 25%, resulting in typical waste layering in the area where settlement occurs. The probabilistic settlement model discussed above was used to determine the post-settlement percent inundated area of the plateau. Figure 3 shows the general final cover surface of the considered landfills.
Fig. 3. Hypothetical landfill final cover surface (25% maximum slope, 5% minimum slope), color bands
indicate individual waste lifts The hypothetical landfill has a 366 m wide square base. It is constructed in 10, 3.0-m thick lifts, in addition to a final lift whose height is based in the slope of the plateau. The total height of the landfill is 33.5 m and 31.7 m for the 5% and 2% slope plateau cases respectively. The landfill is then topped with a 1.8 m thick final cover. Once buried, the physical and biological reduction in MSW volume leads to more than a 30% reduction in landfill fill height [12]. Since waste placement is typically done over the course of several years, the volume loss expected to occur after closure will vary for different lifts. The volume loss (∆v) to be assigned for each lift is determined based on how much settlement would have already occurred at the time of final closure. The time-dependent settlement due to biodegradation, Δh is given by [10] as
∆ℎ = 𝐸𝐷𝐺(1 − 𝑒−𝑑𝑡) ∙ ℎ0 (Eq. 6)
Where:
𝐸𝐷𝐺 = Maximum amount of strain that can ultimately occur (30% in this case) t = Elapsed time since waste placement d = Rate constant for biodegradation (taken as 0.002) ℎ0 = Initial waste thickness
The post-closure volume loss is thus calculated as
∆𝑣 = 𝐸𝐷𝐺 −∆ℎℎ0
(Eq. 7)
5

WM2014 Conference, March 2-6, 2014, Phoenix, Arizona, USA
The assigned volume loss for each lift is given in Tables IIIa and IIIb for the 2% and 5% plateau slopes, respectively. For both cases, a waste filling rate of 398,000 m3/year (520,000 yd3/year) was assumed.
TABLE IIIa. Volume loss per constructed lift for hypothetical landfill with 2% plateau slope
Lift No.
Bottom Elevation
(m)
Top Elevation
(m) Width
(m) Lift
Volume (m3)
Cumulative Fill Volume (m3)
Fill Life (years)
Age at Closure (days)
Post-Closure Volume Loss
1 0.0 3.0 365.8 381,485 381,485 0.96 1,470 1.6% 2 3.0 6.1 341.4 330,741 712,225 1.79 1,167 2.9% 3 6.1 9.1 317.0 283,622 995,847 2.50 906 4.9% 4 9.1 12.2 292.6 240,127 1,235,974 3.11 686 7.6% 5 12.2 15.2 268.2 200,257 1,436,230 3.61 502 11.0% 6 15.2 18.3 243.8 164,011 1,600,242 4.03 351 14.9% 7 18.3 21.3 219.5 131,390 1,731,632 4.36 231 18.9% 8 21.3 24.4 195.1 102,394 1,834,026 4.61 137 22.8% 9 24.4 27.4 170.7 77,022 1,911,047 4.81 66 26.3%
10 27.4 30.5 146.3 55,274 1,966,322 4.95 15 29.1% 11 30.5 31.7 121.9 16,731 1,983,053 4.99 0 30.0%
TABLE IIIb. Volume loss per constructed lift for hypothetical landfill with 5% plateau slope
Lift No.
Bottom Elevation
(m)
Top Elevation
(m) Width
(m) Lift
Volume (m3)
Cumulative Fill Volume
(m3) Fill Life (years)
Age at Closure (days)
Post-Closure Volume Loss
1 0.0 3.0 365.8 381,485 381,485 0.96 1489 1.5% 2 3.0 6.1 341.4 330,741 712,225 1.79 1185 2.8% 3 6.1 9.1 317.0 283,622 995,847 2.50 925 4.7% 4 9.1 12.2 292.6 240,127 1,235,974 3.11 705 7.3% 5 12.2 15.2 268.2 200,257 1,436,230 3.61 521 10.6% 6 15.2 18.3 243.8 164,011 1,600,242 4.03 370 14.3% 7 18.3 21.3 219.5 131,390 1,731,632 4.36 250 18.2% 8 21.3 24.4 195.1 102,394 1,834,026 4.61 156 22.0% 9 24.4 27.4 170.7 77,022 1,911,047 4.81 85 25.3%
10 27.4 30.5 146.3 55,274 1,966,322 4.95 34 28.0% 11 30.5 33.5 121.9 37,152 2,003,474 5.04 0 30.0%
To calculate the resulting total post-closure settlement, each of the 11 waste lifts is divided into equally-sized columns. The volume loss model is used to determine the settlement on the surface due to the applied volume loss at each of those columns. The selection of the k and Fv parameters of the volume loss model is crucial to ensure accuracy. Since this case is not that of a waste trench overlain by a soil cover, the Fv and k parameters cannot be determined from the calibration discussed above. The Fv parameter is related to the portion of voids at depth that are translated to the surface. In this case, the assumed volume loss of 30% is based on observations of settlement seen at the surface and thus an Fv value of 100% is to be used. Parameter k determines how far laterally volume loss is spread. A lower value of k would lead to more localized depressions while a
6

WM2014 Conference, March 2-6, 2014, Phoenix, Arizona, USA
higher value causes the post-settlement surface to be more even. A range of k values between 0.2 and 0.7 was analyzed to determine the effect of this parameter on the results of the analysis. This range of k values is observed for geomaterials [1]. The selection of the k value was based on comparing the results of the analyses with field measurements of the dimensions of craters and depressions formed on the surface of a landfill. This data is presented by [9]. The two key parameters that control the generation of the random fields are the coefficient of variability (COV) and the scale of fluctuation (θ). The COV was determined from waste settlement data using the 6-σ method proposed by [14] and explained in detail by [7]. Table IV presents some values of COV determined from existing settlement data. The average COV for waste from these data is found to be around 31%, which is in agreement with the typical value of 30% suggested for highly variable soils as reported by [2]. Therefore, a COV of 30% was used. The value of θ used was 9.1m and is equivalent to about 25% of the average waste depth. This value has been shown to maximize differential settlement [5].
TABLE IV. Coefficient of variation values from existing literature Reference COV
Bjarngard and Edgers (1990) [3] as presented by McDougall (2008) [11] 42% McDougall (2008) [11] 28%
Spikula (1997) [13] as presented by Qian et al. 2001 [12] 36% Yen and Scanlon (1975) [15] as presented by Qian et al. 2001 [12] 23% Yen and Scanlon (1975) [15] as presented by Qian et al. 2001 [12] 27% Yen and Scanlon (1975) [15] as presented by Qian et al. 2001 [12] 29%
Probabilistic Design Criterion Several realizations, where different random fields are generated for each simulation, were generated to calculate the post-closure settlement of the two hypothetical landfills. The resulting post-settlement surfaces were then analyzed for post-settlement percent inundated area. A histogram of the resulting percent inundated area values for these realizations is then constructed to establish the representative value of inundated area for these typical prescriptive designs. Since the geometry of the prescriptive design is considered acceptable for storm water management purposes, a criterion for acceptable inundated area can be selected based on this representative value. To have a more practical and realistic assessment, excluding the occurrence of small pools that do not threaten the drainage performance of the final cover, another measure of performance that will be considered is the 30-cm inundated area. This represents the areas of the cover where more than 30 cm of water will accumulate in case of precipitation. A value of 30 centimeters was selected for this value because it corresponds to the RCRA subtitle D (40 CFR 258.40) performance criteria for composite liner systems.
RESULTS A total of 360 realizations utilizing random fields were simulated and their results compared. Three values of the k parameter (0.2, 0.4, and 0.7) were used to investigate its effects on the resulting settlement and percent inundated area distributions. Both landfill models (2% and 5% slope plateau) were analyzed. The percent inundated area and the 30-cm percent inundated areas were calculated for each realization. The results are presented in the histograms in Figures 4 and 5.
7

WM2014 Conference, March 2-6, 2014, Phoenix, Arizona, USA
Fig. 4. Inundated Area for hypothetical landfills with (a) 2% plateau slope and (b) 5% plateau slope
Fig. 5. 30-cm Inundated Area for hypothetical landfills with (a) 2% plateau slope and (b) 5% plateau
slope A summary of the percent inundated area and the 30-cm percent inundated area calculated for all realizations is presented in Table V.
TABLE V. Summary of percent inundated area values calculated for 360 realizations.
Plateau Slope 2% 5%
Measure Inundated Area 30-cm Inundated Area Inundated Area 30-cm Inundated
Area k 0.2 0.4 0.7 0.2 0.4 0.7 0.2 0.4 0.7 0.2 0.4 0.7
Minimum 26.8% 22.9% 19.2% 4.2% 3.1% 1.6% 21.5% 14.5% 14.1% 2.1% 1.1% 0.9% Maximum 35.3% 31.8% 29.6% 10.6% 8.3% 6.6% 30.2% 22.3% 23.4% 7.1% 3.9% 4.8%
Mean 31.7% 26.2% 24.2% 6.5% 5.1% 4.1% 24.7% 19.3% 17.5% 3.8% 2.6% 2.1% Median 31.6% 26.1% 24.2% 6.5% 5.0% 4.1% 24.5% 19.5% 17.6% 3.6% 2.6% 2.0%
It is noteworthy that the landfill with 2% plateau slope exhibits higher inundated areas than that with 5% slope. This result is expected since the shallower initial slope hinders post-settlement drainage. Moreover, as the k parameters increases, the inundated areas tend to decrease. This result is also expected since a
0
5
10
15
20
14% to15%
16% to17%
18% to19%
20% to21%
22% to23%
24% to25%
26% to27%
28% to29%
30% to31%
Freq
uecy
k=0.2 k=0.4 k=0.7
0
5
10
15
20
19% to20%
21% to22%
23% to24%
25% to26%
27% to28%
29% to30%
31% to32%
33% to34%
35% to36%
Freq
uecy
k=0.2 k=0.4 k=0.7
(a) 2% Plateau slope (b) 5% Plateau slope
0
10
20
30
40
1% to 2% 3% to 4% 5% to 6% 7% to 8% 9% to 10%
Freq
uecy
k=0.2 k=0.4 k=0.7
0
10
20
30
40
0% to 1% 2% to 3% 4% to 5% 6% to 7%
Freq
uecy
k=0.2 k=0.4 k=0.7
(a) 2% Plateau slope (b) 5% Plateau slope
8

WM2014 Conference, March 2-6, 2014, Phoenix, Arizona, USA
higher k causes settlement to be spread to a larger area and thus decreases the “bumpiness” of the post-settlement surface, which is directly related to the number of slope reversals and, hence, inundated area. Figure 6 presents example post-settlement plateau surfaces for the landfill 5% plateau slope with three different k values (0.2, 0.4, and 0.7). Figures 7 and 8 show the inundated and the 30-cm inundated areas (areas shaded in blue) respectively for example realizations of each k value.
Fig. 6. Example Post-settlement surface of the 5% landfill plateau
Fig. 7. Example post-settlement Inundated area (AI)
k=0.2 k=0.4
k=0.7
k=0.2, AI=23.6% k=0.4, AI=21.1%
k=0.7, AI=16.1%
9
WM2014 Conference, March 2-6, 2014, Phoenix, Arizona, USA
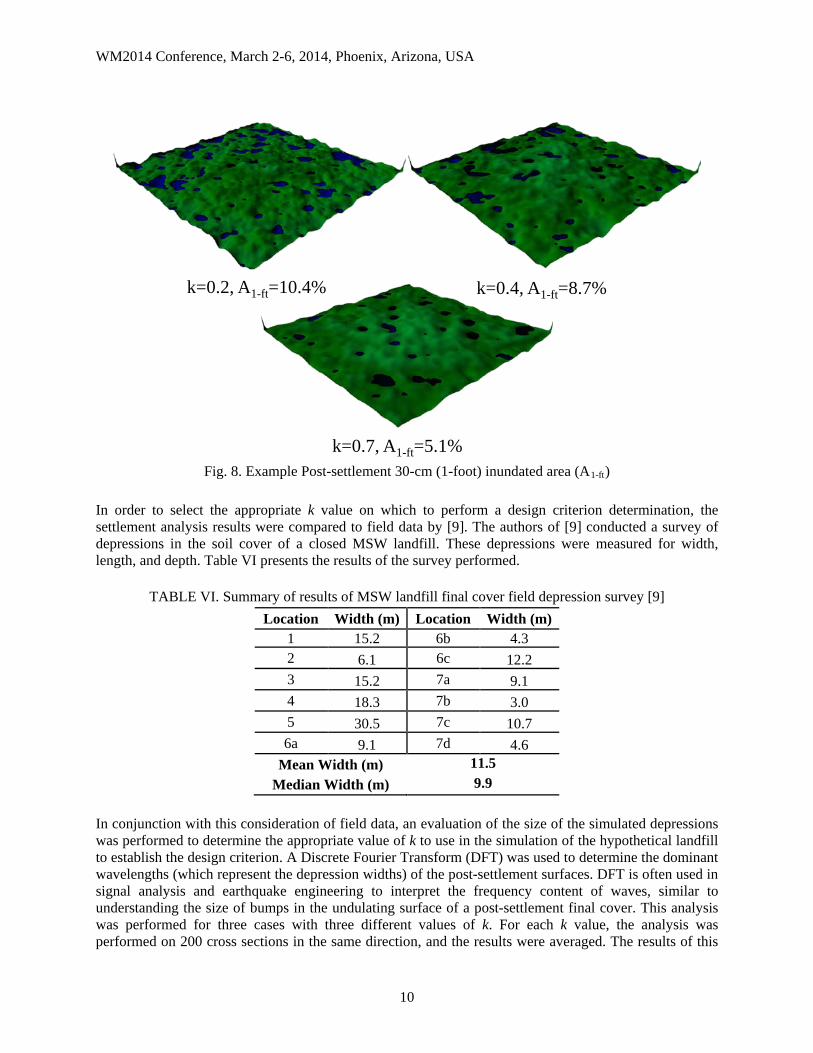
Fig. 8. Example Post-settlement 30-cm (1-foot) inundated area (A1-ft)
In order to select the appropriate k value on which to perform a design criterion determination, the settlement analysis results were compared to field data by [9]. The authors of [9] conducted a survey of depressions in the soil cover of a closed MSW landfill. These depressions were measured for width, length, and depth. Table VI presents the results of the survey performed.
TABLE VI. Summary of results of MSW landfill final cover field depression survey [9] Location Width (m) Location Width (m)
1 15.2 6b 4.3 2 6.1 6c 12.2 3 15.2 7a 9.1 4 18.3 7b 3.0 5 30.5 7c 10.7 6a 9.1 7d 4.6
Mean Width (m) 11.5 Median Width (m) 9.9
In conjunction with this consideration of field data, an evaluation of the size of the simulated depressions was performed to determine the appropriate value of k to use in the simulation of the hypothetical landfill to establish the design criterion. A Discrete Fourier Transform (DFT) was used to determine the dominant wavelengths (which represent the depression widths) of the post-settlement surfaces. DFT is often used in signal analysis and earthquake engineering to interpret the frequency content of waves, similar to understanding the size of bumps in the undulating surface of a post-settlement final cover. This analysis was performed for three cases with three different values of k. For each k value, the analysis was performed on 200 cross sections in the same direction, and the results were averaged. The results of this
k=0.2, A1-ft=10.4% k=0.4, A1-ft=8.7%
k=0.7, A1-ft=5.1%
10
WM2014 Conference, March 2-6, 2014, Phoenix, Arizona, USA
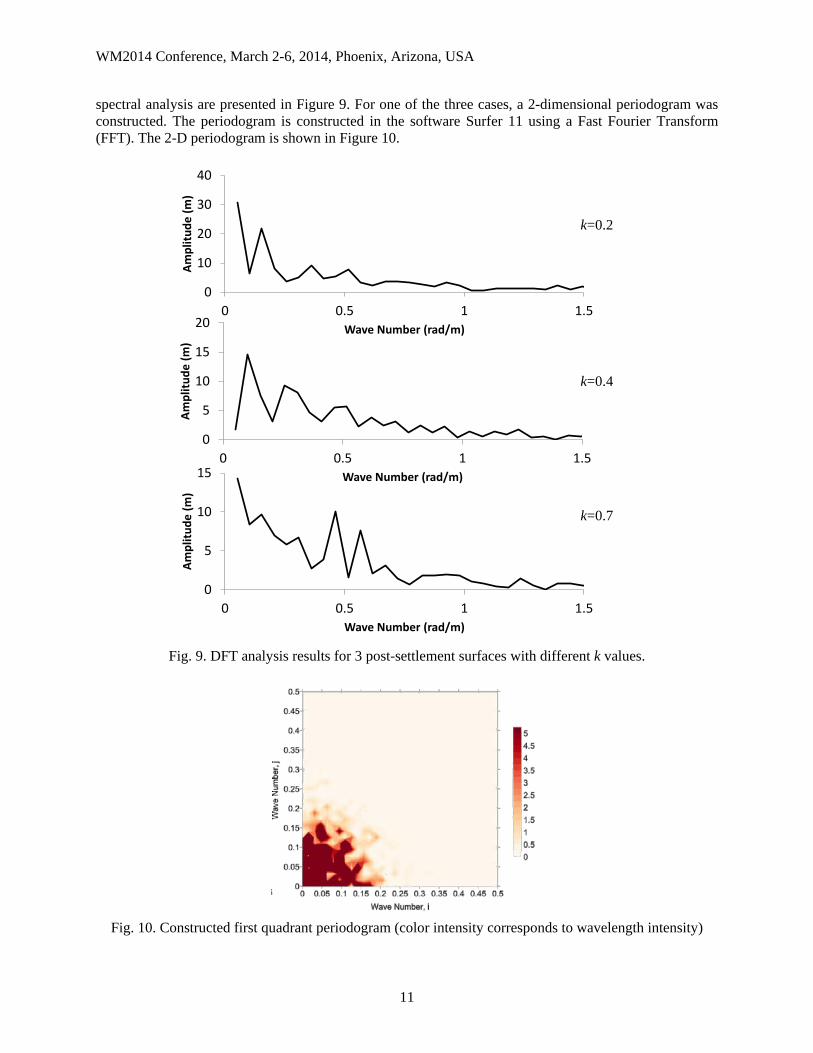
spectral analysis are presented in Figure 9. For one of the three cases, a 2-dimensional periodogram was constructed. The periodogram is constructed in the software Surfer 11 using a Fast Fourier Transform (FFT). The 2-D periodogram is shown in Figure 10.
Fig. 9. DFT analysis results for 3 post-settlement surfaces with different k values.
Fig. 10. Constructed first quadrant periodogram (color intensity corresponds to wavelength intensity)
0
10
20
30
40
0 0.5 1 1.5
Ampl
itude
(m)
Wave Number (rad/m)
0
5
10
15
20
0 0.5 1 1.5
Ampl
itude
(m)
Wave Number (rad/m)
0
5
10
15
0 0.5 1 1.5
Ampl
itude
(m)
Wave Number (rad/m)
k=0.2
k=0.4
k=0.7
11

WM2014 Conference, March 2-6, 2014, Phoenix, Arizona, USA
The 2-D periodogram (Figure 10) shows that the difference between wavelength intensities in the x and y directions is minimal as the diagram appears to be symmetrical. Therefore, the 1-D DFT analyses (Figure 9) are able to provide reliable results. It is evident that the wave number at which the dominant wavelengths (peaks) occur increases as k increases. The wavelength (which represents the depression widths) can be determined from the wave number using the relationship
𝑤𝑎𝑣𝑒𝑙𝑒𝑛𝑔𝑡ℎ = 2𝜋 ⁄ (𝑤𝑎𝑣𝑒 𝑛𝑢𝑚𝑏𝑒𝑟) (Eq. 8)
However, the wavelength spans over a complete period of a wave and thus may not be a realistic representation of the depression width. As shown in Figure 11 below, one half of the wavelength is more representative of the depression widths as they are generally depicted in field surveys. This is in agreement with the methodology used by [9] in their survey of depressions and craters in a landfill final cover.
Fig. 11. Half the wavelength is more representative of the actual depression width than a full wavelength
The dominant depression width was thus calculated using the equation
𝑤 = 𝜋 ⁄ (𝑤𝑎𝑣𝑒 𝑛𝑢𝑚𝑏𝑒𝑟) (Eq. 8)
Table VII shows the calculated depression widths corresponding to the wave numbers at which the amplitude peaks occur for each analysis shown in Figure 9.
TABLE VII. Depression widths corresponding to the results of the DFT analysis.
Wave Number (at peaks)
Depression Width (m)
k=0.2 0.052 61.0 0.155 20.3 0.361 8.7
k =0.4 0.103 30.5 0.257 12.2 0.515 6.1 0.050 62.8
k =0.7 0.155 20.3 0.309 10.2 0.464 6.8 0.566 5.6
T
T/2
12

WM2014 Conference, March 2-6, 2014, Phoenix, Arizona, USA
The first peak usually roughly corresponds to entire analysis domain and was not considered for this comparison. The second peak, however, indicates a strong signal for the dominant depression width. Accordingly, the field data reported by [9] suggests that a k value of 0.7 is the most appropriate value to be used as the depression widths calculated with this value match the field data reasonably well. This result is also in agreement with the expectation that waste is relatively strong in tension and is able to distribute subsidence more effectively that other geomaterials exhibiting lower k values [1]. Based on this choice of k, the maximum acceptable 30-cm inundated area is between 2.1% and 4.1%. DESIGN EXAMPLE The following example demonstrates how the selected design criterion can be applied to the final cover design of a landfill. Figure 12 presents the basic layout and surface topography of the example landfill. The volume loss model discussed above will be used to evaluate the post-settlement performance of the site. Different colored zones are defined based on the site’s drainage pattern. The site is overlying a total of 53 trenches whose layout is presented in Figure 13. The ability of each zone to drain after settlement due to volume loss within the trenches will be evaluated. The slopes of zones that fail to drain based on the criteria determined above will need to be increased. This iterative process allows for the optimization of the final cover thickness and geometry to minimize fill volume and still maintain effective drainage.
Fig. 12. Example design site – different colored zones indicate watersheds
13
WM2014 Conference, March 2-6, 2014, Phoenix, Arizona, USA
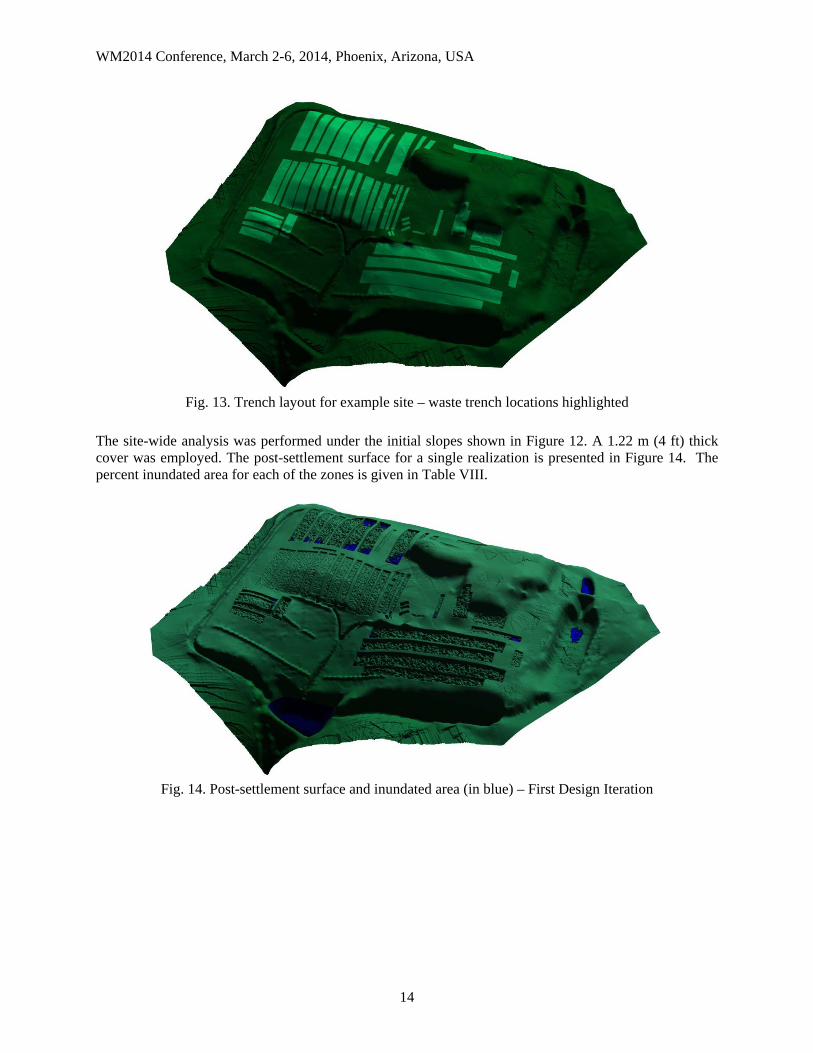
Fig. 13. Trench layout for example site – waste trench locations highlighted
The site-wide analysis was performed under the initial slopes shown in Figure 12. A 1.22 m (4 ft) thick cover was employed. The post-settlement surface for a single realization is presented in Figure 14. The percent inundated area for each of the zones is given in Table VIII.
Fig. 14. Post-settlement surface and inundated area (in blue) – First Design Iteration
14

WM2014 Conference, March 2-6, 2014, Phoenix, Arizona, USA
TABLE VIII. 30-cm Percent inundated areas by zone for first design iteration
Zone Average Initial Slope 30-cm Percent Inundated Area
1 3.9% 0.05%
2 4.4% 0 %
3 4.4% 0.49%
4 6.1% 1.96%
5 4.7% 1.28%
6 5.3% 4.65% Based on the maximum acceptable 30-cm percent inundated area determined above, the slope of zone 6 needs to be increased. The slope of each zone is varied through the following trial slope procedure. Trial slopes are generated by raising all points of the final surface within a zone proportionally to their distance from the edge of this zone. This ratio is the increase in slope (as a percentage). Additionally, a final cover is also added to the final surface. A schematic comparing original and final slope is presented in Figure 15. After the slopes of the zones of interest are increased, the analysis is run again to assess the effect of this increase. This iterative process is repeated until an acceptable 30-cm inundated area is achieved in all zones.
Fig. 15. Design revision process.
CONCLUSIONS In order to assess an effective and representative probabilistic design criterion for landfill final covers, a probabilistic settlement model was applied to typical MSW landfill final cover designs following prescriptive design guidelines. The resulting differential settlement and percent inundated areas were computed for several probabilistic simulations of post-closure settlement. Because the prescriptive design is expected to provide an acceptable level of performance under current design guidance, the resulting probabilistic measures of performance (inundated area, 30-cm inundated area) are taken to represent the implied probabilistic design criteria required for these designs. Considering the purpose of the design criteria with respect to final cover performance, the 30-cm inundated area seems to provide a more practical measure of cover performance and thus should be used to assess final cover performance.
Original Surface
Final Surface
Final Cover
15

WM2014 Conference, March 2-6, 2014, Phoenix, Arizona, USA
Several simulations of the settlement of the prescriptive final cover plateau designs were conducted. In order to assess the impact of the probabilistic settlement model’s input parameters, several different volume loss model k parameters were analyzed. Through a comparison of the typical landfill’s performance with field measurements taken from an existing landfill, a k value of 0.7 was found to compare best to field measurements and existing knowledge regarding waste mechanical behavior. The most representative 30-cm inundated area design criterion selected based on the 120 realizations simulated is between 2.1% and 4.1%. It is expected that this criterion, when applied to probabilistic designs of final cover systems, will provide levels of final cover system reliability and performance comparable to current state-of-practice design guidance. Designs providing lower values of 30-cm percent inundated area will provide better performance than existing practice guidelines suggest. Accordingly, final cover designs can be iteratively analyzed and their performance evaluated relative to this criterion according to the demonstrated procedures. The process demonstrated to design a final cover system using this approach has the following steps: 1) characterize the trenches (dimensions, volume loss, etc.), 2) develop an initial grading plan, 3) divide the grading plan into watershed zones, 4) apply the probabilistic volume loss model to simulate several different possible post-settlement surfaces, 5) determine the post-settlement 30-cm percent inundated area for each realization, 6) compare the computed inundated areas to the design criterion, and 7) adjust the grades and repeat the analyses as needed until an acceptable design is obtained. This iterative process allows a rational, quantitative assessment of final cover performance based on a probabilistically-derived design criterion. Therefore, designs developed according to this methodology can reduce arbitrary design decisions relative to other existing practices. Accordingly, the design criterion can be adjusted to account for additional data and specific risk targets as the methodology is more widely applied.
REFERENCES 1. Ahmed, M. and Iskander, M. (2011). “Analysis of Tunneling-Induced Ground Movements Using
Transparent Soil Models.” Journal of Geotechnical and Geoenvironmental Engineering, ASCE. 137(5): 525 – 535.
2. Baecher, G. B. and Christian, J. T. (2003). Reliability and Statistics in Geotechnical Engineering. Wiley, Hoboken, NJ, 605 p.
3. Bjarngard, A. and Edgers, L. (1990). “Settlement of Municipal Solid Waste Landfills”. Proc. 13th Madison Waste Conf., Univ. of Wisconsin-Madison.
4. Foye, K. C., Salgado, R., and Scott, B. (2006). Assessment of Variable Uncertainties for Reliability-Based Design of Foundations. Journal of Geotechnical and Geoenvironmental Engineering, Vol. 132, No. 9.
5. Foye, K. C. and Soong, T. (2010) “Simulating Differential Settlement of Landfill Foundations using Random Fields” GeoFlorida 2010: Advances in Analysis, Modeling & Design, GSP No. 199, ASCE, Reston, VA, 2042-2051.
6. Foye, K. C. and Soong, T.-Y. (2013). “Probabilistic modeling of landfill subsidence introduced by buried structure collapse.” WM2013 Conference, Phoenix, Arizona, USA.
7. Foye, K. C., Scott, B. and Salgado, R. (2006). "Assessment of Variable Uncertainties for Reliability-Based Design of Foundations." Journal of Geotechnical and Geoenvironmental Engineering, ASCE, 132(9): 1197-1207.
8. Foye, K.C., Rajan, R., Kabalan, M., and Soong, T.-Y. (2014). “Probabilistic Modeling of Reinforced Landfill Final Covers for Sustainable Drainage” Geocongress GeoCongress 2014 Conference, ASCE, Atlanta, Georgia, USA.
16
WM2014 Conference, March 2-6, 2014, Phoenix, Arizona, USA
9. Koerner, R. and Koerner, G. (2011). “Landfill Covers: Past- Present- Future”. Presentation. Geosynthetic Research Institute, Folsom, Pennsylvania.
10. Marques, A. C. M., Filz, G. M., and Vilar, O. M. (2003). “Composite compressibility model for municipal solid waste.” Journal of Geotechnical and Geoenvironmental Engineering. 129: 372-378.
11. McDougall, J. (2008).”Geomechanics and Long-term Landfill Settlement”. Zekkos, D (ed.). Proceedings of the 2008 International Symposium on Waste Mechanics, New Orleans, Louisiana, March 13, 2008, ASCE, pp. 76-111.
12. Qian, X., Koerner, R. M., and Gray, D. H. (2002). Geotechnical Aspects of Landfill Design and Construction. Prentice Hall, Upper Saddle River, NJ, 717 p.
13. Spikula, D. R. (1997) “Subsidence Performance of Landfills,” Proceedings GRI-10 Conference, GSI, Folsom, Pennsylvania. 237-244.
14. Withiam, J.L., E.P. Voytko, J.M. Duncan, R.M. Barker, B.C. Kelly, S.C. Musser and V. Elias. (1997). Load and Resistance Factor Design (LRFD) for Highway Bridge Substructures. FHWA Report DTFH61-94-C-00098. Federal Highway Administration, McLean, VA. 850 p.Withiam, J. L., et al. (1997). “Load and resistance design (LRFD) for highway bridge substructures”, Federal Highway Administration, Washington, D.C.
15. Yen, B. C. and Scanlon, B., (1975) “Sanitary Landfill Settlement Rates,” Journal of Geotechnical Engineering, ASCE, 101(5): 475-487.
17