part i. introduction to mixed method evaluationsintroduction to mixed method evaluations chapter 1:...
TRANSCRIPT

PART I.Introduction to Mixed MethodEvaluations
Chapter 1: Introducing This Handbook
The Need for a Handbook on Designing andConducting Mixed Method EvaluationsEvaluation of the progress and effectiveness of projects funded by the National Science Foundation’s(NSF) Directorate for Education and Human Resources (EHR) has become increasingly important.Project staff, participants, local stakeholders, and decisionmakers need to know how funded projects arecontributing to knowledge and understanding of mathematics, science, and technology. To do so, somesimple but critical questions must be addressed:
What are we finding out about teaching and learning?●
How can we apply our new knowledge?●
Where are the dead ends?●
What are the next steps?●
Although there are many excellent textbooks, manuals, and guides dealing with evaluation, few aregeared to the needs of the EHR grantee who may be an experienced researcher but a novice evaluator.One of the ways that EHR seeks to fill this gap is by the publication of what have been called"user-friendly" handbooks for project evaluation.
The first publication, User-Friendly Handbook for Project Evaluation: Science, Mathematics,Engineering and Technology Education, issued in 1993, describes the types of evaluations principalinvestigators/project directors (PIs/PDs) may be called upon to perform over the lifetime of a project. Italso describes in some detail the evaluation process, which includes the development of evaluationquestions and the collection and analysis of appropriate data to provide answers to these questions.Although this first handbook discussed both qualitative and quantitative methods, it covered techniquesthat produce numbers (quantitative data) in greater detail. This approach was chosen becausedecisionmakers usually demand quantitative (statistically documented) evidence of results. Indicatorsthat are often selected to document outcomes include percentage of targeted populations participating inmathematics and science courses, test scores, and percentage of targeted populations selecting careers inthe mathematics and science fields.
The current handbook, User-Friendly Guide to Mixed Method Evaluations, builds on the first but seeksto introduce a broader perspective. It was initiated because of the recognition that by focusing primarilyon quantitative techniques, evaluators may miss important parts of a story. Experienced evaluators have
Part I: Chapter 1: Introducing This Handbook
http://www.ehr.nsf.gov/EHR/REC/pubs/NSF97-153/CHAP_1.HTM (1 of 8) [03/12/2001 11:05:23 AM]

found that most often the best results are achieved through the use of mixed method evaluations, whichcombine quantitative and qualitative techniques. Because the earlier handbook did not include an indepthdiscussion of the collection and analysis of qualitative data, this handbook was initiated to provide moreinformation on qualitative techniques and discuss how they can be combined effectively withquantitative measures.
Like the earlier publication, this handbook is aimed at users who need practical rather than technicallysophisticated advice about evaluation methodology. The main objective is to make PIs and PDs"evaluation smart" and to provide the knowledge needed for planning and managing useful evaluations.
Key Concepts and AssumptionsWhy Conduct an Evaluation?
There are two simple reasons for conducting an evaluation:
To gain direction for improving projects as they are developing, and●
To determine projects’ effectiveness after they have had time to produce results.●
Formative evaluations (which include implementation and process evaluations) address the first set ofissues. They examine the development of the project and may lead to changes in the way the project isstructured and carried out. Questions typically asked include:
To what extent do the activities and strategies match those described in the plan? If they do notmatch, are the changes in the activities justified and described?
●
To what extent were the activities conducted according to the proposed timeline? By theappropriate personnel?
●
To what extent are the actual costs of project implementation in line with initial budgetexpectations?
●
To what extent are the participants moving toward the anticipated goals of the project?●
Which of the activities or strategies are aiding the participants to move toward the goals?●
What barriers were encountered? How and to what extent were they overcome?●
Summative evaluations (also called outcome or impact evaluations) address the second set of issues.They look at what a project has actually accomplished in terms of its stated goals. Summative evaluationquestions include:
To what extent did the project meet its overall goals?●
Was the project equally effective for all participants?●
What components were the most effective?●
What significant unintended impacts did the project have?●
Is the project replicable and transportable?●
For each of these questions, both quantitative data (data expressed in numbers) and qualitative data (dataexpressed in narratives or words) can be useful in a variety of ways.
The remainder of this chapter provides some background on the differing and complementary nature of
Part I: Chapter 1: Introducing This Handbook
http://www.ehr.nsf.gov/EHR/REC/pubs/NSF97-153/CHAP_1.HTM (2 of 8) [03/12/2001 11:05:23 AM]

quantitative and qualitative evaluation methodologies. The aim is to provide an overview of theadvantages and disadvantages of each, as well as an idea of some of the more controversial issuesconcerning their use.
Before doing so, however, it is important to stress that there are many ways of performing projectevaluations, and that there is no recipe or formula that is best for every case. Quantitative and qualitativemethods each have advantages and drawbacks when it comes to an evaluation's design, implementation,findings, conclusions, and utilization. The challenge is to find a judicious balance in any particularsituation. According to Cronbach (1982),
There is no single best plan for an evaluation, not even for an inquiry into a particular program at aparticular time, with a particular budget.
What Are the Major Differences Between Quantitative and Qualitative Techniques?
As shown in Exhibit 1, quantitative and qualitative measures are characterized by different techniques fordata collection.
Exhibit 1. Common techniques
Quantitative Qualitative
QuestionnairesTestsExisting databases
ObservationsInterviewsFocus groups
Aside from the most obvious distinction between numbers and words, the conventional wisdom amongevaluators is that qualitative and quantitative methods have different strengths, weaknesses, andrequirements that will affect evaluators’ decisions about which methodologies are best suited for theirpurposes. The issues to be considered can be classified as being primarily theoretical or practical.
Theoretical issues. Most often, these center on one of three topics:
The value of the types of data;●
The relative scientific rigor of the data; or●
Basic, underlying philosophies of evaluation.●
Value of the data. Quantitative and qualitative techniques provide a tradeoff between breadth and depthand between generalizability and targeting to specific (sometimes very limited) populations. Forexample, a sample survey of high school students who participated in a special science enrichmentprogram (a quantitative technique) can yield representative and broadly generalizable information aboutthe proportion of participants who plan to major in science when they get to college and how thisproportion differs by gender. But at best, the survey can elicit only a few, often superficial reasons forthis gender difference. On the other hand, separate focus groups (a qualitative technique) conducted withsmall groups of male and female students will provide many more clues about gender differences in thechoice of science majors and the extent to which the special science program changed or reinforcedattitudes. But this technique may be limited in the extent to which findings apply beyond the specific
Part I: Chapter 1: Introducing This Handbook
http://www.ehr.nsf.gov/EHR/REC/pubs/NSF97-153/CHAP_1.HTM (3 of 8) [03/12/2001 11:05:23 AM]

individuals included in the focus groups.
Scientific rigor. Data collected through quantitative methods are often believed to yield more objectiveand accurate information because they were collected using standardized methods, can be replicated, and,unlike qualitative data, can be analyzed using sophisticated statistical techniques. In line with thesearguments, traditional wisdom has held that qualitative methods are most suitable for formativeevaluations, whereas summative evaluations require "hard" (quantitative) measures to judge the ultimatevalue of the project.
This distinction is too simplistic. Both approaches may or may not satisfy the canons of scientific rigor.Quantitative researchers are becoming increasingly aware that some of their data may not be accurateand valid, because some survey respondents may not understand the meaning of questions to which theyrespond, and because people’s recall of even recent events is often faulty. On the other hand, qualitativeresearchers have developed better techniques for classifying and analyzing large bodies of descriptivedata. It is also increasingly recognized that all data collection - quantitative and qualitative - operateswithin a cultural context and is affected to some extent by the perceptions and beliefs of investigators anddata collectors.
Philosophical distinction. Some researchers and scholars differ about the respective merits of the twoapproaches largely because of different views about the nature of knowledge and how knowledge is bestacquired. Many qualitative researchers argue that there is no objective social reality, and that allknowledge is "constructed" by observers who are the product of traditions, beliefs, and the social andpolitical environment within which they operate. And while quantitative researchers no longer believethat their research methods yield absolute and objective truth, they continue to adhere to the scientificmodel and seek to develop increasingly sophisticated techniques and statistical tools to improve themeasurement of social phenomena. The qualitative approach emphasizes the importance ofunderstanding the context in which events and outcomes occur, whereas quantitative researchers seek tocontrol the context by using random assignment and multivariate analyses. Similarly, qualitativeresearchers believe that the study of deviant cases provides important insights for the interpretation offindings; quantitative researchers tend to ignore the small number of deviant and extreme cases.
This distinction affects the nature of research designs. According to its most orthodox practitioners,qualitative research does not start with narrowly specified evaluation questions; instead, specificquestions are formulated after open-ended field research has been completed (Lofland and Lofland,1995). This approach may be difficult for program and project evaluators to adopt, since specificquestions about the effectiveness of interventions being evaluated are usually expected to guide theevaluation. Some researchers have suggested that a distinction be made between Qualitative andqualitative work: Qualitative work (large Q) refers to methods that eschew prior evaluation questions andhypothesis testing, whereas qualitative work (small q) refers to open-ended data collection methods suchas indepth interviews embedded in structured research (Kidder and Fine, 1987). The latter are morelikely to meet EHR evaluators' needs.
Practical issues. On the practical level, there are four issues which can affect the choice of method:
Credibility of findings;●
Staff skills;●
Costs; and●
Part I: Chapter 1: Introducing This Handbook
http://www.ehr.nsf.gov/EHR/REC/pubs/NSF97-153/CHAP_1.HTM (4 of 8) [03/12/2001 11:05:23 AM]

Time constraints.●
Credibility of findings. Evaluations are designed for various audiences, including funding agencies,policymakers in governmental and private agencies, project staff and clients, researchers in academic andapplied settings, as well as various other "stakeholders" (individuals and organizations with a stake in theoutcome of a project). Experienced evaluators know that they often deal with skeptical audiences orstakeholders who seek to discredit findings that are too critical or uncritical of a project's outcomes. Forthis reason, the evaluation methodology may be rejected as unsound or weak for a specific case.
The major stakeholders for EHR projects are policymakers within NSF and the federal government, stateand local officials, and decisionmakers in the educational community where the project is located. Inmost cases, decisionmakers at the national level tend to favor quantitative information because thesepolicymakers are accustomed to basing funding decisions on numbers and statistical indicators. On theother hand, many stakeholders in the educational community are often skeptical about statistics and"number crunching" and consider the richer data obtained through qualitative research to be moretrustworthy and informative. A particular case in point is the use of traditional test results, a favoriteoutcome criterion for policymakers, school boards, and parents, but one that teachers and schooladministrators tend to discount as a poor tool for assessing true student learning.
Staff skills. Qualitative methods, including indepth interviewing, observations, and the use of focusgroups, require good staff skills and considerable supervision to yield trustworthy data. Somequantitative research methods can be mastered easily with the help of simple training manuals; this istrue of small-scale, self-administered questionnaires, where most questions can be answered by yes/nocheckmarks or selecting numbers on a simple scale. Large-scale, complex surveys, however, usuallyrequire more skilled personnel to design the instruments and to manage data collection and analysis.
Costs. It is difficult to generalize about the relative costs of the two methods; much depends on theamount of information needed, quality standards followed for the data collection, and the number ofcases required for reliability and validity. A short survey based on a small number of cases (25-50) andconsisting of a few "easy" questions would be inexpensive, but it also would provide only limited data.Even cheaper would be substituting a focus group session for a subset of the 25-50 respondents; whilethis method might provide more "interesting" data, those data would be primarily useful for generatingnew hypotheses to be tested by more appropriate qualitative or quantitative methods. To obtain robustfindings, the cost of data collection is bound to be high regardless of method.
Time constraints. Similarly, data complexity and quality affect the time needed for data collection andanalysis. Although technological innovations have shortened the time needed to process quantitativedata, a good survey requires considerable time to create and pretest questions and to obtain high responserates. However, qualitative methods may be even more time consuming because data collection and dataanalysis overlap, and the process encourages the exploration of new evaluation questions (see Chapter 4).If insufficient time is allowed for the evaluation, it may be necessary to curtail the amount of data to becollected or to cut short the analytic process, thereby limiting the value of the findings. For evaluationsthat operate under severe time constraints - for example, where budgetary decisions depend on thefindings - the choice of the best method can present a serious dilemma.
In summary, the debate over the merits of qualitative versus quantitative methods is ongoing in theacademic community, but when it comes to the choice of methods for conducting project evaluations, apragmatic strategy has been gaining increased support. Respected practitioners have argued for
Part I: Chapter 1: Introducing This Handbook
http://www.ehr.nsf.gov/EHR/REC/pubs/NSF97-153/CHAP_1.HTM (5 of 8) [03/12/2001 11:05:23 AM]

integrating the two approaches building on their complementary strengths.1 Others have stressed theadvantages of linking qualitative and quantitative methods when performing studies and evaluations,showing how the validity and usefulness of findings will benefit (Miles and Huberman, 1994).
1 See especially the article by William R. Shadish in Program Evaluation: A Pluralistic Enterprise, New Directions forProgram Evaluation, No. 60 (San Francisco: Jossey-Bass. (Winter 1993).
Why Use a Mixed Method Approach?
The assumption guiding this handbook is that a strong case can be made for using an approach thatcombines quantitative and qualitative elements in most evaluations of EHR projects. We offer thisassumption because most of the interventions sponsored by EHR are not introduced into a sterilelaboratory, but rather into a complex social environment with features that affect the success of theproject. To ignore the complexity of the background is to impoverish the evaluation. Similarly, wheninvestigating human behavior and attitudes, it is most fruitful to use a variety of data collection methods(Patton, 1990). By using different sources and methods at various points in the evaluation process, theevaluation team can build on the strength of each type of data collection and minimize the weaknesses ofany single approach. A multimethod approach to evaluation can increase both the validity and reliabilityof evaluation data.
The range of possible benefits that carefully crafted mixed method designs can yield has beenconceptualized by a number of evaluators. 2
The validity of results can be strengthened by using more than one method to study the samephenomenon. This approach - called triangulation - is most often mentioned as the mainadvantage of the mixed method approach.
●
Combining the two methods pays off in improved instrumentation for all data collectionapproaches and in sharpening the evaluator's understanding of findings. A typical design mightstart out with a qualitative segment such as a focus group discussion, which will alert the evaluatorto issues that should be explored in a survey of program participants, followed by the survey,which in turn is followed by indepth interviews to clarify some of the survey findings (Exhibit 2).
●
Exhibit 2.Example of a mixed method design
Quantitative Qualitative Qualitative
(questionnaire) (exploratory focus group) (personal interview with subgroup)
But this sequential approach is only one of several that evaluators might find useful (Miles andHuberman, 1994). Thus, if an evaluator has identified subgroups of program participants or specific
Part I: Chapter 1: Introducing This Handbook
http://www.ehr.nsf.gov/EHR/REC/pubs/NSF97-153/CHAP_1.HTM (6 of 8) [03/12/2001 11:05:23 AM]

topics for which indepth information is needed, a limited qualitative data collection can be initiated whilea more broad-based survey is in progress.
A mixed method approach may also lead evaluators to modify or expand the evaluation designand/or the data collection methods. This action can occur when the use of mixed methods uncoversinconsistencies and discrepancies that alert the evaluator to the need for reexamining theevaluation framework and/or the data collection and analysis procedures used.
●
There is a growing consensus among evaluation experts that both qualitative and quantitative methodshave a place in the performance of effective evaluations. Both formative and summative evaluations areenriched by a mixed method approach.
2 For a full discussion of this topic, see Jennifer C. Greene, Valerie J. Caracelli, and Wendy F. Graham, Toward aConceptual Framework for Mixed Method Evaluation Designs, Educational Evaluation and Policy Analysis, Vol. 11, No.3, (Fall 1989), pp.255-274.
How To Use This Handbook
This handbook covers a lot of ground, and not all readers will want to read it from beginning to end. Forthose who prefer to sample sections, some organizational features are highlighted below.
To provide practical illustrations throughout the handbook, we have invented a hypotheticalproject, which is summarized in the next chapter (Part 1, Chapter 2); the various stages of theevaluation design for this project will be found in Part 3, Chapter 6. These two chapters may beespecially useful for evaluators who have not been involved in designing evaluations for major,multisite EHR projects.
●
Part 2, Chapter 3 focuses on qualitative methodologies, and Chapter 4 deals with analysisapproaches for qualitative data. These two chapters are intended to supplement the information onquantitative methods in the previous handbook.
●
Part 3, Chapters 5, 6, and 7 covers the basic steps in developing a mixed method evaluation designand describes ways of reporting findings to NSF and other stakeholders.
●
Part 4 presents supplementary material, including an annotated bibliography and a glossary ofcommon terms.
●
Before turning to these issues, however, we present the hypothetical NSF project that is used as ananchoring point for discussing the issues presented in the subsequent chapters.
References
Cronbach, L. (1982). Designing Evaluations of Educational and Social Programs. San Francisco:Jossey-Bass.
Kidder, L., and Fine, M. (1987). Qualitative and Quantitative Methods: When Stories Converge. Multiple
Part I: Chapter 1: Introducing This Handbook
http://www.ehr.nsf.gov/EHR/REC/pubs/NSF97-153/CHAP_1.HTM (7 of 8) [03/12/2001 11:05:23 AM]
Methods in Program Evaluation. New Directions for Program Evaluation, No. 35. San Francisco:Jossey-Bass.
Lofland, J., and Lofland, L.H. (1995). Analyzing Social Settings: A Guide to Qualitative Observation andAnalysis. Belmont, CA: Wadsworth Publishing Company.
Miles, M.B., and Huberman, A.M. (1994). Qualitative Data Analysis, 2nd Ed. Newbury Park, CA: Sage,p. 40-43.
National Science Foundation. (1993). User-Friendly Handbook for Project Evaluation: Science,Mathematics, Engineering and Technology Education. NSF 93-152. Arlington, VA: NSF.
Patton, M.Q. (1990). Qualitative Evaluation and Research Methods, 2nd Ed. Newbury Park, CA: Sage.
Previous Chapter | Back to Top | Next Chapter
Table of Contents
Part I: Chapter 1: Introducing This Handbook
http://www.ehr.nsf.gov/EHR/REC/pubs/NSF97-153/CHAP_1.HTM (8 of 8) [03/12/2001 11:05:23 AM]

Directorate for Educationand Human Resources
Division of Research,Evaluation and Communication
National Science Foundation
User-Friendly Handbook forMixed Method Evaluations
The National Science Foundation (NSF) provides awards for research and education in the sciences and engineering. Theawardee is wholly responsible for the conduct of such research and preparation of the results for publication. NSF,therefore, does not assume responsibility for the research findings or their interpretation.
NSF welcomes proposals from all qualified scientists and engineers and strongly encourages women, minorities, andpersons with disabilities to compete fully in any of the research-related programs described here. In accordance withfederal statutes, regulations, and NSF policies, no person on grounds of race, color, age, sex, national origin, or disabilityshall be excluded from participation in, be denied the benefits of, or be subject to discrimination under any program oractivity receiving financial assistance from NSF.
Facilitation Awards for Scientists and Engineers with Disabilities (FASED) provide funding for special assistance orequipment to enable persons with disabilities (investigators and other staff, including student research assistants) to workon NSF projects. See the program announcement or contact the program coordinator at (703) 306-1636.
NSF has TDD (Telephonic Device for the Deaf) capability, which enables individuals with hearing impairment tocommunicate with NSF about programs, employment, or general information. To access NSF TDD dial (703) 306-0090;for the Federal Information Relay Service (FIRS), 1-800-877-8339.
Mixed-Method Evaluations: Start
http://www.ehr.nsf.gov/EHR/REC/pubs/NSF97-153/START.HTM (1 of 5) [03/12/2001 11:06:03 AM]

AcknowledgmentsAppreciation is expressed to our external advisory panel Dr. Frances Lawrenz, Dr. Jennifer Greene, Dr.Mary Ann Millsap, and Steve Dietz for their comprehensive reviews of this document and their helpfulsuggestions. We also appreciate the direction provided by Dr. Conrad Katzenmeyer and Mr. James Dietzof the Division of Research, Evaluation and Communication.
User-Friendly Handbook for Mixed Method Evaluations
Edited by
Joy FrechtlingLaure Sharp
Westat
August 1997
NSF Program OfficerConrad Katzenmeyer
Directorate for Educationand Human Resources
Division of Research,Evaluation and Communication
This handbook was developed with support from the National Science Foundation RED 94-52965.
Mixed-Method Evaluations: Start
http://www.ehr.nsf.gov/EHR/REC/pubs/NSF97-153/START.HTM (2 of 5) [03/12/2001 11:06:03 AM]
Table of Contents
Part I. Introduction to Mixed Method EvaluationsIntroducing This Handbook(Laure Sharp and Joy Frechtling)
1.
The Need for a Handbook on Designing and Conducting Mixed Method EvaluationsKey Concepts and Assumptions
Illustration: A Hypothetical Project(Laure Sharp)
2.
Project TitleProject DescriptionProject Goals as Stated in the Grant Application to NSFOverview of the Evaluation Plan
Part II. Overview of Qualitative Methods and Analytic TechniquesCommon Qualitative Methods(Colleen Mahoney)
3.
ObservationsInterviewsFocus GroupsOther Qualitative Methods
Appendix A: Sample Observation InstrumentAppendix B: Sample Indepth Interview GuideAppendix C: Sample Focus Group Topic Guide
Analyzing Qualitative Data(Susan Berkowitz)
4.
What Is Qualitative Analysis?Processes in Qualitative AnalysisSummary: Judging the Quality of Qualitative AnalysisPractical Advice in Conducting Qualitative Analyses
Part III. Designing and Reporting Mixed Method EvaluationsOverview of the Design Process for Mixed Method Evaluation(Laure Sharp and Joy Frechtling)
5.
Developing Evaluation Questions
Mixed-Method Evaluations: Start
http://www.ehr.nsf.gov/EHR/REC/pubs/NSF97-153/START.HTM (3 of 5) [03/12/2001 11:06:03 AM]

Selecting Methods for Gathering the Data: The Case for Mixed Method DesignsOther Considerations in Designing Mixed Method Evaluations
Evaluation Design for the Hypothetical Project(Laure Sharp)
6.
Step 1. Develop Evaluation Questions
Step 2. Determine Appropriate Data Sources and Data Collection Approaches to Obtain Answersto the Final Set of Evaluation Questions
Step 3. Reality Testing and Design Modifications: Staff Needs, Costs, Time Frame Within WhichAll Tasks (Data Collection, Data Analysis, and Reporting Writing) Must Be Completed
Reporting the Results of Mixed Method Evaluations(Gary Silverstein and Laure Sharp)
7.
Ascertaining the Interests and Needs of the AudienceOrganizing and Consolidating the Final ReportFormulating Sound Conclusions and RecommendationsMaintaining ConfidentialityTips for Writing Good Evaluation Reports
Part IV. Supplementary MaterialsAnnotated Bibliography8.
Glossary9.
List of ExhibitsCommon techniques1.
Example of a mixed method design2.
Advantages and disadvantages of observations3.
Types of information for which observations are a good source4.
Advantages and disadvantages of indepth interviews5.
Considerations in conducting indepth interviews and focus groups6.
Which to use: Focus groups or indepth interviews?7.
Advantages and disadvantages of document studies8.
Advantages and disadvantages of using key informants9.
Data matrix for Campus A: What was done to share knowledge10.
Participants’ views of information sharing at eight campuses11.
Matrix of cross-case analysis linking implementation and outcome factors12.
Goals, stakeholders, and evaluation questions for a formative evaluation13.
Mixed-Method Evaluations: Start
http://www.ehr.nsf.gov/EHR/REC/pubs/NSF97-153/START.HTM (4 of 5) [03/12/2001 11:06:03 AM]
Goals, stakeholders, and evaluation questions for a summative evaluation14.
Evaluation questions, data sources, and data collection methods for a formative evaluation15.
Evaluation questions, data sources, and data collection methods for a summative evaluation16.
First data collection plan17.
Final data collection plan18.
Matrix of stakeholders19.
Example of an evaluation/methodology matrix20.
Back to Top | To Chapter 1
Mixed-Method Evaluations: Start
http://www.ehr.nsf.gov/EHR/REC/pubs/NSF97-153/START.HTM (5 of 5) [03/12/2001 11:06:03 AM]

Chapter 2: Illustration: A HypotheticalProject
Project TitleUndergraduate Faculty Enhancement: Introducing faculty in state universities and colleges to newconcepts and methods in preservice mathematics instruction.
Project DescriptionIn response to the growing national concern about the quality of American elementary and secondaryeducation and especially about students' achievement in mathematics and science, considerable effortshave been directed at enhancing the skills of the teachers in the labor force through inservice training.Less attention has been focused on preservice training, especially for elementary school teachers, mostof whom are educated in departments and schools of education. In many institutions, faculty memberswho provide this instruction need to become more conversant with the new standards and instructionaltechniques for the teaching of mathematics in elementary schools.
The proposed pilot project was designed to examine a strategy for meeting this need. The projectattempts to improve preservice education by giving the faculty teaching courses in mathematics to futureelementary school teachers new knowledge, skills, and approaches for incorporation into theirinstruction. In the project, the investigators ascertain the extent of faculty members' knowledge aboutstandards-based instruction, engage them in expanding their understanding of standards-based reformand the instructional approaches that support high-quality teaching; and assess the extent to which thestrategies emphasized and demonstrated in the pilot project are transferred to the participants' ownclassroom practices.
The project is being carried out on the main campus of a major state university under the leadership ofthe Director of the Center for Educational Innovation. Ten day-long workshops will be offered to twocohorts of faculty members from the main campus and branch campuses. These workshops will besupplemented by opportunities for networking among participating faculty members and the exchange ofexperiences and recommendations during a summer session following the academic year. The workshopsare based on an integrated plan for reforming undergraduate education for future elementary teachers.The focus of the workshops is to provide carefully articulated information and practice on currentapproaches to mathematics instruction (content and pedagogy) in elementary grades, consistent with stateframeworks and standards of excellence. The program uses and builds on the knowledge of contentexperts, master practitioners, and teacher educators.
The following strategies are being employed in the workshops: presentations, discussions, hands-onexperiences with various traditional and innovative tools, coaching, and videotaped demonstrations ofmodel teaching. The summer session is offered for sharing experiences, reflecting on successful andunsuccessful applications, and constructing new approaches. In addition, participants are encouraged to
Part I: Chapter 2: Illustration: A Hypothetical Project
http://www.ehr.nsf.gov/EHR/REC/pubs/NSF97-153/CHAP_2.HTM (1 of 3) [03/12/2001 11:06:47 AM]

communicate with each other throughout the year via e-mail. Project activities are funded for 2 years andare expected to support two cohorts of participants; funding for an additional 6-month period to allowperformance of the summative evaluation has been included.
Participation is limited to faculty members on the main campus and in the seven 4-year branch campusesof the state university where courses in elementary mathematics education are offered. Participants areselected on the basis of a written essay and a commitment to attend all sessions and to try suggestedapproaches in their classroom. A total of 25 faculty members are to be enrolled in the workshops eachyear. During the life of the project, roughly 1,000 undergraduate students will be enrolled in classestaught by the participating faculty members.
Project Goals as Stated in the Grant Application toNSFAs presented in the grant application, the project has four main goals:
To further the knowledge of college faculty with respect to new concepts, standards, and methodsfor mathematics education in elementary schools;
●
To enable and encourage faculty members to incorporate these approaches in their own classroomactivities and, hopefully, into the curricula of their institutions;
●
To stimulate their students’ interest in teaching mathematics and in using the new techniques whenthey become elementary school teachers; and
●
To test a model for achieving these goals.●
Overview of the Evaluation PlanA staff member of the Center for Educational Innovation with prior evaluation experience was assignedresponsibility for the evaluation. She will be assisted by undergraduate and graduate students. Asrequired, consultation will be provided by members of the Center’s statistical and research staff and byfaculty members on the main campus who have played leadership roles in reforming mathematicseducation.
A formative (progress) evaluation will be carried out at the end of the first year. A summative (outcome)evaluation is to be completed 6 months after project termination. Because the project was conceived as aprototype for future expansion to other institutions, a thorough evaluation was considered an essentialcomponent, and the evaluation budget represented a higher-than-usual percentage of total costs (projectcosts were $500,000, of which $75,000 was allocated for evaluation).
The evaluation designs included in the application were specified only in general terms. The formativeevaluation would look at the implementation of the program and be used for identifying its strengths andweaknesses. Suggested formative evaluation questions included the following:
Part I: Chapter 2: Illustration: A Hypothetical Project
http://www.ehr.nsf.gov/EHR/REC/pubs/NSF97-153/CHAP_2.HTM (2 of 3) [03/12/2001 11:06:47 AM]

Were the workshops delivered and staffed as planned? If not, what were the reasons?●
Was the workshop content (disciplinary and pedagogical) accurate and up to date?●
Did the instructors communicate effectively with participants, stimulate questions, and encourageall participants to take part in discussions?
●
Were appropriate materials available?●
Did the participants have the opportunity to engage in inquiry-based activities?●
Was there an appropriate balance of knowledge building and application?●
The summative evaluation was intended to document the extent to which participants introduced changesin their classroom teaching and to determine which components of the workshops were especiallyeffective in this respect. The proposal also promised to investigate the impact of the workshops onparticipating faculty members, especially on their acquisition of knowledge and skills. Furthermore, theimpact on other faculty members, on the institution, and on students was to be part of the evaluation.Recommendations for replicating this project in other institutions, and suggestions for changes in theworkshop content or administrative arrangements, were to be included in the summative evaluation.Proposed summative evaluation questions included the following:
To what extent did the participants use what they were taught in their own instruction or activities?Which topics and techniques were most often (or least often) incorporated?
●
To what extent did participants share their recently acquired knowledge and skills with otherfaculty? Which topics were frequently discussed? Which ones were not?
●
To what extent was there an impact on the students of these teachers? Had they become more (orless) positive about making the teaching of elementary mathematics an important component oftheir future career?
●
Did changes occur in the overall program of instruction offered to potential elementarymathematics teachers? What were the obstacles to the introduction of changes?
●
The proposal also enumerated possible data sources for conducting the evaluations, includingself-administered questionnaires completed after each workshop, indepth interviews with knowledgeableinformants, focus groups, observation of workshops, classroom observations, and surveys of students. Itwas stated that a more complete design for the formative and summative evaluations would be developedafter contract award.
Previous Chapter | Back to Top | Next Chapter
Table of Contents
Part I: Chapter 2: Illustration: A Hypothetical Project
http://www.ehr.nsf.gov/EHR/REC/pubs/NSF97-153/CHAP_2.HTM (3 of 3) [03/12/2001 11:06:47 AM]

PART II.
Overview of Qualitative Methodsand Analytic Techniques
Chapter 3Common Qualitative MethodsIn this chapter we describe and compare the most common qualitative methods employed in projectevaluations.3 These include observations, indepth interviews, and focus groups. We also cover brieflysome other less frequently used qualitative techniques. Advantages and disadvantages are summarized.For those readers interested in learning more about qualitative data collection methods, a list ofrecommended readings is provided.
3 Information on common qualitative methods is provided in the earlier User-Friendly Handbook for Project Evaluation(NSF 93-152).
ObservationsObservational techniques are methods by which an individual or individuals gather firsthand data onprograms, processes, or behaviors being studied. They provide evaluators with an opportunity to collectdata on a wide range of behaviors, to capture a great variety of interactions, and to openly explore theevaluation topic. By directly observing operations and activities, the evaluator can develop a holisticperspective, i.e., an understanding of the context within which the project operates. This may beespecially important where it is not the event that is of interest, but rather how that event may fit into, orbe impacted by, a sequence of events. Observational approaches also allow the evaluator to learn aboutthings the participants or staff may be unaware of or that they are unwilling or unable to discuss in aninterview or focus group.
When to use observations. Observations can be useful during both the formative and summative phasesof evaluation. For example, during the formative phase, observations can be useful in determiningwhether or not the project is being delivered and operated as planned. In the hypothetical project,observations could be used to describe the faculty development sessions, examining the extent to whichparticipants understand the concepts, ask the right questions, and are engaged in appropriate interactions.Such formative observations could also provide valuable insights into the teaching styles of thepresenters and how they are covering the material.
Part II: Chapter 3: Common Qualitative Methods
http://www.ehr.nsf.gov/EHR/REC/pubs/NSF97-153/CHAP_3.HTM (1 of 17) [03/12/2001 11:07:15 AM]

Exhibit 3.Advantages and disadvantages of observations
Advantages
Provide direct information about behavior of individuals and groups
Permit evaluator to enter into and understand situation/context
Provide good opportunities for identifying unanticipated outcomes
Exist in natural, unstructured, and flexible setting
Disadvantages
Expensive and time consuming
Need well-qualified, highly trained observers; may need to be content experts
May affect behavior of participants
Selective perception of observer may distort data
Investigator has little control over situation
Behavior or set of behaviors observed may be atypical
Observations during the summative phase of evaluation can be used to determine whether or not theproject is successful. The technique would be especially useful in directly examining teaching methodsemployed by the faculty in their own classes after program participation. Exhibits 3 and 4 display theadvantages and disadvantages of observations as a data collection tool and some common types of datathat are readily collected by observation.
Readers familiar with survey techniques may justifiably point out that surveys can address these samequestions and do so in a less costly fashion. Critics of surveys find them suspect because of their relianceon self-report, which may not provide an accurate picture of what is happening because of the tendency,intentional or not, to try to give the "right answer." Surveys also cannot tap into the contextual element.Proponents of surveys counter that properly constructed surveys with built in checks and balances canovercome these problems and provide highly credible data. This frequently debated issue is best decidedon a case-by-case basis.
Recording Observational Data
Observations are carried out using a carefully developed set of steps and instruments. The observer ismore than just an onlooker, but rather comes to the scene with a set of target concepts, definitions, andcriteria for describing events. While in some studies observers may simply record and describe, in themajority of evaluations, their descriptions are, or eventually will be, judged against a continuum ofexpectations.
Observations usually are guided by a structured protocol. The protocol can take a variety of forms,ranging from the request for a narrative describing events seen to a checklist or a rating scale of specific
Part II: Chapter 3: Common Qualitative Methods
http://www.ehr.nsf.gov/EHR/REC/pubs/NSF97-153/CHAP_3.HTM (2 of 17) [03/12/2001 11:07:15 AM]
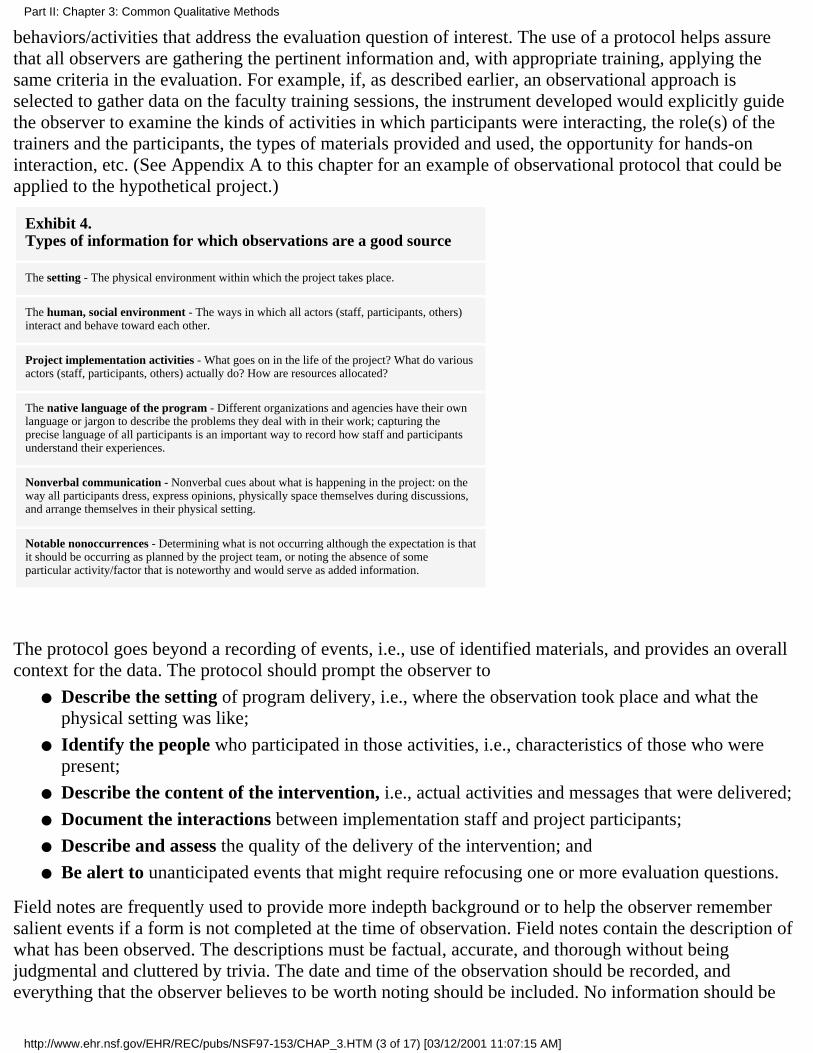
behaviors/activities that address the evaluation question of interest. The use of a protocol helps assurethat all observers are gathering the pertinent information and, with appropriate training, applying thesame criteria in the evaluation. For example, if, as described earlier, an observational approach isselected to gather data on the faculty training sessions, the instrument developed would explicitly guidethe observer to examine the kinds of activities in which participants were interacting, the role(s) of thetrainers and the participants, the types of materials provided and used, the opportunity for hands-oninteraction, etc. (See Appendix A to this chapter for an example of observational protocol that could beapplied to the hypothetical project.)
Exhibit 4.Types of information for which observations are a good source
The setting - The physical environment within which the project takes place.
The human, social environment - The ways in which all actors (staff, participants, others)interact and behave toward each other.
Project implementation activities - What goes on in the life of the project? What do variousactors (staff, participants, others) actually do? How are resources allocated?
The native language of the program - Different organizations and agencies have their ownlanguage or jargon to describe the problems they deal with in their work; capturing theprecise language of all participants is an important way to record how staff and participantsunderstand their experiences.
Nonverbal communication - Nonverbal cues about what is happening in the project: on theway all participants dress, express opinions, physically space themselves during discussions,and arrange themselves in their physical setting.
Notable nonoccurrences - Determining what is not occurring although the expectation is thatit should be occurring as planned by the project team, or noting the absence of someparticular activity/factor that is noteworthy and would serve as added information.
The protocol goes beyond a recording of events, i.e., use of identified materials, and provides an overallcontext for the data. The protocol should prompt the observer to
Describe the setting of program delivery, i.e., where the observation took place and what thephysical setting was like;
●
Identify the people who participated in those activities, i.e., characteristics of those who werepresent;
●
Describe the content of the intervention, i.e., actual activities and messages that were delivered;●
Document the interactions between implementation staff and project participants;●
Describe and assess the quality of the delivery of the intervention; and●
Be alert to unanticipated events that might require refocusing one or more evaluation questions.●
Field notes are frequently used to provide more indepth background or to help the observer remembersalient events if a form is not completed at the time of observation. Field notes contain the description ofwhat has been observed. The descriptions must be factual, accurate, and thorough without beingjudgmental and cluttered by trivia. The date and time of the observation should be recorded, andeverything that the observer believes to be worth noting should be included. No information should be
Part II: Chapter 3: Common Qualitative Methods
http://www.ehr.nsf.gov/EHR/REC/pubs/NSF97-153/CHAP_3.HTM (3 of 17) [03/12/2001 11:07:15 AM]

trusted to future recall.
The use of technological tools, such as battery-operated tape recorder or dictaphone, laptop computer,camera, and video camera, can make the collection of field notes more efficient and the notes themselvesmore comprehensive. Informed consent must be obtained from participants before any observational dataare gathered.
The Role of the Observer
There are various methods for gathering observational data, depending on the nature of a given project.The most fundamental distinction between various observational strategies concerns the extent to whichthe observer will be a participant in the setting being studied. The extent of participation is a continuumthat varies from complete involvement in the setting as a full participant to complete separation from thesetting as an outside observer or spectator. The participant observer is fully engaged in experiencing theproject setting while at the same time trying to understand that setting through personal experience,observations, and interactions and discussions with other participants. The outside observer stands apartfrom the setting, attempts to be nonintrusive, and assumes the role of a "fly-on-the-wall." The extent towhich full participation is possible and desirable will depend on the nature of the project and itsparticipants, the political and social context, the nature of the evaluation questions being asked, and theresources available. "The ideal is to negotiate and adopt that degree of participation that will yield themost meaningful data about the program given the characteristics of the participants, the nature ofstaff-participant interactions, and the sociopolitical context of the program" (Patton, 1990).
In some cases it may be beneficial to have two people observing at the same time. This can increase thequality of the data by providing a larger volume of data and by decreasing the influence of observer bias.However, in addition to the added cost, the presence of two observers may create an environmentthreatening to those being observed and cause them to change their behavior. Studies using observationtypically employ intensive training experiences to make sure that the observer or observers know what tolook for and can, to the extent possible, operate in an unbiased manner. In long or complicated studies, itis useful to check on an observer’s performance periodically to make sure that accuracy is beingmaintained. The issue of training is a critical one and may make the difference between a defensiblestudy and what can be challenged as "one person’s perspective."
A special issue with regard to observations relates to the amount of observation needed. While inparticipant observation this may be a moot point (except with regard to data recording), when an outsideobserver is used, the question of "how much" becomes very important. While most people agree that oneobservation (a single hour of a training session or one class period of instruction) is not enough, there isno hard and fast rule regarding how many samples need to be drawn. General tips to consider are toavoid atypical situations, carry out observations more than one time, and (where possible and relevant)spread the observations out over time.
Participant observation is often difficult to incorporate in evaluations; therefore, the use of outsideobservers is far more common. In the hypothetical project, observations might be scheduled for alltraining sessions and for a sample of classrooms, including some where faculty members whoparticipated in training were teaching and some staffed by teachers who had not participated in the
Part II: Chapter 3: Common Qualitative Methods
http://www.ehr.nsf.gov/EHR/REC/pubs/NSF97-153/CHAP_3.HTM (4 of 17) [03/12/2001 11:07:15 AM]

training.
Issues of privacy and access. Observational techniques are perhaps the most privacy-threatening datacollection technique for staff and, to a lesser extent, participants. Staff fear that the data may be includedin their performance evaluations and may have effects on their careers. Participants may also feeluncomfortable assuming that they are being judged. Evaluators need to assure everyone that evaluationsof performance are not the purpose of the effort, and that no such reports will result from theobservations. Additionally, because most educational settings are subject to a constant flow of observersfrom various organizations, there is often great reluctance to grant access to additional observers. Mucheffort may be needed to assure project staff and participants that they will not be adversely affected bythe evaluators’ work and to negotiate observer access to specific sites.
InterviewsInterviews provide very different data from observations: they allow the evaluation team to capture theperspectives of project participants, staff, and others associated with the project. In the hypotheticalexample, interviews with project staff can provide information on the early stages of the implementationand problems encountered. The use of interviews as a data collection method begins with the assumptionthat the participants’ perspectives are meaningful, knowable, and able to be made explicit, and that theirperspectives affect the success of the project. An interview, rather than a paper and pencil survey, isselected when interpersonal contact is important and when opportunities for followup of interestingcomments are desired.
Two types of interviews are used in evaluation research: structured interviews, in which a carefullyworded questionnaire is administered; and indepth interviews, in which the interviewer does not follow arigid form. In the former, the emphasis is on obtaining answers to carefully phrased questions.Interviewers are trained to deviate only minimally from the question wording to ensure uniformity ofinterview administration. In the latter, however, the interviewers seek to encourage free and openresponses, and there may be a tradeoff between comprehensive coverage of topics and indepthexploration of a more limited set of questions. Indepth interviews also encourage capturing ofrespondents’ perceptions in their own words, a very desirable strategy in qualitative data collection. Thisallows the evaluator to present the meaningfulness of the experience from the respondent’s perspective.Indepth interviews are conducted with individuals or with a small group of individuals.4
4 A special case of the group interview is called a focus group. Although we discuss focus groups separately, several of theexhibits in this section will refer to both forms of data collection because of their similarities.
Indepth interviews. An indepth interview is a dialogue between a skilled interviewer and aninterviewee. Its goal is to elicit rich, detailed material that can be used in analysis (Lofland and Lofland,1995). Such interviews are best conducted face to face, although in some situations telephoneinterviewing can be successful.
Part II: Chapter 3: Common Qualitative Methods
http://www.ehr.nsf.gov/EHR/REC/pubs/NSF97-153/CHAP_3.HTM (5 of 17) [03/12/2001 11:07:15 AM]

Indepth interviews are characterized by extensive probing and open-ended questions. Typically, theproject evaluator prepares an interview guide that includes a list of questions or issues that are to beexplored and suggested probes for following up on key topics. The guide helps the interviewer pace theinterview and make interviewing more systematic and comprehensive. Lofland and Lofland (1995)provide guidelines for preparing interview guides, doing the interview with the guide, and writing up theinterview. Appendix B to this chapter contains an example of the types of interview questions that couldbe asked during the hypothetical study.
The dynamics of interviewing are similar to a guided conversation. The interviewer becomes an attentivelistener who shapes the process into a familiar and comfortable form of social engagement - aconversation - and the quality of the information obtained is largely dependent on the interviewer’s skillsand personality (Patton, 1990). In contrast to a good conversation, however, an indepth interview is notintended to be a two-way form of communication and sharing. The key to being a good interviewer isbeing a good listener and questioner. Tempting as it may be, it is not the role of the interviewer to putforth his or her opinions, perceptions, or feelings. Interviewers should be trained individuals who aresensitive, empathetic, and able to establish a nonthreatening environment in which participants feelcomfortable. They should be selected during a process that weighs personal characteristics that will makethem acceptable to the individuals being interviewed; clearly, age, sex, profession, race/ethnicity, andappearance may be key characteristics. Thorough training, including familiarization with the project andits goals, is important. Poor interviewing skills, poor phrasing of questions, or inadequate knowledge ofthe subject’s culture or frame of reference may result in a collection that obtains little useful data.
When to use indepth interviews. Indepth interviews can be used at any stage of the evaluation process.They are especially useful in answering questions such as those suggested by Patton (1990):
What does the program look and feel like to the participants? To other stakeholders?●
What are the experiences of program participants?●
What do stakeholders know about the project?●
What thoughts do stakeholders knowledgeable about the program have concerning programoperations, processes, and outcomes?
●
What are participants’ and stakeholders’ expectations?●
What features of the project are most salient to the participants?●
What changes do participants perceive in themselves as a result of their involvement in theproject?
●
Specific circumstances for which indepth interviews are particularly appropriate include
complex subject matter;●
detailed information sought;●
busy, high-status respondents; and●
highly sensitive subject matter.●
Exhibit 5.Advantages and disadvantages of indepth interviews
Advantages
Part II: Chapter 3: Common Qualitative Methods
http://www.ehr.nsf.gov/EHR/REC/pubs/NSF97-153/CHAP_3.HTM (6 of 17) [03/12/2001 11:07:15 AM]

Usually yield richest data, details, new insights
Permit face-to-face contact with respondents
Provide opportunity to explore topics in depth
Afford ability to experience the affective as well as cognitive aspects of responses
Allow interviewer to explain or help clarify questions, increasing the likelihood of usefulresponses
Allow interviewer to be flexible in administering interview to particular individuals orcircumstances
Disadvantages
Expensive and time-consuming
Need well-qualified, highly trained interviewers
Interviewee may distort information through recall error, selective perceptions, desire toplease interviewer
Flexibility can result in inconsistencies across interviews
Volume of information too large; may be difficult to transcribe and reduce data
In the hypothetical project, indepth interviews of the project director, staff, department chairs, branchcampus deans, and nonparticipant faculty would be useful. These interviews can address both formativeand summative questions and be used in conjunction with other data collection methods. The advantagesand disadvantages of indepth interviews are outlined in Exhibit 5.
When indepth interviews are being considered as a data collection technique, it is important to keepseveral potential pitfalls or problems in mind.
There may be substantial variation in the interview setting. Interviews generally take place in awide range of settings. This limits the interviewer’s control over the environment. The interviewermay have to contend with disruptions and other problems that may inhibit the acquisition ofinformation and limit the comparability of interviews.
●
There may be a large gap between the respondent’s knowledge and that of the interviewer.Interviews are often conducted with knowledgeable respondents, yet administered by lessknowledgeable interviewers or by interviewers not completely familiar with the pertinent social,political, or cultural context. Therefore, some of the responses may not be correctly understood orreported. The solution may be not only to employ highly trained and knowledgeable staff, but alsoto use interviewers with special skills for specific types of respondents (for example, same statusinterviewers for high-level administrators or community leaders). It may also be most expedientfor the project director or senior evaluation staff to conduct such interviews, if this can be donewithout introducing or appearing to introduce bias.
●
Exhibit 6.Considerations in conducting indepth interviews and focus groups
Part II: Chapter 3: Common Qualitative Methods
http://www.ehr.nsf.gov/EHR/REC/pubs/NSF97-153/CHAP_3.HTM (7 of 17) [03/12/2001 11:07:15 AM]

Factors to consider in determining the setting for interviews (bothindividual and group) include the following:
Select a setting that provides privacy for participants.●
Select a location where there are no distractions and it is easy to hear respondentsspeak.
●
Select a comfortable location.●
Select a nonthreatening environment.●
Select a location that is easily accessible for respondents.●
Select a facility equipped for audio or video recording.●
Stop telephone or visitor interruptions to respondents interviewed in their office orhomes.
●
Provide seating arrangements that encourage involvement and interaction.●
Exhibit 6 outlines other considerations in conducting interviews. These considerations are also importantin conducting focus groups, the next technique that we will consider.
Recording interview data. Interview data can be recorded on tape (with the permission of theparticipants) and/or summarized in notes. As with observations, detailed recording is a necessarycomponent of interviews since it forms the basis for analyzing the data. All methods, but especially thesecond and third, require carefully crafted interview guides with ample space available for recording theinterviewee’s responses. Three procedures for recording the data are presented below.
In the first approach, the interviewer (or in some cases the transcriber) listens to the tapes and writes averbatim account of everything that was said. Transcription of the raw data includes word-for-wordquotations of the participant’s responses as well as the interviewer’s descriptions of participant’scharacteristics, enthusiasm, body language, and overall mood during the interview. Notes from theinterview can be used to identify speakers or to recall comments that are garbled or unclear on the tape.This approach is recommended when the necessary financial and human resources are available, whenthe transcriptions can be produced in a reasonable amount of time, when the focus of the interview is tomake detailed comparisons, or when respondents’ own words and phrasing are needed. The majoradvantages of this transcription method are its completeness and the opportunity it affords for theinterviewer to remain attentive and focused during the interview. The major disadvantages are theamount of time and resources needed to produce complete transcriptions and the inhibitory impact taperecording has on some respondents. If this technique is selected, it is essential that the participants havebeen informed that their answers are being recorded, that they are assured confidentiality, and that theirpermission has been obtained.
A second possible procedure for recording interviews draws less on the word-by-word record and moreon the notes taken by the interviewer or assigned notetaker. This method is called "note expansion." Assoon as possible after the interview, the interviewer listens to the tape to clarify certain issues and toconfirm that all the main points have been included in the notes. This approach is recommended whenresources are scarce, when the results must be produced in a short period of time, and when the purposeof the interview is to get rapid feedback from members of the target population. The note expansionapproach saves time and retains all the essential points of the discussion. In addition to the drawbackspointed out above, a disadvantage is that the interviewer may be more selective or biased in what he orshe writes.
In the third approach, the interviewer uses no tape recording, but instead takes detailed notes during the
Part II: Chapter 3: Common Qualitative Methods
http://www.ehr.nsf.gov/EHR/REC/pubs/NSF97-153/CHAP_3.HTM (8 of 17) [03/12/2001 11:07:15 AM]

interview and draws on memory to expand and clarify the notes immediately after the interview. Thisapproach is useful if time is short, the results are needed quickly, and the evaluation questions are simple.Where more complex questions are involved, effective note-taking can be achieved, but only after muchpractice. Further, the interviewer must frequently talk and write at the same time, a skill that is hard forsome to achieve.
Focus GroupsFocus groups combine elements of both interviewing and participant observation. The focus groupsession is, indeed, an interview (Patton, 1990) not a discussion group, problem-solving session, ordecision-making group. At the same time, focus groups capitalize on group dynamics. The hallmark offocus groups is the explicit use of the group interaction to generate data and insights that would beunlikely to emerge without the interaction found in a group. The technique inherently allows observationof group dynamics, discussion, and firsthand insights into the respondents’ behaviors, attitudes,language, etc.
Focus groups are a gathering of 8 to 12 people who share some characteristics relevant to the evaluation.Originally used as a market research tool to investigate the appeal of various products, the focus grouptechnique has been adopted by other fields, such as education, as a tool for data gathering on a giventopic. Focus groups conducted by experts take place in a focus group facility that includes recordingapparatus (audio and/or visual) and an attached room with a one-way mirror for observation. There is anofficial recorder who may or may not be in the room. Participants are paid for attendance and providedwith refreshments. As the focus group technique has been adopted by fields outside of marketing, someof these features, such as payment or refreshment, have been eliminated.
When to use focus groups. When conducting evaluations, focus groups are useful in answering thesame type of questions as indepth interviews, except in a social context. Specific applications of thefocus group method in evaluations include
identifying and defining problems in project implementation;●
identifying project strengths, weaknesses, and recommendations;●
assisting with interpretation of quantitative findings; 5●
obtaining perceptions of project outcomes and impacts; and●
generating new ideas.●
In the hypothetical project, focus groups could be conducted with project participants to collectperceptions of project implementation and operation (e.g., Were the workshops staffed appropriately?Were the presentations suitable for all participants?), as well as progress toward objectives during theformative phase of evaluation (Did participants exchange information by e-mail and other means?).Focus groups could also be used to collect data on project outcomes and impact during the summativephase of evaluation (e.g., Were changes made in the curriculum? Did students taught by participantsappear to become more interested in class work? What barriers did the participants face in applying whatthey had been taught?).
Part II: Chapter 3: Common Qualitative Methods
http://www.ehr.nsf.gov/EHR/REC/pubs/NSF97-153/CHAP_3.HTM (9 of 17) [03/12/2001 11:07:15 AM]

Although focus groups and indepth interviews share many characteristics, they should not be usedinterchangeably. Factors to consider when choosing between focus groups and indepth interviews areincluded in Exhibit 7.
5 Survey developers also frequently use focus groups to pretest topics or ideas that later will be used for quantitative datacollection. In such cases, the data obtained are considered part of instrument development rather than findings. Qualitativeevaluators feel that this is too limited an application and that the technique has broader utility.
Developing a Focus Group
An important aspect of conducting focus groups is the topic guide. (See Appendix C to this chapter for asample guide applied to the hypothetical project.) The topic guide, a list of topics or question areas,serves as a summary statement of the issues and objectives to be covered by the focus group. The topicguide also serves as a road map and as a memory aid for the focus group leader, called a "moderator."The topic guide also provides the initial outline for the report of findings.
Focus group participants are typically asked to reflect on the questions asked by the moderator.Participants are permitted to hear each other’s responses and to make additional comments beyond theirown original responses as they hear what other people have to say. It is not necessary for the group toreach any kind of consensus, nor it is necessary for people to disagree. The moderator must keep thediscussion flowing and make sure that one or two persons do not dominate the discussion. As a rule, thefocus group session should not last longer than 1 1/2 to 2 hours. When very specific information isrequired, the session may be as short as 40 minutes. The objective is to get high-quality data in a socialcontext where people can consider their own views in the context of the views of others, and where newideas and perspectives can be introduced.
Exhibit 7.Which to use: Focus groups or indepth interviews?
Factors to consider Use focus groups when... Use indepth interview when...
Group interaction interaction of respondents may stimulate a richerresponse or new and valuable thought.
group interaction is likely to be limited ornonproductive.
Group/peer pressure group/peer pressure will be valuable inchallenging the thinking of respondents andilluminating conflicting opinions.
group/peer pressure would inhibit responses andcloud the meaning of results. Color Color ColorColor
Sensitivity of subject matter subject matter is not so sensitive that respondentswill temper responses or withhold information.
subject matter is so sensitive that respondents wouldbe unwilling to talk openly in a group.
Depth of individual responses the topic is such that most respondents can say allthat is relevant or all that they know in less than10 minutes.
the topic is such that a greater depth of response perindividual is desirable, as with complex subjectmatter and very knowledgeable respondents.
Part II: Chapter 3: Common Qualitative Methods
http://www.ehr.nsf.gov/EHR/REC/pubs/NSF97-153/CHAP_3.HTM (10 of 17) [03/12/2001 11:07:15 AM]

Data collector fatigue it is desirable to have one individual conduct thedata collection; a few groups will not createfatigue or boredom for one person.
it is possible to use numerous individuals on theproject; one interviewer would become fatigued orbored conducting all interviews.
Extent of issues to be covered the volume of issues to cover is not extensive. a greater volume of issues must be covered.
Continuity of information a single subject area is being examined in depthand strings of behaviors are less relevant.
it is necessary to understand how attitudes andbehaviors link together on an individual basis.
Experimentation with interview guide enough is known to establish a meaningful topicguide.
it may be necessary to develop the interview guideby altering it after each of the initial interviews.
Observation by stakeholders it is desirable for stakeholders to hear whatparticipants have to say.
stakeholders do not need to hear firsthand theopinions of participants.
Logistics geographically an acceptable number of target respondents canbe assembled in one location.
respondents are dispersed or not easily assembledfor other reasons.
Cost and training quick turnaround is critical, and funds are limited. quick turnaround is not critical, and budget willpermit higher cost.
Availability of qualified staff focus group facilitators need to be able to controland manage groups
interviewers need to be supportive and skilledlisteners.
The participants are usually a relatively homogeneous group of people. Answering the question, "Whichrespondent variables represent relevant similarities among the target population?" requires somethoughtful consideration when planning the evaluation. Respondents’ social class, level of expertise, age,cultural background, and sex should always be considered. There is a sharp division among focus groupmoderators regarding the effectiveness of mixing sexes within a group, although most moderators agreethat it is acceptable to mix the sexes when the discussion topic is not related to or affected by sexstereotypes.
Determining how many groups are needed requires balancing cost and information needs. A focus groupcan be fairly expensive, costing $10,000 to $20,000 depending on the type of physical facilities needed,the effort it takes to recruit participants, and the complexity of the reports required. A good rule of thumbis to conduct at least two groups for every variable considered to be relevant to the outcome (sex, age,educational level, etc.). However, even when several groups are sampled, conclusions typically arelimited to the specific individuals participating in the focus group. Unless the study population isextremely small, it is not possible to generalize from focus group data.
Recording focus group data. The procedures for recording a focus group session are basically the sameas those used for indepth interviews. However, the focus group approach lends itself to more creative andefficient procedures. If the evaluation team does use a focus group room with a one-way mirror, acolleague can take notes and record observations. An advantage of this approach is that the extraindividual is not in the view of participants and, therefore, not interfering with the group process. If aone-way mirror is not a possibility, the moderator may have a colleague present in the room to take notesand to record observations. A major advantage of these approaches is that the recorder focuses onobserving and taking notes, while the moderator concentrates on asking questions, facilitating the groupinteraction, following up on ideas, and making smooth transitions from issue to issue. Furthermore, likeobservations, focus groups can be videotaped. These approaches allow for confirmation of what was seen
Part II: Chapter 3: Common Qualitative Methods
http://www.ehr.nsf.gov/EHR/REC/pubs/NSF97-153/CHAP_3.HTM (11 of 17) [03/12/2001 11:07:15 AM]

and heard. Whatever the approach to gathering detailed data, informed consent is necessary andconfidentiality should be assured.
Having highlighted the similarities between interviews and focus groups, it is important to also point outone critical difference. In focus groups, group dynamics are especially important. The notes, andresultant report, should include comments on group interaction and dynamics as they inform thequestions under study.
Other Qualitative MethodsThe last section of this chapter outlines less common but, nonetheless, potentially useful qualitativemethods for project evaluation. These methods include document studies, key informants, alternative(authentic) assessment, and case studies.
Document Studies
Existing records often provide insights into a setting and/or group of people that cannot be observed ornoted in another way. This information can be found in document form. Lincoln and Guba (1985)defined a document as "any written or recorded material" not prepared for the purposes of the evaluationor at the request of the inquirer. Documents can be divided into two major categories: public records, andpersonal documents (Guba and Lincoln, 1981).
Public records are materials created and kept for the purpose of "attesting to an event or providing anaccounting" (Lincoln and Guba, 1985). Public records can be collected from outside (external) or within(internal) the setting in which the evaluation is taking place. Examples of external records are census andvital statistics reports, county office records, newspaper archives, and local business records that canassist an evaluator in gathering information about the larger community and relevant trends. Suchmaterials can be helpful in better understanding the project participants and making comparisonsbetween groups/communities.
For the evaluation of educational innovations, internal records include documents such as studenttranscripts and records, historical accounts, institutional mission statements, annual reports, budgets,grade and standardized test reports, minutes of meetings, internal memoranda, policy manuals,institutional histories, college/university catalogs, faculty and student handbooks, officialcorrespondence, demographic material, mass media reports and presentations, and descriptions ofprogram development and evaluation. They are particularly useful in describing institutionalcharacteristics, such as backgrounds and academic performance of students, and in identifyinginstitutional strengths and weaknesses. They can help the evaluator understand the institution’s resources,values, processes, priorities, and concerns. Furthermore, they provide a record or history not subject torecall bias.
Personal documents are first-person accounts of events and experiences. These "documents of life"include diaries, portfolios, photographs, artwork, schedules, scrapbooks, poetry, letters to the paper, etc.
Part II: Chapter 3: Common Qualitative Methods
http://www.ehr.nsf.gov/EHR/REC/pubs/NSF97-153/CHAP_3.HTM (12 of 17) [03/12/2001 11:07:15 AM]
Personal documents can help the evaluator understand how the participant sees the world and what she orhe wants to communicate to an audience. And unlike other sources of qualitative data, collecting datafrom documents is relatively invisible to, and requires minimal cooperation from, persons within thesetting being studied (Fetterman, 1989).
The usefulness of existing sources varies depending on whether they are accessible and accurate. In thehypothetical project, documents can provide the evaluator with useful information about the culture ofthe institution and participants involved in the project, which in turn can assist in the development ofevaluation questions. Information from documents also can be used to generate interview questions or toidentify events to be observed. Furthermore, existing records can be useful for making comparisons (e.g.,comparing project participants to project applicants, project proposal to implementation records, ordocumentation of institutional policies and program descriptions prior to and following implementationof project interventions and activities).
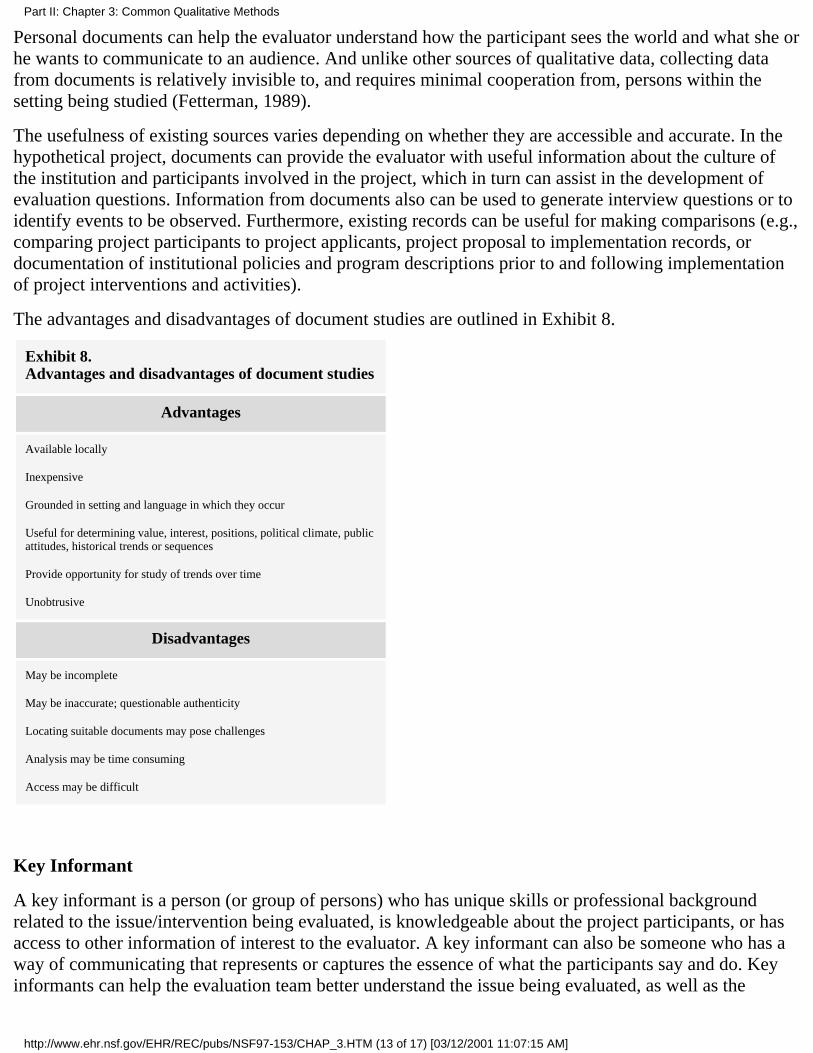
The advantages and disadvantages of document studies are outlined in Exhibit 8.
Exhibit 8.Advantages and disadvantages of document studies
Advantages
Available locally
Inexpensive
Grounded in setting and language in which they occur
Useful for determining value, interest, positions, political climate, publicattitudes, historical trends or sequences
Provide opportunity for study of trends over time
Unobtrusive
Disadvantages
May be incomplete
May be inaccurate; questionable authenticity
Locating suitable documents may pose challenges
Analysis may be time consuming
Access may be difficult
Key Informant
A key informant is a person (or group of persons) who has unique skills or professional backgroundrelated to the issue/intervention being evaluated, is knowledgeable about the project participants, or hasaccess to other information of interest to the evaluator. A key informant can also be someone who has away of communicating that represents or captures the essence of what the participants say and do. Keyinformants can help the evaluation team better understand the issue being evaluated, as well as the
Part II: Chapter 3: Common Qualitative Methods
http://www.ehr.nsf.gov/EHR/REC/pubs/NSF97-153/CHAP_3.HTM (13 of 17) [03/12/2001 11:07:15 AM]

project participants, their backgrounds, behaviors, and attitudes, and any language or ethnicconsiderations. They can offer expertise beyond the evaluation team. They are also very useful forassisting with the evaluation of curricula and other educational materials. Key informants can besurveyed or interviewed individually or through focus groups.
In the hypothetical project, key informants (i.e., expert faculty on main campus, deans, and departmentchairs) can assist with (1) developing evaluation questions, and (2) answering formative and summativeevaluation questions.
The use of advisory committees is another way of gathering information from key informants. Advisorygroups are called together for a variety of purposes:
To represent the ideas and attitudes of a community, group, or organization;●
To promote legitimacy for project;●
To advise and recommend; or●
To carry out a specific task.●
Members of such a group may be specifically selected or invited to participate because of their uniqueskills or professional background; they may volunteer; they may be nominated or elected; or they maycome together through a combination of these processes.
The advantages and disadvantages of using key informants are outlined in Exhibit 9.
Exhibit 9.Advantages and disadvantages of using key informants
Advantages
Information concerning causes, reasons, and/or best approaches from an "insider" point ofview
Advice/feedback increases credibility of study
Pipeline to pivotal groups
May have side benefit to solidify relationships between evaluators, clients, participants, andother stakeholders
Disadvantages
Time required to select and get commitment may be substantial
Relationship between evaluator and informants may influence type of data obtained
Informants may interject own biases and impressions
May result in disagreements among individuals leading to frustration/ conflicts
Performance Assessment
The performance assessment movement is impacting education from preschools to professional schools.At the heart of this upheaval is the belief that for all of their virtues - particularly efficiency and economy- traditional objective, norm-referenced tests may fail to tell us what we most want to know about student
Part II: Chapter 3: Common Qualitative Methods
http://www.ehr.nsf.gov/EHR/REC/pubs/NSF97-153/CHAP_3.HTM (14 of 17) [03/12/2001 11:07:15 AM]

achievement. In addition, these same tests exert a powerful and, in the eyes of many educators,detrimental influence on curriculum and instruction. Critics of traditional testing procedures areexploring alternatives to multiple-choice, norm-referenced tests. It is hoped that these alternative meansof assessment, ranging from observations to exhibitions, will provide a more authentic picture ofachievement.
Critics raise three main points against objective, norm-referenced tests.
Tests themselves are flawed.●
Tests are a poor measure of anything except a student’s test-taking ability.●
Tests corrupt the very process they are supposed to improve (i.e., their structure puts too muchemphasis on learning isolated facts).
●
The search for alternatives to traditional tests has generated a number of new approaches to assessmentunder such names as alternative assessment, performance assessment, holistic assessment, and authenticassessment. While each label suggests slightly different emphases, they all imply a movement towardassessment that supports exemplary teaching. Performance assessment appears to be the most popularterm because it emphasizes the development of assessment tools that involve students in tasks that areworthwhile, significant, and meaningful. Such tasks involve higher order thinking skills and thecoordination of a broad range of knowledge.
Performance assessment may involve "qualitative" activities such as oral interviews, groupproblem-solving tasks, portfolios, or personal documents/creations (poetry, artwork, stories). Aperformance assessment approach that could be used in the hypothetical project is work samplemethodology (Schalock, Schalock, and Girad, in press ). Briefly, work sample methodology challengesteachers to create unit plans and assessment techniques for students at several points during a trainingexperience. The quality of this product is assessed (at least before and after training) in light of the goalof the professional development program. The actual performance of students on the assessmentmeasures provides additional information on impact.
Case Studies
Classical case studies depend on ethnographic and participant observer methods. They are largelydescriptive examinations, usually of a small number of sites (small towns, hospitals, schools) where theprincipal investigator is immersed in the life of the community or institution and combs availabledocuments, holds formal and informal conversations with informants, observes ongoing activities, anddevelops an analysis of both individual and "cross-case" findings.
In the hypothetical study, for example, case studies of the experiences of participants from differentcampuses could be carried out. These might involve indepth interviews with the facility participants,observations of their classes over time, surveys of students, interviews with peers and department chairs,and analyses of student work samples at several points in the program. Selection of participants might bemade based on factors such as their experience and training, type of students taught, or differences ininstitutional climate/supports.
Case studies can provide very engaging, rich explorations of a project or application as it develops in areal-world setting. Project evaluators must be aware, however, that doing even relatively modest,
Part II: Chapter 3: Common Qualitative Methods
http://www.ehr.nsf.gov/EHR/REC/pubs/NSF97-153/CHAP_3.HTM (15 of 17) [03/12/2001 11:07:15 AM]

illustrative case studies is a complex task that cannot be accomplished through occasional, brief sitevisits. Demands with regard to design, data collection, and reporting can be substantial.
For those wanting to become thoroughly familiar with this topic, a number of relevant texts arereferenced here.
References
Fetterman, D.M. (1989). Ethnography: Step by Step. Applied Social Research Methods Series,Vol. 17. Newbury Park, CA: Sage.
Guba, E.G., and Lincoln, Y.S. (1981). Effective Evaluation. San Francisco: Jossey-Bass.
Lincoln, Y.S., and Guba, E.G. (1985). Naturalistic Inquiry. Beverly Hills, CA: Sage.
Lofland, J., and Lofland, L.H. (1995). Analyzing Social Settings: A Guide to QualitativeObservation and Analysis, 3rd Ed. Belmont, CA: Wadsworth.
Patton, M.Q. (1990). Qualitative Evaluation and Research Methods, 2nd Ed. Newbury Park, CA:Sage.
Schalock, H.D., Schalock, M.D., and Girad, G.R. (In press). Teacher work sample methodology,as used at Western Oregon State College. In J. Millman, Ed., Assuring Accountability? UsingGains in Student Learning to Evaluate Teachers and Schools. Newbury Park, CA: Corwin.
Other Recommended Reading
Debus, M. (1995). Methodological Review: A Handbook for Excellence in Focus Group Research.Washington, DC: Academy for Educational Development.
Denzin, N.K., and Lincoln, Y.S. (Eds.). (1994). Handbook of Qualitative Research. ThousandOaks, CA: Sage.
Erlandson, D.A., Harris, E.L., Skipper, B.L., and Allen, D. (1993). Doing Naturalist Inquiry: AGuide to Methods. Newbury Park, CA: Sage.
Greenbaum, T.L. (1993). The Handbook of Focus Group Research. New York: Lexington Books.
Hart, D. (1994). Authentic Assessment: A Handbook for Educators. Menlo Park, CA:Addison-Wesley.
Herman, J.L., and Winters, L. (1992). Tracking Your School’s Success: A Guide to SensibleEvaluation. Newbury Park, CA: Corwin Press.
Hymes, D.L., Chafin, A.E., and Gondor, R. (1991). The Changing Face of Testing andAssessment: Problems and Solutions. Arlington, VA: American Association of SchoolAdministrators.
Krueger, R.A. (1988). Focus Groups: A Practical Guide for Applied Research. Newbury Park,
Part II: Chapter 3: Common Qualitative Methods
http://www.ehr.nsf.gov/EHR/REC/pubs/NSF97-153/CHAP_3.HTM (16 of 17) [03/12/2001 11:07:15 AM]

CA: Sage.
LeCompte, M.D., Millroy, W.L., and Preissle, J. (Eds.). (1992). The Handbook of QualitativeResearch in Education. San Diego, CA: Academic Press.
Merton, R.K., Fiske, M., and Kendall, P.L. (1990). The Focused Interview: A Manual of Problemsand Procedures, 2nd Ed. New York: The Free Press.
Miles, M.B., and Huberman, A.M. (1994). Qualitative Data Analysis: An Expanded Sourcebook.Thousand Oaks, CA: Sage.
Morgan, D.L. (Ed.). (1993). Successful Focus Groups: Advancing the State of the Art. NewburyPark, CA: Sage.
Morse, J.M. (Ed.). (1994). Critical Issues in Qualitative Research Methods. Thousand Oaks, CA:Sage.
Perrone, V. (Ed.). (1991). Expanding Student Assessment. Alexandria, VA: Association forSupervision and Curriculum Development.
Reich, R.B. (1991). The Work of Nations. New York: Alfred A. Knopf.
Schatzman, L., and Strauss, A.L. (1973). Field Research. Englewood Cliffs, NJ: Prentice-Hall.
Seidman, I.E. (1991). Interviewing as Qualitative Research: A Guide for Researchers in Educationand Social Sciences. New York: Teachers College Press.
Stewart, D.W., and Shamdasani, P.N. (1990). Focus Groups: Theory and Practice. Newbury Park,CA: Sage.
United States General Accounting Office (GAO). (1990). Case Study Evaluations, Paper 10.1.9.Washington, DC: GAO.
Weiss, R.S. (1994). Learning from Strangers: The Art and Method of Qualitative InterviewStudies. New York: Free Press.
Wiggins, G. (1989). A True Test: Toward More Authentic and Equitable Assessment. Phi DeltaKappan, May, 703-704.
Wiggins, G. (1989). Teaching to the (Authentic) Test. Educational Leadership, 46, 45.
Yin, R.K. (1989). Case Study Research: Design and Method. Newbury Park, CA: Sage.
Previous Chapter | Back to Top | Next Chapter
Table of Contents
Part II: Chapter 3: Common Qualitative Methods
http://www.ehr.nsf.gov/EHR/REC/pubs/NSF97-153/CHAP_3.HTM (17 of 17) [03/12/2001 11:07:15 AM]

Chapter 4Analyzing Qualitative Data
What Is Qualitative Analysis?Qualitative modes of data analysis provide ways of discerning, examining, comparing and contrasting,and interpreting meaningful patterns or themes. Meaningfulness is determined by the particular goals andobjectives of the project at hand: the same data can be analyzed and synthesized from multiple anglesdepending on the particular research or evaluation questions being addressed. The varieties of approaches- including ethnography, narrative analysis, discourse analysis, and textual analysis - correspond todifferent types of data, disciplinary traditions, objectives, and philosophical orientations. However, allshare several common characteristics that distinguish them from quantitative analytic approaches.
In quantitative analysis, numbers and what they stand for are the material of analysis. By contrast,qualitative analysis deals in words and is guided by fewer universal rules and standardized proceduresthan statistical analysis.
We have few agreed-on canons for qualitative data analysis, in the sense of shared ground rulesfor drawing conclusions and verifying their sturdiness (Miles and Huberman, 1984).
This relative lack of standardization is at once a source of versatility and the focus of considerablemisunderstanding. That qualitative analysts will not specify uniform procedures to follow in all casesdraws critical fire from researchers who question whether analysis can be truly rigorous in the absence ofsuch universal criteria; in fact, these analysts may have helped to invite this criticism by failing toadequately articulate their standards for assessing qualitative analyses, or even denying that suchstandards are possible. Their stance has fed a fundamentally mistaken but relatively common idea ofqualitative analysis as unsystematic, undisciplined, and "purely subjective."
Although distinctly different from quantitative statistical analysis both in procedures and goals, goodqualitative analysis is both systematic and intensely disciplined. If not "objective" in the strict positivistsense, qualitative analysis is arguably replicable insofar as others can be "walked through" the analyst'sthought processes and assumptions. Timing also works quite differently in qualitative evaluation.Quantitative evaluation is more easily divided into discrete stages of instrument development, datacollection, data processing, and data analysis. By contrast, in qualitative evaluation, data collection anddata analysis are not temporally discrete stages: as soon as the first pieces of data are collected, theevaluator begins the process of making sense of the information. Moreover, the different processesinvolved in qualitative analysis also overlap in time. Part of what distinguishes qualitative analysis is aloop-like pattern of multiple rounds of revisiting the data as additional questions emerge, newconnections are unearthed, and more complex formulations develop along with a deepeningunderstanding of the material. Qualitative analysis is fundamentally an iterative set of processes.
At the simplest level, qualitative analysis involves examining the assembled relevant data to determinehow they answer the evaluation question(s) at hand. However, the data are apt to be in formats that are
Part II: Chapter 4: Analyzing Quantitative Data
http://www.ehr.nsf.gov/EHR/REC/pubs/NSF97-153/CHAP_4.HTM (1 of 15) [03/12/2001 11:08:25 AM]

unusual for quantitative evaluators, thereby complicating this task. In quantitative analysis of surveyresults, for example, frequency distributions of responses to specific items on a questionnaire oftenstructure the discussion and analysis of findings. By contrast, qualitative data most often occur in moreembedded and less easily reducible or distillable forms than quantitative data. For example, a relevant"piece" of qualitative data might be interspersed with portions of an interview transcript, multipleexcerpts from a set of field notes, or a comment or cluster of comments from a focus group.
Throughout the course of qualitative analysis, the analyst should be asking and reasking the followingquestions:
What patterns and common themes emerge in responses dealing with specific items? How do thesepatterns (or lack thereof) help to illuminate the broader study question(s)?
●
Are there any deviations from these patterns? If yes, are there any factors that might explain theseatypical responses?
●
What interesting stories emerge from the responses? How can these stories help to illuminate thebroader study question(s)?
●
Do any of these patterns or findings suggest that additional data may need to be collected? Do anyof the study questions need to be revised?
●
Do the patterns that emerge corroborate the findings of any corresponding qualitative analyses thathave been conducted? If not, what might explain these discrepancies?
●
Two basic forms of qualitative analysis, essentially the same in their underlying logic, will be discussed:intra-case analysis and cross-case analysis. A case may be differently defined for different analyticpurposes. Depending on the situation, a case could be a single individual, a focus group session, or aprogram site (Berkowitz, 1996). In terms of the hypothetical project described in Chapter 2, a case willbe a single campus. Intra-case analysis will examine a single project site, and cross-case analysis willsystematically compare and contrast the eight campuses.
Processes in Qualitative AnalysisQualitative analysts are justifiably wary of creating an unduly reductionistic or mechanistic picture of anundeniably complex, iterative set of processes. Nonetheless, evaluators have identified a few basiccommonalities in the process of making sense of qualitative data. In this chapter we have adopted theframework developed by Miles and Huberman (1994) to describe the major phases of data analysis: datareduction, data display, and conclusion drawing and verification.
Data Reduction
First, the mass of data has to be organized and somehow meaningfully reduced or reconfigured. Milesand Huberman (1994) describe this first of their three elements of qualitative data analysis as datareduction. "Data reduction refers to the process of selecting, focusing, simplifying, abstracting, andtransforming the data that appear in written up field notes or transcriptions." Not only do the data need to
Part II: Chapter 4: Analyzing Quantitative Data
http://www.ehr.nsf.gov/EHR/REC/pubs/NSF97-153/CHAP_4.HTM (2 of 15) [03/12/2001 11:08:25 AM]

be condensed for the sake of manageability, they also have to be transformed so they can be madeintelligible in terms of the issues being addressed.
Data reduction often forces choices about which aspects of the assembled data should be emphasized,minimized, or set aside completely for the purposes of the project at hand. Beginners often fail tounderstand that even at this stage, the data do not speak for themselves. A common mistake many peoplemake in quantitative as well as qualitative analysis, in a vain effort to remain "perfectly objective," is topresent a large volume of unassimilated and uncategorized data for the reader's consumption.
In qualitative analysis, the analyst decides which data are to be singled out for description according toprinciples of selectivity. This usually involves some combination of deductive and inductive analysis.While initial categorizations are shaped by preestablished study questions, the qualitative analyst shouldremain open to inducing new meanings from the data available.
In evaluation, such as the hypothetical evaluation project in this handbook, data reduction should beguided primarily by the need to address the salient evaluation question(s). This selective winnowing isdifficult, both because qualitative data can be very rich, and because the person who analyzes the dataalso often played a direct, personal role in collecting them. The words that make up qualitative analysisrepresent real people, places, and events far more concretely than the numbers in quantitative data sets, areality that can make cutting any of it quite painful. But the acid test has to be the relevance of theparticular data for answering particular questions. For example, a formative evaluation question for thehypothetical study might be whether the presentations were suitable for all participants. Focus groupparticipants may have had a number of interesting things to say about the presentations, but remarks thatonly tangentially relate to the issue of suitability may have to be bracketed or ignored. Similarly, aparticipant’s comments on his department chair that are unrelated to issues of program implementation orimpact, however fascinating, should not be incorporated into the final report. The approach to datareduction is the same for intra-case and cross-case analysis.
With the hypothetical project of Chapter 2 in mind, it is illustrative to consider ways of reducing datacollected to address the question "what did participating faculty do to share knowledge withnonparticipating faculty?" The first step in an intra-case analysis of the issue is to examine all therelevant data sources to extract a description of what they say about the sharing of knowledge betweenparticipating and nonparticipating faculty on the one campus. Included might be information from focusgroups, observations, and indepth interviews of key informants, such as the department chair. The mostsalient portions of the data are likely to be concentrated in certain sections of the focus group transcripts(or write-ups) and indepth interviews with the department chair. However, it is best to also quicklyperuse all notes for relevant data that may be scattered throughout.
In initiating the process of data reduction, the focus is on distilling what the different respondent groupssuggested about the activities used to share knowledge between faculty who participated in the projectand those who did not. How does what the participating faculty say compare to what the nonparticipatingfaculty and the department chair report about knowledge sharing and adoption of new practices? Insetting out these differences and similarities, it is important not to so "flatten" or reduce the data that theysound like close-ended survey responses. The tendency to treat qualitative data in this manner is notuncommon among analysts trained in quantitative approaches. Not surprisingly, the result is to makequalitative analysis look like watered down survey research with a tiny sample size. Approachingqualitative analysis in this fashion unfairly and unnecessarily dilutes the richness of the data and, thus,
Part II: Chapter 4: Analyzing Quantitative Data
http://www.ehr.nsf.gov/EHR/REC/pubs/NSF97-153/CHAP_4.HTM (3 of 15) [03/12/2001 11:08:25 AM]

inadvertently undermines one of the greatest strengths of the qualitative approach.
Answering the question about knowledge sharing in a truly qualitative way should go beyondenumerating a list of knowledge-sharing activities to also probe the respondents' assessments of therelative effectiveness of these activities, as well as their reasons for believing some more effective thanothers. Apart from exploring the specific content of the respondents' views, it is also a good idea to takenote of the relative frequency with which different issues are raised, as well as the intensity with whichthey are expressed.
Data Display
Data display is the second element or level in Miles and Huberman's (1994) model of qualitative dataanalysis. Data display goes a step beyond data reduction to provide "an organized, compressed assemblyof information that permits conclusion drawing..." A display can be an extended piece of text or adiagram, chart, or matrix that provides a new way of arranging and thinking about the more textuallyembedded data. Data displays, whether in word or diagrammatic form, allow the analyst to extrapolatefrom the data enough to begin to discern systematic patterns and interrelationships. At the display stage,additional, higher order categories or themes may emerge from the data that go beyond those firstdiscovered during the initial process of data reduction.
From the perspective of program evaluation, data display can be extremely helpful in identifying why asystem (e.g., a given program or project) is or is not working well and what might be done to change it.The overarching issue of why some projects work better or are more successful than others almostalways drives the analytic process in any evaluation. In our hypothetical evaluation example, facultyfrom all eight campuses come together at the central campus to attend workshops. In that respect, allparticipants are exposed to the identical program. However, implementation of teaching techniquespresented at the workshop will most likely vary from campus to campus based on factors such as theparticipants’ personal characteristics, the differing demographics of the student bodies, and differences inthe university and departmental characteristics (e.g., size of the student body, organization of preservicecourses, department chair’s support of the program goals, departmental receptivity to change andinnovation). The qualitative analyst will need to discern patterns of interrelationships to suggest why theproject promoted more change on some campuses than on others.
One technique for displaying narrative data is to develop a series of flow charts that map out any criticalpaths, decision points, and supporting evidence that emerge from establishing the data for a single site.After the first flow chart has been developed, the process can be repeated for all remaining sites.Analysts may (1) use the data from subsequent sites to modify the original flow chart; (2) prepare anindependent flow chart for each site; and/or (3) prepare a single flow chart for some events (if most sitesadopted a generic approach) and multiple flow charts for others. Examination of the data display acrossthe eight campuses might produce a finding that implementation proceeded more quickly and effectivelyon those campuses where the department chair was highly supportive of trying new approaches toteaching but was stymied and delayed when department chairs had misgivings about making changes to atried-and-true system.
Data display for intra-case analysis. Exhibit 10 presents a data display matrix for analyzing patterns of
Part II: Chapter 4: Analyzing Quantitative Data
http://www.ehr.nsf.gov/EHR/REC/pubs/NSF97-153/CHAP_4.HTM (4 of 15) [03/12/2001 11:08:25 AM]

response concerning perceptions and assessments of knowledge-sharing activities for one campus. Wehave assumed that three respondent units - participating faculty, nonparticipating faculty, and departmentchairs - have been asked similar questions. Looking at column (a), it is interesting that the threerespondent groups were not in total agreement even on which activities they named. Only the participantsconsidered e-mail a means of sharing what they had learned in the program with their colleagues. Thenonparticipant colleagues apparently viewed the situation differently, because they did not include e-mailin their list. The department chair - perhaps because she was unaware they were taking place - did notmention e-mail or informal interchanges as knowledge-sharing activities.
Column (b) shows which activities each group considered most effective as a way of sharing knowledge,in order of perceived importance; column (c) summarizes the respondents' reasons for regarding thoseparticular activities as most effective. Looking down column (b), we can see that there is some overlapacross groups - for example, both the participants and the department chair believed structured seminarswere the most effective knowledge-sharing activity. Nonparticipants saw the structured seminars asbetter than lunchtime meetings, but not as effective as informal interchanges.
Exhibit 10.Data matrix for Campus A: What was done to share knowledge
Respondent group (a)Activities named
(b)Which most effective
(c)Why
Participants Structured seminars●
E-mail●
Informal interchanges●
Lunchtime meetings●
Structured seminars●
E-mail●
Concise way ofcommunicating a lot ofinformation
●
Nonparticipants Structured seminars●
Informal interchanges●
Lunchtime meetings●
Informal interchanges●
Structured seminars●
Easier to assimilateinformation in less formalsettings
●
Smaller bits of informationat a time
●
Department chair Structured seminars●
Lunch time meetings●
Structured seminars● Highest attendance bynonparticipants
●
Most comments (positive)to chair
●
Simply knowing what each set of respondents considered most effective, without knowing why, wouldleave out an important piece of the analytic puzzle. It would rob the qualitative analyst of the chance toprobe potentially meaningful variations in underlying conceptions of what defines effectiveness in aneducational exchange. For example, even though both participating faculty and the department chairagreed on the structured seminars as the most effective knowledge-sharing activity, they gave somewhatdifferent reasons for making this claim. The participants saw the seminars as the most effective way ofcommunicating a lot of information concisely. The department chair used indirect indicators - attendancerates of nonparticipants at the seminars, as well as favorable comments on the seminars volunteered toher - to formulate her judgment of effectiveness. It is important to recognize the different bases on whichthe respondents reached the same conclusions.
Part II: Chapter 4: Analyzing Quantitative Data
http://www.ehr.nsf.gov/EHR/REC/pubs/NSF97-153/CHAP_4.HTM (5 of 15) [03/12/2001 11:08:25 AM]

Several points concerning qualitative analysis emerge from this relatively straightforward andpreliminary exercise. First, a pattern of cross-group differences can be discerned even before we analyzethe responses concerning the activities regarded as most effective, and why. The open-ended format ofthe question allowed each group to give its own definition of "knowledge-sharing activities." The pointof the analysis is not primarily to determine which activities were used and how often; if that were themajor purpose of asking this question, there would be far more efficient ways (e.g., a checklist or ratingscale) to find the answer. From an analytic perspective, it is more important to begin to uncover relevantgroup differences in perceptions.
Differences in reasons for considering one activity more effective than another might also point todifferent conceptions of the primary goals of the knowledge-sharing activities. Some of these variationsmight be attributed to the fact that the respondent groups occupy different structural positions in life anddifferent roles in this specific situation. While both participating and nonparticipating faculty teach in thesame department, in this situation the participating faculty are playing a teaching role vis-a-vis theircolleagues. The data in column (c) indicate the participants see their main goal as imparting a great dealof information as concisely as possible. By contrast, the nonparticipants - in the role of students - believethey assimilate the material better when presented with smaller quantities of information in informalsettings. Their different approaches to the question might reflect different perceptions based on thistemporary rearrangement in their roles. The department chair occupies a different structural position inthe university than either the participating or nonparticipating faculty. She may be too removed fromday-to-day exchanges among the faculty to see much of what is happening on this more informal level.By the same token, her removal from the grassroots might give her a broader perspective on the subject.
Data display in cross-case analysis. The principles applied in analyzing across cases essentially parallelthose employed in the intra-case analysis. Exhibit 11 shows an example of a hypothetical data displaymatrix that might be used for analysis of program participants’ responses to the knowledge-sharingquestion across all eight campuses. Looking down column (a), one sees differences in the number andvariety of knowledge-sharing activities named by participating faculty at the eight schools. Brown baglunches, department newsletters, workshops, and dissemination of written (hard-copy) materials havebeen added to the list, which for branch campus A included only structured seminars, e-mail, informalinterchanges, and lunchtime meetings. This expanded list probably encompasses most, if not all, suchactivities at the eight campuses. In addition, where applicable, we have indicated whether thenonparticipating faculty involvement in the activity was compulsory or voluntary.
In Exhibit 11, we are comparing the same group on different campuses, rather than different groups onthe same campus, as in Exhibit 10. Column (b) reveals some overlap across participants in whichactivities were considered most effective: structured seminars were named by participants at campuses Aand C, brown bag lunches
Exhibit 11.Participants’ views of information sharing at eight campuses
Branch campus (a)Activities named
(b)Which most effective
(c)Why
Part II: Chapter 4: Analyzing Quantitative Data
http://www.ehr.nsf.gov/EHR/REC/pubs/NSF97-153/CHAP_4.HTM (6 of 15) [03/12/2001 11:08:25 AM]

A Structured seminar (voluntary)●
E-mail●
Informal interchanges●
Lunchtime meetings●
Structured seminar
Concise way of communicating a lot ofinformation
B Brown bags●
E-mail●
Department newsletter●
Brown bags Most interactive
C Workshops (voluntary)●
Structured seminar (compulsory)●
Structured seminar Compulsory
Structured format works well
D Informal interchanges●
Dissemination of written materials●
Combination of the two Dissemination important but not enoughwithout "personal touch"
E Structured seminars (compulsory)●
Workshops (voluntary)●
Workshops Voluntary hands-on approach works best
F E-mail●
Dissemination of materials●
Workshops (compulsory)●
Dissemination of materials Not everyone regularly uses e-mail
Compulsory workshops resisted ascoercive
G Structured seminar●
Informal interchanges●
Lunch meetings●
Lunch meetings Best time
H Brown bags●
E-mail●
Dissemination of materials●
Brown bags Relaxed environment
by those at campuses B and H. However, as in Exhibit 10, the primary reasons for naming these activitieswere not always the same. Brown bag lunches were deemed most effective because of their interactivenature (campus B) and the relaxed environment in which they took place (campus H), both suggesting apreference for less formal learning situations. However, while campus A participants judged voluntarystructured seminars the most effective way to communicate a great deal of information, campus Cparticipants also liked that the structured seminars on their campus were compulsory. Participants at bothcampuses appear to favor structure, but may part company on whether requiring attendance is a goodidea. The voluntary/compulsory distinction was added to illustrate different aspects of effectiveknowledge sharing that might prove analytically relevant.
It would also be worthwhile to examine the reasons participants gave for deeming one activity moreeffective than another, regardless of the activity. Data in column (c) show a tendency for participants oncampuses B, D, E, F, and H to prefer voluntary, informal, hands-on, personal approaches. By contrast,those from campuses A and C seemed to favor more structure (although they may disagree on voluntaryversus compulsory approaches). The answer supplied for campus G ("best time") is ambiguous andrequires returning to the transcripts to see if more material can be found to clarify this response.
Part II: Chapter 4: Analyzing Quantitative Data
http://www.ehr.nsf.gov/EHR/REC/pubs/NSF97-153/CHAP_4.HTM (7 of 15) [03/12/2001 11:08:25 AM]

To have included all the knowledge-sharing information from four different respondent groups on alleight campuses in a single matrix would have been quite complicated. Therefore, for clarity's sake, wepresent only the participating faculty responses. However, to complete the cross-case analysis of thisevaluation question, the same procedure should be followed - if not in matrix format, then conceptually -for nonparticipating faculty and department chairpersons. For each group, the analysis would be modeledon the above example. It would be aimed at identifying important similarities and differences in what therespondents said or observed and exploring the possible bases for these patterns at different campuses.Much of qualitative analysis, whether intra-case or cross-case, is structured by what Glaser and Strauss(1967) called the "method of constant comparison," an intellectually disciplined process of comparingand contrasting across instances to establish significant patterns, then further questioning and refinementof these patterns as part of an ongoing analytic process.
Conclusion Drawing and Verification
This activity is the third element of qualitative analysis. Conclusion drawing involves stepping back toconsider what the analyzed data mean and to assess their implications for the questions at hand.6Verification, integrally linked to conclusion drawing, entails revisiting the data as many times asnecessary to cross-check or verify these emergent conclusions. "The meanings emerging from the datahave to be tested for their plausibility, their sturdiness, their ‘confirmability’ - that is, their validity"(Miles and Huberman, 1994, p. 11). Validity means something different in this context than inquantitative evaluation, where it is a technical term that refers quite specifically to whether a givenconstruct measures what it purports to measure. Here validity encompasses a much broader concern forwhether the conclusions being drawn from the data are credible, defensible, warranted, and able towithstand alternative explanations.
6 When qualitative data are used as a precursor to the design/development of quantitative instruments, this step may bepostponed. Reducing the data and looking for relationships will provide adequate information for developing otherinstruments.
For many qualitative evaluators, it is above all this third phase that gives qualitative analysis its specialappeal. At the same time, it is probably also the facet that quantitative evaluators and others steeped intraditional quantitative techniques find most disquieting. Once qualitative analysts begin to move beyondcautious analysis of the factual data, the critics ask, what is to guarantee that they are not engaging inpurely speculative flights of fancy? Indeed, their concerns are not entirely unfounded. If the unprocessed"data heap" is the result of not taking responsibility for shaping the "story line" of the analysis, theopposite tendency is to take conclusion drawing well beyond what the data reasonably warrant or toprematurely leap to conclusions and draw implications without giving the data proper scrutiny.
The question about knowledge sharing provides a good example. The underlying expectation, or hope, isfor a diffusion effort, wherein participating faculty stimulate innovation in teaching mathematics amongtheir colleagues. A cross-case finding might be that participating faculty at three of the eight campusesmade active, ongoing efforts to share their new knowledge with their colleagues in a variety of formaland informal settings. At two other campuses, initial efforts at sharing started strong but soon fizzled out
Part II: Chapter 4: Analyzing Quantitative Data
http://www.ehr.nsf.gov/EHR/REC/pubs/NSF97-153/CHAP_4.HTM (8 of 15) [03/12/2001 11:08:25 AM]

and were not continued. In the remaining three cases, one or two faculty participants shared bits andpieces of what they had learned with a few selected colleagues on an ad hoc basis, but otherwise took nosteps to diffuse their new knowledge and skills more broadly.
Taking these findings at face value might lead one to conclude that the project had largely failed inencouraging diffusion of new pedagogical knowledge and skills to nonparticipating faculty. After all,such sharing occurred in the desired fashion at only three of the eight campuses. However, beforejumping ahead to conclude that the project was disappointing in this respect, or to generalize beyond thiscase to other similar efforts at spreading pedagogic innovations among faculty, it is vital to examinemore closely the likely reasons why sharing among participating and nonparticipating faculty occurred,and where and how it did. The analysts would first look for factors distinguishing the three campuseswhere ongoing organized efforts at sharing did occur from those where such efforts were either notsustained or occurred in largely piecemeal fashion. However, it will also be important to differentiateamong the less successful sites to tease out factors related both to the extent of sharing and the degree towhich activities were sustained.
One possible hypothesis would be that successfully sustaining organized efforts at sharing on an ongoingbasis requires structural supports at the departmental level and/or conducive environmental conditions atthe home campus. In the absence of these supports, a great burst of energy and enthusiasm at thebeginning of the academic year will quickly give way under the pressure of the myriad demands, ashappened for the second group of two campuses. Similarly, under most circumstances, the individualgood will of one or two participating faculty on a campus will in itself be insufficient to generate the typeand level of exchange that would make a difference to the nonparticipating faculty (the third set ofcampuses).
At the three "successful" sites, for example, faculty schedules may allow regularly scheduled commonperiods for colleagues to share ideas and information. In addition, participation in such events might beencouraged by the department chair, and possibly even considered as a factor in making promotion andtenure decisions. The department might also contribute a few dollars for refreshments in order to promotea more informal, relaxed atmosphere at these activities. In other words, at the campuses where sharingoccurred as desired, conditions were conducive in one or more ways: a new time slot did not have to becarved out of already crowded faculty schedules, the department chair did more than simply pay "lipservice" to the importance of sharing (faculty are usually quite astute at picking up on what really mattersin departmental culture), and efforts were made to create a relaxed ambiance for transfer of knowledge.
At some of the other campuses, structural conditions might not be conducive, in that classes are taughtcontinuously from 8 a.m. through 8 p.m., with faculty coming and going at different times and onalternating days. At another campus, scheduling might not present so great a hurdle. However, thedepartment chair may be so busy that despite philosophic agreement with the importance of diffusing thenewly learned skills, she can do little to actively encourage sharing among participating andnonparticipating faculty. In this case, it is not structural conditions or lukewarm support so much ascompeting priorities and the department chair's failure to act concretely on her commitment that stood inthe way. By contrast, at another campus, the department chairperson may publicly acknowledge the goalsof the project but really believe it a waste of time and resources. His failure to support sharing activitiesamong his faculty stems from more deeply rooted misgivings about the value and viability of the project.This distinction might not seem to matter, given that the outcome was the same on both campuses(sharing did not occur as desired). However, from the perspective of an evaluation researcher, whether
Part II: Chapter 4: Analyzing Quantitative Data
http://www.ehr.nsf.gov/EHR/REC/pubs/NSF97-153/CHAP_4.HTM (9 of 15) [03/12/2001 11:08:25 AM]

the department chair believes in the project could make a major difference to what would have to be doneto change the outcome.
We have begun to develop a reasonably coherent explanation for the cross-site variations in the degreeand nature of sharing taking place between participating and nonparticipating faculty. Arriving at thispoint required stepping back and systematically examining and re-examining the data, using a variety ofwhat Miles and Huberman (1994, pp. 245-262) call "tactics for generating meaning." They describe 13such tactics, including noting patterns and themes, clustering cases, making contrasts and comparisons,partitioning variables, and subsuming particulars in the general. Qualitative analysts typically employsome or all of these, simultaneously and iteratively, in drawing conclusions.
One factor that can impede conclusion drawing in evaluation studies is that the theoretical or logicalassumptions underlying the research are often left unstated. In this example, as discussed above, these areassumptions or expectations about knowledge sharing and diffusion of innovative practices fromparticipating to non-participating faculty, and, by extension, to their students. For the analyst to be in aposition to take advantage of conclusion-drawing opportunities, he or she must be able to recognize andaddress these assumptions, which are often only implicit in the evaluation questions. Toward that end, itmay be helpful to explicitly spell out a "logic model" or set of assumptions as to how the program isexpected to achieve its desired outcome(s.) Recognizing these assumptions becomes even moreimportant when there is a need or desire to place the findings from a single evaluation into widercomparative context vis-a-vis other program evaluations.
Once having created an apparently credible explanation for variations in the extent and kind of sharingthat occurs between participating and nonparticipating faculty across the eight campuses, how can theanalyst verify the validity - or truth value - of this interpretation of the data? Miles and Huberman (1994,pp. 262-277) outline 13 tactics for testing or confirming findings, all of which address the need to buildsystematic "safeguards against self-delusion" (p. 265) into the process of analysis. We will discuss only afew of these, which have particular relevance for the example at hand and emphasize critical contrastsbetween quantitative and qualitative analytic approaches. However, two points are very important tostress at the outset: several of the most important safeguards on validity - such as using multiple sourcesand modes of evidence - must be built into the design from the beginning; and the analytic objective is tocreate a plausible, empirically grounded account that is maximally responsive to the evaluation questionsat hand. As the authors note: "You are not looking for one account, forsaking all others, but for the bestof several alternative accounts" (p. 274).
One issue of analytic validity that often arises concerns the need to weigh evidence drawn from multiplesources and based on different data collection modes, such as self-reported interview responses andobservational data. Triangulation of data sources and modes is critical, but the results may notnecessarily corroborate one another, and may even conflict. For example, another of the summativeevaluation questions proposed in Chapter 2 concerns the extent to which nonparticipating faculty adoptnew concepts and practices in their teaching. Answering this question relies on a combination ofobservations, self-reported data from participant focus groups, and indepth interviews with departmentchairs and nonparticipating faculty. In this case, there is a possibility that the observational data might beat odds with the self-reported data from one or more of the respondent groups. For example, wheninterviewed, the vast majority of nonparticipating faculty might say, and really believe, that they areapplying project-related innovative principles in their teaching. However, the observers may see verylittle behavioral evidence that these principles are actually influencing teaching practices in these faculty
Part II: Chapter 4: Analyzing Quantitative Data
http://www.ehr.nsf.gov/EHR/REC/pubs/NSF97-153/CHAP_4.HTM (10 of 15) [03/12/2001 11:08:25 AM]
members' classrooms. It would be easy to brush off this finding by concluding that the nonparticipantsare saving face by parroting what they believe they are expected to say about their teaching. But there areother, more analytically interesting, possibilities. Perhaps the nonparticipants have an incompleteunderstanding of these principles, or they were not adequately trained in how to translate themeffectively into classroom practice.
The important point is that analyzing across multiple group perspectives and different types of data is nota simple matter of deciding who is right or which data are most accurate. Weighing the evidence is amore subtle and delicate matter of hearing each group's viewpoint, while still recognizing that any singleperspective is partial and relative to the respondent's experiences and social position. Moreover, as notedabove, respondents' perceptions are no more or less real than observations. In fact, discrepancies betweenself-reported and observational data may reveal profitable topics or areas for further analysis. It is theanalyst's job to weave the various voices and sources together in a narrative that responds to the relevantevaluation question(s). The more artfully this is done, the simpler, more natural it appears to the reader.To go to the trouble to collect various types of data and listen to different voices, only to pound theinformation into a flattened picture, is to do a real disservice to qualitative analysis. However, if there is areason to believe that some of the data are stronger than others (some of the respondents are highlyknowledgeable on the subject, while others are not), it is appropriate to give these responses greaterweight in the analysis.
Qualitative analysts should also be alert to patterns of inter-connection in their data that differ from whatmight have been expected. Miles and Huberman define these as "following up surprises" (1994, p. 270).For instance, at one campus, systematically comparing participating and nonparticipating facultyresponses to the question about knowledge-sharing activities (see Exhibit 10) might reveal few apparentcross-group differences. However, closer examination of the two sets of transcripts might showmeaningful differences in perceptions dividing along other, less expected lines. For purposes of thisevaluation, it was tacitly assumed that the relevant distinctions between faculty would most likely bebetween those who had and had not participated in the project. However, both groups also share a historyas faculty in the same department. Therefore, other factors - such as prior personal ties - might haveoverridden the participant/nonparticipant faculty distinction. One strength of qualitative analysis is itspotential to discover and manipulate these kinds of unexpected patterns, which can often be veryinformative. To do this requires an ability to listen for, and be receptive to, surprises.
Unlike quantitative researchers, who need to explain away deviant or exceptional cases, qualitativeanalysts are also usually delighted when they encounter twists in their data that present fresh analyticinsights or challenges. Miles and Huberman (1994, pp. 269, 270) talk about "checking the meaning ofoutliers" and "using extreme cases." In qualitative analysis deviant instances or cases that do not appearto fit the pattern or trend are not treated as outliers, as they would be in statistical, probability-basedanalysis. Rather, deviant or exceptional cases should be taken as a challenge to further elaboration andverification of an evolving conclusion. For example, if the department chair strongly supports theproject's aims and goals for all successful projects but one, perhaps another set of factors is fulfilling thesame function(s) at the "deviant" site. Identifying those factors will, in turn, help to clarify more preciselywhat it is about strong leadership and belief in a project that makes a difference. Or, to elaborate onanother extended example, suppose at one campus where structural conditions are not conducive tosharing between participating and nonparticipating faculty, such sharing is occurring nonetheless,spearheaded by one very committed participating faculty member. This example might suggest that ahighly committed individual who is a natural leader among his faculty peers is able to overcome the
Part II: Chapter 4: Analyzing Quantitative Data
http://www.ehr.nsf.gov/EHR/REC/pubs/NSF97-153/CHAP_4.HTM (11 of 15) [03/12/2001 11:08:25 AM]

structural constraints to sharing. In a sense, this "deviant" case analysis would strengthen the generalconclusion by showing that it takes exceptional circumstances to override the constraints of the situation.
Elsewhere in this handbook, we noted that summative and formative evaluations are often linked by thepremise that variations in project implementation will, in turn, effect differences in project outcomes. Inthe hypothetical example presented in this handbook, all participants were exposed to the same activitieson the central campus, eliminating the possibility of analyzing the effects of differences inimplementation features. However, using a different model and comparing implementation and outcomesat three different universities, with three campuses participating per university, would give some idea ofwhat such an analysis might look like.
A display matrix for a cross-site evaluation of this type is given in Exhibit 12. The upper portion of thematrix shows how the three campuses varied in key implementation features. The bottom portionsummarizes outcomes at each campus. While we would not necessarily expect a one-to-one relationship,the matrix loosely pairs implementation features with outcomes with which they might be associated. Forexample, workshop staffing and delivery are paired with knowledge-sharing activities, accuracy ofworkshop content with curricular change. However, there is nothing to preclude looking for arelationship between use of appropriate techniques in the workshops (formative) and curricular changeson the campuses (summative). Use of the matrix would essentially guide the analysis along the samelines as in the examples provided earlier.
Exhibit 12.
Matrix of cross-case analysis linking implementation and outcome factors
Implementation Features
Branch campus Workshops deliveredand staffed as
planned?
Content accurate/up to date?
Appropriatetechniques used?
Materials available? Suitablepresentation?
Campus A Yes Yes For most participants Yes, but delayed Mostly
Campus B No Yes Yes No Very mixed reviews
Campus C Mostly Yes For a few participants Yes Some
Outcome Features - Participating Campuses
Branch campus Knowledge -sharingwith nonparticipants?
Curricular changes? Changes to exams andrequirements?
Expenditures? Students moreinterested/ active in
class?
Campus A High level Many Some No Some campuses
Campus B Low level Many Many Yes Mostly participants'students
Campus C Moderate level Only a few Few Yes Only minorimprovement
In this cross-site analysis, the overarching question would address the similarities and differences acrossthese three sites - in terms of project implementation, outcomes, and the connection between them - andinvestigate the bases of these differences. Was one of the projects discernibly more successful than
Part II: Chapter 4: Analyzing Quantitative Data
http://www.ehr.nsf.gov/EHR/REC/pubs/NSF97-153/CHAP_4.HTM (12 of 15) [03/12/2001 11:08:25 AM]

others, either overall or in particular areas - and if so, what factors or configurations of factors seem tohave contributed to these successes? The analysis would then continue through multiple iterations until asatisfactory resolution is achieved.
Summary: Judging the Quality of QualitativeAnalysisIssues surrounding the value and uses of conclusion drawing and verification in qualitative analysis takeus back to larger questions raised at the outset about how to judge the validity and quality of qualitativeresearch. A lively debate rages on these and related issues. It goes beyond the scope of this chapter toenter this discussion in any depth, but it is worthwhile to summarize emerging areas of agreement.
First, although stated in different ways, there is broad consensus concerning the qualitative analyst's needto be self-aware, honest, and reflective about the analytic process. Analysis is not just the end product, itis also the repertoire of processes used to arrive at that particular place. In qualitative analysis, it is notnecessary or even desirable that anyone else who did a similar study should find exactly the same thingor interpret his or her findings in precisely the same way. However, once the notion of analysis as a set ofuniform, impersonal, universally applicable procedures is set aside, qualitative analysts are obliged todescribe and discuss how they did their work in ways that are, at the very least, accessible to otherresearchers. Open and honest presentation of analytic processes provides an important check on anindividual analyst’s tendencies to get carried away, allowing others to judge for themselves whether theanalysis and interpretation are credible in light of the data.
Second, qualitative analysis, as all of qualitative research, is in some ways craftsmanship (Kvale, 1995).There is such a thing as poorly crafted or bad qualitative analysis, and despite their reluctance to issueuniversal criteria, seasoned qualitative researchers of different bents can still usually agree when they seean example of it. Analysts should be judged partly in terms of how skillfully, artfully, and persuasivelythey craft an argument or tell a story. Does the analysis flow well and make sense in relation to thestudy's objectives and the data that were presented? Is the story line clear and convincing? Is the analysisinteresting, informative, provocative? Does the analyst explain how and why she or he drew certainconclusions, or on what bases she or he excluded other possible interpretations? These are the kinds ofquestions that can and should be asked in judging the quality of qualitative analyses. In evaluationstudies, analysts are often called upon to move from conclusions to recommendations for improvingprograms and policies. The recommendations should fit with the findings and with the analysts’understanding of the context or milieu of the study. It is often useful to bring in stakeholders at the pointof "translating" analytic conclusions to implications for action.
As should by now be obvious, it is truly a mistake to imagine that qualitative analysis is easy or can bedone by untrained novices. As Patton (1990) comments:
Applying guidelines requires judgment and creativity. Because each qualitative study is unique,the analytical approach used will be unique. Because qualitative inquiry depends, at every stage,on the skills, training, insights, and capabilities of the researcher, qualitative analysis ultimatelydepends on the analytical intellect and style of the analyst. The human factor is the greatest
Part II: Chapter 4: Analyzing Quantitative Data
http://www.ehr.nsf.gov/EHR/REC/pubs/NSF97-153/CHAP_4.HTM (13 of 15) [03/12/2001 11:08:25 AM]

strength and the fundamental weakness of qualitative inquiry and analysis.
Practical Advice in Conducting QualitativeAnalysesStart the analysis right away and keep a running account of it in your notes: It cannot beoverstressed that analysis should begin almost in tandem with data collection, and that it is an iterativeset of processes that continues over the course of the field work and beyond. It is generally helpful forfield notes or focus group or interview summaries to include a section containing comments, tentativeinterpretations, or emerging hypotheses. These may eventually be overturned or rejected, and will almostcertainly be refined as more data are collected. But they provide an important account of the unfoldinganalysis and the internal dialogue that accompanied the process.
Involve more than one person: Two heads are better than one, and three may be better still. Qualitativeanalysis need not, and in many cases probably should not, be a solitary process. It is wise to bring morethan one person into the analytic process to serve as a cross-check, sounding board, and source of newideas and cross-fertilization. It is best if all analysts know something about qualitative analysis as well asthe substantive issues involved. If it is impossible or impractical for a second or third person to play acentral role, his or her skills may still be tapped in a more limited way. For instance, someone mightreview only certain portions of a set of transcripts.
Leave enough time and money for analysis and writing: Analyzing and writing up qualitative dataalmost always takes more time, thought, and effort than anticipated. A budget that assumes a week ofanalysis time and a week of writing for a project that takes a year’s worth of field work is highlyunrealistic. Along with revealing a lack of understanding of the nature of qualitative analysis, failing tobuild in enough time and money to complete this process adequately is probably the major reason whyevaluation reports that include qualitative data can disappoint.
Be selective when using computer software packages in qualitative analysis: A great proliferation ofsoftware packages that can be used to aid analysis of qualitative data has been developed in recent years.Most of these packages were reviewed by Weitzman and Miles (1995), who grouped them into six types:word processors, word retrievers, textbase managers, code-and-retrieve programs, code-based theorybuilders, and conceptual network builders. All have strengths and weaknesses. Weitzman and Milessuggested that when selecting a given package, researchers should think about the amount, types, andsources of data to be analyzed and the types of analyses that will be performed.
Two caveats are in order. First, computer software packages for qualitative data analysis essentially aidin the manipulation of relevant segments of text. While helpful in marking, coding, and moving datasegments more quickly and efficiently than can be done manually, the software cannot determinemeaningful categories for coding and analysis or define salient themes or factors. In qualitative analysis,as seen above, concepts must take precedence over mechanics: the analytic underpinnings of theprocedures must still be supplied by the analyst. Software packages cannot and should not be used as away of evading the hard intellectual labor of qualitative analysis. Second, since it takes time andresources to become adept in utilizing a given software package and learning its peculiarities, researchers
Part II: Chapter 4: Analyzing Quantitative Data
http://www.ehr.nsf.gov/EHR/REC/pubs/NSF97-153/CHAP_4.HTM (14 of 15) [03/12/2001 11:08:25 AM]

may want to consider whether the scope of their project, or their ongoing needs, truly warrant theinvestment.
References
Berkowitz, S. (1996). Using Qualitative and Mixed Method Approaches. Chapter 4 in NeedsAssessment: A Creative and Practical Guide for Social Scientists, R. Reviere, S. Berkowitz, C.C.Carter, and C. Graves-Ferguson, Eds. Washington, DC: Taylor & Francis.
Glaser, B., and Strauss, A. (1967). The Discovery of Grounded Theory. Chicago: Aldine.
Kvale, S. (1995). The Social Construction of Validity. Qualitative Inquiry, (1):19-40.
Miles, M.B., and Huberman, A.M. (1984). Qualitative Data Analysis, 16. Newbury Park, CA:Sage.
Miles, M.B, and Huberman, A.M. (1994). Qualitative Data Analysis, 2nd Ed., p. 10-12. NewburyPark, CA: Sage.
Patton, M.Q. (1990). Qualitative Evaluation and Research Methods, 2nd Ed. Newbury Park: CA,Sage.
Weitzman, E.A., and Miles, M.B. (1995). A Software Sourcebook: Computer Programs forQualitative Data Analysis. Thousand Oaks, CA: Sage.
Other Recommended Reading
Coffey, A., and Atkinson, P. (1996). Making Sense of Qualitative Data: Complementary ResearchStrategies. Thousand Oaks, CA: Sage.
Howe, K., and Eisenhart, M. (1990). Standards for Qualitative (and Quantitative) Research: AProlegomenon. Educational Researcher, 19(4):2-9.
Wolcott, H.F. (1994). Transforming Qualitative Data: Description, Analysis and Interpretation,Thousand Oaks: CA, Sage.
Previous Chapter | Back to Top | Next Chapter
Table of Contents
Part II: Chapter 4: Analyzing Quantitative Data
http://www.ehr.nsf.gov/EHR/REC/pubs/NSF97-153/CHAP_4.HTM (15 of 15) [03/12/2001 11:08:25 AM]
PART III.Designing and Reporting Mixed MethodEvaluations
Chapter 5Overview of the Design Process for Mixed MethodEvaluationsOne size does not fit all. Consequently, when it comes to designing an evaluation, experience has proventhat the evaluator must keep in mind that the specific questions being addressed and the audience for theanswers must influence the selection of an evaluation design and tools for data collection.
Chapter 2 of the earlier User-Friendly Handbook for Project Evaluation (National Science Foundation,1993) deals at length with designing and implementing an evaluation, identifying the following steps forcarrying out an evaluation:
Developing evaluation questions;●
Matching questions with appropriate information-gathering techniques;●
Collecting data;●
Analyzing the data; and●
Providing information to interested audiences.●
Readers of this volume who are unfamiliar with the overall process are urged to read that chapter. In thischapter, we are briefly reviewing the process of designing an evaluation, including the development ofevaluation questions, the selection of data collection methodologies, and related technical issues, withspecial attention to the advantages of mixed method designs. We are stressing mixed method designsbecause such designs frequently provide a more comprehensive and believable set of understandingsabout a project’s accomplishments than studies based on either quantitative or qualitative data alone.
Developing Evaluation QuestionsThe development of evaluation questions consists of several steps:
Clarifying the goals and objectives of the project;●
Identifying key stakeholders and audiences;●
Listing and prioritizing evaluation questions of interest to various stakeholders; and●
Determining which questions can be addressed given the resources and constraints for the●
Part III: Chapter 5: Overview of the Design Process for Mixed Method Evaluations
http://www.ehr.nsf.gov/EHR/REC/pubs/NSF97-153/CHAP_5.HTM (1 of 10) [03/12/2001 11:09:21 AM]

evaluation (money, deadlines, access to informants and sites).
The process is not an easy one. To quote an experienced evaluator (Patton, 1990):
Once a group of intended evaluation users begins to take seriously the notion that they can learnfrom the collection and analysis of evaluative information, they soon find that there are lots ofthings they would like to find out. The evaluator's role is to help them move from a rather extensivelist of potential questions to a much shorter list of realistically possible questions and finally to afocused list of essential and necessary questions.
We have developed a set of tools intended to help navigate these initial steps of evaluation design. Thesetools are simple forms or matrices that help to organize the information needed to identify and selectamong evaluation questions. Since the objectives of the formative and summative evaluations are usuallydifferent, separate forms need to be completed for each.
Worksheet 1 provides a form for briefly describing the project, the conceptual framework that led to theinitiation of the project, and its proposed activities, and for summarizing its salient features. Informationon this form will be used in the design effort. A side benefit of filling out this form and sharing it amongproject staff is that it can be used to make sure that there is a common understanding of the project’sbasic characteristics. Sometimes newcomers to a project, and even those who have been with it from thestart, begin to develop some divergent ideas about emphases and goals.
WORKSHEET 1:DESCRIBE THE INTERVENTION
1. State the problem/question to be addressed by the project:
2. What is the intervention(s) under investigation?
3. State the conceptual framework which led to the decision to undertake this intervention and itsproposed activities.
4. Who is the target group(s)?
5. Who are the stakeholders?
6. How is the project going to be managed?
Part III: Chapter 5: Overview of the Design Process for Mixed Method Evaluations
http://www.ehr.nsf.gov/EHR/REC/pubs/NSF97-153/CHAP_5.HTM (2 of 10) [03/12/2001 11:09:21 AM]

7. What is the total budget for this project? How are major components budgeted?
8. List any other key points/issues.
Worksheet 2 provides a format for further describing the goals and objectives of the project inmeasurable terms. This step, essential in developing an evaluation design, can prove surprisinglydifficult. A frequent problem is that goals or objectives may initially be stated in such global terms that itis not readily apparent how they might be measured. For example, the statement "improve the educationof future mathematics and science educators" needs more refinement before it can be used as the basisfor structuring an evaluation.
Worksheets 3 and 4 assist the evaluator in identifying the key stakeholders in the project and clarifyingwhat it is each might want to address in an evaluation. Stakeholder involvement has become an importantpart of evaluation design, as it has been recognized that an evaluation must address the needs ofindividuals beyond the funding agency and the project director.
Worksheet 5 provides a tool for organizing and selecting among possible evaluation questions. It pointsto several criteria that should be considered. Who wants to know? Will the information be new orconfirmatory? How important is the information to various stakeholders? Are there sufficient resourcesto collect and analyze the information needed to answer the questions? Can the question be addressed inthe time available for the evaluation?
Once the set of evaluation questions is determined, the next step is selecting how each will be addressedand developing an overall evaluation design. It is at this point that decisions regarding the types andmixture of data collection methodologies, sampling, scheduling of data collection, and data analysis needto be made. These decisions are quite interdependent, and the data collection techniques selected willhave important implications for both scheduling and analysis plans.
WORKSHEET 2: Describe Project GOALAND OBJECTIVE
1. Briefly describe the purpose of the project.
2. State the above in terms of a general goal.
3. State the first objective to be evaluated as clearly as you can.
Part III: Chapter 5: Overview of the Design Process for Mixed Method Evaluations
http://www.ehr.nsf.gov/EHR/REC/pubs/NSF97-153/CHAP_5.HTM (3 of 10) [03/12/2001 11:09:21 AM]

4. Can this objective be broken down further? Break it down to the smallest unit. It must be clear whatspecifically you hope to see documented or changed.
5. Is this objective measurable (can indicators and standards be developed for it)? If not, restate it.
6. Formulate one or more questions that will yield information about the extent to whichthe objective was addressed.
7. Once you have completed the above steps, go back to #3 and write the next objective.Continue with steps 4, and 5, and 6.
WORKSHEET 3:IDENTIFY KEY STAKEHOLDERS AND AUDIENCES
Audience
Spokesperson
Values, Interests, Expectations, etc.That Evaluation Should Address
Part III: Chapter 5: Overview of the Design Process for Mixed Method Evaluations
http://www.ehr.nsf.gov/EHR/REC/pubs/NSF97-153/CHAP_5.HTM (4 of 10) [03/12/2001 11:09:21 AM]

WORKSHEET 4:
STAKEHOLDERS’ INTEREST INPOTENTIAL EVALUATION QUESTIONS
Question Stakeholder Group(s)
Part III: Chapter 5: Overview of the Design Process for Mixed Method Evaluations
http://www.ehr.nsf.gov/EHR/REC/pubs/NSF97-153/CHAP_5.HTM (5 of 10) [03/12/2001 11:09:21 AM]

WORKSHEET 5:PRIORITIZE AND ELIMINATE QUESTIONS
Take each question from worksheet 4 and apply criteria below.
Question Whichstakeholder(s)?
Importanceto
Stakeholders
New DataCollection?
ResourcesRequired
Timeframe Priority (High,Medium, Low,or Eliminate)
H M L E
Part III: Chapter 5: Overview of the Design Process for Mixed Method Evaluations
http://www.ehr.nsf.gov/EHR/REC/pubs/NSF97-153/CHAP_5.HTM (6 of 10) [03/12/2001 11:09:21 AM]

H M L E
H M L E
H M L E
H M L E
H M L E
H M L E
H M L E
H M L E
Selecting Methods for Gathering the Data:The Case for Mixed Method DesignsAs discussed in Chapter 1, mixed method designs can yield richer, more valid, and more reliable findingsthan evaluations based on either the qualitative or quantitative method alone. A further advantage is thata mixed method approach is likely to increase the acceptance of findings and conclusions by the diversegroups that have a stake in the evaluation.
When designing a mixed method evaluation, the investigator must consider two factors:
Which is the most suitable data collection method for the type of data to be collected?●
How can the data collected be most effectively combined or integrated?●
To recapitulate the earlier summary of the main differences between the two methods, qualitative
Part III: Chapter 5: Overview of the Design Process for Mixed Method Evaluations
http://www.ehr.nsf.gov/EHR/REC/pubs/NSF97-153/CHAP_5.HTM (7 of 10) [03/12/2001 11:09:21 AM]

methods provide a better understanding of the context in which the intervention is embedded; when amajor goal of the evaluation is the generalizability of findings, quantitative data are usually needed.When the answer to an evaluation question calls for understanding the perceptions and reactions of thetarget population, a qualitative method (indepth interview, focus group) is most appropriate. If a majorevaluation question calls for the assessment of the behavior of participants or other individuals involvedin the intervention, trained observers will provide the most useful data.
In Chapter 1, we also showed some of the many ways in which the quantitative and qualitativetechniques can be combined to yield more meaningful findings. Specifically, the two methods have beensuccessfully combined by evaluators to test the validity of results (triangulation), to improve datacollection instruments, and to explain findings. A good design for mixed method evaluations shouldinclude specific plans for collecting and analyzing the data through the combined use of both methods;while it may often be difficult to come up with a detailed analysis plan at the outset, it is very useful tohave such a plan when designing data collection instruments and when organizing narrative data obtainedthrough qualitative methods. There needs to be considerable up-front thinking regarding probable dataanalysis plans and strategies for synthesizing the information from various sources. Initial decisions canbe made regarding the extent to which qualitative techniques will be used to provide full-blownstand-alone descriptions versus commentaries or illustrations to give greater meaning to quantitativedata. Preliminary strategies for combining information from different data sources need to be formulated.Schedules for initiating the data analysis need to be established. The early findings thus generated shouldbe used to reflect on the evaluation design and initiate any changes that might be warranted. While in anygood evaluation data analysis is to some extent an iterative process, it is important to think things throughas much as possible at the outset to avoid being left awash in data or with data focusing more onperipheral questions, rather than those that are germane to the study’s goals and objectives (see Chapter4; also see Miles and Huberman, 1994, and Greene, Caracelli, and Graham, 1989).
Other Considerations in DesigningMixed Method EvaluationsSampling. Except in the rare cases when a project is very small and affects only a few participants andstaff members, it will be necessary to deal with a subset of sites and/or informants for budgetary andmanagerial reasons. Sampling thus becomes an issue in the use of mixed methods, just as in the use ofquantitative methods. However, the sampling approaches differ sharply depending on the method used.
The preferred sampling methods for quantitative studies are those that will enable researchers to makegeneralizations from the sample to the universe, i.e., all project participants, all sites, all parents. Randomsampling is the appropriate method for this purpose. Statistically valid generalizations are seldom a goalof qualitative research; rather, the qualitative investigation is primarily interested in locatinginformation-rich cases for study in depth. Purposeful sampling is therefore practiced, and it may takemany forms. Instead of studying a random sample of a project's participants, evaluators may chose toconcentrate their investigation on the lowest achievers admitted to the program. When selectingclassrooms for observation of the implementation of an innovative practice, the evaluator may usedeviant-case sampling, choosing one classroom where the innovation was reported "most successfully"
Part III: Chapter 5: Overview of the Design Process for Mixed Method Evaluations
http://www.ehr.nsf.gov/EHR/REC/pubs/NSF97-153/CHAP_5.HTM (8 of 10) [03/12/2001 11:09:21 AM]

implemented and another where major problems have been reported. Depending on the evaluationquestions to be answered, many other sampling methods, including maximum variation sampling, criticalcase sampling, or even typical case sampling, may be appropriate (Patton, 1990). When samplingsubjects for indepth interviews, the investigator has considerable flexibility with respect to sample size.
In many evaluation studies, the design calls for studying a population at several points in time, e.g.,students in the 9th grade and then again in the 12th grade. There are two ways of carrying out suchstudies that seek to measure trends. In a longitudinal approach, data are collected from the sameindividuals at designated time intervals; in a cross-sectional approach, new samples are drawn for eachsuccessive data collection. While in most cases, longitudinal designs that require collecting informationfrom the same students or teachers at several points in time are best, they are often difficult andexpensive to carry out because students move and teachers are reassigned. Furthermore, loss ofrespondents due to failure to locate or to obtain cooperation from some segment of the original sample isoften a major problem. Depending on the nature of the evaluation and the size of the population studied,it may be possible to obtain good results with successive cross-sectional designs.
Timing, sequencing, frequency of data collection, and cost. The evaluation questions and the analysisplan will largely determine when data should be collected and how often focus groups, interviews, orobservations should be scheduled. In mixed method designs, when the findings of qualitative datacollection will affect the structuring of quantitative instruments (or vice versa), proper sequencing iscrucial. As a general rule, project evaluations are strongest when data are collected at least at two pointsin time: before the time an innovation is first introduced, and after it has been in operation for a sizableperiod of time.
Throughout the design process, it is essential to keep an eye on the budgetary implications of eachdecision. As was pointed out in Chapter 1, costs depend not on the choice between qualitative andquantitative methods, but on the number of cases required for analysis and the quality of the datacollection. Evaluators must resist the temptation to plan for a more extensive data collection than thebudget can support, which may result in lower data quality or the accumulation of raw data that cannotbe processed and analyzed.
Tradeoffs in the design of evaluations based on mixed methods. All evaluators find that both duringthe design phase, when plans are carefully crafted according to experts' recommendations, and later whenfieldwork gets under way, modifications and tradeoffs become a necessity. Budget limitations, problemsin accessing fieldwork sites and administrative records, and difficulties in recruiting staff withappropriate skills are among the recurring problems that should be anticipated as far as possible duringthe design phase, but that also may require modifying the design at a later time.
What tradeoffs are least likely to impair the integrity and usefulness of mixed method evaluations if theevaluation plan as designed cannot be fully implemented? A good general rule for dealing with budgetproblems is to sacrifice the number of cases or the number of questions to be explored (this may meanignoring the needs of some low priority stakeholders), but to preserve the depth necessary to fully andrigorously address the issues targeted.
When it comes to design modifications, it is of course essential that the evaluator be closely involved indecisionmaking. But close contact among the evaluator, the project director, and other project staff isessential throughout the life of the project. In particular, some project directors tend to see the summativeevaluation as an add-on, that is, something to be done - perhaps by a contractor - after the project has
Part III: Chapter 5: Overview of the Design Process for Mixed Method Evaluations
http://www.ehr.nsf.gov/EHR/REC/pubs/NSF97-153/CHAP_5.HTM (9 of 10) [03/12/2001 11:09:21 AM]

been completed. But the quality of the evaluation is dependent on record keeping and data collectionduring the life of the project, which should be closely monitored by the evaluator.
In the next chapter, we illustrate some of the issues related to designing an evaluation, using thehypothetical example provided in Chapter 2.
References
Greene, J.C., Caracelli, V.J., and Graham, W.F. (1989). Toward a Conceptual Framework forMixed Method Evaluation Designs. Educational Evaluation and Policy Analysis, Vol. II, No. 3.
Miles, M.B., and Huberman, A.M. (1994). Qualitative Data Analysis, 2nd Ed. Newbury Park, CA:Sage.
National Science Foundation. (1993). User-Friendly Handbook for Project Evaluation: Science,Mathematics and Technology Education. NSF 93-152. Arlington, VA: NSF.
Patton, M.Q. (1990). Qualitative Evaluation and Research Methods, 2nd Ed. Newbury Park, CA:Sage.
Previous Chapter | Back to Top | Next Chapter
Table of Contents
Part III: Chapter 5: Overview of the Design Process for Mixed Method Evaluations
http://www.ehr.nsf.gov/EHR/REC/pubs/NSF97-153/CHAP_5.HTM (10 of 10) [03/12/2001 11:09:21 AM]

Chapter 6.Evaluation Design for the HypotheticalProject
Step 1. Develop Evaluation QuestionsAs soon as the Center was notified of the grant award for the project described in Chapter 2, staff met withthe evaluation specialist to discuss the focus, timing, and tentative cost allocation for the two evaluations.They agreed that although the summative evaluation was 2 years away, plans for both evaluations had to bedrawn up at this time because of the need to identify stakeholders and to determine evaluation questions.The evaluation specialist requested that the faculty members named in the proposal as technical and subjectmatter resource persons be included in the planning stage. Following the procedure outlined in Chapter 5,the evaluation questions were specified through the use of Worksheets 1 through 5.
As the staff went through the process of developing the evaluation questions, they realized that they neededto become more knowledgeable about the characteristics of the participating institutions and especially theway courses in elementary preservice education were organized. For example, how many levels andsections were there for each course, and how were students and faculty assigned? How much autonomy didfaculty have with respect to course content, examinations, etc.? What were library and other materialresources? The evaluator and her staff spent time reviewing catalogues and other available documents tolearn more about each campus and to identify knowledgeable informants familiar with issues of interest inplanning the evaluation. The evaluator also visited three of the seven branch campuses and held informalconversations with department chairs and faculty to understand the institutional context and issues that theevaluation questions and the data collection needed to take into account.
During these campus visits, the evaluator discovered that interest and participation in the project variedconsiderably, as did the extent to which deans and department chairs encouraged and facilitated facultyparticipation. Questions to explore these issues systematically were therefore added to the formativeevaluation.
The questions initially selected by the evaluation team for the formative and summative evaluation areshown in Exhibits 13 and 14.
Exhibit 13.Goals, stakeholders, and evaluation questions for a formative evaluation
Project goal(implementation-related)
Evaluation questions Stakeholders
Part III: Chapter 6: Evaluation Design for the Hypothetical Project
http://www.ehr.nsf.gov/EHR/REC/pubs/NSF97-153/CHAP_6.HTM (1 of 8) [03/12/2001 11:11:02 AM]

1. To attract faculty and administrators’ interestand support for project participation by eligiblefaculty members
Did all campuses participate? If not, what werethe reasons? How was the program publicized?In what way did local administrators encourage(or discourage) participation by eligible facultymembers? Were there incentives or rewards forparticipation? Did applicants andnonapplicants, and program completers anddropouts, differ with respect to personal andwork-related characteristics (age, highestdegree obtained, ethnicity, years of teachingexperience, etc.)
granting agency, center administrators, projectstaff
2. To offer a state of the art facultydevelopment program to improve thepreparation of future teachers for elementarymathematics instruction
Were the workshops organized and staffed asplanned? Were needed materials available?Were the workshops of high quality (accuracyof information, depth of coverage, etc.)?
granting agency, project sponsor (centeradministrators), other administrators, projectstaff
3. To provide participants with knowledgeconcerning new concepts, methods, andstandards in elementary math education
Was the full range of topics included in thedesign actually covered? Was there evidence ofan increase in knowledge as a result of projectparticipation?
center administrators, project staff
4. To provide followup and encouragenetworking through frequent contact amongparticipants during the academic year
Did participants exchange information abouttheir use of new instructional approaches? Bye-mail or in other ways?
project staff
5. To identify problems in carrying out theproject during year 1 for the purpose of makingchanges during year 2
Did problems arise? Are workshops too few,too many? Should workshop format, content,staffing be modified? Is communicationadequate? Was summer session useful?
granting agency, center administrators, campusadministrators, project staff, participants
Exhibit 14.Goals, stakeholders, and evaluation questions for a summative evaluation
Project goal (outcome) Evaluation questions Stakeholders
1. Changes in instructional practices byparticipating faculty members
Did faculty who have experienced theprofessional development change theirinstructional practices? Did this vary by teachers’or by students’ characteristics? Did facultymembers use the information regarding newstandards, materials, and practices? Whatobstacles prevented implementing changes?What factors facilitated change?
granting agency, project sponsor (center),campus administrators, project staff
2. Acquisition of knowledge and changes ininstructional practices by other (nonparticipating)faculty members
Did participants share knowledge acquiredthrough the project with other faculty? Was itdone formally (e.g., at faculty meetings) orinformally?
granting agency, project sponsor (center),campus administrators, project staff
3. Institution-wide change in curriculum andadministrative practices
Were changes made in curriculum?Examinations and other requirements?Expenditures for library and other resourcematerials (computers)?
granting agency, project sponsor (center),campus administrators, project staff, and campusfaculty participants
4. Positive effects on career plans of studentstaught by participating teachers
Did students become more interested inclasswork? More active participants? Did theyexpress interest in teaching math aftergraduation? Did they plan to use new conceptsand techniques?
granting agency, project sponsor (center),campus administrators, project staff, and campusfaculty participants
Part III: Chapter 6: Evaluation Design for the Hypothetical Project
http://www.ehr.nsf.gov/EHR/REC/pubs/NSF97-153/CHAP_6.HTM (2 of 8) [03/12/2001 11:11:02 AM]

Step 2. Determine Appropriate Data Sources andData Collection Approaches to Obtain Answers tothe Final Set of Evaluation QuestionsThis step consisted of grouping the questions that survived the prioritizing process in step 1, definingmeasurable objectives, and determining the best source for obtaining the information needed and the bestmethod for collecting that information. For some questions, the choice was simple. If the project reimbursesparticipants for travel and other attendance-related expenses, reimbursement records kept in the projectoffice would yield information about how many participants attended each of the workshops. For mostquestions, however, there might be more choices and more opportunity to take advantage of the mixedmethod approach. To ascertain the extent of participants' learning and skill enhancement, the source mightbe participants, or workshop observers, or workshop instructors and other staff. If the choice is made to relyon information provided by the participants themselves, data could be obtained in many different ways:through tests (possibly before and after the completion of the workshop series), work samples, narrativessupplied by participants, self-administered questionnaires, indepth interviews, or focus group sessions. Thechoice should be made on the basis of methodological (which method will give us the "best" data?) andpragmatic (which method will strengthen the evaluation's credibility with stakeholders? which method canthe budget accommodate?) considerations.
Source and method choices for obtaining the answers to all questions in Exhibits 13 and 14 are shown inExhibits 15 and 16. Examining these exhibits, it becomes clear that data collection from one source cananswer a number of questions. The evaluation design begins to take shape; technical issues, such assampling decisions, number of times data should be collected, and timing of the data collections, need to beaddressed at this point. Exhibit 17 summarizes the data collection plan created by the evaluation specialistand her staff for both evaluations.
The formative evaluation must be completed before the end of the first year to provide useful inputs for theyear 2 activities. Data to be collected for this evaluation include
Relevant information in existing records;●
Frequent interviews with project director and staff;●
Short self-administered questionnaires to be completed by participants at the conclusion of eachworkshop; and
●
Reports from the two to four staff observers who observed the 11 workshop sessions.●
In addition, the 25 year 1 participants will be assigned to one of three focus groups to be convened twice(during month 5 and after the year 1 summer session) to assess the program experience, suggest programmodifications, and discuss interest in instructional innovation on their home campus.
Exhibit 15.Evaluation questions, data sources, and data collection methods for a formative evaluation
Question Source of information Data collection methods
Part III: Chapter 6: Evaluation Design for the Hypothetical Project
http://www.ehr.nsf.gov/EHR/REC/pubs/NSF97-153/CHAP_6.HTM (3 of 8) [03/12/2001 11:11:02 AM]

1. Did all campuses participate? If not, what werethe reasons? How was the program publicized?In what way did local administrators encourage(or discourage) participation by eligible facultymembers? Were there incentives or rewards forparticipation? Did applicants and nonapplicants,and program completers and dropouts, differwith respect to personal and work-relatedcharacteristics (age, highest degree obtained,ethnicity, years of teaching experience, etc.)?
project records, project director, roster of eligibleapplicants on each campus, campus participants
record review; interview with project director;rosters of eligible applicants on each campus(including personal characteristics, length ofservice, etc.), participant focus groups
2. Were the workshops organized and staffed asplanned? Were needed materials available? Werethe workshops of high quality (accuracy ofinformation, depth of coverage, etc.)?
project records, correspondence, comparing grantproposal and agenda of workshops
project director, document review, other staffinterviews,
3. Was the full range of topics included in thedesign actually covered? Was there evidence ofan increase in knowledge as a result of projectparticipation?
project director and staff, participants, observers, participant questionnaire, observer notes,observer focus group, participant focus group,work samples
4. Did participants exchange information abouttheir use of new instructional approaches? Bye-mail or in other ways?
participants, analysis of messages of listserv participant focus group
5. Did problems arise? Are workshops too few,too many? Should workshop format, content,staffing be modified? Is communicationadequate? Was summer session useful?
project director, staff, observers, participants interview with project director and staff, focusgroup interview with observers, focus group withparticipants
Exhibit 16.Evaluation questions, data sources, and data collection methods for summative evaluation
Question Source of information Data collection methods
1. Did faculty who have experienced theprofessional development change theirinstructional practices? Did this vary by teachers’or by students’ characteristics? Do they use theinformation regarding new standards, materials,and practices? What obstacles preventedimplementing changes? What factors facilitatedchange?
participants, classroom observers, departmentchair
focus group with participants, reports ofclassroom observers, interview with departmentchair
2. Did participants share knowledge acquiredthrough the project with other faculty? Was itdone formally (e.g., at faculty meetings) orinformally?
participants, other faculty, classroom observers,department chair
focus groups with participants, interviews withnonparticipants, reports of classroom observers(nonparticipants’ classrooms), interview withdepartment chair
3. Were changes made in curriculum?Examinations and other requirements?Expenditures for library and other resourcematerials (computers)?
participants, department chair, dean, budgets andother documents
focus groups with participants, interview withdepartment chair and dean, document review
4. Did students become more interested inclasswork? More active participants? Did theyexpress interest in teaching math aftergraduation? Did they plan to use new conceptsand techniques?
students, participants self-administered questionnaire to be completedby students, focus group with participants
Exhibit 17.First data collection plan
Part III: Chapter 6: Evaluation Design for the Hypothetical Project
http://www.ehr.nsf.gov/EHR/REC/pubs/NSF97-153/CHAP_6.HTM (4 of 8) [03/12/2001 11:11:02 AM]
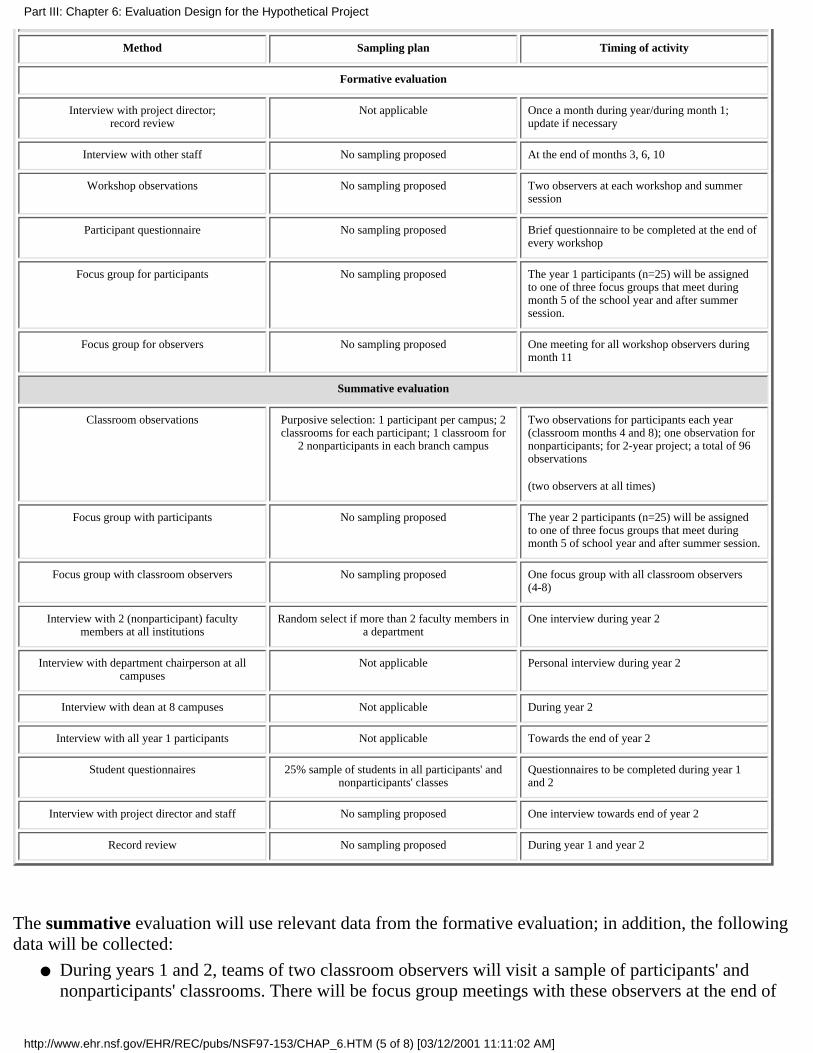
Method Sampling plan Timing of activity
Formative evaluation
Interview with project director;record review
Not applicable Once a month during year/during month 1;update if necessary
Interview with other staff No sampling proposed At the end of months 3, 6, 10
Workshop observations No sampling proposed Two observers at each workshop and summersession
Participant questionnaire No sampling proposed Brief questionnaire to be completed at the end ofevery workshop
Focus group for participants No sampling proposed The year 1 participants (n=25) will be assignedto one of three focus groups that meet duringmonth 5 of the school year and after summersession.
Focus group for observers No sampling proposed One meeting for all workshop observers duringmonth 11
Summative evaluation
Classroom observations Purposive selection: 1 participant per campus; 2classrooms for each participant; 1 classroom for
2 nonparticipants in each branch campus
Two observations for participants each year(classroom months 4 and 8); one observation fornonparticipants; for 2-year project; a total of 96observations
(two observers at all times)
Focus group with participants No sampling proposed The year 2 participants (n=25) will be assignedto one of three focus groups that meet duringmonth 5 of school year and after summer session.
Focus group with classroom observers No sampling proposed One focus group with all classroom observers(4-8)
Interview with 2 (nonparticipant) facultymembers at all institutions
Random select if more than 2 faculty members ina department
One interview during year 2
Interview with department chairperson at allcampuses
Not applicable Personal interview during year 2
Interview with dean at 8 campuses Not applicable During year 2
Interview with all year 1 participants Not applicable Towards the end of year 2
Student questionnaires 25% sample of students in all participants' andnonparticipants' classes
Questionnaires to be completed during year 1and 2
Interview with project director and staff No sampling proposed One interview towards end of year 2
Record review No sampling proposed During year 1 and year 2
The summative evaluation will use relevant data from the formative evaluation; in addition, the followingdata will be collected:
During years 1 and 2, teams of two classroom observers will visit a sample of participants' andnonparticipants' classrooms. There will be focus group meetings with these observers at the end of
●
Part III: Chapter 6: Evaluation Design for the Hypothetical Project
http://www.ehr.nsf.gov/EHR/REC/pubs/NSF97-153/CHAP_6.HTM (5 of 8) [03/12/2001 11:11:02 AM]

school years 1 and 2 (four to eight staff members are likely to be involved in conducting the 48scheduled observations each year).
During year 2 and after the year 2 summer session, focus group meetings will be held with the 25year 2 participants.
●
At the end of year 2, all year 1 participants will be interviewed.●
Interviews will be conducted with nonparticipant faculty members, department chairs and deans ateach campus, the project director, and project staff.
●
Student surveys will be conducted.●
Step 3. Reality Testing and Design Modifications:Staff Needs, Costs, Time Frame Within Which AllTasks (Data Collection, Data Analysis, and ReportWriting) Must Be CompletedThe evaluation specialist converted the data collection plan (Exhibit 17) into a timeline, showing for eachmonth of the 2 1/2-year life of the project data collection, data analysis, and report-writing activities. Staffrequirements and costs for these activities were also computed. She also contacted the chairperson of thedepartment of elementary education at each campus to obtain clearance for the planned classroomobservations and data collection from students (undergraduates) during years 1 and 2. This exercise showeda need to fine tune data collection during year 2 so that data analysis could begin by month 18; it alsosuggested that the scheduled data collection activities and associated data reduction and analysis costswould exceed the evaluation budget by $10,000. Conversations with campus administrators had raisedquestions about the feasibility of on-campus data collection from students. The administrators alsoquestioned the need for the large number of scheduled classroom observations. The evaluation staff felt thatthese observations were an essential component of the evaluation, but they decided to survey students onlyonce (at the end of year 2). They plan to incorporate question about impact on students in the focus groupdiscussions with participating faculty members after the summer session at the end of year 1. Exhibit 18shows the final data collection plan for this hypothetical project. It also illustrates how quantitative andqualitative data have been mixed.
Exhibit 18.Final data collection plan
Activity Type ofmethod*
Scheduled collection date Number of cases
1. Interview with project director Q2 Once a month during year 1; twiceduring year 2 (months 18 and 23)
1
2. Interview with project staff Q2 At the end of months 3, 6, 10 (year1); at the end of month 23 (year 2)
4 interviews with 4 persons =16 interviews
3. Record review Q2 Month 1 plus updates as needed Not applicable
Part III: Chapter 6: Evaluation Design for the Hypothetical Project
http://www.ehr.nsf.gov/EHR/REC/pubs/NSF97-153/CHAP_6.HTM (6 of 8) [03/12/2001 11:11:02 AM]

4. Workshop observations Q2 Each workshop including summer 2 observers, 11 observations =22 observations
5. Participants’ evaluation of each workshop Q1 At the end of each workshop andsummer
25 participants in 11 workshops = 275questionnaires
6. Participants’ focus groups Q2 Months 5,10,17,22 12 focus groups for 7-8 participants
7. Workshop observer focus groups Q2 Month 10 1 meeting for 2-4 observers
8. Classroom observations Q2 Months 4, 8, 16, 20 2 observers 4 times in 8 classrooms = 64observations
9. Classroom observations (nonparticipantclassrooms)
Q2 Months 8 and 16 2 observers twice in 8 classrooms= 32 observations
10. Classroom observers focus group Q2 Months 10 and 22 2 meetings with all classroomobservers (4-8)
11. Interviews with department chairs at 8 branchcampuses
Q2 Months 9 and 21 16 interviews
12. Interviews with all year 1 participants Q2 Month 21 25 interviews
13. Interviews with deans at 7 branch campuses Q2 Month 21 7 interviews
14. Interviews with 2 nonparticipant facultymembers at each campus
Q2 Month 21 16 interviews
15. Student survey Q1 Month 20 600 self-administered questionnaires
16. Document review Q2 Months 3 and 22 Not applicable
*Q1 = quantitative; Q2 = qualitative.
It should be noted that due chiefly to budgetary constraints, the priorities that the final evaluation plan didnot provide for the systematic collection of some information that might have been of importance for theoverall assessment of the project and recommendations for replication are missing. For example, there is noprovision to examine systematically (by using trained workshop observers, as is done during year 1) theextent to which the year 2 workshops were modified as a result of the formative evaluation. This does notmean, however, that an evaluation question that did not survive the prioritization process cannot beexplored in conjunction with the data collection tools specified in Exhibit 17. Thus, the question ofworkshop modifications and their effectiveness can be explored in the interviews scheduled with projectstaff and the self-administered questionnaires and focus groups for year 2 participants. Furthermore,informal interaction between the evaluation staff, the project staff, participants, and others involved in theproject can yield valuable information to enrich the evaluation.
Experienced evaluators know that, in hindsight, the prioritization process is often imperfect. And during thelife of any project, it is likely that unanticipated events will affect project outcomes. Given the flexiblenature of qualitative data collection tools, to some extent the need for additional information can beaccommodated in mixed method designs by including narrative and anecdotal material. Some of the waysin which such material can be incorporated in reaching conclusions and recommendations will be discussedin Chapter 7 of this handbook.
Part III: Chapter 6: Evaluation Design for the Hypothetical Project
http://www.ehr.nsf.gov/EHR/REC/pubs/NSF97-153/CHAP_6.HTM (7 of 8) [03/12/2001 11:11:02 AM]

Previous Chapter | Back to Top | Next Chapter
Table of Contents
Part III: Chapter 6: Evaluation Design for the Hypothetical Project
http://www.ehr.nsf.gov/EHR/REC/pubs/NSF97-153/CHAP_6.HTM (8 of 8) [03/12/2001 11:11:02 AM]

Chapter 7.Reporting the Results of Mixed MethodEvaluationsThe final task the evaluator is required to perform is to summarize what the team has done, what hasbeen learned, and how others might benefit from this project’s experience. As a rule, NSF grantees areexpected to submit a final report when the evaluation has been completed. For the evaluator, this is seenas the primary reporting task, which provides the opportunity to depict in detail the rich qualitative andquantitative information obtained from the various study activities.
In addition to the contracting agency, most evaluations have other audiences as well, such as previouslyidentified stakeholders, other policymakers, and researchers. For these audiences, whose interest may belimited to a few of the topics covered in the full report, shorter summaries, oral briefings, conferencepresentations, or workshops may be more appropriate. Oral briefings allow the sharing of key findingsand recommendations with those decisionmakers who lack the time to carefully review a voluminousreport. In addition, conference presentations and workshops can be used to focus on special themes or totailor messages to the interests and background of a specific audience.
In preparing the final report and other products that communicate the results of the evaluation, theevaluator must consider the following questions:
How should the communication be best tailored to meet the needs and interests of a givenaudience?
●
How should the comprehensive final report be organized? How should the findings based onqualitative and quantitative methods be integrated?
●
Does the report distinguish between conclusions based on robust data and those that are morespeculative?
●
Where findings are reported, especially those likely to be considered sensitive, have appropriatesteps been taken to make sure that promises of confidentiality are met?
●
This chapter deals primarily with these questions. More extensive coverage of the general topic ofreporting and communicating evaluation results can be found in the earlier User-Friendly Handbook forProject Evaluation (NSF, 1993).
Ascertaining the Interests and Needs of the Audience
The diversity of audiences for which the findings are likely to be of interest is illustrated for thehypothetical project in Exhibit 19. As shown, in addition to NSF, the immediate audience for theevaluation might include top-level administrators at the major state university, staff at the Center forEducational Innovation, and the undergraduate faculty who are targeted to participate in these or similarworkshops. Two other indirect audiences might be policymakers at other 4-year institutions interested indeveloping similar preservice programs and other researchers. Each of these potential audiences might be
Part III: Chapter 7: Reporting the Results of Mixed Method Evaluations
http://www.ehr.nsf.gov/EHR/REC/pubs/NSF97-153/CHAP_7.HTM (1 of 9) [03/12/2001 11:12:05 AM]

interested in different aspects of the evaluation's findings. Not all data collected in a mixed methodevaluation will be relevant to their interests. For example:
The National Science Foundation staff interested in replication might want rich narrative detail inorder to help other universities implement similar preservice programs. For this audience, themodel would be a descriptive report that traces the flow of events over time, recounts how thepreservice program was planned and implemented, identifies factors that facilitated or impeded theproject’s overall success, and recommends possible modifications.
●
Top-level administrators at the university might be most interested in knowing whether thepreservice program had its intended effect, i.e., to inform future decisions about funding levels andto optimize the allocation of scarce educational resources. For this audience, data from thesummative evaluation are most pertinent.
●
Staff at the Center for Educational Innovation might be interested in knowing which activitieswere most successful in improving the overall quality of their projects. In addition, the Centerwould likely want to use any positive findings to generate ongoing support for their program.
●
Exhibit 19.Matrix of stakeholders
Intended impacts of the study
Potential audience forthe study findings
Levels of audienceinvolvement with
the program
Assess successof the program
Facilitatedecision-making
Generatesupport for the
program
Revise currenttheories about
preserviceeducation
Inform bestpractices forpreserviceeducationprograms
National ScienceFoundation
Direct X X X X
Top-level administrators atthe major state university
Direct X X X
Staff at the Center forEducational Innovation
Direct X X X X X
Undergraduate facultytargeted to participate inthe workshops
Direct X X
Policymakers at other4-year institutionsinterested in developingsimilar preserviceprograms
Indirect X X X
Other researchers Indirect X X X
In this example, the evaluator would risk having the results ignored by some stakeholders andunderutilized by others if only a single dissemination strategy was used. Even if a single report isdeveloped for all stakeholders (which is usually the case), it is advisable to develop a dissemination
Part III: Chapter 7: Reporting the Results of Mixed Method Evaluations
http://www.ehr.nsf.gov/EHR/REC/pubs/NSF97-153/CHAP_7.HTM (2 of 9) [03/12/2001 11:12:05 AM]

strategy that recognizes the diverse informational needs of the audience and the limited time somereaders might realistically be able to devote to digesting the results of the study. Such a strategy mightinclude (1) preparing a concise executive summary of the evaluation’s key findings (for the university'stop-level administrators); (2) preparing a detailed report (for the Center for Educational Innovation andthe National Science Foundation) that describes the history of the program, the range of activities offeredto undergraduate faculty, and the impact of these activities on program participants and their students;and (3) conducting a series of briefings that are tailored to the interests of specific stakeholders (e.g.,university administrators might be briefed on the program's tangible benefits and costs). By referringback to the worksheets that were developed in planning the evaluation (see Chapter 5), the interests ofspecific stakeholders can be ascertained. However, rigid adherence to the original interests expressed bystakeholders is not always the best approach. This strategy may shortchange the audience if theevaluation - as is often the case - pointed to unanticipated developments. It should also be pointed outthat while the final report usually is based largely on answers to summative evaluation questions, it isuseful to summarize salient results of the formative evaluation as well, where these results provideimportant information for project replication.
Organizing and Consolidating the Final Report
Usually, the organization of mixed method reports follows the standard format, described in detail in theearlier NSF user-friendly handbook, that consists of five major sections:
Background (the project’s objectives and activities);●
Evaluation questions (meeting stakeholders’ information needs);●
Methodology (data collection and analysis);●
Findings; and●
Conclusions (and recommendations).●
In addition to the main body of the report, a short abstract and a one-to four-page executive summaryshould be prepared. The latter is especially important because many people are more likely to read theexecutive summary than the full document. The executive summary can help focus readers on the mostsignificant aspects of the evaluation. It is desirable to keep the methodology section short and to includea technical appendix containing detailed information about the data collection and other methodologicalissues. All evaluation instruments and procedures should be contained in the appendix, where they areaccessible to interested readers.
Regardless of the audience for which it is written, the final report must engage the reader and stimulateattention and interest. Descriptive narrative, anecdotes, personalized observations, and vignettes make forlivelier reading than a long recitation of statistical measures and indicators. One of the major virtues ofthe mixed method approach is the evaluator’s ability to balance narrative and numerical reporting. Thiscan be done in many ways: for example, by alternating descriptive material (obtained through qualitativetechniques) and numerical material (obtained through quantitative techniques) when describing projectactivities, or by using qualitative information to illustrate, personalize, or explicate a statistical finding.
But - as discussed in the earlier chapters - the main virtue of using a mixed method approach is that itenlarges the scope of the analysis. And it is important to remember that the purpose of the final report is
Part III: Chapter 7: Reporting the Results of Mixed Method Evaluations
http://www.ehr.nsf.gov/EHR/REC/pubs/NSF97-153/CHAP_7.HTM (3 of 9) [03/12/2001 11:12:05 AM]

not only to tell the story of the project, its participants, and its activities, but also to assess in what ways itsucceeded or failed in achieving its goals.
In preparing the findings section, which constitutes the heart of the report, it is important to balance andintegrate the descriptive and evaluative reporting section. A well-written report should provide a concisecontext for understanding the conditions in which results were obtained and identifying specific factors(e.g., implementation strategies) that affected the results. According to Patton (1990),
Description is thus balanced by analysis and interpretation. Endless description becomes its ownmuddle. The purpose of analysis is to organize description so that it is manageable. Description isbalanced by analysis and leads into interpretation. An interesting and reasonable report providessufficient description to allow the reader to understand the basis for an interpretation, andsufficient interpretation to allow the reader to understand the description.
For the hypothetical project, most questions identified for the summative evaluation in Exhibit 16 can beexplored through the joint use of qualitative and quantitative data, as shown in Exhibit 20. For example,to answer some of the questions pertaining to the impact of faculty training on their students’ attitudesand behaviors, quantitative data (obtained from a student survey) are being used, together withqualitative information obtained through several techniques (classroom observations, faculty focusgroups, interviews with knowledgeable informants.)
Exhibit 20. Example of an evaluation/methodology/matrix
Project goals Summative evaluation study questions Data collection techniques (see codes below)
a b c d e f
Changes in instructionalpractices by participating facultymembers
Did the faculty who experienced the workshoptraining change their instructional practice?
X X X X
Did the faculty who experienced the workshoptraining use the information regarding newstandards, materials, and practices?
X X X X
What practices prevented the faculty whoexperienced the workshop training fromimplementing the changes?
X
X
Acquisition of knowledge andchanges in instructionalpractices by other(nonparticipating) facultymembers
Did participants share the knowledge acquiredthrough the workshops with other faculty?
X X X
What methods did participants use to share theknowledge acquired through the workshops?
X
Institution-wide changes incurriculum and administrativepractices
Were changes made in curriculum? X X
Were changes made in examinations and otherrequirements?
X X
Were changes made in expenditures for librariesand other resource materials?
X X
Part III: Chapter 7: Reporting the Results of Mixed Method Evaluations
http://www.ehr.nsf.gov/EHR/REC/pubs/NSF97-153/CHAP_7.HTM (4 of 9) [03/12/2001 11:12:05 AM]

Positive effects on career plansof students taught byparticipating teachers
Did students become more interested in theirclasswork?
X X X
Did students become more active participants? X X X X
Did students express interest in teaching math aftergraduation?
X
Did students plan to use new concepts andtechniques?
X
a = indepth interviews with knowledgeable informantsb = focus groupsc = observation of workshops
d = classroom observationse = surveys of studentsf = documents
Formulating Sound Conclusions and Recommendations
In the great majority of reporting activities, the evaluator will seek to include a conclusion andrecommendations section in which the findings are summarized, broader judgments are made about thestrengths and weaknesses of the project and its various features, and recommendations for future, perhapsimproved, replications are presented. Like the executive summary, this section is widely read and mayaffect policymakers' and administrators' decisions with respect to future project support.
The report writer can include in this section only a limited amount of material, and should thereforeselect the most salient findings. But how should saliency be defined? Should the "strongest" findings beemphasized, i.e., those satisfying accepted criteria for soundness in the quantitative and qualitativetraditions? Or should the writer present more sweeping conclusions, ones which may be based in part onimpressionistic and anecdotal material?
It can be seen that the evaluator often faces a dilemma. On the one hand, it is extremely important thatthe bulk of evaluative statements made in this section can be supported by accurate and robust data andsystematic analysis. As discussed in Chapter 1, some stakeholders may seek to discredit evaluations ifthey are not in accord with their expectations or preferences; such critics may question the conclusionsand recommendations offered by the evaluator that seem to leap beyond the documented evidence. Onthe other hand, it is often beneficial to capture insights that result from immersion in a project, insightsnot provided by sticking only to results obtained through scientific documentation. The evaluator mayhave developed a strong, intuitive sense of how the project really worked out, what were its best or worstfeatures, and what benefits accrued to participants or to institutions impacted by the project (for example,schools or school systems). Thus, there may be a need to stretch the data beyond their inherent limits, orto make statements for which the only supporting data are anecdotal.
We have several suggestions for dealing with these issues:
Distinguish carefully between conclusions that are based on "hard" data and those that are morespeculative. The best strategy is to start the conclusions section with material that has undergonethorough verification and to place the more subjective speculations toward the end of the section.
●
Provide full documentation for all findings where available. Data collection instruments,descriptions of the study subjects, specific procedures followed for data collection, survey
●
Part III: Chapter 7: Reporting the Results of Mixed Method Evaluations
http://www.ehr.nsf.gov/EHR/REC/pubs/NSF97-153/CHAP_7.HTM (5 of 9) [03/12/2001 11:12:05 AM]

response rates, refusal rates for personal interviews and focus group participation, accessproblems, etc., should all be discussed in an appendix. If problems were encountered that mayhave affected the findings, possible biases and how the evaluator sought to correct them should bediscussed.
Use the recommendations section to express views based on the total project experience. Ofcourse, references to data should be included whenever possible. For example, a recommendationin the report for the hypothetical project might include the following phrase: "Future programsshould provide career-related incentives for faculty participation, as was suggested by severalparticipants." But the evaluator should also feel free to offer creative suggestions that do notnecessarily rely on the systematic data collection.
●
Maintaining Confidentiality
All research involving human subjects entails possible risks for participants and usually requiresinformed consent on their part. To obtain this consent, researchers usually assure participants that theiridentity will not be revealed when the research is reported and that all information obtained throughsurveys, focus groups, personal interviews, and observations will be handled confidentially. Participantsare assured that the purpose of the study is not to make judgments about their performance or behavior,but simply to improve knowledge about a project's effectiveness and improve future activities.
In quantitative studies, reporting procedures have been developed to minimize the risk that the actionsand responses of participants can be associated with a specific individual; usually results are reported forgroupings only and, as a rule, only for groupings that include a minimum number of subjects.
In studies that use qualitative methods, it may be more difficult to report all findings in ways that make itimpossible to identify a participant. The number of respondents is often quite small, especially if one islooking at respondents with characteristics that are of special interest in the analysis (for example, olderteachers, or teachers who hold a graduate degree). Thus, even if a finding does not name the respondent,it may be possible for someone (a colleague, an administrator) to identify a respondent who made acritical or disparaging comment in an interview.
Of course, not all persons who are interviewed in the course of an evaluation can be anonymous: thename of those persons who have a unique or high status role (the project director, a college dean, or aschool superintendent) are known, and anonymity should not be promised. The issue is of importance tomore vulnerable persons, usually those in subordinate positions (teachers, counselors, or students) whomay experience negative consequences if their behavior and opinions become known.
It is in the interest of the evaluator to obtain informed consent from participants by assuring them thattheir participation is risk-free; they will be more willing to participate and will speak more openly. But inthe opinion of experienced qualitative researchers, it is often impossible to fulfill promises of anonymitywhen qualitative methods are used:
Confidentiality and anonymity are usually promised - sometimes very superficially - in initialagreements with respondents. For example, unless the researcher explains very clearly what afed-back case will look like, people may not realize that they will not be anonymous at all to other
Part III: Chapter 7: Reporting the Results of Mixed Method Evaluations
http://www.ehr.nsf.gov/EHR/REC/pubs/NSF97-153/CHAP_7.HTM (6 of 9) [03/12/2001 11:12:05 AM]

people within the setting who read the case (Miles and Huberman, 1994).
The evaluator may also find it difficult to balance the need to convey contextual information that willprovide vivid descriptive information and the need to protect the identity of informants. But ifparticipants have been promised anonymity, it behooves the evaluator to take every precaution so thatinformants cannot be linked to any of the information they provided.
In practice, the decision of how and when to attribute findings to a site or respondent is generally madeon a case-by-case basis. The following example provides a range of options for revealing and disclosingthe source of information received during an interview conducted for the hypothetical project:
Attribute the information to a specific respondent within an individual site: "The dean atLakewood College indicated that there was no need for curriculum changes at this time."
●
Attribute the information to someone within a site: "A respondent at Lakewood Collegeindicated that there was no need for curriculum changes at this time." In this example, therespondent's identity within the site is protected, i.e., the reader is only made aware that someoneat a site expressed a preference for the status quo. Note that this option would not be used if onlyone respondent at the school was in a position to make this statement.
●
Attribute the information to the respondent type without identifying the site: "The dean atone of the participating colleges indicated that there was no need for curriculum changes at thistime." In this example, the reader is only made aware of the type of respondent that expressed apreference for the status quo.
●
Do not attribute the information to a specific respondent type or site: "One of the studyrespondents indicated that there was no need for curriculum changes at this time." In this example,the identity of the respondent is fully protected.
●
Each of these alternatives has consequences not only for protecting respondent anonymity, but also forthe value of the information that is being conveyed. The first formulation discloses the identity of therespondent and should only be used if anonymity was not promised initially, or if the respondent agreesto be identified. The last alternative, while offering the best guarantee of anonymity, is so general that itweakens the impact of the finding. Depending on the direction taken by the analysis (were thereimportant differences by site? by type of respondent?), it appears that either the second or thirdalternative 2 or 3 represents the best choice.
One common practice is to summarize key findings in chapters that provide cross-site analyses ofcontroversial issues. This alternative is "directly parallel to the procedure used in surveys, in which theonly published report is about the aggregate evidence" (Yin, 1990). Contextual information aboutindividual sites can be provided separately, e.g., in other chapters or an appendix.
Tips for Writing Good Evaluation Reports
Start early. Although we usually think about report writing as the final step in the evaluation, a gooddeal of the work can (and often does) take place before the data are collected. For example, a backgroundsection can often be developed using material from the original proposal. While some aspects of themethodology may deviate from the original proposal as the study progresses, most of the background
Part III: Chapter 7: Reporting the Results of Mixed Method Evaluations
http://www.ehr.nsf.gov/EHR/REC/pubs/NSF97-153/CHAP_7.HTM (7 of 9) [03/12/2001 11:12:05 AM]

information (e.g., nature of the problem, project goals) will remain the same throughout the evaluation.In addition, the evaluation study questions section can often be written using material that was developedfor the evaluation design. The evaluation findings, conclusions, and recommendations generally need towait for the end of the evaluation.
Because of the volume of written data that are collected on site, it is generally a good idea to organizestudy notes as soon after a site visit or interview as possible. These notes will often serve as a startingpoint for any individual case studies that might be included in the report. In addition, as emphasized inChapter 4, preparing written text soon after the data collection activity will help to classify and displaythe data and reduce the overall volume of narrative data that will eventually need to be summarized andreported at the end of the study. Finally, preparing sections of the findings chapter during the datacollection phase allows researchers to generate preliminary conclusions or identify potential trends thatcan be confirmed or refuted by additional data collection activities.
Make the report concise and readable. Because of the volume of material that is generally collectedduring mixed method evaluations, a challenging aspect of reporting is deciding what information mightbe omitted from the final report. As a rule, only a fraction of the tabulations prepared for survey analysisneed to be displayed and discussed. Qualitative field work and data collection methods yield a largevolume of narrative information, and evaluators who try to incorporate all of the qualitative data theycollected into their report risk losing their audience. Conversely, by omitting too much, evaluators riskremoving the context that helps readers attach meaning to any of the report's conclusions. One methodfor limiting the volume of information is to include only narrative that is tied to the evaluation questions.Regardless of how interesting an anecdote is, if the information does not relate to one of the evaluationquestions, it probably does not belong in the report. As discussed previously, another method is toconsider the likely information needs of your audience. Thinking about who is most likely to act upon thereport's findings may help in the preparation of a useful and illuminating narrative (and in the discardingof anecdotes that are irrelevant to the needs of the reader).
The liberal use of qualitative information will enhance the overall tone of the report. In particular, livelyquotes can highlight key points and break up the tedium of a technical summation of study findings. Inaddition, graphic displays and tables can be used to summarize significant trends that were uncoveredduring observations or interviews. Photographs are an effective tool to familiarize readers with theconditions (e.g., classroom size) within which a project is being implemented. New desktop publishingand software packages have made it easier to enhance papers and briefings with photographs, colorfulgraphics, and even cartoons. Quotes can be enlarged and italicized throughout the report to makeimportant points or to personalize study findings. Many of these suggestions hold true for oralpresentations as well.
Solicit feedback from project staff and respondents. It is often useful to ask the project director andother staff members to review sections of the report that quote information they have contributed ininterviews, focus groups, or informal conversations. This review is useful for correcting omissions andmisinterpretations and may elicit new details or insights that staff members failed to share during the datacollection period. The early review may also avoid angry denials after the report becomes public,although it is no guarantee that controversy and demands for changes will not follow publication.However, the objectivity of the evaluation is best served if overall findings, conclusions andrecommendations are not shared with the project staff before the draft is circulated to all stakeholders.
Part III: Chapter 7: Reporting the Results of Mixed Method Evaluations
http://www.ehr.nsf.gov/EHR/REC/pubs/NSF97-153/CHAP_7.HTM (8 of 9) [03/12/2001 11:12:05 AM]

In general, the same approach is suggested for obtaining feedback from respondents. It is essential toinform them of the inclusion of data with which they can be identified, and to honor requests foranonymity. The extent to which other portions of the write-up should be shared with respondents willdepend on the nature of the project and the respondent population, but in general it is probably best tosolicit feedback following dissemination of the report to all stakeholders.
References
Miles, M.B., and Huberman, A.M. (1994). Qualitative Data Analysis, 2nd Ed. Newbury Park, CA:Sage.
National Science Foundation. (1993). User-Friendly Handbook for Project Evaluation: Science,Mathematics, Engineering, and Technical Education. NSF 93-152. Washington, DC: NSF.
Patton, M.Q. (1990). Qualitative Evaluation and Research Method, 2nd Ed. Newbury Park, CA:Sage.
Yin, R.K. (1989). Case Study Research: Design and Method. Newbury Park, CA: Sage.
Previous Chapter | Back to Top | Next Chapter
Table of Contents
Part III: Chapter 7: Reporting the Results of Mixed Method Evaluations
http://www.ehr.nsf.gov/EHR/REC/pubs/NSF97-153/CHAP_7.HTM (9 of 9) [03/12/2001 11:12:05 AM]

PART IV.Supplementary Materials
Chapter 8Annotated BibliographyIn selecting books and major articles for inclusion in this short bibliography, an effort was made toincorporate those useful for principal investigators (PIs) and project directors (PDs) who want to findinformation relevant to the tasks they will face, and which this brief handbook could not cover in depth.Thus, we have not included all books that experts in qualitative research and mixed method evaluationswould consider to be of major importance. Instead, we have included primarily reference materials thatNSF/EHR grantees should find most useful. Included are many of those already listed in the references toChapters 1 through 7.
Some of these publications are heavier on theory, others deal primarily with practice and specifictechniques used in qualitative data collection and analysis. However, with few exceptions, all thepublications selected for this bibliography contain a great deal of technical information and hands-onadvice.
Denzin, Norman K., and Lincoln, Yvonna S. (Eds.). (1994). Handbook of Qualitative Research.Thousand Oaks, CA: Sage.
This formidable volume (643 pages set in small type) consists of 36 chapters written by experts on theirrespective topics, all of whom are passionate advocates of the qualitative method in social andeducational research. The volume covers historical and philosophical perspectives, as well as detailedresearch methods. Extensive coverage is given to data collection and data analysis, and to the "art ofinterpretation" of findings obtained through qualitative research. Most of the chapters assume that thequalitative researcher functions in an academic setting and uses qualitative methods exclusively; the useof quantitative methods in conjunction with qualitative approaches and constraints that apply toevaluation research is seldom considered. However, two chapters - "Designing Funded QualitativeResearch," by Janice M. Morse, and "Qualitative Program Evaluation," by Jennifer C. Greene - contain agreat deal of material of interest to PIs and PDs. But PIs and PDs will also benefit from consulting otherchapters, in particular "Interviewing," by Andrea Fontana and James H. Frey, and "Data Managementand Analysis Methods," by A. Michael Huberman and Matthew B. Miles.
The Joint Committee on Standards for Educational Evaluation. (1994). How to Assess Evaluations ofEducational Programs, 2nd Ed. Thousand Oaks, CA: Sage.
This new edition of the widely accepted Standards for Educational Evaluation is endorsed byprofessional associations in the field of education. The volume defines 30 standards for programevaluation, with examples of their application, and incorporates standards for quantitative as well asqualitative evaluation methods. The Standards are categorized into four groups: utility, feasibility,
Part IV: Chapter 8: Supplemental Materials
http://www.ehr.nsf.gov/EHR/REC/pubs/NSF97-153/CHAP_8.HTM (1 of 5) [03/12/2001 11:12:25 AM]

propriety, and accuracy. The Standards are intended to assist legislators, funding agencies, educationaladministrators, and evaluators. They are not a substitute for texts in technical areas such as researchdesign or data collection and analysis. Instead they provide a framework and guidelines for the practiceof responsible and high-quality evaluations. For readers of this handbook, the section on AccuracyStandards, which includes discussions of quantitative and qualitative analysis, justified conclusions, andimpartial reporting, is especially useful.
Patton, Michael Quinn. (1990). Qualitative Evaluation and Research Methods, 2nd Ed. Newbury Park,CA: Sage.
This is a well-written book with many practical suggestions, examples, and illustrations. The first partcovers, in jargon-free language, the conceptual and theoretical issues in the use of qualitative methods;for practitioners the second and third parts, dealing with design, data collection, analysis, andinterpretation, are especially useful. Patton consistently emphasizes a pragmatic approach: he stresses theneed for flexibility, common sense, and the choice of methods best suited to produce the neededinformation. The last two chapters, "Analysis, Interpretation and Reporting" and "Enhancing the Qualityand Credibility of Qualitative Analysis," are especially useful for PIs and PDs of federally fundedresearch. They stress the need for utilization-focused evaluation and the evaluator's responsibility forproviding data and interpretations, which specific audiences will find credible and persuasive.
Marshall, Catherine, and Rossman, Gretchen B. (1995). Designing Qualitative Research, 2nd Ed.Thousand Oaks, CA: Sage.
This small book (178 pages) does not deal specifically with the performance of evaluations; it isprimarily written for graduate students to provide a practical guide for the writing of research proposalsbased on qualitative methods. However, most of the material presented is relevant and appropriate forproject evaluation. In succinct and clear language, the book discusses the main ingredients of a soundresearch project: framing evaluation questions; designing the research; data collection methods; andstrategies, data management, and analysis. The chapter on data collection methods is comprehensive andincludes some of the less widely used techniques (such as films and videos, unobtrusive measures, andprojective techniques) that may be of interest for the evaluation of some projects. There are also usefultables (e.g., identifying the strengths and weaknesses of various methods for specific purposes; managingtime and resources), as well as a series of vignettes throughout the text illustrating specific strategiesused by qualitative researchers.
Lofland, John, and Lofland, Lyn H. (1995). Analyzing Social Settings: A Guide to QualitativeObservation and Analysis, 3rd Ed. Belmont, CA: Wadsworth.
As the title indicates, this book is designed as a guide to field studies, using as their main data collectiontechniques participant observation and intensive interviews. The authors' vast experience and knowledgein these areas results in a thoughtful presentation of both technical topics (such as the best approach tocompiling field notes) and nontechnical issues, which may be equally important in the conduct ofqualitative research. The chapters that discuss gaining access to informants, maintaining access for theduration of the study, and dealing with issues of confidentiality and ethical concerns are especiallyhelpful for PIs and PDs who seek to collect qualitative material. Also useful is Chapter 5, "LoggingData," which deals with all aspects of the interviewing process and includes examples of questionformulation, the use of interview guides, and the write-up of data.
Part IV: Chapter 8: Supplemental Materials
http://www.ehr.nsf.gov/EHR/REC/pubs/NSF97-153/CHAP_8.HTM (2 of 5) [03/12/2001 11:12:25 AM]

Miles, Matthew B., and Huberman, A. Michael. (1994). Qualitative Data Analysis - An ExpandedSourcebook, 2nd Ed. Thousand Oaks, CA: Sage.
Although this book is not specifically oriented to evaluation research, it is an excellent tool for evaluatorsbecause, in the authors' words, "this is a book for practicing researchers in all fields whose work involvesthe struggle with actual qualitative data analysis issues." It has the further advantage that many examplesare drawn from the field of education. Because analysis cannot be separated from research design issues,the book takes the reader through the sequence of steps that lay the groundwork for sound analysis,including a detailed discussion of focusing and bounding the collection of data, as well as managementissues bearing on analysis. The subsequent discussion of analysis methods is very systematic, relyingheavily on data displays, matrices, and examples to arrive at meaningful descriptions, explanations, andthe drawing and verifying of conclusions. An appendix covers choice of software for qualitative dataanalysis. Readers will find this a very comprehensive and useful resource for the performance ofqualitative data reduction and analysis.
New Directions for Program Evaluation, Vols. 35, 60, 61. A quarterly publication of the AmericanEvaluation Association, published by Jossey-Bass, Inc., San Francisco, CA.
Almost every issue of this journal contains material of interest to those who want to learn aboutevaluation, but the three issues described here are especially relevant to the use of qualitative methods inevaluation research. Vol. 35 (Fall 1987), Multiple Methods in Program Evaluation, edited by Melvin M.Mark and R. Lance Shotland, contains several articles discussing the combined use of quantitative andqualitative methods in evaluation designs. Vol. 60 (Winter 1993), Program Evaluation: A PluralisticEnterprise, edited by Lee Sechrest, includes the article "Critical Multiplism: A Research Strategy and itsAttendant Tactics," by William R. Shadish, in which the author provides a clear discussion of theadvantages of combining several methods in reaching valid findings. In Vol. 61 (Spring 1994), TheQualitative-Quantitative Debate, edited by Charles S. Reichardt and Sharon F. Rallis, several of thecontributors take a historical perspective in discussing the long-standing antagonism between qualitativeand quantitative researchers in evaluation. Others look for ways of integrating the two perspectives. Thecontributions by several experienced nonacademic program and project evaluators (Rossi, Datta, Yin) areespecially interesting.
Greene, Jennifer C., Caracelli, Valerie J., and Graham, Wendy F. (1989). "Toward a ConceptualFramework for Mixed-Method Evaluation Designs" in Educational Evaluation and Policy Analysis, Vol.II, No. 3.
In this article, a framework for the design and implementation of evaluations using a mixed methodmethodology is presented, based both on the theoretical literature and a review of 57 mixed methodevaluations. The authors have identified five purposes for using mixed methods, and the recommendeddesign characteristics for each of these purposes are presented.
Yin, Robert K. (1989). Case Study Research: Design and Method. Newbury Park, CA: Sage.
The author's background in experimental psychology may explain the emphasis in this book on the use ofrigorous methods in the conduct and analysis of case studies, thus minimizing what many believe is aspurious distinction between quantitative and qualitative studies. While arguing eloquently that casestudies are an important tool when an investigator (or evaluator) has little control over events and whenthe focus is on a contemporary phenomenon within some real-life context, the author insists that case
Part IV: Chapter 8: Supplemental Materials
http://www.ehr.nsf.gov/EHR/REC/pubs/NSF97-153/CHAP_8.HTM (3 of 5) [03/12/2001 11:12:25 AM]

studies be designed and analyzed so as to provide generalizable findings. Although the focus is on designand analysis, data collection and report writing are also covered.
Krueger, Richard A. (1988). Focus Groups: A Practical Guide for Applied Research. Newbury Park,CA: Sage.
Krueger is well known as an expert on focus groups; the bulk of his experience and the examples cited inhis book are derived from market research. This is a useful book for the inexperienced evaluator whoneeds step-by-step advice on selecting focus group participants, the process of conducting focus groups,and analyzing and reporting results. The author writes clearly and avoids social science jargon, whilediscussing the complex problems that focus group leaders need to be aware of. This book is best used inconjunction with some of the other references cited here, such as the Handbook of Qualitative Research(Ch. 22) and Focus Groups: Theory and Practice.
Stewart, David W., and Shamdasani, Prem N. (1990). Focus Groups: Theory and Practice. NewburyPark, CA: Sage.
This book differs from many others published in recent years that address primarily techniques ofrecruiting participants and the actual conduct of focus group sessions. Instead, these authors payconsiderable attention to the fact that focus groups are by definition an exercise in group dynamics. Thismust be taken into account when interpreting the results and attempting to draw conclusions that mightbe applicable to a larger population. However, the book also covers very adequately practical issues suchas recruitment of participants, the role of the moderator, and appropriate techniques for data analysis.
Weiss, Robert S. (1994). Learning from Strangers - The Art and Method of Qualitative Interview Studies.New York: The Free Press.
After explaining the different functions of quantitative and qualitative interviews in the conduct of socialscience research studies, the author discusses in considerable detail the various steps of the qualitativeinterview process. Based largely on his own extensive experience in planning and carrying out studiesbased on qualitative interviews, he discusses respondent selection and recruitment, preparing for theinterview (which includes such topics as pros and cons of taping, the use of interview guides, interviewlength, etc.), the interviewing relationship, issues in interviewing (including confidentiality and validityof the information provided by respondents), data analysis, and report writing. There are lengthy excerptsfrom actual interviews that illustrate the topics under discussion. This is a clearly written, very usefulguide, especially for newcomers to this data collection method.
Wolcott, Harry F. (1994). Transforming Qualitative Data: Description, Analysis and Interpretation.Thousand Oaks, CA: Sage.
This book is written by an anthropologist who has done fieldwork for studies focused on education issuesin a variety of cultural settings; his emphasis throughout is "on what one does with data rather than oncollecting it." His frank and meticulous description of the ways in which he assembled his data,interacted with informants, and reached new insights based on the gradual accumulation of fieldexperiences makes interesting reading. It also points to the pitfalls in the interpretation of qualitativedata, which he sees as the most difficult task for the qualitative researcher.
U.S. General Accounting Office. (1990). Case Study Evaluations. Transfer Paper 10.1.9. issued by theProgram Evaluation and Methodology Division. Washington, DC: GAO.
Part IV: Chapter 8: Supplemental Materials
http://www.ehr.nsf.gov/EHR/REC/pubs/NSF97-153/CHAP_8.HTM (4 of 5) [03/12/2001 11:12:25 AM]

This paper presents an evaluation perspective on case studies, defines them, and determines theirappropriateness in terms of the type of evaluation question posed. Unlike the traditional, academicdefinition of the case study, which calls for long-term participation by the evaluator or researcher in thesite to be studied, the GAO sees a wide range of shorter term applications for case study methods inevaluation. These include their use in conjunction with other methods for illustrative and exploratorypurposes, as well as for the assessment of program implementation and program effects. Appendix 1includes a very useful discussion dealing with the adaptation of the case study method for evaluation andthe modifications and compromises that evaluators - unlike researchers who adopt traditional field workmethods - are required to make.
Previous Chapter | Back to Top | Next Chapter
Table of Contents
Part IV: Chapter 8: Supplemental Materials
http://www.ehr.nsf.gov/EHR/REC/pubs/NSF97-153/CHAP_8.HTM (5 of 5) [03/12/2001 11:12:25 AM]

Chapter 9Glossary
Accuracy: The extent to which an evaluation is truthful or valid in what it says about a
program, project, or material.
Achievement: Performance as determined by some type of assessment or testing.
Affective: Consists of emotions, feelings, and attitudes.
Anonymity:(provision for)
Evaluator action to ensure that the identity of subjects cannot be ascertainedduring the course of a study, in study reports, or in any other way.
Assessment: Often used as a synonym for evaluation. The term is sometimes recommendedfor restriction to processes that are focused on quantitative and/or testingapproaches
Attitude: A person’s mental set toward another person, thing, or state.
Attrition: Loss of subjects from the defined sample during the course of a longitudinalstudy.
Audience(s): Consumers of the evaluation; those who will or should read or hear of theevaluation, either during or at the end of the evaluation process. Includes thosepersons who will be guided by the evaluation in making decisions and allothers who have a stake in the evaluation (see stakeholders).
Authenticassessment:
Alternative to traditional testing, using indicators of student task performance.
Background: The contextual information that describes the reasons for the project,including its goals, objectives, and stakeholders’ information needs.
Baseline: Facts about the condition or performance of subjects prior to treatment orintervention.
Behavioralobjectives:
Specifically stated terms of attainment to be checked by observation, ortest/measurement.
Bias: A consistent alignment with one point of view.
Part IV: Chapter 9: Glossary
http://www.ehr.nsf.gov/EHR/REC/pubs/NSF97-153/CHAP_9.HTM (1 of 7) [03/12/2001 11:13:11 AM]

Case study: An intensive, detailed description and analysis of a single project, program, orinstructional material in the context of its environment.
Checklistapproach:
Checklists are the principal instrument for practical evaluation, especially forinvestigating the thoroughness of implementation.
Client: The person or group or agency that commissioned the evaluation.
Coding: To translate a given set of data or items into descriptive or analytic categoriesto be used for data labeling and retrieval.
Cohort: A term used to designate one group among many in a study. For example, "thefirst cohort" may be the first group to have participated in a training program.
Component: A physically or temporally discrete part of a whole. It is any segment that canbe combined with others to make a whole.
Conceptualscheme:
A set of concepts that generate hypotheses and simplify description.
Conclusions(of an evaluation):
Final judgments and recommendations.
Content analysis: A process using a parsimonious classification system to determine thecharacteristics of a body of material or practices.
Context (of anevaluation):
The combination of factors accompanying the study that may have influencedits results, including geographic location, timing, political and social climate,economic conditions, and other relevant professional activities in progress atthe same time.
Criterion, criteria: A criterion (variable) is whatever is used to measure a successful orunsuccessful outcome, e.g., grade point average.
Criterion-referenced test:
Tests whose scores are interpreted by referral to well-defined domains ofcontent or behaviors, rather than by referral to the performance of somecomparable group of people.
Cross-caseanalysis:
Grouping data from different persons to common questions or analyzingdifferent perspectives on issues under study.
Part IV: Chapter 9: Glossary
http://www.ehr.nsf.gov/EHR/REC/pubs/NSF97-153/CHAP_9.HTM (2 of 7) [03/12/2001 11:13:11 AM]

Cross-sectionalstudy:
A cross-section is a random sample of a population, and a cross-sectionalstudy examines this sample at one point in time. Successive cross-sectionalstudies can be used as a substitute for a longitudinal study. For example,examining today’s first year students and today’s graduating seniors mayenable the evaluator to infer that the college experience has produced or canbe expected to accompany the difference between them. The cross-sectionalstudy substitutes today’s seniors for a population that cannot be studied until 4years later.
Data display: A compact form of organizing the available information (for example, graphs,charts, matrices).
Data reduction: Process of selecting, focusing, simplifying, abstracting, and transforming datacollected in written field notes or transcriptions.
Delivery system: The link between the product or service and the immediate consumer (therecipient population).
Descriptive data: Information and findings expressed in words, unlike statistical data, which areexpressed in numbers.
Design: The process of stipulating the investigatory procedures to be followed in doinga specific evaluation.
Dissemination: The process of communicating information to specific audiences for thepurpose of extending knowledge and, in some cases, with a view to modifyingpolicies and practices.
Document: Any written or recorded material not specifically prepared for the evaluation.
Effectiveness: Refers to the conclusion of a goal achievement evaluation. "Success" is itsrough equivalent.
Eliteinterviewers:
Well-qualified and especially trained persons who can successfully interactwith high-level interviewees and are knowledgeable about the issues includedin the evaluation.
Ethnography: Descriptive anthropology. Ethnographic program evaluation methods oftenfocus on a program’s culture.
Executivesummary:
A nontechnical summary statement designed to provide a quick overview ofthe full-length report on which it is based.
Externalevaluation:
Evaluation conducted by an evaluator from outside the organization withinwhich the object of the study is housed.
Field notes: Observer’s detailed description of what has been observed.
Part IV: Chapter 9: Glossary
http://www.ehr.nsf.gov/EHR/REC/pubs/NSF97-153/CHAP_9.HTM (3 of 7) [03/12/2001 11:13:11 AM]

Focus group: A group selected for its relevance to an evaluation that is engaged by a trainedfacilitator in a series of discussions designed for sharing insights, ideas, andobservations on a topic of concern to the evaluation.
Formativeevaluation:
Evaluation designed and used to improve an intervention, especially when it isstill being developed.
Hypothesistesting:
The standard model of the classical approach to scientific research in which ahypothesis is formulated before the experiment to test its truth.
Impact evaluation: An evaluation focused on outcomes or payoff.
Implementationevaluation:
Assessing program delivery (a subset of formative evaluation).
Indepth interview: A guided conversation between a skilled interviewer and an interviewee thatseeks to maximize opportunities for the expression of a respondent’s feelingsand ideas through the use of open-ended questions and a loosely structuredinterview guide.
Informed consent: Agreement by the participants in an evaluation to the use, in specified waysfor stated purposes, of their names and/or confidential information theysupplied.
Instrument: An assessment device (test, questionnaire, protocol, etc.) adopted, adapted, orconstructed for the purpose of the evaluation.
Internal evaluator: A staff member or unit from the organization within which the object of theevaluation is housed.
Intervention: Project feature or innovation subject to evaluation.
Intra-caseanalysis:
Writing a case study for each person or unit studied.
Key informant: Person with background, knowledge, or special skills relevant to topicsexamined by the evaluation.
Longitudinalstudy:
An investigation or study in which a particular individual or group ofindividuals is followed over a substantial period of time to discover changesthat may be attributable to the influence of the treatment, or to maturation, orthe environment. (See also cross-sectional study.)
Matrix: An arrangement of rows and columns used to display multi-dimensionalinformation.
Part IV: Chapter 9: Glossary
http://www.ehr.nsf.gov/EHR/REC/pubs/NSF97-153/CHAP_9.HTM (4 of 7) [03/12/2001 11:13:11 AM]

Measurement: Determination of the magnitude of a quantity.
Mixed methodevaluation:
An evaluation for which the design includes the use of both quantitative andqualitative methods for data collection and data analysis.
Moderator: Focus group leader; often called a facilitator.
Nonparticipantobserver:
A person whose role is clearly defined to project participants and projectpersonnel as an outside observer or onlooker.
Norm-referencedtests:
Tests that measure the relative performance of the individual or group bycomparison with the performance of other individuals or groups taking thesame test.
Objective: A specific description of an intended outcome.
Observation: The process of direct sensory inspection involving trained observers.
Ordered data: Non-numeric data in ordered categories (for example, students’ performancecategorized as excellent, good, adequate, and poor).
Outcome: Post-treatment or post-intervention effects.
Paradigm: A general conception, model, or "worldview" that may be influential inshaping the development of a discipline or subdiscipline. (For example, "Theclassical, positivist social science paradigm in evaluation.")
Participantobserver:
A person who becomes a member of the project (as participant or staff) inorder to gain a fuller understanding of the setting and issues.
Performanceevaluation:
A method of assessing what skills students or other project participants haveacquired by examining how they accomplish complex tasks or the productsthey have created (e.g., poetry, artwork).
Planningevaluation:
Evaluation planning is necessary before a program begins, both to get baselinedata and to evaluate the program plan, at least for evaluability. Planningavoids designing a program that cannot be evaluated.
Population: All persons in a particular group.
Prompt: Reminders used by interviewers to obtain complete answers.
Purposivesampling:
Creating samples by selecting information-rich cases from which one canlearn a great deal about issues of central importance to the purpose of theevaluation.
Part IV: Chapter 9: Glossary
http://www.ehr.nsf.gov/EHR/REC/pubs/NSF97-153/CHAP_9.HTM (5 of 7) [03/12/2001 11:13:11 AM]

Qualitativeevaluation:
The approach to evaluation that is primarily descriptive and interpretative.
Quantitativeevaluation:
The approach to evaluation involving the use of numerical measurement anddata analysis based on statistical methods.
Random sampling: Drawing a number of items of any sort from a larger group or population sothat every individual item has a specified probability of being chosen.
Recommendations: Suggestions for specific actions derived from analytic approaches to theprogram components.
Sample: A part of a population.
Secondary dataanalysis:
A reanalysis of data using the same or other appropriate procedures to verifythe accuracy of the results of the initial analysis or for answering differentquestions.
Self-administeredinstrument:
A questionnaire or report completed by a study participant without theassistance of an interviewer.
Stakeholder: A stakeholder is one who has credibility, power, or other capital invested in aproject and thus can be held to be to some degree at risk with it.
Standardizedtests:
Tests that have standardized instructions for administration, use, scoring, andinterpretation with standard printed forms and content. They are usuallynorm-referenced tests but can also be criterion referenced.
Strategy: A systematic plan of action to reach predefined goals.
Structuredinterview:
An interview in which the interviewer asks questions from a detailed guidethat contains the questions to be asked and the specific areas for probing.
Summary: A short restatement of the main points of a report.
Summativeevaluation:
Evaluation designed to present conclusions about the merit or worth of anintervention and recommendations about whether it should be retained,altered, or eliminated.
Transportable: An intervention that can be replicated in a different site.
Triangulation: In an evaluation, triangulation is an attempt to get a fix on a phenomenon ormeasurement by approaching it via several (three or more) independent routes.This effort provides redundant measurement.
Utility: The extent to which an evaluation produces and disseminates reports thatinform relevant audiences and have beneficial impact on their work.
Part IV: Chapter 9: Glossary
http://www.ehr.nsf.gov/EHR/REC/pubs/NSF97-153/CHAP_9.HTM (6 of 7) [03/12/2001 11:13:11 AM]

Utilization of(evaluations):
Use and impact are terms used as substitutes for utilization. Sometimes seenas the equivalent of implementation, but this applies only to evaluations thatcontain recommendations.
Validity: The soundness of the inferences made from the results of a data-gatheringprocess.
Verification: Revisiting the data as many times as necessary to cross-check or confirm theconclusions that were drawn.
Sources: Jaeger, R.M. (1990). Statistics: A Spectator Sport. Newbury Park, CA: Sage.
Joint Committee on Standards for Educational Evaluations (1981). Standardsfor Evaluation of Educational Programs, Projects and Materials. New York:McGraw Hill.
Scriven, M. (1991). Evaluation Thesaurus. 4th Ed. Newbury Park, CA: Sage.
Authors of Chapters 1-7.
Previous Chapter | Back to Top | Back to Table of Contents
Table of Contents
Part IV: Chapter 9: Glossary
http://www.ehr.nsf.gov/EHR/REC/pubs/NSF97-153/CHAP_9.HTM (7 of 7) [03/12/2001 11:13:11 AM]