a mixed method approach for assessing the …
TRANSCRIPT

A MIXED METHOD APPROACH FOR ASSESSING THE ADJUSTMENT OF INCOMING
FIRST-YEAR ENGINEERING STUDENTS IN A SUMMER BRIDGE PROGRAM
Tremayne O. Waller
Dissertation submitted to the Graduate Faculty of the Virginia Polytechnic Institute and State
University in partial fulfillment for the degree of
DOCTOR OF PHILOSOPHY
In
Curriculum and Instruction
Susan Magliaro, Co-Chairperson
Bevlee Watford, Co-Chairperson
Edith Carter, Committee Member
Mark Sanders, Committee Member
July 20, 2009
Blacksburg, Virginia
Keywords: Summer Bridge Program, Engineering, Retention, Adjustment
Copyright 2009, Tremayne O. Waller

A Mixed Method Approach for Assessing the Adjustment of Incoming First-Year Engineering
Students in a Summer Bridge Program
Tremayne O. Waller
Abstract
For nearly half a century, institutions of higher education have implemented bridge programs in
order to increase the retention and graduation rates of at-risk students (Pascarella & Terenzini,
2005). In fact, summer bridge programs (SBPs), which typically occur prior to a student’s
freshman fall term, are among the oldest strategies used to improve college retention rates
(Garcia, 1991). Surprisingly, even though SBPs are widely acknowledged by both students and
program administrators to be beneficial, there is very little empirical evidence assessing their
effectiveness (Garcia, 1991; Kluepfel,1994; Pascarella & Terenzini; Rita and Bacote,1997;
Ackerman 1990; Gandara & Maxwell-Jolly, 1999). This study, therefore, used a mixed methods
approach to investigate the various adjustment issues of participants versus non-participants in a
summer bridge program for engineering students at a predominantly White institution (PWI) in
the mid-southeastern region of the United States. Specifically, the Academic, Social, Personal-
Emotional, and Goal Commitment/Institutional Attachment subscales of the Student Adaptation
to College Questionnaire (SACQ) were utilized (Baker & Siryk, 1999) for this purpose. One
important finding that the SACQ revealed was that the personal-emotional scale was significant
for gender since scores for men were higher than for females. The Summer Bridge Inventory
(SBI) that was employed in this research also revealed that summer bridge participants and the
director of support programs shared similar opinions about the strengths and weaknesses of the
program and its related activities. In conclusion, college administrators and directors of summer

iii
support programs should carefully assess programmatic outcomes to ensure that their
institutions’ SBPs provided the needed supports that will enhance the retention and graduation
rates of at-risk students in engineering.

iv
ACKNOWLEDGMENTS
“I tell you the truth, if you have faith as small as a mustard seed, you can say to this mountain,
Move from here to there and it will move. Nothing will be impossible for you.”
The statement above illustrates my faith in God. My faith taught me to hold on and to
remain steadfast in the Holy Word. My faith allowed me to remain determined in the face of
adversity. My relationship with God has reminded me to put all trust in Him and He can do
anything.
How can one express thanks to so many people who gave time out of their busy
schedules to assist me through this process? I am indebted to God, my professor, my employer,
my colleagues, and the many college students who were willing to assist me with this
dissertation.
I am very thankful to Dr. Susan Magliaro (Chair) and Dr. Bevlee Watford (Co-Chair)
along with my other committee members, Dr. Edith Carter and Dr. Mark Sanders. I do
appreciate their assistance, support and patience with this dissertation process. This committee
really believed in my ability and pushed me to a new level—I do thank you!
I would also like to thank the following people:
To my family, the Wallers, Martins, Floods, Hairstons, Laws and Galloways, for
unconditional love, support, words of encouragement and inspiration to persist amid the many
challenges associated with obtaining a doctoral degree. Myrtle, Juniata, Larry, Rea, Carlos,
Carissa, Micah, Cassandra, Jermayne, Ca’Daydra, Ca’Jazzyln, and De’Andre -- know that I will
never forget you and I appreciate all you did to inspire me to move forward.

v
To my fraternity brothers Johnathan Gaines, Nick Spruill, Leemar Thorpe, Alvin Bryant
and the members of Alpha Kappa Lamda in Alpha Phi Alpha Fraternity, Inc., for reminding me
to keep pressing onward and upward with the dissertation.
To my entering cohort, Belinda Bennett, Terrell Strayhorn, Catherine Armlink, Evelyn
Leathers and Sharrika Davis, for your assistance and support in the courses we took together.
To my cohort friend, Jody Thompson, the late nights of aiding each other in studying and
constant reminders to keep moving forward with the degree no matter how long it took. You
have been a light of hope and inspiration. I thank you for being my biggest cheerleader.
To a great mentor and friend, Andrea Caldwell, for the cards of encouragement, phone
calls to do a check-in on me and words of wisdom to “press towards the mark of a high calling.”
To my good friend and mentor, Dr. Carl Carpenter, for telling me I can obtain the degree
and constantly reminding me to stay focused and get the dissertation done…no matter what.
Dr. Sharnnia Artis, I am so grateful for your encouragement and motivational
conversations. You reminded me so many times not to be hard on myself, but to seek guidance
from God and He will direct my path. I thank you!
Drs. Wayne and Glenda Scales, I would like to thank you for the lunches, dinners, and
emails of encouragement. The phone calls and discussions really did make difference in my life.
It helped me to believe in myself and stay grounded in God.
Drs. Reliford and Karen Sanders, I would like to thank you for being great role models.
You are great mentors and I aspire to be a model of distinction and professionalism.
Justin Alston, I thank you for your support, advice, and suggestions during and this
dissertation procedure. You were there from the beginning and followed my worked until I
completed it.

vi
Dr. Terry Kershaw, I could not have reached this accomplishment without your support
and willingness to listen. You taught me how to be a scholar-activist.
To past and present CEED and College of Engineering Academic Affairs staff and
administrators, I do appreciate the supportive atmosphere and constant encouragement you
provided me to continue with the degree.
Bishop Lorenzo Hall and Reach Out Apostolic Church family—I thank you and the
church members for being great role models for me. You continue to reach out and help African
American people and others truly inspire me to do the same in my life.
Rev. Dr. P. L. Barrett and First Baptist Church members—I thank you for teaching me so
much about unconditional love and sacrifices. You and the congregation of the church welcomed
me as member into the church, rather than as a visitor. You and the members were never too busy to
talk and share ideas concerning school issues, faith, love and the word of God. Many of these
conversations took place in Ryan’s and I had a great time fellowshipping. I have grown as a human
being from this affiliation.
Dr. Kimberly LaBoone, I thank you for telling me to keep pressing on with the degree
and eventually it will all come together. Also, I would like to thank you for introducing the
book, The PACT, to me. That book was a foundation of inspiration for me and others.
To my first VT PACT (Brandon Brisbon, Jean-Louis Bile, Adrian Allen, Charles Stanton,
Bryon Bazemore, and Brandon Williams) members, I thank each of them for their support and
encouragement to motivate me with my goals to finish my dissertation. They inspired me while
pursuing their engineering degrees.
To Laurie Good, I thank you for all your feedback and encouragement throughout this
dissertation process. Your words of faith and hope helped me in so many ways.

vii
I gained so many friends over the years, I can not name them all, but I thank you for all
the support and encouragement.

viii
Table of Contents
ACKNOWLEDGMENTS ........................................................................................................... iv
LIST OF TABLES ...................................................................................................................... xii
LIST OF FIGURES ................................................................................................................... xvi
LIST OF APPENDICES .......................................................................................................... xvii
CHAPTER ONE: INTRODUCTION ........................................................................................ 1
College Retention and Summer Bridge Programs ...................................................................... 2
Case Study: Virginia Tech’s Engineering SBP .......................................................................... 5
Purpose of the Study and Research Questions ............................................................................ 8
Significance of the Study and Implications for Future Research ............................................... 9
Definition of Terms................................................................................................................... 12
Organization of the Study ......................................................................................................... 14
CHAPTER TWO: REVIEW OF THE LITERATURE .......................................................... 15
Introduction ............................................................................................................................... 15
Conceptual Framework for the Problem ................................................................................... 15
Adjustment to College .............................................................................................................. 18
Foundation for Involvement ..................................................................................................... 20
Astin’s Student Involvement Theory ........................................................................................ 23
Faculty Role in Retention ......................................................................................................... 26
Instrumentation to Measure Retention and Adjustment ........................................................... 27
Methods for Understanding Attrition ........................................................................................ 28
Foundation for Adjustment Theory .......................................................................................... 28
Constructs for the SACQ Instrument ........................................................................................ 31
Summer Bridge Programs ......................................................................................................... 33
History................................................................................................................................... 35
Objectives of a Summer Bridge Program ............................................................................. 36
Research on Summer Bridge Programs ................................................................................ 37
Underrepresented Students in Higher Education: Pre-College Factors .................................... 42

ix
Underrepresented Students in Higher Education: College Factors .......................................... 44
Summary ................................................................................................................................... 47
CHAPTER THREE: METHODOLOGY ............................................................................... 48
Introduction ............................................................................................................................... 48
Research Design ........................................................................................................................ 49
Participants and Sample Selection for SACQ ........................................................................... 54
Instrumentation Development ................................................................................................... 56
SACQ..................................................................................................................................... 56
SBI ......................................................................................................................................... 60
Reliability and Validity ............................................................................................................. 63
SACQ Reliability ................................................................................................................... 63
SACQ Validity ....................................................................................................................... 67
SBI Validity ........................................................................................................................... 70
SBI Reliability ....................................................................................................................... 71
Data Collection Procedures ....................................................................................................... 71
SACQ..................................................................................................................................... 71
SBI ......................................................................................................................................... 74
Data Analysis ............................................................................................................................ 74
SACQ..................................................................................................................................... 74
SBI ......................................................................................................................................... 76
Researcher’s Stance .................................................................................................................. 77
CHAPTER FOUR: RESULTS OF STUDY ............................................................................. 79
Introduction ............................................................................................................................... 79
Research Design ........................................................................................................................ 79
Quantitative Findings: Phase 1 ................................................................................................. 80
Introduction........................................................................................................................... 80
Research Question 1 ............................................................................................................. 81
Research Question 2 ............................................................................................................. 84
Research Question 3 ............................................................................................................. 84
Research Question 4 ............................................................................................................. 86

x
Quantitative Findings Phase 2 .................................................................................................. 87
Research Question 5 ............................................................................................................. 87
Demographic Characteristics of the SBI Participants ......................................................... 89
SBI Analysis Overview ............................................................................................................. 90
ANOVA for SBI ....................................................................................................................... 93
Qualitative Findings Phase 2 .................................................................................................... 99
Introduction........................................................................................................................... 99
Demographic Characteristics of the Sample ...................................................................... 100
Benefits of Participating in SBP ............................................................................................. 106
Academic Adjustment .......................................................................................................... 106
Social Adjustment ................................................................................................................ 106
Personal Emotional Adjustment ......................................................................................... 107
Goal Commitment and Institutional Adjustment ................................................................. 108
Difficulties with Participating in SBP..................................................................................... 108
Summary ................................................................................................................................. 109
CHAPTER FIVE: DISCUSSION AND CONCLUSIONS ................................................... 111
Introduction ............................................................................................................................. 111
Discussion of Findings ............................................................................................................ 111
Academic Adjustment (AA) ................................................................................................... 119
Social Adjustment (SA) .......................................................................................................... 120
Personal-Emotional Adjustment (PEA) .................................................................................. 120
Goal Commitment/Institutional Adjustment (GCIA) ............................................................. 121
Difficulties with Participating Summer Bridge Program........................................................ 121
Benefits of Participating Summer Bridge Program ................................................................ 122
Association of Findings to Previous Research ........................................................................ 122
Conclusions ............................................................................................................................. 123
Limitations .............................................................................................................................. 124
Areas for Future Research ...................................................................................................... 125
Implications for Future Practice, Research, and Policy .......................................................... 126
Personal Reflections................................................................................................................ 129

xi
REFERENCES .......................................................................................................................... 131
APPENDICES ........................................................................................................................... 143

xii
LIST OF TABLES
Table 3.1. Summary of the Phase of this Research Aligned with Research Questions ................ 50
Table 3.2. An Overview of the Items for the SACQ Full Scale and Subscales ........................... 59
Table 3.3. One-Factor Maximum Likelihood Solutions and Principal Components from
Intercorrelations of SACQ Subscale Scores for Selected Colleges .............................................. 64
Table 3.4. Alpha Coefficients for the SACQ for Freshmen at Various Colleges ........................ 66
Table 3.5. Internal Consistency Coefficients for Critical Item .................................................... 67
Table 4.1. Two-Sample T & Mann-Whitney Significance Tests on SACQ Raw Scores for
Subscales ....................................................................................................................................... 82
Table 4.6 Two-Sample T & Mann-Whitney Significance Tests on SACQ Raw Scores for
Subscales and Clusters .................................................................................................................. 85
Table 4.7. Two-Sample T-Test on Fall Term GPA, College Engineering and Institutional
Enrollment..................................................................................................................................... 87
Table 4.8. Cronbach’s Alpha for Summer Bridge Inventory Subscales ....................................... 89
Table 4.37. Means, Standard Deviations, and Confidence Intervals on the Dependent Variables
for the 4 Scales for the Summer Bridge Inventory Activities ....................................................... 94
Table 4.38. Difference in Upper and Lower Confidence Limits on the Dependent Variables for
the 4 Scales for the Summer Bridge Inventory Activities ............................................................ 95
Table 4.39. Overall Levels and Mean Score for SBI Scales ......................................................... 96
Table 4.40. Means, Standard Deviations, and Confidence Intervals on the Dependent Variables
for the 12 Subscales for the Summer Bridge Inventory Activities ............................................... 96
Table 4.41. Difference in Upper and Lower Confidence Limits on the Dependent Variables ..... 98
Table 4.42. Levels and Mean Score for SBI Subscales ................................................................ 99
Table 4.43. Focus Group Participants and Characteristics ......................................................... 100
Table 4.44. Definition of Codes and Terms ................................................................................ 104
Table 5.1a SBI Activities that were Significantly Positive Based on Race ................................ 117
xiii
Table 5.1b. SBI Activities that were Significantly Positive Based on Gender ........................... 118
Table 4.0. Demographic Characteristics of the Sample (N=134) ............................................... 151
Table 4.2. SACQ Academic Adjustment Subscale .................................................................... 172
Table 4.3. SACQ Social Adjustment Subscale .......................................................................... 175
Table 4.4. SACQ Personal-Emotional Adjustment Subscale .................................................... 178
Table 4.5. SACQ Goal Commitment/Institutional Adjustment Subscale .................................. 180
Table 4.9. Likelihood Ratio and Pearson Significance Tests on Summer Bridge Inventory
Academic Adjustment: Application Raw Scores ........................................................................ 181
Table 4.10. Likelihood Ratio and Pearson Significance Tests on Summer Bridge Inventory
Academic Adjustment: Motivation Raw Scores ......................................................................... 182
Table 4.11. Likelihood Ratio and Pearson Significance Tests on Summer Bridge Inventory
Academic Adjustment: Environment Raw Scores ..................................................................... 183
Table 4.12. Likelihood Ratio and Pearson Significance Tests on Summer Bridge Inventory
Academic Adjustment: Performance Raw Scores ..................................................................... 184
Table 4.13. Likelihood Ratio and Pearson Significance Tests on Summer Bridge Inventory
Social Adjustment: Environment Raw Scores ........................................................................... 185
Table 4.14. Likelihood Ratio and Pearson Significance Tests on Summer Bridge Inventory
Social Adjustment: General Raw Scores ................................................................................... 186
Table 4.15. Likelihood Ratio and Pearson Significance Tests on Summer Bridge Inventory
Social Adjustment: Nostalgia Raw Scores ................................................................................ 187
Table 4.16. Likelihood Ratio and Pearson Significance Tests on Summer Bridge Inventory
Social Adjustment: Other People Raw Scores ........................................................................... 188
Table 4.17. Likelihood Ratio and Pearson Significance Tests on Summer Bridge Inventory
Personal-Emotional Adjustment: Physical Raw Scores ............................................................. 189
Table 4.18. Likelihood Ratio and Pearson Significance Tests on Summer Bridge Inventory
Personal-Emotional Adjustment: Psychological Raw Scores.................................................... 190

xiv
Table 4.19. Likelihood Ratio and Pearson Significance Tests on Summer Bridge Inventory Goal
Commitment/Institutional Commitment Adjustment: General Raw Scores ............................. 191
Table 4.20. Likelihood Ratio and Pearson Significance Tests on Summer Bridge Inventory Goal
Commitment/Institutional Commitment Adjustment: This College Raw Scores ....................... 192
Table 4.21. Likelihood Ratio and Pearson Significance Tests on Summer Bridge Inventory Rank
Raw Scores.................................................................................................................................. 193
Table 4.22. Likelihood Ratio and Pearson Significance Tests on Summer Bridge Inventory
Subscale Raw Scores .................................................................................................................. 194
Table 4.23. Mean and Standard Deviations for Rankings for the 29 Activities of the SBI ....... 195
Table 4.24. Mean Ranks for Activities Based on SBI Scales .................................................... 196
Table 4.25. Activity Means and Standard Deviation from the Summer Bridge Inventory for
Academic Adjustment: Motivation Subscale .............................................................................. 197
Table 4.26. Activity Means and Standard Deviation from the Summer Bridge Inventory for
Academic Adjustment: Application Subscale ............................................................................ 198
Table 4.27. Activity Means and Standard Deviation from the Summer Bridge Inventory for
Academic Adjustment: Performance Subscale ........................................................................... 199
Table 4.28. Activity Means and Standard Deviation from the Summer Bridge Inventory for
Academic Adjustment: Academic Environment Subscale ......................................................... 200
Table 4.29. Activity Means and Standard Deviation from the Summer Bridge Inventory for
Social Adjustment: General Subscale ......................................................................................... 201
Table 4.30. Activity Means and Standard Deviation from the Summer Bridge Inventory for
Social Adjustment: Other People Subscale................................................................................. 202
Table 4.31. Activity Means and Standard Deviation from the Summer Bridge Inventory for
Social Adjustment: Nostalgia Subscale ...................................................................................... 203
Table 4.32. Activity Means and Standard Deviation from the Summer Bridge Inventory for
Social Adjustment: Social Environment Subscale ...................................................................... 204

xv
Table 4.33. Activity Means and Standard Deviation from the Summer Bridge Inventory for
Personal-Emotional Adjustment: Psychological Subscale ......................................................... 205
Table 4.34. Activity Means and Standard Deviation from the Summer Bridge Inventory for
Personal-Emotional Adjustment: Physical Subscale .................................................................. 206
Table 4.35. Activity Means and Standard Deviation from the Summer Bridge Inventory for Goal
Commitment/Institutional Adjustment: General Subscale ......................................................... 207
Table 4.36. Activity Means and Standard Deviation from the Summer Bridge Inventory for Goal
Commitment/Institutional Adjustment: This College Subscale ................................................ 208
Table 4.45. Director’s and Participants’ Responses for AA Theme (Sorted by Gender and Race)
..................................................................................................................................................... 209
Table 4.46. Director’s and Participants’ Responses for SA Theme (Sorted By Gender and Race)
..................................................................................................................................................... 210
Table 4.47 Director’s and Participants’ Responses for PEA Theme (Sorted By Gender and Race)
..................................................................................................................................................... 211
Table 4.48. Director’s and Participants’ Responses for GCIA Theme (Sorted By Gender and
Race) ........................................................................................................................................... 211
Table 4.49. Director’s and Participants’ Responses for Difficulties of SBP (Sorted by Gender
and Race) .................................................................................................................................... 212
Table 4.50. Director’s and Participants’ Response Strengths of SBP (Sorted By Gender and
Race) ........................................................................................................................................... 212
Table 4.51. Participants’ Responses for Perception of SBP Theme (Sorted By Gender and Race)
..................................................................................................................................................... 213
Table 4.52. Participants’ Responses Guiding Philosophy (Sorted By Gender and Race) ......... 213
Table 4.53. Participants’ Responses for Prepare for College (Sorted By Gender and Race) .... 213
Table 4.54. Director’s and Participants’ Responses for Other Thoughts (Sorted By Gender and
Race) ........................................................................................................................................... 214
Table 4.55. Responses for the Director Final Remarks .............................................................. 214

xvi
LIST OF FIGURES
Figure 1. Factors that Positively Impact Readiness for Engineering Education .......................... 16
Figure 2. Summer Bridge Program Design.................................................................................. 34
Figure 4.1. Normal Probability Plots of AA Raw Scores .......................................................... 170
Figure 4.2. Normal Probability Plots of PEA Raw Scores ........................................................ 170
Figure 4.3. Normal Probability Plots of SA Raw Scores ........................................................... 171
Figure 4.4. Normal Probability Plots CGIA Raw Scores .......................................................... 171

xvii
LIST OF APPENDICES
Appendix A: Summer Bridge 2007 Activity Schedule .............................................................. 144
Appendix B: Group A Schedule ................................................................................................ 147
Appendix C: SACQ Survey ....................................................................................................... 148
Appendix D: Supplementary Table 4.0 ..................................................................................... 151
Appendix E: Summer Bridge Inventory .................................................................................... 155
Appendix F: IRB Amendment 1 Approval ................................................................................ 165
Appendix G: SACQ Approval from Western Psychological Services ...................................... 166
Appendix H: Letter for Participants in the Study ...................................................................... 168
Appendix I: Follow Up Email for Participants in Study............................................................ 169
Appendix J: Normal P-Plots for SACQ Scales .......................................................................... 170
Appendix K: Supplementary Tables 4.2 to 4.8 .......................................................................... 172
Appendix L: Supplementary Tables 4.9 to 4.22 ........................................................................ 181
Appendix M: Supplementary Table 4.23 ................................................................................... 195
Appendix N: Supplementary Table 4.24 ................................................................................... 196
Appendix O: Supplementary Tables 4.26 to 4.36 ...................................................................... 197
Appendix P: Supplementary Tables 4.45 to 4.55 ...................................................................... 209

1
CHAPTER ONE: INTRODUCTION
In 2007, former President G.W. Bush announced a $136 billion dollar program to
encourage innovation and strengthen the ability of the U.S. to compete in the global economy.
In particular, he stressed the importance of science and engineering to the United States with the
statement that “the nation needs to graduate more engineers or India and China will eat our
lunch” (Wadhwa, 2007). The “lunch” Bush alluded to was our competitiveness in science and
engineering.
The engineering professions have had an inestimable impact on this country’s economic
growth and global impact, and American universities have historically been the principal
incubators for many generations of talented, highly trained engineers (National Science Board,
2003). But as noted above, other countries are challenging this country’s competitiveness. In
order for the U.S. to remain at the forefront of advances in engineering and science, we need to
cultivate a diverse pool of candidates to address current and future global needs (National
Science Board).
One pressing concern for American educators is the overall graduation rates for college
students in the STEM (science, technology, engineering and math) fields. In 1975, the U.S. was
the third leading “producer” of students earning bachelor degrees in math and science. However,
2004 statistics from the National Science Board (2003) revealed an alarming drop in rankings,
with the U.S. slipping to 17th among nations awarding science and engineering degrees to college
students between the ages of 18-24. In overall terms, 18% of degrees conferred in 1996 in U.S.
universities consisted of engineering majors, with 11,316 (18%) of those awarded to women and
51,798 (82%) awarded to men (National Science Board, 2003). Compounding the low output of
students receiving undergraduate degrees in STEM fields (National Science Board) is the low

2
representation of racial and ethnic groups (i.e., Blacks, Latinos, and Native Americans) receiving
a science, math, or engineering degree. On average, only 12% of engineering degrees are earned
by individuals from underrepresented groups (Chang, 2004). Therefore, our society will need to
take bold steps to increase the access and graduation rates of women and currently
underrepresented populations (defined in this study as racial and ethnic groups that are
insufficiently or inadequately represented) to higher education in engineering. These groups
consist of African-Americans, Mexican-Americans, Native Americans (American Indians,
Alaska Natives, and Native Hawaiians), and mainland Puerto Ricans (Smedley, Butler &
Bristow, 2004). In short, the enrollment, retention, and graduation of underrepresented students
from U.S. schools of engineering are becoming increasingly important, especially given the drop
in rankings discussed above.
College Retention and Summer Bridge Programs
The Education Commission of the States (ECS) has projected that enrollments in
institutions of higher education will steadily increase. In fact, by 2015, 19.6 million students are
likely to be enrolled in U.S. institutions of higher education, compared to about 16.7 million
students in 2005 (Ruppert, 2004). Hand-in-hand with managing increased enrollments is
ensuring that graduation rates remain correspondingly high. Therefore, retaining these students
is and will continue to be a critical issue facing higher education.
Retention, as defined by Lenning, Sauer, and Beal (1980), refers to an institution’s ability
to keep a student enrolled until he/she completes an undergraduate degree. Tinto’s (2004) study
on retention reported that, on average, less than 55% of students entering four-year colleges
eventually earn their degrees. Moreover, 56% of all dropouts at America’s colleges and
universities leave before the start of their second year. Given this information, it is not surprising

3
that stagnating graduation rates among all students are on the agenda of college presidents and
policymakers across the country. However, retention becomes an even bigger concern for those
who are dealing with the comparatively low matriculation rates among underrepresented groups.
Students who exit systems of higher education voluntarily before receiving their degrees
tend to leave for three reasons. One reason is the lack of psychological and social support
(Astin, 1999). The second reason is the lack of institutional fit and campus integration (Swail,
Redd, & Perna, 2003). The third reason is associated with increases in college tuition and fees
(Orfield & Paul, 1988).
There are many different types of retention programs that assist college students in
developing academically and socially (Tinto, 1993). Of interest to this study, however, are the
various initiatives that fall into the category of a “bridge program.” Specifically, a bridge
program is a type of retention program geared towards at-risk students to assist them in
acclimating to the college setting in order to be academically successful and graduate (Pascarella
& Terenzini, 2005). On the average four-year college campus, a bridge program that occurs the
summer prior to an incoming freshman’s first fall term—hence the name “summer bridge
program” (SBP)—is available at many locations across the country.
Despite the varying language used to describe this type of assistance program, research
has indicated that SBPs are among the oldest strategies used to improve college retention rates
(Garcia, 1991). Surprisingly, even though SBPs are generally acknowledged to be advantageous
for their target populations, there is very little empirical evidence assessing their effectiveness
(Ackerman 1990; Gandara & Maxwell-Jolly, 1999, Garcia, 1991; Kluepfel, 1994; Pascarella &
Terenzini, 2005; Rita & Bacote,1997). Given the number of institutions of higher education
providing retention programs of this sort, it is therefore vital to investigate their effectiveness.

4
One reason for examining retention programs in general is that they demonstrate an
institution’s commitment to student welfare and success (Tinto, 1990). In other words, when an
institution provides students a variety of opportunities to improve their performance, the
institution will likely produce higher graduation rates. The establishment of retention programs
also demonstrates a university’s obligation to enhance the graduation rates of every student,
regardless of their ethnic background or level of preparedness (Tinto).
Another reason to focus on the effectiveness of retention programs is that they are
indicators of an institution’s ability to deliver quality education (Tinto, 1990). Smith, Smith, and
Clark (2007) stated that quality is the apparent individual nature of something, often tied to a
degree of excellence. They continued by asserting that quality has a consumer value component
associated with it. In the context of higher education, a quality education is essential not only to
students, but also to the many different stakeholders who need evidence that college students are
receiving excellent training and skills. Of course, the quality of retention programs is very much
tied to the dedication and skills of those who administer them. And indeed, the research shows
that administrators of these types of programs tend to be highly motivated individuals committed
to producing or providing products or services of high quality and merit (Gandara & Maxwell-
Jolly, 1999).
While their organizational structure may vary, the fundamental goal of most retention or
bridge programs is to provide an environment that is conducive to mentoring, assessing skills
and abilities, and facilitating faculty interaction and engagement in order to help academically-,
physically-, or socially-challenged students to better integrate themselves into the institution and
achieve greater academic success. Not only do participating students have a chance to interact
with dedicated personnel, they also have opportunities to become more familiar with the

5
advantages and disadvantages associated with a particular program of study. Effective retention
and bridge programs can also educate students on how to avoid obstacles while enrolled in
college (Gandara & Maxwell-Jolly, 1999; Tinto, 1990).
The final reason for examining effective retention programs is to understand how they
promote inclusive communities that are welcoming to an increasingly diverse student body
(Tinto, 1990). Developing a nurturing academic environment for a diverse community of
learners is a challenge to many campuses. Retention and SBPs, however, can increase a
student’s awareness of different ethnic/cultural perspectives through more personal interactions
with other learners, especially those from underrepresented groups. Most universities are, in
fact, actively seeking ways to improve campus climate and it is believed that retention programs
could be utilized to explore and demonstrate increased diversity within their community.
As indicated above, many campuses already have some type of summer bridge retention
programs in place for incoming freshmen. Given that fact it is surprising that there are so few
studies documenting if and how SBPs assist students in overcoming difficult academic and social
obstacles in the unfamiliar college environment (Maton, Hrabowski, & Schmitt, 2000; Rita &
Bacote, 1997). It is therefore vital that researchers provide empirical evidence corroborating the
effectiveness of these programs, as well as specific documentation of how they have assisted
students in various types of institutions.
Case Study: Virginia Tech’s Engineering SBP
An SBP at a Research I PWI was the focus of the present study. This program was
instituted in 1995 by the administrator charged with increasing the diversity of the graduates
from the institution’s College of Engineering. This program was broadly designed to help

6
students transition more successfully to the college environment—and especially to the academic
rigors associated with programs of engineering.
Since its inception nearly 15 years ago, the SBP associated with this study has served
more than 350 students. Initially, the program was expressly designed for incoming African
American freshman engineering students. Hispanic students were added to the target population
in 1999. Later on, the program began to include students from all underrepresented populations 1
who had applied to the College of Engineering, but did not meet the admissions criteria. To be
more specific, these students would initially enroll in the university’s general studies program
but could transfer to the College of Engineering if they were able to maintain a B average in all
the SBP classes, as well as pass the math readiness exam set by the university. In 2005, the
bridge program also began to invite first generation college students, as well as students at the
lower end of the academic spectrum who had been offered admission to the College of
Engineering.
Procedurally, all students who participate in this SBP are required to complete an
application. This process is intended to stress the voluntary nature of the program, although in
many cases students are highly encouraged by their high school guidance counselors or freshmen
orientation officials to apply. While entry into the program is voluntary, the program’s
guidelines and activities are mandatory: students must attend all classes and participate in all
activities sponsored by the program.
For most of the history of the 5-week program, enrollment numbers have remained at
about 30. However, with the addition of the first generation and other transfer students,
supplementary resources have enabled the program to accommodate up to 100 students annually,
1 First Year Generation, Women, African‐Americans students that were in University Studies Students

7
with the largest cohort to date being 68 students. While the overarching goals of the program
(listed below) have remained consistent, the various programmatic logistics associated with
implementing the program have undergone necessary modifications, such as increasing the
number of faculty associated with the program, expanding class schedules, and increasing the
number and involvement of the resident assistants in the program.
The program’s specific goals include the following:
A. Provide students with academic enrichment opportunities in all of the classes
offered.
B. Provide students with an atmosphere and activities conducive to social
development.
C. Provide students opportunities to develop personally and professionally, both
within the university setting as well as within the larger community when and
where appropriate.
Logistically, several classes are required during the five weeks of the program, which
runs Monday through Friday, from 8:00 AM to 4:00 PM. Each day includes a lunch break
and/or some personal time prior to afternoon classes (see Appendices A & B). The classes are
not credit bearing. In order to enhance the students’ adjustment to the fall term, classes are
designed to be somewhat similar to what they will experience during their first freshman term.
In other words, the summer bridge courses include quizzes, tests, some in-class assignments and
a significant amount of homework. Moreover, the students receive instruction in math,
engineering, and chemistry. The program is designed to stress the rigorous nature of these types
of classes and how students must keep up with the work if they are to be successful.

8
To summarize, the general purpose of the SBP that was examined in this study is to
support and aid in the development of these students through non-credit bearing college courses
that focus on content that has been historically difficult for first-term students (chemistry and
chemistry lab, math, and engineering). More specifically, the program aids students in
developing better time management skills and academic strategies to be successful in college. It
also provides students with vital opportunities to become acclimated to more rigorous, complex,
or ambiguous material during courses designed to mimic what they will experience during their
fall freshman term. The program also provides students an opportunity to familiarize themselves
with the institution and the community prior to their academic year. Finally, the program
provides students with personal and professional development through various activities both on-
and off-campus.
Purpose of the Study and Research Questions
The purpose of this study was to investigate the academic, social, goal commitment/
institutional attachment, and personal-emotional adjustment of participants versus non-
participants in a SBP for engineering students at Virginia Polytechnic Institute and State
University (Virginia Tech), a R1 predominantly White institution (R1 PWI) in the mid-
southeastern region of the United States. The Academic, Social, Personal-Emotional, and Goal
Commitment/Institutional Attachment subscales of the Student Adjustment to College
Questionnaire (SACQ) were used for this study (Baker & Siryk, 1999). The research addressed
the following questions:
1. How do participants versus non-participants in an engineering Summer Bridge
Program rate their Academic Adjustment (AA), Social Adjustment (SA), Personal-

9
Emotional Adjustment (PEA), and Goal Commitment/Institutional Attachment
(GCIA) during their first term of college?
2. Is there a significant difference in how the participants versus non-participants in an
engineering Summer Bridge Program rate their Academic Adjustment (AA), Social
Adjustment (SA), Personal-Emotional Adjustment (PEA), and Goal
Commitment/Institutional Attachment (GCIA) during their first term of college?
3. Do the Academic Adjustment (AA), Social Adjustment (SA), Personal-Emotional
Adjustment (PEA), and Goal Commitment/Institutional Attachment (GCIA)
experiences of participants versus non-participants differ by race or gender?
4. Is there a significant difference in participants versus non-participants in fall term
college grade point average with respect to retention after their first year in the
college of engineering and the institution?
5. What were the benefits and difficulties with participating in Summer Bridge Program
according to participants and the director of engineering support programs?
Significance of the Study and Implications for Future Research
Because of the many factors (economic, managerial, organizational, logistic) associated
with instituting and running a SBP, there was a real need to know whether these programs were
actually successful in helping participants to persist in engineering fields until graduation. Reber
(1985) stated that being persistent means striving against opposition. But thus far, the majority
of the research related to persistence in colleges of engineering has centered on how pre-
enrollment characteristics affect retention (Moore, Madison-Colmore, & Smith, 2003). Recently,
studies have broadened and are examining how other factors, including post-enrollment
programs, have positively impacted graduation rates in colleges of engineering (Anderson,

10
2006). Therefore, the present study has significance for further practice, research and policy in
higher education. The results of this study are likely to be useful for administrators/directors of
multicultural engineering programs, underrepresented students and their parents, policymakers at
the institutional, state, and federal levels, and even employers of engineering graduates who wish
to diversify their workforce with well-trained employees.
This research is also significant with respect to the adjustment of underrepresented
engineering students. As is well known, diversity is an important issue for most institutions of
higher learning, and especially when it comes to programs of engineering which have
traditionally been populated by White males (Gold, Deming, & Stone, 1992). Because of this
mono-cultural history, many institutions of higher learning have hired skilled professionals
(sometimes called “Multicultural Engineering Directors”) to identify and implement ways to
increase the number of underrepresented students, as well as to enhance their matriculation rates
(Maton, Hrabowski, & Schmitt, 2000; Sharp, Kleiner, & Frechtling, 2000). The findings of this
study can provide these professionals at Research I institutions with important information
concerning the adjustment of underrepresented engineering students. As a result, directors will
be able to assess the effectiveness of components of these initiatives based on the results of this
research.
This study could be beneficial to underrepresented students and their parents with respect
to important transitional issues they may face in college at Research I institutions—and thus the
need for support or enrichment programs. This study could also assist underrepresented students
in understanding their own college adjustment issues; while at the same time providing parents
with information on how to better assist their child adjust to life on a college campus. For

11
example, parents could help students select the best program(s) to help them overcome
adjustment issues both before and during their college years.
This study also paves the way for future research. The current study examines the
adjustment of participants versus non-participants in a SBP for engineering students at a single
R1 PWI over the course of a single term. A longitudinal study that compares participants and
non-participants over a longer period of time is warranted. Other types of SBPs that aid students
in non-engineering departments at Research I colleges and universities should also be examined.
A broader study could also compare various types of SBPs across diverse departments and their
impacts on graduation rates. Additionally, future studies could focus on the different types of
universities or colleges with SBPs. These types of studies will expand information on the overall
effectiveness of SBPs and student perceptions of their own college adjustment issues. The
results could create a more comprehensive understanding of the adjustment issues that many
students face—regardless of their cultural/ethnic background.
Finally, this study is significant in terms of policy at the institutional, state, and federal
levels. Policymakers who are better informed on the adjustment issues facing engineering
students are more likely to make smarter decisions when it comes to supporting college students.
In particular, administrators at the institutional level who have financial and other oversight for
these programs will be better equipped to make knowledgeable assessments of these programs in
terms of funding, recruitment strategies, and retention policies.
In terms of state and federal level decision making, policymakers could use the results of
this study to help pre-college students make informed decisions about entering and persisting in
Research I college programs for engineering. Moreover, since in many cases state and federal
level policymakers have the financial means to allocate funding to SBPs, it would benefit them

12
to be better informed of their efficacy. For example, they could be influential in expanding
access to SBPs for all students interested in studying engineering at Research I institutions.
Definition of Terms
The following alphabetized list contains definitions pertinent to this study.
Academic Adjustment (AA): One of the four SACQ subscales, which is associated with higher
education learning experiences. The AA section of the instrument measures the success
in dealing with various demands within college. An example of AA item is “I am having
a lot of trouble getting started on homework assignments” (Baker & Siryk, 1999).
Academic Integration: Opportunities for developing meaningful associations within and
outside the classroom setting, thereby enhancing one’s overall academic experience.
These affiliations, for example, can be academic group meetings with peers, faculty and
staff that facilitate sharing useful knowledge and experiences (Tinto, 1993).
Adjustment: The assumption that the overall college experience is complex, involving demands
that vary in kind and degree, all of which require a variety of coping strategies (or
adjustments) (Baker & Siryk, 1999).
First Generation College Student: A student who is the first of his/her generation to attend
college; i.e., neither parent attended college (McGregor, et.al, 1991).
Goal Commitment/Institutional Attachment (GCIA): One of the four SACQ subscales, which
corresponds to a student’s dedication to his/her educational goals and connection to the
institution of choice. An example of GCIA item is “Lately I have been giving a lot of
thought to transferring to another college”(Baker & Siryk, 1999).
Persistence: An individual’s efforts to overcome opposition (Reber, 1985).

13
Personal-Emotional Adjustment (PEA): One of the four SACQ subscales, which is associated
with the psychological and physical aspects of students. The PEA section of the
instrument measures the success in dealing with various demands within college. An
example of PEA item is “I have been feeling in good health lately” (Baker & Siryk,
1999).
Research 1 Predominantly White Institution (R1 PWI): A college or university whose
student population is predominantly White, which offers doctoral degrees and is research
extensive (The Chronicle of Higher Education, 2000).
Retention: An institution’s ability to keep a student enrolled until he/she completes an
undergraduate degree (Lenning, Sauer, & Beal, 1980).
Social Adjustment (SA): One of the SACQ subscales, which is associated with the social
aspects of a higher education environment. The SA section of the instrument measures
the student’s success in dealing with various social demands within college. An example
of SA item is “I am satisfied with the extracurricular activities available at college”
(Baker & Siryk, 1999).
Social Integration: The transition “between membership in past communities and membership
in the new communities of college” (Tinto, 1993, p. 125).
Student Adjustment College Questionnaire (SACQ): A comprehensive survey designed to
measure adjustment to college a measure of potential success (Baker & Siryk, 1999).
Summer Bridge Program (SBP): A retention effort, normally occurring during the summer,
which is geared toward at-risk students to assist them in acclimating to the college
setting, thereby increasing their likelihood of persisting to graduation (Pascarella &
Terenzini, 2005).

14
Transitional Programs: A program that assists students in developing academically and
socially (Tinto, 1993).
Underrepresented: Racial and ethnic populations that are insufficiently or inadequately
represented based on the Institute of Medicine of the National Academies; usually
associated with African-Americans, Mexican-Americans, Native Americans (American
Indians, Alaska Natives, and Native Hawaiians), and mainland Puerto Ricans (Smedley,
Butler, & Bristow, 2004).
Organization of the Study
This study is organized into five chapters. Chapter One introduces the research topic,
purpose of the study, research questions, significance of study, limitations, organization of the
study, and definition of terms. Chapter Two provides an extensive overview of the existing
literature relevant to the topic. Chapter Three describes the methodology used in the study,
including sampling procedures and procedures employed to collect and analyze the data. Chapter
Four presents the results of the study. Chapter Five discusses the findings and offer conclusions
and implications for future practice, research, and policy.

15
CHAPTER TWO: REVIEW OF THE LITERATURE
Introduction
The purpose of this study was to investigate the academic, social, goal commitment/
institutional attachment, and personal-emotional adjustment of participants versus non-
participants in a SBP for engineering students at a R1 PWI in the mid-southeastern region of the
United States. This chapter begins with the conceptual framework for the research, followed by
a discussion of the pertinent research in this area. This chapter then discusses adjustment to
college, affiliation, the role of faculty in retention, instrumentation to measure adjustment, and
summer bridge programs. This chapter concludes with a summary section.
Conceptual Framework for the Problem
The conceptual framework for this study was developed from Tinto (1987), Astin (1984),
Pascrella (1980), and Baker and Siryk (1999). The research study focused on the academic,
social, personal emotional, and goal commitment adjustment of engineering college students.
These factors are believed to be directly related to a student’s ability to integrate both
academically and socially to the university environment, which in turn can affect a student’s
personal and physiological involvement. These factors are also positively correlated with a
student’s interactions with peers and faculty. Figure 1 depicts three of the important components
involved in a student’s readiness for an engineering education.

Figure 1
A
Selective
academic
framewo
universit
in having
created s
career. M
engineeri
.
. Factors tha
A portion of t
e characterist
c and social
rk is the sum
ies that offer
g students re
ummer bridg
Many college
ing educatio
at Positively
the conceptu
tics deal wit
setting prior
mmer bridge
r engineering
ady for engi
ge programs
es and unive
on. The leve
SeChara
y Impact Rea
ual framewor
th the idea of
r to entering
program an
g as a field s
ineering edu
s to assist stu
ersities have
l of involvem
ReadinEnginEduc
elective acteristics
adiness for E
rk is the noti
f students ha
higher educ
nd engineerin
study. There
ucation. The
udents in pre
SBP in orde
ment is the f
ness foneeringcation
Summer BProgra
Engineering E
ion of select
aving variou
cation. Anot
ng education
e are many c
se various co
eparing for th
er to assist st
final section
or g
Bridge am
LevInvolv
Education
tive characte
s experience
ther portion t
n. There are
constituent g
onstituent gr
heir enginee
tudents prep
of the conce
vel of vement
eristics.
es in their
the conceptu
colleges and
groups intere
roups have
ring college
pare them for
eptual
16
ual
d
ested
r

17
framework. Level of involvement deal with the student’s psychological and psychical
involvement in their learning inside and outside the classroom.
If undergraduate students are to thrive at college, it is essential that they successfully
adjust to the various academic and behavioral expectations they will face on most university
campuses. Even though administrators on college campuses across the country have increased
efforts to enroll students, insufficient attention has been paid to helping students overcome the
variety of adjustment issues they will have to face once they arrive (Tinto, 1990). Sometimes
these adjustment issues are unexpected, demanding, and challenging and can negatively impact a
student’s ability to succeed. The population at greatest risk for adjustment difficulties are
freshman, who are often unprepared for the magnitude of the changes they will encounter (Baker
& Siryk, 1986).
The conceptual framework for this study provides the empirical foundation for this
investigation. In this section of the paper, the four bodies of interrelated literature used for this
review—specifically, those developed by (1) Vincent Tinto, (2)Alexander Astin, (3) Ernest
Pascarella, and (4)William Baker and Bohdan Siryk—are described. Many studies have used
these same frameworks to investigate a variety of issues facing college students, which include
adjustment, factors that influence departure, and factors that encourage success. Baker and
Siryk’s (1999) instrumentation was utilized to better analyze and synthesize data collected for
this study. These frameworks have been utilized by other researchers, but never as one overall
conceptual model. Instead of relying on traditional measurements such as high school grade
point average and SAT/ACT scores for predicting the adjustment and success of college
students, we need to incorporate other qualitative and quantitative measures to identify and deal
with the various adjustment issues that could impact student success. Therefore, this study was

18
designed to assist researchers and personnel who utilize assessment information with respect to
the effectiveness of SBPs as they formulate services and activities and create procedures to
increase attrition and enhance the success of students.
Adjustment to College
One critical theoretical framework used for this review was from Vincent Tinto’s 1987
landmark book, Leaving College: Rethink the Causes and Cures of Student Attrition, in which he
discussed the complex issues surrounding student attrition in college. Although Tinto conducted
an extensive review of the existing literature on college student attrition/retention, he found that
the reasons for student attrition were by no means obvious. As he discussed, the complications
surrounding a thorough grasp of this phenomenon were likely due to the overuse of
psychosomatic theories in college student attrition frameworks, as well as the failure to fully
comprehend how institutional policies impact these trends.
Tinto’s (1987) theory was designed to offer a longitudinal model to explain the various
factors that influence students to stay or withdraw for the university. The National Longitudinal
Survey (NLS) results were utilized to view the departure of high school graduating class of 1972.
Tinto examined the scope and patterns of departure at both two-year and four-year institutions.
The findings for a four-year institutions demonstrated that approximately 44 of every 100 new
college student would leave their first institution. Also, Tinto stated that 42% for the students
would transfer to another institution. The researcher indicated that the NLS data reported was
not the same for each institution. However, the findings were aggregated in order to describe the
behavior characteristics of groups at various types of institutions.
Tinto’s (1987) theory features the mostly widely used and cited framework in empirical
studies, which is centered on the following six constructs that college students experience as they

19
transition from a secondary education/family environment to the more independent university
environment.
1. Pre-entry attributes (e.g., prior schooling, family background, and skills/abilities)
2. Goals/commitment (e.g., students’ aspirations and institutional goals)
3. Institutional experience (e.g., academics, faculty interaction)
4. Integration (e.g., academic and social)
5. Goals/commitment (e.g., intentions and external commitments)
6. Outcome (e.g., departure, decision-graduate, transfer, dropout)
These six constructs are based in part on the work of Émile Durkheim (1951), who is
considered an influential figure in modern sociology. Late in the 19th century, Durkheim
conducted a detailed study of suicide, which then fundamentally changed the way sociological
research was conducted. In essence, Durkheim maintained that suicidal tendencies increased in
individuals who were not integrated socially and normatively into a supportive social system.
One of the terms he developed was “egoistic suicide,” which he tied to individuals with few
connections to any social groups that could help that person cope with changes. Tinto (1987)
later used this concept in discussing “student departure,” which he defined as the action of a
college student leaving his or her specific institution of higher learning, or abandoning the entire
system of higher learning altogether. Tinto’s student departure model led many researchers to
develop their own psychometric instruments for understanding student departure.
William Spady (1970) also utilized Durkheim’s suicide theories (1951) to formulate his
own hypothesis of student attrition, which later influenced Tinto’s theoretical framework.
Spady examined the literature on the dropout process from a variety of operational definitions
and intellectual frameworks. Thus, the researcher used a variety of distinct approaches to

20
examine several variables simultaneously in order to bring empirical clarity to the drop-out
process. In a study of 683 first-year undergraduates at the University of Chicago, Spady
concluded that students who did not interact socially with other students, or did not feel
integrated into the social systems of their college, were more likely to withdraw.
Influenced by these earlier studies, Tinto (1975) linked leaving an institution of higher
learning to suicidal behavior, in that an unsuccessful college student was unable to adequately
integrate socially and/or academically to the institutional culture. These various theories that
stemmed from Durkheim’s (1951) seminal study of suicidal tendencies are valuable in that they
provide higher education administrators with some of the key factors that could cause students to
withdraw from a college or university. If these factors are known and understood, they can be
used to develop reasonable strategies for assisting college students to integrate socially and
normatively to the college environment, thereby enhancing their likelihood of graduating.
Foundation for Involvement
Many theorists that have investigated student involvement and the impact it has on
educational accomplishments and personal growth. Kapp (1979) indicated in an earlier study
that approximately 80% of traditional age college students participate in one or more
extracurricular activities that take place outside of the classroom. There are several ways that
involvement impacts students’ development. First, psychosocial development is enhanced by
extracurricular activities (McCluskey-Titus, 2003). Second, extracurricular activities contribute
to cognitive development (Terenizini, Pascarella & Blimling, 1996). Although the concept of
“student involvement” might seem somewhat vague, researchers agree that it involves
participation, an obligation or a desire to commit (which is a step above minimum expectations
for course work, such as voluntary self-engagement with the material, e.g., through study

21
sessions), and networking with peers, staff, and faculty outside of the academic setting (Adams,
1979, Astin, 1984, Willis, 1993). Adams asserted that a key component of involvement is the
student genuinely connecting with university activities and the people. If that occurs, the
individual will feel motivated, better able to become self-guided, and will likely be more
committed to his or her purpose.
Practitioners in the field, also agree on the importance of student involvement. For
example, Beakley and Chilton (1972) reported that engineering educators have long advocated
the involvement of students in their own education. They believed that such involvement would
increase the students’ motivation to learn the complex analytical skills needed to complete most
programs of engineering. Moreover, they maintained that by involving undergraduate students
in assignments that are both educational and enjoyable, it would enhance their abilities and
eagerness to master essential academic skills. Also, these practitioners indicated that involving
students in their own learning can remove some of “traditional pressures and compunctions, and
by offering incentives apparently more meaningful than grades or threats of failure” (pg. 877).
Newell (1984) provided a useful overview of involvement and learning. He stated that
“half of the students who start college never finish” (pg. 7), and maintained that the critical
reason why this occurs is that students have a difficult time adjusting to the university setting.
He states that the persistent students in college tend not share a coherent experience about
college. Newell indicated that half the college students commute. Some of the students maintain
a job. Also, some of the students pursue higher education part-time. Therefore, students that
commute, maintain an outside job, and attend college part-time would have a more difficult time
in adjusting.

22
Newell (1984) stated that colleges have lost a more liberal education focus due to
specifications by the accrediting agencies and the interest of faculty in pursuing their scholarly
interests rather than just teaching. One rationale is due to the low expectations that professors
tend to have of average students. Another reason may be of the lack of faculty participation in a
true evaluative process. In other words, students who receive constructive feedback and
evaluation of their work are likely to outperform students who do not. Newell included a list of
suggestions for institutional administrators and faculty members to bring greater involvement to
the learning process, thereby increasing the retention of students. These include (1) increased
instructor involvement e.g., through office hours, (2) having up-do-date teaching materials and
methods, and (3) conducting more routine evaluation of students.
Willis (1989) indentified two types of student involvement: academic and institutional.
She interviewed 58 undergraduate students to understand their perceptions of involvement, as
well as how they become involved and what issues over time could change their involvement.
The participants provided a number of definitions for involvement. They also demonstrated
different levels of involvement in their undergraduate classes. The data revealed that a student’s
personal approach to learning impacts both their involvement in learning as well as the activities
in which they engage. Moreover, her data revealed that females were more likely than males to
be involved with their academics—possibly due to the fact that females were more likely to
combine personal and vocational interests in their choice of courses. Willis also discussed how
context is important in influencing involvement. Specifically, course involvement developed
from a combination of personal interests and contextual factors, such as relevance of the
coursework, skill of the instructor, and the types of assessments used. She concluded that an
involved student wants to learn and is more likely to persist.

23
Astin’s Student Involvement Theory
Astin’s (1984) Student Involvement Theory is deeply rooted in a longitudinal study based
on college student dropouts. The aim for this study was to examine the factors that impact
college students’ persistence at a university. Tinto (1999) stated that every” significant effect
could be rationalized in terms of the involvement concept” (pg. 523). Thus, positive variables
tend to increase a student’s involvement, while negative variables tend to decrease a student’s
involvement leading to withdrawing from the university.
Astin identified a number of significant ways for a college student to become involved.
These include residence hall experiences, extracurricular activities (e.g., recreational sports and
athletics, student run political settings, etc.), involvement in honors curriculum, and by
networking with faculty and peers. With these factors in mind, Astin (1993) later studied survey
data amassed from 1985 and 1990, received from 25,000 students, in order to look at attrition by
college major. Astin (1993) determined that there was a high attrition rate among engineering
students in the sample population he surveyed as compared to other majors. Specifically, only
about 44% of engineering students emerged with an undergraduate degree in their field. Astin
also reported a student’s interest in the field of engineering generally diminished between their
freshman and sophomore years of college. Astin attributed this reduction in interest and
subsequent attrition in part to an instructor’s use of traditional bell curves for assigning grades,
which equated higher achieving students with average performers.
Astin (1985) asserted that “involvement is also very similar to what learning theorists call
‘vigilance’ or ‘time –on-task’ (p. 135). According to Astin, involvement equates to motivation
and behavior—a student’s active, directed activities. Astin further described the five main
components of his theory.

24
1. “Students learn by coming involved” (p. 133).
2. It is underpinned by a wide array of literature on the environmental issues that impact
student development.
3. It is loosely coupled with psychoanalysis and classical learning theoretical principles
such as Content Theory, Resource Theory, and Individualized (Eclectic) Theory.
4. The idea behind involvement pertains proportionally to students and faculty.
5. Researchers can utilize these concepts to examine the development of students and
faculty while at the same time creating efficient and valuable learning settings.
Astin’s (1984) Involvement Theory has become a cornerstone for describing and
understanding the impact of environmental influences on student development. It is still widely
used to investigate and more fully comprehend student development processes, thereby aiding
administrators in fostering educational settings that are more conducive to success. Astin’s
Involvement Theory is deeply rooted in the Freudian notion of cathexis, which is the
concentration of emotional or psychic energy in a person, object, or idea (Astin, 1985, 1999).
The “object” in his theory is loosely defined. It can be as general as a student’s experience in
college, or as specific as how a student prepares for an engineering test. But as noted earlier,
Astin was very specific as to the meaning of involvement, which he defined as “the amount of
energy that the student devotes to the academic experience” (1984, p. 27). Later, he refined the
term “involvement” to be the amount of “physical and psychological energy that the student
devotes to the academic experience” (Astin, 1999, p. 518). According to Astin (1985), an
involved student is an individual who does the following: a) spends a significant amount of time
studying, b) spends a lot of time on the college campus, c) joins and participates in student
organizations, and d) networks with peers and faculty members.

25
In addition to his cathexis construct, there are four other constructs associated with
Astin’s theory. One construct is the notion that “regardless of its object, involvement occurs
along a continuum” (Astin, 1999, p. 519). In other words, college students all develop
differently; therefore a student will likely experience varying degrees of involvement depending
on the “object” in question. Moreover, a student’s time commitment to that object—and thus his
or her involvement—will vary. Another construct maintains that “involvement has both
quantitative and qualitative features” (Astin, 1999, p. 519) —and thus can be assessed in both
ways. For example, researchers and administrators can quantitatively measure the amount of
hours a student spends studying for an examination, but can also qualitatively determine how
students prepare for tests or review material for classes.
It is the last two constructs, however, that provide the most useful clues for developing
improved educational programs for students. The first is that the “amount of student learning
and personal development associated with any educational program is directly proportional to the
quality and quantity of student involvement in that program” (Astin, 1999, pg. 519). The second
states that “the effectiveness of any educational policy or practice is directly related to the
capacity of that policy or practice to increase student involvement” (Astin, 1999, p. 519).
It should be noted that Astin (1984) described some important characteristics of an
involved student: “An involved student is an individual that is academically, emotionally and
socially engaged. The individual dedicates significant energy to educational endeavors, spends
much time on the college setting, contributes actively in student extracurricular activities, and
interact often with faculty” (p. 292). Concurring with this definition, Pascarella and Terenzini
(1991) emphasized the primary responsibility of the student in determining the extent and nature
of growth according to the quality of effort or involvement with the resources provide by the

26
institution. And indeed, subsequent research has confirmed that the more time and energy a
student freely devotes to the college experience as a whole, the more likely it becomes that the
student will do well academically. For example, both Pascarella and Terenzini and Tinto (1987)
asserted that students who are satisfied with their educational and social experiences are more
likely to matriculate or persist throughout college. This corroborates the earlier findings of
Astin, who was convinced that students will learn more if they are highly involved in both the
academic and social aspects of higher education.
Faculty Role in Retention
In 1980, Pascarella created a conceptual model to examine the withdraw process.
Specifically, he was interested in understanding the importance of informal faculty-student
contact with respect to persistence. Pascarella proposed several variables that he thought would
impact a student’s likelihood of engaging in student-faculty informal contact, which could then
impact that student’s academic achievement, his/her intellectual and personal development, and
ultimately that individual’s institutional persistence. These variables include a) institutional
image, b) administrative policies and decisions, c) size, d) admissions, and e) academic
standards. Pascarella maintained that these variables would impact whether or not a student
engaged in informal contacts with faculty members, thereby impacting that individual’s
educational experience and ultimate decision to persist or withdraw. He also discussed other
educational experiences (e.g., peer environment, courses, and leisure time or extracurricular
activities) and outcomes, such as academic performance, psychological development, personal
development, career aspirations, college fulfillment and assimilation into the institution—all of
which could impact persistence rates. In fact, Pascarella asserted that a student’s background

27
characteristics could be expected to directly impact the institutional variables, informal contact
with faculty, other college experiences and educational results.
Instrumentation to Measure Retention and Adjustment
Many theoretical frameworks have been designed to examine retention (Astin, 1975;
Pascarella & Terenzini, 1980, 1981; Swail, 1995; Tinto, 1987). Some of the retention models are
based upon research on students who withdraw from their university. Many colleges and
universities have a significant number of students who have difficulty adjusting to their new and
oftentimes challenging environment. Freshmen year is typically the most difficult adjustment
period for college students. Thus, it is imperative to understand the variety of adjustment issues
that college freshman face before examining the motives for withdrawing from an institution of
higher learning. Specifically, administrators need appropriate research that addresses adjustment
issues so that they can create new or enhance existing bridge intervention support programs to
enhance persistence rates. Drawing on Baker’s and Siryk’s (1999) conceptual model for
adjustment, the next section outlines methods for understanding attrition, the foundation for these
theories, and their common constructs. A longitudinal project at Clark University, which was
sponsored by funds from the Andrew W. Mellon Foundation, helped researchers to better
understand how college students adjust.
In 1975 and 1976, with support from the Andrew M. Mellon Foundation, Baker and
Nisenbaum (1979) were charged with developing what later became known as the Transitional
Group Program (TGP). The Mellon funding allowed the researchers to work with two groups of
entering Clark University freshmen in small group settings to discuss their shared experiences
and anxieties about adjustment. Even though the TGP only lasted about six weeks (the length of
time needed to determine whether or not participants had successfully adjusted), it led Baker to

28
collaborate with Siryk (1984) on a subsequent study using his clinical experiences with students
transitioning to college. This later study used individuals that had been identified with
adjustment issues in order to design and implement appropriate interventions.
Methods for Understanding Attrition
Siryk (1981) reported several methods for understanding attrition. These include
methods for examining the dimensions of a range of personal attributes and their association to
attrition, methods for examining the association of a variety of components linked to the college
environment, and methods that could be used to implement intervention programs to assist in
reducing or eliminating attrition. Several extensive scales were created to examine the range of
issues associated with the college environment. For example, Pace (1962) and Stern (1963) are
associated with two important scales: the College Characteristic Index and the College and
University Environment Scales (CUES). Pace developed the CUES, which is a survey intended
to assist administrators in defining the cultural, social, and intellectual climate of the college
environment and the impact it has on students. In the nearly 50 years since it was developed,
researchers have questioned the usefulness of the CUES survey. Siryk (1981), for example,
maintained that the characteristics the original survey sought to determine—and these include
educational motivation, social propensity, and academic ability—are actually difficult to evaluate
with absolute certainty because they can change over time. Thus, the predictive power of these
variables is questionable.
Foundation for Adjustment Theory
Incoming college freshmen typically face a variety of adjustment challenges.
Siryk (1981) identified three areas that are still relevant nearly 30 years later. The first is the
increased academic rigor of college. Essentially, a student’s ability to adjust to more challenging

29
coursework and assignments is highly related to his or her ability to persist through graduation.
Conversely, if students are unable to adjust to an increased workload, they are more likely to
withdraw. The second area involves the social environment. Siryk asserted that a residential
college has the potential to successfully blend its social and academic communities. However,
there a number of personal and environmental factors (i.e., age of student, living arrangements,
time spent together, perception of university setting, among others) that will invariably impact
how a student adjusts to the new residential setting. Students who are unable to adjust tend to
withdraw from the university. The third area deals with the choice of college and the student’s
personal attachment to that institution. The student that is able to bond or connect to the
university is more likely to adjust to the college environment and matriculate to graduation.
Several investigators have developed very simple measures consisting of a single item or
a small number of items for assessing and understanding how students adjust to college (Pervin
& Rubin, 1967; Pascarella & Terenzini, 1980; Terenzini & Pascarella, 1977). Long (1976), for
example, designed an effective predictive model of college student adjustment in work he did at
Southern Illinois University Carbondale (SIUC). Responses to the simple question, “What are
your feelings about SIUC?” were used to assess academic attachment in the survey by using
concurrent validity. The 56 goal statements in the WICHE (Western Interstate Commission for
Higher Education) inventory were modified for this study’s survey. There were four domains
designed for this model. The first domain is academic environment, which features three
measurement scales: instructional quality, a student’s perception of curricular impact, and
perception of the academic climate. The second domain is political climate, which can be
measured by four scales: student independence, student participation, student activism, and
authoritarian governance. The third domain is academic alienation, which was assessed using

30
three scales: academic estrangement, academic cynicism, and academic powerlessness. The
fourth domain, university authorities, can be measured through the use of two scales:
administrative excellence and affect scales. After surveying 460 participants, Long revealed that
two domains were significant after several discriminate analyses were conducted—namely,
academic environment and alienation. In the area of academic environment, low instruction
quality, poor academic climate and lack of academic effect were correlated to academic
detachment. The scales for academic alienation correlated well to academic detachment,
0.43(p=0.001).
Pascarella and Terenzini (1980) developed a multi-item model to predict freshman
persistence and dropout rates using Tinto’s multidimensional measure of social and academic
integration. Their longitudinal study of voluntary attrition originally included 773 student
participants—90 of whom decided to leave their university. Administrators from the institution
told several students to withdraw from the university. These students were not included in the
study because the study examined voluntary attrition. Pascarella and Terenzini developed 32
Likert items to examine each of the five dimensions constructed by Tinto. Initially, there were
55 Likert items, but the researchers had the items judged and critiqued in order to shorten the
amount of items. These dimensions were intellectual development, peer group interactions,
interactions with faculty, and institutional and goal commitments. In their analysis, cumulative
grade point average and extent of involvement in extracurricular activities in student’s first year
were controlled because Tinto asserted that these two components were important for social and
academic integration. Their results revealed that the five factors were consistent with
dimensions of Tinto’s model. Among the students who did not withdraw, their average scores
were almost one standard deviation higher than those who did withdraw. It is important to note

31
that their study indicated that the “quality and impact of student-faculty informal contact may be
as important to student’s institutional integration” (pg. 72).
In an earlier study, Bryant and Trower (1973) examined the amount and level of
difficulty in social interaction for a group of second-year Oxford University students. About
10% of the participants were from a lower social class, came from small families, and reported
having a difficult time in social situations. In fact, these participants reported they tried to avoid
social situations. A principal component analysis revealed the questions that demonstrated social
difficulty. Bryant and Trower concluded that some students lacked the basic social skills needed
for establishing friendships or meeting individuals.
Other researchers have also developed multi-item measures for examining adjustment
(Bryant & Tower, 1973; Long, 1976; Pace, 1963; & Stern, 1963), but several of these did not
demonstrate much apprehension for psychometric elements (Baker & Siryk, 1984), and thus
were not incorporated in this study. Others, however, have proposed useful theoretical
frameworks for interpreting the various issues that students face in college (Astin, 1999; Tinto,
1987; & Pascarella, 1980). The one that was used in this study is the Student Adaptation to
College Questionnaire (SACQ), which was created by Baker and Siryk (1999) in response to the
lack of a systematic way for measuring a student’s adjustment to college.
Constructs for the SACQ Instrument
Baker and Siryk (1984) examined several components of adjustment that entering college
students face, three of which are theoretically related: (1) degree of involvement in institutional
activities, (2) attrition from school, and (3) academic achievement. The instrument they
subsequently developed, the SACQ, originally contained 52 statements (later expanded to 67),
which were clustered around four domains of adjustment: a) academic adjustment, b) social

32
adjustment, c) general bonding adjustment, and d) intra-personal adjustment. Baker and Siryk
(1999) maintained that a student who has a difficult time adjusting to one or more of these
frameworks would experience emotional distress with the existing environment.
In a 1985 study, Baker, McNeil and Siryk described the distinction between a
participant’s initial expectations concerning college adjustment, and his or her post-enrollment
expectations of attained adjustment, which they then correlated to various behavioral criteria.
These behavioral criteria included completing college on time, utilizing available psychological
and counseling services, and obtaining academic honors. This study also described how a
participant’s post-enrollment expectations for personal-emotional adjustment tended to be
accurate, while social, academic, and institutional commitment adjustment tended to be
exaggerated.
As noted previously, Baker and Siryk (1984) created the SACQ survey in response to the
lack of a systematic way for measuring a student’s adjustment to college. They asserted that the
SACQ could be used “as a source of dependent variable in investigations of the role of
personality and environmental determinants of adjustment to college” (pg. 179), as well as to
identify students who may be having a difficult time transitioning to college. Such information,
they believed, could be effectively used by college administrators to help students at risk through
appropriate remedial interventions. Baker and Siryk also wanted to remedy the fact that many
investigators did not report necessary reliability data for instruments that examine adjustment.
The SACQ was specifically designed to assess a student’s overall adjustment to college,
detect possible problems, guide intervention strategies, and promote retention. Specifically, it
measures adjustment in four areas: Academic Adjustment (AA), Personal-Emotional
Adjustment (PEA), Social Adjustment (SA), and Goal Commitment/Institutional Attachment to
33
the Institution (GCIA). The SACQ was selected for this study because its four subscales relate
very well to the major activities of the SBP examined in this study. Use of the SACQ provided
an appropriate structure for rigorous inquiry, facilitated a more secure basis for prediction, and
enhanced the researcher’s ability to interpret the data (Merriam & Simpson, 1995).
Summer Bridge Programs
Many colleges of engineering at Research 1 predominantly White institutions (PWIs)
throughout the country have made dramatic and systemic changes to their retention efforts by
developing targeted programs for improving the retention and graduation rates of their
underrepresented student populations, especially Black and Hispanic students (Gold, Deming, &
Stone, 1992; Maton, Hrabowski, & Schmitt, 2000; Robbins & Smith, 1993). Specifically, SBPs
for incoming freshmen have been developed and instituted with the following goals: (1) to help
familiarize incoming students with the university community prior to the start of their academic
year; (2) to augment the academic skills of students in selected subject areas; and (3) to provide
incoming engineering freshman students opportunities for personal and professional
development.
Pascarella and Terenzini (2005) described another type of transitional or retention
program—the SBP (SBP). This type of program is geared toward at-risk students to assist them
in acclimating to the college setting, thereby increasing their likelihood of persisting to
graduation. They identified several important characteristics of a SBP that distinguishes it from
a summer orientation program:
1. Specialized goals.
2. Usually longer in length.
3. Programmatic focus.

4
5
6
7
8
G
Colleges
rationale
secondar
underrep
small per
A
developin
Figure 2
. Varied co
. Targets hi
. Residenti
. Includes c
. Intended t
Green (2006)
and Univers
for these pr
ry to higher e
resented stu
rcentage of t
As shown in F
ng programs
. Summer B
ontent and str
igh school g
al in nature.
course and w
to familiariz
) described th
sities (HBCU
rograms is to
education. S
udents adjust
the student p
Figure 2, SB
s to enhance
Bridge Progr
ructure.
graduates atte
workshops.
ze students w
he many typ
Us) and PWI
o help underr
SBPs at PWI
to an enviro
population.
BPs consider
college succ
ram Design
ending a spe
with the camp
pes of SBPs f
Is. Regardle
represented
Is are especi
onment wher
r the four im
cess.
ecific institut
pus and facu
found at both
ess of their l
students suc
ally importa
re they are li
mportant adju
tion.
ulty, staff an
h Historicall
ocation, the
ccessfully tra
ant in helping
ikely to com
ustment cons
nd peers.
ly Black
primary
ansition from
g
mprise only a
structs in
34
m
a

35
History
The increase in African-American students attending institutions of higher education
coincides with the Civil Rights Movement of the 1960s—a turbulent decade for U.S. public
colleges and universities (Noel, Levitz, Saluri et al., 1985). For the first time, institutions were
forced to openly address equal opportunity for underrepresented students or disadvantaged
groups. With the advent of the 1970s, the retention of African-American students—generally
less well-prepared than White students—became a major issue. Therefore, retention programs
were created to meet the “changing demands and needs and to provide a staying environment for
all students” (p. 78).
As noted above, the 1960s was a watershed decade for the entrance of African-Americans
in institutions of higher education, facilitated in part by the passage of important pieces of
legislation. The Civil Rights Act of 1964, for example, was a landmark act that outlawed
discrimination in public and private facilities based on race, color, religion, sex, national origin.
This act had huge implications for colleges and universities that received federal funds because it
mandated equal admission practices. This act facilitated the acceptance—at least on paper—of
more African-Americans in higher education (Kaplin & Lee, 1997; Levin & Levin, 1991; Robert
& Thomson, 1994; Swail, Redd, & Perna, 2003).
A second critical legislative action was the Higher Education Act of 1966, which
provided financial assistance for students in need who otherwise could not have attended college.
This act provided many African-Americans and other lower-income individuals the opportunity
to attend college in greater numbers (Kaplin & Lee, 1997; Levin & Levin, 1991; Swail, Redd, &
Perna, 2003).

36
The Elementary and Secondary Education Act, passed in 1965, provided additional
funding for professional development, instructional materials, and resources to support
educational programs. Most importantly, Title I of the act funneled much needed support to
school districts with a higher percentage of students from low-income families. Thus, this
important piece of legislation was instrumental in helping to educate African-Americans and
other low-income students and fostered a sense of achievement amongst the student (Kaplin &
Lee, 1997).
Although these laws were passed with the goal of increasing the number of
underrepresented students attending the nation’s colleges and universities, administrators and
educators at predominantly White institutions were not prepared to deal with some of the social
and academic issues that African-American students faced at these colleges (Levin & Levin,
1991). One troubling issue was the hostile environment perceived by African-American students
attending PWIs. These students did not resemble the standard profile of most students attending
college in the ‘60s and ‘70s. Another major dilemma for many African-American students was
their relative lack of preparedness from high school to college as compared to majority students
(Levin & Levin, 1991). In response to these issues, retention programs began to appear to help
meet some of the needs of African-Americans and other underrepresented groups.
Objectives of a Summer Bridge Program
Although the specific mechanics of bridge programs may differ from institution to
institution, they share several common themes and objectives, as noted above. One important
area concerns the overall transition process from high school to college, particularly in view of
the differing capabilities of the entering freshmen. A second major area concerns the social
integration of the students. Social integration, as defined by Tinto (1993), relates to the

37
transition “between membership in past communities and membership in the new communities
of college” (p. 125). Tinto maintained that the average college campus is made up of many
communities, which either individually or collectively provide a way for students to become
acclimated to campus life, thus enhancing their likelihood of being successful in college.
Another important area that guides the development of a SBP is the concept of academic
integration. For this study, the term “academic integration” refers to opportunities for developing
meaningful associations within and outside the classroom setting, thereby enhancing the overall
academic experience (Tinto). These affiliations, for example, could be academic group meetings
with peers, faculty and staff that facilitate the sharing of useful knowledge and experiences.
Research on Summer Bridge Programs
In an interview conducted with Michael Hovland from the Noel-Levitz Centers (a
consulting firm that works with colleges and universities to help them exceed their goals for
enrollment and student success) (Kluepfel, 1994), he indicated that SBPs are economical, for the
most part self-supporting, and accomplish many important objectives. For starters, they give
students a leg-up on building the skills they will need to succeed in higher education. SBPs also
familiarize students with the academic “lay of the land” and the different resources and
expectations in place at their college of choice. Students also gain a better understanding of how
to structure and balance their time in light of competing academic and social demands. Finally,
summer bridge students get a chance to build important relationships with faculty, staff, and
other students in advance of their first freshman term.
Bragg, Kim, and Rubin (2005) also investigated SBPs, which they defined as “transition
and outreach programs designed to provide assistance to high school juniors and seniors who
demonstrate interested in attending college, or to prepare recent high school graduate and

38
incoming college freshmen for college course work and college readiness” (p. 15). They stressed
that these programs are especially important for racial and ethnic underrepresented students
and/or low income students who may need extra help in transitioning from high school to
college.
Many institutions use SBPs to assist underrepresented students in the STEM fields, and
these are well documented in the literature (Bayles, Morrell, & Spence, 2006; Bayles, Spence, &
Morrell, 2004; Brannan, & Wankat, 2005; Boyer & Bayles, 2005; Chapman & Logan,1996;
Coppula,1997; Dale & Zych, 1996; Diefes-Dux, 2006; Dimitriu & O’Connor, 2002; Flecter,
Newell, Newton, & Anderson-Rowland, 2001; Fletcher, & Anderson-Rowland, 2000; Hendley,
1997; Hudspeth, & Aldrich, 2000; Nagchaudhuri & Singh, 2001; Ohland & Collins, 2002;
Ohland & Crockett, 2002; Waller & Watford, 2004; Wang, Velasquez-Bryant, Adams,
Batchman, Cantrell, Jacobson, E., et al., 2004; Varde, 2004; White, Curtis, & Martin, 2001).
However, many of the papers reviewed were not found in the scholarly journals. This
demonstrates a need for a study.
Sharp, Kleiner, and Frechtling (2000) investigated several federally funded programs that
promote participation of underrepresented college students in the STEM fields. One program
that has been particularly successful is the Louis Stokes Alliances for Minority Participation
Program (LSAMP), which is funded through the National Science Foundation (NSF). According
to the NSF (2007) website,
This program is aimed at increasing the quality and quantity of students successfully
completing science, technology, engineering and mathematics (STEM) baccalaureate
degree programs, and increasing the number of students interested in, academically
qualified for and matriculated into programs of graduate study. LSAMP supports

39
sustained and comprehensive approaches that facilitate achievement of the long-term goal
of increasing the number of students who earn doctorates in STEM fields, particularly
those from populations underrepresented in STEM fields. The program goals are
accomplished through the formation of alliances. Phase I awards place emphasis on
aggregate baccalaureate production. Phase II awards augment the Phase I emphasis with
attention to individual student retention and progression to baccalaureate degrees. Phase
III awards augment the Phase I and Phase II with attention to aggregate student
progression to graduate school entry.
Sharp, Kleiner, and Frechtling identified the following components as being critical to the
program’s success: (a) summer bridge experience, (b) research experience, (c) mentoring, (d)
drop in center, (e) caring staff, and (f) alliance structure. In 2001, nearly 22,000
underrepresented students who were enrolled in LSAMP institutions earned bachelor's degrees in
STEM fields.
The Meyerhoff Scholars Program at the University of Maryland was developed to
increase the number of underrepresented students pursuing a graduate or professional degree in
the science and engineering fields. In examining this program, Maton, Hrabowski, and Schmitt
(2000) used both quantitative and qualitative methods to measure undergraduate education
outcomes. For example, they studied bachelor-level retention and graduation rates and grade
point averages in science, engineering and mathematics courses. They also conducted interviews
with the students, many of whom reported that they developed close, supportive relationships
with other participants, which helped to sustain them in the sometimes unfamiliar and
challenging college environment. Using a comparison group and MANCOVA analysis, the
researchers demonstrated that Meyeroff student performed significantly higher on science,

40
engineering, mathematic assessments. Maton, Hrabowski, and Schmitt concluded that a well
designed transitional program could increase the retention and graduation rates of African-
American students in engineering, science, and mathematics, which they positively correlated to
the increased enrollment of these students in graduate and/or professional programs.
Ackerman (1991) examined the benefits of a SBP at the University of California Los
Angeles (UCLA) for underrepresented and low income students. The researchers used
quantitative and qualitative data from the summer bridge cohort of 1988 that reflected their
academic performance during their first two quarters at UCLA, as well as attitudinal survey
information. Chi-square tests were run to determine if there was a difference between the types
of students that returned the survey. The researchers found no significant differences. The
results of the study demonstrated that with a strong curricular component, an SBP can assist
students transition and successfully adjust to college.
Gold, Deming, and Stone (1992) investigated another bridge program at Georgia State
University. As background, in 1984 six institutions across the state instituted SBPs when the
University System of Georgia was found to be in noncompliance with the 1978 Desegregation
Plan. The Georgia Board of Regents implemented the bridge programs, which enabled up to 50
students to participate in the various courses (e.g., mathematics, computer training, reading, and
composition, etc.) and related activities (e.g., multicultural opportunities, study skills remediation
and seminars, etc.). Extensive evaluations were conducted on the program’s effectiveness.
Students reported that the program made them feel more confident and improved their learning
skills. With regard to quantitative outcomes, one-year retention rates of African-American
students revealed that, on average, 90% of the bridge students remained in school, compared to
67% of the regularly admitted African-American students.

41
Rita and Bacote (1997) reported on the benefits of college discovery SBPs for
underrepresented and low-income pre-freshmen at Bronx Community College (BCC). The
program provided six weeks of rigorous instruction in mathematics, English composition, and
reading comprehension. Students also received counseling, learning skills seminars, and
tutoring. The results of the study proved that African-American students’ self-confidence and
social/cultural adjustment at BCC increased after participating in the SBP. Overall, 95 % of the
students agreed that the program facilitated their transition to college life.
Robbins and Smith (1993) evaluated an enhancement program for 193 entering majority
and underrepresented university freshmen at a predominantly White southeastern university.
The one-credit hour program was held for 10 weeks and provided information on campus
resources, study skills, and university procedures. Students were also afforded opportunities to
interview faculty members and visit the campus career center as part of the program. The
investigators used a 2X2 ANCOVA to assess the effects of group membership and ethnicity on
the resulting course satisfaction survey scores. They found that although sex as a covariate was
non-significant, underrepresented students were significantly higher “satisfaction with the course
and greater knowledge and use of university resources” (p. 513) when compared to White
students.
Another SBP for disadvantaged students was examined by Bundy (1993). The Counselor
Tutorial Program at Purdue University was designed in 1971 to assist high-risk freshmen with
engineering courses generally perceived as difficult (e.g., calculus, chemistry, and physics).
Although the program was initially developed for underrepresented students, it has since become
open to any student in need. As a result of longitudinal data gathered from the study, Bundy
found a direct correlation between first term grade point average and graduation. He also

42
reported that underrepresented students earned double the number of A’s in courses when
compared to the majority students.
Garcia (1991) reported on a system-wide SBP conducted at the California State
University. The four to six week residential program, which convened weekly in a classroom
setting, was designed to enhance the academic performance of its students across a general
education curriculum (engineering, biology, history, public speaking, etc.). Resulting data
demonstrated that 85% of first-year students who participated in the program eventually enrolled
in at least three consecutive terms. Also, Garcia reported that the SBP enhanced
underrepresented student retention and raised freshmen retention rates for the third and fourth
cohort.
Underrepresented Students in Higher Education: Pre-College Factors
Doing well as a freshman in a college of engineering can be difficult for students of any
ethnic background. However, it can be especially difficult for underrepresented students. For
example, Kahlenberg (2004) reported a study in which she assessed the reading and math skill
levels of underrepresented students (especially Latinos and African-Americans) in the 12th grade.
She stated that, on average, their performance in these two areas was comparable to the
performance of White students at an 8th grade level. Moreover, the NSF (2006) has reported that
many high school students both in mathematics and science do not achieve “proficient”
performance levels. This, of course, translates to performance difficulties in college—and as
noted above—especially for underrepresented students at PWIs.
Many pre-college factors are responsible for poor persistence rates among low-income
students and underrepresented students (Choy, 2002; Kahlenberg, 2004; National Academy,
2007). One such factor relates to a lack of sufficient resources in their secondary education

43
systems, including the shortage of underrepresented teachers. “Teachers can and do affect
students’ academic preparation, opportunities to learn, self-esteem, and motivation to achieve.
Teacher's’ expectations for students are largely influenced by their beliefs about race, ethnicity,
and social class” (McDonough, 2004, p. 15). Statistically, the numbers are quite startling. The
National Center for Education Statistics (2003) reported that, on average, 84% of teachers are
White, 8% are African-American, 75% are women, and 25% are men. This underrepresentation
(especially by African-American male K-12 teachers) has had a devastating impact on African-
Americans attending public secondary institutions.
Moreover, research shows that secondary education teachers tend to be less well prepared
for their profession. For example, the NSF (2006) indicated that “college graduates who became
teachers took fewer rigorous academic courses in high school, had lower scores on 12th grade
achievement tests, scored lower on college entrance examinations, and graduated from less-
selective colleges”(p. 2). In addition, the report stated that only 17% and 28% of math and
science teachers, respectively, were fully credentialed in those areas.
One critical impact of these statistics is the lack of mentoring that is available for
African-American students from African-American teachers, a relationship that has been proven
to have a highly positive influence (Choy, 2002; Kahlenberg, 2004; National Academy, 2007).
Because most K-12 teachers are middle-class, White women, they are less capable of truly
relating to the experiences and issues of many African-American students and what they bring to
the classroom (Howard, 2006).
Another resource scarcity that impacts pre-college success is inadequate facilities and
equipment for instruction. If secondary institutions do not provide or have the proper
educational tools, subject matter expertise, or equipment resources, this will hinder the progress

44
of students when they attend college (Darling-Hammond, 2004; Oakes, Joseph, & Muir, 2004).
For example, many high schools in low income areas do not have college counseling centers,
provide opportunities to visit college campuses, or even receive visits from college recruiters
(Kirst, 2004; Oakes, Joseph, & Muir, 2004). If students were given a better sense of what
college was like, they would be more likely to apply. Moreover, they would be more likely to
transition successfully than students who were completely unfamiliar with the expectations of
college.
Another pre-college factor is the inconsistent experiences of K-12 students.
Unfortunately, this is virtually unavoidable in a country whose secondary education performance
standards vary from state to state, city to city, and even school to school—especially in the case
of public vs. private education. Moreover, students mature at different levels cognitively and
socially, which certainly has an impact on their rates of learning. Kirst (2004) maintained that
there is a miscommunication about the skills that high schools student should possess in order to
be successful in college. In other words, while a student may complete high school with all of
the required credentials, they may still be academically under-prepared for college-level courses.
Underrepresented Students in Higher Education: College Factors
Once an underrepresented student enters an institution of higher education (especially a
PWI), they are subject to a number of academic and social challenges that could impede their
scholastic persistence (Tinto, 1993). This section will examine the various factors that could
negatively impact an underrepresented student’s goal of earning an undergraduate degree.
As discussed earlier, many researchers have discussed the issue of retention among
college students, and especially among underrepresented groups. Tinto (1993), for example,
identified two primary factors associated with college retention: academic integration and social

45
integration. Successful academic integration occurs when a student develops intellectually and is
able to earn good grades. Social integration refers to the various interactions that a student
experiences with peers, staff/administrators, and faulty. These concepts are interrelated and both
contribute to retention. As an example, a student involved in extracurricular activities (e.g., club
sports, academic clubs) would be more likely to achieve social and academic integration (Tinto,
1993) than a student who was not.
Orfield and Paul (1988) studied enrollment patterns in five major metropolitan areas and
identified four barriers impeding underrepresented students’ access to two- and four-year
institutions:
1. Segregation in schools
2. High college tuition and fees
3. Inadequate assistance for unprepared students
4. A lack of commitment to equal opportunity for every student enrolled in colleges and
universities.
With regard to access to and retention in colleges of engineering, there are additional
factors that impede the progress of underrepresented students (Swail, Redd, & Perna, 2003;
Tinto, 1993). Apart from poorer academic performance—especially in engineering prep
courses—underrepresented students have tended to score lower on SATs than their White and
Asian counterparts. The literature also reported lower success rates for underrepresented students
in advanced placement courses that are critical for admittance to colleges of engineering. These
findings corroborate those of Anderson (2006), Choy (2002) and Kirst (2004), who reported that
a reliable predictor of a student’s successful completion of the bachelor’s degree is the
rigorousness and value of his or her secondary education. In fact, Swail, Redd and Perna stated

46
that completing a more rigorous curriculum in high school is a stronger predictor of success than
test scores such as the SAT.
Another motive for underrepresented students abandoning their intended engineering
majors, or even dropping out altogether, is the lack of their involvement within the college or
within the institution as a whole. Astin’s (1999) seminal work on student involvement strongly
linked the physical and psychological energy that a student dedicates to the university experience
to increased retention and graduation rates. Students have to be engaged in their academic
setting and have a personal investment in the college experience to fully embrace it. This
requires the student to seek assistance when needed, be involved with non-academic activities
(e.g., sports or service activities), as well as be active in academic extracurricular activities
(Astin).
A final factor that helps explain why underrepresented students withdraw from
engineering degree programs is the campus climate of the institution. Swail, Redd, and Perna
(2003) stated that institutional fit and campus integration—although important for all students—
are essential for underrepresented students. Student who are uncomfortable in an academic
setting are unlikely to interact in any significant way with peers, faculty and administrators,
thereby compromising their academic progress.
Zhang et al. (2002) examined retention rates among engineering students between 1987
and 2000. The researchers used six independent variables (ethnicity, gender, high school grade
point average, SAT math scores, SAT verbal scores and citizenship status) to measure graduation
and retention rates. The researchers used data from eight colleges of engineering. Students
included in the study were only those who had matriculated. The researchers did not include a
difference between first-time freshmen and transfer students. On average, the cohorts from 1987

47
through 1994 had 25-54% graduation rates. Zhang et al. used logistic regression and found that
retention was significantly correlated with all six predictors. Specifically, high school grade
point average and SAT math scores were positively correlated with retention at all eight
institutions. Also, the researchers indicated that being a female or African-American was
negatively correlated with retention.
Summary
In summary, the literature on the evolution of transitional programs revealed that many
seminal legislative statutes have helped to create retention programs such as SBPs. The review
provided an overview of information on the difference in transitional program and intervention
programs and how both programs co-exist to assist the various types of students to adjust to the
rigors of college. The conceptual model (See Figure 1) demonstrates how the elements
interrelate. A mix-method was employed to gather both quantitative and qualitative data. The
data was analyzed independently to provide a rich context to investigate the complexity of the
issue. Finally, this review confirmed the very real issues that have and continue to impede
college students at secondary and post-secondary levels of their education.

48
CHAPTER THREE: METHODOLOGY
Introduction
The purpose of this study was to investigate the academic, social, goal commitment/
institutional attachment, and personal-emotional adjustment of participants versus non-
participants in a SBP for engineering students at a R1 predominantly White institution (R1 PWI)
in the mid-southeastern region of the United States. The Academic, Social, Personal-Emotional,
and Goal Commitment/Institutional Attachment subscales of the Student Adjustment to College
Questionnaire (SACQ) were used for this study (Baker & Siryk, 1999). The research addressed
the following questions:
1. How do participants versus non-participants in an engineering Summer Bridge
Program rate their Academic Adjustment (AA), Social Adjustment (SA), Personal-
Emotional Adjustment (PEA), and Goal Commitment/Institutional Attachment
(GCIA) during their first term of college?
2. Is there a significant difference in how the participants versus non-participants in an
engineering Summer Bridge Program rate their Academic Adjustment (AA), Social
Adjustment (SA), Personal-Emotional Adjustment (PEA), and Goal
Commitment/Institutional Attachment (GCIA) during their first term of college?
3. Do the Academic Adjustment (AA), Social Adjustment (SA), Personal-Emotional
Adjustment (PEA), and Goal Commitment/Institutional Attachment (GCIA)
experiences of participants versus non-participants differ by race or gender?
4. Is there a significant difference in participants versus non-participants in fall term
college grade point average with respect to retention after their first year in the
college of engineering and the institution?

49
5. What were the benefits and difficulties with participating in Summer Bridge Program
according to participants and the director of engineering support programs?
This chapter describes the research design, research site, participants, sample selection,
instrumentation development, and the procedures used to collect and analyze the data.
Research Design
The research design for this study featured a mixed methodology approach involving
both qualitative and quantitative components. Table 3.1 identifies the approaches to align the
research questions with the methods. Although designed to accomplish different goals, Patton
(2002) asserted that both research methodologies are complementary and can be combined
effectively. By conducting qualitative research, an investigator can illuminate the individual
differences between subjects in a study, as well as create a more detailed portrait of the findings,
while a quantitative design provides more generalizable data.

50
Table 3.1. Summary of the Phase of this Research Aligned with Research Questions
Phase of the Research
Research Phase Questions
Participants Type of Data Collection
Instruments/Methods Used
Data Obtained Data Analysis
1 RQ 1 RQ 2 RQ 3 RQ 4
67 summer bridge participants 67 non-summer bridge participants
Quantitative Demographic Questions Student Adjustment College Questionnaire
Demographic Information Student Adjustment College Questionnaire Data(Academic, Social, Personal Emotional, Goal Commitment and Institutional Adjustment)
Median Mean Standard Deviation P-Plots Mann-Whitney T-test
2 RQ 5 1 Director of Engineering Support Programs 43 summer bridge students
Quantitative Formative Evaluation Questionnaire
Activity Evaluation Cronbach Alpha Likelihood Ratio Pearson Test Mean Standard Deviations Confidence Intervals Levels Tukey-Kramer
1 Director of Engineering Support Programs and 12 summer bridge students
Qualitative Open Ended Questions Interview and Focus Groups
Content Analysis
*RQ means research question followed by the number

51
Creswell (2003) provided a convincing rationale for the use of quantitative research
methods. In short, he maintained that quantitative research allows a researcher to identify
variables and assess their relationships in ways that are measurable and reliable. Quantitative
research also enables an investigator to formulate unbiased and viable causal explanations for a
given phenomena. This can be done through the use of formal instruments that reduce data to
statistical indices. One format that employs quantitative research methods is surveying
methodology (Patton, 2002).
Merriam and Simpson (1995) maintained that surveying is among the most common
data-gathering techniques. Surveying, which can be conducted through oral interviews or via the
use of written instruments, is an effective tool for eliciting useful information from a study’s
participants. For this study, the researcher used written questionnaires to examine the adjustment
of students in engineering.
Merriam and Simpson (1995) also discussed the two types of written questionnaires,
closed and open, both of which have certain advantages as well as limitations as effective survey
tools. A closed questionnaire helps the researcher to guide the participants throughout the
survey. Typically, a closed questionnaire will have related lines of thought associated with the
research topic. On the other hand, an open questionnaire allows participants more freedom in
responding to survey questions, which Merriam and Simpson referred to as “a wider latitude of
possible responses” (p. 147). The advantage of utilizing an open questionnaire is that it can then
help the researcher develop clear and concise questions for a subsequent closed questionnaire,
which forces participants to pick between a limited number of choices on the survey instrument.
The challenge of using this type of questionnaire is that it forces the researcher to develop a

52
system to code the responses and categorize the data in order to be able to interpret the variety of
responses.
Researchers have also discussed the variety of ways in which surveys can be
administered, as well as their potential assets and drawbacks. For instance, Babbie (1990) and
Rossi, Wright, and Anderson (1983) confirmed that a self-administered on-line survey can be an
effective way for capturing survey data. Bourque and Fielder (1995) later reaffirmed the reports
of Babbie and Rossi et al. in describing the various advantages and disadvantages of surveys as
data collection devices. Some important advantages for using surveys include the fact that (1)
the instructions are consistent for all participants, (2) they are useful in pretesting, and (3) the
confidentiality of respondents can be maintained. Conversely, there is also a trio of important
disadvantages in connection with the use of surveys: (1) there is no control over a participant’s
response (especially true in the case of open ended questionnaires), (2) it can be difficult to
investigate sensitive topics in a survey, and (3) surveys can be expensive to develop and
administer.
In addition to the quantitative data collected for this study, the researcher also included a
qualitative component, which helped to answer the “how and what” lines of inquiry (Creswell,
2003). According to Patton (2002) and Rossman and Rallis (2003), the aim of qualitative
research is to understand the ways in which people create, construe, and give significance to
occurrences they have experienced in their lives. In an earlier study, Lincoln and Guba (1985)
stated that qualitative research allows an investigator to do the following: a) use a natural setting
for the collection of data, b) use humans as instruments for a study, c) conduct purposeful
sampling, d) engage in inductive analysis, and, e) generate thick and rich descriptive reports.
Moreover, Lincoln and Guba discussed “prolonged engagement” and “persistent observations”

53
in connection with qualitative research. These terms refer to the necessity of spending sufficient
time with participants in order to make sure that events and stories align.
Another important component of qualitative research involves the triangulation of data,
which corresponds to the use of a variety of examples to connect and illustrate what is being
examined. According to Patton (2002), triangulation of data is essential to research because it
will “demonstrate that different data sources or inquiry approaches yield essentially the same
result” (pg. 248). In other words, triangulation is an authoritative way of understanding and
gaining insight, making implications, drawing conclusions, and contributing to the
trustworthiness of the resulting data (Patton, 2002; Rossman & Rallis, 2003).
For this study, the researcher administered a Summer Bridge Inventory (SBI) to the
participants, which consisted of two parts. The first part was the rating survey, while the second
portion of the SBI involved two focus group meetings with participants, as well as an interview
with the director of support programs that included the use of semi-structured questions. The
purpose for the two qualitative methods was to provide an additional descriptive component of
the SBP. Specifically, it enabled participants (both the students and the director) to describe
their experiences in their own terms, which then aided the researcher in identifying salient
themes with respect to adjustment. These data were captured during the Spring 2008 term.
As noted, two focus group sessions were held, each involving summer bridge
participants. In general, the use of focus groups encourages participants to freely express their
beliefs, attitudes and emotional reactions to a particular topic—in this case, college adjustment.
To be most effective, focus groups should be held on the participants’ “home turf” so that they
feel comfortable in expressing their thoughts openly. Focus groups are also important in that

54
they can encourage participants to build on each other’s statements/recollections and the
researcher is able gather rich, thick data (Rossman & Rallis, 2003).
As noted, the focus groups conducted in this study provided the researcher with greater
insights with respect to the participants’ adjustment processes—and especially what activities or
events were most effective in a student’s adjustment. Despite the obvious advantages of
acquiring rich personal data from focus group sessions, there are several important limitations
associated with this method of data collection that must be noted. The first one deals with bias.
For example, an interviewee can be biased to the interviewer due to his or her relationship to the
study (Patton, 2002). In addition, an interviewee can be biased to the study if and when the
subject feels the need to tell the interviewer what he/she wants to hear. A second limitation deals
with the tendency of participants to identify with each other and parrot group responses rather
than promulgate a response that could be in opposition to other focus group members.
These limitations were overcome in three primary ways. First, a skilled moderator was
used who was able to recognize these various forms of bias due to their previous educational
training. Second, member checks were conducted, which required group members to verify the
information obtained from the focus groups. The researcher allowed the participants to review
the transcripts to check the data for accuracy. Finally, this study also utilized a peer debriefer. A
peer debriefer is an individual who can review and code the transcripts along with the researcher
for parallel information. The peer debriefer for this study had a doctoral degree in qualitative
measures.
Participants and Sample Selection for SACQ
The research site was Virginia Tech, a Research I Predominately White Institution
located in the mid-southeastern region of the U.S. At the time of this study, the institution had

55
an enrollment of approximately 22,000 undergraduates, with 5,700 of those enrolled in its
College of Engineering. Of those 5,700 engineering students, about 1,300 were first-year
students.
A total of 134 participants were recruited for this study, all of whom took the Student
Adjustment to College Questionnaire (SACQ) survey. This number included 67 first-year
engineering students who participated in the College of Engineering’s 2007 SBP, and an equal
number of non-participants. Two requirements guided the identification of participants for the
study. The first requirement was that participants had to be first-year college students in
engineering. The second requirement was that participants had to be between 16-20 years old,
principally because the SACQ was validated based on participants in this age group (Baker &
Siryk, 1999). The participants for SACQ portion of this study were closely matched based on
math SAT scores, gender and race. To increase the participation and response rate, the
researcher developed an incentive for contributing to the study. Specifically, two $100 dollar gift
certificates for the university bookstore were raffled to two students who participated in the
study.
Forty-two first-year engineering students from the SBP participated in the SBI written
portion of the survey. Of those 42 students, 12 also served as focus group members. The
director of engineering support programs participated in the SBI written portion, and also was
interviewed by the researcher. This individual was hired to increase the number of
undergraduate students graduating in engineering, since she completed all three degrees at
Virginia Tech and worked several years in the field of engineering and higher education. And
indeed, the director was responsible for many support programs that have impacted the increase
of students graduating in engineering.

56
Instrumentation Development
SACQ
The Student Adjustment to College Questionnaire (SACQ), which features a user’s
manual (Baker & Siryk, 1999), was used in this study. Designed to measure adjustment to
college, the SACQ was first published in 1989 and is now maintained and updated by Western
Psychological Services2. Typically, the SACQ is administered several weeks into the academic
term once students have had an opportunity to be exposed to the various aspects of the college
environment (Baker & Schultz, 1992a, 1992b).
The SACQ survey consists of 67 questions, requiring participants to identify their
responses based on a scale from 1 (“doesn’t apply to me at all”) to 9 (“applies very closely to
me”). Students were asked to provide their subjective replies based on their feelings at the time
they took the survey.
The entire SACQ instrument was employed in this research. The instrument is composed
of 4 scales. The Academic Adjustment, Social Adjustment, Personal-Emotional Adjustment, and
Goal Commitment/Institutional Adjustment. The scales fit the research purpose and questions
related to student adjustment to college in ways that could later be coded into quantitative data.
A copy of the SACQ that was used in this study is shown in Appendix C.
The first section of the survey required participants to provide demographic data, which
generated an overall description of the sample. These demographic questions were designed and
based on the literature Astin (1993) and Tinto (1993). The ten general demographic questions are
listed in Appendix D.
2 Western Psychological Services,12031 Wilshire Boulevard, Los Angeles, CA 90025-1251,www.wpspublish.com

57
The Academic Adjustment (AA) subscale contains 24 items associated with higher
education learning experiences. This subscale is divided into four clusters: (1) motivation, (2)
application, (3) performance, and (4) academic environment. Motivation corresponds to a
student’s feelings concerning educational goal setting and being in college. Application refers to
the initiative that a student takes in achieving academic goals. Performance indicates the
effectiveness of a student’s academic performance. Academic Environment signifies the
institutional environment in which a student performs and what that environment has to offer to
the student. Examples of the AA statements associated with each of these four clusters are
shown below (Baker & Siryk, 1999).
1. I know why I’m in college and what I want out of it. (Motivation)
2. I have been keeping up to date on my academic work. (Application)
3. I am finding academic work at college difficult. (Performance)
4. I am satisfied with the number and variety of courses available at college. (Academic
Environment)
The Social Adjustment (SA) subscale contains 20 items associated with the social aspects
of a higher education environment. Similar to the AA subscale, the SA subscale is divided into
four clusters: (1) general, (2) other people, (3) nostalgia, and (4) social environment. General
signifies the ease with which students engaged in social activities. Other People corresponds to
whether or not students develop relationships with other individuals within the university setting.
Nostalgia refers to the social rearrangement of a student’s surroundings and how well he or she
adjusts to being away from home. Social Environment corresponds to the fulfillment a student
felt with the college experience. Examples of SA statements associated with each of these four
clusters are shown below (Baker & Siryk, 1999).

58
1. I am very involved with social activities in college. (General)
2. I have had informal, personal contacts with college professors. (Other People)
3. Lonesomeness for home is a source of difficulty for me now. (Nostalgia)
4. I am pleased now about my decision to attend this college in particular. (Social
Environment)
The Personal-Emotional Adjustment (PEA) subscale contains 15 items associated with
the psychological and physical aspects of the students. The PEA subscale is divided into two
clusters: (1) psychological and (2) physical. Psychological signifies the student’s welfare in
terms of either comfort or degree of distress. Physical corresponds to bodily responses.
Examples of PEA statements associated with each of these two clusters are shown below (Baker
& Siryk, 1999).
1. I have been feeling tense or nervous lately. (Psychological)
2. I have felt tired much of the time lately. (Physical)
The Goal Commitment/Institutional Adjustment (GCIA) subscale contains 15 items
associated with students’ dedication to their educational goals and their institutional connection.
Similar to the PEA subscale, the GCIA subscale is also divided into two clusters: (1) general and
(2) this college. General signifies one’s overall satisfaction with being in college. This college
corresponded to how students feel about attending their college. Examples of GCIA statements
associated with each of these two clusters are shown below (Baker & Siryk, 1999).
1. I am pleased now about my decision to go to college. (General)
2. I wish I were at another college or university. (This College)
Table 3.2 identifies the number of items for each full scale and subscales.

59
Table 3.2.
An Overview of the Items for the SACQ Full Scale and Subscales
Scale Number of Items Items that Overlap on a Scale
Academic Adjustment (AA) 24 Item 36 appears on GCIA
Social Adjustment (SA) 20 Items 1, 4, 16, 26, 42, 56, 57,
65, appears on GCIA
Personal-Emotional Adjustment (PEA) 15 -
Goal Commitment/Institutional Adjustment 15 Items 1, 4, 16, 26, 42, 56, 57,
65, appears on SA
Item 36 appears AA
Full Scale 67 -
Note: Items 53 and 67 are not scored on any scale but a part of the Full Scale. There are 9 items that are utilized on several scales which are noted above. Between AA, SA, PEA, and GCIA there are total of 77 items overall, but if you subtract the overlapping 9 items you have 65 items plus items 53 and 67 would give you a grand total of 67 items for SACQ.
It should be noted that there was some overlap between the subscales. This was
purposefully built in because the constructs were not mutually exclusive. Specifically, there is
one question that was used in both the AA and GCIA subscales (see Table 3.1), and eight
questions used in both the SA and GCIA subscales (see Table 3.1). Baker and Siryk (1999)
maintained that items from the other subscales were empirically driven from the use of the
original 52-item version of the SACQ. This empirical evidence was based on attrition in the two
samples of freshmen examined at Clark University where the SACQ was developed.
Moreover, there were two questions that did not add to the four subscales mentioned
above, but contributed to the Full Scale. These questions were:
1. I feel I have good control over my life situation at college.
2. I feel confident that I will be able to deal in a satisfactory manner with future
challenges here at college.

60
Baker and Siryk (1999) cautioned researchers not to use the full scale on its own because the
four subscales provide distinctive information about college student adjustment and can provide
important associations.
SBI
To further investigate the topic of college adjustment, the researcher designed a survey
that was based on the SACQ survey, but tailored to specifically examine the impact of summer
bridge activities. This survey was termed “The Summer Bridge Inventory” (SBI) (see Appendix
E). In order to ensure that the instrument was clear and concise and would yield data that was
pertinent to the study, the researcher’s committee members suggested a number of modifications
to the original design before the SBI could be administered. Specifically, the committee
members recommended that the researcher create a matrix in order to capture data that would
provide information about the summer bridge activities. The committee members also suggested
that the SACQ instrument be used as a framework to examine the summer bridge activities.
The development of the SBI took several months. Two doctoral students assisted the
researcher in brainstorming and asking relevant questions. The doctoral students were utilized as
a springboard for exchanging ideas and suggestions throughout the development of the SBI.
Also, the researcher received feedback from committee members about the structure and layout
of the instrument. The researcher implemented the committee member suggestions and submitted
the SBI for final review, after which it was reviewed by a team of experts at Virginia Tech’s
Department of Statistics. The experts examined the SBI several times, indicating that although it
was lengthy, it would likely reveal some interesting results. The researcher also utilized the
Dept. of Statistics to assist in examining the data for the SBI.

61
One final meeting was held with committee members to evaluate the revised SBI, after
which it was approved for a pilot study with former summer bridge participants. Based on
Patton’s (2002) assertion that a pilot study is useful for assessing the reliability and validity of an
instrument, a pilot study of the SBI was conducted in January 2008. The cohort that completed
the SBI included a sample of past SBP participants from an array of engineering academic
disciplines (N=12) and the director of support programs (N=1). The pilot study participants
provided important feedback on the instrument, especially with respect to layout and the time
needed to complete the SBI. Subsequent revisions were made to the instrument based on their
comments.
The SBI was composed of two parts: the quantitative inventory instrument, and the
qualitative focus groups and interview. The inventory consisted of the 29 summer bridge
activities. These activities were rated, ranked and grouped around several sections: 1) Academic
Adjustment, 2) Social Adjustment 3) Personal-Emotional Adjustment and 4) Goal Commitment
and Institutional Adjustment. In addition to completing the required demographic survey, the
participants were asked to rate their experiences with the 29 activities of the SBP, and
rank/indicate the dominant subscale for each activity. The rating was between 1 (“does not relate
well to me”) and 5 (“relates well”) for the first 4 elements of the SBI.
The first section of the SBI was devoted to Academic Adjustment. This section consisted
of 29 activities that drew out data for the following four clusters: motivation, application,
performance and academic environment. The definition for the Academic Adjustment clusters is
located in Appendix E. The second section of the SBI was devoted to Social Adjustment. This
section consisted of 29 activities that drew out data for the following four clusters: general, other
people, nostalgia and social environment, which are defined Appendix E. The third section of

62
the SBI was devoted to Personal-Emotional Adjustment. This section consisted of 29 activities
that drew out data for the following two clusters: psychological and physical, which are defined
in Appendix E. The fourth section of the SBI was devoted to Goal Commitment and
Institutional Adjustment. This section consisted of 29 activities that drew out data for the
following two clusters: general and this college, which are defined in Appendix E.
The fifth section of the SBI required participants to identify the dominant subscale for
each activity (see Appendix E). The subscales were assigned a number, as follows:
1. Academic Adjustment
2. Social Adjustment
3. Personal-Emotional Adjustment
4. Goal Commitment and Institutional Adjustment
The participants could only assign one number to each activity.
The revised SBI was then used in the full study. First, all the summer bridge participants
received an email introducing the SBI and explaining the need for their participation. Forty-two
participants agreed to take part in the study. In March 2008, the researcher distributed hard
copies of the SBI to study participants in a neutral, comfortable setting on campus (an
engineering building). The interview with the director of engineering support programs was
conducted in May 2008. The researcher collected and inputted the data into Excel, which
enabled him to have an electronic version of each participant’s data in order to subsequently
import in several statistical data packages. This process took approximately two weeks, after
which two other individuals double-checked his data entry for accuracy.
The final part of the SBI was comprised of the focus groups and the interview. It should
be noted that during the pilot study phase, the researcher conducted a focus group with the past

63
summer bridge participants to make sure the structured questions were clear and concise. The
suggestions and feedback from the pilot study participants were implemented.
Reliability and Validity
It is vital to understand the reliability and validity of any instrument in order to properly
assess the resulting data—which is why the area of survey reliability has been so broadly
considered. In general, reliability refers to the extent to which a measurement instrument yields
consistent, stable, and uniform results over repeated observations or measurements under the
same conditions each time (Creswell, 2003). Stated more simply, Fink (1995) asserted that a
survey is reliable if it is relatively free of measurement error. Internal consistency, also referred
to as homogeneity, is the extent to which the survey measures the same characteristic (Fink).
Internal consistency allows interpretation of the data and helps determine the relationships
between variables.
SACQ Reliability
The SACQ instrument was utilized in this study, since it has been used reliably with a
variety of different cohorts for a number of years at different research sites (Baker & Siryk,
1999). The SACQ instrument was developed to assess how well students acclimate to the
university environment. Its comprehensiveness makes it useful for both basic research and for
more specific applications, such as in the area of college counseling. With respect to the study
described herein, there were several types of reliability data to be considered, since the different
variables used in the survey were not consistent for every student. In fact, variables can typically
change due to circumstantial and environment changes (Baker & Siryk). Robert and Siryk used
several statistical tests to assess the reliability of the SACQ. One test is one factor principal
components analysis (Asher, 2007), which is a variable reduction technique used when variables

64
are highly correlated. It is commonly used for large sample analysis. When applied to the
SACQ, the analysis displayed a large loading of respondents for every variable. This technique
is useful in summarizing the correlation between variables, as well as displaying which survey
subscales are somewhat independent of each other. Table 3.3 shows the one factor principle
component analysis for the SACQ for selected types of colleges and universities.
Table 3.3.
One-Factor Maximum Likelihood Solutions and Principal Components from Intercorrelations of
SACQ Subscale Scores for Selected Colleges
Maximum Likelihood Loadings
Sample n Academic Adjustment
Social Adjustment
Personal-Emotional Adjustment
Goal Commitment/ Institutional Attachment
Percent Variance
Auburn University
49a 96b
.59
.53 .76 .87
.39
.43
.98
.97 51
54.2
Brandon
University 780 .59 .76 .39 .98 51
Salem University 121 .56 .82 .50 .97 54.4
University of
Maryland 104 .25 .92 .38 .88 46.2
aAfrican-American Students bWhite Students (Adapted from Baker & Siryk, 1999, pgs. 42-44)
A second method used was Cronbach alpha, which is a statistic that is common used to
assess the internal consistency reliability of a psychometric tool, as well as how well a set of
variables measures a one-dimensional underlying construct (Hinkle, Wiersma, & Jurs 1998). In

65
1984, the internal consistency for the 52-item version of the SACQ was .82 to .87 for the
Academic Adjustment subscale, and .83 to .89 for the Social Adjustment subscale. The authors
subsequently added more items to the SACQ in order to improve the reliability of the subscales.
Internal consistency is reported for reliability. Baker and Siryk (1999) reported internal
consistency data from several different types of institutions of higher learning. The coefficient
alpha values are reported for this study. The subscales displayed high internal consistency for
the coefficient alpha. Specifically, the coefficient alpha for the Academic Adjustment subscale
ranged from .90 to .82. The coefficient alpha for the Social Adjustment subscale ranged from .91
to .73. The Personal-Emotional Adjustment subscale ranged from.89 to .78. The Goal
Commitment Institutional Attachment subscale ranged from .90 to .84. The Full Scale ranged
from .94 to .89. Since, the average scores for the coefficient was .7 or higher, a highly
dependable internal consistency was indicated. Table 3.4 demonstrates the alpha coefficients for
the SACQ for various types of colleges and universities and Table 3.5 displays the internal
consistency of coefficients for critical items.

66
Table 3.4
Alpha Coefficients for the SACQ for Freshmen at Various Colleges
Sample N Academic
Adjustment
(24 items)
Social
Adjustment
(20 items)
Personal-
Emotional
Adjustment
(15 items)
Goal
Commitment/
Institutional
Attachment
(15 items)
Full Scale
(67 items)
George
Washington
University
166 .86 .86 .78
.87 .89
University of
California
65 .85 .91 .82 .90 .94
University of
Colorado
141 .85 .85 .79 .87 .91
University of
Mississippi
125 .85 .85 .82 .84 .93
Worcester
Polytechnic Inst.
262 .86 .89 .82 .88 .94
York University 34a
28b
.82
.90
.73
.79
.89
.87
-
-
.90
.93 aLearning disabled bNon-learning disabled (Adapted from Baker & Siryk, 1999, pg 36)

67
Table 3.5
Internal Consistency Coefficients for Critical Item
Cluster Number of
Items
Term 1
Total
(N=1075)
Term 2
Total
(N=607)
Academic Adjustment
Motivation
Application
Performance
Academic Environment
6
4
9
5
.74
.71
.74
.74
.78
.77
.73
.74
Social Adjustment
General
Other People
Nostalgia
Social Environment
7
7
3
3
.84
.67
.74
.60
.85
.67
.70
.56
Personal-Emotional Adjustment
Psychological
Physical
9
6
.79
.64
.81
.66
Goal Commitment/Institutional
Attachment (GCIA)
General
This College
3
4
.77
.91
.78
.90
(Adapted from Baker & Siryk, 1999, pg 36)
SACQ Validity
Babbie (2005) referred to validity as the degree to which an instrument sufficiently
measures the construct under consideration. More recently, Asher (2007) reviewed the SACQ

68
and asserted that its validity could be determined. A key way of assessing the validity uses the
concept of intercorrelation. Simply stated, intercorrelation is the connection between two or more
items. Significant intercorrelation of elements is interpreted to mean that the items or
components are measuring the same or closely related constructs in a reliable manner. Low
levels of intercorrelation among items suggest that the construct is not being measured reliably—
that there are sources of unexplained error in the measurement.
Baker and Siryk (1999) used intercorrelation and criterion relations to show validity.
First, the researchers collected data from 21 different types of institutions and showed that
certain subscales shared questions in common. For example, the AA subscale has one item in
common with the GCIA subscale; while the GCIA subscale has eight items in common with the
SA subscale. Therefore, the intercorrelation will be higher for these paired scales (Baker &
Siryk).
Criterion relation has also been used to validate the SACQ. Criterion-related validity is
the ability to precisely evaluate one measure with another measure to demonstrate that it is valid
(Dahmus & Bernadin, 1992). The goal is to examine the relationship between a scale and
independent real-life behavior that may demonstrate the effect of the variables being assessed
(Baker& Siryk, 1999). Dahmus and Bernardin asserted that criterion validity is present in the
SACQ survey. The association between the SACQ subscales and independent real-life behaviors
and results has also been analyzed. One way that criterion-related validity was examined in the
SACQ survey was through the AA subscale. This was done with freshman-year grade point
average and the selection of students for an academic honors organization at Clark University.
The purpose of the Clark University research was to measure if students who attained higher AA
subscale scores would be more likely to demonstrate academic achievement in college. And

69
indeed, there was a significant difference between a high score on the AA subscale and academic
achievement based on their grade point average and student selection into the honors
organization (Baker & Siryk, 1999). Baker and Siryk (1999) concluded that the college students
that were well adjusted would demonstrate academic success and vice versa.
The second criterion-related validity that was examined in the SACQ survey was via the
SA subscale. One criterion involved the social activities checklist and the second criterion
measured if the student had become a residential advisor during his or her second year
(sophomore status) or third year (junior status). Baker and Siryk (1999) indicated the reason for
the “checklist was to provide an index of the extent of involvement with and commitment to, the
immediate social system of which the student is a part” (pg. 45). There was a significant
difference between the SA subscale and both criterions.
A third criterion related validity studied in the SACQ survey was through the PEA
subscale. This was assessed according to whether students at Clark University had visited the
campus psychological service center on more than one occasion. The results demonstrated that
students scoring lower on the PEA subscale were considerably more likely to seek out
psychological services.
The final criterion related validity studied in the SACQ survey was through the GCIA
subscale, which was associated with attrition. This was significantly interrelated with GCIA and
AA. The GCIA subscale level was significantly stronger than the AA subscale (Baker & Siryk,
1999).
Although the SACQ is generally acknowledged to be a valuable survey instrument, there
are several limitations associated with it. One limitation has to do with its “transparency of
purpose” (Baker & Siryk, 1999, pg. 5), which means that it would be apparent to someone taking

70
the questionnaire that it was intended to assess college adjustment. Therefore, a student could
skew his or her answers accordingly. A second limitation is that the norms were determined
from data from just one college when they first administered the 52-item survey (Baker & Siryk,
1999), which may or may not be generalizable to other institutions of higher education. A final
limitation is that the “user should be careful not to place too much interpretive value on
individual item responses” (Baker & Siryk, 1999, pg. 5). Therefore, although the SACQ has
been shown to be useful in advancing a holistic understanding of an empirical sample of scores,
responses should never be analyzed out of context.
SBI Validity
There are a variety of ways for testing validity. Rubio (2005) identified two interrelated
types of validity: face validity and content validity. While similar to content validity, face
validity relates to whether an instrument appears to be valid to its users, to the professional
personnel who make a decision on its use, and to other pilot study participants. Rubio (2005)
simplified its meaning in stating that face validity is “the extent to which a measure appears to be
valid” (pg. 495). The second validity type, content validity, requires a quantitative assessment.
Unlike face validity, content validity is usually associated with more rigorous testing, e.g., by a
board of evaluative specialists (Rubio, 2005).
For the present study, the validity of the SBI was corroborated by several means. As
discussed earlier, it was reviewed and revised by committee members, doctoral students, and
several statistical consultants. The committee members made recommendations on how to
utilize the SACQ instrument to create a matrix for the SBI. The researcher met with several
doctoral candidates to assist with the SBI. The researcher developed and devised a framework
and received feedback from committee member several times. The researcher also consulted

71
with statistical department experts for appropriate revisions. In addition, the initial pilot study
involving past participants in an SBP was also useful in improving the validity of the instrument.
SBI Reliability
The researcher also conducted estimates of internal reliability, which did not result in the
elimination of any of the SBI items. The Cronbach Alpha was used to demonstrate reliability
analysis which was conducted by SPSS 16.0. Table 4.10 documents the coefficient alpha for
each scale. As a result, the researcher decided to examine the coefficient alpha for each
subscale.
Data Collection Procedures
SACQ
The following procedures were used to conduct this study. First, the researcher received
permission from the director of the support programs to use the data from the 67-student cohort
in the Summer 2007 SBP as the “participant data.” Permission was also obtained from the
corresponding administrator who managed college-wide information to identify a matched
cohort of 67 students that would comprise the “non participant” cohort. Permission was also
granted from the Internal Review Board (IRB) to collect the necessary data for this study. An
amendment was later added to expand the participant pool to non-participants. The amendment
was approved on October 26, 2007 (see Appendix F).
To conduct this study, the researcher obtained the following information:
1. List of students names, emails, telephone numbers, and all the demographic
variables for participants and non-participants.
2. Grades assigned for the Fall 2007 Term (requested in January 2008).
3. Retention status in the institution and the department collected in Summer 2008.

72
In addition, the researcher requested permission from the director of summer programs to
conduct focus groups with the summer bridge participants, as well as an interview with the
director in order to understand their perceptions of the SBP experiences.
In October 2007, the researcher contacted Western Psychological Services (WPS) to
obtain permission to use the SACQ instrument. This was required to ensure that the on-line
survey complied in both content and format with WPS guidelines. Approval was granted, as
documented as Appendix G.
Another important aspect of the study was to ensure that the SACQ online survey would
be accessible to every student in the study, regardless of the kind of computer or browser used to
access it. To do so, the researcher met with a web designer who helped design an appropriate,
easy-to-use webpage to host the survey. This included discussions of format (color and layout),
shortcomings to avoid, and accessibility issues. Once approved by the researcher and his
committee members, the on-line survey was administered to a small group of volunteers as a
pilot study (described below). After completing the pilot study, volunteers’ comments with
respect to usability were evaluated and changes were made as needed. Throughout the study, the
researcher contacted the web designer with respect to any concerns with the on-line survey.
As noted above, the researcher conducted a small pilot study to test the survey
instrument. Ten upper-class engineering students who had previously participated in SBPs were
asked to complete the survey as “participants.” In addition, five faculty members also completed
the pilot study. The pilot study participants received an email that served as a letter of
introduction to the study. In the email, they were given the direct internet site location (URL) for
the survey, as well as a password to access the site. After they completed the survey, the

73
researcher obtained their feedback by both email and through telephone interviews—especially
their responses to the following three questions:
1. Were the instructions clear and concise?
2. How long did it take you to complete survey?
3. Where you at ease taking the survey?
The pilot study was useful because it enabled the researcher to identify problems with
data transference, as well as correct several typographical errors. Overall, the pilot study
participants indicated that the survey was clear and concise. One participant suggested a useful
change with regard to the default button for the responses; while another recommended some
phrasing changes. The pilot study participants indicated that it took them an average of 15
minutes to complete the survey.
Prior to collecting the data for the full study, the researcher received training from the
Institutional Review Board (IRB) to ensure compliance with the institution’s policies and
procedures on ethical research procedures. Once permission was given, the researcher contacted
the 134 participants who had agreed to participate in this study (67 students who took part in the
SBP and 67 students who had not). Similar to the pilot study, participants were contacted via an
emailed letter of introduction, which fully explained the study and provides the URL for the
survey (see Appendix H). The letter included information about the researcher, the rationale for
the study, and comprehensive instructions for completing the on-line survey.
A critical step in the study was to obtain the informed consent of every participant to
certify that they understood and acknowledged the benefits and risks associated with the survey.
Because the SACQ was administered online, everyone taking the survey had to click on the
button “Yes, I Understand and Continue” before they were able to fill out the demographic

74
questions associated with the SACQ survey. This informed consent form also included a
statement ensuring the confidentiality of the responses.
The study featured email reminders for anyone who had not completed the survey in a
timely way (see Appendix I). The researcher also phoned participants as needed to request that
they complete the survey. Participants were offered an opportunity to receive the results of the
study once it was completed. Importantly, participants were reassured that withdrawing from the
study at any time and for any reason would be honored without penalty of any kind.
SBI
The researcher followed the protocol summarized in the IRB. The SBI packet was
developed and prepared for the participant meetings to fill out the SBI. The packets included a
descriptive outline of the SBI and a copy of the informed consent form for the entire study. The
packet also included additional information for the SBI focus groups. Specifically, the
participants were asked once again if they wanted to participate in the focus group. If yes, the
researcher informed the participants of the details for the focus groups. Each volunteer received
a flier and were assigned a time slot to participate in one of two focus groups once they had
handed in their completed SBI. The flier included the time, place and location for the focus
groups. The researcher also informed the volunteers that two email reminders would be sent
prior to the session. The researcher coordinated directly with the director of the support
programs to complete the SBI and the interview.
Data Analysis
SACQ
With respect to the quantitative data, the researcher created a database to store the results
from the survey. After the data was assessed for usability, the Statistical Package for Social

75
Sciences (SPSS) 16.0 was used to conduct statistical analyses. It was envisioned that SPSS
would be essential for interpreting the data in order to answer the three research questions posted
in this study.
For the first and second research question listed below:
1. How do participants versus non-participants in an engineering Summer Bridge
Program rate their Academic Adjustment (AA), Social Adjustment (SA),
Personal-Emotional Adjustment (PEA), and Goal Commitment/Institutional
Attachment (GCIA) during their first term of college and is there a significant
difference?
2. Do the Academic Adjustment (AA), Social Adjustment (SA), Personal-Emotional
Adjustment (PEA), and Goal Commitment/Institutional Attachment (GCIA)
experiences of participants versus non-participants differ by race or gender?
The researcher used descriptive statistics to report the responses for the Academic Adjustment
(AA), Social Adjustment (SA), Personal-Emotional Adjustment (PEA), and Goal
Commitment/Institutional Attachment (GCIA) scales and clusters for each scale. Since this study
concerned the differences in the adjustment experiences of participants versus non-participants in
a Summer Bridge Program, the scales were sorted into two groups: summer participants and
non-participants. In addition, the researcher calculated and identified the mean, range, and
standard deviation scores for both summer participants and non-participants. The full scale total
was also included.
The researcher used the two-tailed t-test in order to determine if there were any
significant differences in the mean response with respect to the AA, SA, PEA, GCIA experiences
of participants versus non-participants, as well as any differences by race or gender. The two-

76
tailed t-test assisted the researcher in assessing whether the means of the populations were
statistically different from one another.
Two assumptions had to be verified prior to running a two-tailed t-test. The first
assumption was that both groups would have a normal distribution. One way of checking for
normality was by running a Normal Probability Plot for each group, which confirmed whether
the data was normally distributed. If the data were not normal or turned out to be questionable, a
Mann-Whitney Test would be conducted. The second assumption was that the variance of the
outcome variable would be the same for both groups. The statistical package selected for this
study checked the equality of variance within the t-test procedure. Also, the researcher used
two-tailed t-test to examine whether mean scores differs when the population was analyzed by
race, gender, and fall term college grade point average.
SBI
The SBI was developed to explore the academic, social, personal-emotional and goal
commitment and institutional adjustment of participants in a SBP. The researcher analyzed the
data by race and gender. The data was analyzed using SPSS 16.0, JMP, NUD*IST and content
analysis. For the quantitative portion of the SBI, the researcher examined the differences in
academic, social, personal-emotional and goal commitment and institutional adjustment of the
participants based on race and gender. The researcher used simple descriptive statistics to
analyze the majority of the data for the SBI. The rankings and mean scores were reported for all
scales and subscales, after which the data were arranged into appropriate groupings. Estimates
of internal consistency were done to demonstrate reliability. The mean scores, standard
deviation, confidence intervals and levels were calculated and reported. Chi-square statistics was
used to establish if there were significant differences in the mean responses (p <.05). To further

77
investigate, the researcher conducted One-way Analysis of Variance (ANOVA). The Tukey-
Kramer HSD test was used to assess differences among the means, as well as to control for Type
I error.
For the qualitative portion of the SBI, the researcher asked the participants whether the
SBP activities assisted them in their overall academic, social, personal-emotional and goal
commitment and institutional adjustment in their first term in college. Moreover, the researcher
asked general questions to examine strengths and weakness of the program. The responses from
the focus groups and interview were coded and sorted in appropriate tables based on Patton
(2002). The frequencies of the codes were reported (see Tables 4.45 through 4.55 in Appendix
P). Content analysis and NUD*IST were used to interpret the data. In sum, the various methods
utilized for the SBI were considered adequate to tackle the research questions.
Researcher’s Stance
For the second phase of the study, the researcher has to reflect on his own role since he
was the primary instrument for this phase. Lincoln and Guba (1985) indicated that the best
instrument is the researcher, since he or she is able to create a non-human instrument that can be
adjusted to the realties that come up in focus groups and interviews. Nonetheless, since the
researcher had been personally involved in the SBP for about six years working with over 300
students, it was vital to identify and acknowledge any personal beliefs or biases. For example,
since the aim of this study was to investigate adjustment issues for first-year engineering students
in a summer bridge program, the researcher would have a natural tendency to assume that the
program was doing its job—evidenced by participants of the SBP stating that they considered
themselves to be adjusting well. Thus, the researcher had to be sure to interpret responses
78
dispassionately. Nonetheless, it was gratifying to be receiving data from both the focus groups
and the interview in order to make suggestions and changes to assist future students.
Moreover, since the researcher was the moderator for the focus group and interview, his
role may have had an effect on the responses given by the Summer Bridge Participants and the
director for support programs. This was necessary, however, due to the lack of resources to train
another person.
In summary, the results of this investigation could have been biased due to the
participation of the PI of this study. The interviewees might have been reluctant to criticize the
SBP, which may have limited suggestions on how to improve the various parts of the program
and hinder an in-depth understanding of salient adjustment issues. However, the researcher tried
to reduce this effect as much as possible in every interaction with study participants.

79
CHAPTER FOUR: RESULTS OF STUDY
Introduction
This chapter describes and interprets the data collected from a phased research study
designed to investigate the academic, social, goal commitment/institutional adjustment and
personal-emotional adjustment of participants versus non-participants in a SBP for engineering
students. Analyses also examined differences related to race, gender, and GPA. Finally, the
various SBP activities were ranked ordered by the participants in terms of relative importance to
their adjustment preparation for college.
Research Design
A mixed-methods research design that combined both quantitative and qualitative
methods was used. As discussed earlier, the research was completed in two phases so that
information from the first phase could inform the work completed in the second phase.
For the first phase, the researcher used the SACQ to collect the data. Specifically, the
first portion of the study used quantitative measures to determine the adjustment of engineering
students at a predominantly White institution (PWI) in the mid-southeastern region of the United
States. This initial segment of the research also examined the data from the perspective of race
and gender to facilitate data interpretation.
For the second phase of the study, the researcher developed the Summer Bridge
Inventory (SBI) as a set of quantitative and qualitative procedures to explore in-depth the college
adjustment of 42 engineering students who participated in the SBP. The quantitative portion of
the SBI analyzed the activities in which the participants engaged during the summer and their
perspectives on those activities. In addition, the researcher asked the program director to
complete the SBI survey in order to ascertain the director’s perspective of the activities. The

80
researcher utilized SACQ definitions to categorize the activities within subscales, and also
examined the data from the point of view of race and gender. During the qualitative portion, the
SBI measured the degree to which the summer bridge participants felt the summer bridge
activities assisted them in their overall academic, social, personal emotional, and goal
commitment and institutional adjustment during their first term of college. The researcher also
interviewed the director of support programs to view her overall impressions on how the SBP
activities supported the academic, social, personal emotional, and goal commitment and
institutional adjustment of the participants in the SBP. The qualitative information was then
transformed to a story format in order to create a narrative of the findings.
Quantitative Findings: Phase 1
Introduction
For the quantitative portion of the research study, the Student Adaptation to College
Questionnaire (SACQ) was given to all students who had participated in the College of
Engineering SBP in 2007 (n = 67), and a non-participating cohort (n=67) matched on similar
characteristics to the participants. The student participants in the SBP were a very diverse group.
As a result, it was a challenge to capture a cohort that had parallel academic and racial
characteristics due to the low numbers of underrepresented students in the College of
Engineering. The majority of the respondents were 18 years old (comprising 77.6% of the SBP
participants and 79.1% of the non-participants, and most were Caucasian (52.2% of the SBP
participants and 59.7% of the non-participants). Women were underrepresented, accounting for
40.3% of the SBP participants and 41.0 of the non-participants. Table 4.0 (see Appendix D)
summarizes the demographic characteristics of the participants in this phase of the study. A total
of 134 SACQ surveys were administered and analyzed. The SACQ data were used to answer the

81
first three research questions associated with this Phase 1 of the study. Grade point averages
were used to answer research question four.
Research Question 1
1. How do participants versus non-participants in an engineering Summer Bridge
Program rate their Academic Adjustment (AA), Social Adjustment (SA), Personal-
Emotional Adjustment (PEA), and Goal Commitment/Institutional Adjustment
(GCIA) during their first term of college?
To answer the first research question, the raw scores from each of the four sections of the
SACQ were analyzed by participation. Normal probability plots were used to assess the
normality assumption of the four sets of raw scores. The analysis revealed that the AA and PEA
raw scores tended to follow a normal distribution (see Figures 4.1 and 4.2 in Appendix J). This
result contrasted with the SA and GCIA raw scores in which the normality assumption was
violated (see Figures 4.3 and 4.4 in Appendix J).
Results from these normal probability plots helped determine the appropriate test to use
to detect significant differences in these raw scores by participation, gender, and race. Since the
distributions of the AA and PEA raw scores were approximately normal, two-sample
independent T-tests were conducted. However, as indicated above, the distribution of the SA
and GCIA scores were not normally distributed. Therefore, Mann-Whitney nonparametric tests
were conducted. Table 4.1 provides the test statistics and p-values for each of the two sample T-
tests and Mann-Whitney tests conducted. This research detected that gender was important issue
to examine in the data.

82
Table 4.1
Two-Sample T & Mann-Whitney Significance Tests on SACQ Raw Scores for Subscales
Two-Sample T / Mann-Whitney Test Statistics
by participation by gender By race
AA .274(.785) -.288(.820) 1.043(.299)
PEA .192(.848) -2.008(.047)* .059(.953)
SA -1.647(.100) -.197(.844) -.646(.518)
GCIA -.935(.350) -.373(.709) -1.485(.138)
P-values are in parentheses. Significant differences are denoted with an asterisk (*).
Descriptive analyses were conducted to obtain medium, mean, and standard deviations
for the AA, SA, PEA and GCIA scales and subscales. The scores were grouped on the following
scale:
Low Adjustment: 1 through 3.49
Medium Adjustment: 3.5 though 6.49
High Adjustment: 6.5 though 9
These scores are based on a cut off system developed by the researcher. The researcher
determined the total score for each scale and question. The total score was identified as low,
medium, or high adjustment score. The low, medium, and high adjustment choices provide a
range to demonstrate where the groups are maintaining on the scale or question.
The AA overall total mean scores for the summer participants was 7.01 (high adjustment)
and 6.94 (high adjustment) for non-summer participants (see Table 4.2 in Appendix K), and
mean scores for each question were very close. The highest rated question for both summer
participants (mean score of 7.91-high adjustment) and non-participants (mean score of 8.45-high
adjustment) was related to motivation: “Getting a college degree is very important to me.” The
lowest rated question for summer participants was related to performance: “I am finding

83
academic work at college difficult” (3.79-medium adjustment). The non- participants also
ranked this item as the lowest (3.39-medium adjustment).
The SA overall total mean scores for the summer participants was 6.97 (high adjustment)
and 6.75 (high adjustment) for non-summer participants (see Table 4.3 in Appendix K). The
mean scores for each question were also similar in this category. The highest rated question for
participants related to other people: “I have some good friends or acquaintances at college with
whom I can talk about any problems I may have” (7.67-high adjustment). The highest rated
question for non-participants related to social environment: “I am pleased now about my
decision to attend this college in particular” (8.16-high adjustment). The lowest rated question
for summer participants related to other people: “I’ve had informal, personal contacts with
college professors” (5.58-medium adjustment); the non- participants also ranked this item as the
lowest (5.31-medium adjustment).
The PEA overall total mean scores for the summer participants was 6.11(medium
adjustment) and 6.06 (medium adjustment) for non-participants (see Table 4.4 in Appendix K).
The mean scores for each question were close. The highest rated question for participants was
related to psychological: “I’ve given a lot of thought lately to whether I should ask for help from
the Psychological/Counseling Services Center or from a psychotherapist outside of college”
(7.45-high adjustment). This was also ranked the highest for non-participants (7.82-high
adjustment). The lowest rated question for summer participants was related to physical: “I have
felt tired much of the time lately” (4.31-medium adjustment). The non-participants also ranked
this item as the lowest (4.48-medium adjustment).
The GCIA overall total mean scores for the summer participants was 7.26 (high
adjustment) and 7.34 (high adjustment) for non-participants (see Table 4.5 in Appendix K). The
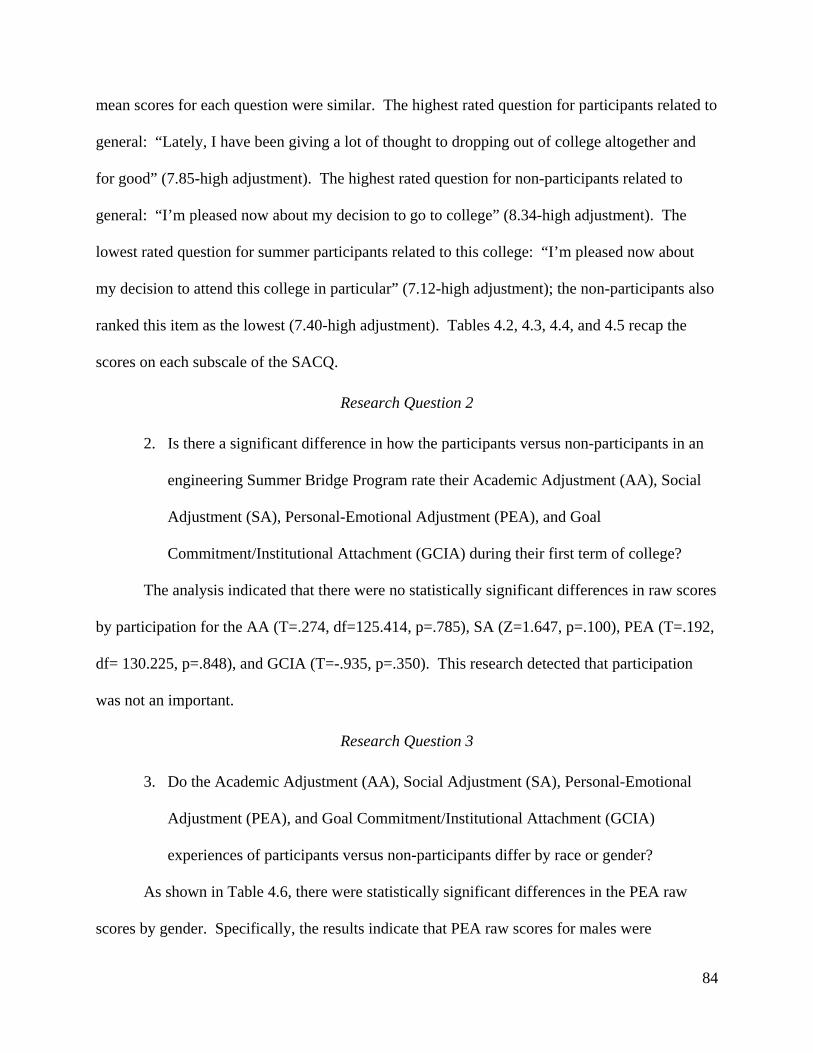
84
mean scores for each question were similar. The highest rated question for participants related to
general: “Lately, I have been giving a lot of thought to dropping out of college altogether and
for good” (7.85-high adjustment). The highest rated question for non-participants related to
general: “I’m pleased now about my decision to go to college” (8.34-high adjustment). The
lowest rated question for summer participants related to this college: “I’m pleased now about
my decision to attend this college in particular” (7.12-high adjustment); the non-participants also
ranked this item as the lowest (7.40-high adjustment). Tables 4.2, 4.3, 4.4, and 4.5 recap the
scores on each subscale of the SACQ.
Research Question 2
2. Is there a significant difference in how the participants versus non-participants in an
engineering Summer Bridge Program rate their Academic Adjustment (AA), Social
Adjustment (SA), Personal-Emotional Adjustment (PEA), and Goal
Commitment/Institutional Attachment (GCIA) during their first term of college?
The analysis indicated that there were no statistically significant differences in raw scores
by participation for the AA (T=.274, df=125.414, p=.785), SA (Z=1.647, p=.100), PEA (T=.192,
df= 130.225, p=.848), and GCIA (T=-.935, p=.350). This research detected that participation
was not an important.
Research Question 3
3. Do the Academic Adjustment (AA), Social Adjustment (SA), Personal-Emotional
Adjustment (PEA), and Goal Commitment/Institutional Attachment (GCIA)
experiences of participants versus non-participants differ by race or gender?
As shown in Table 4.6, there were statistically significant differences in the PEA raw
scores by gender. Specifically, the results indicate that PEA raw scores for males were

85
considerably higher than females. However, there were no significant differences in the four
sections by race.
As an extension of the research questions, the clusters for each subscale were analyzed.
Table 4.6 reports the test statistics and p-values of the two-sample T-tests or Mann-Whitney tests
conducted on the cluster raw scores by participation, gender, and race. The outcome from these
tests revealed that the psychological cluster for PEA was significantly different by gender, i.e.,
the mean scores for males were notably higher than females. These low scores indicate that
females are not transitioning well.
Table 4.6
Two-Sample T & Mann-Whitney Significance Tests on SACQ Raw Scores for Subscales and
Clusters
Two-Sample T / Mann-Whitney Test Statistics by participation by gender By race AA
Motivation
Application
Performance
Academic Environment
.274(.785)
-.203(.839)
-1.612(.109)
1.398(.164)
.191(.849)
-.288(.820)
.633(.528)
.692(.490)
-1.412(.160)
.142(.887)
1.043(.299)
1.620(.109)
1.121(.264)
.054(.957)
.805(.422)
PEA
Psychological
Physical
.192(.848)
-.170(.865)
.715(.476)
-2.008(.047)*
-2.045(.043)*
1.675(.096)
.059(.953)
.056(.956)
-.224(.823)

86
Table 4.6, Con’t Two-Sample T / Mann-Whitney Test Statistics by participation by gender By race SA
General
Other People
Nostalgia
Social Environment
-1.647(.100)
-1.819(.069)
-1.294(.196)
-1.245(.213)
-.309(.757)
-.197(.844)
-.736(.462)
-1.146(.252)
-.735(.462)
-.337(.736)
-.646(.518)
-.478(.633)
-.466(.641)
-.389(.697)
-.255(.799)
GCIA
General
This College
-.935(.350)
-.184(.854)
-.021(.983)
-.373(.709)
-.844(-.398)
-.170(.865)
-1.485(.138)
-1.263(.207)
-1.539(.124) P-values are in parentheses. Significant differences are denoted with an asterisk (*).
Research Question 4
4. Is there a significant difference in participants versus non-participants in fall term
college grade point average (GPA) with respect to retention after their first year in the
college of engineering and the institution?
This research question required analyzing the first term grade point average and the retention of
participants versus non-participants.
Recall that 134 students participated in the initial study in the fall of 2007. Of this
number, 73 (54%) students earned a 3.0 GPA or above, while 61 students (45%) did not.
Regarding retention numbers, 125 students (93%) returned for their second year of college, while
9 (7%) did not. Moreover, 117 students (87%) remained in the College of Engineering, while 17
(13%) did not.

87
Two-sample T test was used to determine if a significant difference existed in retention
based upon participation. The researcher also examined retention based on race and gender. The
Two-Sample T-test analysis revealed no significant relationship between first term grade point
average and retention when compared to participation, gender, and race (see Table 4.7). It
basically means there is no statistical evidence that there is a difference.
Table 4.7
Two-Sample T-Test on Fall Term GPA, College Engineering and Institutional Enrollment
Two-Sample T
by participation by gender By race
Fall Term GPA
Still enroll in College of
Engineering after 1st year
-.387(.699)
1.826(.070)
-1.928(.056)
1.180(.240)
-.892(.374)
-.536(.593)
Still enrolled in the
Institution after 1st year
1.032(.304) -.065(.949) -.912(.363)
P-values are in parentheses.
Quantitative Findings Phase 2
Research Question 5
In the second phase of the research, the researcher analyzed the following question:
What were the benefits and difficulties with participating in Summer Bridge Program
according to participants and the director of engineering support programs?
The researcher developed the Summer Bridge Inventory (SBI) (see Appendix E) in order
to ascertain the most and least beneficial aspects of the SBP. The SBI has 4 scales as well as 12
subscales. These 4 scales and 12 subscales were designed to capture various facets of the

88
summer bridge activities related to SACQ elements. The SBI has a section for ranking the
activities and the 4 scales.
To understand the beneficial aspects of the SBP, the researcher examined 29 activities
associated with the program. The 29 items measured by the SBI were not expected to be reliable
variables. An initial review of all response sheets was conducted to ensure that the participants
took the tasks seriously and entered response that indicated a serious approach to the task. A
Cronbach’s Alpha was conducted with each subscale for further evidence of reliability (see
Table 4.8). The researcher calculated estimates of internal consistency to demonstrate that the
variables were reliable. Table 4.8 presents alpha coefficients for the first version of the SBI
subscales. However, the estimates of internal consistency demonstrate that the variables for each
subscale were reliable based on Cronbach’s Alpha.

89
Table 4.8
Cronbach’s Alpha for Summer Bridge Inventory Subscales
SBI Academic Adjustment
SBI Academic Motivation
SBI Academic Application
SBI Academic Performance
SBI Academic Environment
SBI Social Adjustment
SBI Social General
SBI Social Other People
SBI Social Nostalgia
SBI Social Environment
SBI Personal-Emotional Adjustment
SBI Personal Psychological
SBI Personal Psychical
SBI Goal Commitment/Institutional Adjustment
SBI General Other
SBI General This College
.95
.88
.81
.90
.89
.95
.88
.85
.93
.80
.96
.92
.94
.94
.91
.89
Demographic Characteristics of the SBI Participants
There were a total of 67 students that participated in SBP. Forty-two participants (62%)
completed the SBI for this portion of the study. There were 22 males (52%) and 20 females
(47%) who ranked the various activities in the SBI. The participants were also required to define
their racial background, according to majority or minority. Twenty-seven participants (64%)
ranked themselves as Caucasian; while the remaining 15 minority participants (36%) were
comprised of 2 Asian and Pacific Islanders (5%), 10 African Americans (24%), and 3 Hispanics
(7%).

90
SBI Analysis Overview
Chi-square statistics were used to examine whether distributions of categorical variables
differed from one another. Tables 4.11 through 4.24 (see Appendix L) list the p values for the
likelihood ratio Chi-square and Chi-square Pearson for the categorical variables (race and
gender). First, likelihood Ratio Chi-square tests were calculated as twice the difference of the
log-likelihoods between the full model and the model constrained by the hypothesis to be tested
(the model without the effect) (Hinkle, Wiersma, & Jurs, 1998). Afterwards, the Chi-Square
tested the hypothesis that the response rates were the same in each sample category. This is
typically calculated by summing the squares of the differences between observed and expected
cell counts. The Chi-square exploits the fact that frequency counts tend toward a normal
distribution in very large samples (Hinkle, Wiersma, & Jurs).
Chi-square analysis demonstrated that race and gender rankings were significant for
particular summer bridge activities. The cluster application for SBI AA (see Table 4.11 in
Appendix L) revealed that some of the summer bridge activities were positive by race and
gender. Race was grouped as majority (White and Asian) and minority (African American and
Hispanic). Gender was grouped as male and female. Individual and group picture, chemistry
class, engineering class, math class, campus tour, seminar sponsored by Fortune 500 Company,
and on-line survey were significant for race by majority (White and Asian). White and Asian
students enjoyed these activities. The etiquette dinner was the only summer bridge activity
positive for gender by males. Male students enjoyed these activities.
The cluster motivation for SBI Academic (see Table 4.12 in Appendix L) revealed that
rankings for some of the summer bridge activities were positively different by race and gender.
Individual and group picture, skating, lab tours and on-line survey were positive for race by
majority (White and Asian). White and Asian students enjoyed these activities. The floor

91
meeting was the only summer bridge activity positive for gender by females. Female students
enjoyed the activities.
The cluster academic environment for SBI AA (see Table 4.13 in Appendix L) revealed
that rankings for two summer bridge activities as positively different. The chemistry lab class
was the only summer bridge activity positive for race by majority (White and Asian). White and
Asian students enjoyed this activity. Registration and class sign up/information for fall term was
positive for gender by females. Female students enjoyed these activities.
The cluster performance for SBI AA (see Table 4.14 in Appendix L) revealed that
ranking for one summer bridge activity is positively different. The on-line survey was
significant race by majority (White and Asian). White and Asian student enjoyed this activity.
Gender had no significance.
The cluster social environment for SBI SA (see Table 4.15 in Appendix L) revealed that
rankings for two of the summer bridge activities were positively different by race and gender.
The university freshmen orientation was significant by race by majority (White and Asian).
White and Asian students enjoyed this activity. The move-out meeting was positive by gender
for females. Female students enjoyed this activity.
The cluster general for SBI SA (see Table 4.16 in Appendix L) revealed that rankings for
some of the summer bridge activities were positively different by race and gender. The 4th of
July cookout and university freshmen orientation were positive for race by majority (White and
Asian). White and Asian students enjoyed this activity. The introduction meeting and student
panel was positive by females. Female students enjoyed these activities.
The cluster nostalgia for SBI SA (see Table 4.17 in Appendix L) revealed that rankings
for some of the summer bridge activities were positively different by race and gender. The floor
meeting, Friday seminars, and trip to the mall were positive by race for majority (White and

92
Asian). White and Asian students enjoyed these activities. The campus tour was positive by
gender for females. Female students enjoyed this activity.
The cluster other people for SBI SA (see Table 4.18 in Appendix L) revealed that
rankings for one of the summer bridge activities were positively different by majority. This
activity was move-out meeting for race by majority (White and Asian). White and Asian
students enjoyed this activity. Gender did not have activities that were significant.
The cluster psychological for SBI PEA (see Table 4.20 in Appendix L) revealed that
rankings for two of the summer bridge activities were positively different by race and gender.
Updating resumes was significant by majority (White and Asian). White and Asian students
enjoyed these activities. The 4th of July cookout was significant gender by females. Female
students enjoyed this activity. The researcher did not find any of the activities to be positive for
the cluster physical (see Table 4.19 in Appendix L).
The cluster general and this college for SBI GCIA (see Table 4.21 and 4.22 in Appendix
L) revealed that rankings for three summer bridge activities were positively different by gender.
For general, the university freshmen orientation was positive by majority (White and Asian).
White and Asian students enjoyed this activity. The researcher did not find any of the activities
to be positive for gender. For this college, university freshmen orientation was positive by race
by majority (White and Asian). White and Asian student enjoyed this activity. The researcher
did not find any of the activities to be positive for gender.
The researcher did not find race and gender to be positively different for the ranking scale
for summer bridge activities. However, there was positive difference in race and gender when
examining the dominate subscales for each summer bridge activity. There were four summer
bridge activities that were positive. The orientation meetings with Associate Dean of
Engineering and Friday seminar were positive by majority (White and Asian). White and Asian

93
students enjoyed these activities. The individual/group pictures and floor meeting were
significant gender by males. Male students enjoyed these activities.
The participants ranked and categorized each of the 29 SBI activities. As depicted in
Table 4.25 (see Appendix M), the rankings revealed that the four courses taught during the SBP
(engineering (25.40), math (22.93), chemistry lab (22.21), and chemistry (22.00) were ranked
most highly by the students, while the four bottom activities (seminar sponsored by a Fortune
500 Company(7.48), Move-out (7.17), University Freshman Orientation (5.19), and On-line
Survey (4.57)) were ranked the lowest. The results for categorizing the activities revealed that
none of activities were equated with Goal Commitment/Institutional Adjustment. Instead, many
of the participants identified SBI activities as Social Adjustment activities (see Table 4.26).
The researcher was able to identify the activities in order of how they relate to students
for each subscale. Tables 4.27 through 4.38 (see Appendix O) indicate the mean scores and
standard deviation for all the activities for each subscale.
ANOVA for SBI
In order to better understand the SBI data, a one-way analysis of variance (ANOVA) was
conducted to determine the correlation of the four types of scales (academic, social adjustment,
personal emotional adjustment, and goal commitment/adjustment) on the 29 dependent variables,
namely, the summer bridge activities. The ANOVA were significant, F(3, 344)=7.07, p<.0001.
Table 4.37 shows the means, standard deviations and the confidence intervals on the dependent
variables for the four scales.

94
Table 4.37
Means, Standard Deviations, and Confidence Intervals on the Dependent Variables for the 4
Scales for the Summer Bridge Inventory Activities
Scales M SD CI-Lower 95% CI-Upper 95%
Academic 3.06 0.90 2.89 3.22
Social Adjustment 2.74 0.78 2.60 2.88
Personal Emotional Adjustment 3.17 0.73 2.98 3.37
Goal Commitment/Adjustment 2.67 0.59 2.51 2.82
Follow-up tests were conducted to evaluate pairwise differences among the means. The
researcher chose not to assume that the variances were homogeneous; therefore, the researcher
conducted post hoc comparisons using the Tukey-Kramer HSD test, which does not assume
equal variances among the four scales. There was a positive difference in the means between the
groups listed in the table below, along with the confidence limits for the pairwise differences as
well as the p-value (see Table 4.38).

95
Table 4.38
Difference in Upper and Lower Confidence Limits on the Dependent Variables for the 4 Scales
for the Summer Bridge Inventory Activities
Scales for
Adjustment
Difference CL Lower CL Upper P-value
Personal
Emotional
Goal/Commitment 0.50 0.12 0.88 .0006*
Personal
Emotional
Social 0.43 0.10 0.76 .0007*
Academic Goal/Commitment 0.39 0.06 0.72 .0024*
Academic Social 0.31 0.04 0.58 .0025*
Personal
Emotional
Academic 0.11 -0.21 0.44 .3574
Social Goal/Commitment 0.07 -0.25 0.40 .5848
*Scales were significantly different Also, it is important to view the sum of squares. The sum of squares records the distance
for each source of variation. The total sum squares was 229.80. The sum of squared distance
from each point to its respective group mean was 216.46. There is the remaining unexplained
error (residual) sum squares after fitting the analysis of variance model, which was 13.34.
Table 4.39 shows that the levels not connected by the same letter were significantly
different. The researcher was able to use the levels to list the variables by letter to demonstrate
the fitting of each group mean.

96
Table 4.39
Overall Levels and Mean Score for SBI Scales
Level Mean Personal Emotional A 3.17 Academic A 3.06 Social B 2.70 Goal B 2.67
A one-way analysis of variance (ANOVA) was conducted to evaluate the effects of 12
subscales on the 29 summer bridge activities. The means and standard deviations for the 12
subscales as a function of the 29 factors are presented in Table 4.40. The ANOVA indicated
significance between the subscales and activities, F(11, 336)=4.25, p=.001. The positive values
show pairs of means that are significantly different.
Table 4.40
Means, Standard Deviations, and Confidence Intervals on the Dependent Variables for the 12
Subscales for the Summer Bridge Inventory Activities
Level Mean SD CI-Lower 95% CI-Upper 95%
Academic Application 3.18 0.95 2.82 3.55
Academic Environment 2.96 0.77 2.66 3.25
Academic Motivation 2.75 0.80 2.45 3.06
Academic Performance 3.34 0.99 2.96 3.72
Goal Other 2.73 0.58 2.51 2.95
Goal This College 2.60 0.61 2.37 2.84
Personal Emotional 2.80 0.43 2.63 2.96
Personal Physical 3.55 0.78 3.25 3.85
Social Environment 2.73 0.67 2.47 2.98
Social General 2.69 0.87 2.35 3.02
Social Nostalgia 2.81 0.71 2.54 3.09

97
Level Mean SD CI-Lower 95% CI-Upper 95%
Social Other 2.71 0.89 2.37 3.05
The primary purpose of this analysis was to determine which subscales were significant for
summer bridge activities. The follow-up tests consisted of all pairwise comparisons among the
subscales. The Tukey-Karamer HSD procedure was use to control for Type I error across the
pairwise comparisons (Hinkle, Wiersma, & Jurs, 1998).
The total sum squares was 229.80. The sum of squares distance from each point to its
respective group means was 201.7. There was remaining unexplained error (residual) sum
squares after fitting the analysis of variance mode, which was 20.09.
The results of this analysis indicated how many subscales were needed and which levels
should be in each cluster. There was a significant difference between the following subscales
listed in Table 4.41. Table 4.42 demonstrates the various levels. The levels that are not
connected by the same letter are significantly different. The researcher was able to use the levels
to list the variables by letter to demonstrate the fitting of each group mean.

98
Table 4.41
Difference in Upper and Lower Confidence Limits on the Dependent Variables
Level Sub-Level Difference Lower CL Upper
CL
p-Value
Personal Physical Goal This College 0.94 0.54 1.34 <.0001
Personal Physical Social General 0.86 0.46 1.26 <.0001
Personal Physical Social Other 0.84 0.44 1.24 <.0001
Personal Physical Social Environment 0.82 0.42 1.22 <.0001
Personal Physical Goal Other 0.82 0.42 1.22 <.0001
Personal Physical Academic Motivation 0.79 0.39 1.19 0.0001
Personal Physical Personal Emotional 0.75 0.35 1.15 0.0002
Personal Physical Social Nostalgia 0.73 0.33 1.13 0.0003
Academic Performance Goal This College 0.73 0.33 1.13 0.0003
Academic Performance Social General 0.65 0.25 1.05 0.0014
Academic Performance Social Other 0.63 0.23 1.03 0.0021
Academic Performance Social Environment 0.61 0.21 1.01 0.0028
Academic Performance Goal Other 0.61 0.21 1.01 0.0029
Personal Physical Academic Environment 0.59 0.19 0.99 0.0038
Academic Performance Academic Motivation 0.58 0.18 0.98 0.0043
Academic Application Goal This College 0.58 0.18 0.98 0.0046
Academic Performance Personal Emotional 0.54 0.14 0.94 0.0081
Academic Performance Social Nostalgia 0.52 0.12 0.92 0.0102
Academic Application Social General 0.49 0.09 0.89 0.0149
Academic Application Social Other 0.47 0.07 0.87 0.0202
Academic Application Social Environment 0.45 0.05 0.85 0.0255
Academic Application Goal Other 0.45 0.05 0.85 0.0260
Academic Application Academic Motivation 0.42 0.02 0.82 0.0355

99
Table 4.42
Levels and Mean Score for SBI Subscales
Level Mean Personal Physical A 3.55 Academic Performance A 3.34 Academic Application A B C 3.18 Academic Environment B C D 2.96 Social Nostalgia B C D 2.81 Personal Emotional C D 2.80 Academic Motivation D 2.75 Goal Other D 2.73 Social Environment D 2.73 Social Other D 2.71 Social General D 2.69 Goal This College D 2.60
Qualitative Findings Phase 2
Introduction
For the second phase of the research, the researcher analyzed the following question:
What were the benefits and difficulties with participating in Summer Bridge Program
according to participants and the director of engineering support programs?
This phase of the study also featured a qualitative investigation. Specifically, two focus
groups were held with participants from the SBP to juxtapose their perception. An interview was
also conducted with the director of engineering support programs. The researcher used a list of
structured questions for the focus groups and the interview which is included in the SBI packet
(see Appendix E). Both of these activities provided rich data about the SBI. In particular, the
focus groups with the students allowed them to (1) describe how the summer bridge activities

100
assisted with their own adjustment, and (2) provide feedback on the activities in order to better
serve future participants of the SBP with their adjustment processes.
This qualitative discussion includes direct quotes which capture each respondent’s unique
viewpoints and experiences. The narratives are presented in two segments. The first segment
describes the groups of participants involved in the study and how the groups were formed. The
second segment recaps group findings.
Demographic Characteristics of the Sample
The researcher developed the SBI focus group questions based on the SACQ subscales,
after which volunteers were recruited to participate in the focus groups. Table 4.43 lists the 12
focus group participants and their pseudonym name, race, gender, college major and overall fall
term grade point average.
Table 4.43
Focus Group Participants and Characteristics
Pseudonym Race
Gender
College Major
Fall 2007 GPA
Carlos African American Male General Engineering 3.53
Jerel African American Male Aerospace Engineering 3.43
Taurius African American Male Mechanical Engineering 3.04
Amy African American Female Mechanical Engineering 2.22
Tim Caucasian Male Materials Science Engineering 3.49
Mark Caucasian Male Wood Science 2.28
Micah Caucasian Male Computer Science 1.76
Martha Caucasian Female Engineering Science Mechanics 3.74
Cori Caucasian Female Mechanical Engineering 3.5
Lucy Caucasian Female Mechanical Engineering 2.28
Yael Hispanic Female Mechanical Engineering 3.48
Kim Pacific Islander Female Electrical Engineering 3.58
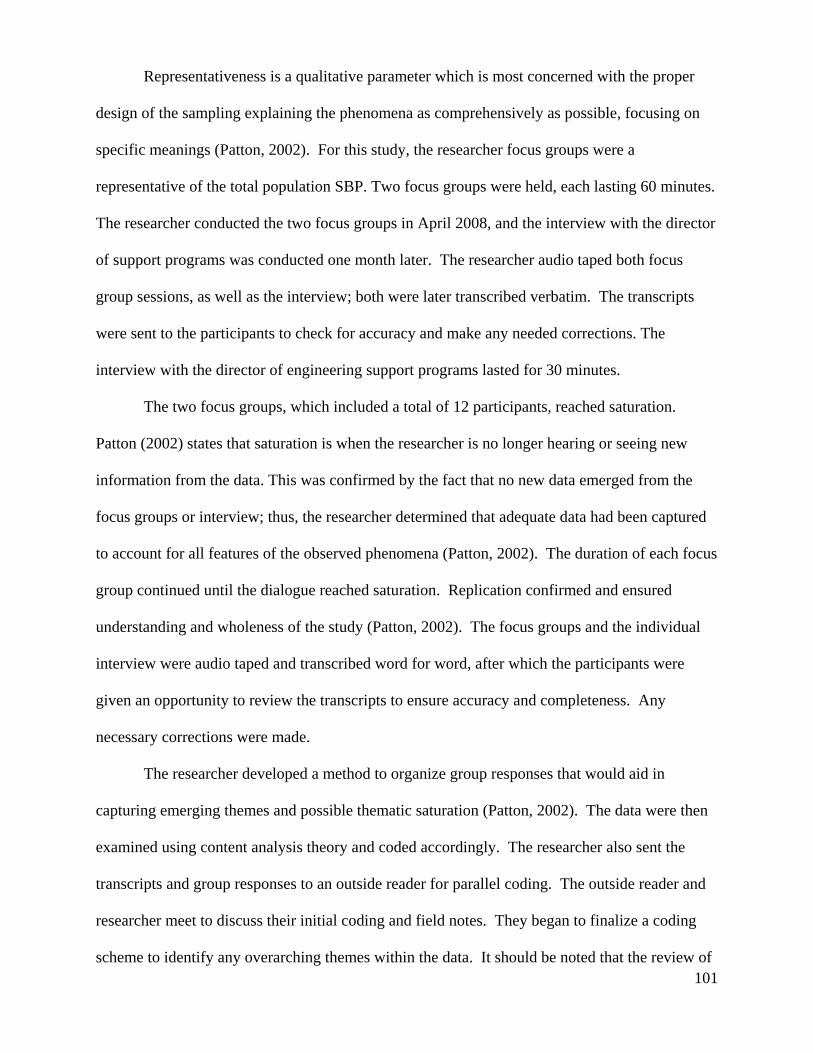
101
Representativeness is a qualitative parameter which is most concerned with the proper
design of the sampling explaining the phenomena as comprehensively as possible, focusing on
specific meanings (Patton, 2002). For this study, the researcher focus groups were a
representative of the total population SBP. Two focus groups were held, each lasting 60 minutes.
The researcher conducted the two focus groups in April 2008, and the interview with the director
of support programs was conducted one month later. The researcher audio taped both focus
group sessions, as well as the interview; both were later transcribed verbatim. The transcripts
were sent to the participants to check for accuracy and make any needed corrections. The
interview with the director of engineering support programs lasted for 30 minutes.
The two focus groups, which included a total of 12 participants, reached saturation.
Patton (2002) states that saturation is when the researcher is no longer hearing or seeing new
information from the data. This was confirmed by the fact that no new data emerged from the
focus groups or interview; thus, the researcher determined that adequate data had been captured
to account for all features of the observed phenomena (Patton, 2002). The duration of each focus
group continued until the dialogue reached saturation. Replication confirmed and ensured
understanding and wholeness of the study (Patton, 2002). The focus groups and the individual
interview were audio taped and transcribed word for word, after which the participants were
given an opportunity to review the transcripts to ensure accuracy and completeness. Any
necessary corrections were made.
The researcher developed a method to organize group responses that would aid in
capturing emerging themes and possible thematic saturation (Patton, 2002). The data were then
examined using content analysis theory and coded accordingly. The researcher also sent the
transcripts and group responses to an outside reader for parallel coding. The outside reader and
researcher meet to discuss their initial coding and field notes. They began to finalize a coding
scheme to identify any overarching themes within the data. It should be noted that the review of

102
the transcripts involved several important steps. First, the researcher made notes in the right and
left margins of the all transcripts (focus groups and the interview with the director). The
researcher compared notes in the margins to the emerging patterns discussed in the debriefing
meetings with the outside reader. Second, the researcher listened to the audio tapes while
reviewing the typed transcripts. The purpose was to examine and focus on the emerging patterns
while listening attentively to the participants’ insights, as well as the undertones that participants
assigned to the specific terminology they used. Last, the researcher color-coded the transcripts
using Excel 2007 in order to recognize the emerging themes. This methodology follows Patton
(2002), who suggested that transcripts of this type should evaluated a number of times to ensure
that the information contained therein is interpreted accurately.
The researcher also checked for consistency of the patterns. Content analysis and “Non-
numerical, Unstructured Data Indexing, Searching and Theorizing” (NUD*IST) was used to
analyze the information from the transcripts and debriefing sessions. Content analysis and
NUD*IST are two techniques that researchers use to interpret qualitative data. In this study,
content analysis was employed to code the participants’ responses to their overall academic,
social adjustment, personal emotional adjustment, and goal commitment/institutional adjustment
during their first term of college. NUD*IST was then used to identify patterns from the coding,
which also enabled the researcher to retrieve pertinent statements from the transcripts.
Thirty-six issues were identified from the data. These issues were clustered based on
their commonalities. Patton (2002) recommended the constant comparative data analysis method
for grouping items. The goal of this analytical method is to use common questions so that
responses can be clustered in an organized way. This would allow a researcher to investigate
issues from different perspectives. For this study, constant comparative data analysis was done
in two phases. During the first phase, the researcher examined the data, which facilitated the
identification of the following 7 recurring categories:

103
1. Independence vs. Dependence
2. Introduction
3. Learning Styles
4. Preparation
5. Skills and abilities
6. Motivation
7. Networking
The second phase involved coding classification. Patton (2002) asserted that “developing
some manageable classification or coding scheme” is essential to analysis (pg. 463). The coding
classifications and findings for the present study, which were developed from relevant literature
reports, are organized according to the main domains of the SACQ (which are AA, SA, PEA and
GCIA). The data was then grouped into the following comment categories: (1) comments about
pre-college characteristics, (2) comments about involvement, and (3) comments about the
benefits of a SBP. The actual codes and definitions are found in Table 4.44.

104
Table 4.44
Definition of Codes and Terms
Code or Term Term Defined
Pre-college characteristics Involvement Benefits of a Summer Bridge Program Independence vs. Dependence Introduction Learning styles Preparation Motivation Skills and Abilities Networking
This classification refers to students who are more independent and know how to use prior knowledge and relationships to transition to collegiate atmosphere. This classification refers to activities in the summer bridge program that challenge and motivate participants to learn for themselves and assist each other in realizing their goals, choices, and decisions. This classification refers to participants’ opinions on their overall experience and usefulness of the program during their first year of college The term independence means the direction of one's own affairs without intrusion. Dependence is being influenced and determined by something; the individual relies on someone to provide them assistance. This term means a dialogue which initiates or guides the way to the main subject. This term means the individuals preference taking in and processing information in different ways. The term means the act of being geared up or made ready. This term means the driving force that initiates and direct behavior. It is the internal and external energy which drives a individual to do something. This term means the aptitude to identify and execute; proficiency; talents. This term means the process of using one contact to gain others. This would allow the individual to create a system through alliances can be formed.

105
The researcher also identified a number of themes from the coding classifications. The
first coding classification was “comments about pre-college characteristics.” This classification
refers to students who were more independent and knew how to use prior knowledge and
relationships to transition to collegiate atmosphere. Some of the themes associated with this
classification included independence versus dependence, introduction, learning styles and
preparation. The second coding classification, “involvement,” refers to activities in the SBP that
challenged and motivated participants to learn for themselves and to assist each other in realizing
their goals, choices, and decisions. Some of the involvement themes that participant mentioned
were motivation, skills, and abilities. The final coding classification was “comments about the
benefits of the SBP,” which refers to participants’ opinions on their overall experience and
usefulness of the program during their first year of college. Some of the themes that emerged in
this category were independence versus dependence, preparation, and networking.
Quotes from the transcripts and journal were used to explicate the themes. All coding
classification and themes are presented in Tables 4.45 through 4.55 (see Appendix P). The
quotes were categorized according to the four scales (academic, social, personal emotional
adjustment and goal commitment/institutional adjustment) and by gender and/or race, as were
the themes from the interview with the director. Gender was defined as male and female. Race
was defined as majority and minority, majority is defined as Caucasians and Asians. The other
races (i.e., African American and Hispanic) constituted the minority category. The responses for
each theme were reported for the focus group participants based on race and gender. The
column labeled Director signifies the data for the interview with the director of the summer
programs.
For the phase of this study, the researcher discussed the most and least beneficial aspects
of the SBP based on the participants and director of engineering support programs. Only the

106
data from the dominant themes is presented herein. This is not to take away from the importance
of the other themes, but rather to provide a snapshot of the data.
Benefits of Participating in SBP
Academic Adjustment
Preparation means geared up and ready to face college challenges. Preparation was the
most consistent theme expressed by the participants and the director with respect to the academic
adjustment question—especially when examining pre-college characteristics comments. Kim, a
female, minority student stated the following about preparation:
It showed you how big attention to detail is cause like there is a lot of things that you
probably knew that you probably studied back in high school but you forgot and when
you went to take a test, it was on that test and really showed you that you had to go back
and look at everything that you learned for you to be prepared for the test and things like
that.
The Director stated the following about preparation:
It gives them the opportunity to experience what it is like being a college student and see
how they react to it. There’s some students that recognize, “Oh wow, this is really hard. I
need to study more.” There’s some students that, you know: “Oh wow, this is really hard,
but this doesn’t count. So I’ll just blow it off. It’s no big deal.” There’s some that don’t
think it’s very hard at all.
Social Adjustment
Again, preparation was the most consistent theme expressed by the participants and the
director with respect to the social adjustment question—especially when examining the
comments about the benefits of the SBP. From a Caucasian male perspective, Tim indicated the
following about preparation:

107
I think we can all pretty much say that definitely being able to meet people and make
friends and all that before we even started college has definitely helped cause you know
you have a support group with you already when you are starting college, and you can
only find small groups of those people who went to the same high school and are still
friends and they usually room together, but definitely having people there who can help
you is really nice, and it definitely helped me get more socially adjusted to college when I
began, and also kind of how the [the summer bridge program] pretty much forced us to
go into the [theme housing programs].
The Director stated the following about preparation:
I see some of the same type of bonding that goes on between the African-American
students and between the Hispanic students amongst themselves; they also are forming
bonds with (fairly strong bonds, I think) with some of the majority students, which I think
is a really good thing.
Personal Emotional Adjustment
Networking was the most consistent theme expressed by the participants and the director
with respect to the personal emotional adjustment question—especially when examining
comments about the benefits of the SBP. From the perspective of an African American male,
Carlos stated the following about networking:
Personally, like I didn’t back in high school, I didn’t have a lot of positive friends. And
coming to [the summer bridge program], they showed me that there were positive people
out there, and I realize when you are around positive people you tend to be more positive.
You are a product of your environment. I think without [the summer bridge program], I
might have gravitated toward the wrong type of people or the wrong crowd when I got
here to college, and that is what I got out of it personally.
The Director stated the following about networking:
They learned a lot about themselves in terms of what they like, what they don’t like, what
they’re capable of doing… I think that it gives them confidence from the standpoint of
they know where everything is around here. It gives them a really strong Virginia Tech

108
faculty/staff connection with people in the [the summer bridge program] office, with the
faculty with the program, the staff, the advisors.
Goal Commitment and Institutional Adjustment
Motivation was the most consistent theme expressed by the participants and the director
with respect to the goal commitment and institutional adjustment question—especially when
examining the comments about involvement. From the perspective of an African American
male, Carlos stated the following about motivation:
Before [the summer bridge program], I didn’t have any set goals, I didn’t study, I didn’t
do anything. That is the aspect of it, like any ratio, it was like a slap in the face, like you
better get on your aim because without [the summer bridge program], I probably would
have been on academic probation or something like that and it turned out I feel like
because of [the summer bridge program] and because of other programs like [engineering
theme housing], it is the reason why I made the Dean’s list and things like that.
The Director stated the following about motivation:
We have five kids who just blew this whole thing off [summer bridge program]. How did
they do during the fall term? And maybe even be able to present that data to the
[incoming summer bridge] students and say, “This is what happened two years ago. They
were the students in [the summer bridge program]: [this group] got really good grades,
the ones that got mediocre grades, and the ones that didn’t do well at all. Here’s what
happened to the ones that didn’t do well at all in the program. Where do you want to end
up? And you have your choice of where you end up; you control where you end up.
Difficulties with Participating in SBP
Student’s skills and abilities was the most consistent theme expressed by the participants
and the director with respect to difficulties—especially when examining the comments about
involvement. From the perspective of an African American male, Tarius stated the following
about skills and abilities:

109
I go along with what Amy says about the learning environment [in the summer bridge
program]. Every time you have a question and you want them to slow down because
they were so far ahead of where I was because I had to take Calculus later, and then when
you have to take tests and this is your first time seeing them, and they have been taking
years of it, it messes up the grade curve. I did well, but everybody who did it for the first
time did just either average or below average.
The Director stated the following about skills and abilities:
I think we do need to begin providing some opportunities for college success strategies.
I’ll call them that, just in general. And more purposeful scheduled opportunities
beyond… cause I told them all. If you want to know about this stuff just come to my
office. I’ll tell you. No one has showed up. No one has asked me. I’ve talked to them
about counseling information; it’s in my office… But maybe they need more purposeful
guidance, still optional, not required. Because they still have to make that choice; they
still have to make that purposeful decision, “I’m going to try and be a better student.”
Because if they don’t make that decision, nothing you can do can help.
Summary
In summary, Phase 1 of this study was quantitative in nature and the researcher examined
the academic, social, goal, commitment/institutional adjustment of personal-emotional
adjustment of participants versus non-participants in a SBP for engineering students at R1 PWI
in the mid-southeastern region of the United States. The data analysis for sex was significant for
the Personal-Emotional Adjustment (PEA) subscale. Specifically, PEA cluster psychological
was significant for Research Question 3. The mean scores for males were significantly higher
than for females. However, the data analysis revealed there was no significant difference for the
other research questions.
The second phase of this study was a mixed method. For the second phase in quantitative
findings, the researcher found that race and gender was significant for some of the summer
bridge activities (see Table 5.1a and 5.1b). The participants ranked the four summer bridge
110
courses as the highest. In addition, the data revealed that majority of the activities were
considered social and none of the activities equated with Goals Commitment/Institutional
Adjustment.
For the qualitative component, the researcher was able to gather in-depth data on the
experiences of 12 participants to demonstrate how the items interrelate according to the
conceptual framework (see Figure 1). The focus groups and interview was coded and then
organized into tables to be compared by the director of the summer support programs and
participants then sorted by race and gender. The researcher indicated that among director of the
SBP and participants similarities. Race and gender had many similarities and difference with the
participants based on the tables. The findings revealed that the results of the study, as well as
implications of the findings for future practice, policy, and research are discussed in Chapter
Five.

111
CHAPTER FIVE: DISCUSSION AND CONCLUSIONS
Introduction
The purpose of this mixed-methods study was to investigate the academic, social,
personal-emotional, and goal commitment/institutional adjustment of participants versus non-
participants in a Summer Bridge Program for engineering students at an R1 predominantly White
institution (R1 PWI). This concluding chapter has six primary purposes. First, this chapter will
discuss the study’s findings. Second, this chapter will address how the current findings relate to
prior research. Third, the researcher will discuss a number of conclusions. Fourth, the
limitations of this research will be discussed, as well as areas for future research. Fifth, the
implications for future practice, research, and policy will be investigated. Last, the researcher
will offer some reflections.
Discussion of Findings
This research study was conducted in two phases. For the first phase of the investigation,
the researcher examined the four research questions. For research Questions One through Three,
the researcher analyzed the responses to the Student Adaptation to College Questionnaire
(SACQ) among participants and non-participants, which required them to respond to 67
questions. Specifically, the participants had to rank their responses on a scale from 1 (“doesn’t
apply to me at all”) to 9 (“applies very closely to me”). Students were also asked to provide their
subjective replies based on their feelings at the time they took the survey. The scores were
grouped on the following scale:
Low Adjustment: 1 through 3.49
Medium Adjustment: 3.5 though 6.49
High Adjustment: 6.5 though 9

112
The total score was identified as low, medium, or high adjustment score. The low, medium, and
high adjustment choices provide a range to demonstrate where the groups are maintaining on the
scale or question. Also, the second research question studied if there is a significant difference in
how participants and non participants adjust based on SACQ scores. Moreover, do the SACQ
scores differ by race and gender?
Three research questions were used to investigate how participants and non-participants
rated their experiences. The experiences of each group were rated using four subscales of the
SACQ to understand their adjustment. The four subscales are Academic Adjustment (AA),
Social Adjustment (SA), Personal-Emotional Adjustment (PEA), and Goal
Commitment/Institutional Adjustment (GCIA).
Overall, the participants in the SBP ranked GCIA as the highest adjustment scale, with a
total mean score of 7.26 out of 9 on the SACQ. The SBP students indicated more dedication to
his/her educational goals and connection to the institution The non-participants also ranked
GCIA as the highest scale, with a similar total mean score of 7.34 out of 9. The second highest
ranked total mean scale corresponded to AA for both participants (7.01 out of 9) and non-
participants (6.94 out of 9). The third highest ranked total mean scale was SA for both
participants (6.97 out of 9) and non-participants (6.75 out of 9), while the lowest ranked total
mean scores scale was for PEA for both participants (6.11 out of 9) and non-participants (6.06
out of 9). As indicated in the scale above, the lowest ranking total mean score still falls within
the “medium adjustment” range. This demonstrates that SBP was moderately effective.
In terms of how these scores can be interpreted, it is important to note that the groups
(participants and non-participants) had very similar scores. For example, the GCIA total mean
score was ranked the highest for both groups, indicating that both participants and non-
participants expressed a strong connection to higher education. The results revealed that the both
groups were trying to stay in college, and were balancing the idea of fitting into the college

113
environment and meeting other people. This research also indicated that college students tend to
disregard their physical and emotional well being when they attend college. These students may
not be aware of the various resources offered by on-campus wellness and counseling centers. It
is vital that students be made aware and avail themselves of these opportunities in order to help
them deal with any psychological and physical roadblocks then encounter in college.
Using SACQ scores, the researcher examined research Questions Two and Three in order
to ascertain if the participants’ and non-participants’ adjustment experiences differed by
participation, race, and gender. With respect to differences in the adjustment experiences of
students by participation and race, no significant differences were identified since the mean
scores for both groups were so similar. There were no significant difference in adjustment
experiences by participation and race for any of the subscales. However, the researcher did find
significant differences by gender, which revealed that female scores were slightly lower than the
male scores. There were also significant differences in PEA adjustment for the psychological
subscale with respect to gender.
The PEA subscale was designed to examine a student’s sense of psychological and
psychical well being. As this investigation revealed, the psychological subscale was significant
for gender in that it indicated that females would be more likely experience personal and
emotional adjustment issues than males. This finding supports literature reports (Astin & Sax,
1996; Seymour & Hewitt, 1997) indicating that a disproportionate number of women in
engineering fields described obstacles to entering the field. Moreover, as reported by Seymour
and Hewitt, issues relating to low self-worth and self-esteem are interrelated factors that
contribute to the career choices that women make. Huang and Brainard (2001) later postulated
that the higher the level of self-esteem, the more likely the individual is to persist and achieve
academically in engineering.

114
Research Question Four focused on whether there was a significant difference in the
academic performance of participants versus non-participants as measured by fall term college
GPA. College of Engineering retention rates were also compared to university-wide retention
rates. According to our findings, there were no significant differences in the grades earned by
participants versus non-participants; both groups earned approximately the same grade point
average. In addition, first-year College of Engineering retention rates were comparable to
overall institutional retention rates; no significant differences were noted.
For the second phase of the investigation, the researcher examined one research question
using a mixed method approach. Research Question Five required participants to identify the
most and least beneficial aspects of the SBP. For the first portion of Phase II of this study, the
researcher created the Summer Bridge Inventory (SBI) survey using the SACQ as a framework
for examining the summer bridge activities.
The Summer Bridge Inventory (SBI) was developed in order to ascertain the most and
least beneficial aspects of the SBP. The SBI has 4 scales as well as 12 subscales. These 4 scales
and 12 subscales were designed to capture various facets of the summer bridge activities related
to SACQ elements. The SBI has a section for ranking the activities and the 4 scales. The
respondents for this study had to rate 29 summer bridge activities. The participants were to
identify their responses based on a scale from 1 (“does not relate at all”) to 5 (“relates well”).
Students were asked to provide their subjective replies based on their feelings at the time they
took the survey. This SBI results were analyzed for any possible race/gender differences.
The scores ranged from high (“relates well”) to low (“does not relate well”). The scores
were grouped on the following scale:
Low—does not relate at all 1 through 2.49
Medium—neutral 2.5 through 3.49

115
High—relates well 3.5 to 5
The respondents’ experiences were rated using four subscales on the SBI. (Note: The
quantitative data for the director was not reported in this research study because the research
consultants indicated the data of the students could not be compared.) These four subscales were
SBI Academic Adjustment (SBI-AA), SBI Social Adjustment (SBI-SA), SBI Personal-
Emotional Adjustment (SBI-PEA), and SBI Goal Commitment/Institutional Adjustment (SBI-
GCIA) were aligned with SACQ instrument. The researcher examined the clusters to better
understand the implications of the participant responses.
For the SBI academic subscales, the higher the score for the activity the more it relates to
the students and the lower the scores the activity did not relate to the students. The SBI-AA
subscale contained four clusters. When examining the mean ranges of the summer bridge
activities by cluster, several commonalities were noted. The “motivation” cluster scores ranged
from 4.64 to 2.05 (see Table 4.27 in Appendix O). The “application” cluster scores ranged from
4.64 to 1.59 (see Table 4.28 in Appendix O). The “performance” cluster scores ranged from 4.66
to 1.39 (see Table 4.29). And the final cluster scores pertaining to “academic environment”
ranged from 4.48 to 1.64 (see Table 4.30). The various summer bridge activities—in this case,
classes—that related highly on these clusters were the following: chemistry class, chemistry lab
class, engineering class, and math class in all SBI academic subscales.
For the SBI social subscales, the higher the score for the activity the more it relates to the
students and the lower the scores the activity did not relate to the students. The SBI-SA subscale
also contained four clusters. When examining the mean range scores of the summer bridge
activities by cluster, a number of commonalities were noted. The “general” cluster scores ranged
from 4.93 to 1.49 (see Table 4.39 in Appendix O). Scores for the second cluster, “other people,”
ranged from 4.81 to 1.48 (see Table 4.40 in Appendix O). The third cluster was “nostalgia” with
a corresponding range of from 4.48 to 1.71 (see Table 4.41 in Appendix O). The final cluster

116
pertained to “social environment;” its scores ranged from 4.38 to 1.86 (see Table 4.42 in
Appendix O). The following summer bridge activities related highly on these clusters: Fourth of
July cookout, bowling, skating, ropes course, etiquette dinner, and the trip to the mall.
Unlike the former two clusters, the SBI-PEA subscale contained only two clusters:
“psychological” and “physical.” For the SBI PEA subscales, the higher the score for the activity
the more it relates to the students and the lower the scores the activity did not relate to the
students. As before, several commonalities were observed when examining the mean range
scores of the summer bridge activities by cluster. The psychological cluster scores ranged from
4.10 to 2.48 (see Table 4.43 in Appendix O), while the physical cluster scores ranged from 4.17
to 1.52 (see Table 4.44 in Appendix O). The summer bridge activities that related highly on
these clusters were the Fourth of July cookout, bowling, skating, and ropes course.
The SBI-GCIA subscale also contained two clusters: “other” and “college.” A number
of commonalities were recorded with respect to the mean range scores for the summer bridge
activities by cluster. The other cluster scores ranged is 4.24 to 1.81 (see Table 4.45), while the
college cluster scores ranged from 4.51 to 2.02 (see Table 4.46). The summer bridge activities
that related highly on these clusters encompassed the following courses and activities:
engineering class, chemistry class, math class, chemistry lab class, Fourth of July cookout,
registration, id pickup, and campus tour. The participants also had to rank the activities from
highest to lowest (29 to 1). As shown in Table 4.25, the rankings ranged from 25.40 to 4.57. In
order of importance, the top six activities were the following: (1) engineering class, (2) math
class, (3) chemistry lab class, (4) chemistry class, (5) registration, and (6) ropes course.
Also important to this study was whether the distributions of the categorical variables for
the various summer bridge activities differed from one another. Chi square analysis confirmed
that race and gender were significant for particular summer bridge activities. Specifically, there
were a total of 23 activities that were significant for race and gender, with the following four

117
common activities showing the greatest significance: campus tour, Fourth of July cookout,
university freshman orientation, and individual/group pictures. The personal-emotional subscale
“physical” did not indicate any of the summer activities to be significant. Table 5.1 illustrates a
quick snapshot of the data.
Table 5.1a
SBI Activities that were Significantly Positive Based on Race
Summer Bridge Inventory Scales and Clusters
Summer Bridge Inventory Activities
Race Black & Hispanic
Race White & Asian
Academic Application Individual and Group Picture
Chemistry Class Engineering Class Math Class Campus Tour Seminar by Fortune 500 Company On-line Survey
X X X X X X X
Motivation Individual and Group Picture Skating Lab Tours On-line Survey
X X X
Environment Chemistry Lab Class X Performance
On-line Survey
X
Social
Environment University Freshmen Orientation X General
4th of July Cookout University Freshmen Orientation
X X
Nostalgia Floor Meeting Friday Seminars Trip to Mall
X X X
Other People Move-out Meeting X Personal-Emotional
Physical - - Psychological Updating Resumes X

118
Goal Commitment/ Institutional Adjustment
General University Freshmen Orientation X This College University Freshmen Orientation X Rank
-
The table illustrates a quick snapshot of the activities that were significant on each scale for the SBI when examining race. The X denotes what was significant for race.
Table 5.1b
SBI Activities that were Significantly Positive Based on Gender
Summer Bridge Inventory Scales and Clusters
Summer Bridge Inventory Activities
Gender Female Male
Academic Application Etiquette Dinner X Motivation Floor Meeting X Environment Registration & Class Sign Up and
information for fall term X
Performance -
Social Environment Move-out Meeting X General
Student Panel Introduction Meeting
X X
Nostalgia
Campus Tour
X
Other People -
Personal-Emotional
Physical - - Psychological
4th of July Cookout Updating Resumes
X X
Goal Commitment/Institutional
General - - This College - - Rank
-
-
Subscale Rank Individual and Group Pictures
Floor Meeting X
X The table illustrates a quick snapshot of the activities that were significant on each scale for the SBI when examining gender. The X denotes what was significant for gender.
119
ANOVA was completed and concluded that there was significance between the subscales and
activities.
The researcher concluded Phase II of the study by examining research Question Five
using a qualitative approach. The fifth and final research question asked participants (including
the program director) to identify the most and least beneficial aspects of the SBP. The SBI
survey used the SACQ as a framework to create a list of structured questions to examine the
participants’ and the director’s responses.
The qualitative findings portrayed the respondents’ unique viewpoints and experiences
with respect to how the summer bridge activities assisted with their own adjustment. There were
seven recurring themes, which have been broadly grouped into three comment categories: (1)
pre-college characteristics, (2) involvement, and (3) benefits of the SBP. Based on the
qualitative findings, a number of conclusions are suggested, which have been organized into the
following six sections that offer triangulation of the SACQ and SBI: (1) Academic Adjustment,
(2) Social Adjustment, (3) Personal-Emotional Adjustment, (4) Goal Commitment/Institutional
Adjustment, (5) Weakness of the Summer Bridge Program, and (6) Strengths of the Summer
Bridge Program. It should be stressed that since this research focused on participants in a SBP at
an R1 PWI, the results discussed herein should not be generalized to other college student
populations, majors, or other institutions of higher learning.
Academic Adjustment (AA)
For AA, the dominant theme was preparation, which in this context refers to the act of
being made ready (The Oxford Dictionary). The comments made by the participants and the
director were important for assessing this subscale. The student participants indicated that the
program helped them adjust academically. Paying attention to detail, relearning information,
getting used to college lectures, note-taking, and interacting with faculty were some of the

120
student comments that pertained to this subscale. In addition, the director stated that the program
provided the students with opportunities to learn and experience college life, as well as gain
some necessary skills such as time management that would help them improve as students.
Social Adjustment (SA)
The dominant theme for this subscale was also preparation. Both the director and the
participants agreed that SBP activities enhanced social adjustment. Specifically, making friends,
meeting a variety of people, creating support groups, and their introduction to other networks
(e.g., through theme housing) were discussed by the students as ways by which they became
better prepared socially in advance of their freshman term. The director stated similar
comments, adding that the students created strong social bonds, and learned to adjust with
individuals of different social and ethnic backgrounds.
Personal-Emotional Adjustment (PEA)
For this subscale, the dominant theme was networking, which refers to the process or
practice of building up or maintaining informal relationships, especially with people whose
friendships could bring advantages (The Oxford Dictionary, 1989). In other words, networking
enables individuals to create systems through which alliances can be formed. Both the students
and the director indicated that the program helped them (the students) adjust personally and
emotionally. The students stated that meeting people and making good friends were significant
for PEA. In addition, the director noted the student adjust personally and emotionally because of
the duration the program enabled them to connect with faculty, staff, and others in ways that
were likely to endure beyond the close of the SBP.

121
Goal Commitment/Institutional Adjustment (GCIA)
The dominant theme for the GCIA subscale was motivation. Motivation refers to the
driving force that initiates and direct behavior (The Oxford Dictionary, 1989). It has also been
defined as the internal and external energy that drives an individual to do something in order to
establish and achieve an objective. Both the students and director indicated that the program
assisted in goal commitment/institutional adjustment. Setting goals, defining purpose,
accomplishing goals, and clarifying what they wanted out of an engineering program were some
the comments made by the students that pertained to this subscale. The director discussed how
the students would have to learn how to control their academic and social situations, since there
are so many potential choices to make while in college.
Difficulties with Participating Summer Bridge Program
The dominant theme associated with difficulties proved to be students’ skills and abilities
for minorities and women, which generally refers to the inherent or learned aptitude needed to
identify and execute tasks in a proficient manner (The Oxford Dictionary, 1989). With respect to
the structure of the SBP, the students stated that although they thought the structure was
beneficial and helped them to achieve program goals while they were in the program, it was
difficult to implement the summer bridge structure once they started the fall term. Specifically,
the students found it more challenging to organize their day wisely and use good time
management skills. They contrasted this with how the summer program faculty had helped them
by taking the time to explain tasks and break down the academic information into more
manageable chunks. This was not the case during the fall term for some of the courses. In fact,
some of the participants did not believe they would have the skills and abilities to succeed. The
director indicated that the program needed to provide more academic workshops to assist
students with their skills and abilities. However, the director cautioned that too much hand-

122
holding could also be detrimental in that it would hinder students from learning how to make
good decisions and being successful in college.
Benefits of Participating Summer Bridge Program
The dominant theme with respect to SBP strengths was preparation. Being “geared up”
and ready to face challenges was discussed by both the students and the director as being
important. The students mentioned how the ropes course assisted them in dealing with stress.
Also, the SBP faculty, staff, and RAs were essential in helping the students adjust by answering
their questions and helping them prepare for courses. The director indicated that the SBP
facilitated a number of important opportunities for students to adjust to being on their own and
developing self-discipline academically and socially.
Association of Findings to Previous Research
The results of this research support previous studies on the experiences of engineering
students in SBPs. These include a number of reports (Astin, 1985; Pascarella & Terenzini, 2005;
Pascarella & Terenzini, 1980; Tinto, 1987) that have shown that college students who adjust
more easily to the social and academic rigors of college tend to do better in classes and
experience higher levels of retention. A related study by Rita and Bacote (1997) showed that
self-confidence and social/cultural adjustment of students increased after participating in a SBP.
Thus, the findings of the present study support these earlier investigations.
Other literature reports associated with this study have also documented the various
components that contribute to successful academic, social personal-emotional, and goal
commitment/institutional adjustment for college students. For example, there are a number of
studies that discussed the importance of academic performance, college readiness, close and
supportive relationships, and a sense of belonging to community in helping students adjust to
college (Brag, Kim, & Rubin, 2005; Maton, Hrabowski, & Schmitt, 2000; Robbins & Smith,

123
1993). These are aspects that were discussed by study participants, as well as the director of the
SBP.
Conclusions
The results of research added to the body of research on the experiences of engineering
students in SBPs. Overall, participants in the SBP indicated positive academic, social personal-
emotional, goal commitment/institutional adjustment. This supports the notion of creating an
environment in which students can engage and contribute something relevant and meaningful
(Kuh, Schuh, Whitt, & Associates, 1991), as well as one in which they can engage in positive
interactions with faculty and students (Pascarella & Terenzini, 1991). These results help to lay a
solid foundation for SBPs that have undergone or are in the process of becoming more
comprehensive programs for other types of college students—not just those enrolled in
engineering curricula.
The results of this research also provides support for SBPs preparing students for
engineering and the academic, social, personal-emotional, and goal commitment/institutional
adjustment experiences they may encounter in the college environment. In addition, the
quantitative findings for Phase I of this study indicate a need to further explore and enhance the
personal-emotional adjustment of female undergraduate engineering majors. The quantitative
findings associated with Phase II of this study indicate that more emphasis should be placed on
summer bridge activities that focus on personal-emotional and goal commitment/institutional
adjustment. The qualitative findings also show that race and gender are important issues to
explore when examining the experiences of engineering students and their academic, social,
personal-emotional, and goal commitment/institutional adjustment. The qualitative findings
have further indicated that the views of the participants and the director were quite similar when

124
they discussed academic, social, personal-emotional, and goal commitment/institutional
adjustment.
This research adds to the literature on academic, social, personal-emotional, and goal
commitment/institutional adjustment and college engineering students. This conceptual model
(see Figure 1) can be used to understand students’ adjustment or withdraw issues. These
findings can be utilized by a variety of educators and researchers who are interested in
understanding the ways in which engineering students typically adjust in these four areas. The
results can be utilized to help summer bridge managers and administrators to plan and implement
programs and activities at their colleges or universities. As the world becomes more competitive
with respect to global demands for expertise in science and technology, it is vital that U.S.
institutions of higher learning create and support SBP efforts that will assist college students to
adjust in more holistic ways so that they can complete their degree programs and join a
competitive workforce.
Limitations
There were a number of noteworthy limitations to the study, largely associated with the
way this investigation was structured and carried out. The primary limitation had to do with the
fact that the population sample was limited to students at single R1 predominantly White
institution (R1 PWI) who were participating in a college of engineering SBP. Thus, the
population was restricted to that particular cohort. In addition, the culture of the particular
university may have an effect on the findings. Findings might be different at a smaller private
college, or another type of institution.
Second, the sample may have been biased towards students who were already involved in
the SBP. Since these college students were already participating in the SBP, they may have been
inherently more motivated to want to make a smoother transition from high school to college.

125
The third limitation was that participants in the sample consisted of students who had
willingly replied to the invitation to contribute to the quantitative and qualitative portion of the
SBI. It is possible, therefore, that the volunteers differed in some way from those who did not
volunteer to participate. This may have resulted in the SBI data being skewed and may not have
reflected a holistic picture of the SBP activities and perspectives.
Fourth, the researcher collected the data over a seven-month time period. However, it is
known that adjustment to college is a time-sensitive issue, and that the developers of the SACQ
recommended that results be obtained in a timely fashion (Baker, & Siryk, 1999). Therefore, it
is possible that those who participated in the SBP had more time to make the adjustment to
college compared to students who did not participate in the SBP. This could have influenced the
findings based on time and perception. Summer Bridge participants could have perceived
themselves as well adjusted.
Finally, the results of the interview data could have been skewed by the way in which
they were collected. This study relied on the perceptions and experiences of students and the
director. However, since the researcher was associated with the SBP under scrutiny, the student
response could have been influenced by social desirability. In other words, the students might
have felt pressured to answer in ways that did not truly reflect their opinions. If the focus group
and interview data had been collected by other students or by another person with no connection
to the program, perhaps the response would have been different (Patton, 2002).
Areas for Future Research
Some of the limitations described above are also applicable as areas for future research.
These include, but are not limited to the following:

126
1. A follow-up qualitative study involving non-participants in a SBP should be conducted to
view what activities assisted them in their academic social, personal-emotional, and goal
commitment/institutional adjustment.
2. Follow-up studies should be conducted yearly with the summer bridge students to
determine what other adjustment issues they faced as undergraduates—and whether and
how they overcame them.
3. A future research study could examine other demographic differences in adjustment, for
example socioeconomic differences, among others.
4. A comparative quantitative study should be conducted to determine if there are
similarities and/or differences among other SBPs at predominantly White institutions?
5. A comparative qualitative study should be conducted to determine if there are similarities
and/or differences among other SBPs at Historically African-American Colleges and
Universities?
6. A meta analysis and findings should be conducted to determine if the findings discussed
herein are indicative of all SBPs?
7. A follow up quantitative and qualitative study to further explore how to enhance the
personal-emotional adjustment of female undergraduate engineering majors.
8. A follow up study using the SACQ should be conducted within 2 years to determine if
summer bridge student’s adjustment scores are different.
Implications for Future Practice, Research, and Policy
The findings of this research have implications for future professional practice, research
investigations, and policy formulation. In relation to future practice of SBPs of any focus the
findings discussed herein can be used to inform practice and decision making for a number of
constituencies, including those who manage SBPs, directors of summer support programs, and

127
deans in higher education. However, these findings are particularly relevant for managers of
engineering SBP at Research 1 institutions to plan activities that will be effective in preparing
and training students for rigorous engineering programs. In so doing, they will assist students in
their academic, social, and personal-emotional and goal commitment/institutional adjustment. In
particular, SBP managers may want to present more varied activities or workshops that that will
prepare students for the goal commitment/institutional adjustment to college, since GCIA was
not ranked on the SBI. This could include, for example, workshops related to navigating
college—possibly involving panels of upper-class students discussing their experience on being
successful in college. The workshops presenter should be clear and concise on it purpose if it is
about time management and study skills.
Higher education policymakers and administrators could also utilize this study, since it
provides important information about the different types of students at Research 1 institutions
who could benefit from participating in engineering SBPs. The qualitative data about the
engineering students in this investigation and the rich comments about their SBP experiences
could also enhance the ability of program managers to design more effective activities and
services. Clearly, the goal of a SBP is to increase persistence among engineering students.
Thus, in addition to designing and implementing new programs, the findings discussed herein
may also assist SBP managers to improve existing programs.
This study also has implications with respect to gender differences of students at
Research I institutions. Since the results described herein revealed that women who participated
in the study reported lower personal-emotional adjustment scores than men, SBP managers
should consider providing specialized opportunities/activities for women to help increase self
perception, self-esteem, physical, and personal well-being.
Summer bridge managers at Research I institutions should also consider reevaluating
their programs to make sure they align with the factors discussed in the SACQ (academic, social,

128
personal-emotional, and goal commitment/institutional adjustment). In so doing, a more holistic
approach could be used to prepare students for college success—and especially those enrolled in
programs of engineering.
Directors of support programs and deans may use the data for expanding the pool of
engineering students at Research I institution. Moreover, since the results from this research
provided information from a variety of engineering students about their academic, social,
personal-emotional, and goal commitment/institutional adjustment to the college environment,
engineering directors and deans may also be interested in the results of this study. Deans could
use the data to create programs to help faculty and others understand the various adjustment
issues engineering students may face during college, and especially as freshmen. Given the
participants’ stated need for interacting with peers, faculty and staff, more opportunities for such
interactions to occur (i.e., mentoring and workshops) could be facilitated by deans and
administrators. Assessments could also be routinely conducted to identify any adjustment issues
so that they could be addressed in a timely fashion. Ultimately, it is hoped that the findings from
this investigation could be used by SBP faculty, staff, and administrators to increase enrollment
and retention numbers in colleges and programs of engineering.
This research study also has implications for policy at the institutional, state and federal
levels. Administrators at the institutional level may use the results to reevaluate policy and
procedures about SBPs that target engineering students at Research I institutions. The outcomes
from this investigation could reinforce the need for these types of SBPs so that they become
more prevalent on college campuses, not just at larger R1 PWIs.
At the state level, policymakers can use these results to create policies to increase the
participation of college students in engineering SBPs. Specifically, state policymakers can
reassess levels of support for these programs and augment current levels and/or create other
funding opportunities so that more students can learn important academic, social, personal-

129
emotional, and goal commitment/institutional adjustment skills that will increase their likelihood
of their college success at Research I institutions.
Finally, policymakers at the federal level can use the findings described herein to increase
their awareness of the adjustment issues of engineering students at Research I institutions. The
federal government has a history of creating programs that have increased access to higher
education, as well as others that have improved retention rates. For example, Noel, Levitz,
Saluri et al. (1985) reported how the federal government forced states and institutions of higher
education to deal with the influx of African American students entering colleges in late 1960s.
Therefore, federal policymakers might use the findings associated with SBPs to encourage state
institutions of higher education to implement these programs so that more students might be
successful in college.
Personal Reflections
It was through this dissertation process that I really came to believe that I had the talent
and the capability to become a researcher and an educator. Although initially I had so many ideas
for a dissertation topic, I found my passion for research (and my Ph.D. topic) through my
graduate assistantship (GTA) with the SBP. I thought I had a good idea of what a SBP was all
about, but I soon learned that I had more questions than answers—some of which were pretty
basic. For example,
1. What is a summer bridge program?
2. Why they are typically held?
3. Who do they serve?
Research starts with a question, and the questions mentioned above led me to discover that there
was no single answer to any of them. Certainly, there were commonalities. For example,
researching this topic taught me that SBPs are among the oldest strategies used to improve

130
college retention (Garcia, 1991). Surprisingly, even though conference proceedings and a
number of studies have acknowledged that SBPs are generally advantageous for their target
populations, there has been very little empirical evidence assessing their effectiveness
(Ackerman, 1990; Gandara & Maxwell-Jolly, 1999; Garcia, 1991; Kluepfel, 1994; Pascarella &
Terenzini, 2005; Rita & Bacote, 1997). Thus, given the number of institutions of higher
education that provide SBPs of this sort, it was vital to investigate just how effective they
actually were using both quantitative and qualitative techniques. Clearly, to make it a
manageable study, it had to be targeted. Thus, this research was about engineering students and
their academic, social, personal-emotional and goal commitment/institutional adjustment.
Through their stories and the surveys described earlier, they were able to reveal the adjustment
issues they faced as college freshmen.

131
REFERENCES
Ackerman, S. (April-June 1991). The benefits of summer bridge programs for underrepresented
and low-income students. Community/Junior College Quarterly of Research and
Practice, 15, 201-208.
Adams, M. (1979). An analysis of meanings attached to “involvement” by ANUstudents and
teaching staff. In proceedings of AARE Conference. Melbourne, 508-519.
Anderson, E. L. (2006). Increasing the success of minority students in science and technology.
American Council on Education.
Asher, E. J. (2007). [Review of the test Student Adaptation to College Questionnaire]. The
sixteenth mental measurements yearbook. Retrieved September 1, 2007, from Ovid
Technologies, Inc. Mental Measurements Yearbook database.
Astin, A. W. (1999). Student involvement: A developmental theory for higher education.
Journal of College Student Development, 40, 518-529.
Astin, A. W. (1993). What matters in college: Four critical years revisited (1st ed.). San
Francisco, CA: Jossey-Bass.
Astin, A. W. (1985). Achieving educational excellence. San Francisco: Jossey-Bass.
Astin, A. W. (1984). Student involvement: A developmental theory for higher education.
Journal of College Student Personnel, 25, 297-308.
Astin, A. W. (1999). Student involvement: A developmental theory of higher education.
Journal of College Student Development, 40, 518-529.
Astin, H. S., & Sax, L. J. (1996). Developing scientific talent in undergraduate women. In C.
Davis, A. B. Ginorio, C. S. Hollenshead, B. Lazarus, P. Rayman, & Associates (Eds.),
The equity equation: Fostering the advancement of women in the sciences, mathematics,
and engineering (pp. 96-121). San Francisco: Jossey-Bass.

132
Baker, R. W., & Siryk, M. A. (1999). Student adaptation to college questionnaire manual. Los
Angeles: Western Psychological Services.
Baker, R. W., & Siryk, B. (1983). Social propensity and college adjustment. Journal of College
Student Personnel, 24, 331-336.
Baker, R. W., & Nisenbaum, S. (1979). Lessons from an attempt to facilitate freshman transition
into college. Journal of American College Health Association, 28(2), 79-81.
Baker, R. W., & Siryk, B. (1984). Measuring adjustment to college. Journal of Counseling
Psychology, 31, 179-189.
Baker, R. W., McNeil, O.V., & Siryk, B. (1985). Expectation and reality in freshmen adjustment
to college. Journal of Counseling Psychology, 32, 94-103.
Baker, R. & Siryk, B. (1986a). Measuring adjustment to college. Journal of Counseling
Psychology, 31(2), 179-189.
Baker, R., & Siryk, B. (1986b). Exploratory intervention with a scale measuring adjustment to
college. Journal of Counseling Psychology, 33(1), 31-38.
Baker, R. W., & Siryk, M. A. (1992a). Experiential counterparts of test-indicated
disillusionment during freshman adjustment to college. NACADA Journal, 12(2), 13-22.
Baker, R. W. & Siryk, M. A. (1992b). Measuring expectations about college adjustment.
NACADA Journal, 12(2), 23-32.
Babbie, E. R. (2005). The basics of social research, (3rd ed). Wadsworth: Belmont, CA.
Babbie, E. (1990). Survey research methods, (2nd ed). Wadsworth: Belmont, CA.
Bayles, T., Morrell, C., & Spence, A. (2006, June). Science, technology, engineering, and
mathematics talent expansion program: An analysis of a pilot program. Paper presented
at the meeting of the American Society for Engineering Education.

133
Bayles, T. M., Spence, A. M., & Morrell, C. (2004, June). Improving the freshman engineering
experience. Paper presented at the meeting of the American Society for Engineering
Education.
Beakley, G. C., & Chilton, E. G. (1972). Involvement increases motivation to learn.
Engineering Education, 62(8), 876-878.
Bragg, D. D., Kim, E., & Rubin, M. B. (2005). Academic pathways to college: Policies and
practices of the fifty states to reach underserved students. Paper presents at the annual
meeting of the Association for the Study of Higher Education, Philadelphia, PA.
Brannan, K. P., Wankat, P. C. (2005). Survey of first-year programs. Paper presented at the
meeting of the American Society for Engineering Education.
Bryant, B., & Trower, P. E. (1974). Social difficulty in a student sample. British Journal of
Educational Psychology, 44, 13-21.
Boyer, R., & Bayles, T. M. (2005, June). A WORTHY pursuit for tomorrow’s engineers. Paper
presented at the meeting of the American Society for Engineering Education.
Bourque, L. B. & Fielder, E. P. (1995). How to conduct self-administered and mail surveys.
Sage: London.
Bragg, D. D., Kim, E., & Rubin, M. B. (2005). Academic pathways to college: Policies and
practices of the fifty states to reach underserved students. Paper presents at the annual
meeting of the Association for the Study of Higher Education, Philadelphia, PA.
Bundy, D. (1994). Counselor tutorial program: A cooperative learning program for the high-
risk freshman engineering courses. Journal of the Freshman Year Experience, 6, 29-52.
Chang, J. C. (2004). Women and minorities in the science, mathematics and engineering
pipeline. Eric Digest. Retrieved on June 2, 2004 from the
http://ww.ericdigests.org/2003-2/women.html.

134
Chapman, C. A., & Logan, B. L. (1996). The bridge: A viable retention program for African-
American Students. In Student retention: Success models in higher education, Ed.
Clinita A. Ford, 27-40. Tallahassee, FL: CNJ Associates, Inc.
Choy, S. P. (2002). Access and persistence: Findings from 10 years of longitudinal research on
students. American Council on Education.
Coppula, D. (1997). STAR POWER. ASEE Prism, 6(15). Retrieved on June 2, 2004 from
http://vnweb.hwwilsonweb.com/hww/results/results_common.jhtml?nn=2.
Creswell, J. W. (2003). Research design qualitative, quantitative, and mixed methods
Approaches (2nd Ed). Thousand Oaks, CA: Sage.
Dale, P. M., & Zych, T. (1996). A successful college retention program. College Student
Journal, 30 (3), 354-361.
Dahmus, S., & Bernardin, H. J. (1992). Student Adaptation to College Questionnaire.
Measurement & Evaluation in Counseling & Development, 25. Retrieved April 1, 2008,
from http://web.ebscohost.com/ehost/detail?vid=7&hid=12&sid=497c7ab1-633a-494f-
a97d-03a3023bf3dc%40sessionmgr8
Darling-Hammond, L. (2004). What happens to a dream deferred? The continuing quest for
equal educational opportunity (pp. 607-627). In Handbook of research on multicultural
education (2nd ed.). San Francisco: Jossey-Bass.
Diefes-Dux, H. (2006, June). Does a successful mathematics bridge program make for
successful students? Paper presented at the meeting of the American Society for
Engineering Education.
Dimitriu, D., & O’Connor, J. (2002, June). The EDGE summer program in its third year. Paper
presented at the meeting of the American Society for Engineering Education.
Durkheim, E. (1951). Suicide. New York: The Free Press.

135
Flecter, S. L., Newell, D. C., Newton, L. D., & Anderson-Rowland, M. R. (2001, June). The
WISE summer bridge program: Assessing student attrition, retention, and program
effectiveness. Paper presented at the meeting of the American Society for Engineering
Education.
Fletcher, S., & Anderson-Rowland, M. R. (2000, June). Developing retention strategies for
Women that promote student success in engineering and the applied sciences. Paper
presented at the meeting of Professional. American Society Engineering Education.
Fink, A. (1995). The survey handbook. London, New Delhi: Sage.
Hinkle, D. E., Wiersma, W. and Jurs, S. G. (1998). Applied statistics for the behavioral
Sciences(4th ed). Boston: Houghton Mifflin Company.
Gandara, P., & Maxwell-Jolly, J. (in press). Priming the pump. A review of programs that aim to
increase the achievement of underrepresented minority undergraduates. A report to the
Task Force on Minority High Achievement of the College Board. New York: College
Board. (http://www.collegeboard.org/research/html/PrimingThePump.pdf)
Garcia, P. (1991). Summer bridge: Improving retention rates for underprepared students.
Journal of the Freshman Year Experience, 3, 91-105.
Gold, M., Deming, M. P., & Stone, K. (1992). The bridge: A summer enrichment program to
retain African-American collegians. Journal of the Freshman Year Experience, 4(2),
101-117.
Green, A. M. (2006). Factors influencing the persistence and non-persistence of African
students in scientific majors at a predominantly White university. [Abstract].
Unpublished Dissertation Virginia Polytechnic Institute and State University.
Hendley, V. (1997). Recruiters hear a “me, too!” From community college students. Retrieved
on June 2, 2004 from
http://vnweb.hwwilsonweb.com/hww/results/results_single.jhtml?nn=13.

136
Howard, G. R. (2006). We can’t teach what we don’t know: White teachers, multiracial
schools. New York: Teacher’s College Press.
Hudspeth, M. C., & Aldrich, J. W. (2000, June). Summer bridge to engineering. Paper
presented at the meeting of Professional American Society Engineering Education.
Kahlenberg, R. D. (2004). America’s untapped resource: Low income student in higher
education. New York: Twentieth Century Fund.
Kaplin, W. A., & Lee, B. A. (1997). A legal guide for student affairs professionals. San
Francisco, CA: Jossey-Bass.
Kapp, G. J. (1979). College co-curricular activities: Who participates and what are the benefits?
Unpublished doctoral dissertation, University of California, Los Angeles.
Kirst, M. W. (2004). The high school/college disconnect. Educational Leadership, 62(3), 51-
55.
Kluepfel, G. A. (1994). Introduction: Special issue on retention programs. Journal of
Development Education, 3, 28-33.
Kuh, G. D., Schuh, J. H., Whitt, E. J., & Associates. (1991). Involving colleges: Successful
approaches to fostering student learning and development outside the classroom. San
Francisco: Jossey-Bass.
Kulik, C., Kulik, J., & Shwalb, B. (1983). College programs for high-risk and disadvantage
students: A meta-analysis of findings. Review of Educational Research, 53, 397-414.
Lenning, O.T., Sauer, K., & Beal, P. E. (1980). Student retention strategies. AAHE-ERIC
Higher Education Research Report, 8. Washington, DC: George Washington University.
Levin, M., & Levin, J. (1991). A critical examination of academic retention programs for at-risk
minority college students. Journal of College Student Development, 32, 323-334.
Lincoln, Y., & Guba, E. (1985). Naturalistic inquiry. Newbury, CA: Sage.

137
Maton, K. I., Hrabowski, F. A., & Schmitt, C. L. (2000). African American college students
excelling in the sciences: College and postcollege outcomes in the Meyerhoff Scholars
Program. Journal of Research in Science Teaching, 37(7), 629-654.
McCluskey-Titus, P. (2003). Assessing what students learn from involvement in campus
activities. Campus Activities Programming, 19(6), 34-38.
McGregor, L. N., Mayleben, M. A., Buzzanga, V. L., Davis, S. F., & Becker, A. H.
(1991). Selected personality characteristics of first-generation college students. College
Student Journal, 25, 231-234.
Merriam, S. B., & Simpson, E. L. (1995). A guide to research for educators and trainers of
adults, (2nd Ed). Krieger: Malabar, FL.
McDonough, P. M. (2004). The school-to-college transition: Challenges and prospects.
American Council on Education.
Merriam-Webster Online Dictionary (2007). Retrieved April. 8, 2007 from
http://www.webster.com/.
Moore, J. L., Madison-Colmore, O., Smith, & D. M. (2003). The prove-them-wrong syndrome:
Voices from unheard African American Males in engineering disciplines. The Journal of
Men’s Studies, 12, (1), 61-73.
Nagchaudhuri, A., & Singh, G. (2001, June). Summer engineering bridge program at the
University of Maryland Eastern Shore: Objectives and enrichment activities. Paper
presented at the meeting of the American Society for Engineering Education.
National Academy of Sciences. (2007). Rising above the gathering storm: Energizing and
employing America for a brighter economic future. Washington, DC: Author.
National Center for Education Statistics. (2003). Table 66: Schools and Staffing Survey (SASS),
"Public Teacher Questionnaire," 1999-2000; Private Teacher Questionnaire," 1999-2000;

138
and "Charter Teacher Questionnaire," 1999-2000. Retrieved March 12, 2007 from
http://nces.ed.gov/programs/digest/d05/tables/dt05_066.asp.
National Science Foundation (2007). LSAMP bridge to the doctorate. Retrieved February 24,
2007, from http://www.nsf.gov/funding/pgm_summ.jsp?pims_id=5477.
National Science Foundation (2006). Science and engineering indicators 2006. Retrieved
February 24, 2007, from http://www.nsf.gov/statistics/seind06/c1/c1h.htm.
National Science Board. (2003). The science and engineering workforce realizing America
potential. Retrieved on March 7, 2007, from
http://www.nsf.gov/nsb/documents/2003/nsb0369/nsb0369.pdf.
Newell, L. J. (1984). A catalyst and a touchstone: Involvement in learning. Change, 16(8), 7-
10.
Noel, L., Levitz, R., & Saluri, D., (1985). Increasing student retention: Effective Programs and
practices for reducing dropout rate. San Francisco: Jossey-Bass.
Oakes, J., Joseph, R., & Muir, K. (2004). Access and achievement in mathematics and science
(pp. 69-88). In Banks, J. A. & McGee Banks, C. (Eds), Handbook of research on
multicultural education (2nd Ed.). San Francisco: Jossey-Bass.
Ohland, M. W., & Collins, R. E. (2002, June). Creating a catalog and meta-analysis of freshman
program for engineering students: Part 2: Learning communities. Paper presented at the
meeting of the American Society for Engineering Education.
Ohland, M. W., & Crockett, E. R. (2002, June). Creating a catalog and meta-analysis of
freshman programs for engineering students: Part 1: Summer bridge programs. Paper
presented at the meeting of the American Society for Engineering Education.
Orfield, G., & Paul, F. (1988). Declines in minority access: A tale of five cities. Educational
Record, 57-62.

139
Pascarella, E. T., & Terenzini, P. T. (1980). Predicting freshman persistence and voluntary
dropout decisions from a theoretical model. Journal of Higher Education, 51, 60-75.
Pascarella, E. T., & Terenzini, P. T. (2005). How college affects students: A third decade of
research (Vol. 2). San Francisco: Jossey-Bass.
Pascarella, E. T., & Terenzin, P. T. (1991). How college affects students: Findings and Insights
from Twenty Years of Research. San Francisco, CA: Jossey-Bass.
Pascarella, E. T. (1980). Student-faculty informal contact and college outcomes. Review of
Educational Research, 50, 545-595.
Pascarella, E. T., & Terenzini, E. T. (1980). Predicting freshman persistence and voluntary
dropout decisions from a theoretical model. Journal of Higher Education, 51, 60-75.
Patton, M. Q. (2002). Qualitative research & evaluation methods. Thousands Oaks, CA: Sage.
Pervin, L. A., & Rubin, D. B. (1967). Student dissatisfaction with college and the college
dropout: A transactional approach. Journal of Social Psychology, 72, 285-295.
Rita, E. D., & Bacote, J. (1997). The benefits of college discovery prefreshmen summer
program for minority and low-income students. College Student Journal, 31, 161-173.
Reber, A. S. (1985). The penguin dictionary of psychology. New York: Viking Penguin, Inc.
Robert, E. R., & Thomson, G. (1994). Learning assistance and the success of underrepresented
students at Berkeley. Journal of Development Education, 17, (3), 4-14.
Robbins, S., & Smith, L. (1993). Enhancement programs for entering university majority and
minority freshmen. Journal of Counseling and Development, 71, 510-514.
Rossi, P. H., Wright, J. D., & Anderson, A. B. (1983). Handbook of survey research. : San
Diego: Academic Press, Inc.
Rossman, G., & Rallis, S. F. (2003). Learning in the field. An introduction to qualitative
research, (2nd Ed). Thousand Oaks, CA: Sage.
Rubio, D. (2005). Content validity. Encyclopedia of Social Measurement, 1, 495-498.

140
Ruppert, S. S. (2003). Closing the college participation gap: A national summary. (No. PS-03-
01, pp. 1-22). Denver, CO: Education Commission of the States.
Seymour, E., & Hewitt, N. (1997). Talking about leaving: Why undergraduates leave the
sciences. Boulder, CO: Westview.
Sharp, L., Kleiner, B., & Frechtling, J. (2000). A description and analysis of best practice
findings of programs promoting participation of underrepresented undergraduate students
in science, mathematics, engineering, and technology fields. (#RED 94-52966).
Washington, DC: National Science Foundation.
Siryk, B. (1981). Identification of high-risk college students. Paper presented at the Annual
Convention of the American Psychological Association (Los Angeles, CA, August 24-28,
1981).
Smedley, B. D., Butler, A. S., & Bristow, L. R. (2004). In the nation's compelling interest:
ensuring diversity in the health-care workforce/committee on institutional and policy-
level strategies for increasing the diversity of the U.S. health care workforce, board on
health sciences policy. Washington, D.C.: National Academies Press.
Smith, G., Smith, A., & Clark, A. (2007). Evaluating service quality in universities: a service
department perspective. Quality Assurance Education, 15 (3), 334-351.
Spady, W. G. (1970). Dropouts from higher education: An interdisciplinary review and
synthesis. Interchange, 1(1), 64-85.
Swail, W. S. (1995). A conceptual framework for student retention in science, engineering, and
mathematics. Dissertation conducted at the George Washington University, Washington,
DC.
Swail, W. S., Redd, K. E., & Perna, L. W. (2003). Retaining minority students in higher
education: A framework for success. ASHE-ERIC Higher Education Report, 30(2). San
Francisco: Jossey-Bass.

141
Terenzini, P. T., & Pascarella, E. T. (1977). Voluntary freshman attrition and patterns of social
and academic intergrationin a university: A test of a conceptual model. Research in
Higher Education, 6, 25-43.
Terenzini, P. K., Pascarella, E. T., & Blimling, G. S. (1996). Students’ out-of-class experiences
and their influence on learning and cognitive development: A literature review. Journal
of College Student Development, 37(2), 149-162.
The Chronicle of Higher Education (2000). Facts & Figures: Carnegie Foundation
Classifications. Retrieved October 8, 2007, from
http://chronicle.com/stats/carnegie/carnegie_results.php3#definitions.
The Oxford English Dictionary. (2nd
ed.) 1989. OED Online. Oxford University Press. 20 May
2009 http://dictionary.oed.com.
Tinto, V. (1987). Leaving college: Rethinking the causes and cures of student attrition. Chicago:
The University of Chicago Press.
Tinto, V. (1993). Leaving college: Rethinking the causes and cures of student attrition.
Chicago: The University of Chicago.
Tinto, V. (1990). Principles of effective retention. Journal of the Freshman Year Experience,
2(1), 35-48.
Tinto, V. (2004). Rethinking the first year of college. Retrieved February 24, 2007, from
Syracuse University, School of Education Web Site:
http://soeweb.syr.edu/Faculty/Vtinto/.
University of South Carolina (2002). University 101 – The Student in the University. Retrieved
March 7, 2007, from http://www.sc.edu/univ101/courses/univ101/index.html.
Varde, K. S. (2004, June). Effects of pre-freshman program for minority students in engineering.
Paper presented at the meeting of the American Society for Engineering Education.

142
Wadhwa, V. (2007). Fixing engineering's gender gap; women should be mentored not only to be
engineers, but to become entrepreneurs in the field. And such encouragement has to start
early. Business Week Online (Feb 2, 2007): NA. InfoTrac OneFile. Thomson
Gale. Virginia Tech. Retrieved February 19, 2007 from
http://find.galegroup.com/itx/infomark.do?&contentSet=IAC-
Documents&type=retrieve&tabID=T003&prodId=ITOF&docId=A158741108&source=g
ale&srcprod=ITOF&userGroupName=viva_vpi&version=1.0.
Waller, T., & Watford, B. (2004, June). ASPIRE- the academic summer program introducing
resources for engineers. Paper presented at the meeting of the American Society for
Engineering Education.
Wang, E., Velasquez-Bryant, N., Adams, J., Batchman, T., Cantrell, P., Jacobson, E., et al.
(2004, June). Paper presented at the meeting of the American Society for Engineering
Education.
White, C., Curtis, M. W., & Martin, C. S. (2001). Pre-freshman accelerated curriculum in
engineering (PACE) summer bridge program. Paper presented at the meeting of the
American Society for Engineering Education.
Willis, D. (1989). Involvement in academic study: An investigation of the nature, effects and
development of involvement in university course. Unpublished Dissertation, Victoria
University of Wellington, New Zealand.
Zhang, G., Anderson, T., Ohland, M., Carter, R., & Thorndyke, B. (2002). Identifying factors
influencing engineering student graduation and retention: A longitudinal and cross-
institutional study. Proceeding ASEE Annual Conference & Exposition in Montreal,
Quebec.

143
APPENDICES

144
Appendix A: Summer Bridge 2007 Activity Schedule
Academic Analysis: Students will participate in Academic Analysis once each week for 15 minutes. Each student will meet individually with an Academic Advisor to review your academic performance. See form in the binder for your advisor. Gym(s): Students will have access to the gym from June 25-July 28. You will need to have your id to enter the facilities. Residence Hall Activities: The Residence Hall Advisors will plan activities during the week.
Week & Date Activity Coordinator Time Location & Other Notes WEEK I: JUNE 24-30 Sun., June 24 Individual Pictures TBA TBA Residence Hall Introduction Meeting TBA TBA Student Center Group Picture TBA TBA Student Center Schedule Overview TBA TBA Student Center Campus Tour TBA TBA Finding classes and campus highlights Floor Meeting TBA TBA Residence Hall Mon., June 25 Pickup Student ID TBA TBA Don’t green card, driver’s license and/or
social security card Tues., June 26 Registration & Class
Sign up information for each student
TBA TBA Chemistry Building
Tues., June 26 Orientation Meeting with Dean
TBA TBA Chemistry Building
Fri., June 29 Seminar TBA TBA Chemistry Building “What’s New with Technology?”
Fri., June 29 Evening Out! TBA TBA Student Center Sat., June 30 Skating TBA TBA Bus will be outside Residence Hall at 12:45
PM

145
WEEK II: July 1 - 7 TBA TBA Sun., July 1 Trip to Mall (1 bus-sign
up sheet) TBA TBA Bus leaving at 1:15 PM
Tues., July 3 Orientation Meeting with Dean
TBA TBA Chemistry Building
Wed., July 4 4th of July Cookout & Fun
TBA TBA Pavilion
Fri., July 6 Seminar TBA TBA Chemistry Building- Bring your resume
Sat./Sun., July 7 & 8 Ropes Course TBA TBA Meet at buses at 8:15 a.m. Week & Date Activity Coordinator Time Location & Other Notes WEEK III: July 8 – 14 TBA TBA
Sat./Sun., July 7 & 8 Ropes Course TBA TBA Meet at buses at 8:15 a.m. Mon., July 9 Work on Updating Your
Resumes TBA TBA Meet with your assigned RHAs for
assistance Tues., July 10 Orientation Meeting TBA TBA Chemistry Building Wed., July 11 Lab Tour TBA TBA TBA Fri., July 13 Seminar TBA TBA Chemistry Building
Fri., July 13 Etiquette Dinner TBA TBA Banquet Room; professional dress…see
your RHA if you have questions Sat., July 14 Fortune 500 Company
Teambuilding Activities TBA TBA TBA
WEEK IV: July 15 – 21 TBA TBA Mon., July 16 Updated Resume Due TBA TBA Email updated resume to director Tues., July 17 Orientation Meeting
with Dean TBA TBA Chemistry Building
Wed., July 18 Lab Tour TBA TBA TBA Thurs., July 19 Move-Out Meeting TBA TBA TBA

146
Fri., July 20 Seminar Sponsored by Fortune 500 Company
TBA TBA Chemistry Building “What Do I Want To Do With My Life?”
Sat., July 21 Fortune 500 Company Visit
TBA TBA TBA
WEEK V: July 22 – 28 TBA TBA Sun., July 22 Student Panel TBA TBA TBA Tues., July 24 On-line Survey TBA TBA On-line survey must be completed by 5 p.m. Tues., July 24 Orientation Meeting
with Dean TBA TBA Chemistry Building
Thurs. & Fri. July 26 & 27
University Freshmen Orientation!
TBA TBA Attendance is required for all activities. Contact STEP Staff if you have questions
Fri., July 27 Check-in Laptops TBA TBA 1:00 PM Group A 1:30 PM Group B 2:00 PM Group C
Sat., July 28 Move-Out TBA TBA Residence Hall – move out must be completed by 10:30
Sat., July 28 Closing Ceremony TBA TBA TBA
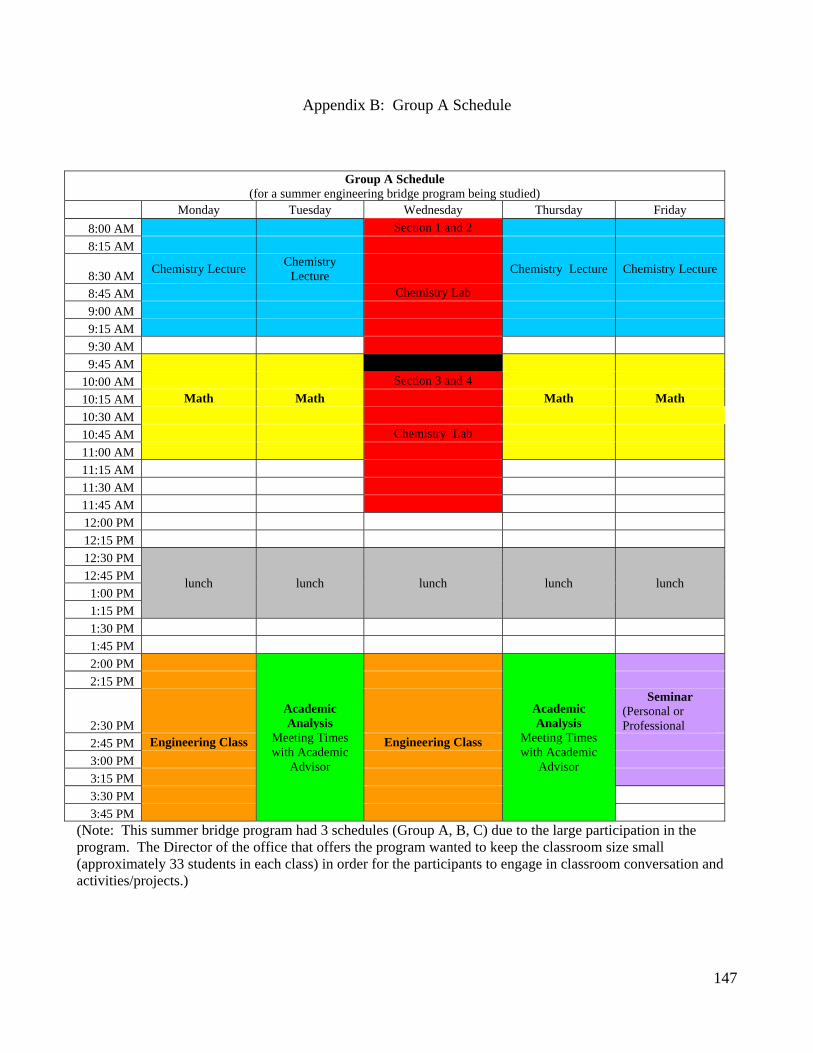
147
Appendix B: Group A Schedule
Group A Schedule (for a summer engineering bridge program being studied)
Monday Tuesday Wednesday Thursday Friday 8:00 AM Section 1 and 2 8:15 AM
8:30 AM Chemistry Lecture Chemistry Lecture Chemistry Lecture Chemistry Lecture
8:45 AM Chemistry Lab 9:00 AM 9:15 AM 9:30 AM 9:45 AM
10:00 AM Section 3 and 4 10:15 AM Math Math Math Math 10:30 AM 10:45 AM Chemistry Lab 11:00 AM 11:15 AM 11:30 AM 11:45 AM 12:00 PM 12:15 PM 12:30 PM
lunch lunch lunch lunch lunch 12:45 PM 1:00 PM 1:15 PM 1:30 PM 1:45 PM 2:00 PM
Academic Analysis
Meeting Times with Academic
Advisor
Academic Analysis
Meeting Times with Academic
Advisor
2:15 PM
2:30 PM
Seminar (Personal or Professional
2:45 PM Engineering Class Engineering Class 3:00 PM 3:15 PM 3:30 PM 3:45 PM
(Note: This summer bridge program had 3 schedules (Group A, B, C) due to the large participation in the program. The Director of the office that offers the program wanted to keep the classroom size small (approximately 33 students in each class) in order for the participants to engage in classroom conversation and activities/projects.)

148
Appendix C: SACQ Survey

149

150

151
Appendix D: Supplementary Table 4.0
Table 4.0. Demographic Characteristics of the Sample (N=134)
Question Summer Participants
(n=67) Non-summer
Participants (n=67) 1. What is your gender?
Male Female
59.7% (40) 40.3% (27)
58.2% (39) 41.8% (28)
2. What is your age? 16 17 18 19
0 6.0% (4) 77.6% (52) 16.4% (11)
3.0% (2) 0 79.1% (53) 17.9% (12)
3. What is your racial or ethnic identification? Asian or Pacific Islander American Indian or other Native American African-American or African American Caucasian (other than Hispanic) Puerto Rican Hispanic Other
4.5% (3) 0 28.4% (19) 52.2.% (35) 3.0% (2) 7.5 % (5) 4.5% (3)
6% (4) 6.0% (4) 10.4% (7) 59.7% (40) 7.5 % (5) 6.0% (4) 4.5% (3)

152
4. Did either of your parents graduate from college? yes, both parents yes, father only yes, mother only don’t know no
53.7% (36)
11.9% (8)
10.4% (7)
3.0 (2)
20.9% (14)
55.2% (37)
19.4% (13)
13.4% (9)
1.5% (1)
10.4% (7) 5. In your last two years of high
school, how many hours a week did you study outside of school time? 5 or less 6-10 11-15 16-20 21-25 26 or more
59.7% (40)
31.3% (21)
4.5% (3)
1.5% (1)
3.0% (2) 0
49.3% (33)
22.4% (15)
19.4% (13)
3.0% (2)
4.5% (3)
1.4% (1)
6. Here at your college, how many hours did you study outside of class time? 5 or less 6-10 11-15 16-20 21-25 26 or more
6.0% (4)
23.9% (16)
41.8% (28)
16.4% (11)
7.5% (5)
4.5% (3)
9.0% (6)
16.4% (11)
35.8% (24)
26.9% (18)
9.0% (6)
3.0%(2)

153
7. How many credit hours are you taking this fall? 6 or less 7-10 12-14 15-16 17 or more
1.5% (1) 0
28.4% (19)
35.8% (24)
34.3% (23)
0 0
37.3% (25)
43.3% (29)
19.4% (13)
8. Which of the following field of engineering do you expect to major in? Aerospace and Ocean Engineering Biological Systems Engineering Chemical Engineering Civil and Environmental Engineering Computer Science Electrical and Computer Engineering Engineering Education Engineering Science and Mechanics Industrial and Systems Engineering Materials Science and Engineering Mechanical Engineering Mining and Minerals Engineering Transferring out of Engineering
13.4% (9)
1.5% (1)
7.5% (5)
6.0% (4)
9.0% (6)
19.4% (13) 0
3.0% (2)
4.5% (3)
1.5% (1)
26.9% (18)
3.0% (2)
4.5% (3) 0
14.9% (10)
3.0% (2)
6.0% (4)
11.9% (8)
3.0% (2)
10.4% (7) 0
3.0% (2)
11.9% (8)
4.5% (3)
25.4% (17)
3.0% (2)
3.0% (2) 0

154
9. About how much of your college expenses this year will be provided by your parents or family (including your own contribution). all or nearly all more than half less than half none or very little
47.8% (32)
13.4% (9)
26.9% (18)
11.9% (8)
56.7% (38)
14.9% (10)
19.4% (13)
9.0% (6)
10. What do you expect your college grade point average to be at the end of your first term? A (4.0) A- (3.7) B+ (3.3) B (3.0) B- (2.7) C+ (2.3) C (2.0) C- (1.7 or lower)
4.5% (3)
19.4% (13)
17.9% (12)
13.4% (9)
40.3% (27) 0
4.5% (3) 0
3.0% (2)
16.4% (11)
32.8% (22)
16.4% (11)
20.9% (14)
3.0% (2)
7.5% (5) 0

155
Appendix E: Summer Bridge Inventory
Purpose The Summer Bridge Inventory (SBI) was developed to complement the use of the Student
Adjustment College Questionnaire (SACQ), which was designed to assess a student’s adjustment
to college. Baker and Siryk (1999) subscale and cluster definitions are useful in providing a
conceptual framework to explore the effectiveness for a summer bridge program activities. The
subscale and cluster definitions are great tool to use to assess the various activities provide in a
summer bridge program. Therefore, the SBI builds on the SACQ model to provide a more
comprehensive assessment of the various types of activities that are offered in a Summer Bridge
Program (SBP) for incoming freshmen in college. The use of the SBI will permit students to
provide richer, more descriptive data to the research on how they adjusted to college, and their
views of the activities and programmatic interventions that they found the most and least
effective. The SBI will also enable the program director to better interpret the effectiveness of
the Summer Bridge Program.
The SBI has both qualitative and quantitative components, and consists of a questionnaire as
well as one-on-one and focus group interviews. The SBI, which will be administered to the
director of engineering support program (i.e. chief administrator for the SBP) and program
participants, consists of seven sections. The first six sections will have twenty-nine items in each
section, while the last part will consist of focus group questions. Participants will be asked to
identify on sections 1-4, on a scale of one to five, how the activity relates to the clusters of each
subscale from the SACQ. In section 5, participants will be asked to rank the thirty activities

156
from most important to least important. In addition, participants will be asked to indicate the
dominate subscale for each activity. The SBI will be administered via a two-phase process.
During Phase 1, the Director of Engineer Support Programs will complete the SBI questionnaire,
after which, I will conduct a one-on-one semi-structured interview with the director.
During Phase 2, participants of the SBP will complete the Summer Bridge Inventory. Once
those data are collected, the researcher will conduct semi-structured focus groups with
participants from the SBP.
The results of the SBI will be used to increase both the director’s and students’ awareness of
their own expectations in the SBP. Research outcomes will also be used to assist institutional
administrators of summer bridge programs on how to better serve participants with respect to
college adjustment.
Would you like to participate in a focus group? ________
Below are the subscales and corresponding clusters along with definitions for each word.

157
Subscales and Definitions Clusters and Definitions
Academic Adjustment (AA)-associated with higher education learning experiences
• Motivation- a student’s feelings concerning educational goal setting and being in college
• Application- the initiative that a student takes in achieving academic goals
• Performance- effectiveness of a student’s academic performance
• Academic Environment- the institutional environment in which a student performs and what that environment has to offer the student
Social Adjustment (SA)- the social aspects of a higher education environment
• General- the ease with which students engage in social activities
• Other People- whether or not students develop relationships with other individuals within the university setting
• Nostalgia- the social rearrangement of a student’s surroundings and how well he or she adjusts to being away from home
• Social Environment- the fulfillment a student feels with the college experience
Personal-Emotional Adjustment (PEA)- the psychological and physical aspects of students
• Psychological-signifies the student’s welfare and comfort or degree of distress
• Physical-corresponds to bodily responses
Goal Commitment/Institutional Adjustment (GCIA)- corresponds to a student’s dedication to his/her educational goals and connection to the institution
• General- overall satisfaction of being in college
• This College- emotions that students have about the college they are attending
Please use the definitions above in identifying a number that relates to the activity designated for each subscale below under each cluster. This inventory can be administered individually or in a group setting and the instructions are clearly written on each section following this page.

158
Section 1 The director and participants will be asked to identify, on a scale of 1 to 5, how the activity relates to the clusters of the Academic Adjustment (associated with higher education learning experiences) subscale (1 = does not relate at all, 5= relates well). Academic Adjustment Activities Motivation Application Performance Academic Environment Individual and Group Pictures Introduction Meeting Chemistry Class Chemistry Lab Class Engineering Class Math Class Campus Tour STEP Schedule Overview Floor Meeting Student ID Pickup Registration & Class Sign Up and information for fall term Orientation Meetings with Associate Dean of Engineering Friday Seminars Evening Out-Bowling Skating Trip to Mall 4th of July Cookout Ropes Course Updating Your Resumes Lab Tours Etiquette Dinner Fortune 500 Company Teambuilding Activities Seminar Sponsored by Fortune 500 Company Move-out Meeting Student Panel On-line Survey University Freshmen Orientation Move-Out Closing Ceremony

159
Section 2 Participants will be asked to identify, on a scale of 1 to 5, how the activity relates to the clusters of the Social Adjustment (the social aspects of a higher education environment) subscale (1 = does not relate at all, 5= relates well). Social Adjustment Activities General Other People Nostalgia Social Environment Individual & Group Pictures Introduction Meeting Chemistry Class Chemistry Lab Class Engineering Class Math Class Campus Tour STEP Schedule Overview Floor Meeting Student ID Pickup Registration & Class Sign Up and information for fall term Meetings with Associate Dean of Engineering Friday Seminars Evening Out-Bowling Skating Trip to Mall 4th of July Cookout Ropes Course Updating Your Resumes Lab Tours Etiquette Dinner Fortune 500 Company Teambuilding Activities Move-out Meeting Seminar Sponsored by Fortune 500 Company Student Panel On-line Survey University Freshmen Orientation Move-Out Closing Ceremony

160
Section 3 The director and participants will be asked to identify, on a scale of 1 to 5, how the activity listed relates to the clusters of Personal-Emotional Adjustment (the psychological and physical aspects of students) subscale (1 1 = does not relate at all, 5= relates well). Personal-Emotional Adjustment Activities Psychological Physical Individual and Group Pictures Introduction Meeting Chemistry Class Chemistry Lab Class Engineering Class Math Class Campus Tour STEP Schedule Overview Floor Meeting Student ID Pickup Registration & Class Sign Up and information for fall term Meetings with Associate Dean of Engineering Friday Seminars Evening Out-Bowling Skating Trip to Mall 4th of July Cookout Ropes Course Updating Your Resumes Lab Tours Etiquette Dinner Fortune 500 Company Teambuilding Activities Move-out Meeting Seminar Sponsored by Fortune 500 Company Student Panel On-line Survey University Freshmen Orientation
Move-Out Closing Ceremony

161
Section 4 The director and participants will be asked to identify, on a scale of 1 to 5, how the activity listed relates to the clusters of Goal Commitment Institutional Adjustment (corresponds to a student’s dedication to his/her educational goals and connection to the institution) subscale (1 = does not relate at all, 5= relates well).
Goal Commitment Institutional Adjustment
Activities General This College Individual and Group Pictures Introduction Meeting Chemistry Class Chemistry Lab Class Engineering Class Math Class Campus Tour STEP Schedule Overview Floor Meeting Student ID Pickup Registration & Class Sign Up and information for fall term Orientation Meetings with Associate Dean of Engineering Friday Seminars Evening Out-Bowling Skating Trip to Mall 4th of July Cookout Ropes Course Updating Your Resumes Lab Tours Etiquette Dinner Fortune 500 Company Teambuilding Activities
Move-Out Meeting Seminar Sponsored by Fortune 500 Company Student Panel On-line Survey University Freshmen Orientation Move-Out Closing Ceremony

162
Section 5 Participants will rank the following STEP activities from 1 to 29 (in order of their importance) (1 = least important, 29 = most important).
Activities Rank Individual and Group Pictures Introduction Meeting Chemistry Class Chemistry Lab Class Engineering Class Math Class Campus Tour STEP Schedule Overview Floor Meeting Student ID Pickup Registration & Class Sign Up information for fall term Orientation Meeting with Associate Dean of Engineering Friday Seminars Evening Out-Bowling Skating Trip to Mall 4th of July Cookout Ropes Course Updating Your Resumes Lab Tours Etiquette Dinner Fortune 500 Company Teambuilding Activities Move-Out Meeting Seminar Sponsored by Fortune 500 Company Student Panel On-line Survey University Freshmen Orientation Move-Out Closing Ceremony

163
Section 6 Participants will indicate the dominate subscale for each activity listed. Please place the appropriate number (see below) beside the activity underneath the column marked Subscale Number. The subscales and assigned numbers are the following: Academic Adjustment = 1 Social Adjustment = 2 Personal-Emotional Adjustment = 3 Goal Commitment/Institutional Adjustment = 4
Activities Subscale Number Individual and Group Pictures Introduction Meeting Chemistry Class Chemistry Lab Class Engineering Class Math Class Campus Tour STEP Schedule Overview Floor Meeting Student ID Pickup Registration & Class Sign Up and information for fall term Orientation Meetings with Associate Dean of Engineering Friday Seminars Evening Out-Bowling Skating Trip to Mall 4th of July Cookout Ropes Course Updating Your Resumes Lab Tours Etiquette Dinner Fortune 500 Company Teambuilding Activities Move-Out Meeting Seminar Sponsored by Fortune 500 Company Student Panel On-line Survey University Freshmen Orientation Move-Out Closing Ceremony
164
Questions for Director • How do you feel the STEP activities assist students in their overall academic adjustment in their
first term of college?
• How do you feel the STEP activities assist students in their overall social adjustment in their first
term of college?
• How do you feel the STEP activities assist students in their overall personal and emotional
adjustment in their first term of college?
• How do you feel the STEP activities assist students in their overall goal commitment and
institutional adjustment in their first term of college?
• What do you hope to learn from the evaluation? Why are these issues important to you?
• How could you use the information provided by participants?
• What do you believe are the strengths of the STEP program?
• What do you believe are the weakness of the STEP program?
• What are the future plans for the program?
• Is there anything else that you would like to add regarding the STEP program that I have not asked
you?
Questions for Participants • How do you feel the STEP activities assisted you in your overall academic adjustment in your first
term of college?
• How do you feel the STEP activities assisted you in your overall social adjustment in your first
term of college?
• How do you feel the STEP activities assisted you in your overall personal and emotional
adjustment in your first term of college?
• How do you feel the STEP activities assisted your overall goal commitment and institutional
adjustment in your first term of college?
• What is the general perception of the STEP program?
• What do you perceive as the purpose or guiding philosophy of the STEP program?
• What do you believe are the strengths of the STEP program?
• What do you believe are the weakness of the STEP program?
• How did STEP prepare you for college?
Is there anything else that you would like to add regarding the STEP Program that I have not asked you?

165
Appendix F: IRB Amendment 1 Approval

166
Appendix G: SACQ Approval from Western Psychological Services
wps®
Western Psychological Services A Division of Manson Western Corporation
12031 Wilshire Boulevard Los Angeles, CA 90025-1251
www.wpspublish.com January 28, 2008 Tremayne O. Waller Doctoral Candidate Virginia Polytechnic Institute and State University African-Americansburg, VA 24061-0002 Re: Student Adaptation to College Questionnaire (SACQ) Dear Mr. Waller:
WPS is processing your license for a specific web-based application of SACQ material. By surface mail, you will soon receive a paid-in-full WPS invoice/receipt, which will serve as your license to use the SACQ items and scoring key in a secure on-line environment, permitting adaptation, administration and scoring of the instrument up to four hundred twenty-five (425) times total. This authorization is for sole use in your doctoral research, examining adjustment to college in African-American men at the Virginia Tech College of Engineering –– with no authorization for continued or commercial use –– subject to the provisions of terms and conditions provided to you earlier today.
With reference to condition (4) of WPS’s terms letter from earlier today, this is the copyright notice that must appear in its entirety, on the screen of item presentation, to each reprint/viewing of the SACQ:
Material from the SACQ copyright © 1988, 1999 by Western Psychological Services. Format adapted by T. Waller, Virginia Polytechnic Institute and State University, for specific, limited research use under license of the publisher, WPS, 12031 Wilshire Boulevard, Los Angeles, California 90025, U.S.A. (www.wpspublish.com). No additional reproduction, in whole or in part, by any medium or for any purpose, may be made without the prior, written authorization of WPS. All rights reserved.
On behalf of WPS, I appreciate your continuing interest in the SACQ, and look forward to hearing the results of your
study. Sincerely yours, Susan Dunn Weinberg Assistant to the President WPS Rights and Permissions e-mail: [email protected] SDW:se

167
wps® Western Psychological Services
12031 Wilshire Boulevard Los Angeles, CA 90025-1251
www.wpspublish.com Dear Graduate Student:
Thank you for contacting Western Psychological Services for permission to reprint material from a copyrighted test instrument for inclusion as an appendix in your dissertation. When widely-distributed commercially produced tests are used, guidelines at most research universities do not call for inclusion of full instruments in thesis or dissertation volumes. In such cases, university policies are generally sensitive to the threat to commercial copyright and proprietary interests that is implicit in such copying or redistributing materials. The inclusion of instruments is generally limited to use of materials that are original to the dissertation author or that are otherwise unpublished and so might be thought difficult for subsequent readers to obtain. WPS policy in such matters is to not authorize reprinting of our tests, subtests, or scales in their entirety, unless there is a committee requirement or other research-based reason that (1) requires you to reprint a test, subtest or scale in its entirety, and that (2) prevents the inclusion in your dissertation of original test forms. We can, as an alternative, readily provide authorization the reproduction of up to five representative sample items from the instrument upon receipt of your written request to that effect, including the specific item numbers desired for reprint. Also, if you need to reprint any other material from the test, including and not limited to material from the instrument’s manual, please provide details by page, figure, table numbers, etc., for our consideration in authorizing inclusion of that material within your work. If you need to pursue reprinting of the instrument in its entirety, please write again to WPS Rights and Permissions: Provide us with the reason you must reprint the subtests in their entirety (as opposed to selecting representative sample items); explain specifically why you are required to reproduce the original subtest (as opposed to binding an original protocol); and arrange for a supervising faculty member to co-sign the request. For expedience, please note that you may fax the letter to my attention at 310/478-7838, or have your professor e-mail it to me through his/her university e-mail address. For your additional reference in the event that your dissertation will be microfilmed, WPS will not authorize reproduction of our tests by microfilm, due to the public availability of the medium. While we regret any inconvenience our position may cause, we hope you appreciate our concern with ethical considerations. Your interest in our material is appreciated, as is your consideration for its copyright. Please contact me if you have any questions. Sincerely yours, Susan Dunn Weinberg Assistant to the President WPS Rights and Permissions e-mail: [email protected] SDW:se

168
Appendix H: Letter for Participants in the Study
November 2007 Dear Student: My name is Tremayne Waller and I am a PhD candidate in the School of Education at Virginia Polytechnic Institute and State University, working as a graduate assistant in the College of Engineering’s Center for the Enhancement of Engineering Diversity. I am requesting your assistance for my research. The goal of the research is to examine the adjustment of participants versus non-participants in a summer bridge program for first year engineering students. Your assistance is appreciated in filling out the survey. Students that complete the survey will be entered in a drawing for one of two $100 dollar gift certificates to the University bookstore. In order to participate in this study, you will need to complete a consent form. The consent form will be included in the survey and will indicate your understanding of the meaning of informed consent. To participate in the study, please go to the URL: http://tremaynewaller.com using the password is Step07. If the URL does not work, please cut and past it into your web browser. The time required to complete the survey is approximately 15 minutes. All survey responses will be kept confidential. The data from this research will be compiled and analyzed. This information will be reported to my dissertation committee and will not include any individual’s information. I look forward to your participation in this study. I do appreciate your time. Sincerely, Tremayne Waller PhD Candidate Virginia Polytechnic Institute and State University

169
Appendix I: Follow Up Email for Participants in Study
November 2007 Dear Student: Last week an on-line survey was sent to you to seek your opinions about your adjustment about college. Your name was drawn randomly from a list of students in the college of engineering. If you have already completed the on-line questionnaire, please accept our sincere thanks. If not, please do so today. We are especially grateful for your help because it is only by asking people like you to share your experiences about adjustment to college. To complete the survey and enter the drawing for one of two $100 dollar gift certificates to the University bookstore, you will need to complete a consent form. The consent form will be included in the survey and will indicate your understanding of the meaning of informed consent. To participate in the study, please go to the URL: http://tremaynewaller.com using the password is Step07. If the URL does not work, please cut and past it into your web browser. The time required to complete the survey is approximately 15 minutes. All survey responses will be kept confidential. The data from this research will be compiled and analyzed. This information will be reported to my dissertation committee and will not include any individual’s information. I look forward to your participation in this study. I do appreciate your time. Sincerely, Tremayne Waller PhD Candidate Virginia Polytechnic Institute and State University

170
Appendix J: Normal P-Plots for SACQ Scales
Figure 4.1. Normal Probability Plots of AA Raw Scores
Figure 4.2. Normal Probability Plots of PEA Raw Scores

171
Figure 4.3. Normal Probability Plots of SA Raw Scores
Figure 4.4. Normal Probability Plots CGIA Raw Scores

172
Appendix K: Supplementary Tables 4.2 to 4.8
Table 4.2. SACQ Academic Adjustment Subscale
Sample Mean, Range, and Standard Deviation on Academic Adjustment (AA) Scale (n = 134)
SUMMER PARTICIPANTS NON-SUMMER PARTICIPANTS
SCALE/CLUSTER/ITEM MEDIAN MEAN ST. DEV. MEDIAN MEAN ST. DEV.
Total for Full Scale 149 7.01 1.55 144 6.94 1.22
Motivation I know why I’m in college and what I want out of it My academic goals and purposes are well defined. Getting a college degree is very important to me. Lately I have been having doubts regarding the value of a
college education. I am enjoying my academic work at college. Most of the things I am interested in are not related to any
of my course work at college.
44.009.0
8.0
9.0
9.0
7.0
7.0
6.96 7.37
7.25
7.91
7.06
6.49
5.72
1.762.467
2.163
2.551
2.984
2.245
2.822
44.009.0
8.0
9.0
9.0
6.0
5.0
7.02 7.69
7.49
8.45
7.58
5.72
5.22
1.482.119
3.254
1.853
2.69
2.405
2.575
Application I have been keeping up to date on my academic work. I’m not working as hard as I should at my course work. I really haven’t had much motivation for studying lately.
26.007.00
4.0
5.0
6.0 6.91
4.36
4.96
5.972.050
2.521
2.370
26.008.00
5.0
5.0
6.38 7.30
5.03
5.10
1.141.784
2.443
2.487

173
SUMMER PARTICIPANTS NON-SUMMER PARTICIPANTS
SCALE/CLUSTER/ITEM MEDIAN MEAN ST. DEV. MEDIAN MEAN ST. DEV.
Total for Full Scale 149 7.01 1.55 144 6.94 1.22
I am attending classes regularly. 9.0
7.66 2.027 9.0
8.09 1.649
Performance
I am finding academic work at college difficult. I have not been functioning well during examinations. I am satisfied with the level at which I am performing
academically. I’m not really smart enough for the academic work I am
expected to be doing now. I haven’t been very efficient in the use of study time
lately. I enjoy writing papers for courses. Recently I have had trouble concentrating when I try to
study. I’m not doing well enough academically for the amount of
work I do.
I am having a lot of trouble getting started on homework assignments.
46.004.00
6.0
6.0
8.0
4.0
4.0
5.0
6.0
5.0
5.15 3.79
5.46
6.06
6.55
4.51
4.04
4.97
5.88
5.09
1.511.996
2.469
1.984
2.647
2.285
2.868
2.540
2.717
2.789
42.003.00
5.0
6.0
7.0
5.0
4.0
4.0
5.0
6.0
4.80 3.39
4.81
5.67
6.31
4.75
3.82
4.45
4.66
5.40
1.332.037
2.469
2.149
2.641
2.218
2.430
2.363
2.761
2.758

174
SUMMER PARTICIPANTS NON-SUMMER PARTICIPANTS
SCALE/CLUSTER/ITEM MEDIAN MEAN ST. DEV. MEDIAN MEAN ST. DEV.
Total for Full Scale 149 7.01 1.55 144 6.94 1.22
Academic Environment
I am satisfied with the number and variety of courses available at college.*
I am satisfied with the quality or the caliber of courses
available at college. I am satisfied with my program of courses for this
term/quarter. I am very satisfied with the professors I have now in my
courses. I’m quite satisfied with my academic situation at college.
38.009.00
8.0
8.0
7.0
7.0
7.05 7.55
7.27
7.40
6.39
6.66
1.732.105
2.213
2.182
2.263
2.346
36.008.00
8.0
7.0
7.0
7.0
7.0 7.67
7.45
7.19
6.43
6.25
1.521.718
1.995
1.948
1.811
2.305
*This item also appears on the GCIA subscale.

175
Table 4.3. SACQ Social Adjustment Subscale
Sample Mean, Range, and Standard Deviation on Social Adjustment (SA) Scale (n=134)
SUMMER PARTICIPANTS NON-SUMMER PARTICIPANTS
SCALE/CLUSTER/ITEM MEDIAN MEAN ST. DEV. MEDIAN MEAN ST. DEV.
Total for Full Scale
146.0 6.97 1.63 141.00 6.75 1.45
General I feel that I fit in well as part of the college environment.* I’m very involved with social activities in college. I am adjusting well to college. I have several close social ties at college. I feel that I have enough social skills to get along well in
the college setting. I’m satisfied with the extent to which I am participating in
social activities at college. I’m quite satisfied with my social life at college.*
54.08.0
7.0
8.0
8.0
9.0
7.0
8.0
7.20 7.34
6.54
7.25
7.42
7.63
6.84
7.40
1.812.384
1.933
2.218
2.394
2.159
2.326
2.175
51.08.0
6.0
7.0
8.0
9.0
7.0
7.0
6.92 7.60
5.81
7.18
7.04
7.78
6.24
6.84
1.661.923
2.3520
1.938
2.198
1.913
2.425
2.326
*This item also appears on the GCIA subscale.

176
SUMMER PARTICIPANTS NON-SUMMER PARTICIPANTS
SCALE/CLUSTER/ITEM MEDIAN MEAN ST. DEV. MEDIAN MEAN ST. DEV.
Total for Full Scale
146.0 6.97 1.63 141.00 6.75 1.45
Other People I am meeting as many people, and making as many friends
as I would like at college.* I’ve had informal, personal contacts with college
professors. I am getting along very well with my roommate(s) at
college. I’m having difficulty feeling at ease with other people at
college.* I haven’t been mixing too well with the opposite sex
lately. I feel I am very different from other students at college in
ways that I don’t like.* I have some good friends or acquaintances at college with
whom I can talk about any problems I may have.
51.008.0
6.0
9.0
8.0
9.0
7.0
9.0
6.86 7.09
5.58
7.15
7.13
6.97
6.43
7.67
1.562.193
2.457
2.530
2.455
2.855
2.862
2.415
49.007.0
5.0
9.0
8.0
8.0
8.0
8.0
6.57 6.76
5.31
7.03
6.67
6.25
6.61
7.37
1.632.264
2.356
2.736
2.688
2.966
2.640
2.248
*This item also appears on the GCIA subscale.
Nostalgia 21.00 6.45 3.60 20.00 6.07 2.31
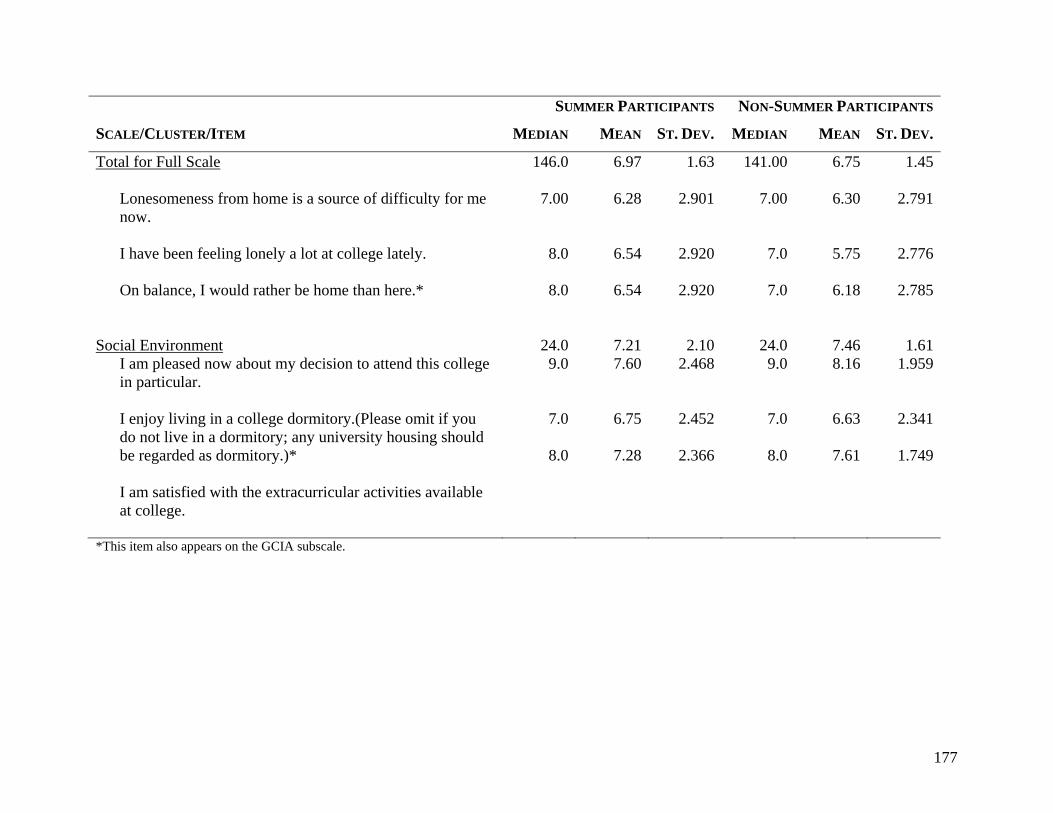
177
SUMMER PARTICIPANTS NON-SUMMER PARTICIPANTS
SCALE/CLUSTER/ITEM MEDIAN MEAN ST. DEV. MEDIAN MEAN ST. DEV.
Total for Full Scale
146.0 6.97 1.63 141.00 6.75 1.45
Lonesomeness from home is a source of difficulty for me now.
I have been feeling lonely a lot at college lately. On balance, I would rather be home than here.*
7.00
8.0
8.0
6.28
6.54
6.54
2.901
2.920
2.920
7.00
7.0
7.0
6.30
5.75
6.18
2.791
2.776
2.785
Social Environment
I am pleased now about my decision to attend this college in particular.
I enjoy living in a college dormitory.(Please omit if you do not live in a dormitory; any university housing should be regarded as dormitory.)* I am satisfied with the extracurricular activities available
at college.
24.09.0
7.0
8.0
7.21 7.60
6.75
7.28
2.102.468
2.452
2.366
24.09.0
7.0
8.0
7.46 8.16
6.63
7.61
1.611.959
2.341
1.749
*This item also appears on the GCIA subscale.

178
Table 4.4. SACQ Personal-Emotional Adjustment Subscale
Sample Mean, Range, and Standard Deviation on Personal-Emotional Adjustment (PEA) Scale (n=134)
SUMMER PARTICIPANTS NON-SUMMER PARTICIPANTS
SCALE/CLUSTER/ITEM MEDIAN MEAN ST. DEV. MEDIAN MEAN ST. DEV.
Total for Full Scale
94.0 6.11 1.74 94.0 6.06 1.55
Psychological I’ve been feeling tense or nervous lately. Lately, I have been feeling blue and moody a lot. Being on my own, taking responsibility for myself, has
not been easy. I haven’t been able to control my emotions very well
lately. I’ve given a lot of thought lately to whether I should ask
for help from the Psychological/Counseling Services Center or from a psychotherapist outside of college.
I’ve been getting angry too easily lately. Sometimes, my thinking gets muddled up to easily. I worry a lot about my college expenses. I’m experiencing a lot of difficulty coping with the
stresses imposed upon me in college.
56.05.0
7.0
7.0
8.0
9.0
8.0
5.0
5.0
7.0
5.96 4.96
6.07
6.10
6.43
7.45
6.64
5.21
4.82
5.99
1.872.694
2.560
2.840
2.803
2.770
2.655
2.484
3.070
2.847
57.05.0
7.0
7.0
7.0
9.0
8.0
5.0
5.0
7.0
6.01 4.73
6.24
6.78
6.33
7.82
6.67
4.93
4.81
5.84
1.612.550
2.577
2.373
2.659
2.393
2.567
2.825
2.924
2.435

179
SUMMER PARTICIPANTS NON-SUMMER PARTICIPANTS
SCALE/CLUSTER/ITEM MEDIAN MEAN ST. DEV. MEDIAN MEAN ST. DEV.
Total for Full Scale
94.0 6.11 1.74 94.0 6.06 1.55
Physical I have felt tired much of the time lately. My appetite has been good lately. I have been having a lot of headaches lately. I put on (or lost) too much weight recently. I haven’t been sleeping very well. I have been feeling in good health lately.
40.03.0
9.0
8.0
8.0
7.0
8.0
6.35 4.31
7.10
6.52
6.79
5.97
7.42
1.812.595
2.541
2.841
2.733
2.801
2.291
37.04.0
8.0
8.0
6.0
7.0
7.0
6.14 4.48
7.24
6.42
6.01
5.76
6.93
1.642.331
2.209
2.781
2.852
2.850
2.169

180
Table 4.5. SACQ Goal Commitment/Institutional Adjustment Subscale
Sample Mean, Range, and Standard Deviation on Goal Commitment/Institutional Adjustment (GCIA) Scale (n=134)
SUMMER PARTICIPANTS NON-SUMMER PARTICIPANTS
SCALE/CLUSTER/ITEM MEDIAN MEAN ST. DEV. MEDIAN MEAN ST. DEV.
Total for Full Scale
120.0 7.26 186 117.0 7.34 1.64
General I’m pleased now about my decision to go to college. Lately, I have been giving a lot of thought to dropping out
of college altogether and for good. I find myself giving considerable thought to taking time
off from college and finishing later.
27.09.0
9.0
9.0
7.78 7.81
7.85
7.69
2.422.500
2.715
2.819
27.09.0
9.0
9.0
7.98 8.34
7.97
7.64
2.131.788
2.534
2.678
This College
I’m pleased now about my decision to attend this college in particular.*
I wish I were at another college or university. I expect to stay at this college for a Bachelor’s degree. Lately, I have been giving a lot of thought to transferring
to another college.
36.09.0
9.0
9.0
9.0
7.43 7.60
7.12
7.60
7.40
2.412.468
2.853
2.612
2.866
34.09.0
9.0
9.0
9.0
7.80 8.16
7.40
8.12
7.54
1.981.959
2.517
1.973
2.642
*This item also appears on the SA subscale.

181
Appendix L: Supplementary Tables 4.9 to 4.22
Table 4.9. Likelihood Ratio and Pearson Significance Tests on Summer Bridge Inventory Academic
Adjustment: Application Raw Scores
Activities N Likelihood Ratio/Pearson
(P Value for Race) Likelihood Ratio/Pearson
(P Value for Gender) Individual and Group Pictures 42 .28(.009*) .10(.15) Introduction Meeting 42 .40(.50) .81(.82) Chemistry Class 42 .38(.01*) .11(.20) Chemistry Lab Class 42 .31(.19) .04(.05) Engineering Class 42 .06(.04*) .83(.83) Math Class 42 .01(.01*) .90(.90) Campus Tour 42 .06(.03*) .72(.72) STEP Schedule Overview 42 .88(.88) .15(.27) Floor Meeting 42 .70(.85) .92(.92) Student ID Pickup 42 .45(.21) .20(.22) Registration & Class Sign Up and information for fall term 42 .45(.64) .36(.37) Meetings with Ass. Dean of Eng.
42 .09(.05) .76(.76) Friday Seminars 42 .62(.76) .31(.32) Evening Out-Bowling 42 .38(.53) .49(.62) Skating 42 .28(.44) .15(.21) Trip to Mall 42 .48(.63) .16(.23) 4th of July Cookout 42 .43(.37) .84(.84) Ropes Course 42 .67(.83) .32(.46) Updating Your Resumes 42 .86(.93) .66(.68) Lab Tours 42 .54(.67) .08(.10) Etiquette Dinner 42 .80(.91) .03(.04*) Fortune 500 Company Teambuilding Activities 42 .48(.58) .06(.08) Move-out Meeting 42 .55(.66) .38(.39) Seminar Sponsored by Fortune 500 Company 42 .14(.003*) .65(.72) Student Panel 42 .22(.15) .24(.26) On-line Survey 42 .04(.02*) .56(.57) University Freshmen Orientation 42 .36(.17) .22(.31) Move-Out 42 .66(.63) .42(.48) Closing Ceremony 42 .49(.62) .04(.06)
P-values are in parentheses. Significant differences are denoted with an asterisk (*)

182
Table 4.10. Likelihood Ratio and Pearson Significance Tests on Summer Bridge Inventory Academic
Adjustment: Motivation Raw Scores
Activities N Likelihood Ratio/Pearson
(P Value for Race) Likelihood Ratio/Pearson
(P Value for Gender) Individual and Group Pictures 42 .001(.0004*) .33(.39) Introduction Meeting 42 .52(.62) .87(.87) Chemistry Class 42 .50(.62) .28(.38) Chemistry Lab Class 42 .47(.47) .49(.62) Engineering Class 42 .60(.58) .37(.51) Math Class 42 .58(.65) .54(.68) Campus Tour 42 .16(.08) .70(.71) STEP Schedule Overview 42 .35(.46) .78(.79) Floor Meeting 42 .11(.25) .02(.03*) Student ID Pickup 42 .53(.64) .75(.76) Registration & Class Sign Up and information for fall term
42.85(78) .61(.75)
Meetings with Associate Dean of Engineering
42.31(.23) .05(.09)
Friday Seminars 42 .09(.18) .53(.54) Evening Out-Bowling 42 .50(.62) .46(.48) Skating 42 .05(.01*) .57(.64) Trip to Mall 41 .58(.71) .54(.67) 4th of July Cookout 42 .45(.58) .53(.54) Ropes Course 42 .20(.34) .91(.91) Updating Your Resumes 42 .85(.93) .34(.44) Lab Tours 41 .01(.0004*) .90(.91) Etiquette Dinner 42 .51(.57) .04(.06) Fortune 500 Company Teambuilding Activities
42.25(.54) .62(.64)
Move-out Meeting 42 .54(.71) .11(.21) Seminar Sponsored by Fortune 500 Company
42.17(.41) .51(.53)
Student Panel 42 .12(.11) .10(.11) On-line Survey 42 .02(.04*) .67(.68) University Freshmen Orientation 42 .93(.95) .60(.62) Move-Out 42 .51(.51) .92(.92) Closing Ceremony 42 .10(.13) .72(.73)
P-values are in parentheses. Significant differences are denoted with an asterisk (*).

183
Table 4.11. Likelihood Ratio and Pearson Significance Tests on Summer Bridge Inventory Academic
Adjustment: Environment Raw Scores
Activities N Likelihood Ratio/Pearson
(P Value for Race) Likelihood Ratio/Pearson
(P Value for Gender) Individual and Group Pictures 42 .49(.60) .78(.79) Introduction Meeting 42 .29(.29) .87(.88) Chemistry Class 42 .20(.27) .14(.23) Chemistry Lab Class 42 .05(.02*) .03(.06) Engineering Class 42 .17(.15) .36(.49) Math Class 42 .19(.23) .23(.36) Campus Tour 42 .46(.70) .06(.13) STEP Schedule Overview 42 .28(.45) .65(.66) Floor Meeting 42 .12(.21) .37(.39) Student ID Pickup 42 .12(.12) .53(.55) Registration & Class Sign Up and information for fall term
42.75(.67) .01(.02*)
Meetings with Associate Dean of Engineering
42.21(.25) .69(.70)
Friday Seminars 42 .72(.86) .99(.99) Evening Out-Bowling 42 .64(.85) .53(.54) Skating 42 .42(.63) .93(.94) Trip to Mall 41 .69(.85) .70(.71) 4th of July Cookout 42 .92(.96) .09(.17) Ropes Course 42 .32(.22) .31(.36) Updating Your Resumes 42 .05(.12) .44(46) Lab Tours 42 .02(.06) .48(.51) Etiquette Dinner 42 .41(.58) .09(.11) Fortune 500 Company Teambuilding Activities
42.10(.05) .83(.84)
Move-out Meeting 42 .09(.14) .10(.13) Seminar Sponsored by Fortune 500 Company
42.10(.05) .71(.72)
Student Panel 42 .56(.64) .84(.85) On-line Survey 42 .31(.34) .15(.17) University Freshmen Orientation 42 .46(.67) .95(.95) Move-Out 42 .59(.63) .45(.52) Closing Ceremony 42 .38(.55) .79(.80)
P-values are in parentheses. Significant differences are denoted with an asterisk (*).

184
Table 4.12. Likelihood Ratio and Pearson Significance Tests on Summer Bridge Inventory Academic
Adjustment: Performance Raw Scores
Activities N Likelihood Ratio/Pearson
(P Value for Race) Likelihood Ratio/Pearson
(P Value for Gender) Individual and Group Pictures 41 .28(.28) .91(.91) Introduction Meeting 41 .37(.45) .72(.73) Chemistry Class 41 .50(.57) .04(.06) Chemistry Lab Class 41 .86(.96) .12(.18) Engineering Class 41 .75(.89) .27(.28) Math Class 41 .20(.32) .23(.29) Campus Tour 41 .33(.56) .07(.09) STEP Schedule Overview 41 .92(.98) .20(.31) Floor Meeting 41 .07(.09) .35(.45) Student ID Pickup 41 .33(.42) .05(.14) Registration & Class Sign Up and information for fall term
41 .72(.74) .34(.36)
Meetings with Associate Dean of Engineering
41 .26(.43) .65(.72)
Friday Seminars 41 .18(.42) .83(.84) Evening Out-Bowling 41 .35(.44) .23(.35) Skating 41 .33(.44) .48(.61) Trip to Mall 40 .46(.47) .39(.51) 4th of July Cookout 41 .76(.78) .30(.45) Ropes Course 41 .06(.14) .48(.50) Updating Your Resumes 41 .09(.24) .50(.51) Lab Tours 40 .04(.05) .49(.52) Etiquette Dinner 41 .89(95) .05(.06) Fortune 500 Company Teambuilding Activities
41 .22(.38) .21(.23)
Move-out Meeting 41 .48(.44) .21(.33) Seminar Sponsored by Fortune 500 Company
41 .28(.58) .07(.09)
Student Panel 41 .07(.15) .16(.19) On-line Survey 41 .01(.02*) .23(.26) University Freshmen Orientation 41 .82(.82) .62(.70) Move-Out 41 .29(.21) .44(.51) Closing Ceremony 41 .46(.59) .84(.85)
P-values are in parentheses. Significant differences are denoted with an asterisk (*).

185
Table 4.13. Likelihood Ratio and Pearson Significance Tests on Summer Bridge Inventory Social
Adjustment: Environment Raw Scores
Activities N Likelihood Ratio/Pearson
(P Value for Race) Likelihood Ratio/Pearson
(P Value for Gender) Individual and Group Pictures 42 .76(.81) .59(.62) Introduction Meeting 42 .38(.33) .03(.07) Chemistry Class 42 .80(.81) .16(.25) Chemistry Lab Class 42 .86(.89) .22(.30) Engineering Class 42 .72(.82) .27(.30) Math Class 42 .48(.60) .20(.22) Campus Tour 42 .84(.90) .95(.95) STEP Schedule Overview 42 .20(.11) .32(.33) Floor Meeting 42 .44(.58) .01(.05) Student ID Pickup 42 .19(.23) .78(.79) Registration & Class Sign Up and information for fall term
42 .22(.31) .74(.75) Meetings with Associate Dean of Engineering
42 .36(.11) .04(.10)
Friday Seminars 42 .24(.22) .86(.86) Evening Out-Bowling 42 .62(.61) .04(.09) Skating 42 .65(.61) .05(.09) Trip to Mall 40 .81(.93) .41(.47) 4th of July Cookout 42 .81(.82) .44(.56) Ropes Course 42 .11(.17) .11(.15) Updating Your Resumes 42 .35(.58) .22(.24) Lab Tours 42 .23(.36) .24(.28) Etiquette Dinner 42 .28(.39) .33(.35) Fortune 500 Company Teambuilding Activities
42 .11(.09) .79(.80)
Move-out Meeting 42 .82(.90) .004(.02*) Seminar Sponsored by Fortune 500 Company
42 .14(.10) .19(.23)
Student Panel 42 .77(.89) .49(.51) On-line Survey 42 .03(.02) .95(.96) University Freshmen Orientation
42 .009(.01*) .15(.17)
Move-Out 42 .37(.58) .78(.78) Closing Ceremony 42 .42(.35) .62(.63)
P-values are in parentheses. Significant differences are denoted with an asterisk (*)

186
Table 4.14. Likelihood Ratio and Pearson Significance Tests on Summer Bridge Inventory Social
Adjustment: General Raw Scores
Activities N Likelihood Ratio/Pearson
(P Value for Race) Likelihood Ratio/Pearson
(P Value for Gender) Individual and Group Pictures 42 .76(.81) .59(.62) Introduction Meeting 42 .48(.67) .001(.006*) Chemistry Class 42 .27(.45) .36(.41) Chemistry Lab Class 42 .15(.31) .88(.89) Engineering Class 42 .39(.51) .49(.51) Math Class 42 .40(.63) .31(.35) Campus Tour 42 .17(.23) .62(.63) STEP Schedule Overview 42 .19(.36) .07(.10) Floor Meeting 42 .37(.56) .72(.79) Student ID Pickup 42 .32(.31) .70(.71) Registration & Class Sign Up and information for fall term
42 .55(.66) .49(.51)
Meetings with Associate Dean of Engineering
42 .17(.20) .08(.10)
Friday Seminars 42 .24(.27) .39(.43) Evening Out-Bowling 42 .85(91) .38(.46) Skating 42 .91(.96) .44(.55) Trip to Mall 42 .74(.91) .28(.42) 4th of July Cookout 42 .02(.0006*) .04(.08) Ropes Course 42 .44(.06) .42(.56) Updating Your Resumes 42 .52(.62) .24(.41) Lab Tours 42 .06(.06) .29(.31) Etiquette Dinner 42 .59(.59) .07(.14) Fortune 500 Company Teambuilding Activities
42 .08(.27) .31(.33)
Move-out Meeting 42 .04 (.12) .95(.95) Seminar Sponsored by Fortune 500 Company
42 .79(.89) .45(.47)
Student Panel 42 .37(.60) .02(.03*) On-line Survey 41 .12(.12) .81(.81) University Freshmen Orientation 42 .01(.04*) .15(.17) Move-Out 42 .21(.23) .02(.08) Closing Ceremony 42 .42(.46) .43(.45)
P-values are in parentheses. Significant differences are denoted with an asterisk (*).

187
Table 4.15. Likelihood Ratio and Pearson Significance Tests on Summer Bridge Inventory Social
Adjustment: Nostalgia Raw Scores
Activities N Likelihood Ratio/Pearson
(P Value for Race) Likelihood Ratio/Pearson
(P Value for Gender) Individual and Group Pictures 42 .37(.45) .02(.06) Introduction Meeting 42 .63(.82) .81(.82) Chemistry Class 42 .10(.24) .97(.97) Chemistry Lab Class 41 .01(.07) .82(.82) Engineering Class 42 .03(.12) .58(.60) Math Class 42 .05(.18) .83(.84) Campus Tour 42 .26(.41) .01(.04*) STEP Schedule Overview 42 .42(.59) .14(.25) Floor Meeting 42 .007(.02*) .09(.17) Student ID Pickup 42 .35(.43) .48(.48) Registration & Class Sign Up and information for fall term
42 .46(.59) .46(.47) Meetings with Associate Dean of Engineering
42 .46(.59) .30(.32)
Friday Seminars 42 .005(.01*) .69(.70) Evening Out-Bowling 42 .68(.62) .06(.16) Skating 42 .66(.56) .07(.16) Trip to Mall 40 .24(.03*) .59(.67) 4th of July Cookout 42 .69(.80) .99(.99) Ropes Course 42 .59(.70) .60(.67) Updating Your Resumes 42 .16(.24) .07(.10) Lab Tours 42 .03(.10) .88(.88) Etiquette Dinner 42 .09(.12) .61(.62) Fortune 500 Company Teambuilding Activities
42 .04(.07) .19(.22)
Move-out Meeting 42 .02(.07) .81(.81) Seminar Sponsored by Fortune 500 Company
42 .05(.16) .53(.55)
Student Panel 42 .44(.59) .09(.10) On-line Survey 42 .45(.51) .58(.71) University Freshmen Orientation 42 .15(.23) .16(.19) Move-Out 42 .65(.79) .58(.58) Closing Ceremony 42 .24(.45) .22(24)
P-values are in parentheses. Significant differences are denoted with an asterisk (*).

188
Table 4.16. Likelihood Ratio and Pearson Significance Tests on Summer Bridge Inventory Social
Adjustment: Other People Raw Scores
Activities N Likelihood Ratio/Pearson
(P Value for Race) Likelihood Ratio/Pearson
(P Value for Gender) Individual and Group Pictures 42 .69(.76) .89(.89) Introduction Meeting 42 .28(.38) .75(.76) Chemistry Class 42 .35(.55) .94(.94) Chemistry Lab Class 42 .70(.87) .78(.79) Engineering Class 42 .74(.87) .55(.56) Math Class 42 .19(.34) .59(.60) Campus Tour 42 .17(.32) .47(.49) STEP Schedule Overview 42 .65(.73) .33(.35) Floor Meeting 42 .50(.49) .26(.39) Student ID Pickup 42 .26(.46) .57(.58) Registration & Class Sign Up and information for fall term
42 .74(.84) .19(.34)
Meetings with Associate Dean of Engineering
42 .86(.94) .26(.28)
Friday Seminars 42 .23(.25) .11(.15) Evening Out-Bowling 42 .40(.61) .20(.30) Skating 42 .88(.92) .46(.55) Trip to Mall 40 .85(.94) .89(.89) 4th of July Cookout 42 .58(.68) .46(.56) Ropes Course 42 .18(.22) .77(.77) Updating Your Resumes 42 .44(74) .42(.54) Lab Tours 42 .30(.51) .86(.86) Etiquette Dinner 42 .85(.92) .76(.84) Fortune 500 Company Teambuilding Activities
42 .15(.30) .29(.31)
Move-out Meeting 42 .01(.01*) .29(.31) Seminar Sponsored by Fortune 500 Company
42 .66(.72) .35(.37)
Student Panel 42 .12(.23) .62(.63) On-line Survey 42 .37(.36) .50(.63) University Freshmen Orientation 42 .41(.51) 94(.94) Move-Out 42 .38(.47) .21(.24) Closing Ceremony 41 .55(.69) .08(.10)
P-values are in parentheses. Significant differences are denoted with an asterisk (*).

189
Table 4.17. Likelihood Ratio and Pearson Significance Tests on Summer Bridge Inventory Personal-
Emotional Adjustment: Physical Raw Scores
Activities Likelihood Ratio/Pearson Likelihood Ratio/Pearson N (P Value for Race) (P Value for Gender)
Individual and Group Pictures 42 .74(.85) .13(.20) Introduction Meeting 42 .48(.60) .13(.24) Chemistry Class 42 .83(.92) .54(.56) Chemistry Lab Class 42 .54(.52) .41(.42) Engineering Class 42 .50(.73) .72(.79) Math Class 42 .36(.53) .30(.45) Campus Tour 42 .50(.67) .41(.42) STEP Schedule Overview 42 .69(.71) .61(.68) Floor Meeting 42 .31(.31) .50(.51) Student ID Pickup 42 .20(.33) .15(.16) Registration & Class Sign Up and information for fall term
42 .38(.46) .35(.41)
Meetings with Associate Dean of Engineering
42 .35(.42) .47(.49)
Friday Seminars 42 .49(.39) .73(.74 Evening Out-Bowling 42 .51(.49) .99(.99) Skating 42 .57(.76) .17(.21) Trip to Mall 40 .43(.65) .80(.80) 4th of July Cookout 42 .57(.69) .72(.72) Ropes Course 42 .51(.63) .04(.12) Updating Your Resumes 42 .71(.75) .91(.91) Lab Tours 42 .23(.07) .71(.78) Etiquette Dinner 42 .65(.78) .06(.08) Fortune 500 Company Teambuilding Activities
42 .16(.10) .43(.44)
Move-out Meeting 42 .48(.59) .58(.59) Seminar Sponsored by Fortune 500 Company
42 .75(.68) .42(.54)
Student Panel 42 .78(.80) .70(.77) On-line Survey 42 .77(.84) .73(.80) University Freshmen Orientation 42 .90(.94) .58(.59) Move-Out 42 .80(.90) .15(.17) Closing Ceremony 42 .36(.50) .78(.75)
P-values are in parentheses. Significant differences are denoted with an asterisk (*).

190
Table 4.18. Likelihood Ratio and Pearson Significance Tests on Summer Bridge Inventory Personal-
Emotional Adjustment: Psychological Raw Scores
Activities N Likelihood Ratio/Pearson
(P Value for Race) Likelihood Ratio/Pearson
(P Value for Gender) Individual and Group Pictures 42 .60(.73) .61(.62) Introduction Meeting 42 .52(.71) .36(.47) Chemistry Class 42 .75(.86) .25(.30) Chemistry Lab Class 42 .53(.21) .27(.36) Engineering Class 42 .23(.30) .98(.98) Math Class 42 .63(.80) .32(.37) Campus Tour 42 .43(.54) .98(.98) STEP Schedule Overview 42 .82(.89) .50(.52) Floor Meeting 42 .56(.66) .97(.97) Student ID Pickup 42 .20(.41) .88(.88) Registration & Class Sign Up and information for fall term
42 .09(.24) .51(.54)
Meetings with Associate Dean of Engineering
42 .04(.06) .66(.69)
Friday Seminars 42 .43(.62) .91(.91) Evening Out-Bowling 42 .34(.35) .30(.33) Skating 42 .35(.32) .03(.07) Trip to Mall 40 .24(.22) .01(.05) 4th of July Cookout 42 .24(.09) .007(.03*) Ropes Course 42 .69(.82) .35(.46) Updating Your Resumes 42 .01(.006*) .18(.19) Lab Tours 42 .18(.18) .98(.98) Etiquette Dinner 42 .17(.31) .40(.43) Fortune 500 Company Teambuilding Activities
42 .04(.16) .44(.46)
Move-out Meeting 42 .70(.74) .38(.55) Seminar Sponsored by Fortune 500 Company
42 .03(.12) .96(.96)
Student Panel 42 .81(.91) .49(.51) On-line Survey 42 .70(.78) .88(.88) University Freshmen Orientation 42 .76(.85) .14(.17) Move-Out 42 .17(.26) .30(.33) Closing Ceremony 42 .64(.66) .64(.65)
P-values are in parentheses. Significant differences are denoted with an asterisk (*).

191
Table 4.19. Likelihood Ratio and Pearson Significance Tests on Summer Bridge Inventory Goal
Commitment/Institutional Commitment Adjustment: General Raw Scores
Activities N Likelihood Ratio/Pearson
(P Value for Race) Likelihood Ratio/Pearson
(P Value for Gender) Individual and Group Pictures 42 .92(.97) .60(.63) Introduction Meeting 42 .70(.79) .79(.79) Chemistry Class 42 .57(.75) .53(.55) Chemistry Lab Class 42 .69(.85) .69(.77) Engineering Class 42 .51(.79) .34(.50) Math Class 42 .39(.72) .27(.37) Campus Tour 42 .76(.91) .04(.12) STEP Schedule Overview 42 .29(.57) .57(.58) Floor Meeting 42 .52(.53) .12(.14) Student ID Pickup 42 .47(.64) .05(.09) Registration & Class Sign Up and information for fall term
42 .85(.95) .44(.44)
Meetings with Associate Dean of Engineering
42 .82(.91) .89(.90)
Friday Seminars 42 .06(.12) .69(.70) Evening Out-Bowling 42 .43(.57) .46(.49) Skating 42 .36(.35) .25(.34) Trip to Mall 42 .37(.50) .04(.11) 4th of July Cookout 42 .30(.40) .33(.37) Ropes Course 42 .65(.67) .17(.26) Updating Your Resumes 42 .16(.27) .65(.66) Lab Tours 42 .06(.06) .90(.90) Etiquette Dinner 42 .34(.35) .42(.54) Fortune 500 Company Teambuilding Activities
42 .12(.23) .81(.82)
Move-out Meeting 42 .12(.22) .34(.36) Seminar Sponsored by Fortune 500 Company
42 .26(.31) .42(.54)
Student Panel 42 .38(.39) .45(.46) On-line Survey 42 .22(.21) .44(.52) University Freshmen Orientation 42 .71(.79) .01(.04*) Move-Out 42 .03(.05) .37(.40) Closing Ceremony 42 .53(.67) .81(.82)
P-values are in parentheses. Significant differences are denoted with an asterisk (*).

192
Table 4.20. Likelihood Ratio and Pearson Significance Tests on Summer Bridge Inventory Goal
Commitment/Institutional Commitment Adjustment: This College Raw Scores
Activities N Likelihood Ratio/Pearson
(P Value for Race) Likelihood Ratio/Pearson
(P Value for Gender) Individual and Group Pictures 42 .27(.41) .55(.56) Introduction Meeting 42 .63(.82) .10(.13) Chemistry Class 42 .58(.75) .44(.51) Chemistry Lab Class 42 .79(.93) .30(.45) Engineering Class 42 .84(.95) .42(.54) Math Class 42 .26(.55) .74(.74) Campus Tour 42 .67(.77) .06(.16) STEP Schedule Overview 42 .02(.09) .72(.72) Floor Meeting 42 .27(.32) .96(.96) Student ID Pickup 42 .53(.81) .82(.82) Registration & Class Sign Up and information for fall term
42 .66(.88) .70(.71) Meetings with Associate Dean of Engineering
42 .24(.33) .10(.20)
Friday Seminars 42 .10(.15) .58(.59) Evening Out-Bowling 42 .32(.58) .44(.45) Skating 42 .33(.44) .03(.06) Trip to Mall 40 .40(.52) .01(.03*) 4th of July Cookout 42 .10(.21) .11(.21) Ropes Course 42 .69(.79) .01(.05) Updating Your Resumes 42 .64(.76) .21(.23) Lab Tours 42 .19(.37) .89(.89) Etiquette Dinner 41 .46(.71) .28(.31) Fortune 500 Company Teambuilding Activities
42 .02(.06) .44(.45)
Move-out Meeting 42 .05(.10) .66(.67) Seminar Sponsored by Fortune 500 Company
42 .22(.88) .22(.27)
Student Panel 42 .39(.46) .08(.11) On-line Survey 42 .04(.05) .51(.64) University Freshmen Orientation 42 .38(.52) .005(.01*) Move-Out 42 .27(.34) .42(.49) Closing Ceremony 42 .33(.60) .33(.35)
P-values are in parentheses. Significant differences are denoted with an asterisk (*).

193
Table 4.21. Likelihood Ratio and Pearson Significance Tests on Summer Bridge Inventory Rank Raw
Scores
Activities N Likelihood Ratio/Pearson
(P Value for Race) Likelihood Ratio/Pearson
(P Value for Gender) Individual and Group Pictures 42 .85(.56) .22(.56) Introduction Meeting 42 .89(.29) .21(.52) Chemistry Class 42 .72(.58) .03(.17) Chemistry Lab Class 42 .88(.86) .06(.31) Engineering Class 42 .97(.89) .15(.44) Math Class 42 .97(.87) .008(.06) Campus Tour 42 .95(.55) .01(.15) STEP Schedule Overview 42 .82(.43) .03(.21) Floor Meeting 41 .40(.05) .11(.37) Student ID Pickup 42 .93(.49) .06(.34) Registration & Class Sign Up and information for fall term
42 .71(.49) .10(.31)
Meetings with Associate Dean of Engineering
42 .87(.33) .54(.77)
Friday Seminars 42 .80(.09) .27(.62) Evening Out-Bowling 42 .78(.11) .06(.28) Skating 42 .96(.50) .005(.10) Trip to Mall 42 .64(.26) .10(.40) 4th of July Cookout 42 .93(.44) .04(.25) Ropes Course 42 .92(.80) .62(.86) Updating Your Resumes 42 .77(.07) .16(.49) Lab Tours 42 .81(.49) .01(.16) Etiquette Dinner 42 .93(.82) .02(.19) Fortune 500 Company Teambuilding Activities
42 .76(.78) .37(.68)
Move-out Meeting 42 .82(.66) .04(.18) Seminar Sponsored by Fortune 500 Company
42 .81(.41) .26(.56)
Student Panel 42 .90(.60) .18(.48) On-line Survey 42 .67(.55) .32(.56) University Freshmen Orientation 42 .88(.47) .04(.15) Move-Out 42 .80(.57) .16(.36) Closing Ceremony 42 .75(.13) .01(.13)
P-values are in parentheses. Significant differences are denoted with an asterisk (*).

194
Table 4.22. Likelihood Ratio and Pearson Significance Tests on Summer Bridge Inventory Subscale Raw
Scores
Activities Likelihood Ratio/Pearson Likelihood Ratio/Pearson
(P Value for Gender) N (P Value for Race) Individual and Group Pictures 42 .36(.41) .02(.04*) Introduction Meeting 42 .24(.17) .55(.55) Chemistry Class 42 .82(.90) .25(.33) Chemistry Lab Class 42 .82(.90) .25(.33) Engineering Class 42 .82(.90) .25(.33) Math Class 42 .82(.90) .25(.33) Campus Tour 42 .34(.38) .22(.24) STEP Schedule Overview 42 .24(.45) .27(.28) Floor Meeting 42 .78(.83) .007(.02*) Student ID Pickup 42 .30(.31) .22(.36) Registration & Class Sign Up and information for fall term
42 .09(.16) .18(.22)
Meetings with Associate Dean of Engineering
42 .12(.02*) .63(.72)
Friday Seminars 42 .01(.01*) .17(.20) Evening Out-Bowling 42 .43(.27) .60(.60) Skating 42 .29(.10) .94(.94) Trip to Mall 42 .48(.30) .21(.31) 4th of July Cookout 42 .29(.10) .94(.94) Ropes Course 42 .80(.87) .37(.51) Updating Your Resumes 42 .93(.93) .30(.31) Lab Tours 42 .41(.43) .81(.82) Etiquette Dinner 42 .75(.87) .45(.53) Fortune 500 Company Teambuilding Activities
42 .28(.30) .41(.42)
Move-out Meeting 42 .70(.74) .53(.61) Seminar Sponsored by Fortune 500 Company
42 .45(.34) .42(.44)
Student Panel 42 .80(.91) .47(.47) On-line Survey 42 .72(.81) .86(.86) University Freshmen Orientation 42 .61(.76) .12(.17) Move-Out 42 .33(.42) .44(.51) Closing Ceremony 42 .40(.56) .29(.34)
P-values are in parentheses. Significant differences are denoted with an asterisk (*).

195
Appendix M: Supplementary Table 4.23
Table 4.23. Mean and Standard Deviations for Rankings for the 29 Activities of the SBI
Activities N Mean SD
Engineering Class 42 25.40 4.72 Math Class 42 22.93 5.54 Chemistry Lab Class 42 22.21 6.25 Chemistry Class 42 22.00 6.81 Registration & Class Sign Up and information for fall term 42 21.19 5.64 Ropes Course 42 20.38 7.81 4th of July Cookout 42 18.71 7.11 Campus Tour 42 17.90 6.35 Updating Your Resumes 42 17.38 6.25 Etiquette Dinner 42 17.33 7.59 Evening Out-Bowling 42 17.02 6.64 Orientation Meetings with Associate Dean of Engineering 42 16.98 5.95 Introduction Meeting 42 16.26 6.68 Skating 42 15.90 7.75 Student ID Pickup 42 14.81 7.56 Lab Tours 42 14.40 6.94 Trip to Mall 42 13.76 8.30 STEP Schedule Overview 42 13.31 6.23 Floor Meeting 41 13.20 6.44 Closing Ceremony 42 13.14 8.53 Individual and Group Pictures 42 12.36 7.72 Friday Seminars 42 11.64 6.33 Fortune 500 Company Teambuilding Activities 42 11.60 6.75 Move-out Meeting 42 11.14 6.91 Student Panel 42 10.50 6.82 Seminar Sponsored by Fortune 500 Company 42 7.48 4.94 Move-Out 42 7.17 5.13 University Freshmen Orientation 42 5.19 6.33 On-line Survey 42 4.57 3.34

196
Appendix N: Supplementary Table 4.24
Table 4.24. Mean Ranks for Activities Based on SBI Scales
(1 =Academic, 2 = Social, 3 Personal-Emotional, and 4=Goal Commitment and Institutional Adjustment)
Activities N Subscale Mean SBI Scale Engineering Class 42 1.07 Academic Math Class 42 1.07 Academic Chemistry Lab Class 42 1.07 Academic Chemistry Class 42 1.07 Academic 4th of July Cookout 42 2.04 Social Skating 42 2.04 Social Evening Out-Bowling 42 2.07 Social Trip to Mall 42 2.19 Social Individual and Group Pictures 42 2.35 Social
Registration & Class Sign Up and information for fall term
2.4
Social
42 Etiquette Dinner 42 2.4 Social Student Panel 42 2.42 Social Friday Seminars 42 2.5 Social Floor Meeting 42 2.52 Social Introduction Meeting 42 2.54 Social Updating Your Resumes 42 2.69 Social Closing Ceremony 42 2.73 Social Ropes Course 42 2.76 Social Orientation Meetings with Associate Dean of Engineering
42 2.78
Social
Seminar Sponsored by Fortune 500 Company
42 2.83
Social
Move-Out 42 2.85 Social University Freshmen Orientation
42 2.9
Social
STEP Schedule Overview 42 2.92 Social Fortune 500 Company Teambuilding Activities
42 2.92
Social
Move-out Meeting 42 2.95 Social Lab Tours 42 3.04 Personal Emotional Student ID Pickup 42 3.23 Personal Emotional Campus Tour 42 3.4 Personal Emotional On-line Survey 42 3.42 Personal Emotional
The range is the following: 1-1.99 (Academic), 2.0-2.99 (Social), 3.0-3.99 (Personal-Emotional),and 4.0-4.99 (Goal Commitment/Institutional

197
Appendix O: Supplementary Tables 4.26 to 4.36
Table 4.25. Activity Means and Standard Deviation from the Summer Bridge Inventory for
Academic Adjustment: Motivation Subscale
Activity N Mean SD
Engineering Class 42 4.64 0.66 Registration & Class Sign Up and information for fall term 42 4.60 0.89 Math Class 42 4.45 0.92 Orientation Meetings with Associate Dean of Engineering 42 4.45 0.92 Chemistry Class 42 4.43 0.89 Chemistry Lab Class 42 4.40 0.91 Updating Your Resumes 42 4.10 1.16 Lab Tours 41 3.76 1.43 Campus Tour 42 3.64 1.38 Fortune 500 Company Teambuilding Activities 42 3.26 1.43 Introduction Meeting 42 3.21 1.32 Student Panel 42 3.21 1.41 Seminar Sponsored by Fortune 500 Company 42 3.19 1.42 Floor Meeting 42 3.19 1.23 Closing Ceremony 42 3.19 1.63 Friday Seminars 42 3.07 1.40 Student ID Pickup 42 3.05 1.58 Ropes Course 42 3.00 1.40 STEP Schedule Overview 42 2.98 1.39 4th of July Cookout 42 2.88 1.43 Etiquette Dinner 42 2.71 1.37 Evening Out-Bowling 42 2.57 1.40 On-line Survey 42 2.43 1.43 Skating 42 2.40 1.19 University Freshmen Orientation 42 2.36 1.34 Move-Out 42 2.33 1.44 Trip to Mall 41 2.24 1.26 Individual and Group Pictures 42 2.17 1.23 Move-out Meeting 42 2.05 1.13

198
Table 4.26. Activity Means and Standard Deviation from the Summer Bridge Inventory for
Academic Adjustment: Application Subscale
Activities N Mean SD
Engineering Class 42 4.64 0.62 Chemistry Lab Class 42 4.52 0.74 Chemistry Class 42 4.45 0.89 Math Class 42 4.33 1.03 Registration & Class Sign Up and information for fall term 42 4.14 1.24 Meetings with Associate Dean of Engineering 42 4.02 1.20 Updating Your Resumes 42 3.98 1.33 Lab Tours 41 3.20 1.29 Friday Seminars 42 2.93 1.40 Fortune 500 Company Teambuilding Activities 42 2.90 1.43 Ropes Course 42 2.86 1.52 Move-out Meeting 42 2.86 1.39 STEP Schedule Overview 42 2.86 1.35 Campus Tour 42 2.79 1.44 Student Panel 42 2.69 1.20 Introduction Meeting 42 2.64 1.43 Closing Ceremony 42 2.50 1.49 Etiquette Dinner 42 2.36 1.45 On-line Survey 42 2.29 1.24 University Freshmen Orientation 42 2.26 1.31 Floor Meeting 42 2.26 1.17 4th of July Cookout 42 2.10 1.28 Student ID Pickup 42 2.10 1.28 Seminar Sponsored by Fortune 500 Company 42 1.88 1.13 Evening Out-Bowling 42 1.83 0.99 Skating 42 1.79 0.92 Move-Out 42 1.74 1.13 Individual and Group Pictures 42 1.74 0.96 Trip to Mall 41 1.59 0.92

199
Table 4.27. Activity Means and Standard Deviation from the Summer Bridge Inventory for
Academic Adjustment: Performance Subscale
Activities N Mean SD
Chemistry Lab Class 41 4.66 0.66 Engineering Class 41 4.59 0.59 Chemistry Class 41 4.56 0.67 Math Class 41 4.46 0.87 Meetings with Associate Dean of Engineering 41 3.85 1.33 Registration & Class Sign Up and information for fall term 41 3.46 1.66 Updating Your Resumes 41 3.44 1.43 Fortune 500 Company Teambuilding Activities 41 3.00 1.48 Move-out Meeting 41 2.80 1.42 Lab Tours 40 2.80 1.44 Friday Seminars 41 2.73 1.47 STEP Schedule Overview 41 2.66 1.35 Student Panel 41 2.63 1.24 Ropes Course 41 2.54 1.50 Campus Tour 41 2.49 1.42 Introduction Meeting 41 2.46 1.32 Closing Ceremony 41 2.39 1.61 Etiquette Dinner 41 2.22 1.39 Floor Meeting 41 2.15 1.28 4th of July Cookout 41 2.02 1.29 On-line Survey 41 2.00 1.14 Student ID Pickup 41 1.88 1.23 University Freshmen Orientation 41 1.85 1.15 Evening Out-Bowling 41 1.78 1.13 Skating 41 1.61 0.97 Seminar Sponsored by Fortune 500 Company 41 1.61 1.09 Trip to Mall 40 1.53 0.99 Individual and Group Pictures 41 1.44 0.81 Move-Out 41 1.39 0.83

200
Table 4.28. Activity Means and Standard Deviation from the Summer Bridge Inventory for
Academic Adjustment: Academic Environment Subscale
Activities N Mean SD
Chemistry Class 42 4.48 0.92 Chemistry Lab Class 42 4.43 1.02 Engineering Class 42 4.38 0.94 Math Class 42 4.31 1.05 Campus Tour 42 3.95 1.25 Meetings with Associate Dean of Engineering 42 3.90 1.30 Registration & Class Sign Up and information for fall term 42 3.64 1.54 Updating Your Resumes 42 3.43 1.52 Lab Tours 42 3.43 1.40 Introduction Meeting 42 3.19 1.35 Floor Meeting 42 3.17 1.32 Friday Seminars 42 3.07 1.42 Student Panel 42 2.93 1.35 Ropes Course 42 2.88 1.52 Evening Out-Bowling 42 2.83 1.56 Seminar Sponsored by Fortune 500 Company 42 2.83 1.58 4th of July Cookout 42 2.81 1.52 Fortune 500 Company Teambuilding Activities 42 2.79 1.54 Etiquette Dinner 42 2.76 1.53 Student ID Pickup 42 2.71 1.49 STEP Schedule Overview 42 2.69 1.37 Closing Ceremony 42 2.64 1.69 Skating 42 2.52 1.47 Individual and Group Pictures 42 2.24 1.46 On-line Survey 42 2.21 1.46 Trip to Mall 41 2.20 1.47 University Freshmen Orientation 42 2.17 1.34 Move-out Meeting 42 1.86 1.12 Move-Out 42 1.64 1.28

201
Table 4.29. Activity Means and Standard Deviation from the Summer Bridge Inventory for Social
Adjustment: General Subscale
Activities N Mean SD
4th of July Cookout 42 4.93 0.26 Evening Out-Bowling 42 4.76 0.58 Skating 42 4.71 0.71 Ropes Course 42 4.71 0.74 Etiquette Dinner 42 4.38 0.94 Trip to Mall 40 4.38 1.23 Floor Meeting 42 3.90 1.08 Introduction Meeting 42 3.86 1.28 Individual and Group Pictures 42 3.79 1.18 Fortune 500 Company Teambuilding Activities 42 3.57 1.36 Closing Ceremony 42 3.52 1.25 Engineering Class 42 3.31 1.26 Chemistry Lab Class 42 3.21 1.30 Campus Tour 42 3.21 1.32 Move-out Meeting 42 3.12 1.38 Math Class 42 3.05 1.31 Chemistry Class 42 2.98 1.28 Student Panel 42 2.98 1.35 Seminar Sponsored by Fortune 500 Company 42 2.93 1.35 University Freshmen Orientation 42 2.93 1.50 Lab Tours 42 2.83 1.29 Move-Out 42 2.81 1.49 Friday Seminars 42 2.71 1.33 Meetings with Associate Dean of Engineering 42 2.64 1.32 Student ID Pickup 42 2.48 1.31 STEP Schedule Overview 42 2.45 1.25 Registration & Class Sign Up and information for fall term 42 2.24 1.19 Updating Your Resumes 42 2.07 1.07 On-line Survey 41 1.49 0.95

202
Table 4.30. Activity Means and Standard Deviation from the Summer Bridge Inventory for
Social Adjustment: Other People Subscale
Activities N Mean SD
4th of July Cookout 42 4.81 0.67 Skating 42 4.81 0.45 Evening Out-Bowling 42 4.79 0.52 Ropes Course 42 4.69 0.60 Trip to Mall 40 4.43 1.13 Etiquette Dinner 42 4.24 1.10 Floor Meeting 42 3.83 1.27 Introduction Meeting 42 3.74 1.29 Engineering Class 42 3.67 1.24 Individual and Group Pictures 42 3.50 1.38 Chemistry Lab Class 42 3.50 1.31 Fortune 500 Company Teambuilding Activities 42 3.48 1.33 Math Class 42 3.43 1.33 Chemistry Class 42 3.38 1.32 Closing Ceremony 41 3.34 1.46 Campus Tour 42 3.24 1.49 University Freshmen Orientation 42 3.05 1.56 Move-out Meeting 42 3.02 1.35 Student Panel 42 3.00 1.31 Lab Tours 42 2.76 1.41 Move-Out 42 2.69 1.51 Meetings with Associate Dean of Engineering 42 2.69 1.33 Seminar Sponsored by Fortune 500 Company 42 2.64 1.38 Friday Seminars 42 2.52 1.35 STEP Schedule Overview 42 2.38 1.32 Student ID Pickup 42 2.19 1.40 Registration & Class Sign Up and information for fall term 42 2.07 1.13 Updating Your Resumes 42 1.93 1.11 On-line Survey 42 1.48 0.97

203
Table 4.31. Activity Means and Standard Deviation from the Summer Bridge Inventory for
Social Adjustment: Nostalgia Subscale
Activities N Mean SD
4th of July Cookout 42 4.48 1.19 Evening Out-Bowling 42 4.43 0.99 Skating 42 4.38 1.13 Ropes Course 42 4.33 1.26 Trip to Mall 40 4.18 1.43 Introduction Meeting 42 3.79 1.18 Floor Meeting 42 3.71 1.31 Etiquette Dinner 42 3.67 1.34 Campus Tour 42 3.48 1.49 Individual and Group Pictures 42 3.43 1.68 Closing Ceremony 42 3.38 1.48 Engineering Class 42 3.24 1.46 Math Class 42 3.14 1.51 Chemistry Lab Class 41 3.12 1.49 Move-Out 42 3.10 1.56 Chemistry Class 42 3.10 1.53 Seminar Sponsored by Fortune 500 Company 42 2.98 1.58 Fortune 500 Company Teambuilding Activities 42 2.90 1.53 University Freshmen Orientation 42 2.81 1.38 Meetings with Associate Dean of Engineering 42 2.76 1.32 STEP Schedule Overview 42 2.76 1.51 Student ID Pickup 42 2.60 1.48 Move-out Meeting 42 2.60 1.52 Student Panel 42 2.57 1.31 Lab Tours 42 2.52 1.44 Friday Seminars 42 2.52 1.25 Registration & Class Sign Up and information for fall term 42 2.52 1.45 Updating Your Resumes 42 2.05 1.19 On-line Survey 42 1.71 1.02

204
Table 4.32. Activity Means and Standard Deviation from the Summer Bridge Inventory for
Social Adjustment: Social Environment Subscale
Activities N Mean SD
4th of July Cookout 42 4.48 1.15 Evening Out-Bowling 42 4.36 1.10 Skating 42 4.31 1.16 Ropes Course 42 4.21 1.44 Trip to Mall 40 3.95 1.54 Chemistry Lab Class 42 3.83 1.27 Engineering Class 42 3.83 1.27 Chemistry Class 42 3.81 1.29 Math Class 42 3.76 1.30 Floor Meeting 42 3.74 1.25 Etiquette Dinner 42 3.71 1.42 Campus Tour 42 3.71 1.27 Closing Ceremony 42 3.50 1.44 Introduction Meeting 42 3.43 1.45 Meetings with Associate Dean of Engineering 42 3.26 1.31 Individual and Group Pictures 42 3.24 1.69 University Freshmen Orientation 42 3.07 1.49 Lab Tours 42 2.93 1.39 Fortune 500 Company Teambuilding Activities 42 2.90 1.49 Registration & Class Sign Up and information for fall term 42 2.88 1.38 Move-Out 42 2.86 1.60 Student ID Pickup 42 2.81 1.49 Seminar Sponsored by Fortune 500 Company 42 2.81 1.45 Student Panel 42 2.67 1.32 Friday Seminars 42 2.67 1.37 Move-out Meeting 42 2.64 1.46 STEP Schedule Overview 42 2.62 1.36 Updating Your Resumes 42 2.57 1.52 On-line Survey 42 1.86 1.22

205
Table 4.33. Activity Means and Standard Deviation from the Summer Bridge Inventory for
Personal-Emotional Adjustment: Psychological Subscale
Activities N Mean SD
Ropes Course 42 4.10 1.27 Chemistry Lab Class 42 3.79 1.12 Engineering Class 42 3.71 1.17 Math Class 42 3.71 1.13 4th of July Cookout 42 3.67 1.54 Skating 42 3.64 1.48 Chemistry Class 42 3.62 1.08 Introduction Meeting 42 3.57 1.29 Evening Out-Bowling 42 3.57 1.52 Trip to Mall 40 3.45 1.55 Meetings with Associate Dean of Engineering 42 3.40 1.31 Individual and Group Pictures 42 3.40 1.56 Registration & Class Sign Up and information for fall term 42 3.38 1.45 Closing Ceremony 42 3.36 1.50 Campus Tour 42 3.33 1.34 Floor Meeting 42 3.19 1.38 Etiquette Dinner 42 3.14 1.51 STEP Schedule Overview 42 3.12 1.31 Updating Your Resumes 42 3.07 1.30 Fortune 500 Company Teambuilding Activities 42 2.90 1.36 Student Panel 42 2.90 1.53 Friday Seminars 42 2.81 1.33 Seminar Sponsored by Fortune 500 Company 42 2.76 1.34 Move-Out 42 2.76 1.56 Lab Tours 42 2.74 1.38 Student ID Pickup 42 2.64 1.54 Move-out Meeting 42 2.50 1.35 On-line Survey 42 2.48 1.44 University Freshmen Orientation 42 2.48 1.27

206
Table 4.34. Activity Means and Standard Deviation from the Summer Bridge Inventory for
Personal-Emotional Adjustment: Physical Subscale
Activities N Mean SD
Ropes Course 42 4.17 1.34 4th of July Cookout 42 3.83 1.25 Evening Out-Bowling 42 3.83 1.31 Skating 42 3.79 1.35 Trip to Mall 40 3.58 1.39 Campus Tour 42 3.24 1.59 Chemistry Class 42 3.05 1.53 Chemistry Lab Class 42 2.81 1.47 Move-Out 42 2.76 1.54 Etiquette Dinner 42 2.67 1.39 Engineering Class 42 2.52 1.50 Math Class 42 2.33 1.49 Lab Tours 42 2.26 1.13 Fortune 500 Company Teambuilding Activities 42 2.24 1.30 Student ID Pickup 42 2.19 1.40 Closing Ceremony 42 2.12 1.29 University Freshmen Orientation 42 2.07 1.31 Individual and Group Pictures 42 2.07 1.52 Meetings with Associate Dean of Engineering 42 2.02 1.41 Friday Seminars 42 1.98 1.28 Floor Meeting 42 1.86 1.32 Introduction Meeting 42 1.81 1.35 Seminar Sponsored by Fortune 500 Company 42 1.79 1.24 Move-out Meeting 42 1.74 1.13 Student Panel 42 1.71 1.22 Registration & Class Sign Up and information for fall term 42 1.69 1.22 STEP Schedule Overview 42 1.64 1.19 Updating Your Resumes 42 1.60 1.19 On-line Survey 42 1.52 1.17

207
Table 4.35. Activity Means and Standard Deviation from the Summer Bridge Inventory for Goal
Commitment/Institutional Adjustment: General Subscale
Activities N Mean SD
Engineering Class 42 4.24 1.03 Math Class 42 4.19 0.99 Chemistry Class 42 4.10 1.03 Chemistry Lab Class 42 4.00 1.10 Registration & Class Sign Up and information for fall term 42 3.86 1.47 4th of July Cookout 42 3.76 1.27 Orientation Meetings with Associate Dean of Engineering 42 3.74 1.31 Campus Tour 42 3.67 1.26 Ropes Course 42 3.57 1.48 Student ID Pickup 42 3.57 1.36 Updating Your Resumes 42 3.50 1.37 Skating 42 3.45 1.25 Introduction Meeting 42 3.40 1.48 Evening Out-Bowling 42 3.33 1.24 Closing Ceremony 42 3.31 1.55 Lab Tours 42 3.29 1.35 Etiquette Dinner 42 3.29 1.29 Trip to Mall 40 3.05 1.45 Floor Meeting 42 3.05 1.34 Fortune 500 Company Teambuilding Activities 42 2.98 1.42 Individual and Group Pictures 42 2.90 1.61 Move-out Meeting 42 2.83 1.40 STEP Schedule Overview 42 2.81 1.35 University Freshmen Orientation 42 2.71 1.52 Student Panel 42 2.71 1.27 Move-Out 42 2.69 1.67 Friday Seminars 42 2.64 1.27 Seminar Sponsored by Fortune 500 Company 42 2.26 1.29 On-line Survey 42 1.81 1.13

208
Table 4.36. Activity Means and Standard Deviation from the Summer Bridge Inventory for Goal
Commitment/Institutional Adjustment: This College Subscale
Activities N Mean SD
Engineering Class 42 4.43 0.94 Chemistry Class 42 4.33 0.90 Math Class 42 4.26 1.06 Chemistry Lab Class 42 4.17 1.10 Registration & Class Sign Up and information for fall term 42 4.14 1.30 Student ID Pickup 42 4.10 1.30 Campus Tour 42 4.07 1.31 Orientation Meetings with Associate Dean of Engineering 42 4.02 0.95 4th of July Cookout 42 3.76 1.32 Skating 42 3.64 1.28 Lab Tours 42 3.55 1.50 Evening Out-Bowling 42 3.50 1.33 Ropes Course 42 3.45 1.43 Introduction Meeting 42 3.38 1.40 Closing Ceremony 42 3.36 1.54 Floor Meeting 42 3.29 1.35 Student Panel 42 3.17 1.50 Etiquette Dinner 41 3.12 1.50 Updating Your Resumes 42 3.10 1.45 Trip to Mall 40 3.08 1.56 University Freshmen Orientation 42 3.02 1.54 Move-Out 42 2.93 1.70 Individual and Group Pictures 42 2.93 1.52 STEP Schedule Overview 42 2.83 1.45 Move-out Meeting 42 2.83 1.61 Fortune 500 Company Teambuilding Activities 42 2.79 1.54 Friday Seminars 42 2.67 1.28 Seminar Sponsored by Fortune 500 Company 42 2.43 1.43 On-line Survey 42 2.02 1.41

209
Appendix P: Supplementary Tables 4.45 to 4.55
Table 4.45. Director’s and Participants’ Responses for AA Theme (Sorted by Gender and Race)
Coding Classification
Academic Adjustment Theme
Gender Male(Female)
Race Minority (Majority)
Director
Comments Pre-College Characteristics
• Independence vs. dependence
• Introduction
• Learning styles
• Preparation
3(2) 5(0) 0
1(0) 0(1) 1
6(3)
9(9)
6(3)
13(5)
1 1
Comments About Involvement
• Skills and abilities
• Motivation
1(5)
0(1)
4(2)
1(0)
1 0
Comments About the Benefits of Summer Bridge Program
• Independence vs. dependence
• Preparation
• Networking
7(3)
4(5)
1(2)
7(3)
5(4)
2(1)
0 0 0

210
Table 4.46. Director’s and Participants’ Responses for SA Theme (Sorted By Gender and Race)
Coding Classification
Social Adjustment Theme
Gender Male(Female)
Race Minority(Majority)
Director
Comments Pre-College
Characteristics
• Preparation
• Learning styles
9(3)
3(4)
9(3)
3(4)
1 1
Comments About
Involvement
• Skills and abilities
• Motivation
4(6)
3(1)
5(5)
1(3)
0 0
Comments About the Benefits of
Summer Bridge Program
• Preparation
• Independence and dependence
• Networking
11(9) 12(8) 1
5(3)
5(3) 0
3(0)
2(1)
0

211
Table 4.47 Director’s and Participants’ Responses for PEA Theme (Sorted By Gender and Race)
Table 4.48. Director’s and Participants’ Responses for GCIA Theme (Sorted By Gender and Race)
Coding Classification Goal Commitment and Institutional Adjustment Theme
Gender Male(Female)
Race Minority(Majority)
Director
Comments About Pre-College Characteristics
• Preparation 10(4) 8(6) 1
Comments About Involvement
• Skills and abilities
• Motivation
1(5) 5(1) 1
13(6) 9(10) 1
Comments About the Benefits of Summer Bridge Program
• Networking
• Preparation
• Independence vs. dependence
3(2)
7(3)
0(0)
0(5)
5(5)
0(0)
0 1 1
Coding Classification
Social Adjustment Theme
Gender Male(Female)
Race Minority(Majority)
Director
Comments About Pre-College Characteristics
• Preparation
• Networking
2(5)
0(2)
3(4)
0(2)
3 0
Comments About Involvement
• Skills and abilities
• Motivation
0(2)
1(2)
1(1)
1(2)
0 0
Comments About Summer Bridge Program
• Preparation
• Independence and dependence
• Networking
4(2)
5(1) 1
1(3)
2(2) 1
5(3) 2(6) 1

212
Table 4.49. Director’s and Participants’ Responses for Difficulties of SBP (Sorted by Gender and
Race)
Coding Classification
Weakness Theme Gender Male(Female)
Race Minority(Majority)
Director
Comments About Pre-College Characteristics
• Independence vs. dependence
• Preparation
1(1)
1(2)
2(0)
2(1)
0 1
Comments About Involvement
• Skills and abilities
• Motivation
2(3) 1(4) 0
0(1) 0(1) 0
Comments About the Benefits of Summer Bridge Program
• Networking
• Preparation
0(1) 0(1) 0
0(2)
0(2) 1
Table 4.50. Director’s and Participants’ Response Strengths of SBP (Sorted By Gender and Race)
Coding Classification Strengths Theme Gender Male(Female)
Race Minority(Majority)
Director
Comments About Pre-College Characteristics
• Independence vs. dependence
• Preparation
3(1)
0(1)
4(0)
1(0)
0 1
Comments About Involvement
• Skills and abilities
• Motivation
0(3) 0
2(1) 0
1 1
Comments About the Benefits of Summer Bridge Program
• Independence vs. dependence
• Networking
• Preparation
2(4) 5(1) 1
1(2)
3(7)
1(2)
6(4)
1 1

213
Table 4.51. Participants’ Responses for Perception of SBP Theme (Sorted By Gender and Race)
Coding Classification
Perception of Summer Bridge Program
Gender Male(Female)
Race Minority(Majority)
• Networking
• Preparation
• Skills and abilities
• Motivation
3(4)
6(1)
3(4)
1(4)
0(1)
6(1)
4(1)
0(1)
Table 4.52. Participants’ Responses Guiding Philosophy (Sorted By Gender and Race)
Coding Classification Guiding Philosophy Gender Male(Female)
Race Minority(Majority)
• Preparation
• Networking
5(4)
4(5)
0(1) 1(0)
Table 4.53. Participants’ Responses for Prepare for College (Sorted By Gender and Race)
Coding Classification SBP: Prepare For College
Gender Male(Female)
Race Minority(Majority)
• Preparation
• Networking
• Motivation
• Skills and abilities
• Independence vs. dependence
11(12) 10(13)
0(5)
0(2)
0(1)
1(1)
2(3)
2(0)
0(1)
0(2)

214
Table 4.54. Director’s and Participants’ Responses for Other Thoughts (Sorted By Gender and Race)
Coding Classification Other Thoughts Gender Male(Female)
Race Minority(Majority)
Director
• Networking
• Preparation
• Skills and abilities
3(3) 2(3) 1
3(7)
2(0)
8(2)
2(0)
1 0
Table 4.55. Responses for the Director Final Remarks
Coding Classification Director Director • Preparation
• Independence vs. dependence
5 2