measuring soil water content with ground penetrating radar: a review
TRANSCRIPT

Measuring Soil Water Content with Ground Penetrating Radar: A Review
J. A. Huisman,* S. S. Hubbard, J. D. Redman, and A. P. Annan
ABSTRACT termines the diurnal evolution of the atmospheric bound-ary layer (Callies et al., 1998). Currently, there is a needWe present a comprehensive review of methods to measure soilto establish and quantify the contribution of soil waterwater content with ground penetrating radar (GPR). We distinguishcontent–regulated land–atmosphere coupling to regionalfour methodologies: soil water content determined from reflectedclimate anomalies, such as continental droughts andwave velocity, soil water content determined from ground wave veloc-large-scale precipitation events (Entekhabi et al., 1999).ity, soil water content determined from transmitted wave velocity
At the catchment scale, soil water content partly con-between boreholes, and soil water content determined from the sur-trols the separation of precipitation into infiltration,face reflection coefficient. For each of these four methodologies, weevaporation, and runoff and therefore has a large influ-discuss the basic principles, illustrate the quality of the data with fieldence on soil erosion and river discharge. Recent studiesexamples, discuss the possibilities and limitations, and identify areashave shown that including soil water content heteroge-where future research is required. We hope that this review will furtherneity in spatially distributed hydrological models canstimulate the community to consider ground penetrating radar as oneimprove discharge predictions (Merz and Plate, 1997;of the possible tools to measure soil water content.Merz and Bardossy, 1998; Pauwels et al., 2001). How-ever, there is no consensus on how to incorporate spatialsoil water content heterogeneity in these models. SomeWater at the land surface is a vital resource forhave suggested that it is sufficient to include the statisticsboth human needs and natural ecosystems. Soci- (spatial mean and variance) of measured soil water con-
ety’s fresh water needs for agriculture, sanitation, mu- tent structure (e.g., Pauwels et al., 2001), whereas othersnicipal, and industrial supply are ever increasing. At have suggested that discharge predictions also improvethe same time, natural hazards involving water, such as when a full description of soil water content variationfloods, droughts and landslides are major natural threats is included (Merz and Bardossy, 1998). Furthermore,to society in many countries (Entekhabi et al., 1999). Merz and Plate (1997) argued that the improvement ofThe vadose zone, which may be defined as the transition discharge predictions by including soil water content
heterogeneity will strongly depend on the event charac-zone between the atmosphere and groundwater reser-teristics, including antecedent soil water conditions andvoirs, is important for water resource management, be-rainfall intensities.cause it regulates the water availability for vegetation,
At the field scale, information on the spatial distribu-including crops, while at the same time provides a pro-tion of soil water is important for precision agriculturetective buffer zone between land surface and groundwa-programs. With too much water, crop quality could de-ter against solutes and pollutants (Rubin, 2003).crease due to the adverse effects of waterlogged plantHydrologists, soil scientists, ecologists, meteorolo-roots (e.g., reduced root respiration due to depletion ofgists, and agronomists all study the space and time vari- O2 and increased availability of toxic ions under reduc-
ability of water in the vadose zone, hereafter referred ing soil conditions). With too little water, crops can beto as soil water content, over a range of scales and for irreversibly damaged due to drought stress. In additiona variety of reasons. At the regional to continental scale, to the impact of water content on the quality and quan-the exchange of moisture and energy between soil, vege- tity of crops, the outlay of resources and energy concom-tation, and the atmosphere has an impact on near-sur- itant with crop irrigation is critical in water-scarce re-face atmospheric moisture and temperature, which in gions, especially as competition for water resources
between rural and agricultural land users increases.turn define the regional climate. For example, soil waterClearly there is a need for soil water content measure-content determines to a large extent the relative magni-
ments across a range of spatial scales. High-frequencytudes of sensible and latent heat fluxes and therefore de-electromagnetic techniques are the most promising cate-gory of soil water content sensors to fulfill this need
J.A. Huisman, Center for Geo-Ecological Research (ICG), Institute because this category contains a range of techniquesfor Biodiversity and Ecosystem Dynamics (IBED)– Physical Geogra- that measure the same soil water content proxy, namelyphy, Universiteit van Amsterdam, The Netherlands (currently Dep. dielectric permittivity, at different spatial scales. Re-of Landscape Ecology and Resources Management, Justus-Liebig-
mote sensing with either passive microwave radiometryUniversity Giessen, Heinrich-Buff-Ring 26-32, 35372 Giessen, Ger-or active radar instruments is the most promising tech-many); S.S. Hubbard, Lawrence Berkeley National Laboratory and
University of California, Berkeley, CA; J.D. Redman and A.P. Annan, nique for measuring soil water content variations overSensors and Software Inc., Mississauga, ON, Canada. Received 13 Mar.2003. Special Section—Advances in Measurement and Monitoring Meth-
Abbreviations: CMP, Common-MidPoint; CPT, cone penetrometer;ods. *Corresponding author ([email protected]).GPR, ground penetrating radar; MOP, multi-offset profile; SWC, soilwater content; TDR, time domain reflectometry; VRP, vertical radarPublished in Vadose Zone Journal 2:476–491 (2003).
Soil Science Society of America profiling; WARR, Wide Angle Reflection and Refraction; ZOP, zerooffset profile.677 S. Segoe Rd., Madison, WI 53711 USA
476

www.vadosezonejournal.org 477
large regions (Jackson et al., 1996; Ulaby et al., 1996, allow more accurate travel time measurements, whichare needed for soil water content determination withFamiglietti et al., 1999; van Oevelen, 2000). The passive
instruments have low spatial resolution and can either GPR. In this review, we present an overview of theavailable methods for estimating soil water content withbe airborne with pixel sizes of thousands of square me-
ters or satellite-borne with footprints in the order of GPR. Additionally, we discuss the possibilities and limi-tations of each of the methods. Hopefully, this reviewtens of square kilometers. In the near future, passive
satellite remote sensing will provide global coverage of will further stimulate readers to consider GPR as one ofthe viable options for soil water content determination.critical hydrological data, including soil water content
(Entekhabi et al., 1999). Active radar instruments havesmaller pixel sizes ranging from 1 to several 1000 m2.
PRINCIPLES OFAlthough remote sensing will surely play an importantELECTROMAGNETIC METHODSrole in many future hydrological studies, currently there
is still a need to establish transfer functions between Electromagnetic Wave Propagationremote sensing and the more familiar in situ soil water The propagation velocity of electromagnetic waves, v (m s�1),content measurements. Additionally, because remote is determined by the complex dielectric permittivity, ε*( f ) �sensing approaches for estimating water content esti- ε�( f ) � jε″( f )mate water content in the uppermost 0.05 m of the soiland require that the vegetation cover is minimal (Jack- v( f ) �
c
�ε� ( f )�r1 � √1 � tan2 �
2
[1]son et al., 1996), remote sensing methods are not applic-able in all types of vadose zone studies.
A well-established in situ electromagnetic techniquefor soil water content investigations is time domain re- with the loss tangent � defined asflectometry (TDR), which was introduced in vadose zonehydrology in the early 1980s (Topp et al., 1980). Time do-main reflectometry has developed into a reliable method tan � �
ε″ ( f ) ��dc
2� fε0
ε� ( f )[2]for soil water content determination that can easily be
automated (Heimovaara and Bouten, 1990). Further-and where c is free space electromagnetic propagation velocitymore, TDR can simultaneously measure dielectric per-(3 108 m s�1), f is the frequency of the electromagnetic fieldmittivity and bulk soil conductivity (Dalton et al., 1984; (Hz), ε�( f) is the real part of the relative dielectric permittivity,
Topp et al., 1988), which allows the study of water and ε″( f) is the imaginary part of the relative dielectric permittivity,solute transport within the same soil volume. Although �r is the relative magnetic permeability, �dc is the DC conduc-TDR is highly suited for monitoring the development tivity (S m�1), and ε0 is the free space permittivity (8.854 of soil water content at one location with a high temporal 10�12 F m�1). For nonmagnetic soils, �r equals 1 in the GPR
frequency range (van Dam et al., 2002). Throughout this re-resolution, the small measurement volume (dm3) makesview, permittivity is understood to represent the relative di-it sensitive to small-scale soil water content variationelectric permittivity, εr, that is, the permittivity relative to free(e.g., macropores, air gaps due to TDR insertion) withinspace as calculated by the absolute permittivity, ε (F m�1),this volume (Ferre et al., 1996). Furthermore, assess-divided by the free space permittivity ε0 (F m�1):ment of spatial soil water content variation with TDR
is labor intensive because TDR sensors need to be in-εr �
εε0
[3]stalled at each measurement location.Clearly, there is a scale gap between remote sensing
The imaginary part of the permittivity, ε″( f), is associatedand TDR measurements of soil water content. At inter-with the energy dissipation, and the real part of the permittivity,mediate spatial scales, such as agricultural land and smallε�( f), is associated with the capability to store energy whencatchments, reliance on sparse TDR measurements oran alternating electrical field is applied. The complex per-coarse remote sensing measurements might not providemittivity of most materials varies considerably with the fre-the accurate soil water content information required at quency of the applied electric field. An important process
these scales (e.g., crop management, precision farming). contributing to the frequency dependence of permittivity isTherefore, there is a need for soil water content mea- the polarization arising from the orientation with the imposedsurement techniques that can provide dense and accu- electric field of molecules that have permanent dipole mo-rate measurements at an intermediate scale. Since the ments. The mathematical formulation of Debye describes this
process for pure polar materials (Debye, 1929):early days of electromagnetic measurement techniques,ground penetrating radar (GPR) has been conceived asthe natural intermediate-scale counterpart of TDR for ε* ( f ) � ε∞ �
εs � ε∞
1 � �i ffrel
��
j�dc
2� fε0
[4]soil water content measurements. Although the numberof TDR applications has increased immensely in thepast 20 yr, the number of GPR applications for measur-
where ε∞ represents the permittivity at frequencies so highing soil water content has only recently increased. Prob- that molecular orientation does not have time to contributeably, the most important reason behind this delay is the to the polarization, εs represents the static permittivity (i.e.,more complicated behavior of the unguided waves used the value at zero frequency), and frel (Hz) is the relaxationin GPR as compared with waves guided by a TDR sensor. frequency, defined as the frequency at which the permittivity
equals (εs � ε∞)/2 (Nelson, 1994). The separation of Eq. [4]Furthermore, recent improvements in GPR technology
478 VADOSE ZONE J., VOL. 2, NOVEMBER 2003
and ε is based on dielectric mixing models, which use thevolume fractions and the dielectric permittivity of each soilconstituent to derive a relationship (e.g., Dobson et al., 1985;Roth et al., 1990; Friedman, 1998; Jones and Friedman, 2000).In dielectric mixing models, the bulk permittivity of a soil–water–air system, εb, may be expressed with the Complex Re-fractive Index Model (CRIM):
εb � ��ε�w � (1 � n)ε�
s � (n � �)ε�a �
1
� [7]
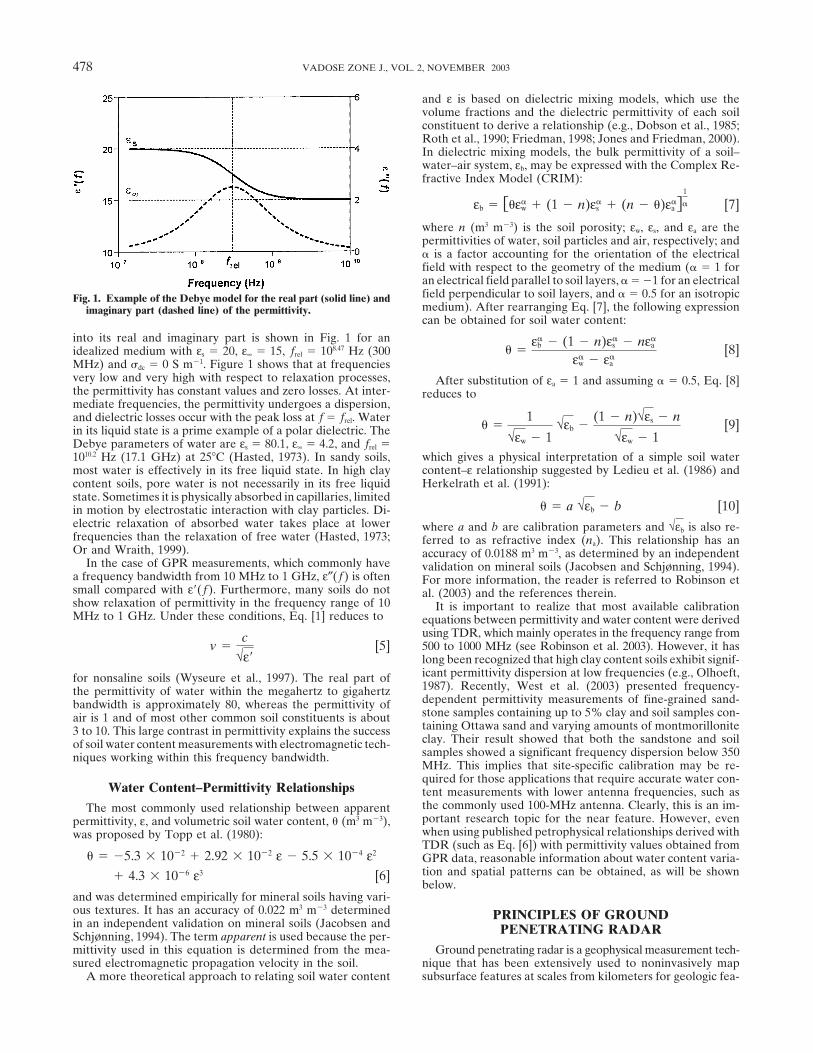
where n (m3 m�3) is the soil porosity; εw, εs, and εa are thepermittivities of water, soil particles and air, respectively; and� is a factor accounting for the orientation of the electricalfield with respect to the geometry of the medium (� � 1 foran electrical field parallel to soil layers, � � �1 for an electricalfield perpendicular to soil layers, and � � 0.5 for an isotropicFig. 1. Example of the Debye model for the real part (solid line) andmedium). After rearranging Eq. [7], the following expressionimaginary part (dashed line) of the permittivity.can be obtained for soil water content:
into its real and imaginary part is shown in Fig. 1 for an� �
ε�b � (1 � n)ε�
s � nε�a
ε�w � ε�
a
[8]idealized medium with εs � 20, ε∞ � 15, frel � 108.47 Hz (300MHz) and �dc � 0 S m�1. Figure 1 shows that at frequenciesvery low and very high with respect to relaxation processes, After substitution of εa � 1 and assuming � � 0.5, Eq. [8]the permittivity has constant values and zero losses. At inter- reduces tomediate frequencies, the permittivity undergoes a dispersion,and dielectric losses occur with the peak loss at f � frel. Water
� �1
√εw � 1√εb �
(1 � n)√εs � n
√εw � 1[9]in its liquid state is a prime example of a polar dielectric. The
Debye parameters of water are εs � 80.1, ε∞ � 4.2, and frel �which gives a physical interpretation of a simple soil water1010.2 Hz (17.1 GHz) at 25 C (Hasted, 1973). In sandy soils,content–ε relationship suggested by Ledieu et al. (1986) andmost water is effectively in its free liquid state. In high clayHerkelrath et al. (1991):content soils, pore water is not necessarily in its free liquid
state. Sometimes it is physically absorbed in capillaries, limited� � a √εb � b [10]in motion by electrostatic interaction with clay particles. Di-
electric relaxation of absorbed water takes place at lower where a and b are calibration parameters and √εb is also re-frequencies than the relaxation of free water (Hasted, 1973; ferred to as refractive index (na). This relationship has anOr and Wraith, 1999). accuracy of 0.0188 m3 m�3, as determined by an independent
In the case of GPR measurements, which commonly have validation on mineral soils (Jacobsen and Schjønning, 1994).a frequency bandwidth from 10 MHz to 1 GHz, ε″( f) is often For more information, the reader is referred to Robinson etsmall compared with ε�( f). Furthermore, many soils do not al. (2003) and the references therein.show relaxation of permittivity in the frequency range of 10 It is important to realize that most available calibrationMHz to 1 GHz. Under these conditions, Eq. [1] reduces to equations between permittivity and water content were derived
using TDR, which mainly operates in the frequency range from500 to 1000 MHz (see Robinson et al. 2003). However, it hasv �
c
√ε�[5]
long been recognized that high clay content soils exhibit signif-icant permittivity dispersion at low frequencies (e.g., Olhoeft,for nonsaline soils (Wyseure et al., 1997). The real part of1987). Recently, West et al. (2003) presented frequency-the permittivity of water within the megahertz to gigahertzdependent permittivity measurements of fine-grained sand-bandwidth is approximately 80, whereas the permittivity ofstone samples containing up to 5% clay and soil samples con-air is 1 and of most other common soil constituents is abouttaining Ottawa sand and varying amounts of montmorillonite3 to 10. This large contrast in permittivity explains the successclay. Their result showed that both the sandstone and soilof soil water content measurements with electromagnetic tech-samples showed a significant frequency dispersion below 350niques working within this frequency bandwidth.MHz. This implies that site-specific calibration may be re-quired for those applications that require accurate water con-
Water Content–Permittivity Relationships tent measurements with lower antenna frequencies, such asthe commonly used 100-MHz antenna. Clearly, this is an im-The most commonly used relationship between apparentportant research topic for the near feature. However, evenpermittivity, ε, and volumetric soil water content, � (m3 m�3),when using published petrophysical relationships derived withwas proposed by Topp et al. (1980):TDR (such as Eq. [6]) with permittivity values obtained from
� � �5.3 10�2 � 2.92 10�2 ε � 5.5 10�4 ε2 GPR data, reasonable information about water content varia-tion and spatial patterns can be obtained, as will be shown� 4.3 10�6 ε3 [6]below.
and was determined empirically for mineral soils having vari-ous textures. It has an accuracy of 0.022 m3 m�3 determined PRINCIPLES OF GROUNDin an independent validation on mineral soils (Jacobsen and PENETRATING RADARSchjønning, 1994). The term apparent is used because the per-mittivity used in this equation is determined from the mea- Ground penetrating radar is a geophysical measurement tech-
nique that has been extensively used to noninvasively mapsured electromagnetic propagation velocity in the soil.A more theoretical approach to relating soil water content subsurface features at scales from kilometers for geologic fea-

www.vadosezonejournal.org 479
Fig. 3. Propagation paths of electromagnetic waves in a soil withtwo layers of contrasting dielectric permittivity (ε1 and ε2) (afterSperl, 1999).
Fig. 2. Wave fronts around a dipole source on the soil surface. A and MEASURING SOIL WATER CONTENTB are spherical waves in the air and soil, respectively. Wave C isWITH GPRthe lateral or head wave in the soil, and D is the ground wave in
the air (after Annan, 1973). Soil Water Content Measurements withReflected Waves
tures to centimeters for rebar in concrete structures. ExtensiveTwo classes of methods to estimate soil water content fromliterature describing GPR applications is available. An excel-
reflected wave travel time data can be distinguished. The firstlent introduction to GPR in hydrogeological applications isclass contains the methods that use a single antenna separationavailable in Davis and Annan (1989).for soil water content estimation (e.g., soil water content esti-The GPR technique is similar in principle to seismic andmation from scattering objects and traditional GPR sections).sonar methods. In the case of the most commonly used bistaticThe second class contains the methods that require multiplesystems, one antenna, the transmitter, radiates short pulses ofmeasurements with different antenna separations.high-frequency (MHz to GHz) electromagnetic waves, and the
other antenna, the receiver, measures the signal from the trans-Single (or Common) Offset Reflection Methodsmitter as a function of time. When the source antenna is placed
on the surface, spherical waves are radiated both upward into The energy that GPR transmits into the soil will be (partly)the air and downward into the soil as indicated by wave fronts reflected when contrasts in soil permittivity are encountered.A and B in Fig. 2. Because of the continuity requirements for Figure 4 (right) shows an idealized GPR section measuredthe electromagnetic field at the soil surface, the propagating with surface radar and a fixed antenna separation (single off-spherical air wave (A in Fig. 2) gives rise to a lateral wave set) over an anomaly (e.g., a water-filled pipe) having a differ-front (C in Fig. 2) in the soil. Similarly, the spherical wave ent permittivity than the host material as shown in Fig. 4 (left).propagating in the soil gives rise to the ground wave (D in Because GPR emits waves in all directions, reflected energyFig. 2). The ground wave amplitude is known to decrease is measured before the GPR is directly over it (Fig. 4, left).strongly with distance above the soil surface, and therefore The reflected events in the radar section trace out a hyperbolathe ground wave is not presented as a wave front in Fig. 2. (B in Fig. 4, right) because the reflected energy of the GPR
Two important aspects of GPR are resolution and depth measurement directly above the anomaly has the shortestpenetration. GPR resolution is determined by the period of travel distance (time) and all other waves will have a largerthe emitted pulse, which is controlled by the frequency band- distance to travel. The average wave velocity in the soil deter-
mines the convexity of the reflection hyperbola B; i.e., it deter-width of the GPR system. Because impulse radar systems aremines how much longer the waves need to travel the extradesigned to achieve bandwidths that are about equal to thedistance. The average velocity between the ground surfacecenter frequency, the resolution of GPR increases with in-and the anomaly, vsoil, can be determined from a GPR transectcreasing center frequency (Davis and Annan, 1989). Depthby fitting the following hyperbola to measured arrival timespenetration of GPR measurements is strongly controlled byat several positions xthe soil electrical conductivity combined with the center fre-
quency of the GPR system. In low-conductivity media, suchas dry sand and gravel, low-frequency GPR systems (e.g., 50- vsoil �
2√x2 � d 2
trw,x
[11]or 100-MHz antennas) can achieve penetration up to severaltens of meters, and high-frequency systems (e.g., 450- or 900-
where x is the position relative to the position of the scatteringMHz antennas) achieve penetration of one to several meters. object (apex of the hyperbola), d is the depth of the scatteringFor silty sands and clays, depth penetration will be significantly object, and trw,x is the arrival time of the reflected wave at po-less. It is important to realize that this high sensitivity to soil sition x that has been zero time corrected. If the GPR sectiontexture and electrical conductivity reduces the range of soils is measured with a significant antenna separation, a, this shouldwhere GPR can successfully be applied. also be included in the velocity determination as follows:
Figure 3 presents possible propagation paths for surfaceGPR energy. Principally, all these waves can be used to mea-
vsoil �√(x � 0.5a)2 � d 2 � √(x � 0.5a)2 � d 2
trw,x
[12]sure soil water content. In the following section, we focus onsoil water content estimation using reflected and ground wavetravel time data. In addition, we also discuss the estimation Most common GPR analysis software provides routinesof water content using borehole GPR travel time data and where the velocity can be determined interactively by manu-
ally fitting hyperbola to the limbs of the reflections of theusing ground surface reflection amplitude data.

480 VADOSE ZONE J., VOL. 2, NOVEMBER 2003
Fig. 4. Idealized ground penetrating radar (GPR) transect measured with a fixed antenna separation over an anomalous wetter zone and ahorizontal groundwater table (GWT). A marks the air wave, B marks the point reflector, and C marks the reflection from the groundwatertable (after Davis and Annan, 1989).
scattering object. The velocity can then be used to calculatevsoil �
2dtrw
[13]soil permittivity (Eq. [5]) and soil water content (e.g., Eq. [6]).The zero time correction of arrival times is required to
correct for the additional travel time at the beginning of each where trw is the two-way travel time of the reflected wave thatmeasurement, which is mainly due to the travel time in the has been zero time corrected and d is the water table depth.cables of the radar system. A commonly used correction proce- When antenna separation is significant, this equation becomesdure consists of (i) aligning the arrival times of the air waveto correct for drift in the zero time (e.g., caused by temperature vsoil �
2√d 2 � (0.5a)2
trw
[14]changes affecting the radar system and the cables), (ii) estimat-ing the average arrival time of the air wave, and (iii) calculating
To be useful for estimating water content, the single offsetthe zero time correction from the average arrival time andGPR reflection method requires sufficient signal penetration,the known antenna separation. It should be noted that thethe presence of a subsurface dielectric contrast that yields amethods presented in this review have different requirementsclear (and preferably continuous) GPR reflector, and goodfor the accuracy of the zero time correction. The accuracy ofcontrol on the depth of the reflector. Shallow studies usingborehole GPR and single offset ground wave data dependsthis technique have been successfully performed using buriedon accurate zero time corrections, whereas the accuracy ofreflectors and engineered materials, where the depth to themulti-offset measurements does not depend strongly on accu-reflector is well constrained. Grote et al. (2002) used the reflec-rate zero time corrections.tion travel time associated with shallow (1 m) reflectorsAlthough it is simple and straightforward to determine ve-buried within a constructed sandy test pit to estimate waterlocity from scattering objects, it is a method that has not beencontent values. Their estimates were within 0.01 m3 m�3 ofused often for soil water content determination. The mainthe measured values obtained using gravimetric techniques.drawback of this method is that it can only be used in soilsGrote et al. (2002) also used 1.2-GHz time-lapse single offsetwhere scattering objects can be observed in the GPR section.GPR reflection data to monitor water infiltration conductedEven when scattering objects are present, this method only within a pavement section consisting of permeable aggregateprovides the average soil water content to the depth of the base layers overlain by concrete, all having a prescribed thick-
reflector; that is, the user has no control over the depth resolu- ness. Under these engineered conditions, they obtained esti-tion of the soil water content measurements. An early appli- mates of volumetric water content within the permeable layerscation was presented by Vellidis et al. (1990), who used a as a function of depth using the GPR reflection method, whichreflection from a buried pipe to determine the average velocity agreed with measurements obtained using gravimetric tech-above the wetting front, which allowed the monitoring of wet- niques to within 0.01 m3 m�3. Stoffregen et al. (2002) estimatedting front movement by assuming a homogeneous soil water volumetric water content seasonally using 1-GHz GPR reflec-content distribution above the wetting front. tions from the base of a 1.5-m-deep lysimeter, which was filled
The reflection from the top of the saturated zone, just above with sandy soils. They found that the standard deviation be-the groundwater table, is an example of a (semi-)horizontal tween the GPR estimates and the lysimeter measurements ofcontrast in soil permittivity (marked with C in Fig. 4, right). water content was on average 0.01 m3 m�3 and that the esti-It can be seen that the anomalous wetter zone results in a mated changes in water content corresponded with seasonalpull-down of the arrival time of the wave reflected from the moisture variations.horizontal groundwater table because the average wave veloc- The accuracy of the single offset GPR reflection methodity to the groundwater table is lower for GPR measurements for estimating water content under natural conditions is notrecorded above the anomaly. Unfortunately, the groundwater yet well established. Some researchers have tested the concepttable reflection in a single offset measurement cannot be used of using GPR reflections under natural conditions to estimateto calculate the vsoil without knowledge of the water table depth. water content using depth measurements to the reflectors ob-Of course, the water table depth (or depth of any other reflec- tained at discrete locations from, for example, noting lithologictor) can be determined independently, and in such cases the transitions during drilling (Weiler et al., 1998) or water tablearrival time of the water table reflection can easily be con- observations (van Overmeeren et al., 1997). The use of single
offset GPR reflection data for estimating spatially variableverted to average soil water content of the vadose zone with

www.vadosezonejournal.org 481
Fig. 5. Common-midpoint (CMP, top) and wide angle reflection andFig. 7. Common-midpoint (CMP) measurement made with a 100-refraction (WARR, bottom) acquisition, where S denotes the trans-
MHz antenna at the Cambridge Research Station, University ofmitter location and R denotes the receiver locations.Guelph, ON, Canada.
water content under naturally heterogeneous conditions at and Dubois, 1995). Most common GPR analysis software pro-the field scale is a topic of active research. vides routines where the velocity can be determined by manu-ally fitting hyperbola to the reflected waves in the multi-offset
Multi-Offset Reflection Methods measurements. Multi-offset measurements also permit veloc-ity determination from arrivals other than the reflected waves.Single offset measurements cannot be used to determine waterFor example, Bohidar and Hermance (2002) showed how tocontent from reflecting soil layers if no information about theuse critically refracted air waves and subsurface refracteddepth of the reflector is available. In that case, one can use awaves for soil water content determination.multi-offset GPR acquisition geometry to determine soil water
To avoid subjective soil water content estimates and tocontent from radar reflections. Two commonly used multi-offsetspeed up the analysis, (semi-)automated approaches for veloc-GPR acquisition geometries are called Common-MidPointity determination from reflected GPR waves have been devel-(CMP) and Wide Angle Reflection and Refraction (WARR)oped that are analogous to the velocity analysis approachesmeasurements (Fig. 5). In CMP acquisition, the distance be-developed for use with seismic data (e.g., Yilmaz, 1987). Atween the antennas is increased stepwise while keeping a com-well-known method is semblance analysis. The aim of sem-mon midpoint. In WARR acquisition, the distance betweenblance analysis is to find the velocity and travel time for whichthe antennas is increased stepwise with the transmitter at athe reflection energy of a reflected wave in a multi-offsetfixed position. A schematic outcome of a multi-offset GPRmeasurement collapses to a point. This is done with help ofmeasurement is given in Fig. 6. If consistent reflected wavesthe semblance plot, which is constructed by recalculating theare present in the multi-offset GPR measurement, they canarrival times of the CMP for a range of velocities (x axis ofbe used to calculate soil water content directly by fittingsemblance plot) and summing the normalized energy for eacharrival time (y axis) for each velocity. High values in thevsoil �
2√d 2 � (0.5a)2
trw,a
[15]semblance plot indicate that the reflected waves at that partic-ular arrival time are well described by that particular velocity.
to the zero time corrected arrival times of the reflected wave, The manually or semiautomatically determined velocitiestrw,a, for different antenna separations, a, and solving for depth, from the multi-offset measurement are average velocities tod, and the average velocity to the reflecting layer, vsoil (Tillard the depth of the reflector. To convert these average velocities
to interval velocities of each layer, vint,n, the Dix formula (Dix,1955; Yilmaz, 1987) can be used:
vint,n � �trw,nv2soil,n � trw,n�1v2
soil,n�1
trw,n � trw,n�1
[16]
where vsoil,n is the average velocity from the surface down tothe bottom of layer n, vsoil,n�1 is the average velocity down tothe bottom of layer n � 1, trw,n is the two-way travel time to thebottom of layer n, trw,n�1 is the two-way travel time to thebottom of layer n � 1, and n � 1 is the upper layer of the soil.
The requirements for useful water content estimates withthe multi-offset GPR reflection method are similar to thoseof single offset measurements: decent signal penetration andthe presence of subsurface dielectric contrasts that yield clear(and preferably continuous) GPR reflectors. There are numer-ous applications of multi-offset measurements for soil watercontent determination (e.g., Tillard and Dubois, 1995; Greaveset al., 1996; van Overmeeren et al., 1997; Dannowski and Yara-Fig. 6. Schematic wide angle reflection and refraction (WARR ) mea-manci, 1999; Endres et al., 2000; Nakashima et al., 2001; Bohi-surement. The ground wave can be identified as a wave with adar and Hermance, 2002; Garambois et al., 2002). Figure 7linear move out starting from the origin of the x–t plot. In theshows a CMP measurement made with 100-MHz antennas atslope equations, c is the electromagnetic velocity in air and x is
the antenna separation (after Sperl, 1999). the Cambridge Research Station (University of Guelph, ON,
482 VADOSE ZONE J., VOL. 2, NOVEMBER 2003
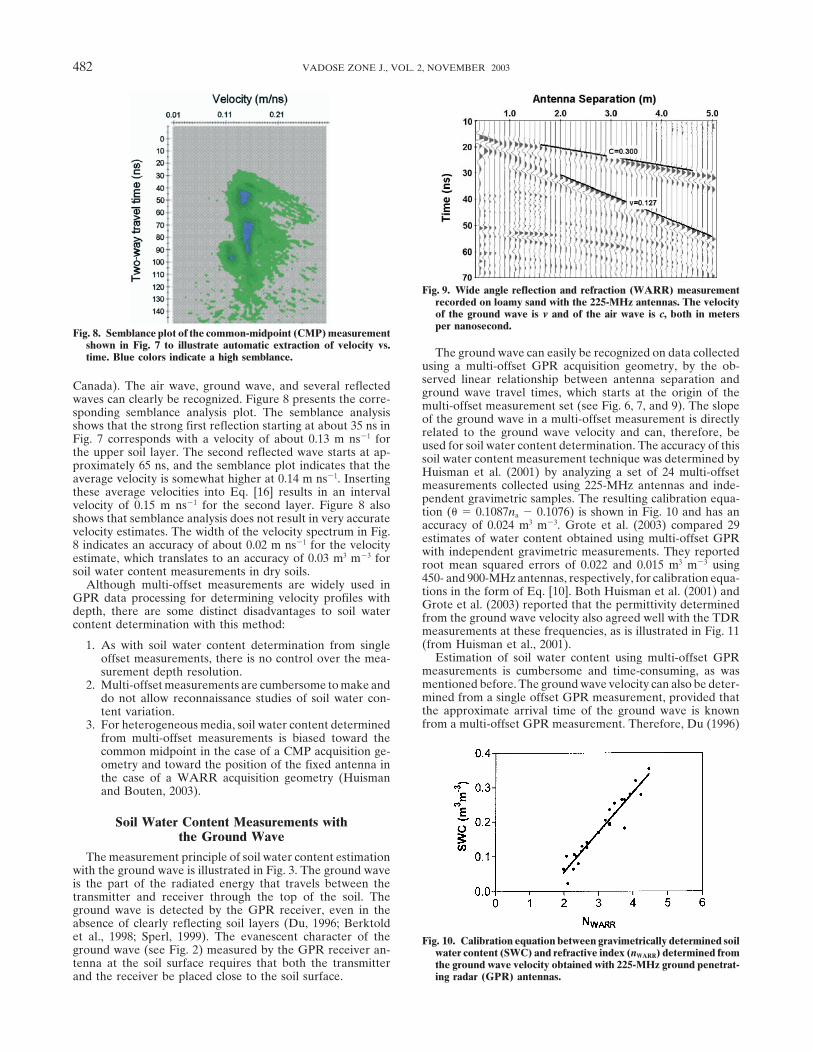
Fig. 9. Wide angle reflection and refraction (WARR) measurementrecorded on loamy sand with the 225-MHz antennas. The velocityof the ground wave is v and of the air wave is c, both in metersper nanosecond.
Fig. 8. Semblance plot of the common-midpoint (CMP) measurementshown in Fig. 7 to illustrate automatic extraction of velocity vs.
The ground wave can easily be recognized on data collectedtime. Blue colors indicate a high semblance.using a multi-offset GPR acquisition geometry, by the ob-served linear relationship between antenna separation andCanada). The air wave, ground wave, and several reflected ground wave travel times, which starts at the origin of thewaves can clearly be recognized. Figure 8 presents the corre- multi-offset measurement set (see Fig. 6, 7, and 9). The slopesponding semblance analysis plot. The semblance analysis of the ground wave in a multi-offset measurement is directlyshows that the strong first reflection starting at about 35 ns in related to the ground wave velocity and can, therefore, beFig. 7 corresponds with a velocity of about 0.13 m ns�1 for used for soil water content determination. The accuracy of thisthe upper soil layer. The second reflected wave starts at ap- soil water content measurement technique was determined byproximately 65 ns, and the semblance plot indicates that the Huisman et al. (2001) by analyzing a set of 24 multi-offsetaverage velocity is somewhat higher at 0.14 m ns�1. Inserting measurements collected using 225-MHz antennas and inde-these average velocities into Eq. [16] results in an interval pendent gravimetric samples. The resulting calibration equa-velocity of 0.15 m ns�1 for the second layer. Figure 8 also tion (� � 0.1087na � 0.1076) is shown in Fig. 10 and has anshows that semblance analysis does not result in very accurate accuracy of 0.024 m3 m�3. Grote et al. (2003) compared 29velocity estimates. The width of the velocity spectrum in Fig. estimates of water content obtained using multi-offset GPR8 indicates an accuracy of about 0.02 m ns�1 for the velocity with independent gravimetric measurements. They reportedestimate, which translates to an accuracy of 0.03 m3 m�3 for root mean squared errors of 0.022 and 0.015 m3 m�3 usingsoil water content measurements in dry soils. 450- and 900-MHz antennas, respectively, for calibration equa-Although multi-offset measurements are widely used in tions in the form of Eq. [10]. Both Huisman et al. (2001) andGPR data processing for determining velocity profiles with Grote et al. (2003) reported that the permittivity determineddepth, there are some distinct disadvantages to soil water from the ground wave velocity also agreed well with the TDRcontent determination with this method: measurements at these frequencies, as is illustrated in Fig. 11(from Huisman et al., 2001).1. As with soil water content determination from single
Estimation of soil water content using multi-offset GPRoffset measurements, there is no control over the mea-measurements is cumbersome and time-consuming, as wassurement depth resolution.mentioned before. The ground wave velocity can also be deter-2. Multi-offset measurements are cumbersome to make andmined from a single offset GPR measurement, provided thatdo not allow reconnaissance studies of soil water con-the approximate arrival time of the ground wave is knowntent variation.from a multi-offset GPR measurement. Therefore, Du (1996)3. For heterogeneous media, soil water content determined
from multi-offset measurements is biased toward thecommon midpoint in the case of a CMP acquisition ge-ometry and toward the position of the fixed antenna inthe case of a WARR acquisition geometry (Huismanand Bouten, 2003).
Soil Water Content Measurements withthe Ground Wave
The measurement principle of soil water content estimationwith the ground wave is illustrated in Fig. 3. The ground waveis the part of the radiated energy that travels between thetransmitter and receiver through the top of the soil. Theground wave is detected by the GPR receiver, even in theabsence of clearly reflecting soil layers (Du, 1996; Berktoldet al., 1998; Sperl, 1999). The evanescent character of the Fig. 10. Calibration equation between gravimetrically determined soilground wave (see Fig. 2) measured by the GPR receiver an- water content (SWC) and refractive index (nWARR) determined fromtenna at the soil surface requires that both the transmitter the ground wave velocity obtained with 225-MHz ground penetrat-
ing radar (GPR) antennas.and the receiver be placed close to the soil surface.

www.vadosezonejournal.org 483
resulting soil water increase map for TDR is presented in Fig.12 (right). Clearly, there is a good general agreement betweenboth methods since they show similar patterns in soil waterincrease caused by the heterogeneous application of water.Furthermore, the higher number of GPR measurements ac-quired within a shorter time span has resulted in a much higherresolution, as evidenced by the clear circular boundaries ofthe increase in soil water content due to the impact sprinklerslocated at (17.5, 42.5) and (35, 25). Using 450- and 900-MHzsingle offset GPR ground wave data, Grote et al. (2003) esti-mated the spatial and temporal variations in near surface watercontent over a large-scale agricultural site during the courseof a year. They found that soil texture exerted an influenceon the spatial distribution of water content over the field site.
Fig. 11. Comparison of nTDR and nWARR (225 MHz) for the same mea- Using a 100-MHz antenna, Lesmes et al. (1999) generallysurements shown in Fig. 10. found similar trends in soil water content estimated with GPR
ground wave data and reference small-scale measurements.and Sperl (1999) proposed the following procedure for soil However, soil water content estimated using 100-MHz GPRwater content mapping with the ground wave of GPR: ground wave data typically underestimated water content com-
pared with the reference measurements collected between 01. Identify an approximate ground wave arrival time forand 0.30 m below ground surface. This discrepancy may bedifferent antenna separations in a multi-offset GPR mea-associated with the deeper zone of influence associated withsurement,the lower-frequency GPR antennas as compared with the2. Choose an antenna separation where the ground wavehigher-frequency antennas used in the studies described above.is clearly separated from the air and reflected waves and
Although the results with ground wave data generally are3. Use this antenna separation for single offset GPR mea-promising, there are still some uncertainties associated withsurements and relate the changes in ground wave arrivalthis method. An important, but unresolved issue is the effec-time to changes in soil permittivity.tive measurement volume over which the ground wave aver-
The most straightforward relationship between ground wave ages. Du (1996) suggested that the influence depth is approxi-arrival time tGW (s), antenna separation x (m), and soil per- mately one-half of the wavelength [� � c/( fε)1/2], which would,mittivity is given by Sperl (1999): for example, mean that for a central frequency of 225 MHz,
the depth of influence could vary from 0.50 m (ε � 4.0) toε � �cv �
2
� �c(tGW � tAW) � xx �
2
[17] 0.22 m (ε � 20.0). Sperl (1999) reported that the depth ofinfluence was indeed a function of wavelength, but from a
where tAW (s) is the air wave arrival time. The tAW is included modeling exercise he concluded that the influence depth isas part of the zero time correction, as was already discussed approximately 0.145�1/2, which would suggest that the influ-in the previous section. Accurate zero time corrections and ence depth ranges from 0.15 m (ε � 4.0) to 0.10 m (ε � 20.0)accurate travel time determination are important for soil water for the 225-MHz antennas. The results of Sperl (1999) do notcontent measurements derived from ground wave travel time contradict the results of Huisman et al. (2001), who concludeddata. Typically, the onset of the wave or the first maximum of that soil water content measurements based on ground wavethe wave are picked, but Huisman and Bouten (2003) showed data are similar to measurements with 0.10-m-long TDRthat these phases can be quite difficult to pick when mapping probes for both the 225- and 450-MHz GPR antennas. Grotewater content variation, especially for the air wave. Instead, et al. (2003) compared estimates of water content obtainedHuisman and Bouten (2003) proposed to use the zero-crossing using 450- and 900-MHz common offset GPR ground wavebetween the maximum and minimum wave amplitude because
data with measurements collected using gravimetric tech-the steep derivative of the wave at this phase allows the mostniques in soils having various textures and at depths from 0accurate travel time determination. It should be noted thatto 0.10, 0.10 to 0.20, and 0 to 0.20 m below ground surface.the onset of the wave should be preferred over the latterThey found that the estimates obtained using these frequen-approach when there are clear indications for waveform dis-cies showed the highest correlation with the soil water contentpersion (Annan, 1996).values averaged across the 0- to 0.20-m range and the leastRecent experiments by Lesmes et al. (1999), Hubbard etcorrelation with the water content measurements taken fromal. (2002), Huisman et al. (2002, 2003), and Grote et al. (2003)the 0.10- to 0.20-m interval. Clearly, further research is neededhave confirmed that soil water content mapping with groundto better understand the ground wave zone of influence.wave travel time data works well. In an irrigation experiment,
Other drawbacks of using the GPR ground wave to estimateHuisman et al. (2002) created a heterogeneous pattern insoil water content include the following:soil water content by using different types of sprinklers with
varying ranges and intensities. Figure 12 (left) shows the in-1. It might be difficult to separate the ground wave arrivalcrease in water content over a 60 by 60 m area measured with
in the clutter of critically refracted and reflected waves.GPR, which was calculated by subtracting the water content2. It might be difficult to choose an antenna separation formap before irrigation from the water content map after irriga-
which the arrival times of the air and ground wave cantion. Ground penetrating radar measurements were made withconsistently be picked despite moving the antennasa 225-MHz antenna on lines 5 m apart. The antenna separationacross a field with varying soil water content.was 1.54 m, and the distance between GPR measurements
3. The ground wave is attenuated more quickly than otherwas 0.5 m. The measurements were performed within 1 h inwaves, which limits the range of antenna separation atthe field. Time domain reflectometry measurements to 0.1 m
deep were made within 1.5 h at 5-m station spacing. The which the ground wave can be observed.

484 VADOSE ZONE J., VOL. 2, NOVEMBER 2003
Fig. 12. Maps illustrating the increase in soil water content (m3 m�3) due to irrigation obtained using ground penetrating radar (GPR) groundwave and time domain reflectometry (TDR) measurements. The maps were obtained by subtracting interpolated maps of soil water contentobtained using GPR and TDR data collected before and after irrigation.
mographic data was presented in detail by Peterson (2001),Soil Water Content Measurements withwho also discussed methods for recognizing and correctingBorehole GPRfor errors caused by incorrect station geometry, incorrect zero
For borehole GPR applications, the transmitting and receiv- time and zero time drift, geometric spreading, transmittering antenna are lowered into a pair of vertical access tubes. radiation pattern, transmitter amplitude, and high angle ray-In the zero offset profile (ZOP) mode, the antennas are low- paths. The two-dimensional tomogram is obtained by discret-ered such that their midpoints are always at the same depth izing the area between the boreholes in rectangular cells of(Fig. 13, left). The arrival time of the direct wave between constant velocity and determining the velocity of each cell bythe boreholes and the known borehole separation is used to minimizing the difference between measured arrival times andcalculate the velocity and soil permittivity. The ZOP mode is arrival times calculated for raypaths passing through thesean attractive approach for measuring the soil water content cells. When necessary, three-dimensional tomograms can alsoprofile of the vadose zone with a high spatial resolution and a be reconstructed (e.g., Eppstein and Dougherty, 1998). Thelarge sampling volume (Gilson et al., 1996; Knoll and Clement, drawback of acquiring the two-dimensional tomogram is the1999; Parkin et al., 2000; Binley et al., 2001, 2002, Rucker and much longer time (typically several hours) required to obtainFerre, 2003). Furthermore, each borehole GPR measurement all the required measurements. Therefore, the MOP mode isrequires only a couple of seconds and, therefore, the ZOP best suited for steady-state water content conditions. For casesmethod is potentially capable of measuring transient processes where the subsurface variations occur on similar time scaleswithin the unsaturated zone.
as the radar data acquisition, Day-Lewis et al. (2002) recentlySoil water content can also be determined from a multi-described a sequential approach for inverting time-lapse tomo-offset profile (MOP, Fig. 13, right). The first arrival times ofgraphic radar data to assist in more accurate imaging.all multi-offset measurements can be used to reconstruct a
The sampling volume of borehole GPR measurements can(tomographic) two-dimensional image of the soil water con-be approximated by the volume of the first Fresnel zone (Cer-tent distribution between the boreholes (Hubbard et al., 1997;veny and Soares, 1992). The Fresnel volume is an elongatedParkin et al., 2000; Binley et al., 2001; Alumbaugh et al., 2002).rotational ellipsoid with its foci at the location of the transmit-To extract high-resolution, quantitative information from ra-ter and the receiver. For a homogeneous medium, the Fresneldar tomographic data, it is important to process the data asvolume, V, depends on the path length of the ray trace, Laccurately as possible. The procedure for inverting radar to-(m), and the wavelength of the radar signal, � (m):
V �43
�abc [18]
where a, b, and c are the semi-axes of the ellipsoid defined as
a �12 ��2 � L� [19]
b,c �12 ��
2
4� L��
12
[20]
The wavelength, �, can be calculated from the center fre-quency or the bandwidth of the transmitted GPR pulse. TheFig. 13. Schematic diagrams of borehole ground penetrating radarFresnel zone, a circular region, is the cross section of the Fres-(GPR) wave paths between transmitter and receiver for ZOP (left)
and MOP (right). nel volume in a plane perpendicular to the raypath. The maxi-

www.vadosezonejournal.org 485
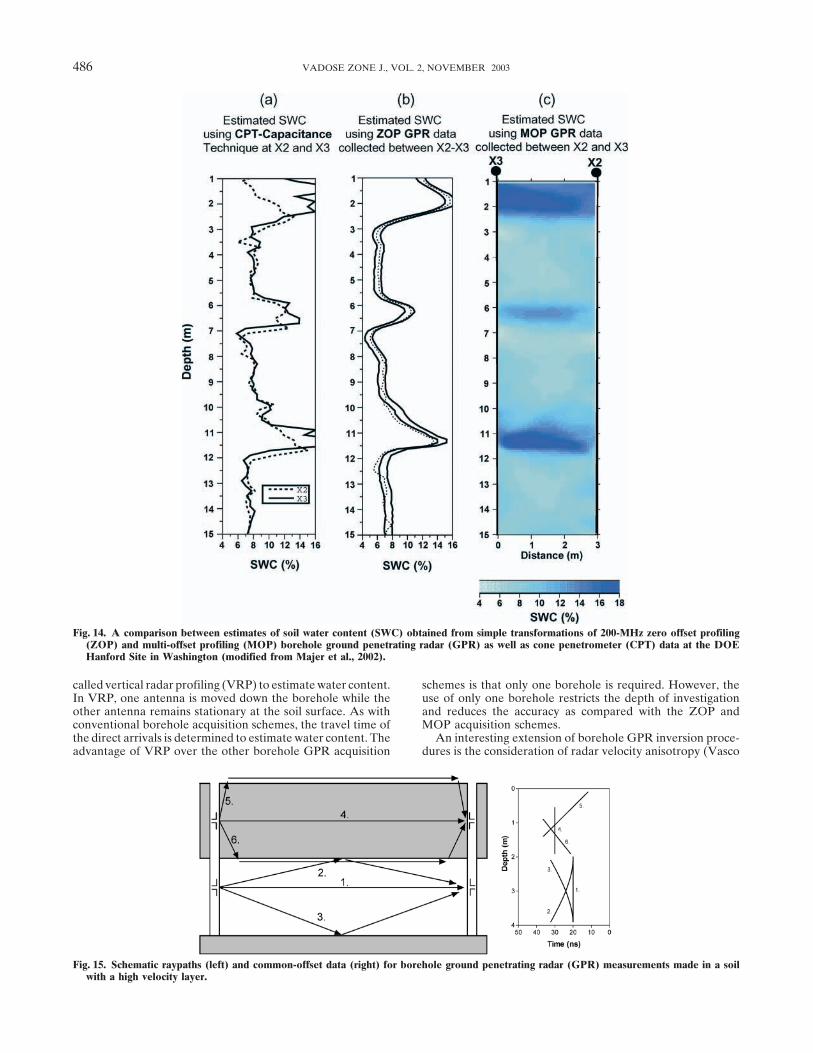
mum diameter of the Fresnel zone along the raypath (2b) is et al., 1998). In Fig. 14b, the solid lines illustrate the soil watercontent estimates obtained from the ZOP measurements, ac-often given as the spatial resolution in tomography.
Several studies have compared water content estimates ob- quired prior and subsequent to the MOP measurements, whilethe dashed line indicates the estimates obtained from the ZOPtained from GPR travel time data collected between boreholes
with one-dimensional measurements obtained from data col- measurements extracted from the MOP gathers. These ZOPmeasurements have been converted into water content usinglected within the corresponding boreholes (Hubbard et al.,
1997; Binley et al., 2001; Alumbaugh et al., 2002). Errors in the Topp relation and without accounting for the zero timedrift as was mentioned above and described in detail by Pe-water content estimates obtained using borehole GPR data
can potentially arise from acquisition procedures (ZOP and terson (2001). A gradual shift in zero time is illustrated bythis figure, which is indicative of system changes associatedMOP), inversion procedures (MOP), as well as from the petro-
physical relationship used to convert the GPR velocity esti- with components in the radar system warming up. This figurehighlights how important it is to correct for zero time driftsmates to water content (ZOP and MOP). Using a site-specific
petrophysical relationship, Alumbaugh et al. (2002) found that using radar tomographic data. For example, in this case, if thezero time drift is not accounted for, estimates of soil waterestimates of volumetric water content obtained from tomo-
graphic radar velocity estimates had a root mean square error content obtained from radar velocity measurements could eas-ily be off by 1%. Finally, Fig. 14c illustrates the estimates ofof 0.02 to 0.03 m3 m�3 compared with neutron log derived
values obtained from corresponding boreholes, and that the soil water content obtained by converting the tomographic(MOP) travel time data, collected between X2 and X3 anderrors were greatest in wetter zones. Repeatability measure-
ments at the same study site suggested that the precision corrected for zero time drift, into estimates of water contentusing the Topp relation. Comparison of the estimates of waterassociated with the radar acquisition system accounted for
about 0.5% of the error in water content estimation. content from the one-dimensional CPT data, the horizontallyaveraged ZOP data, and the two-dimensional tomographicTime-lapse radar tomograms are often presented as “differ-
ence” tomograms to illustrate the change in geophysical attri- data illustrate the similarity in water content spatial distribu-tions revealed by the borehole GPR estimates and the logbute (or corresponding estimated moisture content) with time.
These tomograms are constructed by subtracting the geophysi- data under conditions of only minor lateral heterogeneity.Similar results have been found on comparison of water con-cal responses collected at one point in time from the responses
collected at the same location but at another point in time, tent estimates obtained from borehole GPR and from neutronprobe data.or by inverting the differences in the electromagnetic travel
time picks. By displaying differences only, subtle changes asso- Crucial to the analysis of borehole GPR measurements isthe correct identification of the raypath of the wave arrivingciated with a dynamic event, such as moisture migration due
to forced or natural infiltration, can be highlighted. For exam- first (Hammon et al., 2003; Rucker and Ferre, 2003; Ferreet al., 2003). Figure 15 (left) shows possible raypaths for ZOPple, if the geophysical signal is influenced by both lithology
and moisture content in the unsaturated zone, by collecting measurements in a soil with a high-velocity (dry) layer sur-rounded by soil with a lower velocity. Figure 15 (right) presentsdata during an infiltration experiment at one point in time
and subtracting it from another data set collected at another the corresponding schematic ZOP measurement (right). Forthe high-velocity zone, the direct wave labeled 1 arrives first,point in time, the changes in the geophysical signature associ-
ated only with the infiltrating fluid are illuminated, and the and the known borehole separation can be used to calculatethe velocity. The reflections from the top and bottom of theeffects of the geology are suppressed. This approach has been
used with time-lapse radar tomographic data to delineate per- high velocity zone (marked 2 and 3) arrive later. When theantennas are in the low-velocity zone, refracted waves (4 andmeable pathways and moisture migration (Hubbard et al.,
1997; Eppstein and Dougherty, 1998). Binley et al. (2002) 5), rather than direct waves (6), might arrive first, and thevelocity estimate will be in error when a direct wave path isconverted time lapse ZOP radar data sets to volumetric water
content using a dielectric mixing model (West et al., 2003) to assumed. This is of particular importance for borehole GPRmeasurements near the surface, where the refracted (air) waveobtain an estimated change in volumetric water content. Their
change in water content estimates ranged between 0.5 and (4) will most likely arrive first. For refracted waves partlytraveling in air, the velocity–depth profile, V(z) can be esti-2% and agreed favorably with monthly rainfall measurements.
As described by Peterson (2001), extreme care must be mated from (Hammon et al., 2003)taken to determine the zero time when using crosshole radardata for time-lapse monitoring, as zero time drift associated V(z) �
1
�1c2
�1
4V �(z)2
[21]with the radar system can easily overwhelm velocity changescaused by the dynamic event that is being monitored. Thesechanges can be caused by system electronics, such as changingpower transmitters or cycling the power to any of the system where V �(z) is the apparent velocity at depth z that can becomponents. Loose connections or temperature changes as determined from the slope, dz/dt, in Fig. 14 (right). Ruckerthe system components warm up can cause more subtle shifts. and Ferre (2003) successfully used Eq. [21] to determine soilPeterson (2001) suggested collecting ZOP data prior and sub- water content from refracted air waves. They also predictedsequent to acquiring MOP radar data to assess zero time drifts refraction termination depths below which direct waves arethat occur during acquisition and subsequently accounting for expected to arrive before refracted air waves, which can bethem in the MOP processing procedure. helpful in analyzing borehole GPR measurements.
A comparison between estimates of water content obtained Borehole GPR has not only been used in the vertical ZOPfrom simple transformations of data obtained using 200-MHz and MOP mode. For example, Parkin et al. (2000) and Gala-borehole GPR and logging tools is given in Fig. 14 (modified gedara et al. (2002) used horizontal boreholes to monitor thefrom Majer et al., 2002). These data were collected within a soil water content in a two-dimensional horizontal plane belowsandy and unsaturated section of the DOE Hanford Site in a wastewater trench. Other interesting applications of hori-Washington. Figure 14a illustrates estimates of soil water con- zontal boreholes are conceivable, such as measurements oftent (SWC) obtained at two well bores (X2 and X3) using cone fingered flow and solute breakthrough. Knoll and Clement
(1999) and Buursink et al. (2002) used an acquisition schemepenetrometer (CPT) capacitance probe measurements (Shinn
486 VADOSE ZONE J., VOL. 2, NOVEMBER 2003
Fig. 14. A comparison between estimates of soil water content (SWC) obtained from simple transformations of 200-MHz zero offset profiling(ZOP) and multi-offset profiling (MOP) borehole ground penetrating radar (GPR) as well as cone penetrometer (CPT) data at the DOEHanford Site in Washington (modified from Majer et al., 2002).
called vertical radar profiling (VRP) to estimate water content. schemes is that only one borehole is required. However, theuse of only one borehole restricts the depth of investigationIn VRP, one antenna is moved down the borehole while the
other antenna remains stationary at the soil surface. As with and reduces the accuracy as compared with the ZOP andMOP acquisition schemes.conventional borehole acquisition schemes, the travel time of
the direct arrivals is determined to estimate water content. The An interesting extension of borehole GPR inversion proce-dures is the consideration of radar velocity anisotropy (Vascoadvantage of VRP over the other borehole GPR acquisition
Fig. 15. Schematic raypaths (left) and common-offset data (right) for borehole ground penetrating radar (GPR) measurements made in a soilwith a high velocity layer.
www.vadosezonejournal.org 487
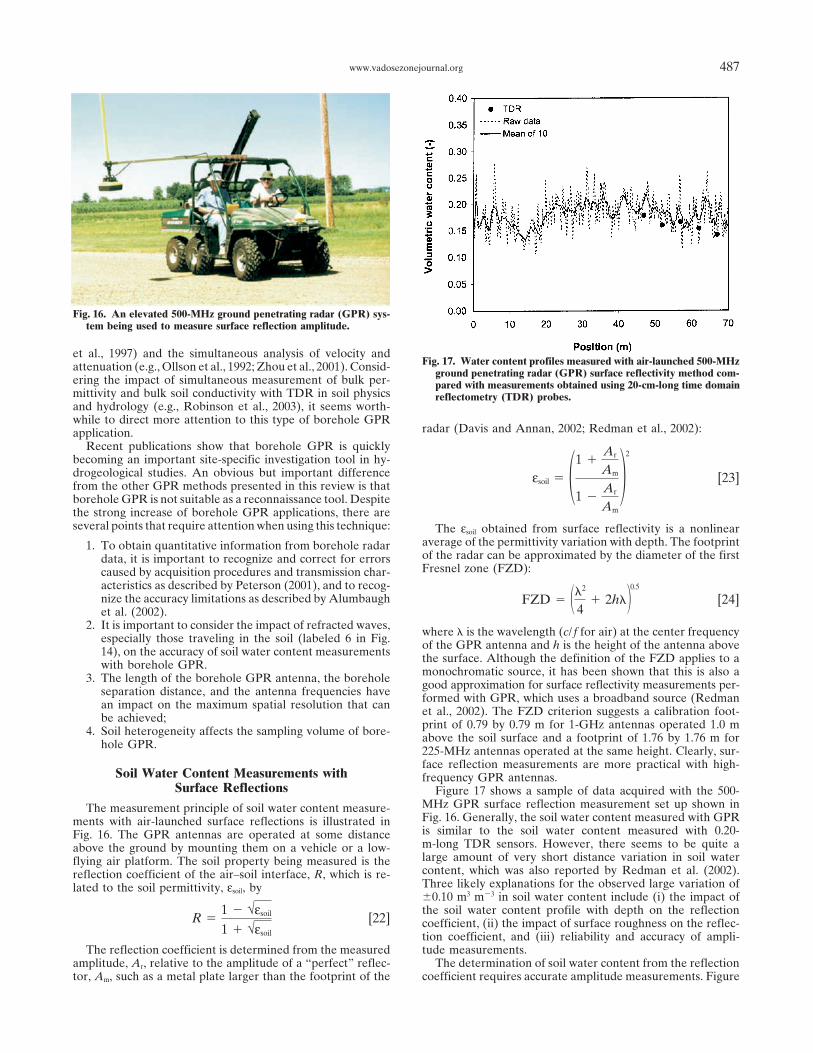
Fig. 16. An elevated 500-MHz ground penetrating radar (GPR) sys-tem being used to measure surface reflection amplitude.
et al., 1997) and the simultaneous analysis of velocity andFig. 17. Water content profiles measured with air-launched 500-MHzattenuation (e.g., Ollson et al., 1992; Zhou et al., 2001). Consid- ground penetrating radar (GPR) surface reflectivity method com-
ering the impact of simultaneous measurement of bulk per- pared with measurements obtained using 20-cm-long time domainmittivity and bulk soil conductivity with TDR in soil physics reflectometry (TDR) probes.and hydrology (e.g., Robinson et al., 2003), it seems worth-while to direct more attention to this type of borehole GPR
radar (Davis and Annan, 2002; Redman et al., 2002):application.Recent publications show that borehole GPR is quickly
becoming an important site-specific investigation tool in hy-drogeological studies. An obvious but important difference εsoil � �1 �
Ar
Am
1 �Ar
Am
�2
[23]from the other GPR methods presented in this review is thatborehole GPR is not suitable as a reconnaissance tool. Despitethe strong increase of borehole GPR applications, there areseveral points that require attention when using this technique: The εsoil obtained from surface reflectivity is a nonlinear
average of the permittivity variation with depth. The footprint1. To obtain quantitative information from borehole radarof the radar can be approximated by the diameter of the firstdata, it is important to recognize and correct for errorsFresnel zone (FZD):caused by acquisition procedures and transmission char-
acteristics as described by Peterson (2001), and to recog-nize the accuracy limitations as described by Alumbaugh FZD � ��
2
4� 2h��
0.5
[24]et al. (2002).
2. It is important to consider the impact of refracted waves, where � is the wavelength (c/ f for air) at the center frequencyespecially those traveling in the soil (labeled 6 in Fig. of the GPR antenna and h is the height of the antenna above14), on the accuracy of soil water content measurements the surface. Although the definition of the FZD applies to awith borehole GPR. monochromatic source, it has been shown that this is also a3. The length of the borehole GPR antenna, the borehole good approximation for surface reflectivity measurements per-separation distance, and the antenna frequencies have formed with GPR, which uses a broadband source (Redmanan impact on the maximum spatial resolution that can et al., 2002). The FZD criterion suggests a calibration foot-be achieved; print of 0.79 by 0.79 m for 1-GHz antennas operated 1.0 m4. Soil heterogeneity affects the sampling volume of bore- above the soil surface and a footprint of 1.76 by 1.76 m forhole GPR. 225-MHz antennas operated at the same height. Clearly, sur-face reflection measurements are more practical with high-
Soil Water Content Measurements with frequency GPR antennas.Surface Reflections Figure 17 shows a sample of data acquired with the 500-
MHz GPR surface reflection measurement set up shown inThe measurement principle of soil water content measure-Fig. 16. Generally, the soil water content measured with GPRments with air-launched surface reflections is illustrated inis similar to the soil water content measured with 0.20-Fig. 16. The GPR antennas are operated at some distancem-long TDR sensors. However, there seems to be quite aabove the ground by mounting them on a vehicle or a low-large amount of very short distance variation in soil waterflying air platform. The soil property being measured is thecontent, which was also reported by Redman et al. (2002).reflection coefficient of the air–soil interface, R, which is re-Three likely explanations for the observed large variation oflated to the soil permittivity, εsoil, by�0.10 m3 m�3 in soil water content include (i) the impact ofthe soil water content profile with depth on the reflection
R �1 � √εsoil
1 � √εsoil
[22] coefficient, (ii) the impact of surface roughness on the reflec-tion coefficient, and (iii) reliability and accuracy of ampli-tude measurements.The reflection coefficient is determined from the measured
amplitude, Ar, relative to the amplitude of a “perfect” reflec- The determination of soil water content from the reflectioncoefficient requires accurate amplitude measurements. Figuretor, Am, such as a metal plate larger than the footprint of the
488 VADOSE ZONE J., VOL. 2, NOVEMBER 2003
www.geophysical.com), Mala Geosciences (Mala, Sweden;www.malags.se), and Sensors and Software (Mississauga, ON,Canada; www.sensoft.ca). These manufacturers provide multi-purpose GPR systems that can typically be operated at differ-ent frequency ranges from 10 to 1400 MHz. The GPR marketas a whole is moving toward easy-to-use GPR systems dedi-cated to specific tasks. Besides the aforementioned manufac-turers of GPR equipment, there are other manufacturers, whomostly provide purpose-built systems operating at around1000 MHz (Davis and Annan, 2002).
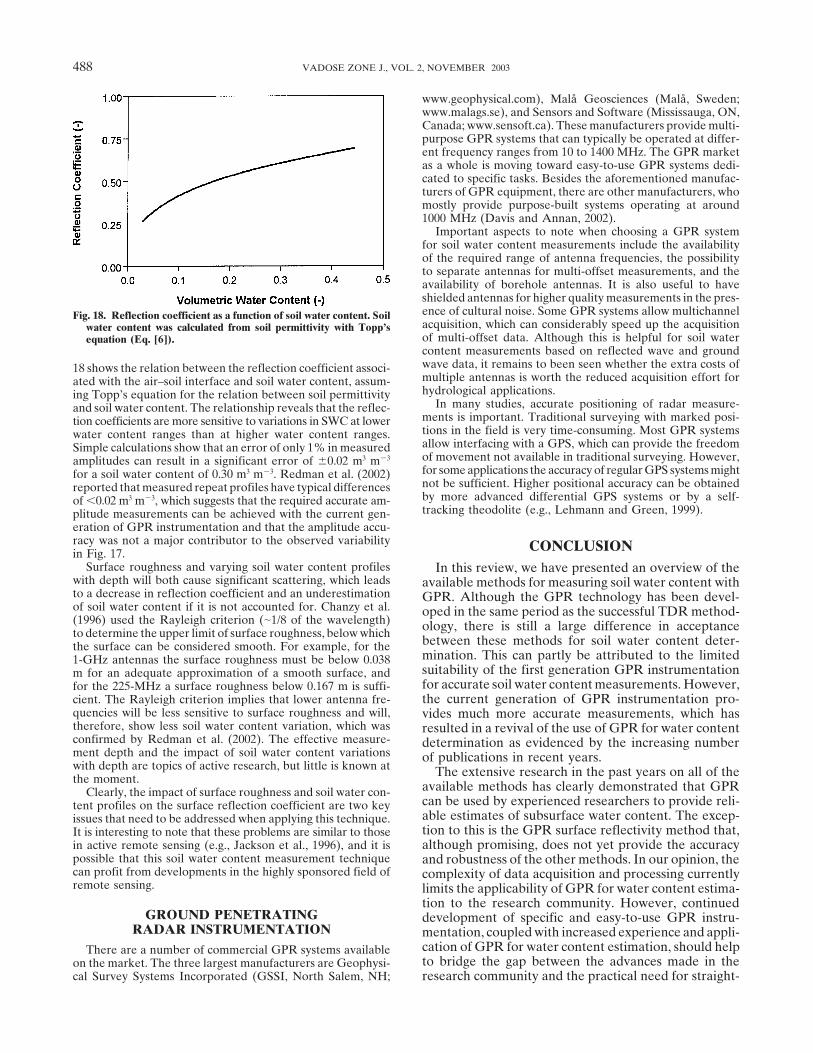
Important aspects to note when choosing a GPR systemfor soil water content measurements include the availabilityof the required range of antenna frequencies, the possibilityto separate antennas for multi-offset measurements, and theavailability of borehole antennas. It is also useful to haveshielded antennas for higher quality measurements in the pres-ence of cultural noise. Some GPR systems allow multichannelFig. 18. Reflection coefficient as a function of soil water content. Soilacquisition, which can considerably speed up the acquisitionwater content was calculated from soil permittivity with Topp’sof multi-offset data. Although this is helpful for soil waterequation (Eq. [6]).content measurements based on reflected wave and groundwave data, it remains to been seen whether the extra costs of18 shows the relation between the reflection coefficient associ-multiple antennas is worth the reduced acquisition effort forated with the air–soil interface and soil water content, assum-hydrological applications.ing Topp’s equation for the relation between soil permittivity
In many studies, accurate positioning of radar measure-and soil water content. The relationship reveals that the reflec-ments is important. Traditional surveying with marked posi-tion coefficients are more sensitive to variations in SWC at lowertions in the field is very time-consuming. Most GPR systemswater content ranges than at higher water content ranges.allow interfacing with a GPS, which can provide the freedomSimple calculations show that an error of only 1% in measuredof movement not available in traditional surveying. However,amplitudes can result in a significant error of �0.02 m3 m�3
for some applications the accuracy of regular GPS systems mightfor a soil water content of 0.30 m3 m�3. Redman et al. (2002)not be sufficient. Higher positional accuracy can be obtainedreported that measured repeat profiles have typical differencesby more advanced differential GPS systems or by a self-of 0.02 m3 m�3, which suggests that the required accurate am-tracking theodolite (e.g., Lehmann and Green, 1999).plitude measurements can be achieved with the current gen-
eration of GPR instrumentation and that the amplitude accu-racy was not a major contributor to the observed variability CONCLUSIONin Fig. 17.
Surface roughness and varying soil water content profiles In this review, we have presented an overview of thewith depth will both cause significant scattering, which leads available methods for measuring soil water content withto a decrease in reflection coefficient and an underestimation GPR. Although the GPR technology has been devel-of soil water content if it is not accounted for. Chanzy et al. oped in the same period as the successful TDR method-(1996) used the Rayleigh criterion (�1/8 of the wavelength) ology, there is still a large difference in acceptanceto determine the upper limit of surface roughness, below which
between these methods for soil water content deter-the surface can be considered smooth. For example, for themination. This can partly be attributed to the limited1-GHz antennas the surface roughness must be below 0.038suitability of the first generation GPR instrumentationm for an adequate approximation of a smooth surface, andfor accurate soil water content measurements. However,for the 225-MHz a surface roughness below 0.167 m is suffi-the current generation of GPR instrumentation pro-cient. The Rayleigh criterion implies that lower antenna fre-
quencies will be less sensitive to surface roughness and will, vides much more accurate measurements, which hastherefore, show less soil water content variation, which was resulted in a revival of the use of GPR for water contentconfirmed by Redman et al. (2002). The effective measure- determination as evidenced by the increasing numberment depth and the impact of soil water content variations of publications in recent years.with depth are topics of active research, but little is known at The extensive research in the past years on all of thethe moment.
available methods has clearly demonstrated that GPRClearly, the impact of surface roughness and soil water con-can be used by experienced researchers to provide reli-tent profiles on the surface reflection coefficient are two keyable estimates of subsurface water content. The excep-issues that need to be addressed when applying this technique.tion to this is the GPR surface reflectivity method that,It is interesting to note that these problems are similar to thosealthough promising, does not yet provide the accuracyin active remote sensing (e.g., Jackson et al., 1996), and it is
possible that this soil water content measurement technique and robustness of the other methods. In our opinion, thecan profit from developments in the highly sponsored field of complexity of data acquisition and processing currentlyremote sensing. limits the applicability of GPR for water content estima-
tion to the research community. However, continuedGROUND PENETRATING development of specific and easy-to-use GPR instru-
RADAR INSTRUMENTATION mentation, coupled with increased experience and appli-cation of GPR for water content estimation, should helpThere are a number of commercial GPR systems availableto bridge the gap between the advances made in theon the market. The three largest manufacturers are Geophysi-
cal Survey Systems Incorporated (GSSI, North Salem, NH; research community and the practical need for straight-

www.vadosezonejournal.org 489
England sites and comparison with neutron log porosity. In Proc.forward tools to accurately measure water content inof SAGEEP ’02, Las Vegas, NV. 10–14 Feb. 2002. Environmentalhigh resolution and over large areas. Most likely, theand Engineering Geophysical Society, Denver, CO.
borehole GPR method will continue to be used as an Callies, U., A. Rhodin, and D.P. Eppel. 1998. A case study on varia-important research tool for studying infiltration pro- tional soil moisture analysis from atmospheric observations. J. Hy-
drol. (Amsterdam) 212–213:95–108.cesses and contaminant transport in the saturated andCerveny, V., and J.E.P. Soares. 1992. Fresnel volume ray tracing.unsaturated zones. There may even be potential applica-
Geophysics 57:902–915.tions outside the research community for monitoring Chanzy, A., A. Tarussov, A. Judge, and F. Bonn. 1996. Soil watersubsurface water content as part of groundwater protec- content determination using a digital ground-penetrating radar.
Soil Sci. Soc. Am. J. 60:1318–1326.tion strategies.Dalton, F.N., W.N. Herkelrath, D.S. Rawlins, and J.D. Rhoades. 1984.The potential and limitations of each GPR method
Time-domain reflectometry: Simultaneous measurement of soilfor water content determination have been discussedwater content and electrical conductivity with a single probe. Sci-
extensively in this review. Here, we want to highlight ence 224:989–990.two important research issues that, in our opinion, cur- Dannowski, G., and U. Yaramanci. 1999. Estimation of water content
and porosity using combined radar and geoelectrical measure-rently limit the development and acceptance of GPRments. Eur. J. Environ. Eng. Geophys. 4:71–85.as a soil water content sensor. The first issue deals with
Davis, J.L., and A.P. Annan. 1989. Ground-penetrating radar forthe petrophysical relationships between permittivity high resolution mapping of soil and rock stratigraphy. Geophys.and volumetric water content. Although the community Prospect. 37:531–551.seems to have high confidence in the reliability of these Davis, J.L., and A.P. Annan. 2002. Ground penetrating radar to mea-
sure soil water content. p. 446–463. In J.H. Dane and G.C. Topprelationships because of the excellent results obtained(ed.) Methods of soil analysis. Part 4. SSSA Book Ser. 5. SSSA,with TDR, there seems to be evidence that site- andMadison WI.frequency-dependent relationships may be required for Day-Lewis, F.D., J.M. Harris, and S. Gorelick. 2002. Time-lapse inver-
those applications that require accurate water content sion of crosswell radar data. Geophysics 67:1740–1752.measurements with lower-frequency GPR antennas. Debye, P. 1929. Polar molecules. Dover Publ., Mineola, NY.
Dix, C.H. 1955. Seismic velocities from surface measurements. Geo-Further measurements of the frequency dependency ofphysics 20:73.soil permittivity in the 10-MHz to 1-GHz frequency
Dobson, M.C., F.T. Ulaby, M.T. Hallikainen, and M.A. El-Rayes.range and further field studies that directly compare 1985. Microwave dielectric behaviour of wet soil. Part II. DielectricTDR and GPR using lower-frequency antennas on high mixing models. IEEE Trans. Geosci. Remote Sens. 23:35–46.
Du, S. 1996. Determination of water content in the subsurface withclay content soils should help resolve this issue. Thethe ground wave of ground penetrating radar. Ph.D. thesis. Ludwig-second issue is the sampling volume and spatial resolu-Maximilians-Universitat, Munich, Germany.tion of all of the GPR methods, particularly under het-
Endres, A.L., W.P. Clement, and D.L. Rudolph. 2000. Ground pene-erogeneous (field) conditions. Here, both numerical trating radar imaging of an aquifer during a pumping test. Groundmodeling and field studies will be required to determine Water 38:566–576.
Entekhabi, D., G.R. Asrar, A.K. Betts, K.J. Beven, R.L. Bras, C.J.these values.Duffy, T. Dunne, R.D. Koster, D.P. Lettenmaier, D.B. McLaughlin,W.J. Shuttleworth, M.Th. van Genuchten, M.Y. Wei, and E.F.ACKNOWLEDGMENTSWood. 1999. An agenda for land surface hydrology research anda call for the second international hydrological decade. Bull. Am.This study was financially supported by NWO-ALW grantMeteorol. Soc. 80:2043–2058.number 750-19-804 (J.A. Huisman) and by USDA grant num-
Eppstein, M.J., and D.E. Dougherty. 1998. Efficient three-dimensionalber 2001-35102-09866 (Y. Rubin). T.P.A. Ferre is thanked fordata inversion: Soil characterization and moisture monitoring frominitiating this review. Three anonymous reviewers are thankedcross-well ground-penetrating radar at a Vermont test site. Wat.for their constructive comments.Resour. Res. 34:1889–1900.
Famiglietti, J.S., J.A. Deveraux, C.A. Laymon, T. Tsegaye, P.R.REFERENCES Houser, T.J. Jackson, S.T. Graham, M. Rodell, and P.J. van Oeve-
len. 1999. Ground-based investigation of soil moisture variabilityAlumbaugh, D., P. Chang, L. Paprocki, J. Brainard, R.J. Glass, andwithin remote sensing footprints during the Southern Great PlainsC.A. Rautman. 2002. Estimating moisture contents in the vadose1997 (SGP97) hydrology experiment. Wat. Resour. Res. 35:zone using cross-borehole ground penetrating radar: A study of1839–1851.accuracy and repeatability. Water Resour. Res. 38:1309.
Ferre, P.A., D.L. Rudolph, and R.G. Kachanoski. 1996. Spatial averag-Annan, A.P. 1973. Radar interferometry depth sounding: Part I. Theo-ing of water content by time domain reflectometry: Implicationsretical discussion. Geophysics 38:557–580.for twin rod probes with and without dielectric coatings. Wat.Annan, A.P. 1996. Transmission, dispersion and GPR. J. Environ.Resour. Res. 32:271–279.Eng. Geophys. 0:125–136.
Ferre, P.A., G. von Glinski, and L.A. Ferre. 2003. Monitoring theBerktold, A., K.G. Wollny, and H. Alstetter. 1998. Subsurface mois-maximum depth of drainage in response to pumping using boreholeture determination with the ground wave of GPR. p. 675–680. Inground penetrating radar. Available at www.vadosezonejournal.Proc. Int. Conf. on Ground-Penetrating Radar, 7th, Lawrence, KS.org. Vadose Zone J. 2:511–518 (this issue).May 1998. Univ. of Kansas, Lawrence.
Friedman, S.P. 1998. A saturation degree-dependent compositeBinley, A., P. Winship, R. Middleton, M. Pokar, and J. West. 2001.spheres model for describing the effective dielectric constant ofHigh-resolution characterization of vadose zone dynamics usingunsaturated porous media. Wat. Resour. Res. 34:2949–2961.cross-borehole radar. Water Resour. Res. 37:2639–2652.
Galagedara, L.W., G.W. Parkin, J.D. Redman, and A.L. Endres. 2002.Binley, A., P. Winship, L.J. West, M. Pokar, and R. Middleton. 2002.Temporal and spatial variation of soil water content measured bySeasonal variation of moisture content in unsaturated sandstoneborehole GPR under irrigation and drainage. Proc. of the Ninthinferred from borehole radar and resistivity profiles. J. Hydrol.Conf. on Ground Penetrating Radar. Proc. SPIE 4758:180–185.(Amsterdam) 267:160–172.
Garambois, S., P. Senechal, and H. Perroud. 2002. On the use ofBohidar, R.N., and J.F. Hermance. 2002. The GPR refraction method.combined geophysical methods to assess water content and waterGeophysics 67:1474–1485.conductivity of near-surface formations. J. Hydrol. (Amsterdam)Buursink, M.L., J.W. Lane, Jr., W.P. Clement, and M.D. Knoll. 2002.
Use of vertical-radar profiling to estimate porosity at two New 259:32–48.

490 VADOSE ZONE J., VOL. 2, NOVEMBER 2003
Gilson, E.W., J.D. Redman, J. Pilon, and A.P. Annan. 1996. Near resolution imaging of vadose zone transport using crosswell radarsurface applications of borehole radar. p. 545–553. In Proc. of the and seismic methods. Rep. LBNL 49022. Lawrence Berkeley Na-Symp. on the Application of Geophysics to Engineering and Envi- tional Laboratory, Berkeley, Ca.ronmental Problems, Keystone, CO. Environ. Eng. and Geophys. Merz, B., and A. Bardossy. 1998. Effects of spatial variability onSoc., Denver, CO. the rainfall runoff process in a small loess catchment. J. Hydrol.
Greaves, R.J., D.P. Lesmes, J.M. Lee, and M.N. Toksoz. 1996. Velocity (Amsterdam) 212–213:304–317.variations and water content estimated from multi-offset, ground- Merz, B., and E.J. Plate. 1997. An analysis of the effects of spatialpenetrating radar. Geophysics 61:683–695. variability of soil and soil moisture on runoff. Water Resour.
Grote, K., S.S. Hubbard, and Y. Rubin. 2002. GPR monitoring of Res. 33:2909–2922.volumetric water content in soils applied to highway construction Nakashima, Y., H. Zhou, and M. Sato. 2001. Estimation of ground-and maintenance. Leading Edge Explor. 21:482–485. water level by GPR in an area with multiple ambiguous reflections.
Grote, K., S.S. Hubbard, and Y. Rubin. 2003. Field-scale estimation J. Appl. Geophys. 47:241–249.of volumetric water content using GPR ground wave techniques. Nelson, S.O. 1994. Measurement of microwave dielectric propertiesWat. Resour. Res. In press. of particulate materials. J. Food Eng. 21:365–384.
Hammon, W.S. III, X. Zeng, R.M. Corbeanu, and G.A. McMechan. Olhoeft, G.R. 1987. Electrical properties from 10�3 to 10�9 Hz: Physics2003. Estimation of the spatial distribution of fluid permeability and chemistry. Proc. Phys. Chem. Porous Media II 154:281–298.from surface and tomographic GPR data and core, with a 2-D Ollson, O., L. Falk, O. Forslund, L. Lundmark, and E. Sandberg. 1992.example from the Ferron Sandstone, Utah. Geophysics 67: Borehole radar applied to the characterization of hydraulically1505–1515. conductive fracture zones in crystalline rock. Geophys. Prospect.
Hasted, J.B. 1973. Aqueous dielectrics. Chapman and Hall, London. 40:109–142.Heimovaara, T.J., and W. Bouten. 1990. A computer-controlled 36- Or, D., and J.M. Wraith. 1999. Temperature effects on soil bulk dielec-
channel time domain reflectometry system for monitoring soil wa- tric permittivity measured by time domain reflectometry: A physi-ter contents. Water Resour. Res. 26:2311–2316. cal model. Water Resour. Res. 35:371–383.
Herkelrath, W.N., S.P. Hamburg, and F. Murphy. 1991. Automatic, Parkin, G., D. Redman, P. von Bertoldi, and Z. Zhang. 2000. Measure-real-time monitoring of soil moisture in a remote field area with ment of soil water content below a wastewater trench using ground-time domain reflectometry. Water Resour. Res. 27:857–864. penetrating radar. Water Resour. Res. 36:2147–2154.
Hubbard, S.S., K. Grote, and Y. Rubin. 2002. Mapping the volumetric Pauwels, V.R.N., R. Hoeben, N.E.C. Verhoest, and F.P. De Troch.soil water content of a California vineyard using high-frequency 2001. The importance of the spatial patterns of remotely sensedGPR ground wave data. Leading Edge Explor. 21:552–559. soil moisture in the improvement of discharge predictions for small-
Hubbard, S.S., J.E. Peterson, Jr., E.L. Majer, P.T. Zawislanski, K.H. scale basins through data assimilation. J. Hydrol. (Amsterdam)Williams, J. Roberts, and F. Wobber. 1997. Estimation of perme- 251:88–102.able pathways and water content using tomographic radar data. Peterson, J.E., Jr. 2001. Pre-inversion corrections and analysis of radarLeading Edge Explor. 16:1623–1630. tomographic data. J. Environ. Eng. Geophys. 6:1–18.Huisman, J.A., and W. Bouten. 2003. Accuracy and reproducibility Redman, J.D., J.L. Davis, L.W. Galagedara, and G.W. Parkin. 2002.of measuring soil water content with the ground wave of ground Field studies of GPR air launched surface reflectivity measure-penetrating radar. J. Environ. Eng. Geophys. 8:65–73.
ments of soil water content. Proc. of the Ninth Conf. on Ground-Huisman, J.A., J.J.J.C. Snepvangers, W. Bouten, and G.B.M. Heuvel-Penetrating Radar. Proc. SPIE 4758:156–161.ink. 2002. Mapping spatial variation in surface soil water content:
Robinson, D.A., S.B. Jones, J.M. Wraith, D. Or, and S.P. Friedman.Comparison of ground-penetrating radar and time domain reflec-2003. A review of advances in dielelectric and electric conductivitytometry. J. Hydrol. (Amsterdam) 269:194–207.measurements using time domain reflectometry. Available at www.Huisman, J.A., J.J.J.C. Snepvangers, W. Bouten, and G.B.M. Heuvel-vadosezonejournal. Vadose Zone J. 2:444–475 (this issue).ink. 2003. Monitoring temporal development of spatial soil water
Roth, K., R. Schulin, H. Fluhler, and W. Attinger. 1990. Calibrationcontent variation: Comparison of ground penetrating radar andof time domain reflectometry for water content measurement usingtime domain reflectometry. Available at www.vadosezonejourna-a composite dielectric approach. Water Resour. Res. 26:2267–2273.l.org. Vadose Zone J. 2:519–529 (this issue).
Rubin, Y. 2003. Applied stochastic hydrogeology. Oxford UniversityHuisman, J.A., C. Sperl, W. Bouten, and J.M. Verstraten. 2001. SoilPress, Oxford, UK.water content measurements at different scales: Accuracy of time
Rucker, D.F., and P.A. Ferre. 2003. Near-surface water content esti-domain reflectometry and ground-penetrating radar. J. Hydrol.mation with borehole ground penetrating radar using critically(Amsterdam) 245:48–58.refracted waves. Available at www.vadosezonejournal.org. VadoseJackson, T.J., J. Schmugge, and E.T. Engman. 1996. Remote sensingZone J. 2:247–252.applications to hydrology: Soil moisture. Hydrol. Sci. J. 41:517–530.
Shinn, J.D., D.A. Timian, R.M. Morey, G. Mitchell, C.L. Antle, andJacobsen, O.H., and P. Schjønning. 1994. Comparison of TDR calibra-R. Hull. 1998. Development of a CPT deployed probe for in sitution functions for soil water determination. p. 9–23. In Proc. Timemeasurement of volumetric soil moisture content and electricalDomain Reflectometry, Applications in Soil Science, Researchresistivity. Field Anal. Chem. Tech. 2:103–109.Centre Foulum, Denmark. 16 Sept. 1994. SP-Report 25-33. Danish
Sperl, C. 1999. Determination of spatial and temporal variation of theInst. of Plant and Soil Sci., Tjele, Denmark.soil water content in an agro-ecosystem with ground-penetratingJones, S.B., and S.P. Friedman. 2000. Particle shape effect on theradar. (In German.) Ph.D. thesis. Technische Universitat Munchen,effective permittivity of anisotropic or isotropic media consistingMunich, Germany.of aligned or randomly oriented ellipsoidal particles. Water Resour.
Stoffregen, H., T. Zenker, and G. Wessolek. 2002. Accuracy of soilRes. 36:2821–2833.water content measurements using ground penetrating radar: Com-Knoll, M.D., and W.P. Clement. 1999. Vertical radar profiling toparison of ground penetrating radar and lysimeter data. J. Hydrol.determine dielectric constant, water content and porosity values(Amsterdam) 267:201–206.at well locations. p. 821–830. In Proc. of SAGEEP’99, Oakland,
Tillard, S., and J.-C. Dubois. 1995. Analysis of GPR data: WaveCA. Environ. Eng. and Geophys. Soc., Denver, CO.propagation velocity determination. J. Appl. Geophys. 33:77–91.Ledieu, J., P. De Ridder, P. De Clerck, and S. Dautrebande. 1986. A
Topp, G.C., J.L. Davis, and A.P. Annan. 1980. Electromagnetic deter-method of measuring soil moisture by time domain reflectometry. J.mination of soil water content: Measurements in coaxial transmis-Hydrol. (Amsterdam) 88:319–328.sion lines. Water Resour. Res. 16:574–582.Lehmann, F., and A.G. Green. 1999. Semi-automated georadar data
Topp, G.C., M. Yanuka, W.D. Zebchuk, and S.J. Zegelin. 1988. Deter-acquisition in three dimensions. Geophysics 64:719–731.mination of electrical conductivity using time domain reflectome-Lesmes, D.P., R. Herbstzuber, and D. Wertz. 1999. Terrain permittiv-try: Soil and water experiments in coaxial lines. Water Resour.ity mapping: GPR measurements of near-surface soil moisture.Res. 24:945–952.p. 575–582. In Proc. SAGEEP’99, Oakland, CA. Environ. Eng.
Ulaby, F.T., P.C. Dubois, and J. van Zyl. 1996. Radar mapping ofand Geophys. Soc., Denver, CO.Majer, E.L., K.H. Williams, J.E. Peterson, and T.M. Daley. 2002. High surface soil moisture. J. Hydrol. (Amsterdam) 184:57–84.

www.vadosezonejournal.org 491
van Dam, R.L., W. Schlager, M.J. Dekkers, and J.A. Huisman. 2002. Weiler, K.W., T.S. Steenhuis, J. Boll, and K.-J.S. Kung. 1998. Compari-son of ground penetrating radar and time domain reflectometryIron oxides as a cause of GPR reflections. Geophysics 67:536–545.
van Oevelen, P.J. 2000. Estimation of areal soil water content through as soil water sensors. Soil Sci. Soc. of Am. J. 62:1237–1239.West, L.J., K. Handley, Y. Huang, and M. Pokar. 2003. Radar fre-microwave remote sensing. Ph.D. thesis. Wageningen University,
The Netherlands. quency dielectric dispersion in sandstone: Implications for determi-nation of moisture and clay content. Water Resour. Res. 39.van Overmeeren, R.A., S.V. Sariowan, and J.C. Gehrels. 1997. Ground
penetrating radar for determining volumetric soil water content; DOI:10.1029/2001WR000923.Wyseure, G.C.L., M.A. Mojid, and M.A. Malik. 1997. Measurementresults of comparative measurements at two sites. J. Hydrol. (Am-
sterdam) 197:316–338. of volumetric water content by TDR in saline soils. Eur. J. SoilSci. 48:347–354.Vasco, D.W., J.E. Peterson, and K.H. Lee. 1997. Ground-penetrating
radar velocity tomography in heterogeneous and anisotropic media. Yilmaz, O. 1987. Seismic data processing. SEG Investigations in Geo-physics 2. Society of Exploration Geophysicists, Tulsa, OK.Geophysics 62:1758–1773.
Vellidis, G., M.C. Smith, D.L. Thomas, and L.E. Asmussen. 1990. Zhou, C., L. Liu, and J.W. Lane. 2001. Nonlinear inversion of bore-hole-radar tomography data to reconstruct velocity and attenuationDetecting wetting front movement in a sandy soil with ground-
penetrating radar. Trans. ASAE 33:1867–1874. distribution in earth materials. J. Appl. Geophys. 47:271–284.