machine learning-based activity pattern classification
TRANSCRIPT
International Journal of
Environmental Research
and Public Health
Article
Machine Learning-Based Activity PatternClassification Using Personal PM2.5Exposure Information
JinSoo Park 1 and Sungroul Kim 2,*1 Department of Industrial Cooperation, Soonchunhyang University, Asan 31538, Korea; [email protected] Department of ICT Environmental Health System, Graduate School, Soonchunhyang University,
Asan 31538, Korea* Correspondence: [email protected]; Tel.: +82-41-530-1266
Received: 1 July 2020; Accepted: 2 September 2020; Published: 9 September 2020�����������������
Abstract: The activity pattern is a significant factor in identifying hotspots of personal exposure to airpollutants, such as PM2.5. However, the recording process of an activity pattern can be annoying tostudy participants, because they are often asked to bring a diary or a tracking recorder to write orvalidate their activity patterns when they change their activity profiles. Furthermore, the accuracy ofthe records of activity patterns can be lower, because people can mistakenly record them. Thus, thispaper proposes an idea to overcome these problems and make the whole data-collection process easierand more reliable. Our idea was based on transforming training data using the statistical propertiesof the children’s personal exposure level to PM2.5, temperature, and relative humidity and applyingthe properties to a decision tree algorithm for classification of activity patterns. From our finalmachine-learning modeling processes, we observed that the accuracy for activity-pattern classificationwas more than 90% in both the training and test data. We believe that our methodology can be usedeffectively in data-collection tasks and alleviate the annoyance that study participants may feel.
Keywords: machine learning; activity-pattern analysis; environmental data; PM2.5
1. Introduction
Environmental risk assessment [1,2] plays a major role in finding out relationships between thelevel of exposure to environmental pollutants and its effect on our bodies caused by the exposure.For this purpose, people have been gathering numerous environmental data to find out the relationshipfor a long time. For example, what a person does when a specific fine-dust value occurs, along withtime, temperature, humidity, latitude, and longitude at the time of the activity, are recorded together asa base information for the risk assessment tasks. However, there are some problems that need to beaddressed regarding the recording of activity patterns. The recording of activity patterns has to bemanually set each time the activity-pattern change happens, which to some is extremely inconvenient.Furthermore, it can lead to errors when one chooses the wrong options in the menu. To minimizethese problems and make the whole data-collection process smoother, it is necessary to make theactivity-pattern recording process automatic. Therefore, in this paper, we propose an idea to solve theinconvenience of manual activity-pattern input in data collection for risk assessment.
It is important to recognize the human activity patterns to make the activity-pattern recordingprocess automatic. Previously, various research has been conducted to recognize the activity pattern ofhuman activities, called human activities recognition (HAR), online and offline, and it was led mostlyby a computer-science group. The HAR has received much attention, because it is easy to gatherthe required data using built-in sensors on portable terminals including smartphones. Most HAR
Int. J. Environ. Res. Public Health 2020, 17, 6573; doi:10.3390/ijerph17186573 www.mdpi.com/journal/ijerph
Int. J. Environ. Res. Public Health 2020, 17, 6573 2 of 11
research has used acceleration data from inertial sensors for the estimation of human activities [3–5]and developed machine-learning techniques to classify the activity patterns. The machine-learningtechniques used include the classical algorithms, such as support vector machine (SVM) [6], decisiontree [7], naive Bayes [8], and k-nearest neighbor (kNN) [9] as well as the modern deep-learningalgorithms, such as convolutional neural network (CNN) [10], recurrent neural network (RNN) [11],restricted Boltzmann machine (RBM) [12], stacked autoencoder (SAE) [13,14], and deep belief network(DBN) [15].
There have been a couple of studies reporting machine-learning-based time-use activity-patternrecognition models. Hafezi et al. developed activity-based travel demand modeling [16]. Using amachine-learning algorithm, this study identified twelve unique clusters of travel-related daily activitypatterns from a large survey database of Halifax STAR household travel diaries, i.e., activity tracking.In addition, another previous study also reported activity-based models forecasting activities-basedtour chains as the individual unit of analysis [17]. Recently, environmental health studies applied asimilar technique of analyzing activity-based mobility patterns and evaluated its impact on PM2.5
exposure dose in different age groups [18].Unlike studies examining PM2.5 exposure levels by activity pattern with or without acceleration
data [3–5], as an opposite way, this study aimed to develop a predicting model identifying humanactivity patterns by analyzing environmental information. For this purpose, we used machine-learningtechniques and personal exposure levels of PM2.5, temperature, and relative humidity to identifypre-defined activity patterns. The idea was based on transforming the training data into its statisticalvalues, which is a technique used to diversify features of data to improve the performance ofclassifiers [19–22].
2. Methods and Materials
2.1. Machine-Learning-Based Activity-Pattern Detection
To evaluate the exposure dose of fine dust, we conducted personal PM2.5 monitoring in 10 sinterval, and the measured data were recorded together with the specific activity pattern associatedwith the data. After re-arranging the obtained PM2.5 data according to activity patterns, the statisticalvalues of the PM2.5 data representing each activity pattern were extracted and used as added featurevalues, which means that the statistics of PM2.5 data were used as training data. The summary of thedata transformation process is given in Sections 2.2 and 2.3.
2.2. Strategy for Obtaining Training Data
There were 10 different activity patterns defined in the database: bicycle, bus, car, commercialbuilding, cooking, education building (like schools), indoor-house, outdoor, restaurant, and walking.A few of them indicate where the target person actually stays. The children, who carried the real timemeasurement sensors were asked to write their activity on a separate diary book whenever he/shemakes a move, which was inconvenient in most cases. The idea was to transform the training databased on their statistical properties, so that we could diversify the training data by adding a fewmore features.
A few previous researchers attempted to transform their dataset into various forms to improvethe performance of the machine-learning system [19–22]. In this research, we chose to use PM2.5,temperature and relative humidity data as input data of our predictive model. However, these valueswere time-series data, measured every 10 s, so it was not wise to use the raw values directly, becausethe three types of data were too large to manage and contained semantically less information from anenvironmental perspective. Therefore, we used statistical features of input data as training data ratherthan the raw data. The statistical properties of the training data included five values from boxplotstatistics: minimum, first quartile, median, third quartile, and maximum. We specifically focused on
Int. J. Environ. Res. Public Health 2020, 17, 6573 3 of 11
using the PM2.5 data and its statistical features and put aside the temperature and humidity featuresfor now.
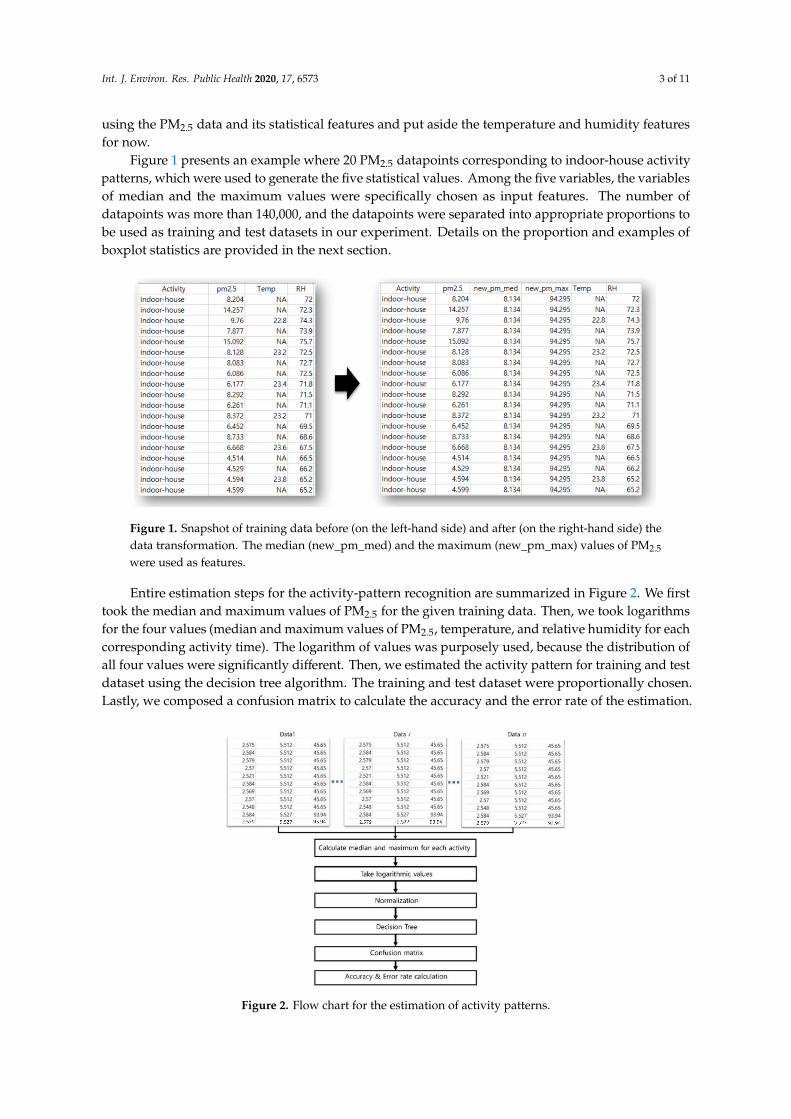
Figure 1 presents an example where 20 PM2.5 datapoints corresponding to indoor-house activitypatterns, which were used to generate the five statistical values. Among the five variables, the variablesof median and the maximum values were specifically chosen as input features. The number ofdatapoints was more than 140,000, and the datapoints were separated into appropriate proportions tobe used as training and test datasets in our experiment. Details on the proportion and examples ofboxplot statistics are provided in the next section.
Int. J. Environ. Res. Public Health 2020, 17, x 3 of 12
focused on using the PM2.5 data and its statistical features and put aside the temperature and humidity features for now.
Figure 1 presents an example where 20 PM2.5 datapoints corresponding to indoor-house activity patterns, which were used to generate the five statistical values. Among the five variables, the variables of median and the maximum values were specifically chosen as input features. The number of datapoints was more than 140,000, and the datapoints were separated into appropriate proportions to be used as training and test datasets in our experiment. Details on the proportion and examples of boxplot statistics are provided in the next section.
Figure 1. Snapshot of training data before (on the left-hand side) and after (on the right-hand side) the data transformation. The median (new_pm_med) and the maximum (new_pm_max) values of PM2.5 were used as features.
Entire estimation steps for the activity-pattern recognition are summarized in Figure 2. We first took the median and maximum values of PM2.5 for the given training data. Then, we took logarithms for the four values (median and maximum values of PM2.5, temperature, and relative humidity for each corresponding activity time). The logarithm of values was purposely used, because the distribution of all four values were significantly different. Then, we estimated the activity pattern for training and test dataset using the decision tree algorithm. The training and test dataset were proportionally chosen. Lastly, we composed a confusion matrix to calculate the accuracy and the error rate of the estimation.
Figure 2. Flow chart for the estimation of activity patterns.
Figure 1. Snapshot of training data before (on the left-hand side) and after (on the right-hand side) thedata transformation. The median (new_pm_med) and the maximum (new_pm_max) values of PM2.5
were used as features.
Entire estimation steps for the activity-pattern recognition are summarized in Figure 2. We firsttook the median and maximum values of PM2.5 for the given training data. Then, we took logarithmsfor the four values (median and maximum values of PM2.5, temperature, and relative humidity for eachcorresponding activity time). The logarithm of values was purposely used, because the distribution ofall four values were significantly different. Then, we estimated the activity pattern for training and testdataset using the decision tree algorithm. The training and test dataset were proportionally chosen.Lastly, we composed a confusion matrix to calculate the accuracy and the error rate of the estimation.
Int. J. Environ. Res. Public Health 2020, 17, x 3 of 12
focused on using the PM2.5 data and its statistical features and put aside the temperature and humidity features for now.
Figure 1 presents an example where 20 PM2.5 datapoints corresponding to indoor-house activity patterns, which were used to generate the five statistical values. Among the five variables, the variables of median and the maximum values were specifically chosen as input features. The number of datapoints was more than 140,000, and the datapoints were separated into appropriate proportions to be used as training and test datasets in our experiment. Details on the proportion and examples of boxplot statistics are provided in the next section.
Figure 1. Snapshot of training data before (on the left-hand side) and after (on the right-hand side) the data transformation. The median (new_pm_med) and the maximum (new_pm_max) values of PM2.5 were used as features.
Entire estimation steps for the activity-pattern recognition are summarized in Figure 2. We first took the median and maximum values of PM2.5 for the given training data. Then, we took logarithms for the four values (median and maximum values of PM2.5, temperature, and relative humidity for each corresponding activity time). The logarithm of values was purposely used, because the distribution of all four values were significantly different. Then, we estimated the activity pattern for training and test dataset using the decision tree algorithm. The training and test dataset were proportionally chosen. Lastly, we composed a confusion matrix to calculate the accuracy and the error rate of the estimation.
Figure 2. Flow chart for the estimation of activity patterns. Figure 2. Flow chart for the estimation of activity patterns.
Int. J. Environ. Res. Public Health 2020, 17, 6573 4 of 11
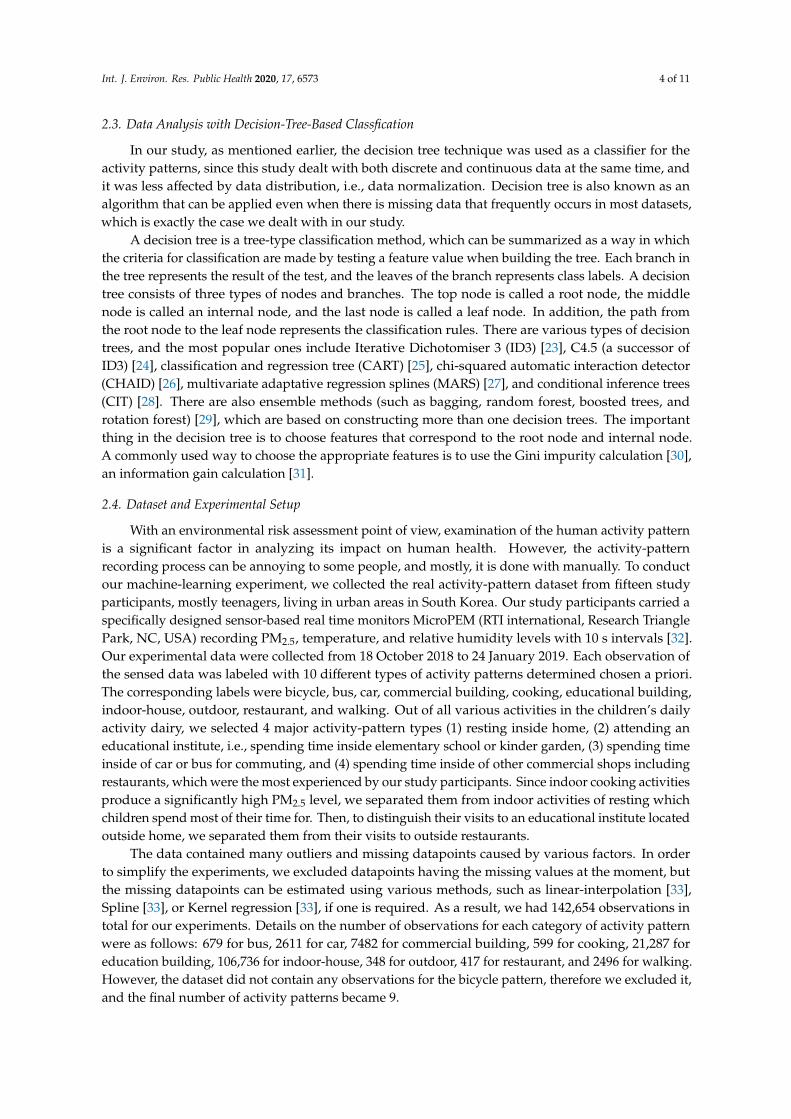
2.3. Data Analysis with Decision-Tree-Based Classfication
In our study, as mentioned earlier, the decision tree technique was used as a classifier for theactivity patterns, since this study dealt with both discrete and continuous data at the same time, andit was less affected by data distribution, i.e., data normalization. Decision tree is also known as analgorithm that can be applied even when there is missing data that frequently occurs in most datasets,which is exactly the case we dealt with in our study.
A decision tree is a tree-type classification method, which can be summarized as a way in whichthe criteria for classification are made by testing a feature value when building the tree. Each branch inthe tree represents the result of the test, and the leaves of the branch represents class labels. A decisiontree consists of three types of nodes and branches. The top node is called a root node, the middlenode is called an internal node, and the last node is called a leaf node. In addition, the path fromthe root node to the leaf node represents the classification rules. There are various types of decisiontrees, and the most popular ones include Iterative Dichotomiser 3 (ID3) [23], C4.5 (a successor ofID3) [24], classification and regression tree (CART) [25], chi-squared automatic interaction detector(CHAID) [26], multivariate adaptative regression splines (MARS) [27], and conditional inference trees(CIT) [28]. There are also ensemble methods (such as bagging, random forest, boosted trees, androtation forest) [29], which are based on constructing more than one decision trees. The importantthing in the decision tree is to choose features that correspond to the root node and internal node.A commonly used way to choose the appropriate features is to use the Gini impurity calculation [30],an information gain calculation [31].
2.4. Dataset and Experimental Setup
With an environmental risk assessment point of view, examination of the human activity patternis a significant factor in analyzing its impact on human health. However, the activity-patternrecording process can be annoying to some people, and mostly, it is done with manually. To conductour machine-learning experiment, we collected the real activity-pattern dataset from fifteen studyparticipants, mostly teenagers, living in urban areas in South Korea. Our study participants carried aspecifically designed sensor-based real time monitors MicroPEM (RTI international, Research TrianglePark, NC, USA) recording PM2.5, temperature, and relative humidity levels with 10 s intervals [32].Our experimental data were collected from 18 October 2018 to 24 January 2019. Each observation ofthe sensed data was labeled with 10 different types of activity patterns determined chosen a priori.The corresponding labels were bicycle, bus, car, commercial building, cooking, educational building,indoor-house, outdoor, restaurant, and walking. Out of all various activities in the children’s dailyactivity dairy, we selected 4 major activity-pattern types (1) resting inside home, (2) attending aneducational institute, i.e., spending time inside elementary school or kinder garden, (3) spending timeinside of car or bus for commuting, and (4) spending time inside of other commercial shops includingrestaurants, which were the most experienced by our study participants. Since indoor cooking activitiesproduce a significantly high PM2.5 level, we separated them from indoor activities of resting whichchildren spend most of their time for. Then, to distinguish their visits to an educational institute locatedoutside home, we separated them from their visits to outside restaurants.
The data contained many outliers and missing datapoints caused by various factors. In orderto simplify the experiments, we excluded datapoints having the missing values at the moment, butthe missing datapoints can be estimated using various methods, such as linear-interpolation [33],Spline [33], or Kernel regression [33], if one is required. As a result, we had 142,654 observations intotal for our experiments. Details on the number of observations for each category of activity patternwere as follows: 679 for bus, 2611 for car, 7482 for commercial building, 599 for cooking, 21,287 foreducation building, 106,736 for indoor-house, 348 for outdoor, 417 for restaurant, and 2496 for walking.However, the dataset did not contain any observations for the bicycle pattern, therefore we excluded it,and the final number of activity patterns became 9.
Int. J. Environ. Res. Public Health 2020, 17, 6573 5 of 11
We used the R open programming language (version 3.6.1) and R Studio (Boston, MA, U.S.A.) toanalyze the performance of the experiments, and R packages of stringr, dplyr and party were used toimplement the classifier and to calculate the error rates of classification results. The experiment wasdone on a computer with Microsoft Windows 10 (Microsoft Corporation, Redmond, WA, U.S.A.) andIntel® Core™ i7-6500U CPU at 2.60 GHz.
Table 1 summarizes the experimental environments including the type of classifier and Rpackages used.
Table 1. Experimental setup.
No. Contents Details
1 No. of activity patterns 92 No. of features 43 No. of observations 142,6544 Features to use Raw PM2.5, median and max of PM2.5, temperature, humidity5 Type of classifier decision tree6 Training to test data ratio 8:2 (with replacement)7 R packages Stringr, dplyr, party
3. Results
3.1. Features for Classification
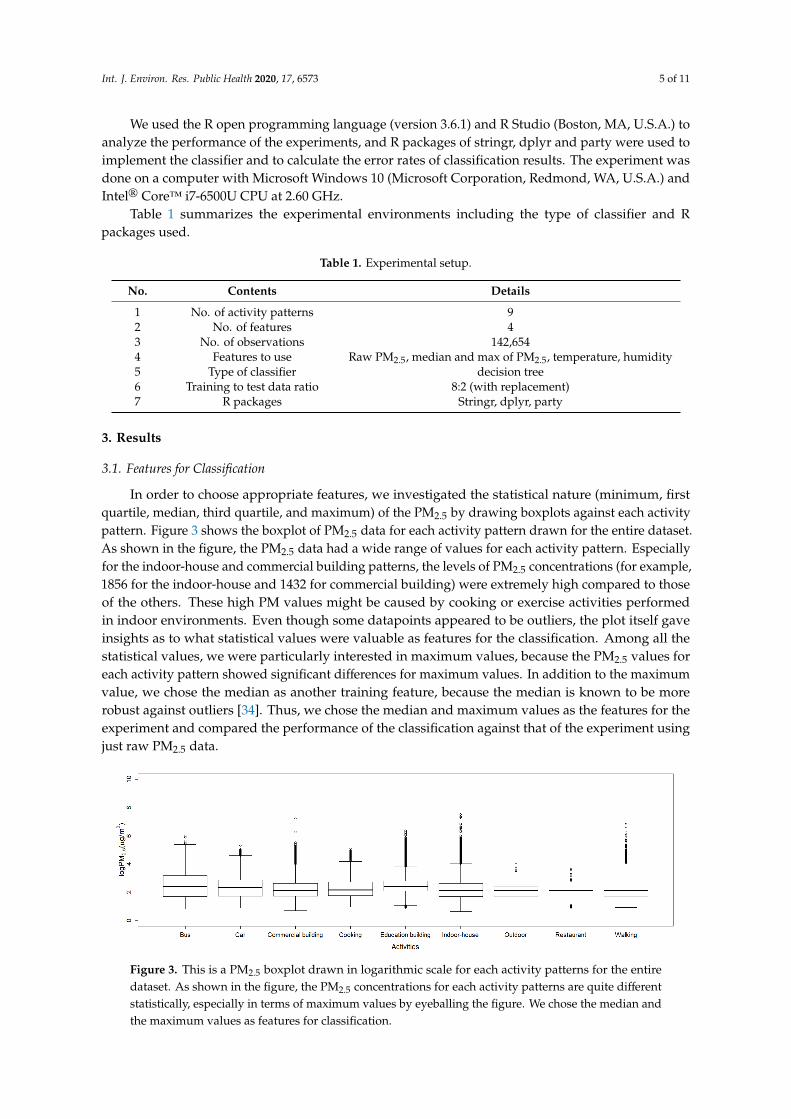
In order to choose appropriate features, we investigated the statistical nature (minimum, firstquartile, median, third quartile, and maximum) of the PM2.5 by drawing boxplots against each activitypattern. Figure 3 shows the boxplot of PM2.5 data for each activity pattern drawn for the entire dataset.As shown in the figure, the PM2.5 data had a wide range of values for each activity pattern. Especiallyfor the indoor-house and commercial building patterns, the levels of PM2.5 concentrations (for example,1856 for the indoor-house and 1432 for commercial building) were extremely high compared to thoseof the others. These high PM values might be caused by cooking or exercise activities performedin indoor environments. Even though some datapoints appeared to be outliers, the plot itself gaveinsights as to what statistical values were valuable as features for the classification. Among all thestatistical values, we were particularly interested in maximum values, because the PM2.5 values foreach activity pattern showed significant differences for maximum values. In addition to the maximumvalue, we chose the median as another training feature, because the median is known to be morerobust against outliers [34]. Thus, we chose the median and maximum values as the features for theexperiment and compared the performance of the classification against that of the experiment usingjust raw PM2.5 data.
Int. J. Environ. Res. Public Health 2020, 17, x 5 of 12
to implement the classifier and to calculate the error rates of classification results. The experiment was done on a computer with Microsoft Windows 10 (Microsoft Corporation, Redmond, WA, U.S.A.) and Intel® Core™ i7-6500U CPU at 2.60 GHz.
Table 1 summarizes the experimental environments including the type of classifier and R packages used.
Table 1. Experimental setup.
No. Contents Details 1 No. of activity patterns 9 2 No. of features 4 3 No. of observations 142,654 4 Features to use Raw PM2.5, median and max of PM2.5, temperature, humidity 5 Type of classifier decision tree 6 Training to test data ratio 8:2 (with replacement) 7 R packages Stringr, dplyr, party
3. Results
3.1. Features for Classification
In order to choose appropriate features, we investigated the statistical nature (minimum, first quartile, median, third quartile, and maximum) of the PM2.5 by drawing boxplots against each activity pattern. Figure 3 shows the boxplot of PM2.5 data for each activity pattern drawn for the entire dataset. As shown in the figure, the PM2.5 data had a wide range of values for each activity pattern. Especially for the indoor-house and commercial building patterns, the levels of PM2.5 concentrations (for example, 1856 for the indoor-house and 1432 for commercial building) were extremely high compared to those of the others. These high PM values might be caused by cooking or exercise activities performed in indoor environments. Even though some datapoints appeared to be outliers, the plot itself gave insights as to what statistical values were valuable as features for the classification. Among all the statistical values, we were particularly interested in maximum values, because the PM2.5 values for each activity pattern showed significant differences for maximum values. In addition to the maximum value, we chose the median as another training feature, because the median is known to be more robust against outliers [34]. Thus, we chose the median and maximum values as the features for the experiment and compared the performance of the classification against that of the experiment using just raw PM2.5 data.
Figure 3. This is a PM2.5 boxplot drawn in logarithmic scale for each activity patterns for the entire dataset. As shown in the figure, the PM2.5 concentrations for each activity patterns are quite different statistically, especially in terms of maximum values by eyeballing the figure. We chose the median and the maximum values as features for classification.
Figure 3. This is a PM2.5 boxplot drawn in logarithmic scale for each activity patterns for the entiredataset. As shown in the figure, the PM2.5 concentrations for each activity patterns are quite differentstatistically, especially in terms of maximum values by eyeballing the figure. We chose the median andthe maximum values as features for classification.
Int. J. Environ. Res. Public Health 2020, 17, 6573 6 of 11
3.2. Logarithmic Transformation of Data
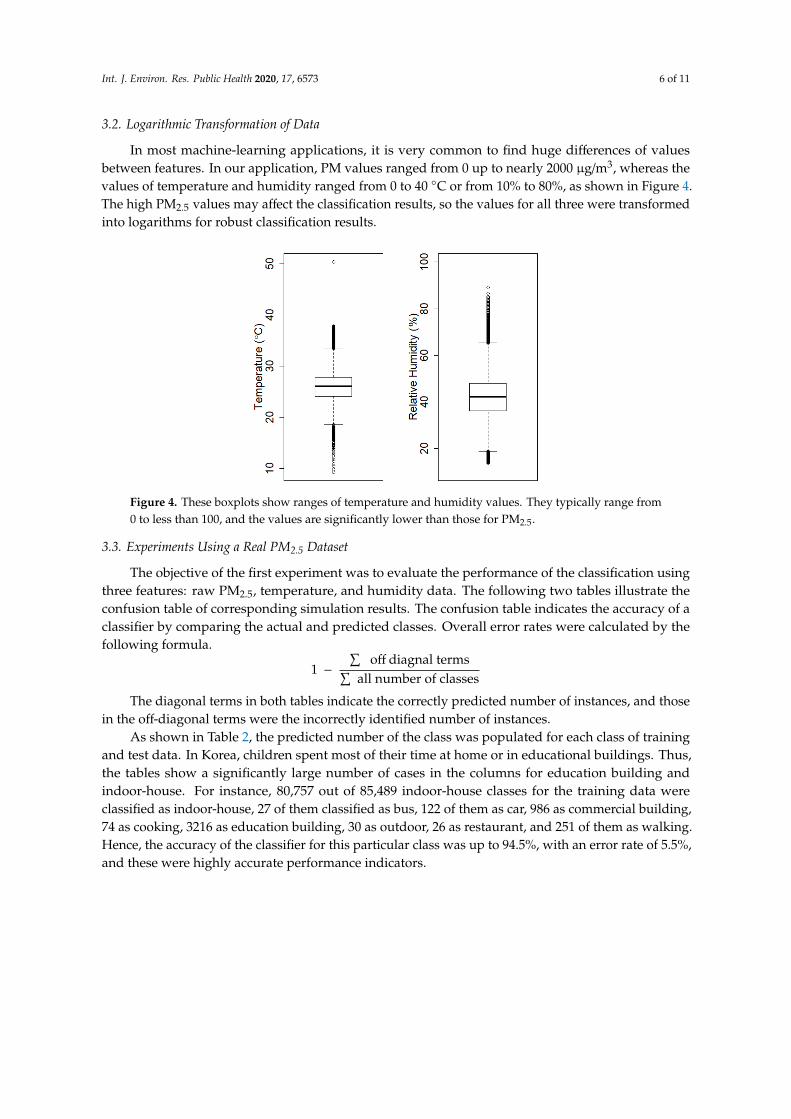
In most machine-learning applications, it is very common to find huge differences of valuesbetween features. In our application, PM values ranged from 0 up to nearly 2000 µg/m3, whereas thevalues of temperature and humidity ranged from 0 to 40 ◦C or from 10% to 80%, as shown in Figure 4.The high PM2.5 values may affect the classification results, so the values for all three were transformedinto logarithms for robust classification results.
Int. J. Environ. Res. Public Health 2020, 17, x 6 of 12
3.2. Logarithmic Transformation of Data
In most machine-learning applications, it is very common to find huge differences of values between features. In our application, PM values ranged from 0 up to nearly 2000 μg/m3, whereas the values of temperature and humidity ranged from 0 to 40 °C or from 10% to 80%, as shown in Figure 4. The high PM2.5 values may affect the classification results, so the values for all three were transformed into logarithms for robust classification results.
Figure 4. These boxplots show ranges of temperature and humidity values. They typically range from 0 to less than 100, and the values are significantly lower than those for PM2.5.
3.3. Experiments Using a Real PM2.5 Dataset
The objective of the first experiment was to evaluate the performance of the classification using three features: raw PM2.5, temperature, and humidity data. The following two tables illustrate the confusion table of corresponding simulation results. The confusion table indicates the accuracy of a classifier by comparing the actual and predicted classes. Overall error rates were calculated by the following formula. 1 − ∑ off diagnal terms∑ all number of classes
The diagonal terms in both tables indicate the correctly predicted number of instances, and those in the off-diagonal terms were the incorrectly identified number of instances.
As shown in Table 2, the predicted number of the class was populated for each class of training and test data. In Korea, children spent most of their time at home or in educational buildings. Thus, the tables show a significantly large number of cases in the columns for education building and indoor-house. For instance, 80,757 out of 85,489 indoor-house classes for the training data were classified as indoor-house, 27 of them classified as bus, 122 of them as car, 986 as commercial building, 74 as cooking, 3216 as education building, 30 as outdoor, 26 as restaurant, and 251 of them as walking. Hence, the accuracy of the classifier for this particular class was up to 94.5%, with an error rate of 5.5%, and these were highly accurate performance indicators.
Figure 4. These boxplots show ranges of temperature and humidity values. They typically range from0 to less than 100, and the values are significantly lower than those for PM2.5.
3.3. Experiments Using a Real PM2.5 Dataset
The objective of the first experiment was to evaluate the performance of the classification usingthree features: raw PM2.5, temperature, and humidity data. The following two tables illustrate theconfusion table of corresponding simulation results. The confusion table indicates the accuracy of aclassifier by comparing the actual and predicted classes. Overall error rates were calculated by thefollowing formula.
1 −∑
off diagnal terms∑all number of classes
The diagonal terms in both tables indicate the correctly predicted number of instances, and thosein the off-diagonal terms were the incorrectly identified number of instances.
As shown in Table 2, the predicted number of the class was populated for each class of trainingand test data. In Korea, children spent most of their time at home or in educational buildings. Thus,the tables show a significantly large number of cases in the columns for education building andindoor-house. For instance, 80,757 out of 85,489 indoor-house classes for the training data wereclassified as indoor-house, 27 of them classified as bus, 122 of them as car, 986 as commercial building,74 as cooking, 3216 as education building, 30 as outdoor, 26 as restaurant, and 251 of them as walking.Hence, the accuracy of the classifier for this particular class was up to 94.5%, with an error rate of 5.5%,and these were highly accurate performance indicators.

Int. J. Environ. Res. Public Health 2020, 17, 6573 7 of 11
Table 2. Confusion table for training data simulation using raw dataset.
PredictedActual
Bus Car CommercialBuilding Cooking Education
Building Indoor-House Outdoor Restaurant Walking Total
Bus 89 1 19 0 7 27 0 0 4 147
Car 1 540 114 1 62 122 0 6 4 850
Commercialbuilding 54 115 3194 8 243 986 0 3 149 4752
Cooking 0 1 5 184 19 74 1 0 3 287
Educationbuilding 69 397 291 33 9954 3216 25 4 249 14,238
Indoor-house 310 1036 2301 253 6687 80,757 216 106 1119 92,785
Outdoor 0 1 7 0 7 30 39 0 3 87
Restaurant 0 1 20 0 0 26 0 219 4 270
Walking 13 6 34 0 56 251 0 0 529 889
Total 536 2098 5985 479 17,035 85,489 281 338 2064 114,305
Similar classification accuracy was made for the 20% test data, and the corresponding results aregiven in Table 3. Similarly, for the indoor-house case, 19,905 out of 21,247 indoor-house classes forthe test data were classified as indoor-house, 15 of them classified as bus, 53 of them as car, 258 ascommercial building, 25 as cooking, 908 as education building, 7 as outdoor, 12 as restaurant, and 64of them as walking. Hence, the accuracy of the classifier for this particular class was 93.7%, with anerror rate of 6.3%, and these were also highly accurate performance indicators. Classification results inTables 2 and 3 indicate that the overall estimation error for the training dataset was 0.16%, and that ofthe test dataset was 0.18%.
Table 3. Confusion table for test data simulation using raw dataset.
PredictedActual
Bus Car CommercialBuilding Cooking Education
Building Indoor-House Outdoor Restaurant Walking Total
Bus 13 0 0 0 6 15 0 0 0 34
Car 1 109 43 0 17 53 0 1 0 224
Commercialbuilding 9 28 732 6 67 258 0 2 30 1132
Cooking 0 0 1 31 13 25 0 0 0 70
Education building 16 89 94 8 2300 908 3 1 48 3467
Indoor-house 94 286 606 75 1835 19,905 53 25 254 23,133
Outdoor 0 0 3 0 3 7 11 0 0 24
Restaurant 0 0 7 0 0 12 0 50 0 69
Walking 10 1 11 0 11 64 0 0 99 196
Total 143 513 1497 120 4252 21,247 67 79 431 28,349
3.4. Experiments Using Statistical PM2.5 Dataset
In the previous experiment, the raw PM2.5 data were used for the prediction of activities.In this experiment set, we strive to demonstrate the performance of classifiers using statistical data.As demonstrated in Figure 3, PM concentrations for each activity show significant differences, which isespecially noticeable in the maximum values, so we chose the maximum as one feature. In addition,we chose the median as another feature based on the explanation given before. This set of experimentsdemonstrated the performance of classification using these two statistical features.
Table 4 shows the prediction results for the training data where prediction results could reach upto almost 100% except for the indoor-house case. The overall estimation error was less than 0.02%,which was more than a 90% improvement over the previous experiment.

Int. J. Environ. Res. Public Health 2020, 17, 6573 8 of 11
Table 4. Confusion table for training data simulation using statistical dataset.
PredictedActual
Bus Car CommercialBuilding Cooking Education
Building Indoor-House Outdoor Restaurant Walking Total
Bus 536 0 0 0 0 0 0 0 0 536
Car 0 2098 0 0 0 0 0 0 0 2098
Commercialbuilding 0 0 5985 0 0 1 0 0 0 5986
Cooking 0 0 0 479 0 0 0 0 0 479
Education building 0 0 0 0 17,035 0 0 0 0 17,035
Indoor-house 0 0 0 0 0 85,488 0 0 0 85,488
Outdoor 0 0 0 0 0 0 281 0 0 281
Restaurant 0 0 0 0 0 0 0 338 0 338
Walking 0 0 0 0 0 0 0 0 2064 2064
Total 536 2098 5985 479 17,035 85,489 281 338 2064 114,305
Similarly, the prediction error for the test data was also very low, as shown in Table 5, which is lessthan 0.02%. All nine cases had very accurate estimation results except for the bus and indoor-housecases, where only one and two observations were estimated in error. These results indicated that thechosen statistical features could be effectively used for the prediction of activity-pattern classification.
Table 5. Confusion table for test data simulation using statistical dataset.
PredictedActual
Bus Car CommercialBuilding Cooking Education
Building Indoor-House Outdoor Restaurant Walking Total
Bus 142 0 0 0 0 0 0 0 0 142
Car 0 513 0 0 0 0 0 0 0 513
Commercialbuilding 0 0 1497 0 0 2 0 0 0 1499
Cooking 0 0 0 120 0 0 0 0 0 120
Education building 0 0 0 0 4252 0 0 0 0 4252
Indoor-house 1 0 0 0 0 21,245 0 0 0 21,246
Outdoor 0 0 0 0 0 0 67 0 0 67
Restaurant 0 0 0 0 0 0 0 79 0 79
Walking 0 0 0 0 0 0 0 0 431 431
Total 143 513 1497 120 4252 21,247 67 79 431 28,349
4. Discussion
Along with massive distribution of smartphones, various research has been conducted forrecognizing human activity patterns using the smartphones, mostly from computer science parties.Such work can be classified according to the method of data acquisition, data-collection frequency,position of the smartphone in a human body, domains of feature representation, features for the chosendomain, and recognition algorithm used [3]. The method of data acquisition is categorized accordingto whether the data are obtained from natural human or artificial movement. The data- collectioncycle refers to the operating frequency of used sensors. The position of the smartphone refers to howthe smartphone is worn at the time of data acquisition. A feature point is a representative value thatcharacterizes data, and data acquisition is usually done at the time or frequency domain. In eachdomain, the desired feature is extracted in an appropriate manner. Recognition algorithms are used forrecognition or classification purposes, and they include classical machine-learning-based algorithmsand modern deep-learning-based algorithms.
Like most human activity-pattern research, this paper attempted to recognize the activity patternsof children in very limited scenarios, where the classification was done only for the data collected inadvance. Unlike most related research associated with acquiring training data for activity-patternrecognition [5,35], we aim to relieve the inconvenience of manual handwriting work.
Int. J. Environ. Res. Public Health 2020, 17, 6573 9 of 11
This manual work may sometimes result in unexpected errors or make them feel annoyed.These reasons can hinder the entire data-collection process from the beginning. Therefore, it is worthdeveloping automatic classification technology to alleviate the manual-setting burden of the targetperson and thereby achieve errorless high-quality training data. Through our study, we proposed anidea to overcome the problems and showed that it was possible to achieve highly accurate estimates ofactivity patterns by transforming data based on their statistical features.
However, our study still has some drawbacks that need to be addressed. First, the proposed ideashould be improved to be fitted with real-time observation scenarios. With our current methodology, astudy participant needed to mark the beginning of every different activity pattern. Although it was alot of improvement from the previous way, it may still need further improvement using information oflongitude and latitude. Second, our approach worked in the set of selected activity-pattern scenariosin the current version. As a part of the whole of project, we thought that it might be possible toestimate the activity pattern using the PM2.5, temperature, and relative humidity values without usingthe acceleration information. However, in the future study, we may conduct a study comparing theimprovement of the prediction accuracy with the measurement of acceleration and that without theinformation of acceleration.
When we conducted our modeling, six different combinations of variable sets were applied intothe model. First, we ran our model with variables of (1) medians of temperature (Temp) and relativehumidity (RH) over each children’s corresponding activities. Then, with a similar way, we simulatedour modeling with variables of (2) medians of PM2.5 and Temp followed by (3) medians of PM2.5 andRH; (4) maximum of PM2.5 and medians of Temp and RH; (5) median of PM2.5 and medians of Tempand RH; (6) maximum PM2.5, median PM2.5, and medians of Temp and RH over their activity periods,respectively. From a result of our simulation, we found that the modeling with variable combinationsof (1), (2), and (3) had error rates of nearly 20%, those of (4) and (5) had around 0.1%, but the lastcombination showed a significantly lower error rate, compared to the other combinations, which is farless than 0.1%. Thus, we chose the last variable combination as our final simulation. We will extractoptimal features using an ensemble classifier in our next future study. Although, at the present stage,this study dealt with selected activity patterns, and there was the classification of activity patterns,manually examined, the current version of the idea can still be applicable to environmental healthstudy conducted with children.
There is no machine-learning technique that yields the best classification in all scenarios asmentioned by Amancio et al. [36] and Tantithanmthavorn et al. [37]. However, in this study, we useddecision tree because of the characteristics of our database composed of both discrete (handwritingdaily activity pattern and its corresponding starting time) and continuous data (temperature, relativehumidity, and PM2.5) at the same time. Decision tree is known as an algorithm that can be applied tosuch cases, and it is useful even when there is missing data that frequently occurs in most dataset,which is exactly the case we dealt with in our study. We are planning to implement ensemble classifiersin our future study to find the most appropriate features with a bigger dataset, because the ensembleclassifiers require several key parameters, such as the number for trees and relatively enough numberof variables randomly sampled at each node split. These parameters will be chosen carefully, becauseit determines the performance of the classifiers, as pointed out by previous studies [36,37].
5. Conclusions
In this study, to solve the inconvenience of direct handwriting of activity patterns with a diary,we proposed a methodology that could determine the activity pattern through machine-learningtechnologies with data transformation. We observed that both training and test data were found tohave an accuracy of more than 90%. We believe that this method can alleviate the annoyance thatpeople may feel when they are asked to collect their activity-pattern data using a diary in the field andmay be used effectively in data-collection tasks. In a future upcoming study, we may further validate

Int. J. Environ. Res. Public Health 2020, 17, 6573 10 of 11
our current algorithm using other study population’s activity patterns, which we did not include inthis version of study.
Author Contributions: Conceptualization, J.P. and S.K.; methodology, J.P. and S.K.; software, J.P.; validation, J.P.and S.K.; data analysis, J.P. and S.K.; resources, J.P. and S.K; data curation, J.P. and S.K.; writing—review andediting, J.P. and S.K.; visualization, J.P.; project administration, S.K.; funding acquisition, S.K. All authors haveread and agreed to the published version of the manuscript.
Funding: This study was funded by Environmental Health Research Center Project (2019000160005) by KoreaEnvironmental Industry and Technology Institute, Ministry of Environment, South Korea.
Acknowledgments: Authors thank study participants and their parents. This study was supported by theSoonchunhyang University Research Fund and the Brain Korea (BK) 21 (Big Data Analytics for Air Pollution andHealth, ICT Environmental Health System, Graduate School, Soonchunhyang University).
Conflicts of Interest: The authors declare no conflict of interest.
References
1. Klepeis, N.E.; Nelson, W.C.; Ott, W.R.; Robinson, J.P.; Tsang, A.M.; Switzer, P.; Behar, J.V.; Hern, S.C.;Engelmann, W.H. The National Human Activity Pattern Survey (NHAPS): A resource for assessing exposureto environmental pollutants. J. Expo. Sci. Environ. Epidemiol. 2001, 11, 231–252. [CrossRef] [PubMed]
2. Dong, J.; Zhang, S.; Xia, L.; Yu, Y.; Hu, S.; Sun, J.; Zhou, P.; Chen, P. Physical activity, a critical exposurefactor of environmental pollution in children and adolescents health risk assessment. Int. J. Environ. Res.Public Health 2018, 15, 176. [CrossRef]
3. Lima, W.S.; Souto, E.; El-Khatib, K.; Jalali, R.; Gama, J. Human activity recognition using inertial sensors in asmartphone: An overview. Sensors 2019, 19, 3213. [CrossRef] [PubMed]
4. Ehatisham-Ul-Haq, M.; Azam, M.A. Opportunistic sensing for inferring in-the-wild human contexts basedon activity pattern recognition using smart computing. Future. Gener. Comput. Syst. 2020, 106, 374–392.[CrossRef]
5. Pires, I.M.; Marques, G.; Garcia, N.M.; Flórez-Revuelta, F.; Teixeira, M.C.; Zdravevski, E.; Spinsante, S.;Coimbra, M.T. Pattern recognition techniques for the identification of activities of daily living using a mobiledevice accelerometer. Electronics 2020, 9, 509. [CrossRef]
6. Khan, A.M.; Tufail, A.; Khattak, A.M.; Laine, T.H. Activity recognition on smartphones via sensor-fusion andKDA-Based SVMs. Int. J. Distrib. Sens. Netw. 2014, 10, 1–16. [CrossRef]
7. Reddy, S.; Mun, M.; Burke, J.; Estrin, D.; Hansen, M.; Srivastava, M. Using mobile phones to determinetransportation modes. ACM Trans. Sens. Netw. 2010, 6, 1–27. [CrossRef]
8. Martín, H.; Bernardos, A.M.; Iglesias, J.; Casar, J.R. Activity logging using lightweight classification techniquesin mobile devices. Pers. Ubiquitous Comput. 2012, 17, 675–695. [CrossRef]
9. Das, B.; Seelye, A.M.; Thomas, B.L.; Cook, D.J.; Holder, L.B.; Schmitter-Edgecombe, M. Using smartphones for context-aware prompting in smart environments. In Proceedings of the 2012 IEEE ConsumerCommunications and Networking Conference (CCNC), Las Vegas, NV, USA, 14–17 January 2012; pp. 399–403.
10. Zheng, Y.; Liu, Q.; Chen, E.; Ge, Y.; Zhao, J.L. Time series classification using multi-channels deep convolutionalneural networks. In Proceedings of the Conference on Web-Age Information Management, Macau, China,16–18 June 2014; Springer: Cham, Switzerland, 2014; pp. 298–310.
11. Ordóñez, F.J.; Roggen, D. Deep convolutional and LSTM recurrent neural networks for multimodal wearableactivity recognition. Sensors 2016, 16, 115. [CrossRef]
12. Liu, C.; Zhang, L.; Liu, Z.; Liu, K.; Li, X.; Liu, Y. Lasagna: Towards deep hierarchical understanding andsearching over mobile sensing data. In Proceedings of the 22nd Annual International Conference on MobileComputing and Networking, New York, NY, USA, 3–7 October 2016; pp. 334–347.
13. Li, F.; Shirahama, K.; Nisar, M.A.; Koping, L.; Grzegorzek, M.; Li, F. Comparison of feature learning methodsfor human activity recognition using wearable sensors. Sensors 2018, 18, 679. [CrossRef]
14. Almaslukh, B.; Almuhtadi, J.; Artoli, A. An effective deep autoencoder approach for online smartphone-basedhuman activity recognition. Int. J. Comput. Sci. Netw. Secur. 2017, 17, 160–165.
15. Alsheikh, M.A.; Selim, A.; Niyato, D.; Doyle, L.; Lin, S.; Tan, H.P. Deep activity recognition models withtriaxial accelerometers. In Proceedings of the Workshops of the Thirtieth AAAI Conference on ArtificialIntelligence, Phoenix, AZ, USA, 12–13 February 2016; pp. 8–13.
Int. J. Environ. Res. Public Health 2020, 17, 6573 11 of 11
16. Hafezi, M.H.; Liu, L.; Millward, H. A time-use activity-pattern recognition model for activity-based traveldemand modeling. Transportation 2017, 46, 1369–1394. [CrossRef]
17. Rasouli, S.; Timmermans, H. Activity-based models of travel demand: Promises, progress and prospects.Int. J. Urban Sci. 2013, 18, 31–60. [CrossRef]
18. Wu, Y.; Song, G. The impact of activity-based mobility pattern on assessing fine-grained traffic-induced airpollution exposure. Int. J. Environ. Res. Public Health 2019, 16, 3291. [CrossRef] [PubMed]
19. Park, S.-H.; Ihm, S.-Y.; Park, Y.-H.; Lee, W.; Choi, W.; Jung, S.; Song, M. A study on adjustable dissimilaritymeasure for efficient piano learning. In Proceedings of the 7th International Conference on EmergingDatabases, Busan, Korea, 14 October 2017; pp. 111–118.
20. Sajid, S.; Von Zernichow, B.M.; Soylu, A.; Roman, D. Predictive data transformation suggestions in grafterizerusing machine learning. In Proceedings of the 13th International Conference MTSR 2019, Rome, Italy,28–31 October 2019; pp. 137–149.
21. Narita, M.; Igarashi, T. Programming-by-example for data transformation to improve machine learningperformance. In Proceedings of the IUI 2019, Los Angeles, CA, USA, 17–20 March 2019.
22. Jin, Z.; Anderson, M.R.; Cafarella, M.; Jagadish, H.V. Foofah: A programming-by-example system forsynthesizing data transformation programs. In Proceedings of the 2017 ACM International Conference onManagement of Data, Chicago, IL, USA, 14–19 May 2017. [CrossRef]
23. Utgoff, P.E. Incremental induction of decision trees. Mach. Learn. 1989, 4, 161–186. [CrossRef]24. Quinlan, J.R. C4.5: Programs for Machine Learning; Morgan Kaufmann: Burlington, MA, USA, 1993.25. Gordon, A.D.; Breiman, L.; Friedman, J.H.; Olshen, R.A.; Stone, C.J. Classification and Regression Trees;
Chapman & Hall/CRC: New York, NY, USA, 1984.26. Chi-Square Automatic Interaction Detection. Available online: https://en.wikipedia.org/wiki/Chi-square_
automatic_interaction_detection (accessed on 17 March 2020).27. Friedman, J.H. Multivariate adaptive regression splines. Ann. Stat. 1991, 19, 1–67. [CrossRef]28. Hothorn, T.; Hornik, K.; Zeileis, A. Ctree: Conditional Inference Trees. The Comprehensive R Archive
Network. 2015. Available online: https://cran.r-project.org/web/packages/partykit/vignettes/ctree.pdf(accessed on 17 March 2020).
29. Decision Tree Ensembles—Bagging and Boosting. Available online: https://towardsdatascience.com/decision-tree-ensembles-bagging-and-boosting-266a8ba60fd9 (accessed on 17 March 2020).
30. Tutorial The Gini Impurity Index and What It Means and How to Calculate It. Availableonline: https://www.researchgate.net/publication/327110793_Tutorial_The_Gini_Impurity_index_and_what_it_means_and_how_to_calculate_it (accessed on 17 March 2020).
31. A Simple Explanation of Information Gain and Entropy. Available online: https://victorzhou.com/blog/
information-gain/ (accessed on 17 March 2020).32. Woo, J.; Rudasingwa, G.; Kim, S.R. Assessment of daily personal PM2.5 exposure level according to four
major activities among children. Appl. Sci. 2019, 10, 159. [CrossRef]33. Park, J.; Kim, S.R. Improved interpolation and anomaly detection for personal PM2.5 measurement. Appl.
Sci. 2020, 10, 543. [CrossRef]34. Rousseeuw, P.; Hubert, M. Robust statistics for outlier detection. WIREs Data Min. Knowl. Discov. 2011, 1,
73–79. [CrossRef]35. Hussain, G.; Maheshwari, M.K.; Memon, M.L.; Jabbar, M.S.; Khan, M.K.J. A CNN based automated activity
and food recognition using wearable sensor for preventive healthcare. Electronics 2019, 8, 1425. [CrossRef]36. Amancio, D.R.; Comin, C.H.; Casanova, D.; Travieso, G.; Bruno, O.M.; Rodrigues, F.A.; Costa, L.D.F. A
systematic comparison of supervised classifiers. PLoS ONE 2014, 9, e94137. [CrossRef] [PubMed]37. Tantithamthavorn, C.; McIntosh, S.; Hassan, A.E.; Matsumoto, K. Automated parameter optimization of
classification techniques for defect prediction models. In Proceedings of the ICSE’16, Austin, TX, USA, 14–22May 2016; Volume 16, pp. 321–332. [CrossRef]
© 2020 by the authors. Licensee MDPI, Basel, Switzerland. This article is an open accessarticle distributed under the terms and conditions of the Creative Commons Attribution(CC BY) license (http://creativecommons.org/licenses/by/4.0/).