pattern classification and evaluating
DESCRIPTION
Pattern Classification and Evaluating. Contents. Introduction Pattern Recognition Pattern Classification Evaluating a pattern. What is Pattern Recognition?. The study of how machines can observe the environment, learn to distinguish patterns of interest from their background, and - PowerPoint PPT PresentationTRANSCRIPT
Pattern Classification and Evaluating
Contents Introduction Pattern Recognition Pattern Classification Evaluating a pattern
What is Pattern Recognition? The study of how machines can observe the
environment, learn to distinguish patterns of interest from their
background, and make sound and reasonable decisions about the
categories of the patterns.
What is a pattern? What kinds of category we have?
What is a Pattern? As opposite of a chaos; it is an entity, vaguely
defined, that could be given a name.
For example, a pattern could be A fingerprint images A handwritten cursive word A human face A speech signal
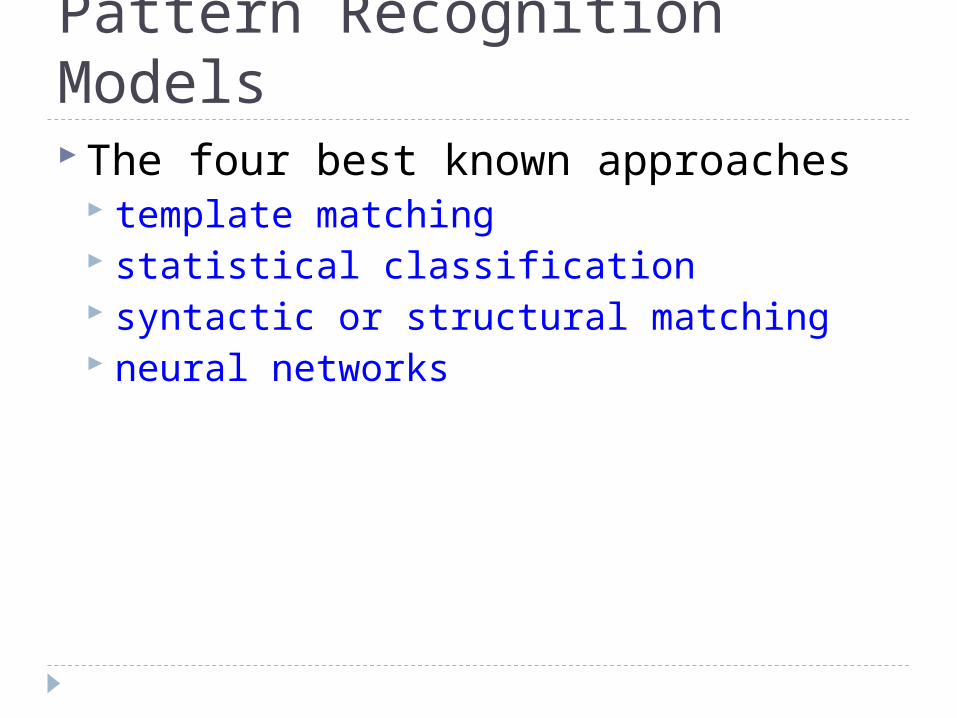
Pattern Recognition Models The four best known approaches
template matching statistical classification syntactic or structural matching neural networks
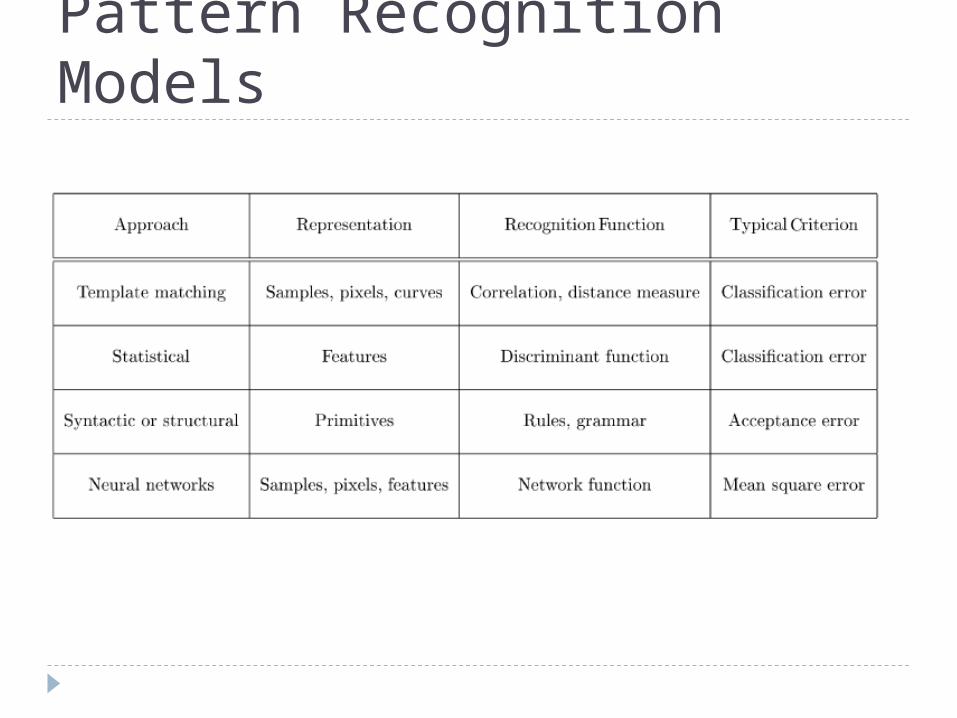
Pattern Recognition Models
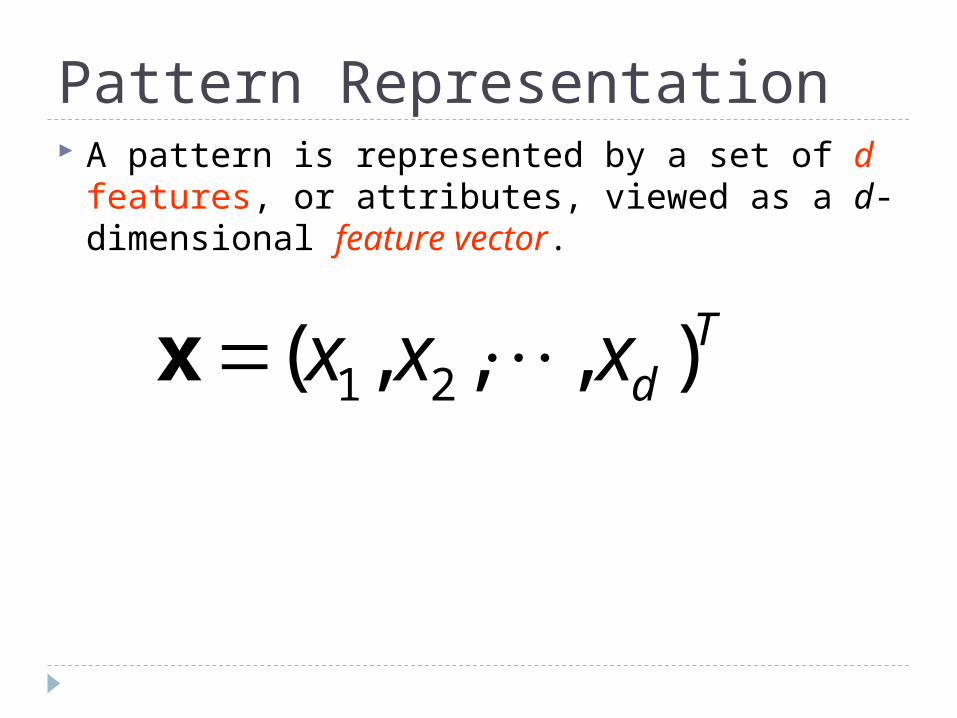
Pattern Representation A pattern is represented by a set of d features, or
attributes, viewed as a d-dimensional feature vector.
1 2( , , , )Tdx x xx
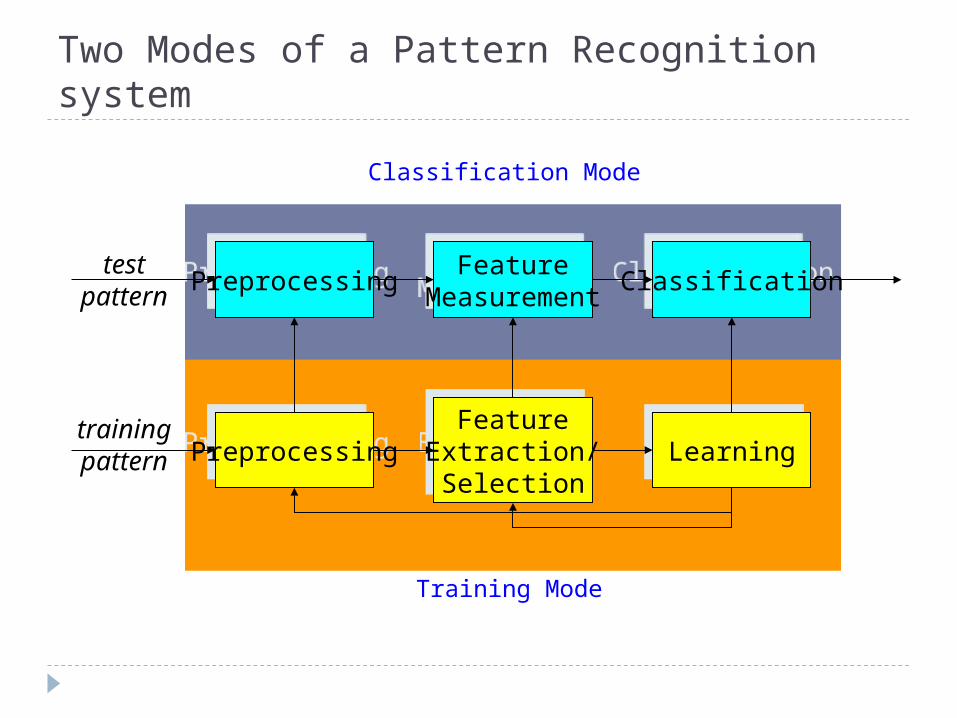
Two Modes of a Pattern Recognition system
PreprocessingPreprocessingFeature
MeasurementFeature
MeasurementClassificationClassification
testpattern
Classification Mode
PreprocessingPreprocessing
FeatureExtraction/Selection
FeatureExtraction/Selection
LearningLearningtrainingpattern
Training Mode
Pattern Classification Pattern classification involves taking features
extracted from the image and using them to classify image objects automatically.
This is done by developing classification algorithms that use the feature information.
The primary uses of pattern classification are for computer vision and image compression applications development.
Pattern Classification Pattern classification is typically the final step
in the development of a computer vision algorithm.
In computer vision applications, the goal is to identify objects in order for the computer to perform some vision-related task.
These tasks range from computer diagnosis of medical images to object classification for robot control.
Pattern Classification In image compression, we want to remove
redundant information from the image and compress the important information as much as possible.
One way to compress information is to find a higher-level representation of it, which is exactly what feature analysis and pattern classification is all about.
Pattern Classification To develop a classification algorithm, we need
to divide our data into two. Training set: To develop the classification scheme Test set: To test the classification algorithm
Both the training and the test sets should represent the images that will be seen in the application domain.
Pattern Classification Theoretically, a larger training set size would
give an increasingly higher success rate. However, since we normally have a finite
number of data (images), they are equally divided between the two sets.
After the data have been divided, work can begin on the development of the classification algorithm.
Figure 6.4.1
Pattern Classification The general approach is to use the
information in the training set to classify the “unknown” samples in test set.
It is assumed that all samples available have a known classification.
The success rate is measured by the number of correct classifications.
Pattern Classification The simplest method for identifying a sample
from the test set is called the nearest neighbor method.
The object of interest is compared to every sample in the training using either a distance measure, a similarity measure or a combination of measures.
Pattern Classification The “unknown” object is then identified as
belonging to the to the same class as the closest example in the training set. If distance measure is used, this is indicated by
the smallest number. If similarity measure is used, this is indicated by
the largest number. This process is computationally intensive and
not robust.
Pattern Classification We can make the nearest neighbor method
more robust by selecting not just the vector it is closest to, but a group of close feature vectors.
This method is known as K-nearest neighbor method. K can be assigned any integer.
Pattern Classification Then we assign the unknown feature vector to
the class that occurs most often in the set of K-neighbors.
This is still very computationally expensive since we must compare each unknown sample to every sample in the training set.
Even worse, we normally want the training set to be as large as possible.
Pattern Classification One way to reduce the amount of
computation is by using a method called nearest centroid.
Here, we find the centroid vector that is the representative of the whole class.
The centroids are calculated by finding the average value for each vector component in the training set.
Pattern Classification The unknown sample only needs to be
compared with the representative centroid. This would reduce the number of comparisons and
subsequently the amount of calculations. Template matching is a pattern classification
method that uses the raw image data as a feature vector.
Pattern Classification A template is devised, possibly via a training
set, which is then compared to subimages by using a distance or similarity measure.
Typically, a threshold is set on this measure to determine when we have found a match.
More sophisticated methods using fuzzy logic, artificial neural network, and probability density model are also commonly used.
Evaluating a pattern recognition system Recognition rate Cross validation Interpretation of the results
Recognition rate
In your system specifications you need success criteria for your project (product) HW, SW, Real-time, recognition rate,…
Recognition rate = (number of correct classified / number of tested samples) Multiply by 100% and you have it in percentages
How do you test a system? How do you present and interpret the
results?

Test
The training data contains variations Is this variation similar to the variations in ”real life data” ?
The system will never be better than the training data !
The right question to ask is how well the trained system generalizes That is, how well does the system recognize UNKNOWN data? NEVER TRAIN OF TEST DATA !!! However, it does provide an upper limit for the recognition
rate Test methods:
Cross-validation M-fold cross validation
Methods for test
Cross-validation Train on % of the samples () and test on the rest is typically 90, depending on the number of samples and
the complexity of the system M-fold cross validation
Divide (randomly) all samples in M equally sized groups Use M-1 groups to train the system and test on the rest Do this M times and average the results
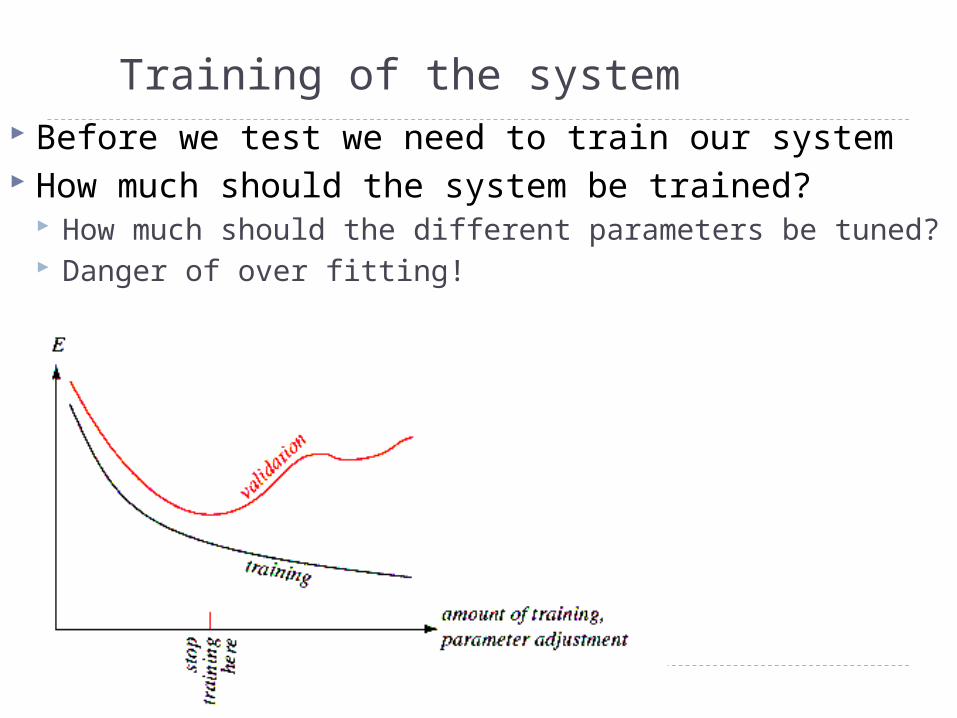
Training of the system Before we test we need to train our system How much should the system be trained?
How much should the different parameters be tuned? Danger of over fitting!
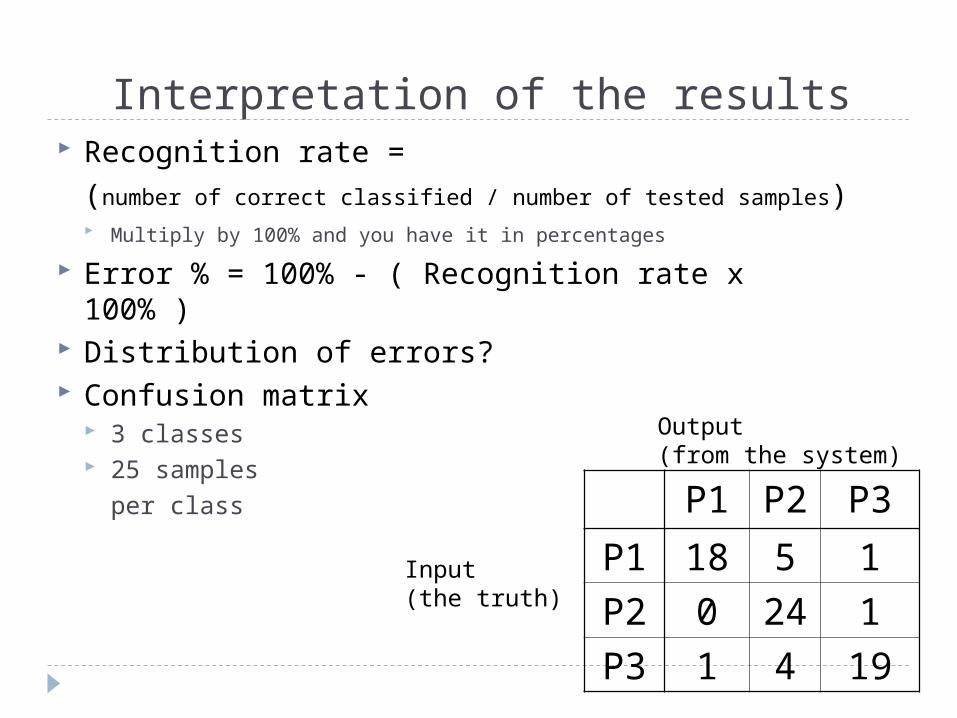
Interpretation of the results Recognition rate =
(number of correct classified / number of tested samples) Multiply by 100% and you have it in percentages
Error % = 100% - ( Recognition rate x 100% ) Distribution of errors? Confusion matrix
3 classes 25 samples
per class P1 P2 P3
P1 18 5 1
P2 0 24 1
P3 1 4 19
Input(the truth)
Output(from the system)
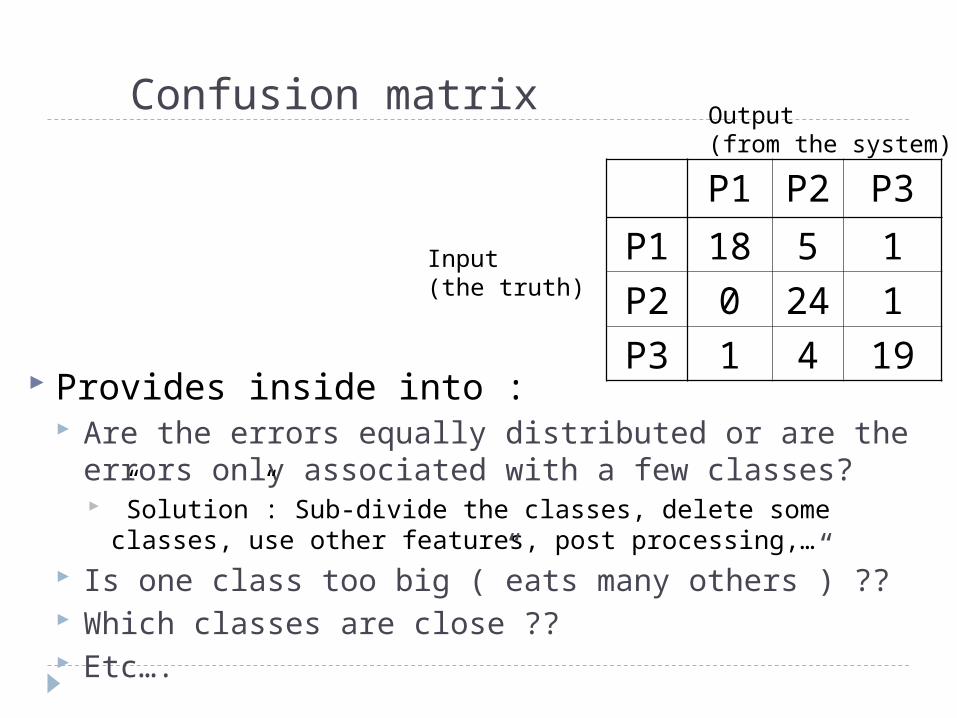
Confusion matrix
Provides inside into : Are the errors equally distributed or are the errors
only associated with a few classes? ”Solution”: Sub-divide the classes, delete some classes, use
other features, post processing,… Is one class too big (”eats many others”) ?? Which classes are close ?? Etc….
P1 P2 P3
P1 18 5 1
P2 0 24 1
P3 1 4 19
Input(the truth)
Output(from the system)
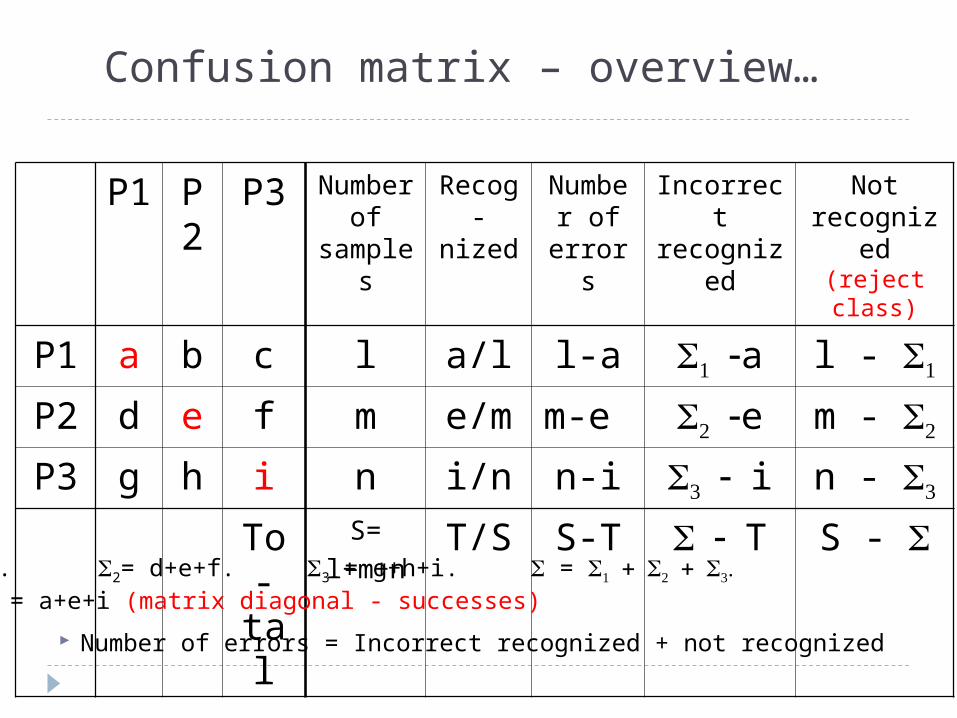
Confusion matrix – overview…
Number of errors = Incorrect recognized + not recognized
P1 P2
P3 Numberof
samples
Recog-nized
Number of
errors
Incorrect recognize
d
Not recognized (reject
class)
P1 a b c l a/l l-a a l -
P2 d e f m e/m m-e e m -
P3 g h i n i/n n-i i n -
To-tal
S=l+m+n
T/S S-T T S - 1 = a+b+c. 2= d+e+f. 3 = g+h+i. = T = Trace = a+e+i (matrix diagonal - successes)
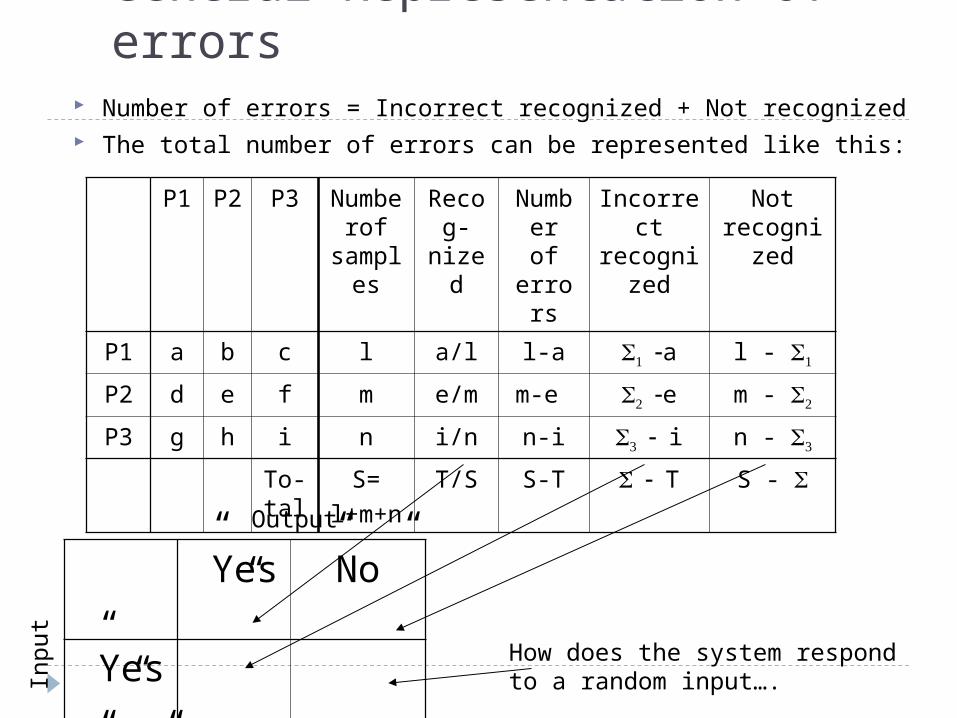
General Representation of errors Number of errors = Incorrect recognized + Not recognized The total number of errors can be represented like this:
P1 P2 P3 Numberof
samples
Recog-
nized
Number of error
s
Incorrect
recognized
Not recogniz
ed
P1 a b c l a/l l-a a l -
P2 d e f m e/m m-e e m -
P3 g h i n i/n n-i i n -
To-tal
S=l+m+
n
T/S S-T T S -
”Yes”
”No”
”Yes”
”No”
How does the system respond to a random input….
Output
Inpu
t
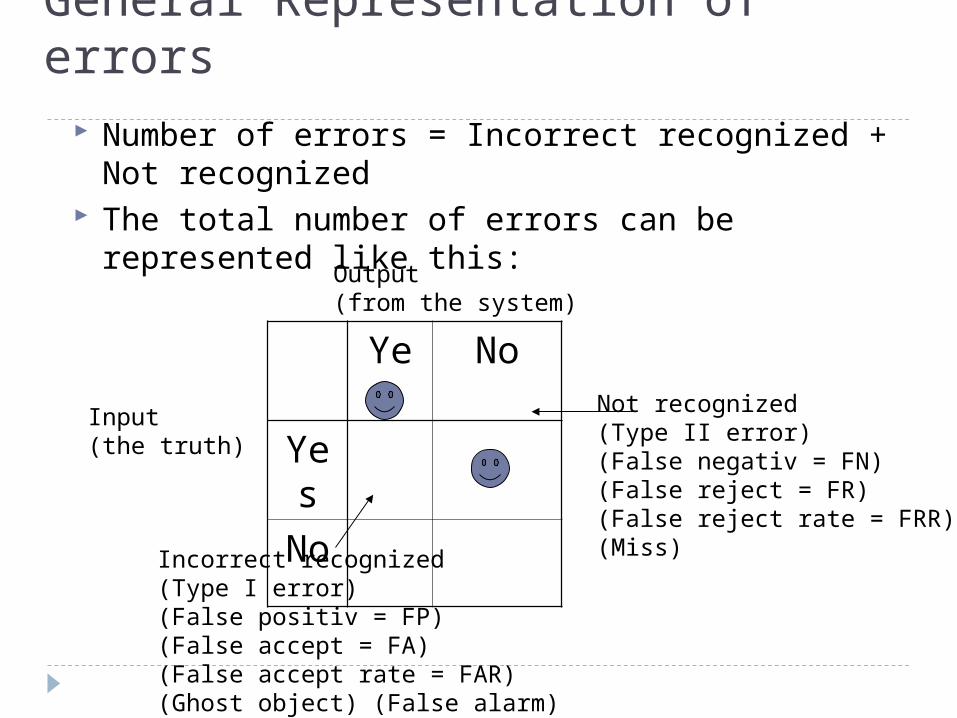
General Representation of errors Number of errors = Incorrect recognized + Not
recognized The total number of errors can be represented like
this:
Yes No
Yes
No
Input(the truth)
Output(from the system)
Incorrect recognized(Type I error)(False positiv = FP)(False accept = FA)(False accept rate = FAR)(Ghost object) (False alarm)
Not recognized(Type II error)(False negativ = FN)(False reject = FR)(False reject rate = FRR)(Miss)
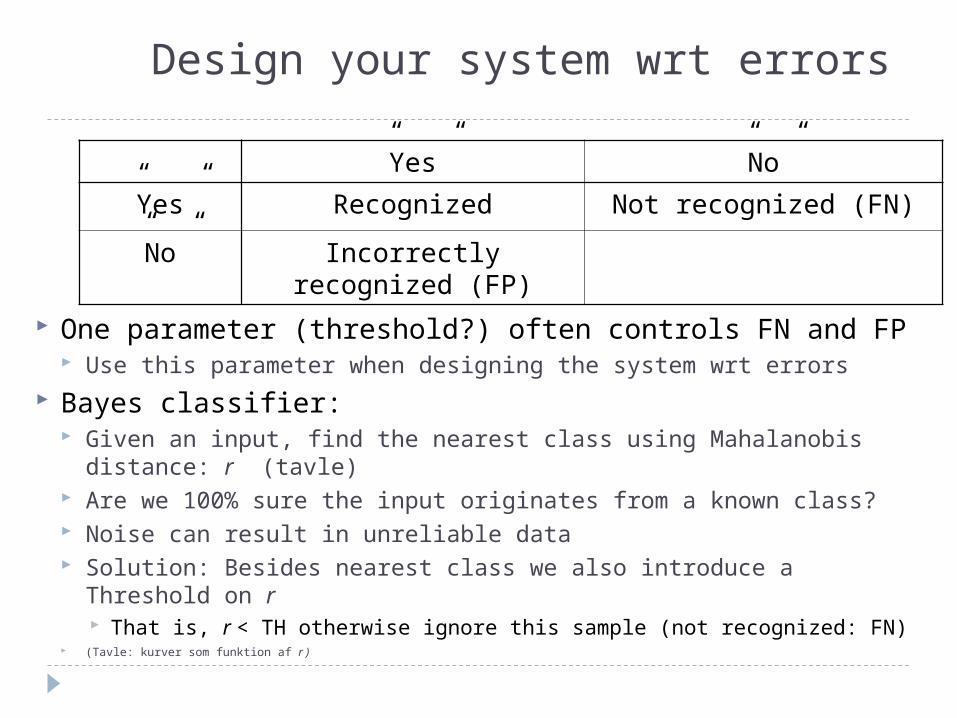
Design your system wrt errors
One parameter (threshold?) often controls FN and FP Use this parameter when designing the system wrt errors
Bayes classifier: Given an input, find the nearest class using Mahalanobis
distance: r (tavle) Are we 100% sure the input originates from a known class? Noise can result in unreliable data Solution: Besides nearest class we also introduce a Threshold
on r That is, r < TH otherwise ignore this sample (not recognized: FN)
(Tavle: kurver som funktion af r )
”Yes” ”No”
”Yes” Recognized Not recognized (FN)
”No” Incorrectly recognized (FP)
Design your system wrt errors Choice of TH: DEPENDS ON THE APPLICATION! Default: EER or overall minimum error If we want a low FP (incorrect recognized). This
results in more FN (not recognized) and you therefore need to post-process these samples
”Re-try” (as with conveyer belts) ”New” pattern recognizer with ”new” features Or…
General post-processing: store the likelihoods for each classified sample and use this in the following
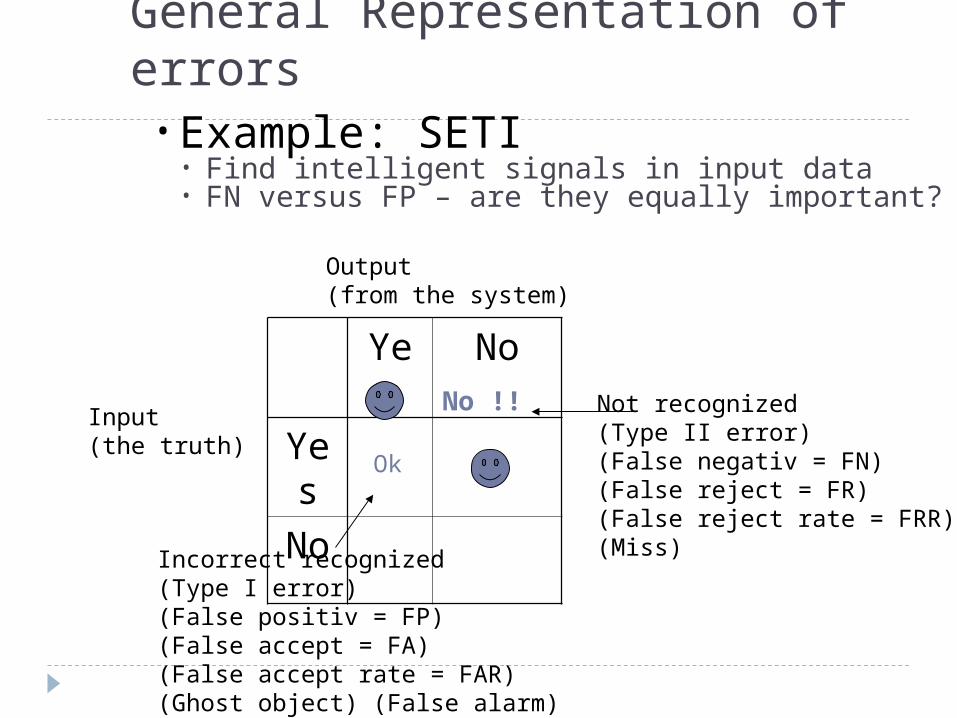
General Representation of errors• Example: SETI
• Find intelligent signals in input data• FN versus FP – are they equally important?
Yes No
Yes
No
Input(the truth)
Output(from the system)
Incorrect recognized(Type I error)(False positiv = FP)(False accept = FA)(False accept rate = FAR)(Ghost object) (False alarm)
Not recognized(Type II error)(False negativ = FN)(False reject = FR)(False reject rate = FRR)(Miss)
Ok
No !!
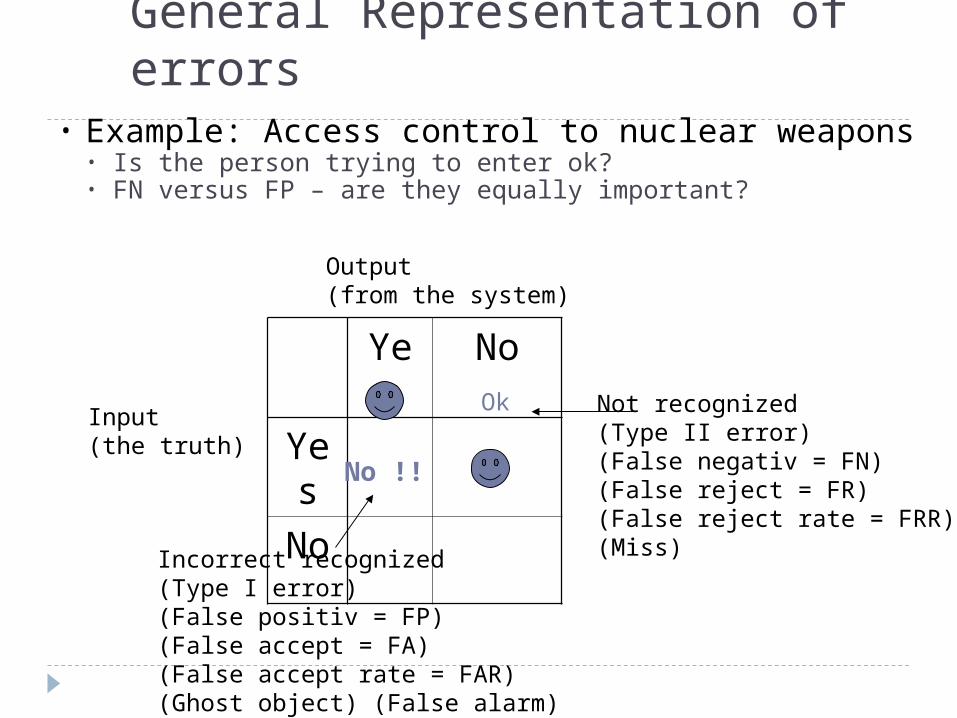
General Representation of errors• Example: Access control to nuclear weapons
• Is the person trying to enter ok?• FN versus FP – are they equally important?
Yes No
Yes
No
Input(the truth)
Output(from the system)
Incorrect recognized(Type I error)(False positiv = FP)(False accept = FA)(False accept rate = FAR)(Ghost object) (False alarm)
Not recognized(Type II error)(False negativ = FN)(False reject = FR)(False reject rate = FRR)(Miss)
Ok
No !!
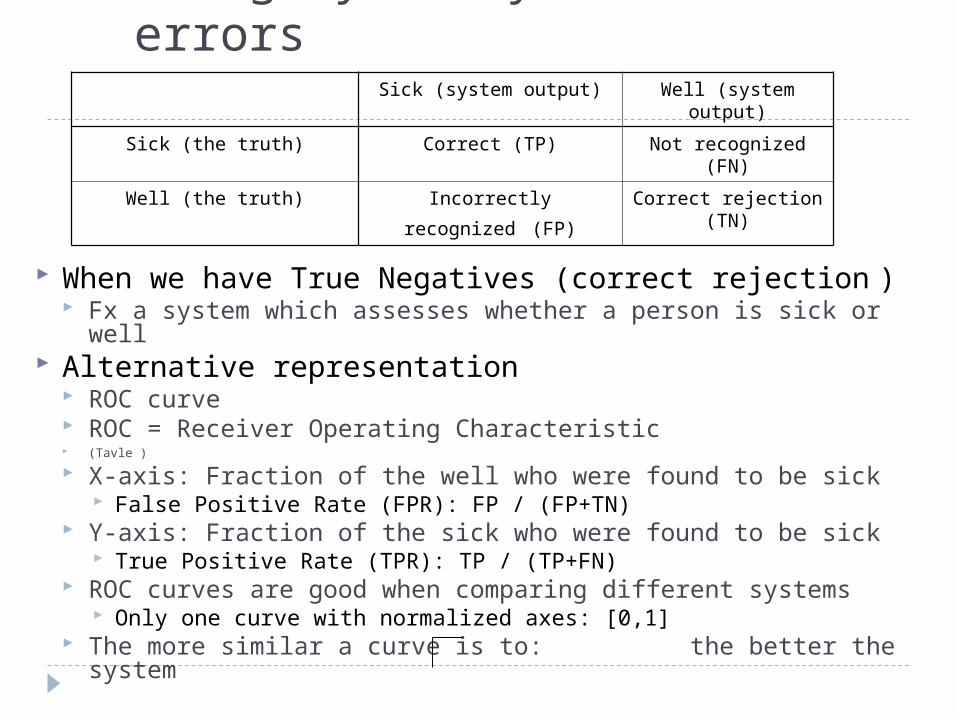
Design your system wrt errors
When we have True Negatives (correct rejection ) Fx a system which assesses whether a person is sick or well
Alternative representation ROC curve ROC = Receiver Operating Characteristic (Tavle )
X-axis: Fraction of the well who were found to be sick False Positive Rate (FPR): FP / (FP+TN)
Y-axis: Fraction of the sick who were found to be sick True Positive Rate (TPR): TP / (TP+FN)
ROC curves are good when comparing different systems Only one curve with normalized axes: [0,1]
The more similar a curve is to: the better the system
Sick (system output) Well (system output)
Sick (the truth) Correct (TP) Not recognized (FN)
Well (the truth) Incorrectly recognized (FP)
Correct rejection (TN)
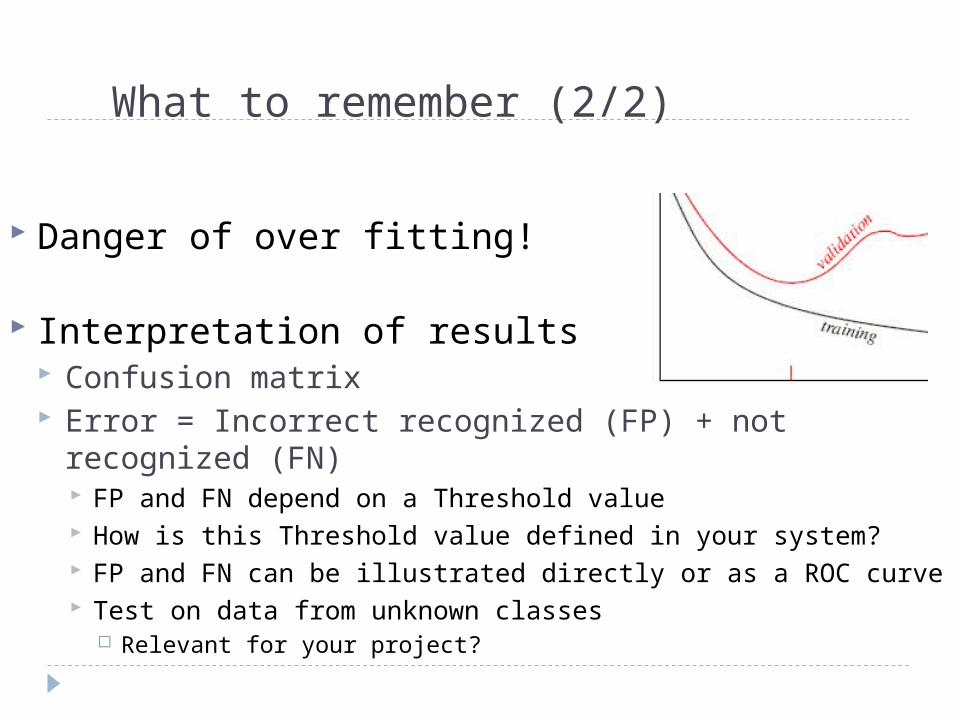
What to remember (2/2)
Danger of over fitting!
Interpretation of results Confusion matrix Error = Incorrect recognized (FP) + not recognized
(FN) FP and FN depend on a Threshold value How is this Threshold value defined in your system? FP and FN can be illustrated directly or as a ROC curve Test on data from unknown classes
Relevant for your project?

What to remember (1/2)
Success criteria for your project HW, SW, Real-time, recognition rate
Test You perform tests to see how well the trained
system generalizes NEVER TEST ON TRAINING DATA!!! Cross-validation
Train on % of the samples () and test on the rest What should be?
M-fold cross validation Divide (randomly) all samples in M equally sized groups Use M-1 groups to train the system and test on the rest Do this M times and average the results