tw pattern classification - university of edinburgh 2011 edinburgh multivariate pattern...
TRANSCRIPT

SPM 2011 Edinburgh
Multivariate Pattern Classification
Multivariate pattern Multivariate pattern classificationclassification
Thomas WolbersThomas WolbersSpace & Ageing Laboratory (www.sal.mvm.ed.ac.uk)Space & Ageing Laboratory (www.sal.mvm.ed.ac.uk)
Centre for Cognitive and Neural Systems &Centre for Cognitive and Neural Systems &Centre for Cognitive Ageing and Cognitive EpidemiologyCentre for Cognitive Ageing and Cognitive Epidemiology
SPM Course 04/11
WHY PATTERN CLASSIFICATION?WHY PATTERN CLASSIFICATION?
PROCESSING STREAMPROCESSING STREAM
PREPROCESSING / FEATURE REDUCTIONPREPROCESSING / FEATURE REDUCTION
CLASSIFICATIONCLASSIFICATION
EVALUATING RESULTSEVALUATING RESULTS
APPLICATIONSAPPLICATIONS
WHY PATTERN CLASSIFICATION?WHY PATTERN CLASSIFICATION?
PROCESSING STREAMPROCESSING STREAM
PREPROCESSING / FEATURE REDUCTIONPREPROCESSING / FEATURE REDUCTION
CLASSIFICATIONCLASSIFICATION
EVALUATING RESULTSEVALUATING RESULTS
APPLICATIONSAPPLICATIONS
OutlineOutline
SPM Course 04/11
== ++
Tim
e (
Tim
e ( s
can
scan
))
WhyWhy patternpattern classclass.?.?
datadata parameterparameter errorerrordesigndesign matrixmatrixβ1β2β3β4β5β6β7β8β9β10β0
εε== ββ ++yy X ••
••
GLM: separate GLM: separate modelmodel fittingfitting forfor eacheach voxel voxel massmass‐‐univariateunivariate analysisanalysis!!

SPM 2011 Edinburgh
Multivariate Pattern Classification
SPM Course 04/11
Key idea behind pattern classificationKey idea behind pattern classificationGLM analysis relies exclusively on the information contained in the time course of individual voxelsMultivariate analyses take advantage of the information contained in activity patterns across space, frommultiple voxels Cognitive/Sensorimotor states are expressed in the brain as distributed patterns of brain activity
GLM GLM
WhyWhy patternpattern classclass.?.?
SPM Course 04/11
Advantages of multivariate pattern classificationAdvantages of multivariate pattern classification
increaseincrease in in sensitivitysensitivity: : weakweak informationinformation in in singlesingle voxels voxels isisaccumulatedaccumulated acrossacross manymany voxelsvoxels
multiple multiple regionsregions/voxels /voxels maymay onlyonly carry carry infoinfo aboutabout brainbrainstatesstates whenwhen jointlyjointly analyzedanalyzed
can preventcan prevent informationinformation lossloss duedue to to spatialspatial smoothing smoothing (but see Op de Beeck, 2009 / Kamitani & Sawahata 2010)(but see Op de Beeck, 2009 / Kamitani & Sawahata 2010)
cancan preservepreserve temporal temporal resolutionresolution insteadinstead of of characterizingcharacterizingaverageaverage responsesresponses acrossacross manymany trialstrials
WhyWhy patternpattern classclass.?.?
SPM Course 04/11
WHY PATTERN CLASSIFICATION?WHY PATTERN CLASSIFICATION?
PROCESSING STREAMPROCESSING STREAM
PREPROCESSING / FEATURE REDUCTIONPREPROCESSING / FEATURE REDUCTION
CLASSIFICATIONCLASSIFICATION
EVALUATING RESULTSEVALUATING RESULTS
APPLICATIONSAPPLICATIONS
OutlineOutline

SPM 2011 Edinburgh
Multivariate Pattern Classification
SPM Course 04/11
Wolbers et al. (in press)
Can the direction of auditory motion be decoded from fMRI signals in the human motion complex (hMT+)?
AUDITORY MOTION AUDITORY MOTION PERCEPTION IN THE BLINDPERCEPTION IN THE BLIND
SPM Course 04/11
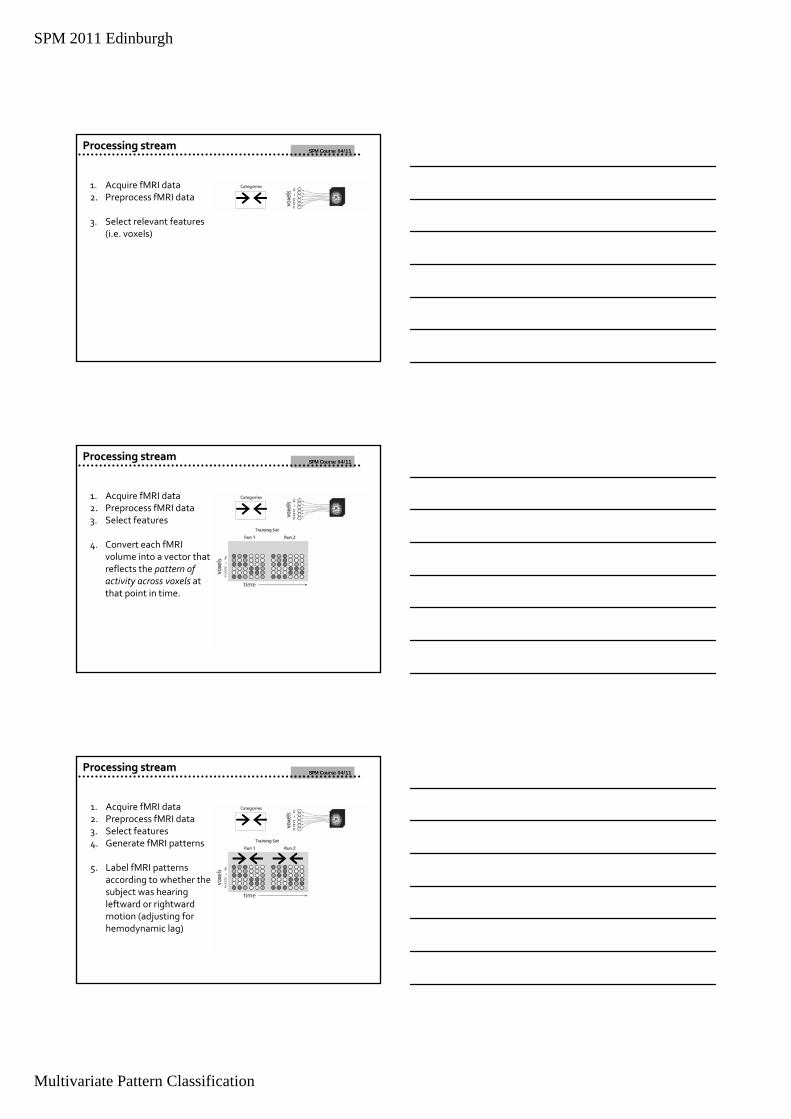
1. Acquire fMRI data while subject listens to leftward and rightward motion
Processing streamProcessing stream
SPM Course 04/11
1. Acquire fMRI data
2. Preprocess fMRI data
Processing streamProcessing stream
SPM 2011 Edinburgh
Multivariate Pattern Classification
SPM Course 04/11
1. Acquire fMRI data2. Preprocess fMRI data
3. Select relevant features (i.e. voxels)
Processing streamProcessing stream
SPM Course 04/11
1. Acquire fMRI data2. Preprocess fMRI data3. Select features
4. Convert each fMRI volume into a vector that reflects the pattern of activity across voxels at that point in time.
Processing streamProcessing stream
SPM Course 04/11
1. Acquire fMRI data2. Preprocess fMRI data3. Select features4. Generate fMRI patterns
5. Label fMRI patterns according to whether the subject was hearing leftward or rightward motion (adjusting for hemodynamic lag)
Processing streamProcessing stream
SPM 2011 Edinburgh
Multivariate Pattern Classification
SPM Course 04/11
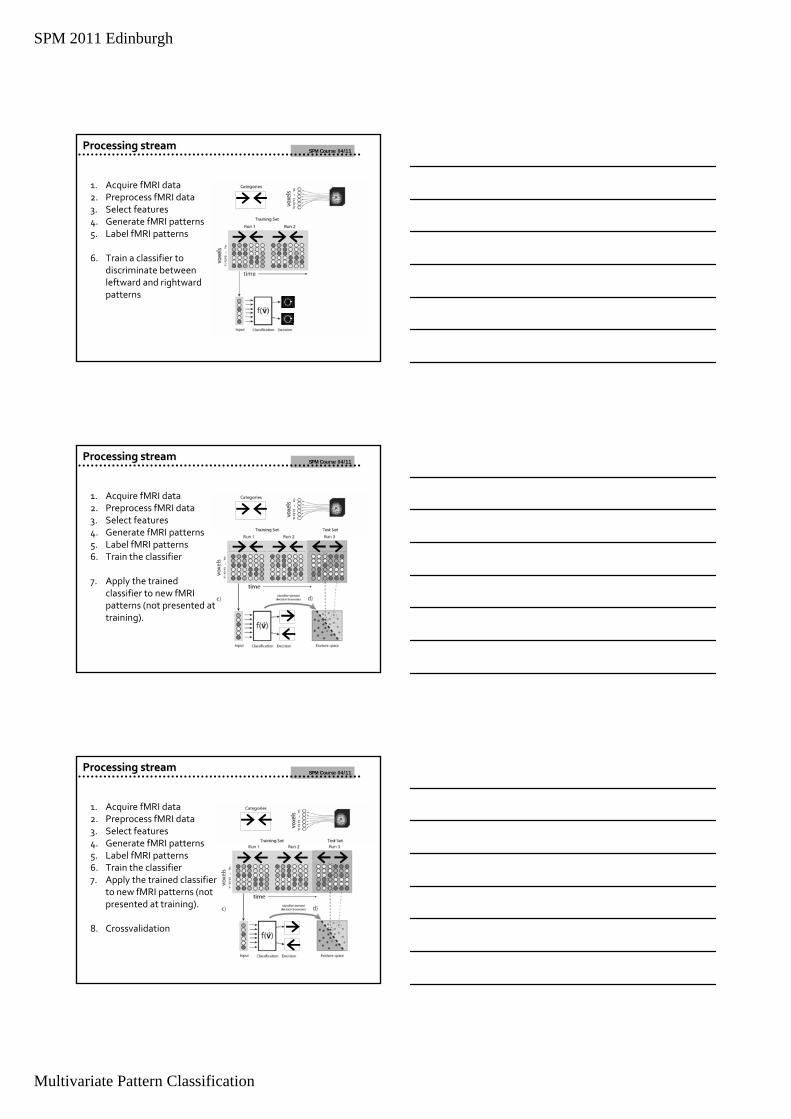
1. Acquire fMRI data2. Preprocess fMRI data3. Select features4. Generate fMRI patterns5. Label fMRI patterns
6. Train a classifier to discriminate between leftward and rightward patterns
Processing streamProcessing stream
SPM Course 04/11
1. Acquire fMRI data2. Preprocess fMRI data3. Select features4. Generate fMRI patterns5. Label fMRI patterns6. Train the classifier
7. Apply the trained classifier to new fMRI patterns (not presented at training).
Processing streamProcessing stream
SPM Course 04/11
1. Acquire fMRI data2. Preprocess fMRI data3. Select features4. Generate fMRI patterns5. Label fMRI patterns6. Train the classifier7. Apply the trained classifier
to new fMRI patterns (not presented at training).
8. Crossvalidation
Processing streamProcessing stream

SPM 2011 Edinburgh
Multivariate Pattern Classification
SPM Course 04/11
1. Acquire fMRI data2. Preprocess fMRI data3. Select features4. Generate fMRI patterns5. Label fMRI patterns6. Train the classifier7. Apply the trained classifier
to new fMRI patterns (not presented at training).
8. Crossvalidation
9. Statistical inference
Processing streamProcessing stream
SPM Course 04/11
Univariate ROI analysis
Pattern classification analysis
Wolbers et al. (in press)
SPM Course 04/11
WHY PATTERN CLASSIFICATION?WHY PATTERN CLASSIFICATION?
PROCESSING STREAMPROCESSING STREAM
PREPROCESSING / FEATURE REDUCTIONPREPROCESSING / FEATURE REDUCTION
CLASSIFICATIONCLASSIFICATION
EVALUATING RESULTSEVALUATING RESULTS
APPLICATIONSAPPLICATIONS
OutlineOutline
SPM 2011 Edinburgh
Multivariate Pattern Classification
SPM Course 04/11
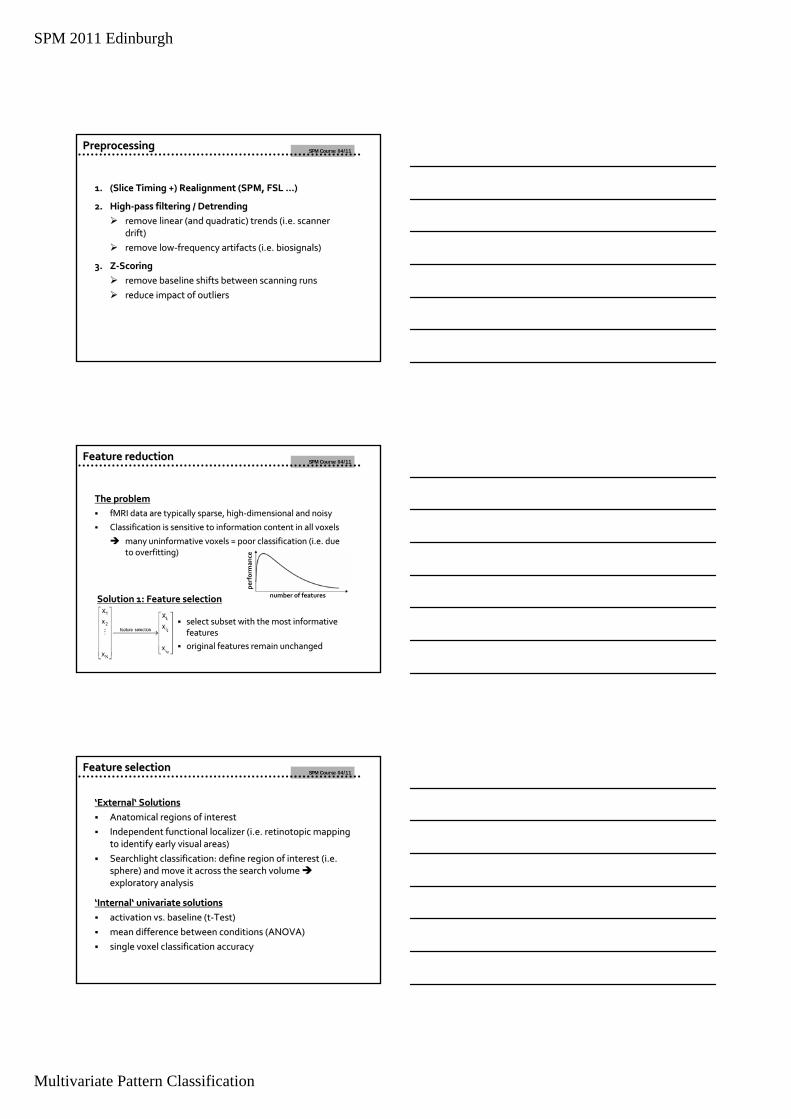
1.1. ((SliceSlice Timing +) Realignment Timing +) Realignment (SPM,(SPM, FSL FSL ……))
2.2. HighHigh‐‐pass filtering / Detrendingpass filtering / Detrendingremoveremove linear (and linear (and quadraticquadratic) ) trendstrends ((i.ei.e. . scannerscannerdrift)drift)removeremove lowlow‐‐frequencyfrequency artifactsartifacts ((i.ei.e. . biosignalsbiosignals))
3.3. ZZ‐‐ScoringScoringremoveremove baselinebaseline shiftsshifts betweenbetween scanningscanning runsrunsreducereduce impactimpact of of outliersoutliers
PreprocessingPreprocessing
SPM Course 04/11
TheThe problemproblemfMRI fMRI datadata areare typicallytypically sparsesparse, , highhigh‐‐dimensionaldimensional and and noisynoisy
ClassificationClassification isis sensitive to sensitive to informationinformation contentcontent in all voxelsin all voxels
manymany uninformative voxels = uninformative voxels = poorpoor classificationclassification ((i.ei.e. . duedueto to overfittingoverfitting))
number of features
performan
ce
Solution 1: Feature Solution 1: Feature selectionselection
selectselect subsetsubset withwith thethe mostmost informative informative featuresfeaturesoriginal original featuresfeatures remainremain unchangedunchanged
Feature reductionFeature reduction
SPM Course 04/11
‘‘ExternalExternal‘‘ SolutionsSolutionsAnatomicalAnatomical regionsregions of of interestinterestIndependent Independent functionalfunctional localizerlocalizer (i.e. retinotopic(i.e. retinotopic mappingmappingto to identifyidentify earlyearly visualvisual areas)areas)Searchlight classification: define region of interest (i.e. Searchlight classification: define region of interest (i.e. sphere) and move it across the search volume sphere) and move it across the search volume exploratory analysisexploratory analysis
‘‘InternalInternal‘‘ univariateunivariate solutionssolutionsactivationactivation vs. vs. baselinebaseline (t(t‐‐Test)Test)meanmean differencedifference betweenbetween conditionsconditions (ANOVA)(ANOVA)singlesingle voxel voxel classificationclassification accuracyaccuracy
Feature selectionFeature selection

SPM 2011 Edinburgh
Multivariate Pattern Classification
SPM Course 04/11
PeekingPeeking #1 (ANOVA and #1 (ANOVA and classificationclassification onlyonly))testingtesting a a trainedtrained classifierclassifier needsneeds to to bebe performedperformed on on independentindependent test test datasetsdatasetsifif entireentire datasetdataset isis usedused forfor featurefeature selectionselection, , ......
Pereira et al. (2009)
Feature selectionFeature selection
SPM Course 04/11Feature selectionFeature selection
SPM Course 04/11
if entire dataset is used for feature selection, we will identifif entire dataset is used for feature selection, we will identify some voxels that show y some voxels that show task related consistency between training and test set => trainitask related consistency between training and test set => training and test data are no ng and test data are no longer independent, classification estimates become overly optimlonger independent, classification estimates become overly optimisticistic
nested crossvalidationnested crossvalidation
ROI definition in inferior temporal cortex based ROI definition in inferior temporal cortex based on two sided ton two sided t‐‐tests comparing conditionstests comparing conditions
Feature selectionFeature selection

SPM 2011 Edinburgh
Multivariate Pattern Classification
SPM Course 04/11
Solution 1: Feature Solution 1: Feature selectionselection
selectselect subsetsubset fromfrom all all availableavailable featuresfeaturesoriginal original featuresfeatures remainremain unchangedunchanged
createcreate newnew featuresfeatures as a as a functionfunction of of existingexisting featuresfeaturesLinear Linear functionsfunctions (PCA,(PCA, ICA,ICA,……))NonlinearNonlinear functionsfunctions duringduringclassificationclassification ((i.ei.e. . hiddenhidden unitsunits in a in a neuralneural networknetwork))
Solution 2: Feature Solution 2: Feature extractionextraction
Feature extractionFeature extraction
SPM Course 04/11
WHY PATTERN CLASSIFICATION?WHY PATTERN CLASSIFICATION?
PROCESSING STREAMPROCESSING STREAM
PREPROCESSING / FEATURE REDUCTIONPREPROCESSING / FEATURE REDUCTION
CLASSIFICATIONCLASSIFICATION
EVALUATING RESULTSEVALUATING RESULTS
APPLICATIONSAPPLICATIONS
OutlineOutline
SPM Course 04/11
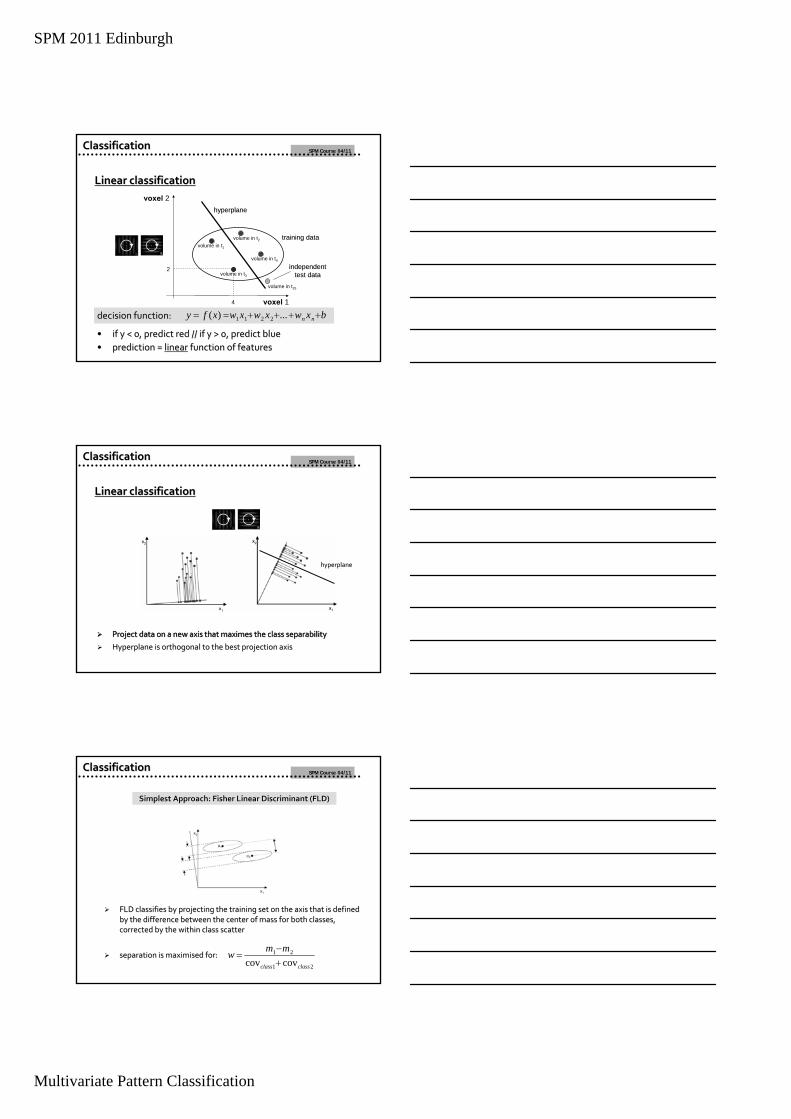
Linear Linear classificationclassification
voxel 1
voxel 2
volume in t1
volume in t2
volume in t4
volume in t32
4
trainingtraining datadata
volume in t25
independent independent test test datadata
hyperplanehyperplane
ourour tasktask: find a : find a hyperplanehyperplane thatthat separates separates bothboth conditionsconditions
ClassificationClassification
SPM 2011 Edinburgh
Multivariate Pattern Classification
SPM Course 04/11
Linear Linear classificationclassification
voxel 1
voxel 2
volume in t1
volume in t2
volume in t4
volume in t32
4
bxwxwxwxfy nn ++++== ...)( 2211decisiondecision functionfunction::
•• ifif y y << 0, 0, predictpredict redred // // ifif y y >> 0, 0, predictpredict blueblue•• predictionprediction = = linearlinear functionfunction of of featuresfeatures
trainingtraining datadata
volume in t25
independent independent test test datadata
hyperplanehyperplane
ClassificationClassification
SPM Course 04/11
Linear Linear classificationclassification
Project data on a new axis that maximes the class separabilityProject data on a new axis that maximes the class separability
hyperplanehyperplane
Project data on a new axis that maximes the class separabilityProject data on a new axis that maximes the class separability
Hyperplane is orthogonal to the best projection axisHyperplane is orthogonal to the best projection axis
ClassificationClassification
SPM Course 04/11
Simplest Approach: Fisher Linear Simplest Approach: Fisher Linear DiscriminantDiscriminant (FLD)(FLD)
FLD classifies by projecting the training set on the axis that iFLD classifies by projecting the training set on the axis that is defined s defined by the difference between the center of mass for both classes, by the difference between the center of mass for both classes, corrected by the within class scattercorrected by the within class scatter
separation is separation is maximisedmaximised for:for:21
21
covcov classclass
mmw+−
=
ClassificationClassification

SPM 2011 Edinburgh
Multivariate Pattern Classification
SPM Course 04/11
weightvector w
voxel 1
voxel 2
volume in t1
volume in t2
volume in t4
volume in t3volume in t25
hyperplanehyperplane
Linear Linear classificationclassification
by += wx hyperplane defined by weight vector w and hyperplane defined by weight vector w and offset boffset b
ClassificationClassification
SPM Course 04/11
How to interpret the How to interpret the weight vector?weight vector?
weightvector w
voxel 1
voxel 2
volume in t1 volume in t2
volume in t4volume in t3
volume in t25
hyperplanehyperplane
Weight vector (Discriminating Volume)W = [0.45 0.89] 0.45 0.89
The value of each voxel in the weight vector indicates its imporThe value of each voxel in the weight vector indicates its importance in tance in discriminating between the two classes (i.e. cognitive states).discriminating between the two classes (i.e. cognitive states).
Linear Linear classificationclassification
ClassificationClassification
SPM Course 04/11
Support Vector Machine (SVM)
Which of the linear separators is the optimal one?
voxel 2
voxel 1
ClassificationClassification
SPM 2011 Edinburgh
Multivariate Pattern Classification
SPM Course 04/11
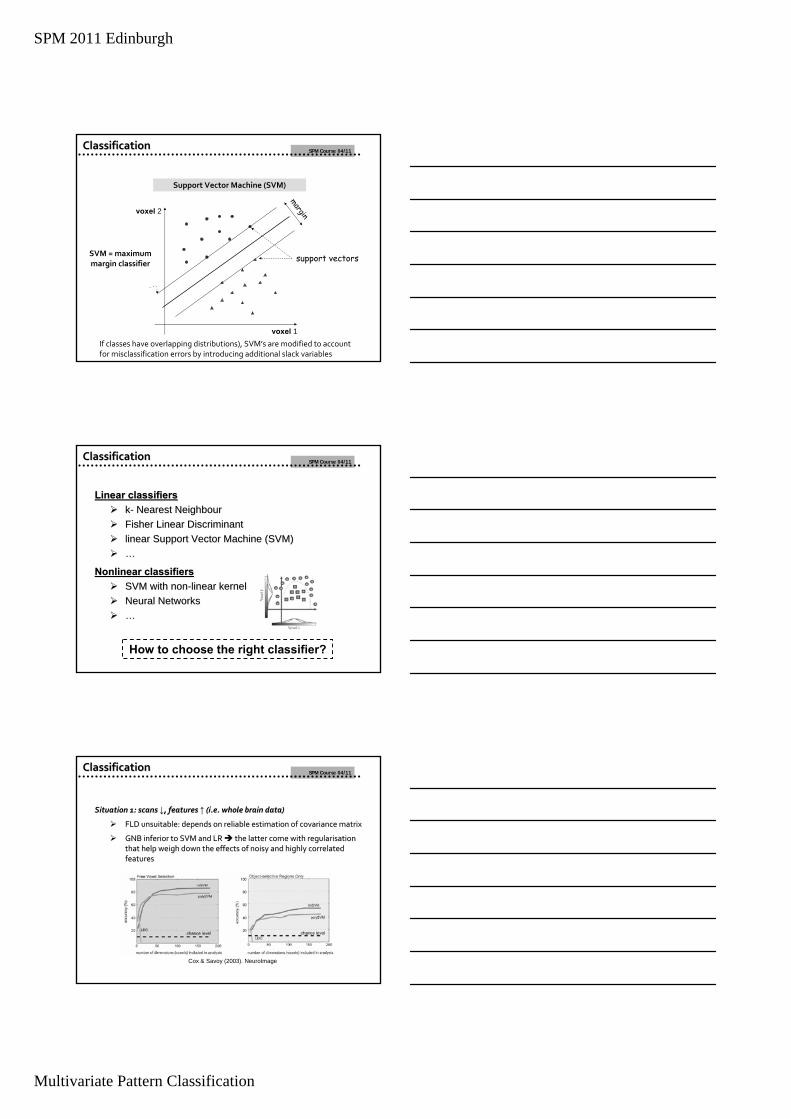
Support Vector Machine (SVM)
SVM = maximum margin classifier
margin
support vectors
voxel 2
voxel 1If classes have overlapping distributions), SVM’s are modified to account for misclassification errors by introducing additional slack variables
ClassificationClassification
SPM Course 04/11
Linear Linear classifiersclassifierskk-- Nearest NeighbourNearest NeighbourFisherFisher Linear Linear DiscriminantDiscriminantlinear Supportlinear Support Vector Vector MachineMachine (SVM)(SVM)……
NonlinearNonlinear classifiersclassifiersSVM SVM withwith nonnon--linear kernellinear kernelNeuralNeural NetworksNetworks……
How to choose the right classifier?
ClassificationClassification
SPM Course 04/11
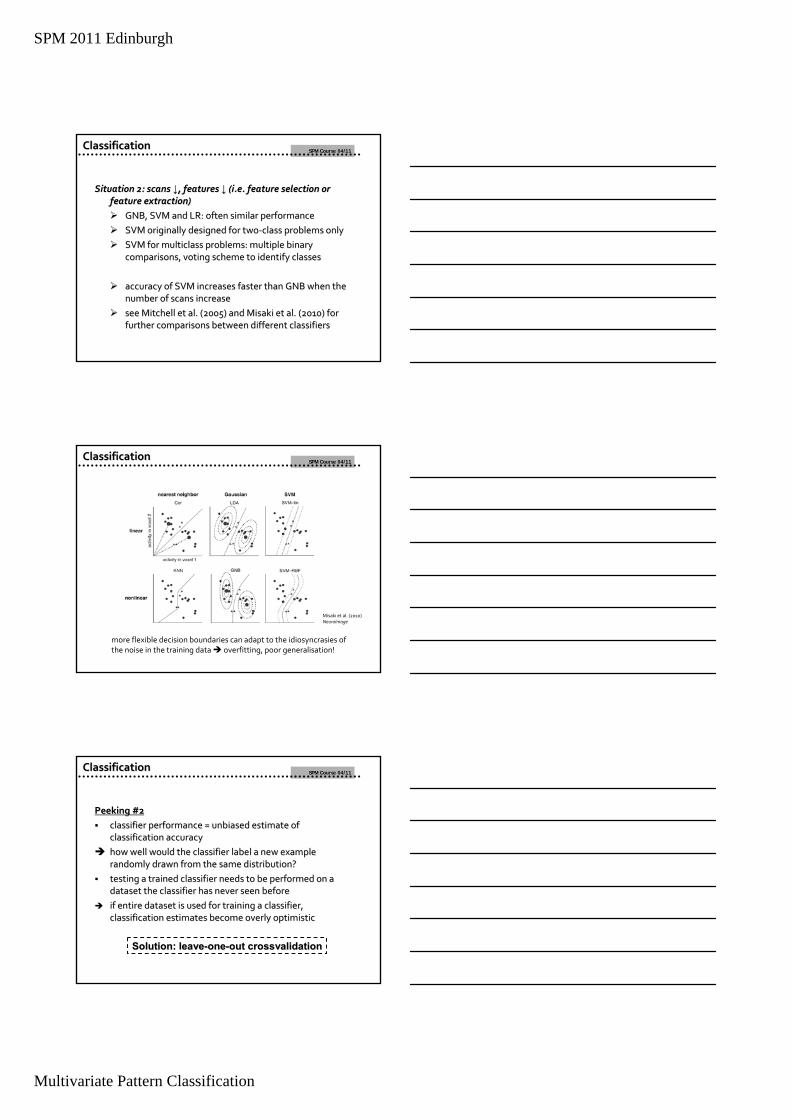
Situation 1: Situation 1: scansscans ↓↓, , featuresfeatures ↑↑ ((i.ei.e. . wholewhole brainbrain datadata))
FLD FLD unsuitableunsuitable: : dependsdepends on on reliablereliable estimationestimation of of covariancecovariance matrixmatrix
GNBGNB inferior to SVM and LR inferior to SVM and LR thethe latterlatter come come withwith regularisationregularisationthatthat helphelp weighweigh down down thethe effectseffects of of noisynoisy and and highlyhighly correlatedcorrelatedfeaturesfeatures
Cox & Savoy (2003). NeuroImage
ClassificationClassification
SPM 2011 Edinburgh
Multivariate Pattern Classification
SPM Course 04/11
Situation 2: Situation 2: scansscans ↓↓, , featuresfeatures ↓↓ ((i.ei.e. . featurefeature selectionselection ororfeaturefeature extractionextraction))
GNB, SVM and LR: GNB, SVM and LR: oftenoften similarsimilar performanceperformanceSVM SVM originallyoriginally designeddesigned forfor twotwo‐‐classclass problemsproblems onlyonlySVM SVM forfor multiclassmulticlass problemsproblems: multiple : multiple binarybinarycomparisonscomparisons, , votingvoting schemescheme to to identifyidentify classesclasses
accuracyaccuracy of SVM of SVM increasesincreases fasterfaster thanthan GNB GNB whenwhen thethenumbernumber of of scansscans increaseincreaseseesee Mitchell et al. (2005) Mitchell et al. (2005) and Misaki et al. (2010) forand Misaki et al. (2010) forfurtherfurther comparisonscomparisons betweenbetween different different classifiersclassifiers
ClassificationClassification
SPM Course 04/11ClassificationClassification
more flexible decision boundaries can adapt to the idiosyncrasies of the noise in the training data overfitting, poor generalisation!
Misaki et al. (2010) NeuroImage
SPM Course 04/11
PeekingPeeking #2#2classifierclassifier performanceperformance = = unbiasedunbiased estimateestimate of of classificationclassification accuracyaccuracyhowhow well well wouldwould thethe classifierclassifier labellabel a a newnew exampleexamplerandomlyrandomly drawndrawn fromfrom thethe samesame distributiondistribution??testingtesting a a trainedtrained classifierclassifier needsneeds to to bebe performedperformed on a on a datasetdataset thethe classifierclassifier has has nevernever seenseen beforebeforeifif entireentire datasetdataset isis usedused forfor trainingtraining a a classifierclassifier, , classificationclassification estimatesestimates becomebecome overlyoverly optimisticoptimistic
Solution: Solution: leaveleave--oneone--outout crossvalidationcrossvalidation
ClassificationClassification

SPM 2011 Edinburgh
Multivariate Pattern Classification
SPM Course 04/11
CrossvalidationCrossvalidationstandardstandard approachapproach: : leaveleave‐‐oneone‐‐outoutcrossvalidationcrossvalidationsplitsplit datasetdataset intointo n n foldsfolds ((i.ei.e. . runsruns))traintrain classifierclassifier on 1:non 1:n‐‐1 1 foldsfoldstest test thethe trainedtrained classifierclassifier on on foldfold nnrerunrerun trainingtraining//testingtesting whilewhilewithholdingwithholding a different a different foldfoldrepeatrepeat procedureprocedure untiluntil eacheach foldfold has has beenbeen withheldwithheld onceonceClassificationClassification accuracyaccuracy usuallyusuallycomputedcomputed as as meanmean accuracyaccuracy
training set test set
ClassificationClassification
SPM Course 04/11
WHY PATTERN CLASSIFICATION?WHY PATTERN CLASSIFICATION?
PROCESSING STREAMPROCESSING STREAM
PREPROCESSING / FEATURE REDUCTIONPREPROCESSING / FEATURE REDUCTION
CLASSIFICATIONCLASSIFICATION
EVALUATING RESULTSEVALUATING RESULTS
APPLICATIONSAPPLICATIONS
OutlineOutline
SPM Course 04/11
Independent test Independent test datadataClassificationClassification accuracyaccuracy = = unbiasedunbiased estimateestimate of of thethe truetrue accuracyaccuracyof of thethe classifierclassifierQuestionQuestion: : whatwhat isis thethe probabilityprobability of of obtainingobtaining 57% 57% accuracyaccuracyunderunder thethe null null hypothesishypothesis (no (no informationinformation aboutabout thethe variable of variable of interestinterest in in mymy datadata)?)?Binary classification: pBinary classification: p‐‐valuevalue cancan bebe calculatedcalculated underunder a a binomialbinomialdistributiondistribution withwith N N trialstrials ((i.ei.e. 100) and P . 100) and P probabilityprobability of of successsuccess((i.ei.e. 0.5) . 0.5) MatlabMatlab: p = 1 : p = 1 ‐‐ binocdf(X,N,Pbinocdf(X,N,P) = 0.067 () = 0.067 (hmmhmm……))
X = X = numbernumber of of correctlycorrectly labeledlabeled examplesexamples ((i.ei.e. 57). 57)
CanCan I I publishpublish mymy datadata withwith 57% 57% classificationclassification accuracyaccuracy in in Science Science oror Nature?Nature?
Evaluating resultsEvaluating results

SPM 2011 Edinburgh
Multivariate Pattern Classification
SPM Course 04/11
NonparametricNonparametric approachesapproachesPermutation Permutation teststests ((i.ei.e. . PolynPolyn et al, 2005):et al, 2005):
createcreate a null a null distributiondistribution of of performanceperformance valuesvalues byby repeatedlyrepeatedlygeneratinggenerating scrambledscrambled versionsversions of of thethe classifierclassifier outputoutputMVPA: MVPA: waveletwavelet basedbased scramblingscrambling techniquetechnique ((BullmoreBullmore et al., 2004) et al., 2004)
cancan accomodateaccomodate nonnon‐‐independentindependent datadata
BootstrappingBootstrappingestimateestimate thethe variancevariance and and distributiondistribution of a of a statisticstatistic ((i.ei.e. voxel . voxel weightsweights))Multiple Multiple iterationsiterations of of datadata resamplingresampling byby drawingdrawing withwith replacementreplacementfromfrom thethe datasetdataset
MulticlassMulticlass problemsproblems: : accuracyaccuracy cancan bebe painfulpainfulaverageaverage rank of rank of thethe correctcorrect labellabelaverageaverage of all of all pairwisepairwise comparisonscomparisons
Evaluating resultsEvaluating results
SPM Course 04/11
Design Design considerationsconsiderationsacquireacquire as as manymany trainingtraining examplesexamples as as possiblepossible classifierclassifier needsneeds to to bebe ableable to to „„seesee throughthrough thethe noisenoise““
averagingaveraging consecutiveconsecutive TRTR‘‘ss cancan helphelp to to reducereduce thethe impactimpact of of noisenoise((butbut maymay also also eliminateeliminate naturalnatural, informative , informative variation)variation)
avoidavoid usingusing consecutiveconsecutive scansscans forfor trainingtraining a a classifierclassifier lots of lots of highlyhighly similarsimilar datapointsdatapoints do do notnot givegive newnew informationinformation
acquireacquire as as manymany testtest examplesexamples as as possiblepossible increasesincreases thethe powerpower of of significancesignificance testtest
balancebalance conditionsconditions ifif notnot, , classifierclassifier maymay tendtend to to focusfocus on on predominantpredominant conditioncondition
alternative to averaging: use beta weights or talternative to averaging: use beta weights or t‐‐images from a GLM images from a GLM analysis (i.e. based on FIR or HRF)analysis (i.e. based on FIR or HRF)
Getting resultsGetting results
SPM Course 04/11Getting resultsGetting results
Classification on t‐ vs. beta images
Misaki et al. (2010) NeuroImage
•• normalisation by standard error can normalisation by standard error can downweightdownweight noisy voxels noisy voxels
•• SVMSVM’’ss can benefit from inputs with similar response magnitudes can benefit from inputs with similar response magnitudes

SPM 2011 Edinburgh
Multivariate Pattern Classification
SPM Course 04/11
WHY PATTERN CLASSIFICATION?WHY PATTERN CLASSIFICATION?
PROCESSING STREAMPROCESSING STREAM
PREPROCESSING / FEATURE REDUCTIONPREPROCESSING / FEATURE REDUCTION
CLASSIFICATIONCLASSIFICATION
EVALUATING RESULTSEVALUATING RESULTS
APPLICATIONSAPPLICATIONS
OutlineOutline
SPM Course 04/11
Pattern Pattern discriminationdiscriminationQuestionQuestion 1: do 1: do thethe selectedselected fMRI fMRI datadata containcontain informationinformationaboutabout a variable of a variable of interestinterest ((i.ei.e. . consciousconscious perceptpercept in Haynes & in Haynes & ReesRees)?)?
Pattern Pattern localizationlocalizationQuestionQuestion 2: 2: wherewhere in in thethebrainbrain isis informationinformation aboutaboutthethe variable of variable of interestinterestrepresentedrepresented??weightweight vectorvector containscontains infoinfoon on thethe importanceimportance of of eacheachvoxel voxel forfor differentiatingdifferentiatingbetweenbetween classesclasses
weightvector w
voxel 1
voxel 2
volume in t1
volume in t2
volume in t4
volume in t3volume in t25
hyperplanehyperplane
ApplicationsApplications
SPM Course 04/11
Pattern localization Pattern localization ‐‐ SpaceSpace
Polyn et al. (2005), Science.
ApplicationsApplications
SPM 2011 Edinburgh
Multivariate Pattern Classification
SPM Course 04/11
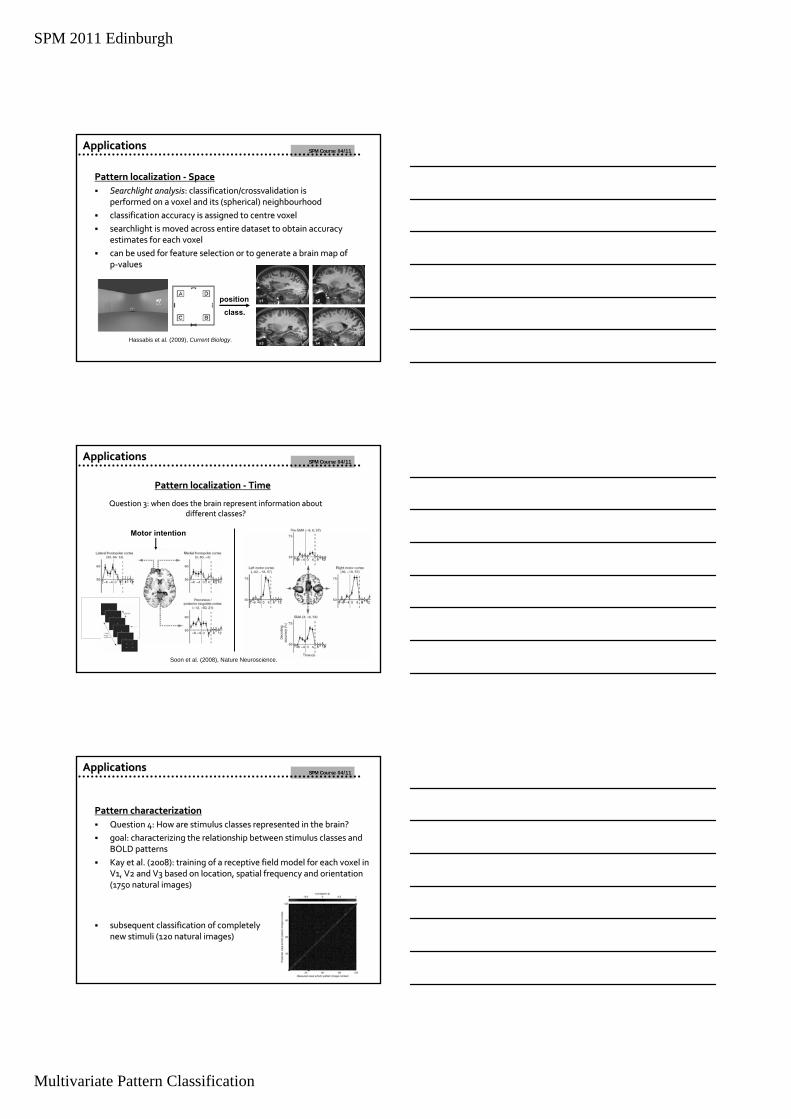
Pattern Pattern localization localization ‐‐ SpaceSpaceSearchlightSearchlight analysisanalysis: : classificationclassification//crossvalidationcrossvalidation isisperformedperformed on a voxel and on a voxel and itsits (spherical)(spherical) neighbourhoodneighbourhoodclassificationclassification accuracyaccuracy isis assignedassigned to to centrecentre voxelvoxelsearchlightsearchlight isis movedmoved acrossacross entireentire datasetdataset to to obtainobtain accuracyaccuracyestimatesestimates forfor eacheach voxelvoxelcancan bebe usedused forfor featurefeature selectionselection oror to to generategenerate a a brainbrain mapmap of of pp‐‐valuesvalues
Hassabis et al. (2009), Current Biology.
positionclass.
ApplicationsApplications
SPM Course 04/11
Motor intention
Pattern Pattern localization localization ‐‐ TimeTime
QuestionQuestion 3: 3: whenwhen doesdoes thethe brainbrain representrepresent informationinformation aboutaboutdifferentdifferent classesclasses??
Soon et al. (2008), Nature Neuroscience.
ApplicationsApplications
SPM Course 04/11
Pattern Pattern characterizationcharacterizationQuestionQuestion 4: 4: HowHow areare stimulusstimulus classesclasses representedrepresented in in thethe brainbrain??goalgoal: : characterizingcharacterizing thethe relationshiprelationship betweenbetween stimulusstimulus classesclasses and and BOLD BOLD patternspatternsKay et al. (2008): Kay et al. (2008): trainingtraining of a of a receptivereceptive fieldfield modelmodel forfor eacheach voxel in voxel in V1, V2 and V3 V1, V2 and V3 basedbased on on locationlocation, , spatialspatial frequencyfrequency and and orientationorientation(1750 (1750 naturalnatural imagesimages))
subsequentsubsequent classificationclassification of of completelycompletelynewnew stimulistimuli (120 (120 naturalnatural imagesimages))
ApplicationsApplications

SPM 2011 Edinburgh
Multivariate Pattern Classification
SPM Course 04/11
Useful literatureUseful literatureHaynes JD, Rees G (2006) Decoding mental states from brain activity in humans. Nat Rev Neurosci 7:523‐534.Formisano E, De Martino F, Valente G (2008) Multivariate analysis of fMRI time series: classification and regression of brain responses using machine learning. Magn Reson Imaging 26(7):921‐34.Kriegeskorte N, Goebel R, Bandettini P (2006) Information‐based functional brain mapping. Proc Natl Acad SciU S A 103:3863‐3868.Misaki M. et al. (2010) Comparison of multivariate classifiers and response normalizations for pattern‐information fMRI. NeuroImage 53, 103‐118.Mitchell TM, et al. (2004) Learning to Decode Cognitive States from Brain Images. Machine Learning 57:145‐175.O’Toole et al. (2007). Theoretical, statistical, and practical perspectives on pattern‐based classification approaches to the analysis of functional neuroimaging data. J Cogn Neurosci.19(11):1735‐52Pereira F, Mitchell TM, Botvinick M (2009) Machine Learning Classifiers and fMRI: a tutorial overview. Neuroimage 45(1 Suppl):S199‐209.