liver tumor-initiating cells drive self-renewal and tumor
TRANSCRIPT
1
CD24+ liver tumor-initiating cells drive self-renewal and tumor initiation through
Stat3-mediated Nanog regulation
Terence Kin Wah Lee1,2
, Antonia Castilho1,2
, Vincent Chi Ho Cheung 1,2
,
Kwan Ho Tang2, Stephanie Ma
1,2, Irene Oi Lin Ng
1,2 #
1State Key Laboratory for Liver Research, The University of Hong Kong,
2Liver Cancer and Hepatitis Research Laboratory, Department of Pathology,
Li Ka Shing Faculty of Medicine, The University of Hong Kong
#To whom correspondence should be addressed: Prof. Irene O.L. Ng, Room 127B, University
Pathology Building, Department of Pathology, The University of Hong Kong, Queen Mary
Hospital, Pokfulam, Hong Kong. Tel: (852) 2255-3967; Fax: (852) 2872-5197; Email:
Running title: CD24+ cells drive self-renewal and tumor formation
Keywords: CD24; chemoresistance; Nanog; HCC; Stat3
Abbreviations: Tumor-initiating cells, T-IC; epithelial cell adhesion molecule, EpCAM;
hepatocellular carcinoma, HCC; immunohistochemistry, IHC; quantitative PCR , qPCR.
Financial support: The study was supported by Hong Kong Research Grants Council
Collaborative Research Fund (HKU 1/06C and HKU 7/CRF/09). I.O.L. Ng is Loke Yew Professor
in Pathology.
Acknowledgement: The authors would like to thank LKS Faculty of Medicine at The University
of Hong Kong for the Faculty Core Facility.
*ManuscriptClick here to view linked References

2
Summary
Tumor-initiating cells (T-ICs) are a subpopulation of chemoresistant tumor cells that have been
shown to cause tumor recurrence upon chemotherapy. Identification of T-ICs and their related
pathways are therefore priorities for the development of new therapeutic paradigms. We
established chemoresistant hepatocellular carcinoma (HCC) xenograft tumors in
immunocompromised mice in which an enriched T-IC population was capable of tumor initiation
and self-renewal. Using this model, we found CD24 to be up-regulated in residual chemoresistant
tumors when compared with bulk tumor upon cisplatin treatment. CD24+ HCC cells were found to
be critical for the maintenance, self-renewal, differentiation, and metastasis of tumors and to
significantly impact patients’ clinical outcome. Using a lentiviral-based knockdown approach,
CD24 was found to be a functional liver T-IC marker that drives T-IC genesis through
Stat3-mediated Nanog regulation. Our findings point to a CD24 cascade in liver T-ICs that may
provide an attractive therapeutic target for HCC patients.

3
Introduction
Hepatocellular carcinoma (HCC) is the fifth most common cancer in the world (Jemal et al., 2008).
The first line treatment for HCC is liver transplantation or surgical resection (Carr, 2004, Kassahun
et al., 2006). However, most HCCs are inoperable as patients present at advanced stages. Even after
surgical resection, the long-term prognosis of HCC remains unsatisfactory due to high
recurrence
rates. For HCC patients in advanced stages, chemotherapy via either transarterial
chemoembolization or a systemic route is the second-line treatment. Unfortunately, the overall
response rate is unsatisfactory due to the highly chemoresistant nature of the tumor and the toxicity
of the chemotherapeutic agents (Aguayo and Patt, 2001, Llovet and Bruix, 2003, Kuvshinoff and
Ota, 2002). Further investigation into the mechanism of chemoresistance of HCCs is needed to
improve the survival rate.
The cancer stem cell hypothesis posits that cancers are maintained in a hierarchical
organization of rare ‘cancer stem cells’ (or tumor-initiating cells, T-ICs), which divide rapidly into
amplifying cells and differentiated tumor cells (Dalerba et al., 2007). Owing to this unique survival
mechanism, this rare population of cells is resistant to the current chemotherapies (All-Hajj, 2007).
This hypothesis also provides an explanation for the failure of current treatment regimes due to the
fact that they are largely targeted at eradicating the rapidly proliferating tumor bulk. The existence
of T-ICs was first evidenced in acute myeloid leukemia (Lapidot et al., 1994) and more recently in
different solid tumors, including those of the brain (Singh et al., 2003), colon (O’Brien et al., 2007),
breast (Al-Hajj et al., 2003), prostate (Collin et al., 2005), melanoma (Fang et al., 2005), and
pancreas (Hermann et al., 2007). Integrative comparative genomic analysis has established
molecular similarities between T-ICs and normal tissue stem cells, suggesting a role for liver T-ICs
in hepatocarcinogenesis (Marquardt et al., 2010). Recently, liver T-ICs have been identified by
several cell surface antigens such as CD133 (Ma et al., 2007 and 2010), CD90 (Yang et al., 2008),
and EpCAM (Yamashita et al., 2009), and these T-ICs are capable of self-renewal and were found
to be resistant to chemotherapeutic drugs (Ma et al., 2008).
4
Because T-ICs are relatively resistant to chemotherapy, we enriched for liver T-ICs by
establishing chemoresistant HCC xenograft tumors in immunocompromised mice, mimicking the
clinical situation under which HCC patients receive chemotherapy. Using this model, we identified
CD24, a mucin-like cell surface glycoprotein, to be up-regulated in residual chemoresistant tumors
upon cisplatin treatment when compared with untreated tumors. To further investigate the role of
CD24+ cells in HCC, we isolated these cells from the HCC cell lines PLC/PRF/5 and HLE and
HCC clinical samples. Freshly isolated CD24+ cells were found to be more quiescent, greater
ability to form tumors in NOD/SCID mice, the ability to self-renew, differentiation and metastasis.
The clinical impact of CD24 was also addressed, and it was found to significantly correlate with
aggressive tumor behavior. Knockdown of CD24 by a lentiviral-based shRNA approach suppressed
the stem/progenitor cell characteristics, suggesting that CD24 is a functional marker of liver T-ICs.
Furthermore, we identified Nanog to be an important downstream effector of CD24-mediated HCC
tumorigenicity and self-renewal. cDNA microarray analysis revealed that regulation of Nanog by
CD24 was Stat3-dependent. Our findings may provide an attractive therapeutic approach of
targeting the CD24 cascade in liver T-ICs to achieve better clinical outcomes for HCC patients.
5
Results
CD24 was elevated in self-renewing liver cancer cells enriched by chemotherapy in an HCC
xenograft model
According to the ‘cancer stem cell’ hypothesis, chemotherapy reduces the tumor burden while
sparing a T-IC population endowed with drug-resistant properties (Ma et al., 2008, Pardal et al.,
2003). In order to determine whether liver T-ICs are enriched upon chemotherapy, a chemoresistant
xenograft model derived from HCC cell lines was established that mimics the heterogeneity
observed in patients' tumors. Tumor xenografts derived from PLC/PRF/5 cells were subcutaneously
inoculated into nude mice. When the tumors reached 4 mm in diameter, the mice were injected
intra-peritoneally with various doses of cisplatin. Such treatment resulted in variable tumor
inhibition among the xenografts (Figure 1A). The dosage of cisplatin for establishment of
chemoresistant tumor was determined experimentally by comparing the tumor response to several
different dosages ranging from 1 mg/kg to 5 mg/kg. From the dose response curve, 5 mg/kg was
chosen as the level at which further increase of cisplatin concentration did not further reduce the
tumor size (Figure 1B). To verify whether cisplatin at 5 mg/kg enriched the proportion of T-ICs in
the residual chemoresistant tumor, single HCC cells derived from untreated (control group) and
chemoresistant residual tumors (chemoresistant group) were isolated. The tumorigenicity of the
HCC cells derived from these two groups was compared after serial orthotopic transplantation of
5x10⁴
corresponding cells into SCID mice. Because the PLC/PRF/5 cells were labeled with the
luciferase gene, the tumorigenicity was evaluated using a xenogen imaging system. Compared with
HCC cells from untreated tumor, enhanced tumor-forming and self-renewal abilities were observed
in chemoresistant residual HCC cells, indicating successful enrichment for liver T-ICs in this
chemoresistant HCC xenograft model derived from PLC/PRF/5 cells (Figure 1C). To further
determine what markers are elevated in self-renewing chemoresistant HCC cells, the messenger
RNA profiles from tumors derived from the untreated and chemoresistant groups (5 mg/kg) were
compared using a cDNA microarray containing 34,000 genes (data not shown, unpublished). CD24,
6
but not other currently known liver T-IC markers (CD133, CD90, and EpCAM), was found to be
up-regulated by two folds in the chemoresistant group compared to the control group. To validate
this observation, we studied the expression of CD24 by qPCR and immunohistochemistry (IHC) in
the tumors. Consistent with the cDNA microarray data, CD24 was found to be up-regulated by
three folds by qPCR (Figure 1D). Similarly, IHC studies also showed that CD24 expression was
dramatically higher in the chemoresistant group relative to the control group (Figure 1E). To
exclude the possibility of a cell-type specific effect, CD24 expression was further evaluated in the
same chemoresistant model using another HCC cell line, Huh-7. By IHC staining, CD24 expression
was dramatically higher in the chemoresistant group (Figure S1).
CD24 expression in HCC cell lines and human HCC sspecimens
To determine whether CD24 marks more tumorigenic liver cells, we examined its expression by
flow cytometry (FACS) analysis in a panel of liver cell lines, including the non-tumorigenic
immortalized cell line MIHA and the HCC cell lines Huh-7, Hep3B, BEL7402, PLC/PRF/5, HLE,
BEL7402, MHCC-97L, MHCC-97H, and MHCC-LM3. Variable expression of CD24 was found in
the HCC cell lines with in vivo tumor forming ability. In contrast, the immortalized
non-tumorigenic cell line MIHA, which is incapable of tumor formation in vivo showed no CD24
expression (Figure 1F). These results suggest that CD24 expression might play a role in tumor
development in vivo. Next, we asked whether CD24 was overexpressed in patient HCC specimens
when compared with non-tumor counterparts. We performed IHC staining for CD24 on 41 human
HCC tissue samples as well as their non-tumor counterparts. The percentage of CD24+ cells in the
HCC specimens ranged from 0% to 16%, whereas there was no CD24 expression in the non-tumor
counterparts. Among all HCC specimens, over 70% (29/41) of the cases showed CD24 expression
in less than 2% of cells (Figure 1G & 1H). Thus, CD24 was expressed sporadically in human HCC
specimens.
7
CD24+
HCC cells possessed characteristics of stem/progenitor cells
T-ICs are believed to possess the stem/progenitor properties of relative quiescence (Friel et al.,
2008), self-renewal (Patrawala et al., 2005), and tumorigenicity in immunodeficient mice (Li et al.,
2007). First, we determined whether CD24+ HCC cells were more tumorigenic than their CD24
-
counterparts in vivo by tumor-forming assay using CD24+ and CD24
- cells purified from
PLC/PRF/5 and HLE cell lines. Purified cells were inoculated subcutaneously into NOD/SCID
mice. A significant difference in tumor incidence was observed between CD24+ and CD24
- cells
(Figure 2A & 2B). As few as 500 CD24+ cells were sufficient for consistent tumor development in
NOD/SCID mice (Table S1A & 1B). A key property of stem cells, including T-ICs, is their unique
ability to undergo self-renewal (Patrawala et al., 2005). One method of evaluating self-renewal
capacity is by testing serial passage ability. After xenografts derived from sorted PLC/PRF/5 cells
formed, the corresponding tumors were excised from the primary recipients, dissociated into a
single-cell suspension, grown in culture for approximately one week, re-sorted into CD24+ and
CD24- cells using an antibody specific to human CD24, and then re-injected into secondary mouse
recipients. About three weeks, all the secondarily xenografted mice injected with CD24+ cells
showed tumor formation that reconstituted the phenotypic heterogeneity of the primary xenografts
(Figure 2A & 2B), providing direct evidence of the self-renewal ability of the cell population.
Consistently, as few as 500 CD24+
cells were sufficient for tumor formation (Table S1C). In
addition, all secondary xenografts formed around three weeks, a significantly shorter tumor latency
period than for the primary xenografts. Normal and neoplastic stem-like cells from epithelial organs
can be expanded as sphere-like aggregates in serum-free EGF-bFGF-supplemented medium and
undergo serial passage (Liu et al., 2005). To obtain further evidence for the self-renewal ability of
CD24+ cells, we performed a sphere formation assay. Compared with CD24
- cells, significantly
larger and more hepatospheres were observed in CD24+ cells isolated from both PLC/PRF/5 and
HLE cells (Figure 2C), which supports the greater self-renewal capability of CD24+ HCC cells. It is
believed that quiescence is one of the characteristics of stem cells (Friel et al., 2008). To compare
8
the relative quiescence of CD24+ and CD24
- cell fractions, cell proliferation rate was measured.
Colony formation assay revealed that CD24+ cells derived from PLC/PRF/5 and HLE proliferated
at a significantly lower rate than CD24- cells (P <0.010 and P <0.001, respectively, t test, Figure
2D). Finally, we addressed whether CD24+ cells had other intrinsic properties of stem cells by
examining the expression of certain ‘stemness’ associated genes that are crucial in pathways and
programs that establish and maintain stem cell-like characteristics. Using qPCR analysis, we found
that CD24+ fractions purified from both PLC/PRF/5 and HLE cells had a general overexpression of
these genes (Figure 2E).
Clinical ssignificance of CD24 in HCC
We have demonstrated that sorted CD24+ cells derived from HCC cell lines possess
stem/progenitor characteristics (Figure 2). To examine the role of CD24+ HCC cells in HCC
patients, we isolated single HCC cells from fresh HCC clinical samples and separated them into
CD24+ and CD24
- cell populations. We examined whether CD24
+ HCC cells derived from HCC
clinical samples also possessed tumorigenicity and self-renewal ability. In colony formation assays,
CD24+ HCC cells were able to induce more and larger tumor colonies than their CD24
-
counterparts (P<0.001, t test) (Figure 3A) and this showed that CD24+ HCC cells were more
tumorigenic than CD24- cells in vitro. To evaluate the in vivo tumorigenicity, two fresh HCC
patient samples were used. By flow cytometry, corresponding CD24+
and CD24- cells were sorted
from patient #71 and patient #73, and their CD24 expression was found to be 15% and 2%,
respectively. As few as 4,000 CD24+ HCC cells are able to develop a tumor in NOD/SCID mice,
while there was no tumor formation with CD24- cells after 70 days of tumor inoculation (Figure 3B
& 3C). The capacity of CD24+ cells for self-renewal was also evidenced by sphere formation
assays and evaluation of stemness genes by quantitative PCR. CD24+ HCC cells preferentially
expressed stemness genes and were able to survive in anchorage-independent serum-free EFG-FGF
supplemented medium (Figure 3D & 3E). CD24 expression was previously found to be
9
overexpressed in HCC and has prognostic significance (Huang and Hsu, 1995; Yang et al., 2009).
Next, we investigated the potential relationship between CD24 expression and the clinical outcome
of HCC patients. We retrospectively analyzed the CD24 expression in 46 HCC patients by
quantitative PCR. The cut off value of T/N >3 was used to determine CD24 expression in HCC
patients. Eighteen (39.1%) of the 46 cases showed more than three-fold CD24 overexpression in
the HCC tumor tissues as compared with the corresponding non-tumorous liver tissues, and these
were considered the high CD24 expression group. The correlation between CD24 overexpression
and the clinico-pathologic features is summarized in Table 1. Patients whose tumors had high
CD24 expression had a significantly higher risk of tumor recurrence in the first year after surgery
(P=0.002, 2
test), and higher serum AFP level (P=0.009, 2
test). Their tumors more frequently
had venous infiltration (P=0.003, 2
test), presented at advanced tumor stages (P=0.010, 2
test).
Patients with CD24 overexpression in their tumors had significantly shorter disease-free survival
than those with low CD24 expression (P=0.002, log-rank test) (Figure 3F). Consistently, patients
with CD24 overexpression had shorter overall survival, though this did not reach statistical
significance (P=0.113, log-rank test) (Figure 3F). All in all, CD24 overexpression in HCC
correlated with more aggressive tumor behavior and worse clinical outcome.
CD24+
HCC cells had the capacity to metastasize in vivo
Venous infiltration is an important pathologic feature determining HCC metastasis and tumor
recurrence (Arii et al., 1992). As shown in Table 1, high CD24 expression significantly correlated
with venous infiltration. This finding suggests that CD24+ cells are endowed with metastatic
features. To test this hypothesis, we first isolated CD24+ and CD24
- cells from PLC/PRF/5 and
examined their invasive and migratory abilities using matrigel invasion and transwell migration
assay, respectively. Prior to each experiment, trypan blue assay was performed to show that cell
viability of sorted cells from both subpopulations was greater than 90% (data not shown). As
compared to CD24-
cells, CD24+ cells displayed approximately 3.7-fold and 5-fold higher cell

10
migration and invasion efficiency, respectively (P<0.001, t test) (Figure 4A & 4B). To test the in
vivo metastatic role of CD24+ cells, an experimental metastasis model was employed in which
1x10⁵ CD24
+ or CD24
- cells were injected into NOD/SCID mice through tail vein injection. After
40 days, the formation of tumor foci in the lungs was evaluated with a xenogen imaging system.
Three out of five (60%) mice injected with CD24+ cells showed tumor formation in the lungs,
whereas none of the mice injected with CD24- cells showed tumor formation in the lungs (Figure
4C & 4D). In addition, lung metastasis was also observed in NOD/SCID mice after subcutaneous
injection of CD24+ derived from patient #71 and #73 (Figure S2A). Histological evidence for the
lack of tumorigenicity in NOD/SCID mice inoculated with CD24- cells is shown in Figure S2B.
These data support the hypothesis that CD24+
T-ICs represent a distinct invasive T-IC population
that contributes to tumor metastasis. Recent studies have suggested that CD133 and EpCAM are
putative T-IC markers for HCC (Ma et al., 2007, Yamashita et al., 2007). By flow cytometric
analysis, we examined and compared the expression of each marker in Huh-7 cells. CD24
expression was found to overlap with that of CD133 and EpCAM, suggesting that these three
markers share similar self-renewal pathways (Figure S3A). Contrary to CD133 and EpCAM, we
observed only a very low, if at all, overlapping expression between CD24 and CD90 (~1%) (data
not shown). In view of this, we proceeded to examine whether CD24 serves a unique function of
liver T-IC over CD90 using a CD90 lentiviral based shRNA knockdown approach in MHCC97H
cells, which was found to contain the highest CD24 expression among a panel of liver cell lines
tested (Yang et al., 2008). CD90-repressed clones (shRNA CD90) or CD90 expressing clones
(non-target control) were first sorted for CD24+ and CD24
- cells; and then examined for differential
tumorigenic capacity (Figure S3B). CD24+ liver T-ICs were found to be more tumorigenic than
CD24- non-T-ICs. Further, the ability of CD24
+ CD90 expressing or knockdown cells to initiate
tumor formation were very similar, with a tumor initiation rate of 83.3% and 75%, respectively
(Figure S3C). Thus, we concluded that CD24 do serve as a unique function in the T-ICs of HCC.
11
CD24+
HCC cells had the capacity to differentiate in vitro
To investigate the differentiation capacity of CD24+ cells, we first cultivated the cells dissociated
from fresh HCC clinical tissues in such specified medium as ‘hepatospheres’, to obtain
undifferentiated cells. These hepatospheres were serially passaged by trypsinization into single
cells to re-form new hepatospheres and, after three passages, all the floating hepatospheres were
observed to be CD24+
(data not shown), suggesting the inability of CD24- cells to survive in
serum-free conditions. To evaluate the differentiation potential of CD24+
cells, hepatospheres were
cultivated without EGF or FGF in the presence of 10% serum. After one day of culture, floating
undifferentiated cells attached to the glass, gradually flattened out from the hepatospheres, and
became large and adherent cells. Upon differentiation, the hepatospheres gained CK18 expression
and lost CD24 expression, and they acquired a morphology closely resembling the HCC cells
present in the original tumor (Figure 4E). By qPCR, we found consistent decline in CD24 and
‘stemness’-associated genes upon differentiation of the hepatospheres derived from HCC patient
samples (Figure 4F). The same phenomenon was observed upon differentiation of the
hepatospheres derived from the HCC cell line PLC/PRF/5 (Figure 4G). To further explore the
capacity of CD24+
cells to differentiate, highly purified CD24+ and CD24
- cells were separately
cultured in 10% serum-supplemented medium for two weeks, following which the expression of
CD24 was analysed in each population by flow cytometry. We found that the CD24+ proportion
dramatically declined after three days, and reverted almost to the pre-sorting level, whereas CD24-
cells retained low expression of CD24 even after two weeks, indicating that CD24- cells arose only
from CD24+ cells and not vice versa (Figure 4H). In addition, by single cell sorting, increase in
CK18 expression was observed in CD24+ cells but not in CD24
- cells upon differentiation (Figure
S4).
CD24 knockdown reduced stem/progenitor characteristics in HCC cells
It is yet to be proven whether T-IC cell surface markers are just physical markers or whether they
12
functionally contribute to the traits of stem/progenitor cells. Therefore, we performed a CD24
knockdown experiment using a lentiviral-based approach in cells that highly express CD24 (Huh-7
and PLC/PRF/5). After confirmation of successful knockdown with a 50% to 60% reduction
(Figure 5A & 5B) in CD24 expression in clones #121 and #278, respectively, in both Huh-7 and
PLC/PRF/5, we first compared the expression of ‘stemness’-associated genes between CD24
knockdown clones and non-target controls. Compared with the non-target controls, these genes,
including Sox2, Oct4, and Nanog, were down-regulated in Huh-7 and PLC/PRF/5 knockdown
clones (#278) (Figure 5A & 5B). Consistent down-regulation of the above stemness genes was
observed in clone #121 (data not shown). Next, we examined the tumorigenicity of Huh-7 cells
upon CD24 knockdown. After four weeks, we found that both the number and size of the tumors
was lower in clone #278 when compared with the non-target control group (Figure 5C & Table S2).
The effect of CD24 knockdown on tumorigenicity was also examined in PLC/PRF/5 cells. Either
CD24 knockdown cells or control cells (15,000) were injected into the liver of SCID mice. The
incidence of tumor formation was 60% (3/5) whereas it was 20% (1/5) in the CD24 knockdown
group (Figure 5D). In the control group, all SCID mice showing tumor formation exhibited lung
metastasis. However, no lung metastasis was observed in the CD24 knockdown group, further
suggesting the metastatic role of CD24 in HCC (Figure 5E). The effect of CD24 knockdown on cell
proliferation was also examined with the colony formation assay. We found that CD24 knockdown
cells proliferated more rapidly than the non-target control cells (Figure 5F). The effect of CD24
knockdown on self-renewal was also examined by sphere formation assay. We found that CD24
knockdown cells generated fewer and smaller hepatospheres in their first and second passages
(Figure 5G). In addition, knockdown of CD24 in Huh-7 cells increased the sensitivity of cells to
both cisplatin and doxorubicin (Figure S5A). Similarly, by cell sorting approach, CD24+ HCC cells
derived from PLC/PRF/5 were more chemoresistant than CD24- cells (Figure S5B).
CD24 drove tumor initiation and self-renewal by mediating a self-renewal gene, nanog
13
To determine the major downstream mediator of CD24 in tumor initiation and self-renewal, we
scrutinized the qPCR data for effects of CD24 on ‘stemness’-associated genes by both cell sorting
and lentiviral-knockdown approach. The effect of CD24 on the expression of ‘stemness’-associated
genes in both HCC cell lines and clinical samples is summarized in Table S3. Among the genes we
examined, Nanog and Sox2 were found to be consistently altered upon loss of CD24 in the four
HCC cell lines and two HCC clinical samples studied. To further identify the major mediator of
CD24 function, we sought a correlation between the expression of CD24 with Nanog and Sox2 in
five HCC cell lines that expressed different levels of CD24. In these five HCC cell lines, CD24
expression positively correlated with Nanog expression but not with Sox2 (Figure 6A & S6A). Next,
we examined the correlation between CD24 and Nanog by qPCR using the same cohort of HCC
patients. Consistently, CD24 significantly correlated with Nanog expression in these 46 HCC
patient samples (P=0.026; r=0.325, Pearson’s correlation) (Table S4, Figure 6B). To determine
whether CD24 drives tumor initiation and self-renewal by activating Nanog gene expression, we
overexpressed Nanog in a CD24 knockdown clone (#278) of Huh-7 cells to investigate whether the
effect of CD24 knockdown could be eliminated upon transfection with Nanog. Using the lentiviral
approach, Nanog was overexpressed in a CD24 knockdown clone (#278) of Huh-7 cells and the
expression level was comparable to the non-target control (Figure 6C). After successful
confirmation of Nanog overexpression in the CD24 knockdown Huh-7 cells, we compared in SCID
mice the tumor forming abilities of CD24 knockdown Huh-7 cells with and without Nanog
overexpression. The tumorigenicity of CD24 knockdown cells increased upon Nanog transfection,
and it was comparable to that of the non-target controls (Figure 6D, Table S5). The effect of Nanog
overexpression on the self-renewal ability of CD24 knockdown Huh-7 cells was also studied using
the sphere formation assay. This revealed that CD24 knockdown cells generated greater and larger
hepatospheres in their first and second passages upon Nanog overexpression (Figure 6E). This
result provides direct evidence that CD24 mediates tumor initiation and self-renewal by driving up
Nanog expression.
14
CD24 regulated nanog expression through Stat3 phosphorylation
Being a transmembrane protein (Sammar et al., 1997), CD24 should be able to transmit
extracellular signals to the nucleus to activate Nanog expression. In order to identify the
cytoplasmic mediator linking CD24 and Nanog, a cDNA microarray (the Affymetrix Human
genome U133 gene chip) was used to compare the gene expression profiles of CD24 knockdown
Huh-7 cells and non-target control cells. By Ingenuity Pathway analysis, several canonical
pathways were identified, among which ‘acute phase response signaling’ was found to be the most
significantly altered (Figure S6B). One of the key components of this signaling cascade is the IL6
pathway, a pathway important for liver stem cell maintenance, in which phosphorylation of Stat3 at
the Tyrosine705 residue is critical (Lin et al., 2009, Tang et al., 2008). The pathway analysis
suggested the importance of Stat3 phosphorylation in the IL6 pathway, as the expression of several
genes downstream of Stat3 was altered upon CD24 knockdown (Figure S6C). In embryonic stem
cells, phosphorylated Stat3 was found to bind to the murine Nanog promoter and activate its
transcription (Suzuki et al., 2006). We therefore hypothesized that CD24 transcriptionally regulated
Nanog expression through Stat3 phosphorylation. To test this hypothesis, we first examined the
expression of Stat3 and its phosphorylated form in CD24 knockdown clones of Huh-7 and
PLC/PRF/5 cells. We found less phosphorylated Stat3 (Y705) upon CD24 knockdown but not so
for its parental form (Figure 6F); this is consistent with the cDNA microarray finding that there was
no change in the mRNA level of Stat3. To further examine whether the regulation of Nanog
expression in HCC cells is Stat3 dependent, we examined pStat3 (Y705) and Nanog expression in
response to a Stat3 inhibitor (S3I-201) in PLC/PRF/5 and Huh-7 cells. Nanog expression was found
to be down-regulated upon S3I-201 treatment in a dose-dependent manner (Figure S7A). This
observation was further confirmed when we found overexpression of CD24 ORF into CD24
negative cells, MIHA, resulted in a significant increase in pStat3 (Y705) and Nanog expression;
while addition of varying doses of S3I-201 led to abolishment of this effect (Figure S7B). To
validate the transcriptional regulation of Nanog by CD24, we transfected a GFP-tagged Nanog
15
promoter into PLC/PRF/5 cells to monitor its activity. By FACS-sorting, the GFP signal was found
to be notably higher in the CD24+ fraction, reflecting up-regulation of Nanog transcription, and this
signal was decreased upon addition of S3I-201 (Figure 6G). To further examine the potential
binding between phosphorylated Stat3 and the Nanog promoter, a ChIP-qPCR assay was
performed. In Figure 6H, we demonstrated binding between phosphorylated Stat3 and Nanog
promoters in Huh-7 and PLC/PRF/5 cells. Conversely, upon CD24 knockdown, there was a
decrease of p-Stat3 binding on the Nanog promoters in these two cell lines. CD24 was previously
found to be associated with Src-associated kinase (Sammar et al., 1997), which phosphorylates
Stat3 (Byers et al., 2009). By overexpression and knockdown approaches, activated form of Src
(pY416) was consistently altered but not JAK2, another molecule that has previously been found to
phosphorylate Stat3 (Hedvat et al., 2009) (Figure S7C-E), which suggests that CD24 potentially
phosphorylates Stat3 through Src but not JAK. These findings demonstrate the positive link
between CD24 expression, STAT3 activation and Nanog transcription.
16
Discussion
According to the ‘cancer stem cell hypothesis’, T-IC populations become enriched upon
chemotherapy due to their unique survival mechanism. Recently, this theory has been
experimentally proven in various cancer systems including breast and lung cancer (Bertolini et al.,
2009, Yu et al., 2007). In this study, we successfully enriched for liver T-ICs using a
chemoresistant HCC xenograft model. In this model, cisplatin-treated HCC cells showed enhanced
self-renewal capacity and tumorigenicity when compared with untreated control cells. By cDNA
microarray, we found that CD24 was up-regulated in the enriched T-IC population, and this was
confirmed by qPCR and IHC staining. To eliminate the possibility that up-regulation of CD24 upon
chemotherapy was a cell-type specific effect, we confirmed CD24 up-regulation by IHC staining
using xenografts derived from another HCC cell line, Huh-7.
The CD24 gene encodes a heavily glycosylated cell surface protein anchored to the membrane
by phosphatidylinositol (Pirruccello et al., 1986). CD24 is an oncogene, which are overexpressed in
various human malignancies (Kristiansen et al., 2002, Kristiansen et al., 2003). It also plays a role
during the embryonal development of pancreatic cells (Cram et al., 1999). Recent studies have
suggested that CD24 may be a negative T-IC marker with specific regards to breast cancer (Al-Hajj
et al., 2003). Intriguingly, increasing evidence has shown that CD24+ tumor cells are T-ICs for
gastrointestinal cancers such as colon cancer (Yeung et al., 2010), pancreatic cancer (Li et al.,
2007), and cholangiocarcinoma (Wang et al., 2010). To determine whether CD24+ cells were liver
T-ICs, we isolated CD24+ and CD24
- fractions from HCC cell lines and human HCC samples by
cell sorting. We found that CD24+ HCC cells showed higher tumorigenicity than their CD24
-
counterparts in NOD/SCID mice. In addition, CD24+ HCC cells were capable of self-renewal, as
they could propagate in another mouse recipient upon serial transplantation. The self-renewal
ability of CD24+ HCC cells was further evidenced by the more and larger hepatospheres they
generated in sphere formation assays when compared with their CD24- counterpart. The above
phenotype was also associated with increased expression of stemness genes. Consistently, CD24+

17
HCC cells were found to be more quiescent and to proliferate more slowly in colony formation
assays. Moreover, CD24+ HCC cells were able to differentiate into CD24
- cells, but not vice versa
by single cell sorting approach.
To examine whether CD24 was specific for liver T-ICs, we performed CD24
immunostaining of 41 paraffin-embedded HCC clinical samples and their non-tumor counterparts.
We found that only a minority of HCC cells showed CD24 expression, whereas no CD24
expression was observed in the non-tumor liver tissues. Flow cytometric analysis also suggested
scanty expression of CD24 in several fresh HCC clinical samples (data not shown). Using qPCR on
HCC resected specimens; we found that CD24 overexpression was significantly associated with
shorter disease-free survival of patients. In addition, CD24 overexpression was significantly
correlated with early recurrence of HCC after surgery in the present study, suggesting the ability of
CD24+
tumor cells to re-establish tumor growth. These data support a previous study showing that
CD24 is a useful predictive marker for early recurrence of HBV-related HCC (Woo et al., 2008). It
has been predicted that T-ICs might also primarily be responsible for the formation of tumor
metastases (Dalerba and Clarke, 2007). CD24 overexpression was also significantly correlated with
venous infiltration, which is an important clinico-pathologic feature of HCC metastasis. Both in
vitro and in vivo data demonstrate that CD24+
HCC cells alone have the capacity to initiate and
sustain tumor growth, leading eventually to cancer metastasis. Thus far, CD133 and EpCAM have
been identified as putative T-IC markers for HCC (Ma et al., 2007, Yamashita et al., 2009).
However, their metastatic potential has not been investigated. Using flow cytometric analysis, we
found that CD24 expression overlapped with the expression of both CD133 (~90.9%) and EpCAM
(~55.8%), suggesting that they may share common self-renewal pathways. However, unlike CD24,
CD133+
liver T-ICs have previously been found to have a greater proliferative potential than
CD133- counterparts (Ma et al., 2007). We do not, at the moment, have an explanation to why
CD24 and CD133 subpopulations display different proliferative potential, as demonstrated by
colony formation assay. Yet, we speculate that since CD24 expression do not completely overlap
18
with CD133 (9.1% CD24+CD133
-) and EpCAM (44.2% CD24
+EpCAM
-), it is possible that these
T-IC markers may display different tumorigenic and metastatic potentials. In terms of their
tumorigenic potential, 2x10⁴ CD133
+ and 1x10
4 EpCAM
+ HCC cells derived from patient samples
were previously reported to be needed for efficient tumor formation in immunodeficient mice (Ma
et al., 2010; Yamashita et al., 2009). And in our current study, we found that as few as 4,000
CD24+ HCC cells were sufficient for consistent tumor initiation.
Unlike CD133 and EpCAM, CD24 showed only very low overlapping expression with
CD90. Using a CD90 shRNA knockdown approach, CD90-repressed clones or CD90 expressing
clones were sorted for CD24+ and CD24
- cells. The tumorigenicity of CD24
+ CD90 expressing or
knockdown cells were found to be very similar indicating that CD24 can serve as a unique function
in the T-ICs of HCC. In terms of metastatic potential, 5,000 CD90+ liver T-ICs was previously
reported to induce lung metastasis following orthotropic injection in 50% of the animals examined
(Yang et al., 2008) while in our current study, we found that only 4,000 CD24+ liver T-ICs derived
from patient samples was sufficient to induce lung metastasis following subcutaneous injection in
100% of the animals tested. These results demonstrate the superiority of CD24 in some aspects
over currently available liver T-IC markers.
Using lentiviral-based RNA interference approach, CD24 was found to be functional liver
T-IC marker. Also, in an orthotopic HCC tumor model, CD24 knockdown not only inhibited the
growth of tumors but also inhibited metastasis to the lungs of SCID mice. Furthermore, we found
that stemness genes such as Oct4, Sox2, and Nanog were down-regulated when CD24 was knocked
down, suggesting a crosstalk between CD24 signaling and stemness gene expression. Interestingly,
we found a significant correlation between CD24 expression and Nanog expression in a panel of
HCC cell lines and HCC clinical samples. Nanog is a self-renewal gene that maintains the
pluripotency of embryonic stem cells (Silva et al., 2009). Recently, Nanog was identified as a new
oncogene by large-scale oncogenomic analysis (Mattison et al., 2010), and Nanog expression
regulates human tumor development (Jeter et al., 2009). To determine if CD24 drove tumor
19
initiation and self-renewal through activation of Nanog gene expression, we overexpressed Nanog
in a CD24 knockdown clone (#278) of Huh-7 cells. We found that the effect of CD24 knockdown
was eliminated upon transfection of Nanog, demonstrating that CD24 up-regulates Nanog
expression to initiate tumor formation and self-renewal. However, by western blot analysis, we
found that CD24 expression did not change upon overexpression of Nanog and inhibition of Stat3
(data not shown). This indicates that Nanog and Stat3 truly are downstream targets of CD24.
By cDNA microarray comparison of gene expression between CD24 knockdown cells and
control cells, we found that the IL6/Stat3 pathway was significantly down-regulated upon CD24
knockdown. The IL6/Stat3 pathway has been previously demonstrated to play important roles in
the maintenance and proliferation of liver T-ICs (Lin et al., 2009, Tang et al., 2008). CD24 is
associated with Src-associated kinase (Sammar et al., 1997), which phosphorylates Stat3 (Byers et
al., 2009). By overexpression and shRNA knockdown approaches, pY416-Src was consistently
altered with phosphorylated Stat3 (Y705) and Nanog expression, which suggests that CD24 might
act on Stat3 through Src. By ChIP assay, we found binding of phosphorylated Stat3 (Y705) to
Nanog promoter, which is consistent to the previous study shown in murine system (Suzuki et al.,
2006). Upon CD24 knockdown in Huh-7 and PLC/PRF/5, there was reduced binding between
phosphorylated Stat3 (Y705) and Nanog promoter. By western blot analysis, we found that less
phosphorylated Stat3 (Y705) was observed in CD24 knockdown cells. It is controversial whether
Nanog is regulated in a Stat3-dependent manner (Humphrey et al., 2004). Nanog expression was
found to be reduced in a dose-dependent manner upon addition of S3I-201, indicating a regulatory
role of Stat3 on Nanog expression. Using GFP as a reporter of Nanog promoter activity, we found
that CD24+ PLC cells showed higher Nanog promoter activity, and this activity was reduced upon
addition of S3I-201. This result suggests that CD24 activates Nanog promoter in a Stat3-dependent
manner.
Current chemotherapy against HCC usually primarily directs against the bulk population of
the tumor. Although these therapies are able to initially shrink the primary tumors, they fail to

20
consistently eradicate the lesions, leading to tumor relapse. In this study, we identified CD24+ HCC
cells within these small lesions, and they functioned to initiate tumor growth and self-renewal
through Stat3-mediated Nanog up-regulation. The identification of CD24 signaling pathways
provides an attractive therapeutic strategy against this deadly disease.

21
Experimental Procedures
Human HCC tissue collection and processing. Liver tumor and adjacent non-tumor liver tissue
specimens were collected from six patients (Patient #3, 36, 38, 51, 71, and 73) (age ranging from 37
to 82) who underwent hepatectomy for HCC between 2008 and 2010 in the Department of Surgery,
Queen Mary Hospital, Hong Kong, with Institutional Review Board (IRB) approval. Tumor tissue
from xenografts and fresh tumors was minced into 1 mm3 cubes and incubated with Type IV
Collagenase (Sigma, St. Louis, MO) for 5-10 minutes at 37°C. A single-cell suspension was
obtained by filtering the supernatant through a 100-μm cell strainer (BD Biosciences, San Jose,
CA). Cell viability was assessed by trypan blue exclusion staining and counting using a
hemocytometer. For fresh clinical tumors, removal of CD45+ cells from within the tumor was done
with a CD45 depletion kit (Miltenyi Biotech, Germany).
Isolation of CD24+ and CD24
− populations by flow cytometry and magnetic bead cell sorting. For
magnetic cell sorting, cells were labeled with PE-conjugated CD24 antibody (clone ML5) (BD
Pharmingen, San Jose, CA) followed by anti-PE microbeads (Miltenyi Biotec, Germany). Sorting
was carried out using the Miltenyi Biotec MACS Cell Separation Kit according to the
manufacturer’s instructions. Magnetic separation was performed up to three times to obtain a
CD24+ population more than 95% pure. Aliquots of CD24
+ and CD24
− sorted cells were evaluated
for purity with a FACSCalibur machine and CellQuest software (BD Biosciences San Jose, CA).
For isolation of CD24+ and CD24
- cell populations, cells were stained with PE-conjugated CD24
antibody (BD Biosciences, San Jose, CA) and with isotype-matched mouse immunoglobulin as a
control. Samples were analyzed and sorted on a BD FACSAria (BD Biosciences San Jose, CA).
For the positive and negative populations, only the top 10% most brightly stained cells and the
bottom 10% most dimly stained cells were selected, respectively. Aliquots of CD24+
and CD24−
sorted cells were evaluated for purity with a FACSCalibur machine and CellQuest software (BD
Biosciences San Jose, CA).
22
In Vivo tumorigenicity experiments. Different numbers of cells were injected subcutaneously
either into severe combined immunodeficient (SCID)-beige or non-obese diabetic (NOD)/SCID
mice. For an orthotopic tumor model, approximately 15,000 PLC/PRF/5 cells in 30 L of culture
medium were injected into the left liver lobe of the SCID-beige mice using a method described
previously (Fu et al., 1991). For those HCC cells labeled with luciferase, imaging was performed
using a Xenogen IVIS 100 cooled CCD camera (Xenogen, California) on Day 40. The mice were
given intraperitoneal injections with 200 µL of 15 mg/mL D-luciferin 15 min before imaging. For
imaging, the mice were placed in a light-tight chamber, the acquisition time ranged from 3 sec to 1
min, and pseudoimages of the emitted light in photons/s/cm2/steradian superimposed over the
gray-scale photographs of the animal were taken.
Chemoresistant tumor model. Subcutaneous xenografts were established using the PLC/PRF/5 and
Huh-7 HCC cell line. The animals used to test the treatment were 4- to 6-week-old male athymic
nude mice (BALB/c-nu/nu). Treatment was started once the size of the xenograft reached
approximately 4 mm in diameter. The mice were randomly assigned into four groups, each
consisting of three mice. They were treated with cisplatin intra-peritoneally every 4 days for 4
weeks at either 1) cisplatin (1 mg/kg), 2) cisplatin (2 mg/kg) or 3) cisplatin (5 mg/kg).
Statistical analyses. All statistical analyses were performed using the statistical software SPSS 17
for Windows (SPSS Inc., Chicago, IL). Fisher’s exact test was used to assess the correlation
between clinico-pathological parameters and CD24 overexpression for HCC patients. Student’s t or
Mann-Whitney test was used for continuous data wherever appropriate. The survival curves were
assessed by the Kaplan-Meier method, and the statistical difference between two groups was
evaluated by log rank test. P values less than 0.05 were considered statistically significant.
23
References
Aguayo, A., and Patt, Y.Z. (2001). Nonsurgical treatment of hepatocellular carcinoma. Semin.
Oncol. 28, 503–513.
Al-Hajj, M. (2007). Cancer stem cells and oncology therapeutics. Curr. Opin. Oncol. 19, 61–64.
Al-Hajj, M., Wicha, M.S., Benito-Hernandez, A., Morrison, S.J., and Clarke, M.F. (2003).
Prospective identification of tumorigenic breast cancer cells. Proc. Natl. Acad. Sci. USA 100,
3983–3988.
Arii, S., Tanaka, J., Yamazoe, Y., Minematsu, S., Morino, T., Fujita, K., Maetani, S., and Tobe, T.
(1992). Predictive factors for intrahepatic recurrence of hepatocellular carcinoma after partial
hepatectomy. Cancer 69, 913-919.
Bertolini, G., Roz, L., Perego, P., Tortoreto, M., Fontanella, E., Gatti, L., Pratesi, G., Fabbri, A.,
Andriani, F., and Tinelli, S., et al. (2009). Highly tumorigenic lung Cancer CD133+ cells display
stem-like features and are spared by cisplatin treatment. Proc. Natl. Acad. Sci. USA 106,
16281-16286.
Byers, L.A., Sen, B., Saigai, B., Diao, L., Wang, J., Nanjundan, M., Cascone, T., Mills, G.B.,
Heymach, J.V., and Johnson, F.M. (2009). Recipocal regulation of c-Src and Stat3 in non-small cell
lung cancer. Clin. Cancer Res. 15, 6852-6861.
Carr, B.I. (2004). Hepatocellular carcinoma: current management and future trends.
Gastroenterology 127, 218–224.
Collin, A.T., Berry, P.A., Hyde, C., Stower, M.J., and Maitland, N.J. (2005). Prospective
identification of tumorigenic prostate cancer stem cells. Cancer Res. 65, 10946–10951.
Cram, D.S., Mclntosh, A., Oxbrow, L., Johnston, A.M., and Deaizpurua, H.J. (1999). Differenital
mRNA display analysis of two related but functionally distinct rat insulinoma (RIN) cell lines:
identification of CD24 and its expression in the developing pancreas. Differentiation 64, 237-246.
Dalerba, P., Cho, R.W., and Clarke, M.F. (2007). Cancer stem cells: models and concepts. Annu.
Rev. Med. 58, 267–284.
Dalerba, P., and Clarke, M.F. (2007). Cancer stem cells and tumor metastasis: first steps into
uncharted territory. Cell Stem Cell 1, 241-242.
Fang, D., Nguyen, T.K., Leishear, K., Finko, R., Kulp, A.N., Hotz, S., Van Belle, P.A., Xu, X.,
Elder, D.E., and Herlyn, M. (2005). A tumorigenic subpopulation with stem cell properties in
melanomas. Cancer Res. 65, 9328–9337.

24
Friel, A.M., Sergent, P.A., Patnaude, C., Szotek, P.P., Oliva, E., Scadden, D.T. Seiden, M.V.,
Foster, R., and Rueda, B.R. (2008). Functional analyses of the cancer stem cell-like properties of
human endometrial tumor initiating cells. Cell Cycle 7, 242–249.
Fu, X., Besterman, J.M., Monosov, A., and Hoffman, R.M. (1991). Models of human metastatic
colon cancer in nude mice orthotopically constructed by using histologically intact patient
specimens. Proc. Natl. Acad. Sci. USA 88, 9345–9349.
Hedvat, M., Huszar, D., Herrmann, A., Gozqit, J.M., Schroeder, A., Sheephy, A., Buettner, R., Proia,
D., Kowolik, C.M., and Xin, H. et al. (2009). The JAK2 inhibitor AZD1480 potently bock Stat3
signaling and oncogenesis in solid tumors. Cancer Cell 16, 487-497.
Hermann, P.C., Huber, S.L., Herrler, T., Aicher, A., Ellwart, J.W., Guba, M., Bruns, C.J., and
Heeschen, C. (2007). Distinct populations of cancer stem cells determine tumor growth and
metastatic activity in human pancreatic cancer. Cell Stem Cell 1, 313–323.
Huang, L.R., and Hsu, H.C. (1995). Cloning and expression of CD24 gene in human hepatocellular
carcinoma: a potential early tumor marker gene correlates with p53 mutation and tumor
differentiation. Cancer Res. 55; 4717-4721.
Humphrey, R.K., Beattie, G.M., Lopez, A.D., Bucay, N., King, C.C., Firpo, M.T., Rose-John, S.,
and Hayek, A. (2004). Maintenance of pluripotency in human embryonic stem cells is STAT3
independent. Stem Cells 22, 522-530.
Jemal, A., Siegel, R., Ward, E., Hao, Y., Xu, Y., Murray, T., and Thun, M.J. (2008). Cancer statistics.
CA. Cancer J. Clin. 58, 71–96.
Jeter, C.R., Badeaux, M., Choy, G., Chandra, D., Patrawala, L., Liu, C., Calhoun-Davis, T.,
Zaehres, H., Daley, G.Q., and Tang, D.G. (2009). Functional evidence that the self-renewal gene
NANOG regulates human tumor development. Stem cells 27, 993-1005.
Kassahun, W.T., Fangmann, J., Harm, J., Hauss, J., and Bartels, M. (2006). Liver resection and
transplantation in the management of hepatocellular carcinoma: a review. Ex. Clin. Transplant. 4,
549–558.
Kristiansen, G., Denkert, C., Schlüns, K., Dahl, E., Pilarsky, C., and Hauptmann, S. (2002). CD24
is expressed in ovarian cancer and is a new independent prognostic marker of patient survival. Am.
J. Pathol. 161, 1215–1221.
Kristiansen, G., Winzer, K.J., Mayordomo, E., Bellach, J., Schlüns, K., Denkert, C., Dahl, E.,
Pilarsky, C., and Altevogt, P. (2003). CD24 expression is a new prognostic marker in breast cancer.
Clin. Cancer Res. 9, 4906–4913.
25
Kuvshinoff, B.W., and Ota, D.M. (2002). Radiofrequency ablation of liver tumors: influence of
technique and tumor size. Surgery 132, 605–611.
Lapidot, T., Sirard, C., Vormoor, J., Murdoch, B., Hoang, T., Caceres-Cortes, J., Minden, M.,
Paterson, B., Caliqiuri, M.A., and Dick, J.E. (1994). A cell initiating human acute myeloid
leukaemia after transplantation into SCID mice. Nature 367, 645-648.
Li, C., Heidt, D.G., Dalerba, P., Burant, C.F., Zhang, L., Adsay, V., Wicha, M., Clarke, M.F., and
Simeone, M. (2007). Identification of pancreatic cancer stem cells. Cancer Res. 67, 1030–1037.
Lin, L., Amin, R., Gallicano, G.I., Glasgow, E., Jogunoori, W., Jessup, J.M., Zasloff, M., Marshall,
J.L., Shetty, K., and Johnson, L., et al. (2009). The Stat3 inhibitor NSC 74859 is effective in
hepatocellular cancers with disrupted TGF-beta signaling. Oncogene 28, 961-972.
Liu, S., Dontu, G., and Wicha, M.S. (2005). Mammary Stem cells, self-renewal pathways, and
carcinogenesis. Breast Cancer Res. 7, 86-95.
Llovet, J.M., and Bruix, J. (2003). Systematic review of randomized trials for unresectable
hepatocellular carcinoma: chemoembolization improves survival. Hepatology 37, 429–442.
Ma, S., Chan, K.W., Hu, L., Lee, T.K., Wo, J.Y., Ng, I.O., Zheng, B.J., and Guan, X.Y. (2007).
Identification and characterization of tumorigenic liver cancer stem/progenitor cells.
Gastroenterology 132, 2542-2556.
Ma, S., Lee, T.K., Zheng, B.J., Chan, K.W., and Guan, X.Y. (2008). CD133+ HCC cancer stem
cells confer chemoresistance by preferential expression of the Akt/PKB survival pathway.
Oncogene 27, 1749-1758.
Ma, S., Tang, K.H., Chan, Y.P., Lee, T.K., Kwan, P.S., Castilho, A., Ng, I.O., Man, K., Wong, N.,
and To, K.F., et al. (2010). miR-130b promotes CD133(+) liver tumor-initiating cell growth and
self-renewal via tumor protein 53-induced nuclear protein 1. Cell Stem Cell 7, 694-707.
Marquardt, J.U., and Thorgeirsson, S.S. (2010). Stem cells in hepatocarcinogenesis: evidence from
genomic data. Semin. Liver Dis. 1, 26-34.
Mattison, J., Kool, J., Uren, A.G., de Ridder, J., Wessels, L., Jonkers, J., Bignell, G.R., Butler, A.,
Rust, A.G., and Brosch, M., et al. (2010). Novel candidate cancer genes identified by a large-scale
cross species comparative oncogenomics approach. Cancer Res. 70, 883-895.
O’Brien, C.A., Pollett, A., Gallinger, S., and Dick, J.E. (2007). A human colon cancer cell capable
of initiating tumor growth in immunodeficient mice. Nature 445, 106–110.
Pardal, R., Clarke, M.F., and Morrison, S.J. (2003). Applying the principles of stem-cell biology to
cancer. Nat. Rev. Cancer 3, 895–902.
26
Patrawala, L., Calhoun, T., Schneider-Broussard, R., Zhou, J., Claypool, K., and Tang, D.G. (2005).
Side population is enriched in tumorigenic, stem-like cancer cells, whereas ABCG2+ and ABCG2−
cancer cells are similarly tumorigenic. Cancer Res. 65, 6207–6219.
Pirruccello, S.J., and LeBien, T.W. (1986). The human B cell-associated antigen CD24 is a single
chain sialoglycoprotein. J. Immunol. 136, 3779–3784.
Sammar, M., Gulbins, E., Hilbert, K., Lang, F., and Altevogt, P. (1997). Mouse CD24 as a signaling
molecule for integrin-mediated cell binding: functional and physical association with src-kinase.
Biochem. Biophys. Res. Commun. 234, 330-334.
Silva, J., Nichols, J., Theunissen, T.W., Guo, G., van Oosten, A.L., Barrandon, O., Wray, J.,
Yamanaka, S., Chambers, I., and Smith, A. (2009). Nanog is the gateway to the pluripotent ground
state. Cell 138, 7227-7237.
Singh, S.K., Clarke, I.D., Terasaki, M., Bonn, V.E., Hawkins, C., Squire, J., and Dirks, P.B. (2003).
Identification of a cancer stem cell in human brain tumors. Cancer Res. 63, 5821–5828.
Suzuki, A., Raya, A., Kawakami, Y., Morita, M., Matsui, T., Nakashima, K., Gage, F.H.,
Roddriguez-Esteban, and Izpisua Belmonte, J.C. (2006). Nanog binds to Smad1 and clocks bone
morphogenetic protein-induced differentiation of embryonic stem cells. Proc. Natl. Acad. Sci. USA
103, 10294-10299.
Tang, Y., Kitisin, K., Jogunoori, W., Li, C., Deng, C.X., Mueller, S.C., Ressom, H.W., Rashid, A.,
He, A.R., and Mendelson, J.S., et al. (2008). Progenitor/stem cells give rise to liver cancer due to
aberrant TGF-beta and IL-6 signaling. Proc. Natl. Acad. Sci. USA 105, 2445-2450.
Wang, M., Xiao, J., Shen, M., Yahong, Y., Tian, R., Zhu, F., Jiang, J., Du, Z., Hu, J., and Liu, W., et
al. (2010). Isolation and characterization of tumorigenic extrahepatic cholangiocarcinoma cells with
stem cell-like properties. Int. J. Cancer 128, 72-81.
Woo, H.G., Park, E.S., Cheon, J.H., Kim, J.H., Lee, J.S., Park, B.J., Kin, W., Park, S.C., Chung, Y.J.,
and Kim, B.G., et al. (2008). Gene expression-based recurrence prediction of hepatitis B
virus-related human hepatocellular carcinoma. Clin. Cancer Res. 14, 2056-2064.
Yamashita, T., Ji, J., Budhu, A., Forgues, M., Yang, W., Wang, H.Y., Jia, H., Ye, Q., Qin, L.X., and
Wauthier, E. et al (2009). EpCAM-positive hepatocellular carcinoma cells are tumor-initiating cells
with stem/progenitor cell features. Gastroenterology 136, 1012-1024.
Yang, X.R., Xu, Y., Yu, B., Zhou, J., Li, J.C., Qiu, S.J., Shi, Y.H., Wang, X.Y., Dai, Z., and Shi,
G.M., et al. (2009). CD24 is a novel predictor for poor prognosis of hepatocellular carcinoma after
surgery. Clin. Cancer Res. 15, 5518-5527.
Yang, Z.F., Ho, D.W., Ng, M.N., Lau, C.K., Yu, W.C., Ngai, P., Chu, P.W., Lam, C.T., Poon, R.T.,
and Fan, S.T. (2008). Significance of CD90+ cancer stem cells in human liver cancer. Cancer Cell

27
13, 153-166.
Yeung, T.M., Gandhi, S.C., Wilding, J.L., Muschel, R., and Bodmer, W.F. (2010). Cancer stem cells
from colorectal cancer-derived cell lines. Proc. Natl. Acad. Sci. USA 107, 3722-3727.
Yu, F., Yao, H., Zhu, P., Zhang, X., Pan, Q., Gong, C., Huang, Y., Hu, X., Su, F., and Lieberman, J.
et al. (2007). Let-7 regulates self-renewal and tumorigenicity of breast cancer cells. Cell 131,
1109-1123.
28
Figure Legends
Figure 1. Up-regulation of CD24 in self-renewing liver cancer cells in chemoresistant HCC
xenograft model. (A) Nude mice with xenograft tumors of 4 mm in diameter were separated into 4
groups and given different dosages (1 mg/kg, 2 mg/kg, 5 mg/kg, and no-drug control) of cisplatin at
embedded intervals of 4 days for 4 weeks. (B) The dosage of 5 mg/kg was found to be optimal to
achieve enrichment of chemoresistant cells, because further administration of drug from day 14
onwards did not cause significant shrinkage of the tumors, indicating that the majority of cells
remaining in the small tumors were insensitive to cisplatin. (C) When the cells dissociated from the
‘resistant group’ and ‘untreated group’ tumors were injected orthotopically into secondary SCID
mice recipients, 5 104 cells from the ‘resistant group’ were sufficient to form tumors, whereas no
tumors were formed from the ‘untreated group’ cells. (D) By qPCR, it was shown that CD24 was
2.9-fold higher in the PLC/PRF/5-derived ‘resistant group’ tumor cells. (E) Similarly, higher
expression of CD24 at the protein level was shown by IHC analysis of paraffin-embedded tumor
tissue. CD24-positivity in the PLC/PRF/5 and Huh-7 derived tumor was found to be increased in
the ‘chemoresistant group’ when compared with the ‘untreated group’. See also Figure S1. (F) By
FACS analysis, it was found that MIHA, a non-tumorigenic liver cell line, did not express CD24,
whereas the HCC cell lines tested varied in their expression levels, ranging from 6.4±2.6% in
MHCC-97L to 97.7±1.5% in Huh-7 cells. (G &H) By IHC, it was shown that in clinical specimens,
the non-tumorous liver tissues away from the HCC tumors stained negative for CD24, whereas in
the tumorous tissues the expression of CD24 was scarce (29/41, i.e. 70.7% of cases examined had
<2% positivity) and usually in few isolated cells. Error bars represent standard deviation (SD) from
at least three independent experiments.
Figure 2. CD24+
HCC cells possessed traits of stem/progenitor cells. (A) Representative images
of the primary-sorted PLC/PRF/5 and HLE and secondary PLC/PRF/5 cell-induced tumor
formation. See also Table S1. Right flanks were injected with CD24+ cells while left flanks were
29
injected with CD24- cells. Red arrow indicates the site of tumor formation for HLE cells (B)
Paraffin-embedded tissue of the xenotransplanted tumors were processed for H&E staining and
IHC to detect CD24 expression. These representative images show that in cases of tumor formation,
tumor cell heterogeneity, in terms of both cell morphology and CD24 expression, was observable.
(C) By sphere forming assay, the in vitro self-renewal ability was enhanced in CD24+ cells from
PLC/PRF/5 and HLE (left column). Secondary spheres formed from dissociating both spheres also
demonstrated enhanced serial sphere-forming capacity in CD24+ cells, respectively (right column).
(D) By colony formation assay on the sorted cells of PLC/PRF/5 and HLE), it was demonstrated
that CD24+ HCC cells had a significantly lower proliferation rate when compared with CD24
- cells
respectively (P <0.010 and P <0.001, respectively, t test). (E) CD24+ cells from the two HCC
cell lines, PLC/PRF/5 and HLE, overexpressed several genes related to ‘stemness’ when compared
to CD24- cells. (p<0.05; p<0.01) Error bars represent standard deviation (SD) from at least
three independent experiments.
Figure 3. Clinical relevance of CD24 expression. (A) When cells from a fresh clinical HCC
sample (Patient #38) were sorted magnetically into CD24+ and CD24
- fractions, the CD24
+ cells
displayed significantly enhanced anchorage-independent growth in the soft-agar colony formation
assay, indicating higher in vitro tumorigenicity. (B) As few as 4000 CD24+ HCC cells (4/4) from
two clinical HCCs induced tumor formation. Right flanks were injected with CD24+ cells while left
flanks were injected with CD24- cells. Red arrows indicate the site of tumor formation. (C)
Paraffin-embedded tissues of the xenotransplanted tumors were processed for H&E staining and
IHC to detect CD24 expression. (D) CD24+ cells from primary HCC samples overexpressed several
genes related to ‘stemness’ when compared with CD24- cells. (p<0.05; p<0.01) (E). By sphere
forming assay, the in vitro self-renewal ability was enhanced in CD24+ cells from fresh HCC tumor
(Patients #36, #38 and #51). (F) Kaplan-Meier curves for disease-free and overall survival were
compared according to the CD24 expression in tumor tissues. The overall and disease-free survival
30
of HCC patients with CD24 overexpression in their tumors were 36.7 and 6.6 months as compared
with 94.2 and 42.4 months in patients with low CD24 expression (P=0.113 and 0.002, respectively,
log-rank test). Error bars represent standard deviation (SD) from at least three independent
experiments.
Figure 4. CD24+ HCC cells had the capacity to differentiate and metastasize in vivo. (A&B)
Using trans-well migration and invasion assays, it was shown that the CD24+ fraction of sorted
PLC/PRF/5 cells had enhanced migratory (P<0.001, t test) and invasive properties (P<0.001, t
test) in vitro. (C&D) By experimental metastatic assay in NOD/SCID mice which was evaluated by
bioluminescent imaging, it was found that CD24+ PLC/PRF/5 cells injected intravenously
successfully colonized the lungs in 3 of 5 mice, whereas the CD24-
cells did not colonize,
indicating enhanced in vivo metastatic ability. (E) By immunofluorescence staining, spheres of
stem-like cells derived from clinical HCC cells displayed strong expression of CD24, and CD24
expression (green color) was lost and CK18 (marker for differentiated hepatoyctes; red color) was
gained near peripheral region upon differentiation. The cells are counterstained with DAPI. (F&G)
By comparing the gene expression of spheres of stem-like cells with their differentiated progenies,
it was found that, for both PLC/PRF/5 cell line and clinical HCC cells (Patient #3), CD24
expression was relatively higher in the spheres than in the parental cells. The ‘stemness’ of the
spheres was also reflected by the overexpression of several ‘stemness’-associated genes. (H) Upon
culture in serum-containing medium for 2 weeks, FACS-sorted CD24+ PLC/PRF/5 cells gradually
reconstituted the original proportion of CD24-expressing cells, whereas CD24- cells failed to give
rise to the original heterogeneity of CD24 expression. Error bars represent standard deviation (SD)
from at least three independent experiments. See also Figures S2, S3 and S4.
Figure 5. CD24 knockdown reduced characteristics of liver T-ICs. (A&B) Knockdown of
CD24 in Huh-7 and PLC/PRF/5 cells resulted in down-regulation of several genes related to

31
‘stemness’ as compared to the non-target control (NTC). (p<0.05; p<0.01, t test) (C) CD24
knockdown (shCD24) HCC cells exhibited reduced tumor-forming incidence when compared with
NTC cells. See also Table S2. Right flanks were injected with NTC cells while left flanks were
injected with shCD24 cells. Corresponding paraffin-embedded tissue of the xenotransplanted
tumors were processed for H&E staining and IHC to detect CD24 expression. (D) The effect of
CD24 knockdown on tumorigenicity of PLC/PRF/5 cells was evaluated using xenogen
bioluminescence imaging. Representative image of tumor developed from PLC/PRF/5 cells derived
from NTC (left) and shCD24 (right) and corresponding paraffin-embedded tissue of the
xenotransplanted tumors were processed for H&E staining and IHC to detect CD24 expression. (E)
H & E staining of paraffin-embedded lung tissue from SCID mice after orthotopic injection of NTC
cells. Black arrows indicate the tumor foci within the lung tissue. (F) Knockdown of CD24 in
Huh-7 and PLC/PRF/5 cells resulted in significant increase in proliferative rate respectively
(P=.017 and P=.032, respectively, t test). (G) Knockdown of CD24 also reduced the size and
number of hepatospheres formed in Huh-7 and PLC/PRF/5 cells (P<0.001, t test). In addition,
knockdown of CD24 decreased the ability of cells to form secondary hepatospheres (P<0.001, t
test). Error bars represent standard deviation (SD) from at least three independent experiments. See
also Figure S5.
Figure 6. CD24 drove tumor formation and self-renewal via Stat3-mediated Nanog regulation.
(A) Nanog expression in different HCC cell lines was evaluated by qPCR and found to
significantly correlate with CD24 expression (P=0.012, r= 0.955, Pearson’s Correlation). (B).
CD24 expression significantly correlated with Nanog expression in 46 HCC patients (P=0.026,
r=0.325, Pearson’s Correlation). (C) Nanog was successfully transfected in a CD24 knockdown
clone (#278) of Huh-7 cells and the expression level was comparable to the non-target control. (D)
The tumorigenicity of CD24 knockdown cells increased upon Nanog transfection. Representative
image of tumor developed from Huh-7 derived from shCD24 (left) and shCD24-Nanog (right). (E)
32
In addition, Nanog overexpression in shCD24 knockdown cells also increased the sizes of and
number of hepatospheres formed in Huh-7 and PLC/PRF/5 cells (P<0.001, t test). In addition,
Nanog overexpression increased the ability of cells to form primary and secondary hepatospheres
in shCD24 cells respectively (P<0.001, t test). (F) Decreased level of phosphorylated Stat3 (Y705)
but not its parental form was observed after CD24 knockdown in Huh-7 and PLC/PRF/5 cells. (G)
Quantitative assessment of GFP-positive cells by flow cytometry for Nanog promoter activity.
Flow cytometry analysis showed a 4.5-fold increase in the percentage of GFP-positive cells in
CD24+ PLC/PRF/5 cells when compared with CD24
- cells, and its percentage decreased after
incubation of S3I-201 at 200 M. Immunofluorescence staining also revealed increase of GFP
signal in CD24+ cells when compared with its CD24
- counterpart. (H) A marked decrease of pStat3
bound on the upstream of transcriptional start site of Nanog was found upon CD24 knockdown
Huh-7 and PLC/PRF/5 cells as compared with the corresponding vector control in ChIP assay.
Normal rabbit antibody added served as a negative control. Error bars represent standard deviation
(SD) from at least three independent experiments. See also Figures S6 and S7 and Tables S3, S4
and S5.

Figure 1Click here to download high resolution image

Figure 2Click here to download high resolution image

Figure 3Click here to download high resolution image
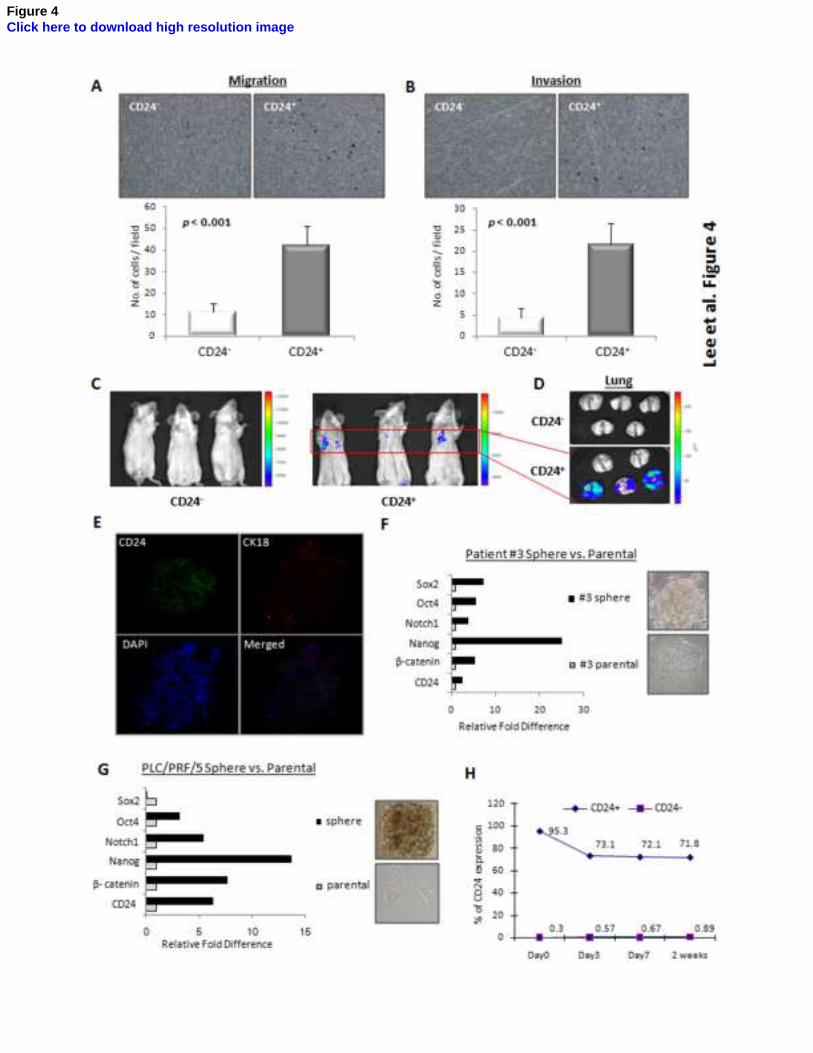
Figure 4Click here to download high resolution image

Figure 5Click here to download high resolution image
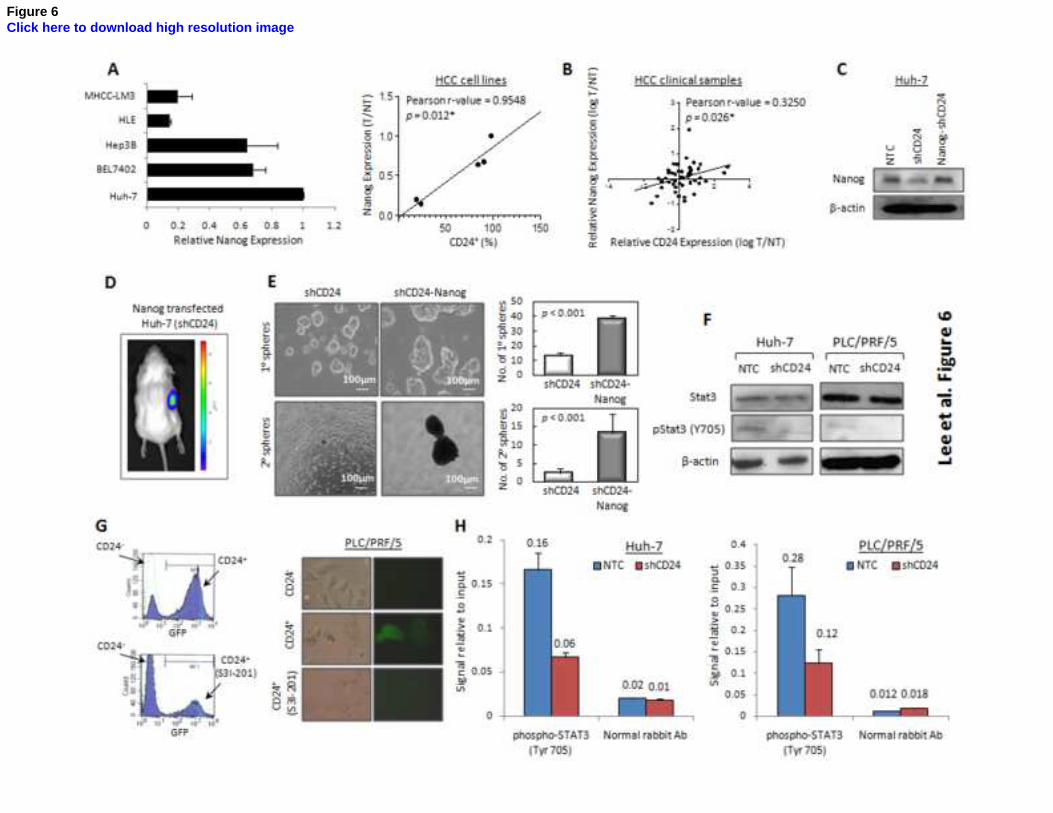
Figure 6Click here to download high resolution image
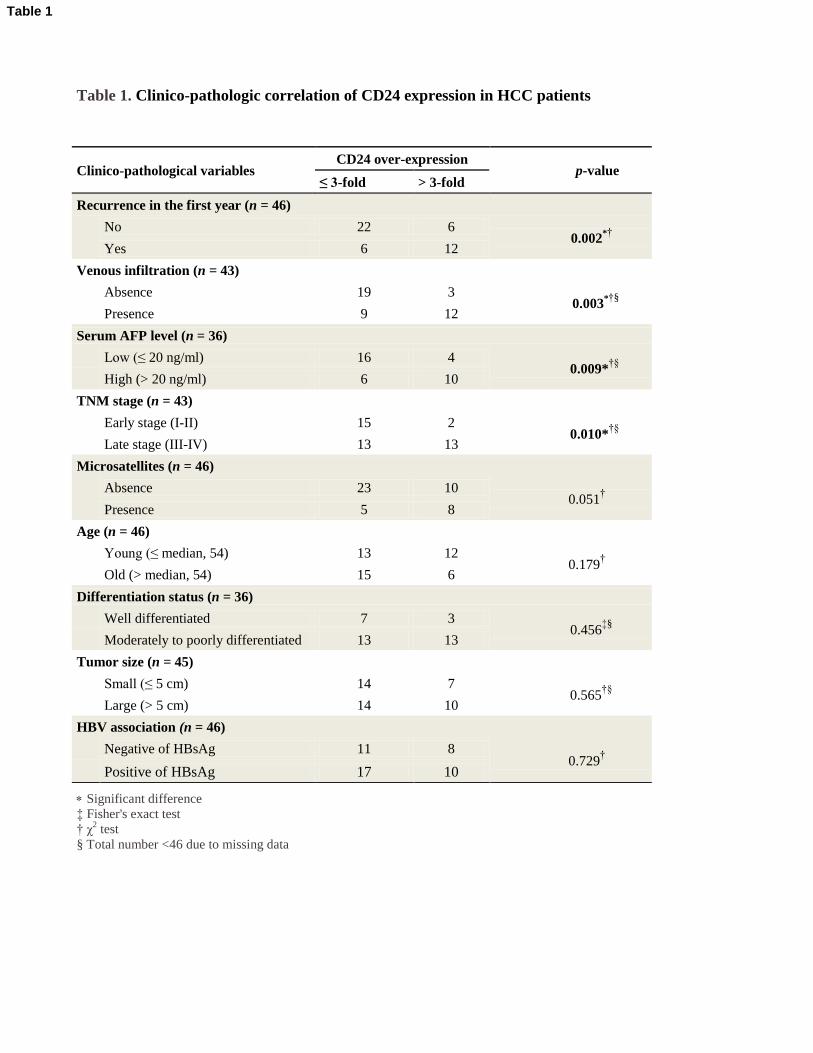
Table 1. Clinico-pathologic correlation of CD24 expression in HCC patients
Significant difference
‡ Fisher's exact test
† χ2 test
§ Total number <46 due to missing data
Clinico-pathological variables CD24 over-expression
p-value ≤ 3-fold > 3-fold
Recurrence in the first year (n = 46)
No 22 6
0.002*†
Yes 6 12
Venous infiltration (n = 43)
Absence 19 3
0.003*†§
Presence 9 12
Serum AFP level (n = 36)
Low (≤ 20 ng/ml) 16 4
0.009*†§
High (> 20 ng/ml) 6 10
TNM stage (n = 43)
Early stage (I-II) 15 2
0.010*†§
Late stage (III-IV) 13 13
Microsatellites (n = 46)
Absence 23 10
0.051†
Presence 5 8
Age (n = 46)
Young (≤ median, 54) 13 12
0.179†
Old (> median, 54) 15 6
Differentiation status (n = 36)
Well differentiated 7 3
0.456‡§
Moderately to poorly differentiated 13 13
Tumor size (n = 45)
Small (≤ 5 cm) 14 7
0.565†§
Large (> 5 cm) 14 10
HBV association (n = 46)
Negative of HBsAg 11 8
0.729†
Positive of HBsAg 17 10
Table 1
CD24+ liver tumor-initiating cells drive self-renewal and tumor initiation through Stat3-
mediated Nanog regulation
Terence Kin Wah Lee, Antonia Castilho, Vincent Chi Ho Cheung, Kwan Ho Tang, Stephanie Ma,
Irene Oi Lin Ng
Inventory of Supplemental Information
1. Supplemental Figures and Tables
Figure S1: related to Figure 1. Up-regulation of CD24 in a chemoresistant HCC xenograft model
derived from Huh-7 cells.
Figure S2: related to Figure 4. Histological analysis of lung and skin of NOD/SCID mice.
Figure S3: related to Figure 4. CD24 serves unique function in T-IC of HCC.
Figure S4: related to Figure 4. Differentiation capacity of CD24+ HCC cells by single cell sorting
approach.
Figure S5: related to Figure 5. The effect of CD24 altered expression on chemosensitivity of HCC
cells.
Figure S6: related to Figure 6. Significance of Stat3 phosphorylation in CD24 signaling pathway.
Figure S7: related to Figure 6. CD24 phosphorylates Stat3 (Y705) through Src.
Table S1: related to Figure 2. Tumorigenicity of CD24- and CD24
+ HCC cells in NOD/SCID mice.
Table S2: related to Figure 5. In vivo tumor development of shCD24 and non-target control cells
from Huh-7 in SCID mice.
Table S3: related to Figure 6. Expression of stemness associated genes including -catenin, Nanog,
Notch1, Sox2, Oct4, Nestin, Smo, Bmi-1, ABCB5, ABCG2, ABCB1, ABCC1, and ABCC2 in CD24
deficient cells by both cell sorting and knockdown approach.
Table S4: related to Figure 6. Correlation between CD24 and Nanog expression in 46 HCC clinical
samples.
Table S5: related to Figure 6. In vivo tumor development experiments of shCD24 and Nanog-
shCD24 cells from Huh-7 in SCID mice.
2. Supplemental Experimental Procedures
3. Supplemental References
Inventory of Supplemental Information
CD24+ liver tumor-initiating cells drive self-renewal and tumor initiation through Stat3-
mediated Nanog regulation
Terence Kin Wah Lee, Antonia Castilho, Vincent Chi Ho Cheung, Kwan Ho Tang, Stephanie Ma,
Irene Oi Lin Ng
Supplemental Figures and Legends
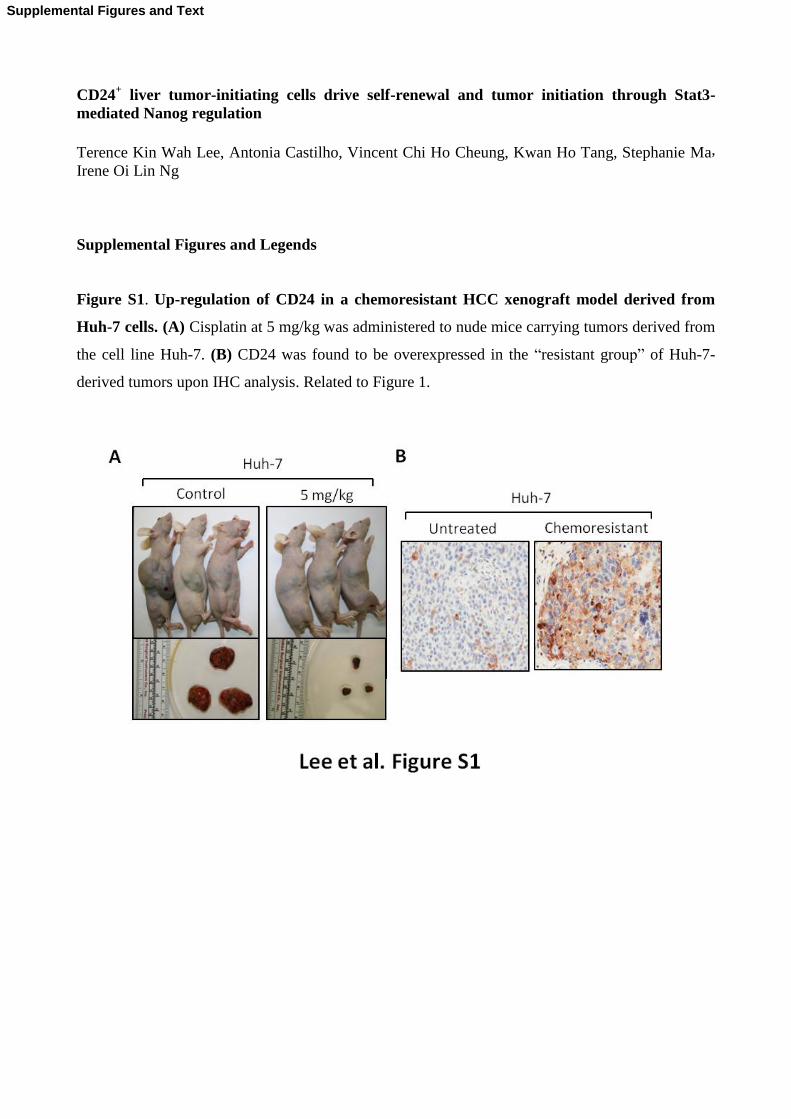
Figure S1. Up-regulation of CD24 in a chemoresistant HCC xenograft model derived from
Huh-7 cells. (A) Cisplatin at 5 mg/kg was administered to nude mice carrying tumors derived from
the cell line Huh-7. (B) CD24 was found to be overexpressed in the “resistant group” of Huh-7-
derived tumors upon IHC analysis. Related to Figure 1.
Supplemental Figures and Text

Figure S2. Histological analysis of lung and skin of NOD/SCID mice. (A) Histological analysis
showed lung metastasis after subcutaneous inoculation of CD24+ cells derived from patient #71 and
#73. (B) Lack of tumorigenicity in the skin of NOD/SCID mice inoculated with CD24- cells
derived from patient #71. Related to Figure 4.

Figure S3. CD24 serves unique function in T-IC of HCC. (A) CD24 expression significantly
overlapped with the expression of the markers CD133 and EpCAM. By FACS analysis on Huh-7
cells, the majority of CD24+ cells expressed the two other reported HCC T-IC markers, EpCAM
(55.8%) and CD133 (90.9%). 100% EpCAM+ cells were CD24
+, and 98.9% CD133
+ cells were
CD24+. (B) CD90 was knocked down in MHCC-97H cells by lentiviral based approach. (C) As
few as 500 CD24+ HCC cells from MHCC-97H induced tumor formation. Right flanks were
injected with CD24+ cells while left flanks were injected with CD24
- cells. Black arrows indicate
the site of tumor formation. Tumorigenicity of CD24+
cells is comparable between CD90
knockdown cells (75%) and control cells (83.3%). Related to Figure 4.

Figure S4. Differentiation capacity of CD24+ HCC cells by single cell sorting approach. CD24
-
and CD24+ single cells from PLC/PRF/5 cells were isolated by single cell sorting. Corresponding
cells are seeded onto 96 well plates and grown in 10% FBS supplemented medium. After 3 weeks,
CK18 expression was evaluated by Cells-to CT™ kit (Applied Biosystems, Foster city, CA). CK18
was 4 fold more in CD24+ cells when compared with CD24
- cells. Upon differentiation, there is no
apparent increase in CK18 expression in CD24- cells while there is 3.69-fold increase in CK18
expression in CD24+ cells. Error bars represent standard deviation (SD) from at least three
independent experiments. Related to Figure 4.

Figure S5. The effect of CD24 altered expression on chemosensitivity of HCC cells. (A) Upon
CD24 knockdown in Huh-7 cells, CD24 knockdown cells are more chemosensitive to cisplatin
(27.3% vs 12.3%) and doxorubicin (39.3% vs 24.4%) when compared with control cells after
treatment for 24 hours at 5 µg/mL and 3 µg/mL respectively. (B) By Annexin V staining, CD24+
cells derived from PLC/PRF/5 is more chemoresistant to cisplatin (35.4% vs 71.1%) and
doxorubicin (38.6% vs 78.2%) when compared with CD24- cells after treatment for 24 hours at 10
µg/mL and 6 µg/mL, respectively. Related to Figure 5.
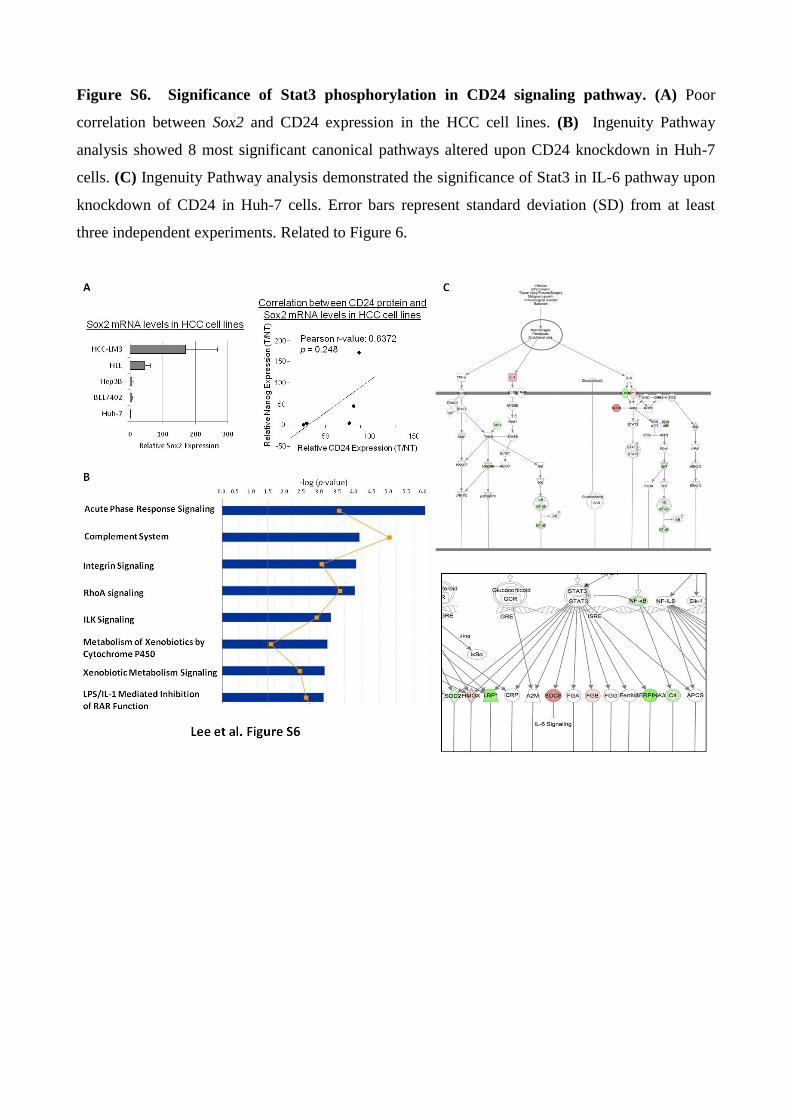
Figure S6. Significance of Stat3 phosphorylation in CD24 signaling pathway. (A) Poor
correlation between Sox2 and CD24 expression in the HCC cell lines. (B) Ingenuity Pathway
analysis showed 8 most significant canonical pathways altered upon CD24 knockdown in Huh-7
cells. (C) Ingenuity Pathway analysis demonstrated the significance of Stat3 in IL-6 pathway upon
knockdown of CD24 in Huh-7 cells. Error bars represent standard deviation (SD) from at least
three independent experiments. Related to Figure 6.
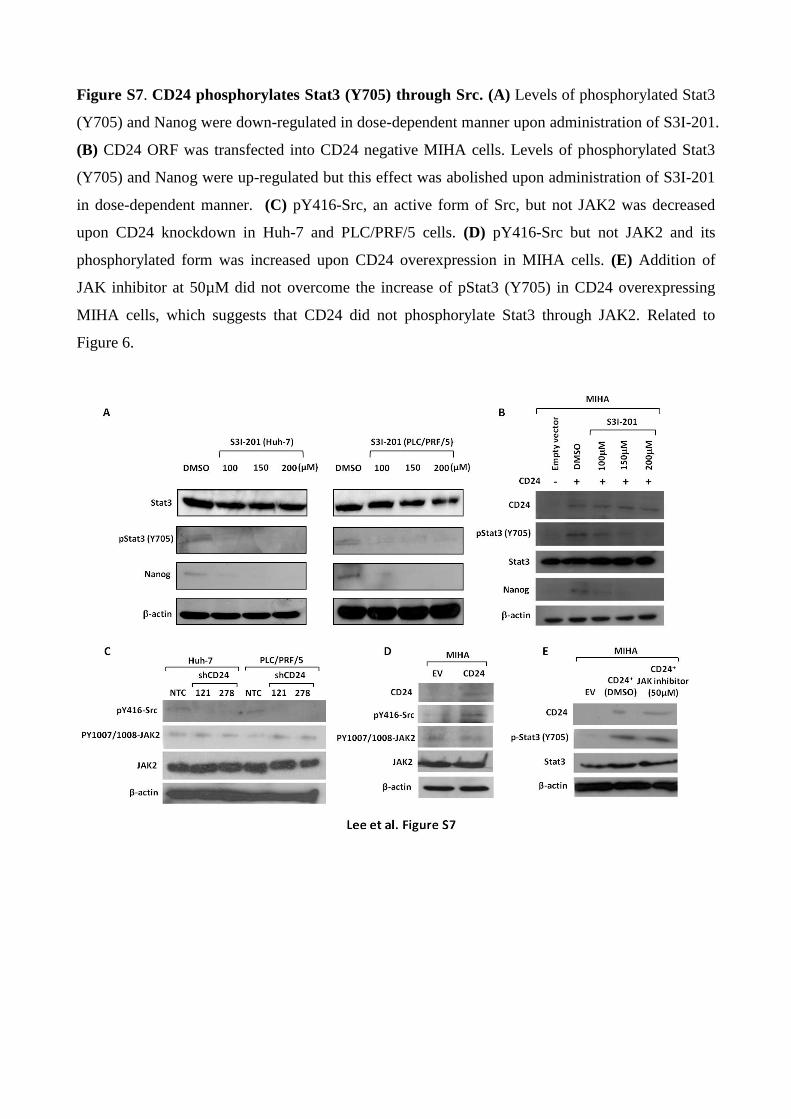
Figure S7. CD24 phosphorylates Stat3 (Y705) through Src. (A) Levels of phosphorylated Stat3
(Y705) and Nanog were down-regulated in dose-dependent manner upon administration of S3I-201.
(B) CD24 ORF was transfected into CD24 negative MIHA cells. Levels of phosphorylated Stat3
(Y705) and Nanog were up-regulated but this effect was abolished upon administration of S3I-201
in dose-dependent manner. (C) pY416-Src, an active form of Src, but not JAK2 was decreased
upon CD24 knockdown in Huh-7 and PLC/PRF/5 cells. (D) pY416-Src but not JAK2 and its
phosphorylated form was increased upon CD24 overexpression in MIHA cells. (E) Addition of
JAK inhibitor at 50µM did not overcome the increase of pStat3 (Y705) in CD24 overexpressing
MIHA cells, which suggests that CD24 did not phosphorylate Stat3 through JAK2. Related to
Figure 6.

Supplemental Tables
Table S1. Tumorigenicity of CD24- and CD24
+ HCC cells in NOD/SCID mice. (A)
Subcutaneous in vivo tumor development by CD24- and CD24
+ cells sorted from PLC/PRF/5 in
NOD/SCID mice. (B) In vivo tumor development experiments of CD24- and CD24
+ cells sorted
from HLE in NOD/SCID mice. (C) Subcutaneous in vivo tumor development of serially
transplanted CD24- and CD24
+ cells sorted from CD24
+ HCC cell-derived xenograft tumors in
NOD/SCID mice. Related to Figure 2.

Table S2. In vivo tumor development of shCD24 and non-target control cells from Huh-7 in
SCID mice. Related to Figure 5.

Table S3. Expression of stemness associated genes including -catenin, Nanog, Notch1, Sox2,
Oct4, Nestin, Smo, Bmi-1, ABCB5, ABCG2, ABCB1, ABCC1, and ABCC2 in CD24 deficient
cells by both cell sorting and knockdown approach. Related to Figure 6.
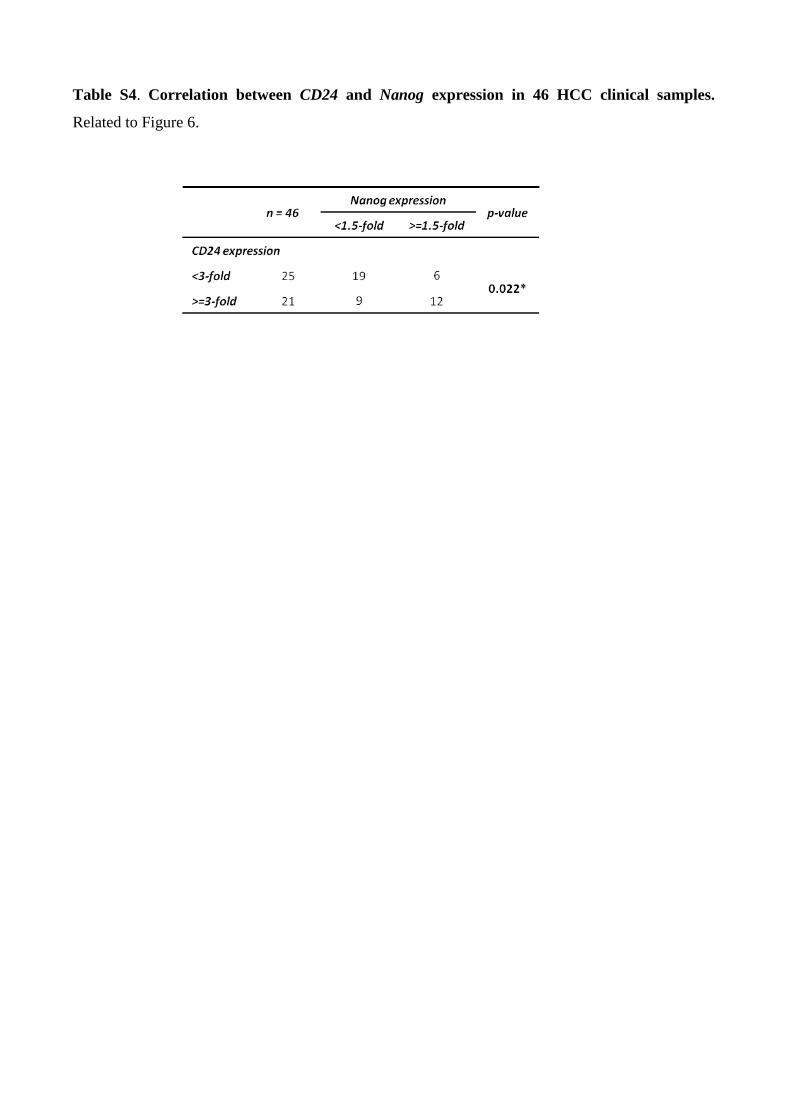
Table S4. Correlation between CD24 and Nanog expression in 46 HCC clinical samples.
Related to Figure 6.
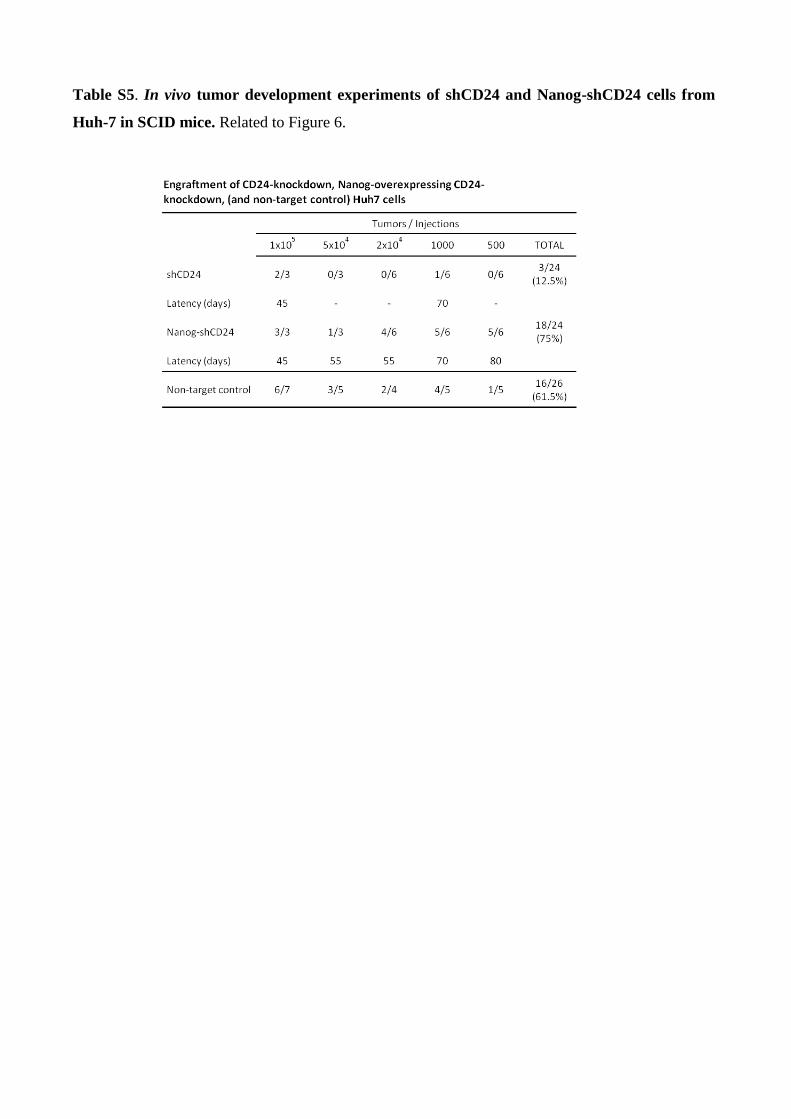
Table S5. In vivo tumor development experiments of shCD24 and Nanog-shCD24 cells from
Huh-7 in SCID mice. Related to Figure 6.
Supplemental Experimental Procedures
Cell lines and cell culture. The human HCC cell lines MHCC-97L, MHCC-97H, MHCC-LM3
(from Liver Cancer Institute, Fudan University, China) (Li et al., 1997), Huh-7, HLE, PLC/PRF/5
(Japanese Cancer Research Bank, Tokyo, Japan), and Hep3B (American type Culture Collection,
HB-8064) were maintained in DMEM with high glucose (Gibco BRL, Grand Island, NY)
supplemented with 10% heat-inactivated fetal bovine serum (Gibco BRL), 100 mg/mL penicillin G,
and 50 g/mL streptomycin (Gibco BRL) at 37C in a humidified atmosphere containing 5% CO2.
MIHA was kindly provided by Dr. J.R. Chowdhury, Albert Einstein College of Medicine, New
York (Brown et al., 2000).
Patient samples. Human HCC and corresponding non-tumorous liver samples were collected at the
time of surgical resection at Queen Mary Hospital, the University of Hong Kong, from 2001 to
2003. After collection from surgical resection, all samples were immediately snap-frozen in liquid
nitrogen before storage at -80C.
Plasmids and reagents. Cisplatin was obtained from Calbiochem (La Jolla, CA) and Stat3 inhibitor
(S3I-201) and JAK inhibitor I (sc-204021) were from Santa Cruz Biotechnology (Santa Cruz, CA).
Lentiviral-based GFP tagged human Nanog promoter and was purchased from System Biosciences
(Mountain View, CA). CD24 and Nanog ORF were purchased in GeneCopoeia (Rockville, MD)
and GenTarget (San Diego, CA) respectively.
cDNA microarray. Total RNA was isolated using TRIZOL Reagent (Invitrogen, Carlsbad, CA)
according to the manufacturer’s instructions. The quality of total RNA was checked with an
Agilent 2100 bioanalyzer. The RNA was then amplified and labeled with MessageAmp II-Biotin
Enhanced Single Round RNA Amplification Kit (Ambion Inc., TX). In brief, double-stranded
cDNA was generated by reverse transcription from 1 g of total RNA with an oligo(dT) primer
bearing a T7 promoter. The double-strand cDNA was used as a template for in vitro transcription to
generate biotin-labeled cRNA. After fragmentation, 15 g of cRNA was hybridized to the GeneChip
array for 16 hr. The GeneChips were washed and stained using the GeneChip Fluidics Station 400
(Affymetrix Inc. Santa Clara, CA) and then scanned with the GeneChip Scanner 3000
(Affymetrix). Genome-wide expression profiles were analyzed by the gene chip system Human
U133 Plus 2.0 (Affymetrix). RNA quality control, sample labeling, GeneChip hybridization, and
data acquisition were performed at the Genome Research Centre, the University of Hong Kong. To
compare the gene expression patterns, hybridization intensity in the samples was normalized with
the Affymetrix global scaling method (Affymetrix). Computational analyses were performed using
Genespring gx v.11 software (Silicon Genetics). Scanned output files were analysed using Robust
Multichip Average (RMA) methods with Genespring GX software, Affymetrix. Transcripts with
more than a two-fold difference level were defined as differentially expressed. Microarray data are
available publicly at http://www.ncbi.nlm.nih.gov/geo/(Geo accession number, GSE28057).
Lentiviral-based transfection into HCC cells. For luciferase labeling of HCC cells, Huh-7 and
PLC/PRF/5 cells were labeled with luciferase using a lentiviral-based approach as previously
described (Lee et al., 2007). For suppression of CD24 and CD90 in HCC cells, lentiviral particles
(DFCI-Broad RNAi Consortium, Boston) expressing shRNAs against human CD24 and CD90
were used to downregulate cd24 and cd90 mRNA. Transduced cells were selected with 2 µg/mL
puromycin.
Sphere formation assay. A total of 200 single HCC cells were plated onto 24-well polyHEMA
(Sigma)-coated plates. Cells were grown in DMEM/F12 medium (Invitrogen, Carlsbad, CA) for 10
days supplemented with 4 µg/mL insulin (Sigma-Aldrich, St. Louis, MO), B27 (Invitrogen,
Carlsbad, CA), 20 ng/mL EGF (Sigma-Aldrich, St. Louis, MO), and 20 ng/mL basic FGF
(Invitrogen, Carlsbad, CA). For serial passage of primary spheres, the primary spheres were
collected, subsequently dissociated with trypsin, and resuspended in DMEM/F12 medium with the
above supplements.
Proliferation assay. Cells were seeded at a density of 1,000 cells per well and allowed to grow for
five to seven days. Cell proliferation was assessed by a colorimetric assay using crystal violet as
described previously (Ng et al., 2000).
Anchorage independent growth assay. Cells were suspended in soft agar and growth medium in 6-
well plates at a density of 1,000 cells per well. After 2-3 weeks, colonies (10 cells) were counted
under the microscope at five fields per well and photographed.
Migration and invasion assays. The migration assay was performed as described (Wong et al.,
2005). The cell invasion assay was performed with self-coated Matrigel (BD Biosciences, San Jose,
CA) on the upper surface of a transwell chamber. The invasive cells that had invaded through the
extracellular matrix layer to the lower surface of the membrane were fixed with methanol and

stained with crystal violet. Photographs of three randomly selected fields of the fixed cells were
captured and cells were counted. The experiments were repeated independently three times.
Annexin V staining. Cells were stained in binding buffer, 7-AAD and FITC-conjugated Annexin V
as provided by the Annexin-V-FLUOS Staining Kit (Roche Diagnostics) according to
manufacturer's instructions. Analysis was determined by a FACSCalibur flow cytometer and
CellQuest software (BD Biosciences).
Single cell sorting. Viable CD24- and CD24
+ cells from a single cell suspension of PLC/PRF/5
were sorted into wells of a 96-well microtitre plate using a FACSAria cell-sorter equipped with an
automated cell deposition unit (ACDU) and using 488-nm laser light. For single cell deposition,
cells were sorted using the 70µm nozzle with the sheath pressure set at 70 PSI using the sort
precision mode set at single cell. Dead cells were excluded from the sort based on their forward and
side scatter characteristics using an electronic gate, before applying sort gates to define CD24+
expressing cells for collection. The number of cells deposited in each well was one cell per well.
Plates were maintained at 37°C in a humidified incubator with 5% CO2 in either physiologic
oxygen (2–5%). Plates were manually screened and wells scored as positive if a cell colony was
found. Selected colonies were expanded and used for future analysis.
Flow cytometric analysis. The antibodies used included phycoerythrin (PE)-conjugated CD24 (BD
PharMingen, San Jose, CA), allophycocyanin (APC)-conjugated monoclonal mouse anti-human
CD133/2 (Miltenyi Biotec, Aubum, CA), and fluorescein isothiocyanate (FITC)-conjugated
monoclonal mouse anti-human epithelial antigen (DAKO, Carpentaria, CA). Cells were incubated
in phosphate-buffered saline (PBS) containing 2% fetal bovine serum (FBS) and 0.1% sodium
azide followed by PE, APC- or FITC-conjugated antibodies. Isotype-matched mouse
immunoglobulins served as controls. The samples were analyzed using a FACSCalibur flow
cytometer and CellQuest software (BD Biosciences, San Jose, CA).
Chromatin immunoprecipitation (ChIP) assay. The cells were processed for ChIP assays using
Pierce Agarose ChIP kit (Thermo Fisher Scientific, Rockford, IL). Briefly, cells were cross-linked
for 10 min with 1% formaldehyde and lysed. Lysate pellets were resuspended and sonicated with a
Microson sonifier XL-2000 (Misonix). Protein-DNA complexes were immunoprecipitated using
either phosphorylated Stat3 (Y705) antibody (Cell Signaling Technology Danvers, MA) or Normal
rabbit IgG (Thermo Fisher Scientific, Rockford, IL) bound to protein A/G agarose, eluted, and
digested with proteinase K. For PCR analysis of the ChIP samples before amplicon generation,
QIAquick-purified immunoprecipitates were dissolved in 50 µL of water. Standard PCR reactions
using 3µL of the immunoprecipitated DNA were performed with a SYBR Green PCR kit (Applied
Biosystems) using GPH1002937(-)17A (Superarray Bioscience, Frederick, MD) which generates a
PCR amplicon centered 16381 base pairs upstream of the NM_024865.2 (Nanog) transcirption start
site. Bioinformatics analysis is based on the Human Genome Build from the UCSC Genome
Browser Feb. 2009 (GRCh37/hg19) Assembly. Calculation of pStat3 (Y705) occupancy on the
Nanog promoter was performed according to the ChIP-qPCR primer assay data analysis template
from Superarray Bioscience (Frederick, MD).
Quantitative PCR (qPCR) analysis. Total RNA was isolated using Trizol reagent according to the
manufacturer’s protocol (Invitrogen, Carlsbad, CA). Complementary DNA (cDNA) was
synthesized using a GeneAmp® Gold RNA PCR Kit (Applied Biosystems, Foster City, CA)
according to the manufacturer’s instructions and then subjected to PCR with a SYBR Green PCR
kit with primers the sequences of which are provided in Supplementary Methods. For single cell
sorting experiment, RNA extraction and cDNA synthesis were carried out using the Power SYBR
Green Cells-to-CT™-kit (Applied Biosystems), according to manufacturer’s instructions. The
amplification protocol consisted of incubations at 94°C for 15 seconds, 63°C for 30 seconds,
and
72°C for 60 seconds. Incorporation of the SYBR Green dye into PCR products was monitored in
real time with an ABI 7900HT Sequence Detection System and SDS 1.9.1 software (Applied
Biosystems) and subsequently analyzed using RQ Manager 1.2 software (Applied Biosystems),
thereby allowing the threshold cycle (CT) at which exponential amplification of the products began
to be determined. The amount of target cDNA was calculated
relative to that of β-actin cDNA.
Western blot analysis. Western blots were
developed using an ECL Plus kit (Amersham
Biosciences, Piscataway, NJ). The primary antibodies included rabbit anti-human Nanog, anti-
human Stat3 (79D7), phospho-Src (Y416), JAK2 (D2E12), phospho-JAK2 (Tyr1007/1008), mouse
monoclonal XP rabbit anti-human phospho-Stat3 (Tyr705) (D3A7) (Cell Signaling Technology
Danvers, MA), mouse anti-human CD90 (Abcam, Cambridge, MA) and mouse anti-human β-actin
(Santa Cruz Technology, Santa Cruz, CA). After washing, the membrane was incubated with
horseradish peroxidase–conjugated anti-mouse or rabbit or goat antibody (Amersham) and then
visualized by enhanced chemiluminescence plus according to the manufacturer’s protocol.
Immunostaining, immunofluorescence staining and histopathology. For paraffin-embedded

tissues, sections were deparaffinized in xylene and rehydrated in graded alcohols and distilled water.
Slides were processed for antigen retrieval by a standard microwave heating technique. Specimens
were incubated with goat anti-human CD24 (C-20) (Santa Cruz Biotechnology, Santa Cruz, CA) in
a dilution of 1:100. Subsequent immunodetection was performed using the standard rapid EnVision
technique. The reaction was then developed with the DAKO Liquid DAB_Substrate-Chromogen
System (DAKO, Carpentaria, CA). Sections were counterstained with Mayer’s hematoxylin.
Stained slides were imaged on an Aperio Scanscope® CS imager (Vista, CA), generating 0.43
µm/pixel whole slide images. These images were compiled, and CD24 expression was quantitated
using the Aperio Spectrum® software with a pixel count algorithm.
Immunofluorescence was performed on differentiating hepatospheres. First, floating hepatospheres
were adhered onto chamber slides and differentiated in the presence of 10% FBS for 24 hours;
subsequently they were fixed and permeabilized with 0.1% Triton X-100 and fixed with 4%
paraformaldehyde in PBS. The cells were incubated with FITC-conjugated mouse anti-human
CD24 (clone ML5) (1:100) (BD Pharmingen, San Jose, CA) and PE-conjugated monoclonal mouse
anti-human Cytokeratin 18 (2X44) (Santa Cruz Biotechnology, Santa Cruz, CA), and subsequently
counterstained with DAPI for 5 minutes at room temperature (AppliChem GmbH, Germany). All
images were visualized under a fluorescent microscope.
For histological analysis, tissues were fixed in formalin, embedded in paraffin, cut into 4-m
sections and stained with hematoxylin and eosin stain as described (Lee et al., 2007).
Experimental metastasis model. A total of 1x10⁴ luciferase-labeled cells were suspended in 100L
of complete medium and then injected into the tail veins of NOD/SCID mice to enter into
circulation. At 40 days after tumor injection, focus formation was inspected by xenogen imaging,
observing either the whole anaesthetized mouse or the lungs that were removed immediately after
sacrificing the mice. The lungs were then collected for paraffin embedding.
Pathway analysis. The Ingenuity Pathway Analysis Tool was used to examine the functional
associations among genes and generate a gene network with high significance on the basis of more
interconnected genes being present than would be expected by chance. The significance of each
network was estimated by the scoring system provided by Ingenuity. The scores were determined
by the number of differentially expressed genes within each of the networks and the strength of the
associations among network members. Once over-represented genes that are functionally relevant

in the gene networks were identified, we validated their functional association by using the
independent pathway analysis tool PathwayAssist (Version 3.0, Ariadne Genomics).
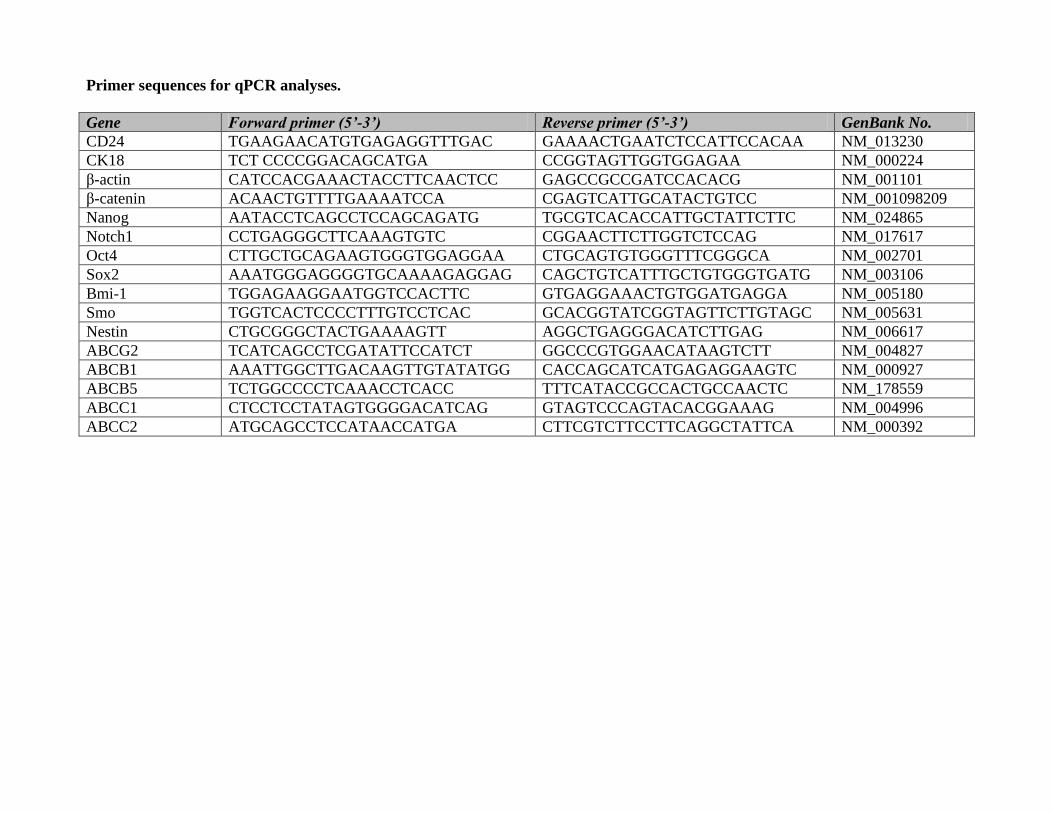
Primer sequences for qPCR analyses.
Gene Forward primer (5’-3’) Reverse primer (5’-3’) GenBank No.
CD24 TGAAGAACATGTGAGAGGTTTGAC GAAAACTGAATCTCCATTCCACAA NM_013230
CK18 TCT CCCCGGACAGCATGA CCGGTAGTTGGTGGAGAA NM_000224
β-actin CATCCACGAAACTACCTTCAACTCC GAGCCGCCGATCCACACG NM_001101
β-catenin ACAACTGTTTTGAAAATCCA CGAGTCATTGCATACTGTCC NM_001098209
Nanog AATACCTCAGCCTCCAGCAGATG TGCGTCACACCATTGCTATTCTTC NM_024865
Notch1 CCTGAGGGCTTCAAAGTGTC CGGAACTTCTTGGTCTCCAG NM_017617
Oct4 CTTGCTGCAGAAGTGGGTGGAGGAA CTGCAGTGTGGGTTTCGGGCA NM_002701
Sox2 AAATGGGAGGGGTGCAAAAGAGGAG CAGCTGTCATTTGCTGTGGGTGATG NM_003106
Bmi-1 TGGAGAAGGAATGGTCCACTTC GTGAGGAAACTGTGGATGAGGA NM_005180
Smo TGGTCACTCCCCTTTGTCCTCAC GCACGGTATCGGTAGTTCTTGTAGC NM_005631
Nestin CTGCGGGCTACTGAAAAGTT AGGCTGAGGGACATCTTGAG NM_006617
ABCG2 TCATCAGCCTCGATATTCCATCT GGCCCGTGGAACATAAGTCTT NM_004827
ABCB1 AAATTGGCTTGACAAGTTGTATATGG CACCAGCATCATGAGAGGAAGTC NM_000927
ABCB5 TCTGGCCCCTCAAACCTCACC TTTCATACCGCCACTGCCAACTC NM_178559
ABCC1 CTCCTCCTATAGTGGGGACATCAG GTAGTCCCAGTACACGGAAAG NM_004996
ABCC2 ATGCAGCCTCCATAACCATGA CTTCGTCTTCCTTCAGGCTATTCA NM_000392
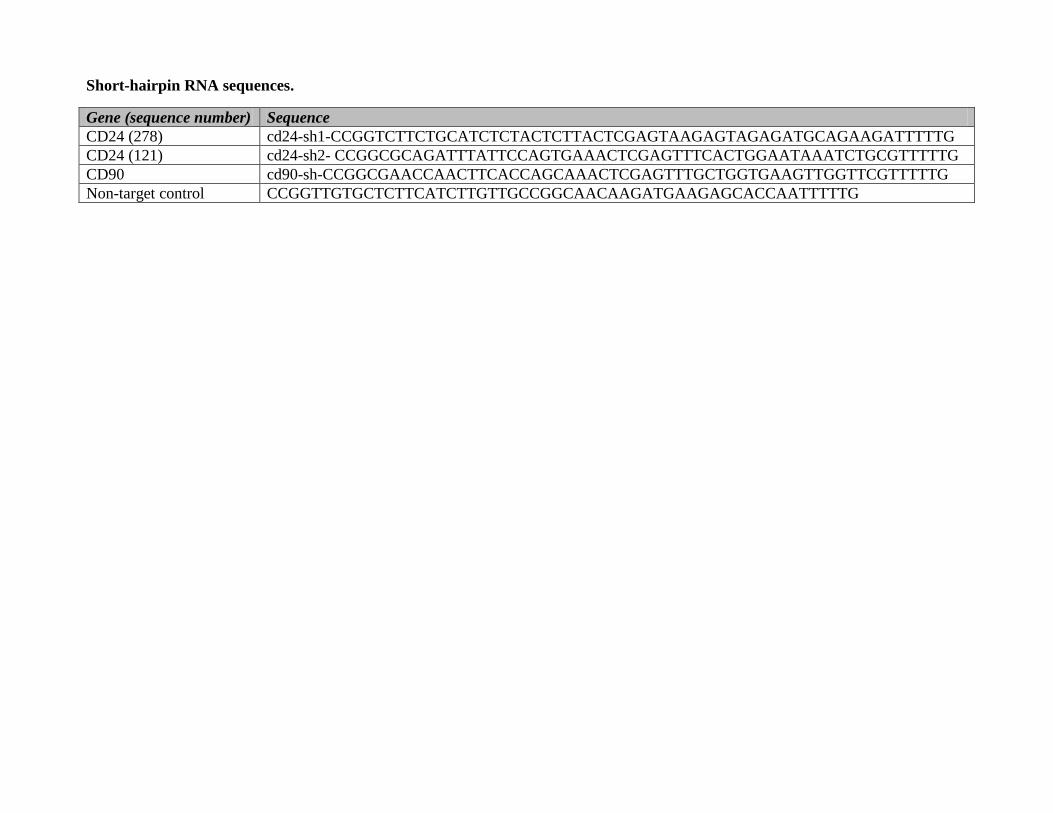
Short-hairpin RNA sequences.
Gene (sequence number) Sequence
CD24 (278) cd24-sh1-CCGGTCTTCTGCATCTCTACTCTTACTCGAGTAAGAGTAGAGATGCAGAAGATTTTTG
CD24 (121) cd24-sh2- CCGGCGCAGATTTATTCCAGTGAAACTCGAGTTTCACTGGAATAAATCTGCGTTTTTG
CD90 cd90-sh-CCGGCGAACCAACTTCACCAGCAAACTCGAGTTTGCTGGTGAAGTTGGTTCGTTTTTG
Non-target control CCGGTTGTGCTCTTCATCTTGTTGCCGGCAACAAGATGAAGAGCACCAATTTTTG

Supplemental References
Brown, J.J., Parashar, B., Moshage, H., Tanaka, K.E., Engelhardt, D., Rabbani, E., Roy-Chowdhury,
N., and Roy-Chowdhury, J. (2000). A long-term hepatitis B viremia model generated by transplanting
nontumorigenic immortalized human hepatocytes in Rag-2-deficient mice. Hepatology 31, 173-181.
Lee, T.K., Poon, R.T., Guan, X.Y., Ma, S., Guan, X.Y., Myers, J.N., Altevogt, P., and Yuen, A.P.
(2007). Lupeol suppresses cisplatin induced NFB activation in HNSCC cells and inhibits local
invasion and nodal metastasis in orthotopic nude mouse model of tongue squamous cell carcinoma.
Cancer Res. 67, 8800-8809.
Li, Y., Tang, Z.Y., Ye, S.L., Liu, Y., Chen, J., Xue, Q., Huang, X., Chen, J., Bao, W., and Yang, J., et
al. (2001). Establishment of cell clones with different metastatic potential from the metastatic
hepatocellular carcinoma cell line MHCC97. World J. Gastroenterol. 7, 630-636.
Ng, I.O., Liang, Z.D., Cao, L., and Lee, T.K. (2000). DLC-1 is deleted in primary hepatocellular
carcinoma and exerts inhibitory effects on the proliferation of hepatoma cell lines deleted DLC-1.
Cancer Res. 60, 6581-6584.
Wong, C.M., Yam, J.W., Ching, Y.P., Yau, T.O., Leung, T.H., Jin, D.Y., and Ng, I.O. (2005). Rho
GTPase-activating protein deleted in liver cancer suppresses cell proliferation and invasion in
hepatocellular carcinoma. Cancer Res. 65, 8861-8868.