initiating coverage karur vysya bank ltd. tiating coverage ... vysya bank - initiating... · p a g...
TRANSCRIPT
1 |
P a g e
Init
iati
ng
Co
ve
rag
e
tia
tin
g C
ov
era
ge
Karur Vysya Bank Ltd.
In
itia
tin
g c
ov
era
ge
03
De
c 2
01
8
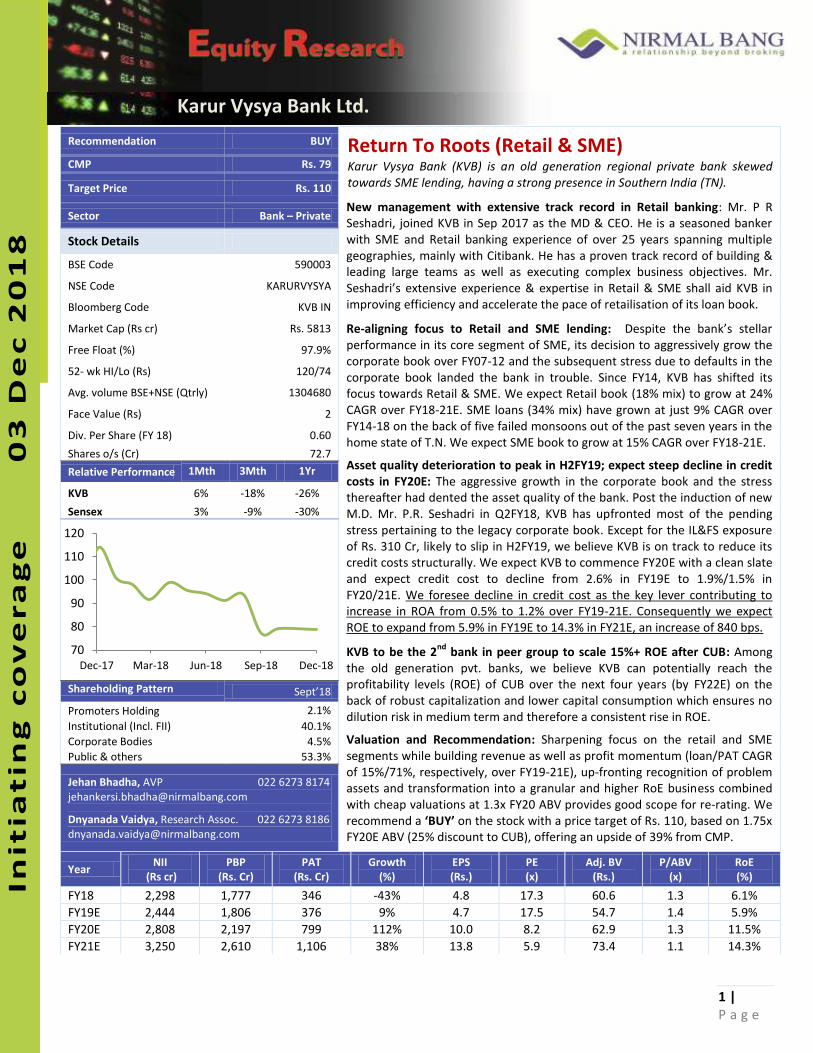
Recommendation BUY
Return To Roots (Retail & SME) Karur Vysya Bank (KVB) is an old generation regional private bank skewed
towards SME lending, having a strong presence in Southern India (TN).
New management with extensive track record in Retail banking: Mr. P R
Seshadri, joined KVB in Sep 2017 as the MD & CEO. He is a seasoned banker
with SME and Retail banking experience of over 25 years spanning multiple
geographies, mainly with Citibank. He has a proven track record of building &
leading large teams as well as executing complex business objectives. Mr.
Seshad i s e te si e e pe ie e & expertise in Retail & SME shall aid KVB in
improving efficiency and accelerate the pace of retailisation of its loan book.
Re-aligning focus to Retail and SME lending: Despite the a k s stella performance in its core segment of SME, its decision to aggressively grow the
corporate book over FY07-12 and the subsequent stress due to defaults in the
corporate book landed the bank in trouble. Since FY14, KVB has shifted its
focus towards Retail & SME. We expect Retail book (18% mix) to grow at 24%
CAGR over FY18-21E. SME loans (34% mix) have grown at just 9% CAGR over
FY14-18 on the back of five failed monsoons out of the past seven years in the
home state of T.N. We expect SME book to grow at 15% CAGR over FY18-21E.
Asset quality deterioration to peak in H2FY19; expect steep decline in credit
costs in FY20E: The aggressive growth in the corporate book and the stress
thereafter had dented the asset quality of the bank. Post the induction of new
M.D. Mr. P.R. Seshadri in Q2FY18, KVB has upfronted most of the pending
stress pertaining to the legacy corporate book. Except for the IL&FS exposure
of Rs. 310 Cr, likely to slip in H2FY19, we believe KVB is on track to reduce its
credit costs structurally. We expect KVB to commence FY20E with a clean slate
and expect credit cost to decline from 2.6% in FY19E to 1.9%/1.5% in
FY20/21E. We foresee decline in credit cost as the key lever contributing to
increase in ROA from 0.5% to 1.2% over FY19-21E. Consequently we expect
ROE to expand from 5.9% in FY19E to 14.3% in FY21E, an increase of 840 bps.
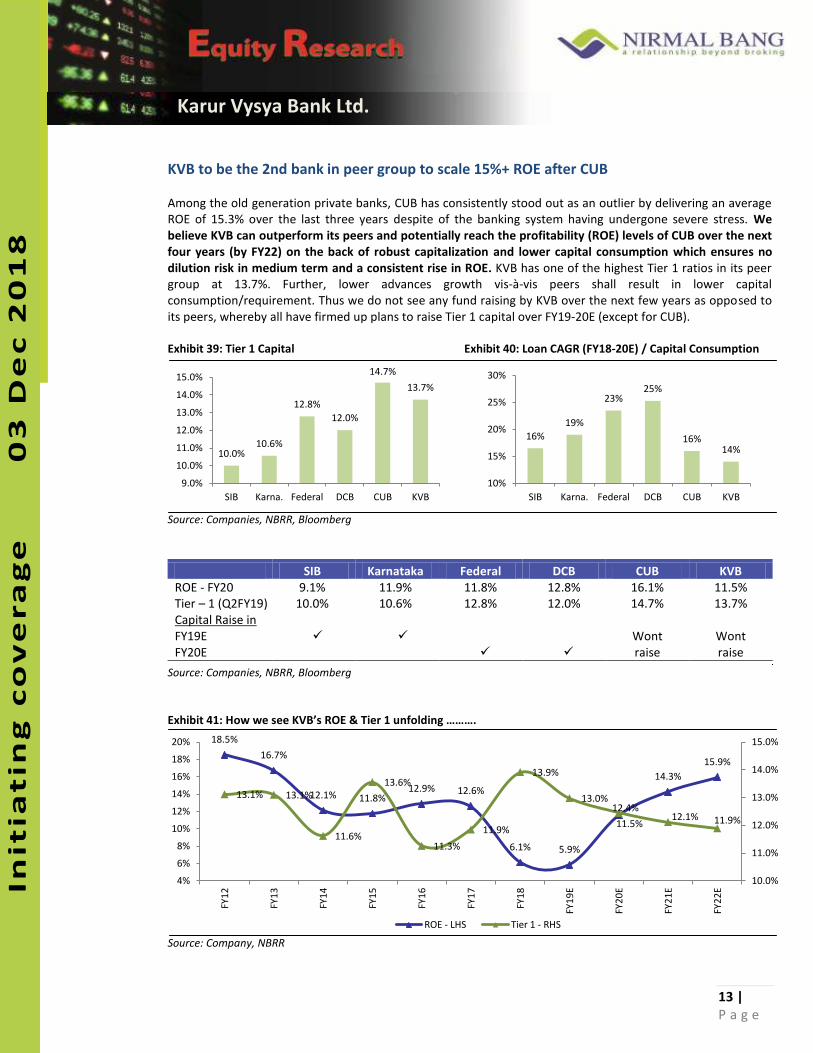
KVB to be the 2nd
bank in peer group to scale 15%+ ROE after CUB: Among
the old generation pvt. banks, we believe KVB can potentially reach the
profitability levels (ROE) of CUB over the next four years (by FY22E) on the
back of robust capitalization and lower capital consumption which ensures no
dilution risk in medium term and therefore a consistent rise in ROE.
Valuation and Recommendation: Sharpening focus on the retail and SME
segments while building revenue as well as profit momentum (loan/PAT CAGR
of 15%/71%, respectively, over FY19-21E), up-fronting recognition of problem
assets and transformation into a granular and higher RoE business combined
with cheap valuations at 1.3x FY20 ABV provides good scope for re-rating. We
recommend a BUY on the stock with a price target of Rs. 110, based on 1.75x
FY20E ABV (25% discount to CUB), offering an upside of 39% from CMP.
CMP Rs. 79
Target Price Rs. 110
Sector Bank – Private
Stock Details
BSE Code 590003
NSE Code KARURVYSYA
Bloomberg Code KVB IN
Market Cap (Rs cr) Rs. 5813
Free Float (%) 97.9%
52- wk HI/Lo (Rs) 120/74
Avg. volume BSE+NSE (Qtrly) 1304680
Face Value (Rs) 2
Div. Per Share (FY 18) 0.60
Shares o/s (Cr) 72.7
Relative Performance 1Mth 3Mth 1Yr
KVB 6% -18% -26%
Sensex 3% -9% -30%
Shareholding Pattern “ept 8
Promoters Holding 2.1%
Institutional (Incl. FII) 40.1%
Corporate Bodies 4.5%
Public & others 53.3%
Jehan Bhadha, AVP 022 6273 8174
Dnyanada Vaidya, Research Assoc. 022 6273 8186
Year NII
(Rs cr)
PBP
(Rs. Cr)
PAT
(Rs. Cr)
Growth
(%)
EPS
(Rs.)
PE
(x)
Adj. BV
(Rs.)
P/ABV
(x)
RoE
(%)
FY18 2,298 1,777 346 -43% 4.8 17.3 60.6 1.3 6.1%
FY19E 2,444 1,806 376 9% 4.7 17.5 54.7 1.4 5.9%
FY20E 2,808 2,197 799 112% 10.0 8.2 62.9 1.3 11.5%
FY21E 3,250 2,610 1,106 38% 13.8 5.9 73.4 1.1 14.3%
70
80
90
100
110
120
Dec-17 Mar-18 Jun-18 Sep-18 Dec-18
2 |
P a g e
Init
iati
ng
Co
ve
rag
e
tia
tin
g C
ov
era
ge
Karur Vysya Bank Ltd.
In
itia
tin
g c
ov
era
ge
03
De
c 2
01
8
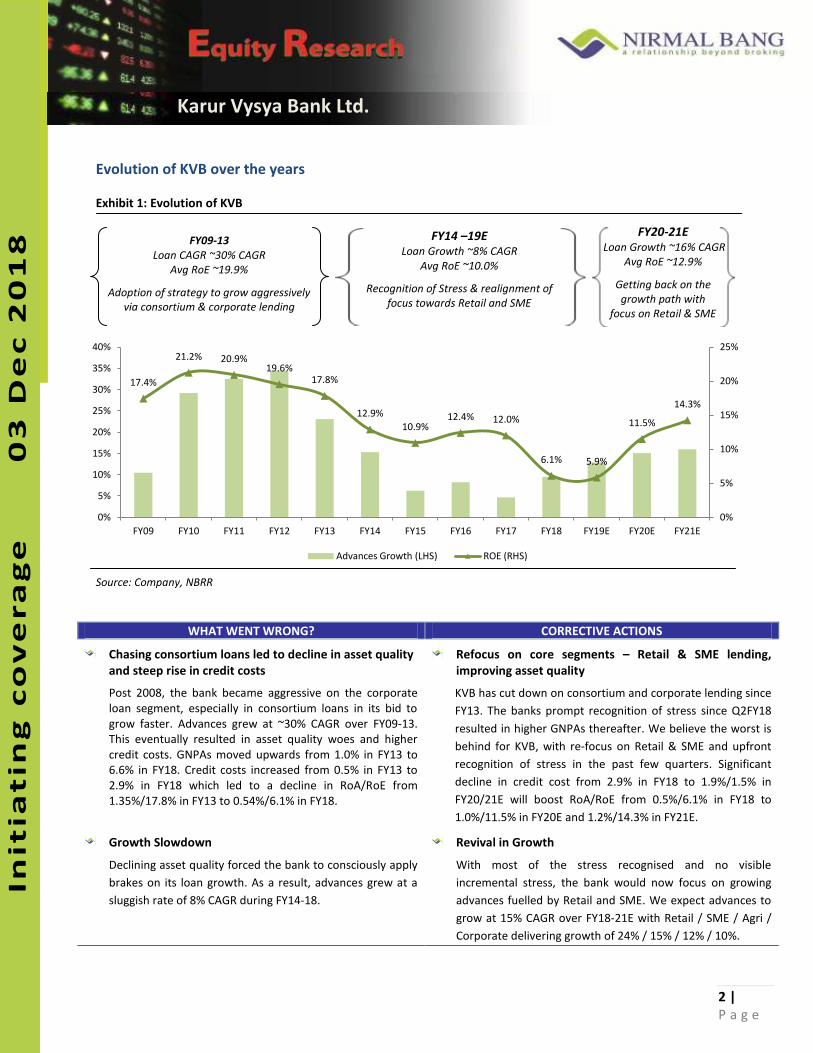
Evolution of KVB over the years
Exhibit 1: Evolution of KVB
Source: Company, NBRR
WHAT WENT WRONG? CORRECTIVE ACTIONS
Chasing consortium loans led to decline in asset quality
and steep rise in credit costs
Post 2008, the bank became aggressive on the corporate
loan segment, especially in consortium loans in its bid to
grow faster. Advances grew at ~30% CAGR over FY09-13.
This eventually resulted in asset quality woes and higher
credit costs. GNPAs moved upwards from 1.0% in FY13 to
6.6% in FY18. Credit costs increased from 0.5% in FY13 to
2.9% in FY18 which led to a decline in RoA/RoE from
1.35%/17.8% in FY13 to 0.54%/6.1% in FY18.
Refocus on core segments – Retail & SME lending,
improving asset quality
KVB has cut down on consortium and corporate lending since
FY13. The banks prompt recognition of stress since Q2FY18
resulted in higher GNPAs thereafter. We believe the worst is
behind for KVB, with re-focus on Retail & SME and upfront
recognition of stress in the past few quarters. Significant
decline in credit cost from 2.9% in FY18 to 1.9%/1.5% in
FY20/21E will boost RoA/RoE from 0.5%/6.1% in FY18 to
1.0%/11.5% in FY20E and 1.2%/14.3% in FY21E.
Growth Slowdown
Declining asset quality forced the bank to consciously apply
brakes on its loan growth. As a result, advances grew at a
sluggish rate of 8% CAGR during FY14-18.
Revival in Growth
With most of the stress recognised and no visible
incremental stress, the bank would now focus on growing
advances fuelled by Retail and SME. We expect advances to
grow at 15% CAGR over FY18-21E with Retail / SME / Agri /
Corporate delivering growth of 24% / 15% / 12% / 10%.
17.4%
21.2% 20.9% 19.6%
17.8%
12.9%
10.9% 12.4% 12.0%
6.1% 5.9%
11.5%
14.3%
0%
5%
10%
15%
20%
25%
0%
5%
10%
15%
20%
25%
30%
35%
40%
FY09 FY10 FY11 FY12 FY13 FY14 FY15 FY16 FY17 FY18 FY19E FY20E FY21E
Advances Growth (LHS) ROE (RHS)
FY09-13
Loan CAGR ~30% CAGR
Avg RoE ~19.9%
Adoption of strategy to grow aggressively
via consortium & corporate lending
FY14 –19E
Loan Growth ~8% CAGR
Avg RoE ~10.0%
Recognition of Stress & realignment of
focus towards Retail and SME
FY20-21E
Loan Growth ~16% CAGR
Avg RoE ~12.9%
Getting back on the
growth path with
focus on Retail & SME
3 |
P a g e
Init
iati
ng
Co
ve
rag
e
tia
tin
g C
ov
era
ge
Karur Vysya Bank Ltd.
In
itia
tin
g c
ov
era
ge
03
De
c 2
01
8
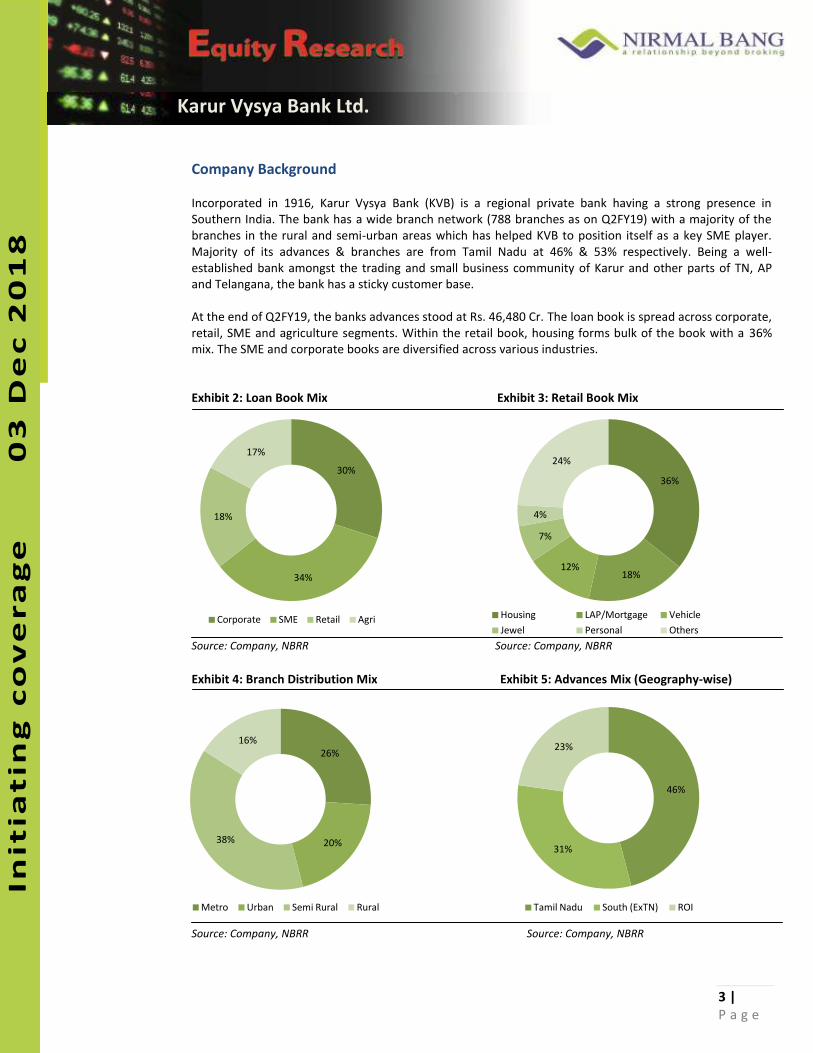
Company Background
Incorporated in 1916, Karur Vysya Bank (KVB) is a regional private bank having a strong presence in
Southern India. The bank has a wide branch network (788 branches as on Q2FY19) with a majority of the
branches in the rural and semi-urban areas which has helped KVB to position itself as a key SME player.
Majority of its advances & branches are from Tamil Nadu at 46% & 53% respectively. Being a well-
established bank amongst the trading and small business community of Karur and other parts of TN, AP
and Telangana, the bank has a sticky customer base.
At the end of Q2FY19, the banks advances stood at Rs. 46,480 Cr. The loan book is spread across corporate,
retail, SME and agriculture segments. Within the retail book, housing forms bulk of the book with a 36%
mix. The SME and corporate books are diversified across various industries.
Exhibit 2: Loan Book Mix Exhibit 3: Retail Book Mix
Source: Company, NBRR Source: Company, NBRR
Exhibit 4: Branch Distribution Mix Exhibit 5: Advances Mix (Geography-wise)
Source: Company, NBRR Source: Company, NBRR
30%
34%
18%
17%
Corporate SME Retail Agri
36%
18% 12%
7%
4%
24%
Housing LAP/Mortgage Vehicle
Jewel Personal Others
26%
20% 38%
16%
Metro Urban Semi Rural Rural
46%
31%
23%
Tamil Nadu South (ExTN) ROI
4 |
P a g e
Init
iati
ng
Co
ve
rag
e
tia
tin
g C
ov
era
ge
Karur Vysya Bank Ltd.
In
itia
tin
g c
ov
era
ge
03
De
c 2
01
8
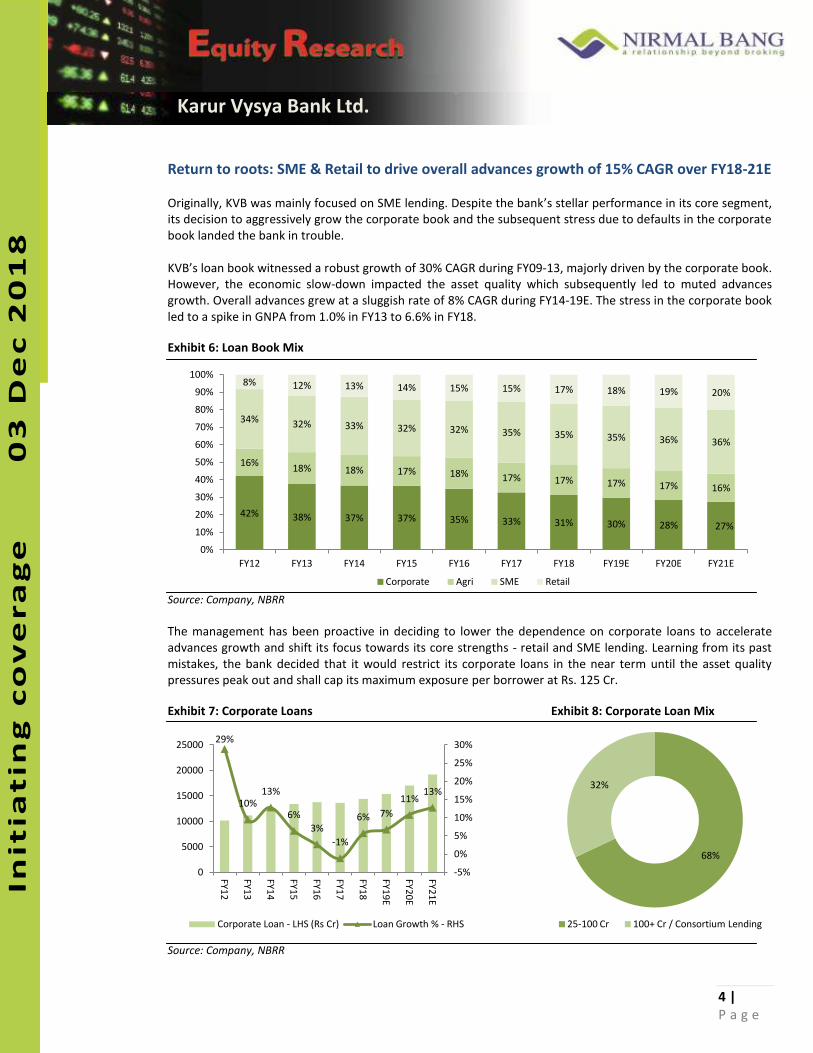
Return to roots: SME & Retail to drive overall advances growth of 15% CAGR over FY18-21E
Originally, KVB was mainly focused on SME lending. Despite the bank s stellar performance in its core segment,
its decision to aggressively grow the corporate book and the subsequent stress due to defaults in the corporate
book landed the bank in trouble.
KVB s loa ook it essed a o ust g o th of 30% CAGR during FY09-13, majorly driven by the corporate book.
However, the economic slow-down impacted the asset quality which subsequently led to muted advances
growth. Overall advances grew at a sluggish rate of 8% CAGR during FY14-19E. The stress in the corporate book
led to a spike in GNPA from 1.0% in FY13 to 6.6% in FY18.
Exhibit 6: Loan Book Mix
Source: Company, NBRR
The management has been proactive in deciding to lower the dependence on corporate loans to accelerate
advances growth and shift its focus towards its core strengths - retail and SME lending. Learning from its past
mistakes, the bank decided that it would restrict its corporate loans in the near term until the asset quality
pressures peak out and shall cap its maximum exposure per borrower at Rs. 125 Cr.
Exhibit 7: Corporate Loans Exhibit 8: Corporate Loan Mix
Source: Company, NBRR
42% 38% 37% 37% 35% 33% 31% 30% 28% 27%
16% 18% 18% 17% 18% 17% 17% 17% 17% 16%
34% 32% 33% 32% 32% 35% 35% 35% 36% 36%
8% 12% 13% 14% 15% 15% 17% 18% 19% 20%
0%
10%
20%
30%
40%
50%
60%
70%
80%
90%
100%
FY12 FY13 FY14 FY15 FY16 FY17 FY18 FY19E FY20E FY21E
Corporate Agri SME Retail
29%
10% 13%
6%
3%
-1%
6% 7%
11% 13%
-5%
0%
5%
10%
15%
20%
25%
30%
0
5000
10000
15000
20000
25000
FY
12
FY
13
FY
14
FY
15
FY
16
FY
17
FY
18
FY
19
E
FY
20
E
FY
21
E
Corporate Loan - LHS (Rs Cr) Loan Growth % - RHS
68%
32%
25-100 Cr 100+ Cr / Consortium Lending
5 |
P a g e
Init
iati
ng
Co
ve
rag
e
tia
tin
g C
ov
era
ge
Karur Vysya Bank Ltd.
In
itia
tin
g c
ov
era
ge
03
De
c 2
01
8
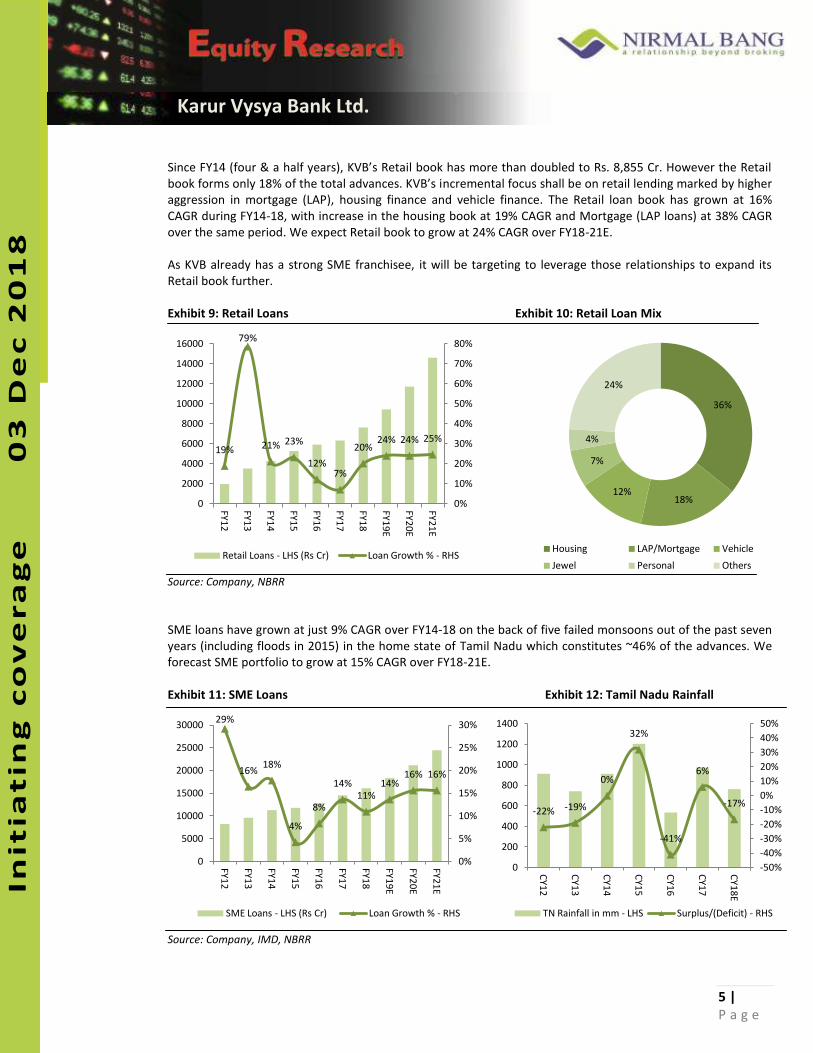
“i e FY fou & a half ea s , KVB s ‘etail ook has o e tha dou led to ‘s. 8,8 C . Ho e e the ‘etail ook fo s o l 8% of the total ad a es. KVB s incremental focus shall be on retail lending marked by higher
aggression in mortgage (LAP), housing finance and vehicle finance. The Retail loan book has grown at 16%
CAGR during FY14-18, with increase in the housing book at 19% CAGR and Mortgage (LAP loans) at 38% CAGR
over the same period. We expect Retail book to grow at 24% CAGR over FY18-21E.
As KVB already has a strong SME franchisee, it will be targeting to leverage those relationships to expand its
Retail book further.
Exhibit 9: Retail Loans Exhibit 10: Retail Loan Mix
Source: Company, NBRR
SME loans have grown at just 9% CAGR over FY14-18 on the back of five failed monsoons out of the past seven
years (including floods in 2015) in the home state of Tamil Nadu which constitutes ~46% of the advances. We
forecast SME portfolio to grow at 15% CAGR over FY18-21E.
Exhibit 11: SME Loans Exhibit 12: Tamil Nadu Rainfall
Source: Company, IMD, NBRR
19%
79%
21% 23%
12% 7%
20% 24% 24% 25%
0%
10%
20%
30%
40%
50%
60%
70%
80%
0
2000
4000
6000
8000
10000
12000
14000
16000
FY
12
FY
13
FY
14
FY
15
FY
16
FY
17
FY
18
FY
19
E
FY
20
E
FY
21
E
Retail Loans - LHS (Rs Cr) Loan Growth % - RHS
36%
18% 12%
7%
4%
24%
Housing LAP/Mortgage Vehicle
Jewel Personal Others
29%
16% 18%
4%
8%
14%
11%
14% 16% 16%
0%
5%
10%
15%
20%
25%
30%
0
5000
10000
15000
20000
25000
30000
FY
12
FY
13
FY
14
FY
15
FY
16
FY
17
FY
18
FY
19
E
FY
20
E
FY
21
E
SME Loans - LHS (Rs Cr) Loan Growth % - RHS
-22% -19%
0%
32%
-41%
6%
-17%
-50%
-40%
-30%
-20%
-10%
0%
10%
20%
30%
40%
50%
0
200
400
600
800
1000
1200
1400
CY
12
CY
13
CY
14
CY
15
CY
16
CY
17
CY
18
E
TN Rainfall in mm - LHS Surplus/(Deficit) - RHS
6 |
P a g e
Init
iati
ng
Co
ve
rag
e
tia
tin
g C
ov
era
ge
Karur Vysya Bank Ltd.
In
itia
tin
g c
ov
era
ge
03
De
c 2
01
8
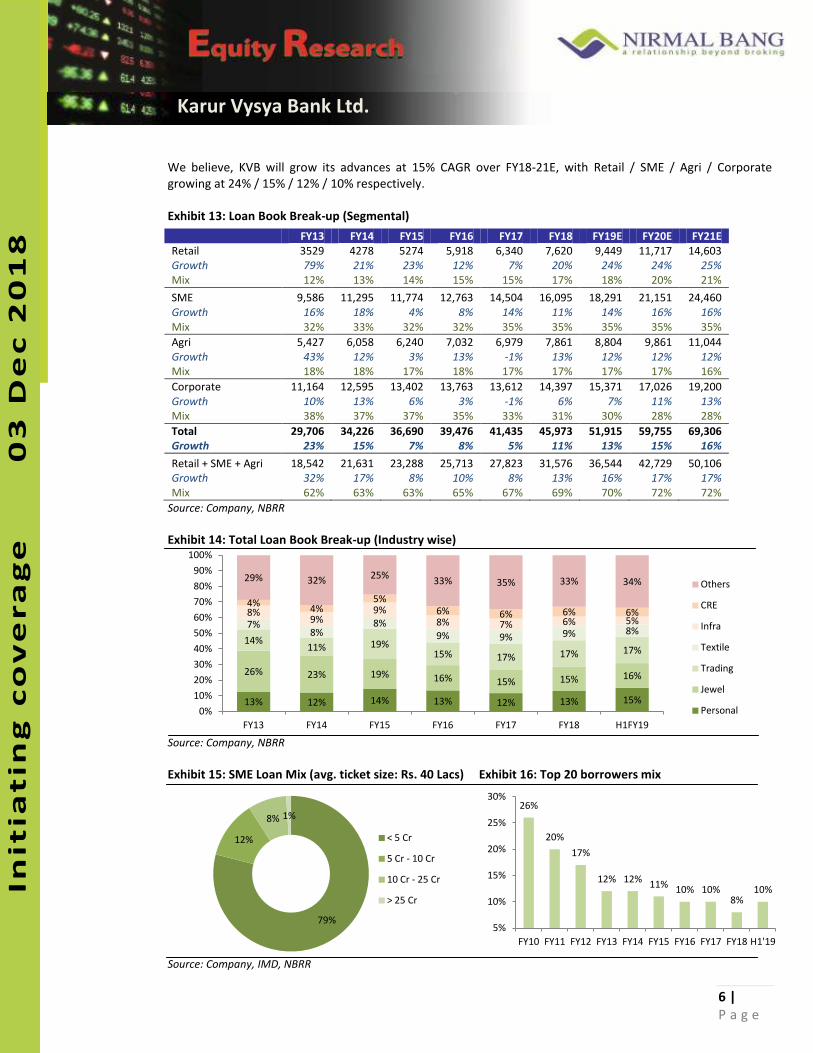
We believe, KVB will grow its advances at 15% CAGR over FY18-21E, with Retail / SME / Agri / Corporate
growing at 24% / 15% / 12% / 10% respectively.
Exhibit 13: Loan Book Break-up (Segmental)
FY13 FY14 FY15 FY16 FY17 FY18 FY19E FY20E FY21E
Retail 3529 4278 5274 5,918 6,340 7,620 9,449 11,717 14,603
Growth 79% 21% 23% 12% 7% 20% 24% 24% 25%
Mix 12% 13% 14% 15% 15% 17% 18% 20% 21%
SME 9,586 11,295 11,774 12,763 14,504 16,095 18,291 21,151 24,460
Growth 16% 18% 4% 8% 14% 11% 14% 16% 16%
Mix 32% 33% 32% 32% 35% 35% 35% 35% 35%
Agri 5,427 6,058 6,240 7,032 6,979 7,861 8,804 9,861 11,044
Growth 43% 12% 3% 13% -1% 13% 12% 12% 12%
Mix 18% 18% 17% 18% 17% 17% 17% 17% 16%
Corporate 11,164 12,595 13,402 13,763 13,612 14,397 15,371 17,026 19,200
Growth 10% 13% 6% 3% -1% 6% 7% 11% 13%
Mix 38% 37% 37% 35% 33% 31% 30% 28% 28%
Total 29,706 34,226 36,690 39,476 41,435 45,973 51,915 59,755 69,306
Growth 23% 15% 7% 8% 5% 11% 13% 15% 16%
Retail + SME + Agri 18,542 21,631 23,288 25,713 27,823 31,576 36,544 42,729 50,106
Growth 32% 17% 8% 10% 8% 13% 16% 17% 17%
Mix 62% 63% 63% 65% 67% 69% 70% 72% 72%
Source: Company, NBRR
Exhibit 14: Total Loan Book Break-up (Industry wise)
Source: Company, NBRR
Exhibit 15: SME Loan Mix (avg. ticket size: Rs. 40 Lacs) Exhibit 16: Top 20 borrowers mix
Source: Company, IMD, NBRR
13% 12% 14% 13% 12% 13% 15%
26% 23% 19% 16% 15% 15% 16%
14% 11% 19%
15% 17% 17% 17%
7% 8%
8%
9% 9% 9% 8%
8% 9%
9%
8% 7% 6% 5%
4% 4%
5%
6% 6% 6% 6%
29% 32% 25%
33% 35% 33% 34%
0%
10%
20%
30%
40%
50%
60%
70%
80%
90%
100%
FY13 FY14 FY15 FY16 FY17 FY18 H1FY19
Others
CRE
Infra
Textile
Trading
Jewel
Personal
79%
12%
8% 1%
< 5 Cr
5 Cr - 10 Cr
10 Cr - 25 Cr
> 25 Cr
26%
20%
17%
12% 12% 11%
10% 10% 8%
10%
5%
10%
15%
20%
25%
30%
FY10 FY11 FY12 FY13 FY14 FY15 FY16 FY17 FY18 H1'19
7 |
P a g e
Init
iati
ng
Co
ve
rag
e
tia
tin
g C
ov
era
ge
Karur Vysya Bank Ltd.
In
itia
tin
g c
ov
era
ge
03
De
c 2
01
8
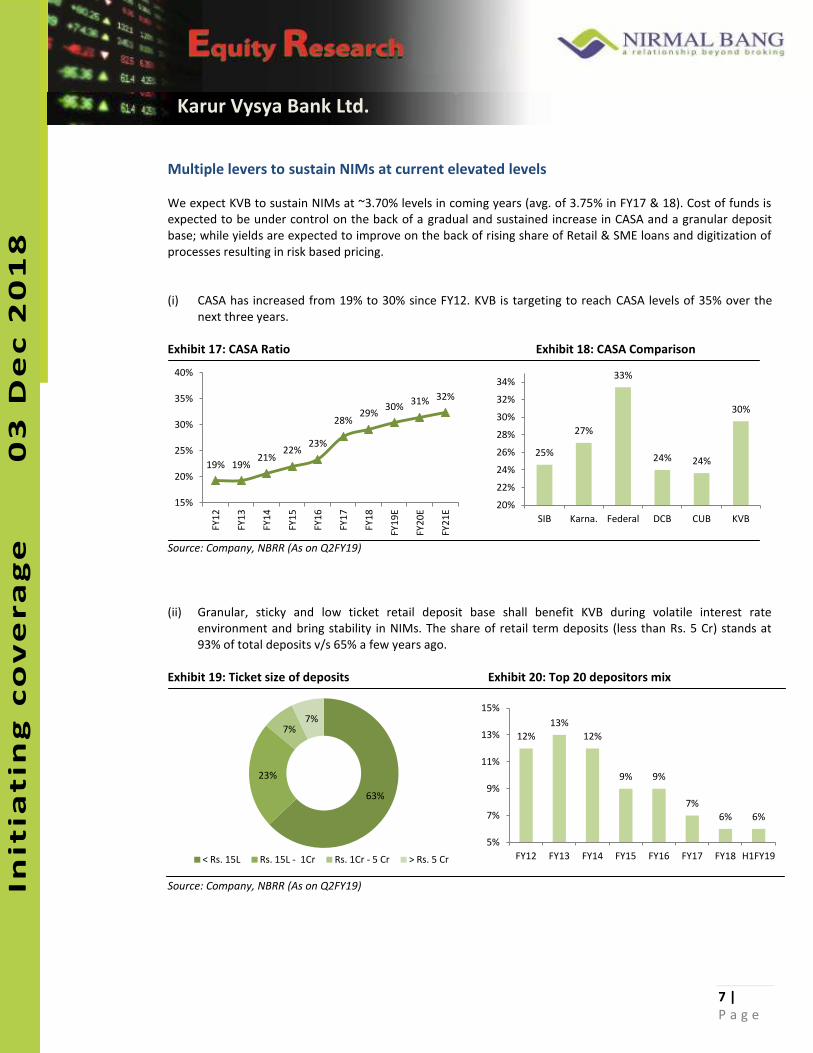
Multiple levers to sustain NIMs at current elevated levels
We expect KVB to sustain NIMs at ~3.70% levels in coming years (avg. of 3.75% in FY17 & 18). Cost of funds is
expected to be under control on the back of a gradual and sustained increase in CASA and a granular deposit
base; while yields are expected to improve on the back of rising share of Retail & SME loans and digitization of
processes resulting in risk based pricing.
(i) CASA has increased from 19% to 30% since FY12. KVB is targeting to reach CASA levels of 35% over the
next three years.
Exhibit 17: CASA Ratio Exhibit 18: CASA Comparison
Source: Company, NBRR (As on Q2FY19)
(ii) Granular, sticky and low ticket retail deposit base shall benefit KVB during volatile interest rate
environment and bring stability in NIMs. The share of retail term deposits (less than Rs. 5 Cr) stands at
93% of total deposits v/s 65% a few years ago.
Exhibit 19: Ticket size of deposits Exhibit 20: Top 20 depositors mix
Source: Company, NBRR (As on Q2FY19)
19% 19% 21%
22% 23%
28% 29%
30% 31% 32%
15%
20%
25%
30%
35%
40%
FY
12
FY
13
FY
14
FY
15
FY
16
FY
17
FY
18
FY
19
E
FY
20
E
FY
21
E
25%
27%
33%
24% 24%
30%
20%
22%
24%
26%
28%
30%
32%
34%
SIB Karna. Federal DCB CUB KVB
63%
23%
7% 7%
< Rs. 15L Rs. 15L - 1Cr Rs. 1Cr - 5 Cr > Rs. 5 Cr
12%
13%
12%
9% 9%
7%
6% 6%
5%
7%
9%
11%
13%
15%
FY12 FY13 FY14 FY15 FY16 FY17 FY18 H1FY19
8 |
P a g e
Init
iati
ng
Co
ve
rag
e
tia
tin
g C
ov
era
ge
Karur Vysya Bank Ltd.
In
itia
tin
g c
ov
era
ge
03
De
c 2
01
8
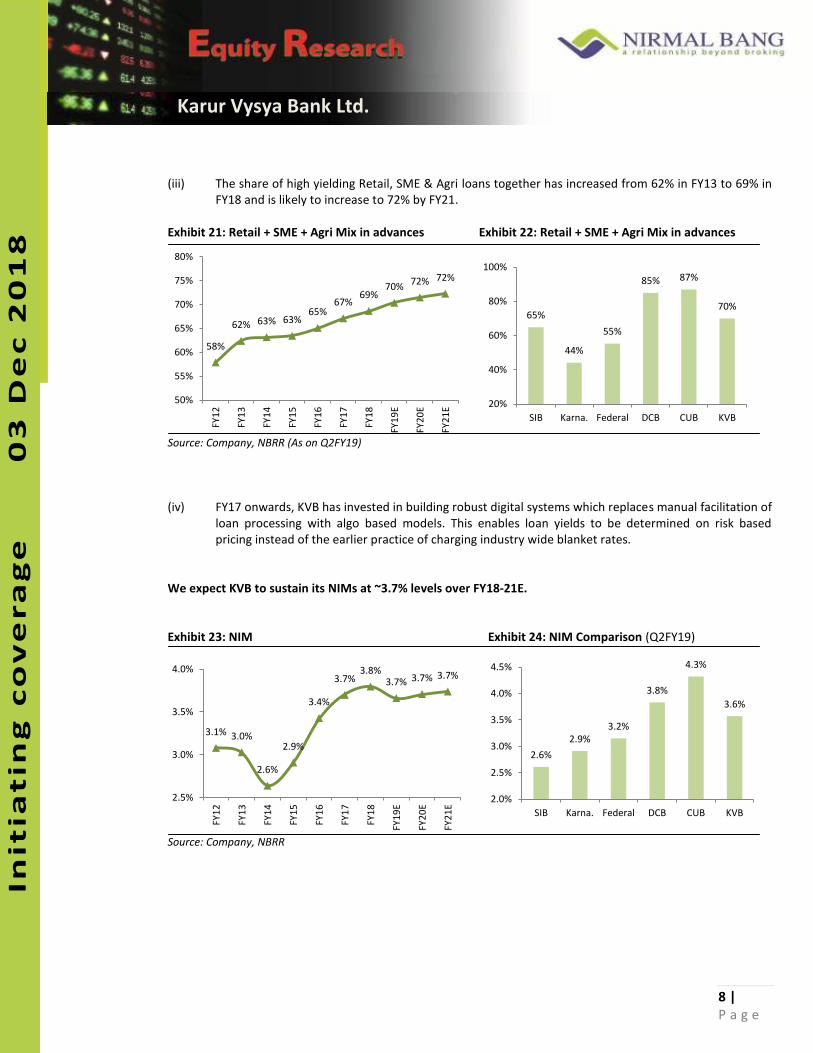
(iii) The share of high yielding Retail, SME & Agri loans together has increased from 62% in FY13 to 69% in
FY18 and is likely to increase to 72% by FY21.
Exhibit 21: Retail + SME + Agri Mix in advances Exhibit 22: Retail + SME + Agri Mix in advances
Source: Company, NBRR (As on Q2FY19)
(iv) FY17 onwards, KVB has invested in building robust digital systems which replaces manual facilitation of
loan processing with algo based models. This enables loan yields to be determined on risk based
pricing instead of the earlier practice of charging industry wide blanket rates.
We expect KVB to sustain its NIMs at ~3.7% levels over FY18-21E.
Exhibit 23: NIM Exhibit 24: NIM Comparison (Q2FY19)
Source: Company, NBRR
58%
62% 63% 63% 65%
67% 69%
70% 72% 72%
50%
55%
60%
65%
70%
75%
80%
FY
12
FY
13
FY
14
FY
15
FY
16
FY
17
FY
18
FY
19
E
FY
20
E
FY
21
E
65%
44%
55%
85% 87%
70%
20%
40%
60%
80%
100%
SIB Karna. Federal DCB CUB KVB
3.1% 3.0%
2.6%
2.9%
3.4%
3.7% 3.8%
3.7% 3.7% 3.7%
2.5%
3.0%
3.5%
4.0%
FY
12
FY
13
FY
14
FY
15
FY
16
FY
17
FY
18
FY
19
E
FY
20
E
FY
21
E
2.6%
2.9%
3.2%
3.8%
4.3%
3.6%
2.0%
2.5%
3.0%
3.5%
4.0%
4.5%
SIB Karna. Federal DCB CUB KVB
9 |
P a g e
Init
iati
ng
Co
ve
rag
e
tia
tin
g C
ov
era
ge
Karur Vysya Bank Ltd.
In
itia
tin
g c
ov
era
ge
03
De
c 2
01
8
Scope for improvement in cost efficiency
KVB is one of the efficient banks in the Indian private banking space. KVB posted a cost/income ratio of 44.4%
i FY 8 hi h is a o gst the top ua tile i p i ate a ks. With the a ks i te tio to s ale up a hes o l a gi all a d ulk of the e pe ditu e elated to digitizatio ha i g al ead i u ed, e fo e ast KVB s ope
to grow at 11% CAGR over FY18-21E as against net income growth of 13% CAGR and thus deliver cost/income
ratio of 44.2%/43.0% in FY20/21E.
Exhibit 25: Cost to Income Exhibit 26: Cost to Income Comparison
Source: Company, NBRR (As on FY18) – Taken FY18 nos. as Q2 treasury income has been erratic across all banks
Exhibit 27: Opex to Assets Exhibit 28: Opex to Assets Comparison
Source: Company, NBRR (As on FY18) – Taken FY18 nos. as Q2 treasury income has been erratic across all banks
42.7%
47.3%
54.7% 53.9%
47.6%
45.0% 44.4%
46.5%
44.2% 43.0%
35%
40%
45%
50%
55%
60%
FY
12
FY
13
FY
14
FY
15
FY
16
FY
17
FY
18
FY
19
E
FY
20
E
FY
21
E
47% 48%
52%
60%
41%
44%
30%
35%
40%
45%
50%
55%
60%
65%
SIB Karna. Federal DCB CUB KVB
1.6%
1.8%
2.1% 2.1% 2.1% 2.1%
2.2% 2.2% 2.2% 2.1%
1.5%
1.7%
1.9%
2.1%
2.3%
FY
12
FY
13
FY
14
FY
15
FY
16
FY
17
FY
18
FY
19
E
FY
20
E
FY
21
E
1.7%
2.0% 1.9%
2.9%
2.0% 2.2%
1.0%
1.5%
2.0%
2.5%
3.0%
3.5%
SIB Karna. Federal DCB CUB KVB
10 |
P a g e
Init
iati
ng
Co
ve
rag
e
tia
tin
g C
ov
era
ge
Karur Vysya Bank Ltd.
In
itia
tin
g c
ov
era
ge
03
De
c 2
01
8
Asset quality deterioration to peak in H2FY19; expect steep decline in credit costs in FY20E
The aggressive growth in the corporate book and the stress thereafter had dented the asset quality of the bank.
Post the induction of new M.D. Mr. P.R. Seshadri in Q2FY18, the bank has upfronted most of the pending stress
pertaining to the legacy corporate book. As on date, the total pending corporate stress assets include: (i)
watchlist of Rs. 165 Cr (unfunded exposure which is unlikely to slip) and (ii) Exposure of Rs. 310 Cr to the IL&FS
group (likely to slip in H2FY19). Excluding these 2 cases, KVB expects to maintain a slippage ratio of 1.5% on
steady state basis (Q2FY19 was at 1.6% vs 6.6% QoQ and 3.0% YoY).
Exhibit 29: Stressed Assets
FY16 FY17 FY18 FY19E FY20E FY21E
GNPA 511 1484 3016 4271 4688 5119
% of Loan Book 1.3% 3.6% 6.6% 8.2% 7.8% 7.4%
Watchlist 700 150 325 165 0 0
% of Loan Book 1.8% 0.4% 0.7% 0.3% 0.0% 0.0%
Restructured Standard 1355 1077 337 75 0 0
% of Loan Book 3.4% 2.6% 0.7% 0.1% 0.0% 0.0%
Security Receipts 263 504 492 478 478 478
As % of Loan Book 0.7% 1.2% 1.1% 0.9% 0.8% 0.7%
Total Gross Stressed Assets 2829 3216 4171 4989 5166 5597
As % of Loan Book 7.2% 7.8% 9.1% 9.6% 8.6% 8.1%
Source: Company, NBRR
We expect KVB to commence FY20 with a clean slate and forecast a steep decline in slippage ratio and credit
costs over FY20 and FY21E. We have been conservative in our forecasts and expect the slippage ratio to decline
from 3.9% in FY19E to 2.6%/2.4% in FY20/21E (vs 1.5% as guided by the management). We expect credit cost to
decline from 2.6% in FY19E to 1.9%/1.5% in FY20/21E
Agg essi e e og itio a d upf o ti g of st essed assets has esulted i KVB s GNPAs ei g at highe le els than peers. However, with the entire corporate legacy exposure already slipping into GNPAs except for IL&FS
exposure of Rs. 310 Cr (likely to slip in H2FY19), we believe KVB is now on track to reduce its credit costs
structurally thereby leading to an increase in ROA from 0.5% in FY19E to 1.0%/1.2% in FY20/21E
Exhibit 30: Gross Slippage ratio & Credit cost
Source: Company, NBRR
0.7% 0.8% 0.5%
1.8%
3.0% 3.3%
4.9%
3.9%
2.6% 2.4%
0.2% 0.5%
1.4% 1.4% 1.0%
1.7%
2.9% 2.6%
1.9% 1.5%
0.0%
1.0%
2.0%
3.0%
4.0%
5.0%
FY
12
FY
13
FY
14
FY
15
FY
16
FY
17
FY
18
FY
19
E
FY
20
E
FY
21
E
Slippage Ratio % Credit Cost %
11 |
P a g e
Init
iati
ng
Co
ve
rag
e
tia
tin
g C
ov
era
ge
Karur Vysya Bank Ltd.
In
itia
tin
g c
ov
era
ge
03
De
c 2
01
8
Exhibit 31: Asset Quality deterioration is mainly due to legacy corporate exposure
Source: Company, NBRR
Exhibit 32: Corporate Segment: Net Slippages have already peaked (IL&FS exposure is the only pending A/c)
Source: Company, NBRR
Exhibit 33: Total Provisioning Expense (Rs Cr)
Source: Company, NBRR
1.3% 1.0% 0.8%
1.9% 1.3%
3.6%
6.6%
8.2% 7.8%
7.4%
0.3% 0.4% 0.4% 0.8% 0.6%
2.5%
4.2% 4.4% 3.9%
3.5%
0.0%
2.0%
4.0%
6.0%
8.0%
10.0%
FY
12
FY
13
FY
14
FY
15
FY
16
FY
17
FY
18
FY
19
E
FY
20
E
FY
21
E
GNPA NNPA
4.0%
7.6%
16.1%
14.3%
7.2%
0.9%
0.0%
4.0%
8.0%
12.0%
16.0%
20.0%
0
100
200
300
400
500
600
700
Q1FY18 Q2FY18 Q3FY18 Q4FY18 Q1FY19 Q2FY19
Corp. Net Slippages - LHS Corp. Net Slippage Ratio
89 123
442 481 392
687
1274 1259
1034 1000
0
200
400
600
800
1000
1200
1400
FY12 FY13 FY14 FY15 FY16 FY17 FY18 FY19E FY20E FY21E
12 |
P a g e
Init
iati
ng
Co
ve
rag
e
tia
tin
g C
ov
era
ge
Karur Vysya Bank Ltd.
In
itia
tin
g c
ov
era
ge
03
De
c 2
01
8
ROE to rise 840 bps over FY19-21E to 14.3% driven by lower credit costs
While we expect a moderate improvement in NIM, Non Op. Inc. and Opex, we foresee decline in Credit Cost as
the biggest lever contributing to increase in ROA over FY19-21E. Over FY19-21E, we expect credit cost/assets to
decline from 1.8% to 1.1%, a decline of 70bps and an equivalent increase in ROA from 0.5% to 1.2%.
Consequently we expect ROE to expand from 5.9% in FY19E to 14.3% in FY21E, an increase of 840 bps.
Exhibit 34: DuPont
FY12 FY13 FY14 FY15 FY16 FY17 FY18 FY19E FY20E FY21E
NII 4.9% 2.7% 2.6% 2.8% 3.2% 3.4% 3.6% 3.4% 3.5% 3.5%
Other Income 1.9% 1.1% 1.1% 1.1% 1.3% 1.3% 1.4% 1.3% 1.4% 1.4%
Total Income 6.7% 3.8% 3.8% 3.9% 4.4% 4.7% 5.0% 4.8% 4.9% 5.0%
Opex 2.9% 1.8% 2.1% 2.1% 2.1% 2.1% 2.2% 2.2% 2.2% 2.1%
PBP 3.9% 2.0% 1.7% 1.8% 2.3% 2.6% 2.8% 2.5% 2.7% 2.8%
Provisions 0.5% 0.3% 0.9% 0.9% 0.7% 1.1% 2.0% 1.8% 1.3% 1.1%
PBT 3.4% 1.7% 0.8% 0.9% 1.6% 1.5% 0.8% 0.8% 1.4% 1.7%
Tax Rate 20% 24% 2% -7% 38% 31% 31% 31% 31% 31%
ROA 2.7% 1.3% 0.8% 0.9% 1.0% 1.0% 0.5% 0.5% 1.0% 1.2%
Leverage 6.9 12.8 15.3 13.8 12.7 12.6 11.4 11.0 11.6 11.9
ROE 18.5% 16.7% 12.1% 13.1% 12.9% 12.6% 6.1% 5.9% 11.5% 14.3%
Source: Company, NBRR
Exhibit 35: ROA Exhibit 36: ROA (FY20E) Comparison
Source: Companies, NBRR, Bloomberg
Exhibit 37: ROE Exhibit 38: ROE (FY20E) Comparison
Source: Companies, NBRR, Bloomberg
1.5%
1.3%
0.8% 0.9% 1.0% 1.0%
0.5% 0.5%
1.0% 1.2%
0.0%
0.5%
1.0%
1.5%
2.0%
FY
12
FY
13
FY
14
FY
15
FY
16
FY
17
FY
18
FY
19
E
FY
20
E
FY
21
E
0.6%
0.8% 0.9% 1.0%
1.6%
1.0%
0.0%
0.4%
0.8%
1.2%
1.6%
2.0%
SIB Karna. Federal DCB CUB KVB
18.5%
16.7%
12.1% 11.8%
12.9%
12.6%
6.1% 5.9%
11.5%
14.3%
4.0%
8.0%
12.0%
16.0%
20.0%
FY
12
FY
13
FY
14
FY
15
FY
16
FY
17
FY
18
FY
19
E
FY
20
E
FY
21
E
9.1%
11.9% 11.8% 12.8%
16.1%
11.5%
5.0%
8.0%
11.0%
14.0%
17.0%
20.0%
SIB Karna. Federal DCB CUB KVB
13 |
P a g e
Init
iati
ng
Co
ve
rag
e
tia
tin
g C
ov
era
ge
Karur Vysya Bank Ltd.
In
itia
tin
g c
ov
era
ge
03
De
c 2
01
8
KVB to be the 2nd bank in peer group to scale 15%+ ROE after CUB
Among the old generation private banks, CUB has consistently stood out as an outlier by delivering an average
ROE of 15.3% over the last three years despite of the banking system having undergone severe stress. We
believe KVB can outperform its peers and potentially reach the profitability (ROE) levels of CUB over the next
four years (by FY22) on the back of robust capitalization and lower capital consumption which ensures no
dilution risk in medium term and a consistent rise in ROE. KVB has one of the highest Tier 1 ratios in its peer
group at 13.7%. Further, lower advances growth vis-à-vis peers shall result in lower capital
consumption/requirement. Thus we do not see any fund raising by KVB over the next few years as opposed to
its peers, whereby all have firmed up plans to raise Tier 1 capital over FY19-20E (except for CUB).
Exhibit 39: Tier 1 Capital Exhibit 40: Loan CAGR (FY18-20E) / Capital Consumption
Source: Companies, NBRR, Bloomberg
SIB Karnataka Federal DCB CUB KVB
ROE - FY20 9.1% 11.9% 11.8% 12.8% 16.1% 11.5%
Tier – 1 (Q2FY19) 10.0% 10.6% 12.8% 12.0% 14.7% 13.7%
Capital Raise in
FY19E
Wont Wont
FY20E
raise raise
Source: Companies, NBRR, Bloomberg
Exhibit 41: How we see KVB s ‘OE & Tier 1 unfolding ……….
Source: Company, NBRR
10.0% 10.6%
12.8%
12.0%
14.7%
13.7%
9.0%
10.0%
11.0%
12.0%
13.0%
14.0%
15.0%
SIB Karna. Federal DCB CUB KVB
16%
19%
23% 25%
16% 14%
10%
15%
20%
25%
30%
SIB Karna. Federal DCB CUB KVB
18.5%
16.7%
12.1% 11.8% 12.9% 12.6%
6.1% 5.9%
11.5%
14.3%
15.9%
13.1% 13.1%
11.6%
13.6%
11.3%
11.9%
13.9%
13.0% 12.4%
12.1% 11.9%
10.0%
11.0%
12.0%
13.0%
14.0%
15.0%
4%
6%
8%
10%
12%
14%
16%
18%
20%
FY
12
FY
13
FY
14
FY
15
FY
16
FY
17
FY
18
FY
19
E
FY
20
E
FY
21
E
FY
22
E
ROE - LHS Tier 1 - RHS
14 |
P a g e
Init
iati
ng
Co
ve
rag
e
tia
tin
g C
ov
era
ge
Karur Vysya Bank Ltd.
In
itia
tin
g c
ov
era
ge
03
De
c 2
01
8
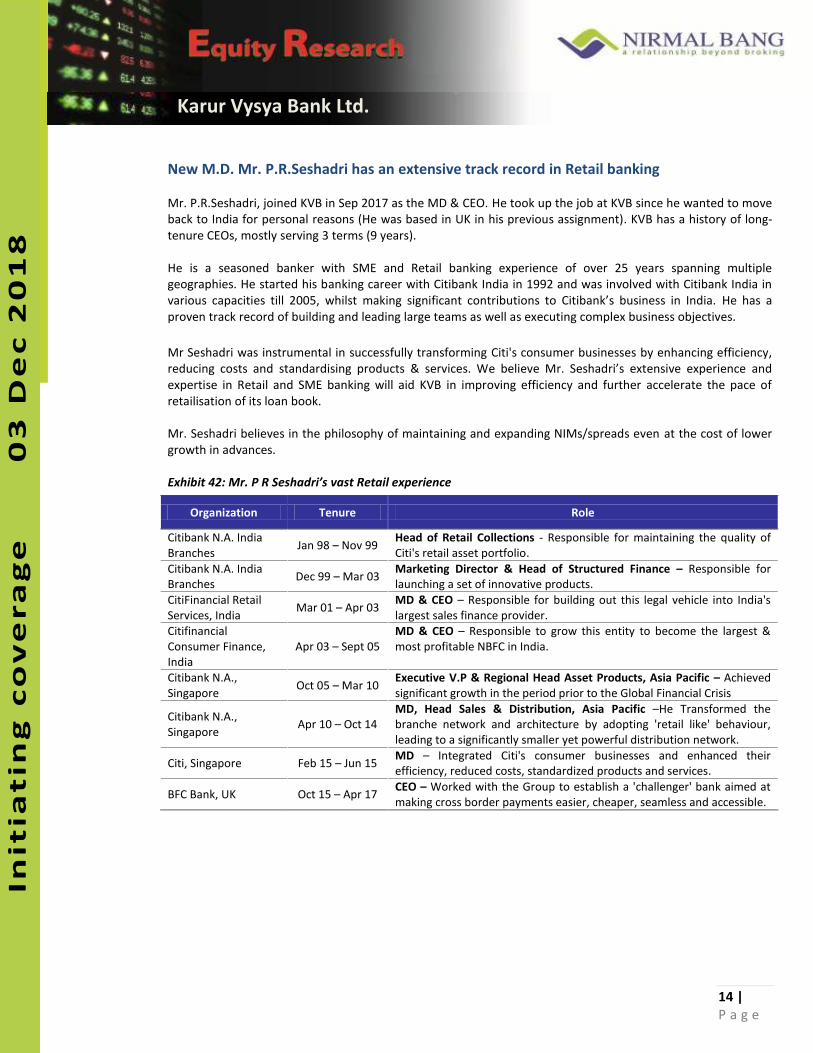
New M.D. Mr. P.R.Seshadri has an extensive track record in Retail banking
Mr. P.R.Seshadri, joined KVB in Sep 2017 as the MD & CEO. He took up the job at KVB since he wanted to move
back to India for personal reasons (He was based in UK in his previous assignment). KVB has a history of long-
tenure CEOs, mostly serving 3 terms (9 years).
He is a seasoned banker with SME and Retail banking experience of over 25 years spanning multiple
geographies. He started his banking career with Citibank India in 1992 and was involved with Citibank India in
a ious apa ities till , hilst aki g sig ifi a t o t i utio s to Citi a k s usi ess i I dia. He has a
proven track record of building and leading large teams as well as executing complex business objectives.
Mr Seshadri was instrumental in successfully transforming Citi's consumer businesses by enhancing efficiency,
reducing costs and standardising products & services. We believe M . “eshad i s e te si e e pe ie e and
expertise in Retail and SME banking will aid KVB in improving efficiency and further accelerate the pace of
retailisation of its loan book.
Mr. Seshadri believes in the philosophy of maintaining and expanding NIMs/spreads even at the cost of lower
growth in advances.
Exhibit 42: Mr. P R Seshadri’s vast Retail experience
Organization Tenure Role
Citibank N.A. India
Branches Jan 98 – Nov 99
Head of Retail Collections - Responsible for maintaining the quality of
Citi's retail asset portfolio.
Citibank N.A. India
Branches Dec 99 – Mar 03
Marketing Director & Head of Structured Finance – Responsible for
launching a set of innovative products.
CitiFinancial Retail
Services, India Mar 01 – Apr 03
MD & CEO – Responsible for building out this legal vehicle into India's
largest sales finance provider.
Citifinancial
Consumer Finance,
India
Apr 03 – Sept 05
MD & CEO – Responsible to grow this entity to become the largest &
most profitable NBFC in India.
Citibank N.A.,
Singapore Oct 05 – Mar 10
Executive V.P & Regional Head Asset Products, Asia Pacific – Achieved
significant growth in the period prior to the Global Financial Crisis
Citibank N.A.,
Singapore Apr 10 – Oct 14
MD, Head Sales & Distribution, Asia Pacific –He Transformed the
branche network and architecture by adopting 'retail like' behaviour,
leading to a significantly smaller yet powerful distribution network.
Citi, Singapore Feb 15 – Jun 15 MD – Integrated Citi's consumer businesses and enhanced their
efficiency, reduced costs, standardized products and services.
BFC Bank, UK Oct 15 – Apr 17 CEO – Worked with the Group to establish a 'challenger' bank aimed at
making cross border payments easier, cheaper, seamless and accessible.
15 |
P a g e
Init
iati
ng
Co
ve
rag
e
tia
tin
g C
ov
era
ge
Karur Vysya Bank Ltd.
In
itia
tin
g c
ov
era
ge
03
De
c 2
01
8
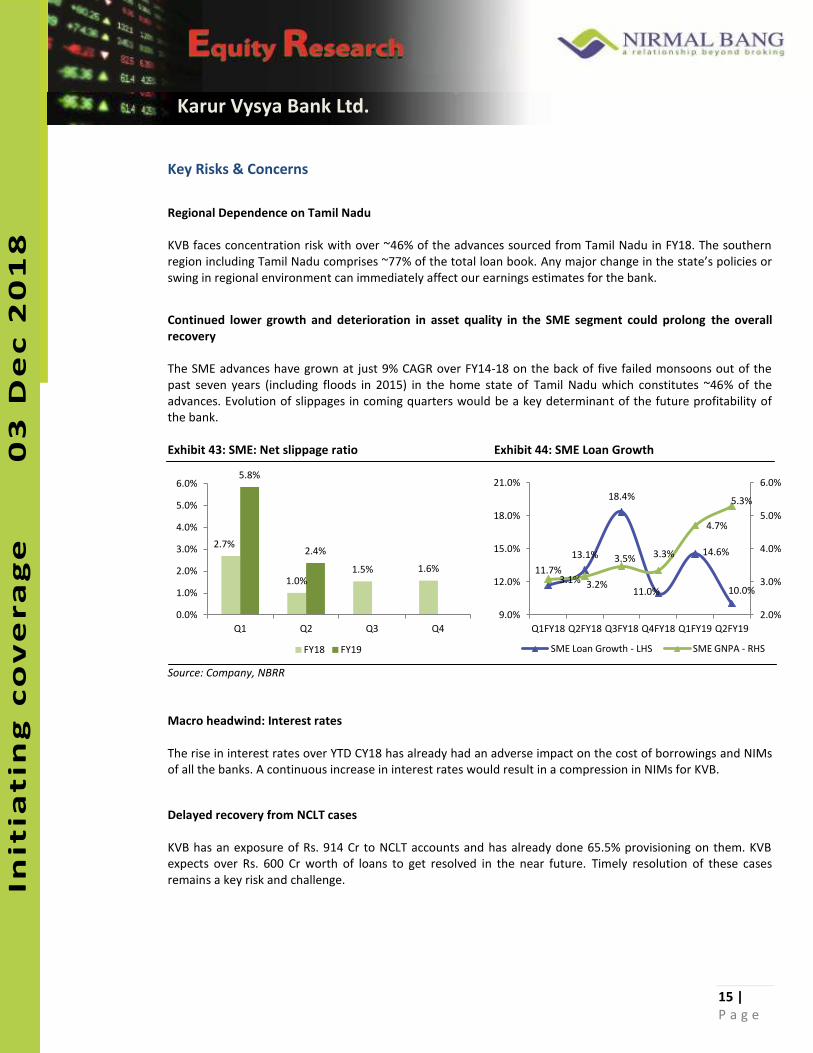
Key Risks & Concerns
Regional Dependence on Tamil Nadu
KVB faces concentration risk with over ~46% of the advances sourced from Tamil Nadu in FY18. The southern
region including Tamil Nadu comprises ~77% of the total loan book. Any major change in the state s poli ies o swing in regional environment can immediately affect our earnings estimates for the bank.
Continued lower growth and deterioration in asset quality in the SME segment could prolong the overall
recovery
The SME advances have grown at just 9% CAGR over FY14-18 on the back of five failed monsoons out of the
past seven years (including floods in 2015) in the home state of Tamil Nadu which constitutes ~46% of the
advances. Evolution of slippages in coming quarters would be a key determinant of the future profitability of
the bank.
Exhibit 43: SME: Net slippage ratio Exhibit 44: SME Loan Growth
Source: Company, NBRR
Macro headwind: Interest rates
The rise in interest rates over YTD CY18 has already had an adverse impact on the cost of borrowings and NIMs
of all the banks. A continuous increase in interest rates would result in a compression in NIMs for KVB.
Delayed recovery from NCLT cases
KVB has an exposure of Rs. 914 Cr to NCLT accounts and has already done 65.5% provisioning on them. KVB
expects over Rs. 600 Cr worth of loans to get resolved in the near future. Timely resolution of these cases
remains a key risk and challenge.
2.7%
1.0% 1.5% 1.6%
5.8%
2.4%
0.0%
1.0%
2.0%
3.0%
4.0%
5.0%
6.0%
Q1 Q2 Q3 Q4
FY18 FY19
11.7%
13.1%
18.4%
11.0%
14.6%
10.0% 3.1%
3.2%
3.5% 3.3%
4.7%
5.3%
2.0%
3.0%
4.0%
5.0%
6.0%
9.0%
12.0%
15.0%
18.0%
21.0%
Q1FY18 Q2FY18 Q3FY18 Q4FY18 Q1FY19 Q2FY19
SME Loan Growth - LHS SME GNPA - RHS
16 |
P a g e
Init
iati
ng
Co
ve
rag
e
tia
tin
g C
ov
era
ge
Karur Vysya Bank Ltd.
In
itia
tin
g c
ov
era
ge
03
De
c 2
01
8
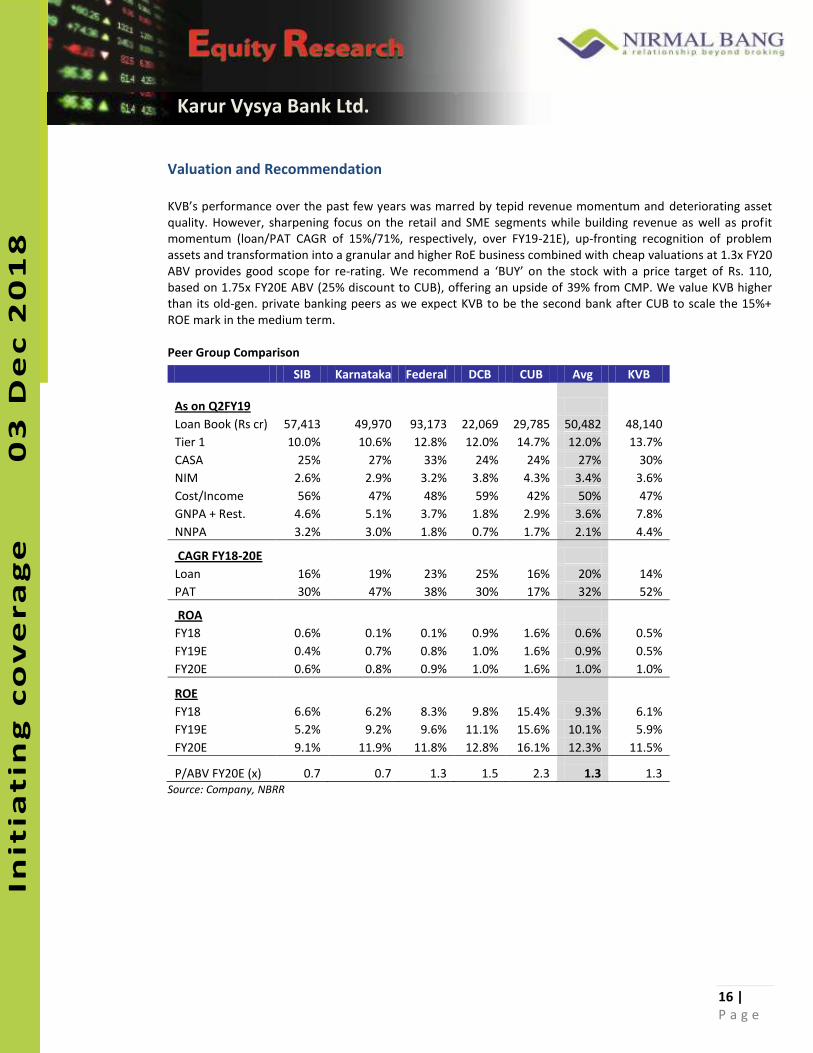
Valuation and Recommendation
KVB s performance over the past few years was marred by tepid revenue momentum and deteriorating asset
quality. However, sharpening focus on the retail and SME segments while building revenue as well as profit
momentum (loan/PAT CAGR of 15%/71%, respectively, over FY19-21E), up-fronting recognition of problem
assets and transformation into a granular and higher RoE business combined with cheap valuations at 1.3x FY20
ABV provides good scope for re- ati g. We e o e d a BUY on the stock with a price target of Rs. 110,
based on 1.75x FY20E ABV (25% discount to CUB), offering an upside of 39% from CMP. We value KVB higher
than its old-gen. private banking peers as we expect KVB to be the second bank after CUB to scale the 15%+
ROE mark in the medium term.
Peer Group Comparison
SIB Karnataka Federal DCB CUB Avg KVB
As on Q2FY19
Loan Book (Rs cr) 57,413 49,970 93,173 22,069 29,785 50,482 48,140
Tier 1 10.0% 10.6% 12.8% 12.0% 14.7% 12.0% 13.7%
CASA 25% 27% 33% 24% 24% 27% 30%
NIM 2.6% 2.9% 3.2% 3.8% 4.3% 3.4% 3.6%
Cost/Income 56% 47% 48% 59% 42% 50% 47%
GNPA + Rest. 4.6% 5.1% 3.7% 1.8% 2.9% 3.6% 7.8%
NNPA 3.2% 3.0% 1.8% 0.7% 1.7% 2.1% 4.4%
CAGR FY18-20E
Loan 16% 19% 23% 25% 16% 20% 14%
PAT 30% 47% 38% 30% 17% 32% 52%
ROA
FY18 0.6% 0.1% 0.1% 0.9% 1.6% 0.6% 0.5%
FY19E 0.4% 0.7% 0.8% 1.0% 1.6% 0.9% 0.5%
FY20E 0.6% 0.8% 0.9% 1.0% 1.6% 1.0% 1.0%
ROE
FY18 6.6% 6.2% 8.3% 9.8% 15.4% 9.3% 6.1%
FY19E 5.2% 9.2% 9.6% 11.1% 15.6% 10.1% 5.9%
FY20E 9.1% 11.9% 11.8% 12.8% 16.1% 12.3% 11.5%
P/ABV FY20E (x) 0.7 0.7 1.3 1.5 2.3 1.3 1.3
Source: Company, NBRR
17 |
P a g e
Init
iati
ng
Co
ve
rag
e
tia
tin
g C
ov
era
ge
Karur Vysya Bank Ltd.
In
itia
tin
g c
ov
era
ge
03
De
c 2
01
8
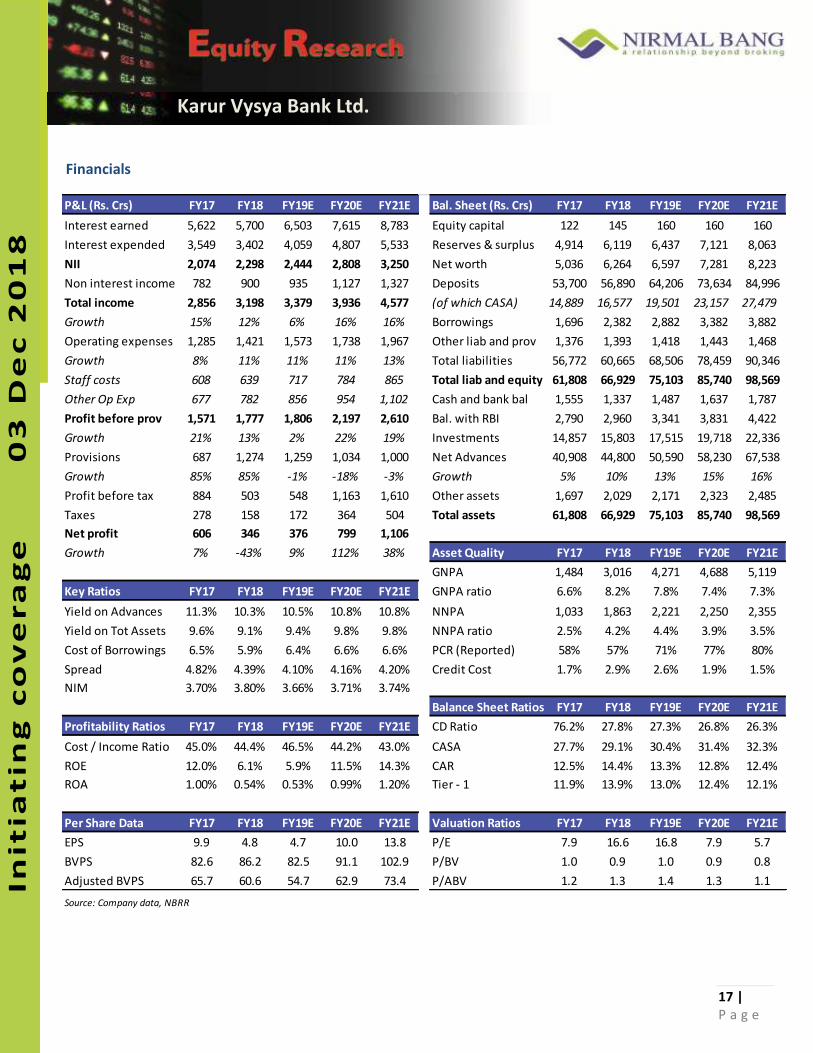
Financials
P&L (Rs. Crs) FY17 FY18 FY19E FY20E FY21E Bal. Sheet (Rs. Crs) FY17 FY18 FY19E FY20E FY21E
Interest earned 5,622 5,700 6,503 7,615 8,783 Equity capital 122 145 160 160 160
Interest expended 3,549 3,402 4,059 4,807 5,533 Reserves & surplus 4,914 6,119 6,437 7,121 8,063
NII 2,074 2,298 2,444 2,808 3,250 Net worth 5,036 6,264 6,597 7,281 8,223
Non interest income 782 900 935 1,127 1,327 Deposits 53,700 56,890 64,206 73,634 84,996
Total income 2,856 3,198 3,379 3,936 4,577 (of which CASA) 14,889 16,577 19,501 23,157 27,479
Growth 15% 12% 6% 16% 16% Borrowings 1,696 2,382 2,882 3,382 3,882
Operating expenses 1,285 1,421 1,573 1,738 1,967 Other liab and prov 1,376 1,393 1,418 1,443 1,468
Growth 8% 11% 11% 11% 13% Total liabilities 56,772 60,665 68,506 78,459 90,346
Staff costs 608 639 717 784 865 Total liab and equity 61,808 66,929 75,103 85,740 98,569
Other Op Exp 677 782 856 954 1,102 Cash and bank bal 1,555 1,337 1,487 1,637 1,787
Profit before prov 1,571 1,777 1,806 2,197 2,610 Bal. with RBI 2,790 2,960 3,341 3,831 4,422
Growth 21% 13% 2% 22% 19% Investments 14,857 15,803 17,515 19,718 22,336
Provisions 687 1,274 1,259 1,034 1,000 Net Advances 40,908 44,800 50,590 58,230 67,538
Growth 85% 85% -1% -18% -3% Growth 5% 10% 13% 15% 16%
Profit before tax 884 503 548 1,163 1,610 Other assets 1,697 2,029 2,171 2,323 2,485
Taxes 278 158 172 364 504 Total assets 61,808 66,929 75,103 85,740 98,569
Net profit 606 346 376 799 1,106
Growth 7% -43% 9% 112% 38% Asset Quality FY17 FY18 FY19E FY20E FY21E
GNPA 1,484 3,016 4,271 4,688 5,119
Key Ratios FY17 FY18 FY19E FY20E FY21E GNPA ratio 6.6% 8.2% 7.8% 7.4% 7.3%
Yield on Advances 11.3% 10.3% 10.5% 10.8% 10.8% NNPA 1,033 1,863 2,221 2,250 2,355
Yield on Tot Assets 9.6% 9.1% 9.4% 9.8% 9.8% NNPA ratio 2.5% 4.2% 4.4% 3.9% 3.5%
Cost of Borrowings 6.5% 5.9% 6.4% 6.6% 6.6% PCR (Reported) 58% 57% 71% 77% 80%
Spread 4.82% 4.39% 4.10% 4.16% 4.20% Credit Cost 1.7% 2.9% 2.6% 1.9% 1.5%
NIM 3.70% 3.80% 3.66% 3.71% 3.74%
Balance Sheet Ratios FY17 FY18 FY19E FY20E FY21E
Profitability Ratios FY17 FY18 FY19E FY20E FY21E CD Ratio 76.2% 27.8% 27.3% 26.8% 26.3%
Cost / Income Ratio 45.0% 44.4% 46.5% 44.2% 43.0% CASA 27.7% 29.1% 30.4% 31.4% 32.3%
ROE 12.0% 6.1% 5.9% 11.5% 14.3% CAR 12.5% 14.4% 13.3% 12.8% 12.4%
ROA 1.00% 0.54% 0.53% 0.99% 1.20% Tier - 1 11.9% 13.9% 13.0% 12.4% 12.1%
Per Share Data FY17 FY18 FY19E FY20E FY21E Valuation Ratios FY17 FY18 FY19E FY20E FY21E
EPS 9.9 4.8 4.7 10.0 13.8 P/E 7.9 16.6 16.8 7.9 5.7
BVPS 82.6 86.2 82.5 91.1 102.9 P/BV 1.0 0.9 1.0 0.9 0.8
Adjusted BVPS 65.7 60.6 54.7 62.9 73.4 P/ABV 1.2 1.3 1.4 1.3 1.1
Source: Company data, NBRR
18 |
P a g e
Init
iati
ng
Co
ve
rag
e
tia
tin
g C
ov
era
ge
Karur Vysya Bank Ltd.
In
itia
tin
g c
ov
era
ge
03
De
c 2
01
8
Disclosure:
This Report is published by Nirmal Ba g “e u ities P i ate Li ited he ei afte efe ed to as NB“PL fo p i ate i ulatio . NB“PL is a registered Research Analyst under SEBI (Research Analyst) Regulations, 2014 having Registration no. INH000001766. NBSPL is
also a registered Stock Broker with National Stock Exchange of India Limited and BSE Limited in cash and derivatives segments. It is
also a registered Portfolio Manager having registration no as INP000002981.
NBSPL has other business divisions with independent research teams separated by Chinese walls, and therefore may, at times, have
different or contrary views on stocks and markets.
NBSPL or its associates have not been debarred / suspended by SEBI or any other regulatory authority for accessing / dealing in
securities Market. NBSPL, its associates or analyst or his relatives do not hold any financial interest in the subject company. NBSPL or
its associates or Analyst do not have any conflict or material conflict of interest at the time of publication of the research report with
the subject company. NBSPL or its associates or Analyst or his relatives hold / do not hold beneficial ownership of 1% or more in the
subject company at the end of the month immediately preceding the date of publication of this research report.
NBSPL or its associates / analyst has not received any compensation / managed or co-managed public offering of securities of the
company covered by Analyst during the past twelve months. NBSPL or its associates have not received any compensation or other
benefits from the company covered by Analyst or third party in connection with the research report. Analyst has not served as an
officer, director or employee of Subject Company and NBSPL / analyst has not been engaged in market making activity of the subject
company.
Analyst Certification: I/We, Jehan Bhadha and Dnyanada Vaidya, the research analysts and authors of this report, hereby certify that
the views expressed in this research report accurately reflects my/our personal views about the subject securities, issuers, products,
sectors or industries. It is also certified that no part of the compensation of the analyst(s) was, is, or will be directly or indirectly
related to the inclusion of specific recommendations or views in this research. The analyst(s) principally responsible for the
preparation of this research report and has taken reasonable care to achieve and maintain independence and objectivity in
making any recommendations.
19 |
P a g e
Init
iati
ng
Co
ve
rag
e
tia
tin
g C
ov
era
ge
Karur Vysya Bank Ltd.
In
itia
tin
g c
ov
era
ge
03
De
c 2
01
8
Disclaimer:
This report is for the personal information of the authorized recipient and does not construe to be any investment, legal or
taxation advice to you. NBSPL is not soliciting any action based upon it. Nothing in this research shall be construed as a
solicitation to buy or sell any security or product, or to engage in or refrain from engaging in any such transaction. In
preparing this research, we did not take into account the investment objectives, financial situation and particular needs of
the reader.
This research has been prepared for the general use of the clients of NBSPL and must not be copied, either in whole or in
part, or distributed or redistributed to any other person in any form. If you are not the intended recipient you must not use
or disclose the information in this research in any way. Though disseminated to all the customers simultaneously, not all
customers may receive this report at the same time. NBSPL will not treat recipients as customers by virtue of their receiving
this report. This report is not directed or intended for distribution to or use by any person or entity resident in a state,
country or any jurisdiction, where such distribution, publication, availability or use would be contrary to law, regulation or
which would subject NBSPL & its group companies to registration or licensing requirements within such jurisdictions.
The report is based on the information obtained from sources believed to be reliable, but we do not make any representation
or warranty that it is accurate, complete or up-to-date and it should not be relied upon as such. We accept no obligation to
correct or update the information or opinions in it. NBSPL or any of its affiliates or employees shall not be in any way
responsible for any loss or damage that may arise to any person from any inadvertent error in the information contained in
this report. NBSPL or any of its affiliates or employees do not provide, at any time, any express or implied warranty of any
kind, regarding any matter pertaining to this report, including without limitation the implied warranties of merchantability,
fitness for a particular purpose, and non-infringement. The recipients of this report should rely on their own investigations.
This information is subject to change without any prior notice. NBSPL reserves its absolute discretion and right to make or
refrain from making modifications and alterations to this statement from time to time. Nevertheless, NBSPL is committed to
providing independent and transparent recommendations to its clients, and would be happy to provide information in
response to specific client queries.
Before making an investment decision on the basis of this research, the reader needs to consider, with or without the
assistance of an adviser, whether the advice is appropriate in light of their particular investment needs, objectives and
financial circumstances. There are risks involved in securities trading. The price of securities can and does fluctuate, and an
individual security may even become valueless. International investors are reminded of the additional risks inherent in
international investments, such as currency fluctuations and international stock market or economic conditions, which may
adversely affect the value of the investment. Opinions expressed are subject to change without any notice. Neither the
company nor the director or the employees of NBSPL accept any liability whatsoever for any direct, indirect, consequential or
other loss arising from any use of this research and/or further communication in relation to this research. Here it may be
noted that neither NBSPL, nor its directors, employees, agents or representatives shall be liable for any damages whether
direct or indirect, incidental, special or consequential including lost revenue or lost profit that may arise from or in
connection with the use of the information contained in this report.
Copyright of this document vests exclusively with NBSPL. Our reports are also available on our website www.nirmalbang.com
20 |
P a g e
Init
iati
ng
Co
ve
rag
e
tia
tin
g C
ov
era
ge
Karur Vysya Bank Ltd.
In
itia
tin
g c
ov
era
ge
03
De
c 2
01
8
Nirmal Bang Research (Division of Nirmal Bang Securities Pvt. Ltd.)
B-2, 301/302, Marathon Innova,
Opp. Peninsula Corporate Park
Off. Ganpatrao Kadam Marg
Lower Parel (W), Mumbai-400013
Board No. : 91 22 6723 8000/8001
Fax. : 022 6723 8010