proliferation of brain tumor initiating cells a nr2e1
TRANSCRIPT

Page 1/29
A NR2E1-Interacting Peptide of LSD1 Inhibits theProliferation of Brain Tumor Initiating CellsRong Hu
The Sixth A�liated Hospital of Sun Yat-sen UniversityUmar Hameed
National University of SingaporeXiang Sun
The Chinese University of Hong KongBalakrishnan Moorthy
National University of SingaporeWen Zhang
The Sixth A�liated Hospital of Sun Yat-sen UniversityPhilip Jeffrey
Princeton UniversityLi Zhou
The Chinese University of Hong KongXin Ma
The Chinese University of Hong KongFangjin Chen
Peking UniversityJianfeng Pei
Peking University https://orcid.org/0000-0002-8482-1185Pankaj Giri
Columbia UniversityYonggao Mou
Sun Yat-sen University Cancer CenterKunchithapadam Swaminathan
National University of SingaporePing Yuan ( [email protected] )
The Sixth A�liated Hospital of Sun Yat-sen University https://orcid.org/0000-0001-7243-3487
Article
Keywords: Brain tumor initiating cells, NR2E1, LSD1, Peptide, Brain cancer

Page 2/29
Posted Date: June 1st, 2021
DOI: https://doi.org/10.21203/rs.3.rs-492657/v1
License: This work is licensed under a Creative Commons Attribution 4.0 International License. Read Full License

Page 3/29
AbstractThe recurrence of malignant brain tumor, like glioblastoma, is often due to the existence of brain tumorinitiating cells (BTICs) with stem cell properties. As the mortality ratio of brain tumor relapsed patients isvery high and lack of e�cient therapies, there is an urgent need to develop novel therapeutic methodstargeting BTICs. NR2E1 (TLX), an orphan nuclear receptor, is critical for the self-renewal of BTICs. In thisstudy, we found that NR2E1 recruits LSD1, a lysine demethylase, to demethylate mono- and di-methylatedhistone 3 Lys4 (H3K4me/me2) at the Pten promoters and repress its expression, thereby promoting BTICproliferation. Using Amide Hydrogen/Deuterium Exchange and Mass Spectrometry (HDX-MS) method, weidenti�ed four LSD1 peptides that may interact with NR2E1. One of the peptides that locates at the LSD1SWIRM domain strongly inhibited BTIC proliferation by promoting Pten expression through interferingNR2E1 and LSD1 function. Furthermore, overexpression of this peptide in human BTIC can inhibit itsformation of brain tumor. Hence, this peptide exhibits an interesting potential for therapeutic interventionin malignant brain tumors in future.
IntroductionMalignant brain cancers, like glioblastoma (GBM), are highly heterogeneous and aggressive. They areresistant to chemotherapy and radiation therapy and show a high chance of relapse. The patient survivalrate is only about 15 months after diagnosis. This situation has lasted over the past decades althoughmultiple novel therapeutic means have been employed (Houshyari et al., 2015, Mrugala, 2013). It hasbeen suggested that cancer initiating cells (CICs) with stem cell properties underlie the heterogeneity ofmalignant tumors (Zhu et al., 2014). They are less differentiated and resistant to chemotherapy andradiation treatment. They are thought to be the “root” of tumor occurrence and are responsible for thegrowth and relapse of tumors. Targeting CICs to treat cancer may help to improve the outcome of clinicaltherapies (Lin et al., 2013).
Researches have revealed that the recurrence of high-grade gliomas is due to the existence of brain tumorinitiating cells (BTICs). BTICs were among the �rst CICs derived from a solid tumor (Singh et al., 2003,Singh et al., 2004). BTICs express the neural stem cell surface marker CD133. And as little as 100 BTICscould initiate phenocopies of the original tumors in a NOD.CB17-Prkdcscid/J (NOD SCID) mouse brain(Singh et al., 2004). BTICs and neural stem cells (NSCs) share several similarities, and it has beensuggested that BTICs hijack the self-renewal mechanisms of NSCs to support their proliferation. Manystudies have shown that the factors important for NSC maintenance also play important roles in braintumorigenesis. For example, Nestin, which labels NSCs in adult mouse brain, also marks BTICs inglioblastoma and is required for the long-term sustenance of tumor growth (Chen et al., 2012).
NR2E1(TLX), an orphan nuclear receptor, is essential for the self-renewal of BTICs. NR2E1-positive gliomacells can initiate brain tumors and form spheres in suspension culture (Zhu et al., 2014). Depletion of
Page 4/29
NR2E1 in mouse primary tumors signi�cantly extended animal survival time. Interestingly, GBM patientsexpress a high level of NR2E1 which is correlated with poor survival time (Zhu et al., 2014). NR2E1 maytherefore be a valuable target for brain tumor therapy. Just like Nestin, NR2E1 is highly expressed at thehippocampal dentate gyrus and the subventricular zone. It is required for the maintenance and self-renewal of neural stem cells (Shi et al., 2004a). In NSCs, NR2E1 interacts with LSD1, a histonedemethylase, and recruits it to the promoter of Pten. LSD1 then demethylates mono- and di-methylatedhistone 3 Lys 4 (H3K4) and removes these active epigenetic markers from the regions to silence theexpression of Pten, a gene that induces apoptosis, regulates the cell cycle and functions as tumorrepressors. Through coordinated repression of Pten, NR2E1 and LSD1 contribute to the proliferation ofNSCs and retinoblastoma cells (Shi et al., 2004a, Yokoyama et al., 2008). Pten is an important mis-regulated tumor suppressor gene in almost all types of cancers. It is now an open and interestingquestion whether a similar mechanism is also employed in BTICs.
Lysine-speci�c histone demethylase LSD1 (also named AOF2 or KDM1A or BHC110) is a FAD dependentlysine demethylase. LSD1 can demethylate mono- and di-methylated H3K4 in a complex with CoREST,but shifts its targets to mono- and di-methylated H3K9 when it partners with the androgen receptor (AR)(Lee et al., 2006, Metzger et al., 2005, Shi et al., 2004b, Shi et al., 2005). Thus, by changing partners, LSD1is involved in both gene activation and gene repression. The N-terminus of LSD1 is a non-structuralelement and contains a putative nuclear localization signal. Following this region is theSwip3p/Rsc8p/Moira (SWIRM) domain. After the SWIRM domain is an oxidase domain which is involvedin demethylating proteins. LSD1 is also linked to the growth of glioblastoma and its inhibition increasesthe sensitivity of glioblastoma cells to histone deacetylase (HDAC) inhibitor treatment (Singh et al.,2011). Since NR2E1 and LSD1 both play important roles in glioblastoma, we set out to investigatewhether BTICs employ the same NR2E1-LSD1 mechanism, as in NSCs, to regulate BTIC proliferation.
ResultsNR2E1 and LSD1 are essential for the proliferation of BTICs
To study the role of NR2E1 and LSD1 in BTICs, two BTIC lines, BTIC-1 and BTIC-2 derived from Nestin-TV-a mice were employed for the following experiments. These BTICs can e�ciently grow mouse braintumors after transplantation in recipient mice(Zhu et al., 2014). Like neural stem cells (NSCs), BTICscould be maintained in monolayer or non-adherent suspension culture (Figure 1a) (Zhu et al., 2014). Thecapacity of BTICs to form tumor spheres suggests their stem cell properties. NR2E1 and LSD1 are highlyexpressed in NSCs and promote the self-renewal of NSCs (Sun et al., 2010). Real-time PCR and westernblot assays showed that both NR2E1 and LSD1 were more highly expressed in BTICs than NSCs (Figure1b and 1c). We therefore set to examine whether NR2E1 and LSD1 coordinate with each other to regulatethe proliferation of BTICs. To knock down Nr2e1 and Lsd1, we designed two different shRNAs for eachgene and cloned them into pSuper-puro vector. We transfected these shRNAs in to BTICs respectively byelectroporation and selected the transfected cells with puromycin(Sun et al., 2010). Three days afterpuromycin selection, Nr2e1 and Lsd1 shRNA knockdown led to a signi�cantly lower amount of BTICs in

Page 5/29
culture (Figure 1d and Supplementary Figure 1a). Real-time PCR revealed that the expression of Nr2e1and Lsd1 was downregulated to about 20% to 40% of their original levels by their respective shRNAs(Figure 1e and Supplementary Figure 1b). We then examined cell viability by the MTT cell proliferationassay, which revealed that the knockdown of Nr2e1 and Lsd1 resulted in reduced cell viability comparedto the control knockdown BTICs (Figure 1f and Supplementary Figure 1c). These results suggest thatNr2e1 and Lsd1 are required for the proliferation of BTICs.
NR2E1 and LSD1 synergistically repress PTEN to promote BTIC proliferation
To examine whether NR2E1 and LSD1 play the same role in BTICs as in NSCs, we performed co-immunoprecipitation assay using whole cell lysate. An anti-NR2E1 antibody could pull down endogenousLSD1, but control IgG could not, suggesting that NR2E1 and LSD1 form a complex in BTICs (Figure 2a).To investigate whether NR2E1 and LSD1 also regulate Pten in BTICs, we knocked down the expression ofNr2e1 and Lsd1 in BTICs by shRNAs. The downregulation of NR2E1 and LSD1 led to the upregulation ofPTEN at both the mRNA and protein levels (Figure 2b and 2c, Supplementary Figure 2a). To examinewhether PTEN is one of the major effectors of NR2E1 and LSD1, we generated shRNA that coulde�ciently downregulate Pten expression (Figure 2d). Downregulation of Pten expression in Nr2e1knockdown BTICs or Lsd1 knockdown BTICs could rescue the cell death phenotype caused by onlyknockdown of Nr2e1 or Lsd1 (Figure 2e- 2f, Supplementary Figure 2b-2c). To further examine whetherBTICs employed the same NR2E1-LSD1 regulatory mechanism as NSCs, we performed chromatinimmunoprecipitation (ChIP) assay to investigate NR2E1 and LSD1 binding pro�le. The ChIP assayrevealed that NR2E1 and LSD1 both bind to the promoter of Pten (Figure 2g). To examine whether NR2E1and LSD1 are functional at the promoter of Pten, we performed ChIP assay with antibodies againstH3K4me1 and H3K4me2 using chromatin extracted from Nr2e1 or Lsd1 knockdown BTICs. It turned outthat both downregulation of NR2E1 and LSD1 led to upregulated enrichment of H3K4me1 and H3K4me2at the Pten promoter, suggesting that NR2E1 and LSD1 indeed directly repress Pten in BTICs bydemethylating H3K4me and H3K4me2 at its promoter (Figure 2h).
Prediction of Lsd1 peptides involved in the NR2E1-LSD1 interaction
To understand how NR2E1 and LSD1 synergistically function, we employed Amide Hydrogen/DeuteriumExchange and Mass Spectrometry (HDX-MS) to investigate the interaction between NR2E1 and LSD1. Atotal of 56 pepsin digested fragments covering about 80% of the LSD1 primary sequence were identi�edand analyzed. The difference in deuterium uptake for all the fragments between LSD1 alone andLSD1:NR2E1 complex was measured at 30 seconds, 1, 2, 5 and 10 minutes. As the difference indeuterium exchange was maximum at 1 minute, the deuterium uptake for each peptide in the 1 minutesamples was used to monitor the effects of NR2E1 binding with LSD1. A number of regions in LSD1showed decreased exchange upon interactions with NR2E1, but the maximum difference occurred at theregions within the AO domain. Peptides 333-350, 333-353 and 354-377 from the AO domain showed asigni�cant decrease of 2.2, 2.5 and 4.0 deuterons, respectively (Figure 3a). Also, in the LSD1:NR2E1complex, peptides 196-211, 197-211, 320-332, 333-344, 378-385, 419-441, 481-501, 498-511, 500-510,

Page 6/29
537-546, 601-614 and 623-650 from the SWIRM, Tower and AO domains showed a decrease of about 1.6deuterons. Mass spectral isotope envelopes for four peptides, 197-211, 354-377, 481-501 and 537-546,from 1 minute HDX samples showed the most signi�cant difference between LSD1 alone and NR2E1-LSD1 complex after deuterium uptake, suggesting these LSD1 peptides may be involved in forming acomplex with NR2E1 (Figure 3b). The difference in deuterium uptake for each peptide was calculated andthe results from 1 minute samples were mapped onto the crystal structure of LSD1 (PDB ID: 2Z3Y)(Figure 3c).
The crystal structure of the NR2E1 ligand binding domain (LBD) has been solved (Zhi et al., 2015). NR2E1LBD interacts with both the SWIRM and AO domains of LSD1 (Yokoyama et al., 2008). We have predictedthe interaction between NR2E1 LBD (PDB code: 4XAI) and LSD1 (PDB code: 3ZMU) using the ZDOCKprogram (Chen et al., 2003). LSD1 residues 256-333, 410-435, 575-626, 712-744 and 792-819 that are notsupposed to interact with NR2E1 were set as block residues. As a result, 3600 docking complexes weregenerated and clustered into 650 groups using the MMSTB clustering method (Feig et al., 2004) with aroot-mean-square deviation (RMSD) cutoff at 8 Å. The buried solvent-accessible area, which is deemed asthe possible binding surface of NR2E1 LBD by LSD1 peptides 197-211, 354-377, 481-501 and 537-546,was calculated by Naccess (Hubbard and Thornton, 1993) with a probe radius of 1.4 Å. LSD1 peptides197-211, 354-377 and 481-501 individually showed varying predicted binding surface on NR2E1.However, LSD1-537-546 showed almost no predicted binding surface, suggesting that LSD1-537-546 isnot likely involved in the interaction between LSD1 and NR2E1 LBD (Figure 3d).
Role of LSD1 peptides in NR2E1-LSD1 interaction
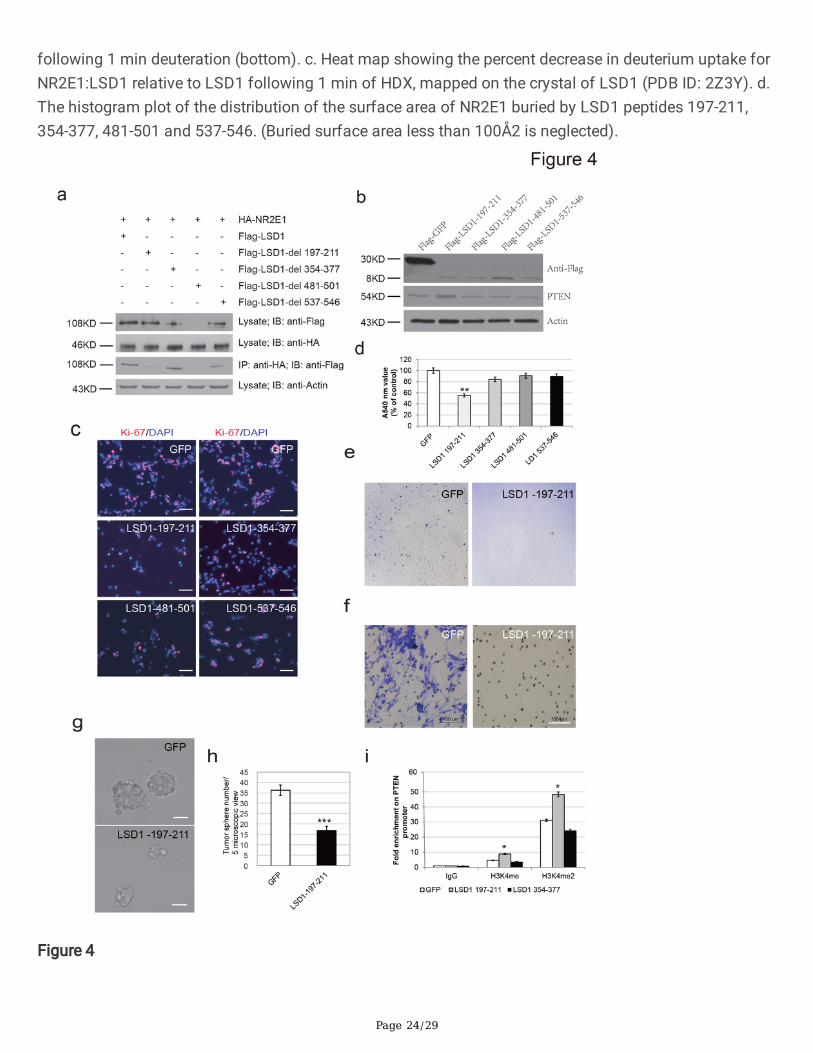
To further characterize the role of the LSD1 peptides 197-211, 354-377, 481-501 and 537-546 identi�ed byHDX-MS, we generated Flag-tagged Lsd1 mutant clones by deleting the peptide encoding regions. Theseclone plasmids were then co-transfected with a plasmid expressing HA-NR2E1 into 293T cells for co-immunoprecipitation assay. Western blot revealed that while Flag-LSD1-∆197-211, Flag-LSD1-∆354-377and Flag-LSD1-∆537-546 could be stably expressed, deletion of residues 481-501 of LSD1 however led tono detectable protein, suggesting this region is critical for the stable expression of LSD1 (Figure 4a). Thenwe performed immunoprecipitation with an anti-HA antibody using whole cell lysate and followed byimmunoblotting with an anti-Flag antibody. It turned out that HA-NR2E1could pull down Flag-LSD1, Flag-LSD1-∆354-377 and Flag-LSD1-∆537-546, but not Flag-LSD1-∆197-211. This suggests that deletion ofpeptide LSD1-354-377 or LSD1 537-546 did not disturb the interaction between LSD1 and NR2E1, onlydeletion of LSD1-197-211 destroyed the NR2E-LSD1 complex (Figure 4a). Therefore, LSD1-197-211 isessential for NR2E1-LSD1 complex formation.
We next investigated the function of overexpression of these peptides in BTICs. We cloned the fourpeptides into the pCAG-puro plasmids and expressed them as Flag-tag peptides. Twelve hours aftertransfection, puromycin was added to select the transfected cells. At day 3 after puromycin selection,cells were harvested to check protein expression. Western blot with an anti-Flag antibody con�rmed thatall four Flag-tagged LSD1 peptides were expressed. Interestingly, the level of PTEN was increased in Flag-

Page 7/29
LSD1-197-211 overexpressed BTICs compared to GFP overexpressed BTICs (Figure 4b). ImmunostainingBTICs at this stage with an anti-Ki67 antibody revealed that overexpression of LSD1-197-211 led to fewerKi67 positive cells (Figure 4c). Further MTT assay con�rmed that LSD1-197-211 transfected BTICsshowed the most drastic reduction of viable cells, while LSD1-354-377 only slightly decreased BTICs andboth LSD1-481-501 and LSD1-537-546 showed almost no effect (Figure 4d).
As transient express LSD1-197-211 could inhibit the self-renewal of BTICs, we next generated doxycyclineinducible lentivirus to stably express LSD1-197-211 peptide-P2A-EGFP in BTICs. LSD1-197-211 peptideand EGFP are connected with P2A, a self-cleavage peptide Supplementary Figure 3a). After translation,LSD1-197-211 and EGFP are cut apart at P2A site. Hence GFP protein level can re�ect LSD1-197-211level in transduced cells. We �rst infected 293T cells with these lentiviruse. After doxycycline induction forthree days, it is clearly that both GFP lentivirus and LSD1-197-211-GFP lentivirus express similar level ofGFP. Therefore LSD1-197-211 did not inhibit the growth of 293T cells (Supplementary Figure 3b). Next,we infected BTICs with the same batch of lentivirus and puri�ed the transduced cells by puromycinselection. We then induced the peptide expression with doxycycline. 60 hours after induction, weperformed immunostaining with antibody against cleaved Caspase-3, the marker of apoptosis. It turnedout that BTICs that expressed LSD1-197-211 and GFP were often cleaved Caspase-3 positive, while it wasnot the case for the control GFP overexpressed BTICs (Supplementary Figure 4a). This result suggeststhat the expression of LSD1-197-211 in BTICs leads to apoptosis of the cells. Further extending the cellculture time, we observed that GFP positive LSD1-197-211 BTICs gradually lost their shape and detachedfrom the plate. Eventually very rare GFP positive cells in LSD1-197-211 lentivirus transduced BTIC culturewere observed (Supplementary Figure 4b). Analysis of GFP positive cell ratio with �ow cytometry revealedthat in contrast to the 78.6% GFP positive cells in the GFP lentivirus transduced BTICs, only 0.71% of theLSD1-197-211 lentivirus transduced BTICs showed weak GFP expression, suggesting that LSD1-197-211peptide expressed BTICs were dead (Supplementary Figure. 4c). Soft agar colony formation assay alsorevealed that LSD1-197-211 overexpression drastically reduced the colony formation capacity of BTICs(Figure 4e). Furthermore, transwell assay revealed that overexpression of LSD1-197-211 drasticallyreduced the migration capacity of BTICs (Figure 4f). As expected, the size of tumor spheres formed byLSD1-197-211 overexpressed BTICs was smaller than GFP overexpressed BTICs (Figure 4g). Besides, theoverall sphere number was also much less in LSD1-197-211 overexpressed BTICs than GFPoverexpressed BTICs (Figure 4h), suggesting an inhibitory role of LSD1-197-211 on BTIC in vitro.
To examine whether the inhibitory effect of LSD1-197-211 on BTIC proliferation is due to the interferenceof NR2E1 and LSD1 synergistical function, we performed ChIP assay with antibodies against H3K4me1and H3K4me2 with chromatin extracted from GFP, LSD1-197-211 and LSD1-354-377 overexpressedBTICs respectively. H3K4me1 and H3K4me2 modi�cation at Pten promoter was signi�cantly increased inLSD1-197-211 overexpressed BTICs, compared to the GFP overexpressed BTICs and LSD1-354-377overexpressed BTICs (Figure 4i). These data suggest that LSD1-197-211 can inhibit BTIC proliferation byinterfering the demethylation function of NR2E1-LSD1 complex on H3K4 methylation at Pten promoter.
Speci�city of peptide Lsd1-197-211

Page 8/29
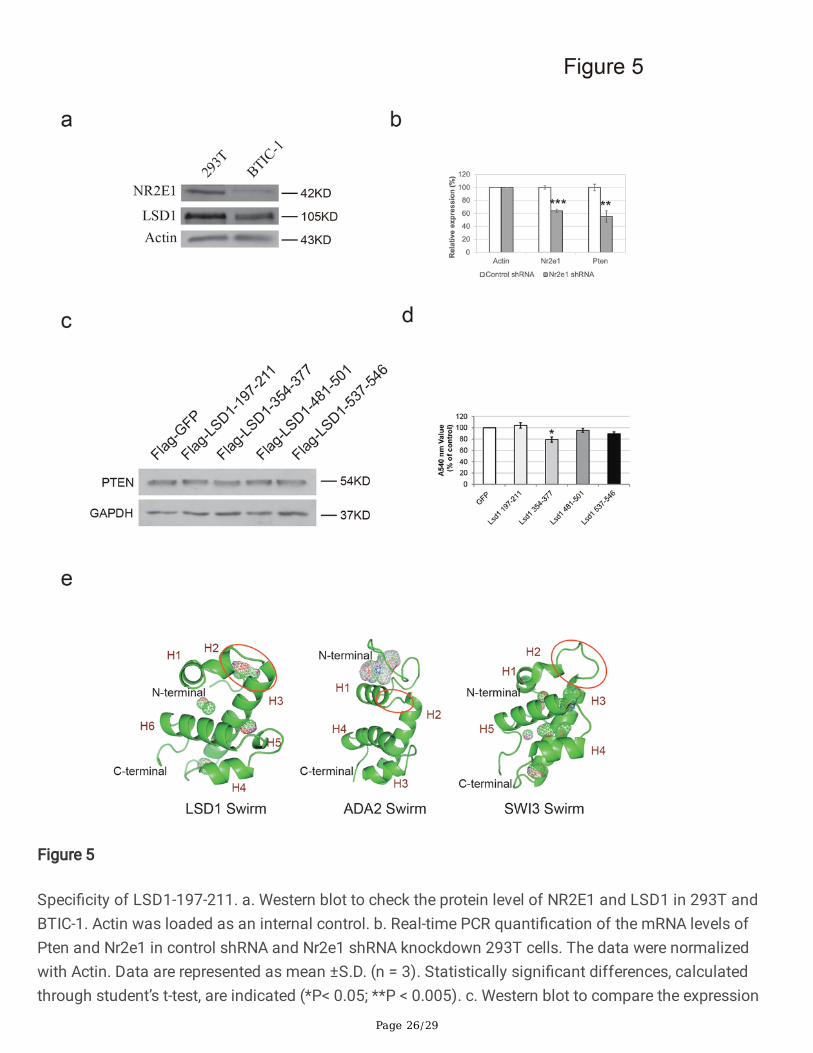
Although LSD1-197-211 could interfere with the synergistic function of NR2E1 and LSD1 and inhibit theproliferation of BTICs, the speci�city of this peptide is unclear. Both NR2E1 and LSD1 are highlyexpressed in 293T cells (Figure 5a). Knockdown of Nr2e1 by shRNA did not, however, lead to theupregulation of Pten at the mRNA level, suggesting that the NR2E1-LSD1 mechanism is not involved inthe proliferation of 293T cells (Figure 5b). To test whether LSD1-197-211 had any effect on the cells thatdo not rely on the NR2E1-LSD1 based cell proliferation, we overexpressed GFP and LSD1 peptides in293T cells separately with puromycin selection for three days. Western blot showed that the PTEN proteinlevel was similar in the GFP and LSD1 peptide overexpressed BTICs (Figure 5c). MTT assay was furtherperformed to check the cell viability. Apart from LSD1-354-377, which exhibited slight inhibition of 293Tcell growth, other peptides showed no obvious inhibitory effect (Figure 5d). This result suggests that theLSD1-197-211 peptide shows relatively speci�c inhibition on BTICs.
To further characterize the speci�city of LSD1-197-211, we determined the crystal structure of the humanLSD1 SWIRM domain, residues 183-267 (Supp. Table 1). The SWIRM structure mainly contains a longcentral helix separating two smaller helix-loop-helix motifs at both sides (Figure 5e). The SWIRM domainhighly resembles the SWIRM domain of previously determined human LSD1 crystal structure (PDB ID:2Z3Y) (Supplementary Figure 5). Out of 687 aligned atoms, 528 atoms of the two structures can be wellaligned with a root mean square of 0.418. Unlike the SWIRM domain of SWI3 and ADA2, which binds toDNA, the SWIRM domain of LSD1 can neither bind to DNA nor does it contain any typical DNA-bindingpatch (Da et al., 2006). One major difference between LSD1 SWIRM domain and SWI3 and ADA2 SWIRMdomains is mainly con�ned to the N-terminus. LSD1-197-211 is located at this region of the SWIRMdomain, comprising a part of helix H2, a loop and a part of the long central helix H3 (Figure 5e). Thisregion protrudes away from the hydrophobic core formed by H6 and the AO domain, which is involved insubstrate demethylation (Chen et al., 2006). It forms a stable binding pocket with the N terminal loop andprovides enough space to interact with other proteins (Figure 5e). Unlike LSD1 SWIRM domain, thecorresponding region of ADA2 SWIRM is blocked by the N-terminal loop, making it impossible to interactwith other proteins. For the SWI3 SWIRM domain, a big loop connects the H2 and H3 helices and nobinding pocket is formed in this region (Figure 5e). The structural difference among LSD1, ADA2 andSWI3 SWIRM domains substantiates their different ligand binding properties.
LSD1 197-211 inhibits the brain tumor formation of BTIC
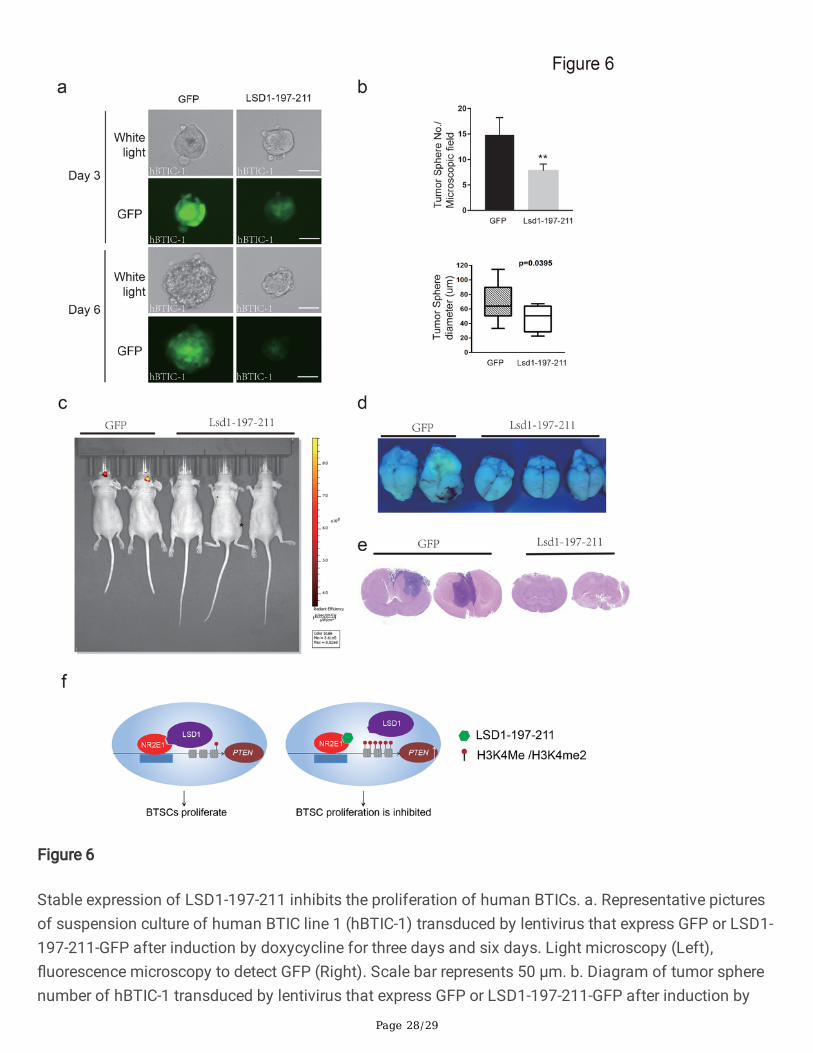
Human and mouse NR2E1 protein sequences share more than 97% similarity so does LSD1. In addition,human and mouse LSD1-197-211 peptides are exactly the same. Therefore, we deduced that LSD1-197-211 peptide should be able to repress human BTICs (hBTICs) as well. To test this hypothesis, we derivedtwo hBTIC lines from glioblastoma patients (Supplementary Figure 6a) and generated doxycyclineinducible LSD1-197-211-GFP and control GFP transduced hBTICs by abovementioned lentivirus system.Next, we tested the effect of LSD1-197-211 on tumor sphere formation by adding doxcycycline to theculture medium. 3 days after doxycycline induction, LSD1-197-211-GFP transduced hBTICs formedslightly smaller tumor sphere than GFP transduced hBTICs. GFP signal in LSD1-197-211-GFP transducedhBTICs was also weaker than GFP transduced hBTICs. 6 days later, the difference was more drastic
Page 9/29
(Figure 6a and Supplementary Figure 6b). Not only the number of tumor spheres formed by LSD1-197-211-GFP transduced hBTICs was less than GFP transduced hBTICs, but also the average tumor spheresize of LSD1-197-211-GFP transduced hBTICs was smaller than GFP transduced hBTICs (Figure 6b).These results con�rmed that LSD1-197-211 inhibits hBTICs.
To further investigate the function of LSD1-197-211 in vivo, we transplanted the transduced hBTICs intothe brains of nude mice. The next day after the transplantation, we started to feed the mice with watercontaining doxycycline to induce transduced gene expression. Mice transplanted with GFP transducedhBTICs showed obvious brain tumor growth as revealed by GFP positive signals, while almost no GFPpositive signals were detected in mice transplanted with LSD1-197-211-GFP transduced hBTICs (Figure6c-6d). Further Hematoxylin-eosin staining revealed obvious tumor in�ltration in the brains of GFPtransduced hBTIC transplanted mice, while most brains of mice transplanted with LSD1-197-211-GFPtransduced hBTICs showed no or very small tumor in�ltration (Figure 6e). By examining the genotype ofthe BTIC transplanted mouse brain via PCR, we con�rmed that 11 mice were GFP hBTIC positive and 13mice were LSD1-197-211-GFP hBTIC positive (Supplementary Figure 6c). The average brain tumorvolume of LSD1-197-211-GFP hBTIC transplanted mice was obviously smaller than control BTICtransplanted mice (Supplementary Figure 6d). In addition, mice transplanted with GFP transduced hBTICswere much weaker and skinner than mice transplanted with LSD1-197-211-GFP transduced hBTICs(Supplementary Figure 6e-6f). Out of 11 GFP transduced hBTIC transplanted mice, 3 mice died beforeweek seven after transplantation, while none of LSD1-197-211-GFP transduced hBTIC transplantedmouse died before week seven. Hence, LSD1-197-211 can suppress the tumor formed by hBTICs andimprove the survival rate of hBITC transplanted mice.
DiscussionHigh-grade glioma, including glioblastoma, is the most common primary malignant brain tumor. Thegeneral treatment for high-grade glioma includes surgery, radiotherapy and chemotherapy. However, it isvirtually impossible to completely resect these in�ltrative tumors and concurrent radiotherapy andchemotherapy do not provide any signi�cant survival bene�t for patients. Five-year survival ratio ofpatient is still less than 5%. Therefore, novel treatment strategies are desperately needed for this grimdisease.
Past clinic research shows that drugs that target epigenetic modi�ers yield promising survival bene�ts inmultiple diseases. For example, the use of valproic acid, an HDAC inhibitor, together with radiotherapy,has shown a greater e�cacy in GBM patients (Thotala et al., 2015, Weller et al., 2011). In recent years,LSD1 has been deemed as a very promising target, owing to its broad role in cancer, neurodegenerationand viral infection (Kashyap et al., 2013, Liang et al., 2013, Lynch et al., 2012, Schenk et al., 2012).However, no therapeutics targeting LSD1 have been developed at present. One of the reasons is thatLSD1 is broadly expressed in mammalian tissues, in particular stem cells. Inhibition of LSD1 by AOinhibitors or depletion of LSD1 might therefore cause a signi�cant disturbance of its normalphysiological function, leading to unwanted side effects. All reported LSD1 inhibitors that bind to the FAD

Page 10/29
or AO domains are far from ideal, either because of poor selectivity or their polycationic nature (Lee et al.,2006, Schmidt and McCafferty, 2007, Willmann et al., 2012). Potential short peptides that could competewith natural histone H3 substrates or bind at sites beyond the active site of the AO domain by anallosteric mechanism to prevent LSD1 from forming complexes or binding to the nucleosomes are beingactively explored (Baron and Vellore, 2012, Shi et al., 2005, Tortorici et al., 2013). Nevertheless, targetingthe general LSD1 repressive complex, CoREST/LSD1 or LSD1 binding to the histone tail would stilldisturb the general function of LSD1 in cells. To achieve more effective and speci�c treatment of high-grade glioma, targeting the LSD1 involved speci�c cell proliferation mechanism is more appropriate, withminimum side effects.
Yokoyama et. al. have shown that in retinoblastoma cells the DNA binding domain (DBD) of NR2E1interacts with the AO domain of LSD1, while the ligand-binding domain (LBD) of NR2E1 interacts withboth the SWIRM and AO domains of LSD1 (Yokoyama et al., 2008). However, the details of theseinteractions are not reported. Our study has identi�ed four possible NR2E1-interacting peptides of LSD1using HDX-MS in vitro. Peptide deletion assay revealed that LSD1-197-211 peptide is critical for theinteraction between NR2E1 and LSD1, since Flag-LSD1-∆197-211 can no longer interact with NR2E1. Toexamine whether LSD1-197-211 and other identi�ed peptides can synergistically interact with NR2E1, weinvestigated NR2E1 LBD/LSD1 docking complexes that showed more than 50 Å2 solvent accessible areaon NR2E1 by LSD1-197-211 and other identi�ed peptides. It turned out that only LSD1-197-211 and LSD1-354-377 may bind to NR2E1. However, in most docking complexes, the solvent accessible area of LSD1-354-377 is smaller than that of LSD1-197-211, indicating that LSD1-354-377 may contribute to a weakerinteraction between LSD1 and NR2E1 compared to LSD1-197-211 (Supp. Table 2). Indeed, compared toLSD1-354-377, which is located at the AO domain and shows only slight inhibition of the proliferation ofboth BTICs and 293T cells, LSD1-197-211 is located at the SWIRM domain and shows speci�c andpotent inhibition of BTIC proliferation (Figure 4d and Supplementary Figure 3b). Overexpression of LSD1-197-211 e�ciently blocks the function of NR2E1 and LSD1 complex and disrupts the LSD1demethylation activity at the Pten promoter and leads to its upregulation, and therefore, inhibits theproliferation of BTICs (Figure 4).
However, since the NR2E1 and LSD1 mechanism is also employed by NSCs for self-renewal, weanticipate that LSD1-197-211 may also inhibit NSC proliferation. If this is the case, neurogenesisdisturbance that might result from the use of this peptide for brain glioma treatment would be a concern.It is known that neurogenesis is most active in the fetus and reduces with aging. Elderly people, in whomneurogenesis is very low, have the highest probability of developing high-grade brain glioma. LSD1-197-211 may therefore hold great therapeutic potential for patients of this age group. Besides, research hasrevealed that the regulatory factors of the self-renewal of NSCs in vitro do not always affect neurogenesisin vivo. For example, mice with mutated inhibitors of DNA binding 1 (Id1), a factor that is required for theself-renewal of NSCs in vitro, show normal neurogenesis and NSC population in vivo (Zhu et al., 2014).
Over all, our study revealed that Lsd1-197-211 may serve as a leading peptide for peptide drugdevelopment for glioblastoma. However, further investigation on the peptide delivery, safety and
Page 11/29
optimization will be needed to bring the discovery closer to application.
MethodsCell culture
Brain tumor initiating cells (BTICs) derived from Nestin-TV-a mice were received as a gift from Dr. HaikunLiu’s lab (Zhu et al., 2014). To culture BTICs in monolayer, the cell culture plate was coated with lamininand poly-L-lysine. Cells were grown in DMEM/F12 medium plus 20 ng/ml epidermal growth factor (EGF),10 ng/ml �broblast growth factor (FGF-2), B27 and insulin-transferrin-selenium supplements (ITSS). Cellswere digested with accutase for passage. To culture brain tumor initiating cells in sphere, cells wereseeded in a low attached cell culture plate (Corning) in the above medium without any coating.
Cloning
shRNA constructs were generated as previously described (Li et al., 2015). The sequences are as follows:Nr2e1 shRNA1 GGCTGTATCTGGCATGAAT shRNA2 CGTGGACACAAGGAAGACAAT Lsd1 shRNA1CACAAGGAAAGCTAGAAGA, shRNA2 CCACAAGTCAAACCTTTATTT Pten shRNACGACTTAGACTTGACCTATAT and control shRNA GATGAAATGGGTAAGTACA. The shRNAs were clonedinto the pSuper-puro plasmid (Addgene) between the BglII and HindIII restriction sites. For transient geneoverexpressing clones, NR2E1, LSD1 and LSD1 peptide cDNAs were cloned into the pCAG-puro plasmids.LSD1 peptide deletion clones were generated in the pCAG-puro vector by two-step PCR. For lentivirusvector construction, LD1-197-211 peptide cDNA was cloned into pLenti-TRE-EGFP-EF1-rtTA3-IRES-Puroplasmid at EcoRI restriction sites. The clone was sequenced and con�rmed by forward primerACGGTGGGAGGCCTATATAAGC and reverse primer CGTCGCCGTCCAGCTCGACCAG.
Reverse transcription and real-time PCR
Reverse transcription was performed with 2 µg of total RNA using the PrimeScript RT reagent kit (Takara).Real-time PCR analysis was performed by using the ABI Prism 7900HT machine (Applied Biosystems)with the SYBR Green mixture (Takara). For each primer, only one correct size band was formed. Allexperiments were repeated at least three times independently. The �nal results were normalized againstthe expression of β-ACTIN or GAPDH.
Cell growth assay
106 BTICs were transfected with 2 ug plasmids of interests by electroporation with Amaxa cell lineNucleofector Kit V using nucleofector II. The transfected cells were seeded on a poly-L-lysine and laminintreated 6-well plate. After 24 hours, the transfected cells were selected with 1ug/ml puromycin. After 3days, the �oating dead cells were washed away and the viability of cells was quantitated using MTTassay or CCK-8 assay kit by following manufacturer’s protocol.
Chromatin immunoprecipitation

Page 12/29
ChIP assay was carried out as described previously with slight modi�cation (Li et al., 2013b). Brie�y, cellswere �xed with 1% (w/v) formaldehyde for 10 minutes at room temperature, and 125 mM glycine wasused to inactivate formaldehyde. Chromatins were sonicated to generate average fragment sizes from200 to 600 bp and immunoprecipitated using the anti-NR2E1 (a gift from Liu’s lab), anti-Lsd1 (ab17721),anti-H3K4me1 (ab8895), anti-H3K4me2 (ab7766) antibodies and control IgG or control GFP. The ChIPenriched DNA and input were then decrosslinked and proteins were digested by proteinase K. DNAs werepuri�ed by phenol:chloroform extractions and followed by ChIP-qPCR analysis using the ABI PRISM 7900sequence detection system and Kappa SYBR green master mix (Takara). The values of each real-timePCR assay were normalized with its own input value and then compared with the IgG or GFP value to getthe enrichment fold. PCR primers were designed to amplify the promoter regions of mouse Pten andcontrol according to previous research(Sun et al., 2010). Each experiment was performed three timesindependently.
Western blot
Western blot was performed by following standard protocols (Li et al., 2013a). Total protein was collectedby lysing cells with RIPA buffer containing 0.2 M NaCl, 1% SDS, 1 mM PMSF and 0.1 M DTT. Proteinswere then separated by SDS-PAGE and transferred to PVDF membrane (Pall). The membrane wasblocked with TBS+0.1% Tween with 5% nonfat milk (BD) and then blotted with proper primary antibody inTBS+0.1% Tween at cold room overnight. The primary antibodies and dilutions were: rabbit anti-LSD1 (ab17721, Abcam) at 1/1000, rabbit anti-NR2E1 (a gift from Haikun Liu’s lab) at 1/500, rabbit anti-PTEN ( ab-31392, Abcam) at 1/1000, mouse anti-p21 (CS2948 CST) at 1/1000, mouse anti-ACTIN (sc-47778, Santa Cruz) at 1/1000, mouse anti-GAPDH (sc-137179, Santa Cruz) at 1/1000. Suitablesecondary antibodies, such as anti-rabbit or anti-mouse antibodies conjugated with HRP, were used forECL detection (Amershan).
Immuno�uorescence staining
The cells were �xed were 4% paraformaldehyde (PFA) for 30 minutes at 4 degree, and then washed incold PBS for 5 minutes 3 times. The nuclei were subsequently permeabilized with PBS with 0.5% Triton X-100 for 30 minutes. Next the cells were blocked with 1% BSA in PBS for 1 hour. The cells were incubatedwith primary antibody overnight at 4°C. Primary antibodies used were rabbit anti-cleaved caspase 3antibody (9664S, CST) and rabbit anti-Ki67 (ab15580, Abcam). After wash, the cells were incubated withanti-rabbit secondary antibody conjugated with proper Alexa Fluor label for 1 hour at room temperature indarkness. The nuclei were counterstained with DAPI. The cells were imaged with Olympus IX-73immuno�uorescence microscope.
Co-immunoprecipitation
Immunoprecipitation assays were performed with whole-cell lysates from BTICs or targeted cellstransfected with overexpression plasmids. Anti-NR2E1 (ab30942), anti-LSD1(ab17721), anti-FLAG(SIGMA #F 1804) and anti-HA (ab18181) antibodies were used to pull down protein complexes.

Page 13/29
Immunoprecipitated complexes, bound to the corresponding antibody, were washed extensively with 0.1%Triton X-100 buffer (50 mM Tris-HCl at pH 8, 150 mM NaCl, 1 mM EDTA, 0.1% Triton X-100, 10% glycerolplus Roche protease inhibitor cocktail). The interacting protein bands were resolved with 10% SDS-PAGEgel and transferred to the PVDF membrane, followed by detection with an appropriate primary antibody,an HRP-conjugated second antibody, and an ECL detection reagent.
Animals
The animal experiments were performed under the approval from Animal Experimentation EthicsCommittee (AEEC) in the Sixth A�liated Hospital of Sun Yat-sen University. 1X10⁵ GFP or LSD1-197-211-GFP transduced human BTICs were intracranially transplanted into the frontal lobe of 6 to 8-week-oldfemale nude mice. The cells were suspended in 5 ul PBS and injected into the right frontal lobe at 2 mmlateral and 1 mm anterior to bregma with 2.5 mm depth from the skull base. The mice were fed withwater containing fresh 2mg/ml Doxycycline (DOX) daily on day after transplantation. The brain tumorgrowth was monitored by IVIS Spectrum imaging (PerkinElmer) after transplantation. The mouse brainswere harvested for hematoxylin-eosin staining.
Amide Hydrogen/Deuterium Exchange and Mass Spectrometry (HDX-MS)
Human NR2E1 (GenScript) was cloned into pET22b to express protein with C-terminal His tag. Theprotein was puri�ed with Ni-NTA beads and followed by gel �ltration. Human LSD1 (ATCC) was clonedinto pGEX6 to express protein with N-terminal GST tag. The protein was puri�ed with glutathione agaroseand the GST tag was removed by precission protease digestion at 4 degree overnight. The eluted proteinwas further puri�ed by gel �ltration. To study the peptide of Lsd1 involved in the interaction with NR2E1,50 μM of full length human LSD1 protein was incubated with 75 μM of human NR2E1 (residues 183-354)in buffer A (25 mM potassium phosphate and 5% glycerol at pH 7.5) for 12 hrs prior to the HDXexperiments. 2 μL of LSD1 alone or in complex with NR2E1 was mixed with 18 μL of deuterated buffer Aresulting in a �nal concentration of 90% D2O. Exchange reactions were carried out at 20 ˚C for �vedifferent time points (0.5 to 10 min) and quenched by adding 40 μL of ice cold 0.1% tri�uoro acetic acidto get a �nal pH of 2.5. 50 μL aliquot of the quenched samples containing 0.83 μM of Lsd1 was injectedonto a chilled nano-Ultra Performance Liquid Chromatography sample manager (test version, Waters),specially designed for HDX experiments. Online digestion was carried out using an immobilized pepsincolumn (Porozyme, ABI) in water containing 0.05% FA at a �ow rate of 100 μL/min. The digested samplewas desalted in a 2.1 x 5 mm C18 peptide microtrap (ACQUITY BEH C18 VanGuard Pre-column, 1.7 μm,Waters) and eluted using a linear gradient of acetonitrile (8-40%) in 0.1% FA, onto a reverse phaseanalytical column (ACQUITY UPLC BEH C18 Column, 1.0 × 100 mm, 1.7 μm, Waters) at 40 µL/min. Massspectra were acquired over the m/z range 200−1700 and continuous instrument calibration was carriedout using Glu-Fibrinogen peptide (GFP) at 100 fmol/μl. Peptides were identi�ed from MSE data of anundeuterated Lsd1 sample using ProteinLynx Global Server (PLGS 2.4) (test version, Waters) and mappedon to subsequent deuteration experiments using prototype custom software (DynamX, Waters). Theaverage number of deuterons exchanged for each of the pepsin digest fragments was obtained as

Page 14/29
described before(Mandell et al., 1998). Exchange values were not corrected for the deuterium back-exchange, that occurs during sample analysis and so all the results reported in this study are only fromthe relative deuterium level. The difference in deuterium uptake (subtracting the absolute deuterium levelin LSD1 from the NR2E1:LSD1 samples) for 56 pepsin digest fragments at all the time points was plottedusing Origin software (Origin Pro v.8.6, OriginLab). The percent difference in deuterium uptake for all ofthe pepsin digest fragments between LSD1 and NR2E1:LSD1 following 1 min HDX were shown below(Eqn. 1) and mapped onto the crystal structure of LSD1 (PDB ID: 2Z3Y) using PyMOL (PyMOL MolecularGraphics System, Version 1.3, Schrodinger, LLC).
Crystal structure determination
The SWIRM domain of human LSD1 residue 172 to 280, was subcloned into the pET15b vector betweenthe EcoRI and BamH1 restriction sites, and the resulting plasmid was transformed into E. coli strain BL21.Cells were grown at 37 °C in LB medium to an optical density of 0.6 at 600 nm and induced with 0.5 mMIPTG. The collected cells were lysed by French press in a buffer containing 50 mM Tris, pH 7.0, 150 mMNaCl, 1 mM EDTA and 1 mM dithiothreitol (DTT). After removing cell debris by centrifugation at 10,000xgfor 30 minutes, the supernatant was mixed with Ni-NTA resin, and then poured into a column. Afterextensive wash, the SWIRM domain protein was released from the resin by 300 mM imidazole.Selenomethionine (SeMet) protein was expressed following the standard method (Yuan et al., 2003).Native crystals were grown at 20 °C by the hanging drop vapor diffusion method: 2 μl of protein at aconcentration of 10 mg ml–1 was mixed with equal amount of reservoir buffer consisting of 0.1 MMgCl2, 0.1 M Tris pH 8.5, 25% (w/v) PEG 3350. SeMet derivative crystals were grown in reservoir buffercontaining 0.8M K/Na tartrate, 0.1 M MES pH 6, 2.5% (v/v) glycerol. Native SWIRM protein crystallizes inthe space groups P212121 and P21212 whereas SeMet SWIRM protein crystallized in space group I222.Diffraction data of native crystals and SeMet crystals were collected at beamline A1 and beamline F2respectively in Cornell High Energy Synchrotron Source. All data were processed withDENZO/SCALEPACK. The structure was determined by multiwavelength anomalous dispersion (MAD)methods using SHELX and SHARP and re�ned using CNS (Brunger et al., 1998). Native crystal structureswere solved by molecular replacement with PHASER using the MAD structure as an initial model. Thereare two molecules in asymmetric unit. Pymol was used to calculate the cavity and binding pocket anddraw the structure. The human LSD1 SWIRM domain coordinates have been deposited in the ProteinData Bank (Accession code 5IT3).
Prediction of the interaction between Lsd1 and NR2E1 LBD
ZDOCK V3.0.2 (http://zdock.umassmed.edu/) was used to predict the interaction between LSD1 (PDBcode: 3ZMU) and NR2E1 LBD (PDB code: 4XAI) by rigid body docking (Chen et al., 2003). ZDOCK
Page 15/29
explicitly searches rotational space and uses a Fast Fourier Transformation (FFT) algorithm to speed upsearching in translational spaces. Residues 256-333, 410-435, 575-626, 717-742 and 792-819 of LSD1,assumed to be not participating in the interaction between LSD1 and NR2E1 LBD were set as blockresidues. ZDOCK generated docking complexes were then clustered by the MMTSB clustering method(http://www.mmtsb.org) at 8 Å RMSD cutoff (Feig et al., 2004). LSD1 peptide accessible areas on NR2E1were calculated as buried solvent-accessible area with a 1.4 Å probe radius using the Naccess software(Hubbard and Thornton, 1993).
DeclarationsSupplementary material
Supplementary information of two tables and six �gures is included as part of this submission.
Ethics approval
The animal experiments were performed under the approval from Animal Experimentation EthicsCommittee (AEEC) in the Sixth A�liated Hospital of Sun Yat-sen University.
Con�ict of interest statement
The authors declare that no con�icts of interest exist.
Funding
This work was supported by funds from National Natural Science Foundation of China (NSFC) (Grant No.81773156 to PY and Grant No. 8187232 to YM) and the support of the Ministry of Education ofSingapore Academic Research Fund to the Singapore researchers to KS.
Author contributions
Conceptualization: PY, KS and YM, Methodology: RH, UH, PDJ and JP, formal analysis RH UH PDJ andFC, investigation:RH, UH, XS, BSM, WZ, LZ, XM and PKG, resources: YM, writing of the original draft: PY,review and editing of the manuscript: RH, KS and PY supervision JP KS and PY funding acquisition YM,KS and PY.
Acknowledgements
We thank Haikun Liu from German Cancer Research Center for providing the brain tumor initiating cellsand anti-Tlx antibody and Yanhong Shi from City of Hope for scienti�c discussion. We thank Yigong Shifrom Xihu University for his support on SWIRM structure determination.
Data availability statement

Page 16/29
The raw data that supports the �ndings of this study are available from the corresponding author uponreasonable request.
References1. Baron, R., and Vellore, N.A. (2012). LSD1/CoREST is an allosteric nanoscale clamp regulated by H3-
histone-tail molecular recognition. Proc Natl Acad Sci U S A 109, 12509-12514.
2. Brunger, A.T., Adams, P.D., Clore, G.M., DeLano, W.L., Gros, P., Grosse-Kunstleve, R.W., Jiang, J.S.,Kuszewski, J., Nilges, M., Pannu, N.S., et al. (1998). Crystallography & NMR system: A new softwaresuite for macromolecular structure determination. Acta Crystallogr D Biol Crystallogr 54, 905-921.
3. Chen, J., Li, Y., Yu, T.S., McKay, R.M., Burns, D.K., Kernie, S.G., and Parada, L.F. (2012). A restricted cellpopulation propagates glioblastoma growth after chemotherapy. Nature 488, 522-526.
4. Chen, R., Li, L., and Weng, Z. (2003). ZDOCK: an initial-stage protein-docking algorithm. Proteins 52,80-87.
5. Chen, Y., Yang, Y., Wang, F., Wan, K., Yamane, K., Zhang, Y., and Lei, M. (2006). Crystal structure ofhuman histone lysine-speci�c demethylase 1 (LSD1). Proc Natl Acad Sci U S A 103, 13956-13961.
�. Da, G., Lenkart, J., Zhao, K., Shiekhattar, R., Cairns, B.R., and Marmorstein, R. (2006). Structure andfunction of the SWIRM domain, a conserved protein module found in chromatin regulatorycomplexes. Proc Natl Acad Sci U S A 103, 2057-2062.
7. Feig, M., Karanicolas, J., and Brooks, C.L., 3rd (2004). MMTSB Tool Set: enhanced sampling andmultiscale modeling methods for applications in structural biology. J Mol Graph Model 22, 377-395.
�. Houshyari, M., Hajalikhani, F., Rakhsha, A., and Hajian, P. (2015). A Comparative Study of SurvivalRate in High Grade Glioma Tumors Being Treated by Radiotherapy Alone Versus ChemoradiationWith Nitrosourea. Glob J Health Sci 7, 43702.
9. Hubbard, S.J., and Thornton, J.M. (1993). NACCESS, Computer Program. . Department ofBiochemistry Molecular Biology, University College London.
10. Kashyap, V., Ahmad, S., Nilsson, E.M., Helczynski, L., Kenna, S., Persson, J.L., Gudas, L.J., andMongan, N.P. (2013). The lysine speci�c demethylase-1 (LSD1/KDM1A) regulates VEGF-A expressionin prostate cancer. Mol Oncol 7, 555-566.
11. Lee, M.G., Wynder, C., Schmidt, D.M., McCafferty, D.G., and Shiekhattar, R. (2006). Histone H3 lysine 4demethylation is a target of nonselective antidepressive medications. Chem Biol 13, 563-567.
12. Li, P., Chen, Y., Mak, K.K., Wong, C.K., Wang, C.C., and Yuan, P. (2013a). Functional role of mst1/mst2in embryonic stem cell differentiation. PLoS One 8, e79867.
13. Li, P., Chen, Y., Meng, X., Kwok, K.Y., Huang, X., Choy, K.W., Wang, C.C., Lan, H., and Yuan, P. (2013b).Suppression of malignancy by Smad3 in mouse embryonic stem cell formed teratoma. Stem CellRev 9, 709-720.
14. Li, P., Ma, X., Adams, I.R., and Yuan, P. (2015). A tight control of Rif1 by Oct4 and Smad3 is critical formouse embryonic stem cell stability. Cell Death Dis 6, e1588.

Page 17/29
15. Liang, Y., Quenelle, D., Vogel, J.L., Mascaro, C., Ortega, A., and Kristie, T.M. (2013). A novel selectiveLSD1/KDM1A inhibitor epigenetically blocks herpes simplex virus lytic replication and reactivationfrom latency. MBio 4, e00558-00512.
1�. Lin, S., Shen, H., Li, J.L., Tang, S., Gu, Y., Chen, Z., Hu, C., Rice, J.C., Lu, J., and Wu, L. (2013).Proteomic and functional analyses reveal the role of chromatin reader SFMBT1 in regulatingepigenetic silencing and the myogenic gene program. The Journal of biological chemistry 288, 6238-6247.
17. Lynch, J.T., Harris, W.J., and Somervaille, T.C. (2012). LSD1 inhibition: a therapeutic strategy incancer? Expert Opin Ther Targets 16, 1239-1249.
1�. Mandell, J.G., Falick, A.M., and Komives, E.A. (1998). Measurement of amide hydrogen exchange byMALDI-TOF mass spectrometry. Anal Chem 70, 3987-3995.
19. Metzger, E., Wissmann, M., Yin, N., Muller, J.M., Schneider, R., Peters, A.H., Gunther, T., Buettner, R., andSchule, R. (2005). LSD1 demethylates repressive histone marks to promote androgen-receptor-dependent transcription. Nature 437, 436-439.
20. Mrugala, M.M. (2013). Advances and challenges in the treatment of glioblastoma: a clinician'sperspective. Discov Med 15, 221-230.
21. Schenk, T., Chen, W.C., Gollner, S., Howell, L., Jin, L., Hebestreit, K., Klein, H.U., Popescu, A.C., Burnett,A., Mills, K., et al. (2012). Inhibition of the LSD1 (KDM1A) demethylase reactivates the all-trans-retinoic acid differentiation pathway in acute myeloid leukemia. Nat Med 18, 605-611.
22. Schmidt, D.M., and McCafferty, D.G. (2007). trans-2-Phenylcyclopropylamine is a mechanism-basedinactivator of the histone demethylase LSD1. Biochemistry 46, 4408-4416.
23. Shi, Y., Chichung Lie, D., Taupin, P., Nakashima, K., Ray, J., Yu, R.T., Gage, F.H., and Evans, R.M.(2004a). Expression and function of orphan nuclear receptor TLX in adult neural stem cells. Nature427, 78-83.
24. Shi, Y., Lan, F., Matson, C., Mulligan, P., Whetstine, J.R., Cole, P.A., and Casero, R.A. (2004b). Histonedemethylation mediated by the nuclear amine oxidase homolog LSD1. Cell 119, 941-953.
25. Shi, Y.J., Matson, C., Lan, F., Iwase, S., Baba, T., and Shi, Y. (2005). Regulation of LSD1 histonedemethylase activity by its associated factors. Mol Cell 19, 857-864.
2�. Singh, M.M., Manton, C.A., Bhat, K.P., Tsai, W.W., Aldape, K., Barton, M.C., and Chandra, J. (2011).Inhibition of LSD1 sensitizes glioblastoma cells to histone deacetylase inhibitors. Neuro Oncol 13,894-903.
27. Singh, S.K., Clarke, I.D., Terasaki, M., Bonn, V.E., Hawkins, C., Squire, J., and Dirks, P.B. (2003).Identi�cation of a cancer stem cell in human brain tumors. Cancer Res 63, 5821-5828.
2�. Singh, S.K., Hawkins, C., Clarke, I.D., Squire, J.A., Bayani, J., Hide, T., Henkelman, R.M., Cusimano,M.D., and Dirks, P.B. (2004). Identi�cation of human brain tumour initiating cells. Nature 432, 396-401.
29. Sun, G., Alzayady, K., Stewart, R., Ye, P., Yang, S., Li, W., and Shi, Y. (2010). Histone demethylase LSD1regulates neural stem cell proliferation. Mol Cell Biol 30, 1997-2005.

Page 18/29
30. Thotala, D., Karvas, R.M., Engelbach, J.A., Garbow, J.R., Hallahan, A.N., DeWees, T.A., Laszlo, A., andHallahan, D.E. (2015). Valproic acid enhances the e�cacy of radiation therapy by protecting normalhippocampal neurons and sensitizing malignant glioblastoma cells. Oncotarget.
31. Tortorici, M., Borrello, M.T., Tardugno, M., Chiarelli, L.R., Pilotto, S., Ciossani, G., Vellore, N.A., Bailey,S.G., Cowan, J., O'Connell, M., et al. (2013). Protein recognition by short peptide reversible inhibitorsof the chromatin-modifying LSD1/CoREST lysine demethylase. ACS Chem Biol 8, 1677-1682.
32. Weller, M., Gorlia, T., Cairncross, J.G., van den Bent, M.J., Mason, W., Belanger, K., Brandes, A.A.,Bogdahn, U., Macdonald, D.R., Forsyth, P., et al. (2011). Prolonged survival with valproic acid use inthe EORTC/NCIC temozolomide trial for glioblastoma. Neurology 77, 1156-1164.
33. Willmann, D., Lim, S., Wetzel, S., Metzger, E., Jandausch, A., Wilk, W., Jung, M., Forne, I., Imhof, A.,Janzer, A., et al. (2012). Impairment of prostate cancer cell growth by a selective and reversiblelysine-speci�c demethylase 1 inhibitor. Int J Cancer 131, 2704-2709.
34. Yokoyama, A., Takezawa, S., Schule, R., Kitagawa, H., and Kato, S. (2008). Transrepressive functionof TLX requires the histone demethylase LSD1. Mol Cell Biol 28, 3995-4003.
35. Yuan, P., Jedd, G., Kumaran, D., Swaminathan, S., Shio, H., Hewitt, D., Chua, N.H., and Swaminathan,K. (2003). A HEX-1 crystal lattice required for Woronin body function in Neurospora crassa. NatStruct Biol 10, 264-270.
3�. Zhi, X., Zhou, X.E., He, Y., Searose-Xu, K., Zhang, C.L., Tsai, C.C., Melcher, K., and Xu, H.E. (2015).Structural basis for corepressor assembly by the orphan nuclear receptor TLX. Genes Dev 29, 440-450.
37. Zhu, Z., Khan, M.A., Weiler, M., Blaes, J., Jestaedt, L., Geibert, M., Zou, P., Gronych, J., Bernhardt, O.,Korshunov, A., et al. (2014). Targeting self-renewal in high-grade brain tumors leads to loss of braintumor stem cells and prolonged survival. Cell Stem Cell 15, 185-198.
Figures

Page 19/29
Figure 1
NR2E1 and LSD1 are required for the proliferation of BTICs. a. Morphology of neural stem cells (NSCs)and two lines of brain tumor initiating cells (BTIC-1 and BTIC-2) cultured in monolayer (top panel) andsuspension (bottom panel). The scale bar is 50 µm. b. Real-time PCR analysis of mRNA level of Nr2e1and Lsd1 in NSCs and BTICs. The expression data was normalized with actin. Data are represented asmean ±S.D. (n = 3). Statistically signi�cant differences, calculated through student’s t-test, are indicated

Page 20/29
(*P< 0.05; **P < 0.005). c. Western blot of the protein level of NR2E1 and LSD1 in NSCs and BTICs.GAPDH was used as an internal loading control. d. Cell morphology of BTICs after knockdown by controlshRNA, Nr2e1 shRNA1 and Lsd1 shRNA1. The scale bar is 50 µm. e. Real-time PCR analysis of mRNAlevel of Nr2e1 and Lsd1 in BTICs after knockdown by control shRNA, Nr2e1 shRNA1 and Lsd1 shRNA1.Data are represented as mean ±S.D. (n = 3). Statistically signi�cant differences, calculated throughstudent’s t-test, are indicated (*P< 0.05; **P < 0.005; *** P < 0.001). f. MTT assay of the cell viability ofBTICs after knockdown with control shRNA, Nr2e1 shRNA1 or Lsd1 shRNA1. Data are represented asmean ±S.D. (n = 3). Statistically signi�cant differences, calculated through student’s t-test, are indicated(*P< 0.05; **P < 0.005; *** P < 0.001).

Page 21/29
Figure 2
NR2E1 and LSD1 form a complex in BTICs and regulate PTEN expression. a. Co-immunoprecipitation(Co-IP) assay with antibodies against NR2E1 and LSD1 to test their interaction in BTICs. Equal amount oftotal cell lysate was immunoprecipitated with control IgG and an antibody against NR2E1. The pulleddown proteins were then blotted with an anti-LSD1 antibody. GAPDH in the lysate was shown as a controlfor the input material for each Co-IP assay. IgG light chain was shown as a loading control of Co-IP pull-

Page 22/29
down material. b. Real-time PCR analysis of mRNA level of Pten in BTIC after control shRNA, Nr2e1shRNA1 or Lsd1 shRNA1 knockdown. Data are represented as mean ±S.D. (n = 3). Statistically signi�cantdifferences, calculated through student’s t-test, are indicated (*P< 0.05; **P < 0.005). c. Western blotanalysis of the protein level of NR2E1, LSD1 and PTEN in BTICs after control shRNA, Nr2e1 shRNA orLsd1 shRNA knockdown. Actin was used as an internal control. d. Real-time PCR analysis of mRNA levelof Pten in BTICs after control shRNA or Pten shRNA knockdown. Data are represented as mean ±S.D. (n =3). Statistically signi�cant differences, calculated through student’s t-test, are indicated (*P< 0.05). e. Cellmorphology of BTICs after control shRNA, Nr2e1 shRNA1, Lsd1 shRNA1 and Pten shRNA knockdown asindicated combination. Scale bar represents 100 µm. f. Cell survival analysis of BTICs after controlshRNA, Nr2e1 shRNA1, Lsd1 shRNA1 and Pten shRNA knockdown as indicated combination using cellcounting kit-8. Data are represented as mean ±S.D. (n = 3). Statistically signi�cant differences, calculatedthrough student’s t-test, are indicated (*P< 0.05; **P < 0.005). g. Scheme depicting the region whereprimers were designed for ampli�cation of ChIP DNA and relative enrichment of control GFP, LSD1 andNR2E1 at Pten promoter revealed by Chromatin immunoprecipitation (ChIP) and real-time PCR assay.Data are represented as mean ±S.D. (n = 3). Statistically signi�cant differences, calculated throughstudent’s t-test, are indicated (*P< 0.05; **P < 0.005). h. ChIP and real-time PCR analysis of H3K4me1 andH3K4me2 enrichment at Pten promoter in BTICs after knockdown by control shRNA, Nr2e1 shRNA orLsd1 shRNA. Data are represented as mean ±S.D. (n = 3). Statistically signi�cant differences, calculatedthrough student’s t-test, are indicated (*P< 0.05; **P < 0.005).

Page 23/29
Figure 3
Effect of NR2E1 on LSD1 as shown by HDX-MS. a. The difference in absolute deuterium uptake betweenLSD1 and NR2E1:LSD1. b. Enhanced mass spectra for four pepsin digest fragments of LSD1, 197-211,354-377, 481-501 and 537-546 which show signi�cant differences in exchange upon NR2E1 binding:undeuterated peptide (top), isotopic envelope for the same peptide from LSD1 alone following 1 mindeuteration (middle) and isotopic envelope for the same peptide from LSD1 in complex with NR2E1
Page 24/29
following 1 min deuteration (bottom). c. Heat map showing the percent decrease in deuterium uptake forNR2E1:LSD1 relative to LSD1 following 1 min of HDX, mapped on the crystal of LSD1 (PDB ID: 2Z3Y). d.The histogram plot of the distribution of the surface area of NR2E1 buried by LSD1 peptides 197-211,354-377, 481-501 and 537-546. (Buried surface area less than 100Å2 is neglected).
Figure 4

Page 25/29
The role of LSD1 peptides on NR2E1 and LSD1 interaction. a. The interaction between NR2E1 and Lsd1was disrupted by the deletion of residues 197-211 in LSD1. Total protein lysate of HA-NR2E1 and Flag-LSD1 or Flag-LSD1 mutant transfected 293T cells were immunoprecipitated with anti-HA antibody,followed by immunoblotting with anti-Flag antibody. Protein expression in the cell was shown byimmunoblotting with anti-Flag or anti-HA antibody. b. Overexpression of Flag-LSD1 peptide 197-211 ledto the upregulation of pTEN in BTICs. Lysates of Flag-GFP and Flag-LSD1 peptide overexpressed BTICswere immunoblot by anti-Flag and anti- PTEN antibodies. Actin was loaded as an internal loading control.c. Overexpression of LSD1 peptide 197-211 led to a reduction of Ki-67 positive cells. Anti-Ki-67 antibodystaining was shown in red and DAPI staining was shown in blue. The scale bar is 25 µm. d. MTT assay ofthe viable BTICs after transient overexpression of control or LSD1 peptides. Data are represented asmean ±S.D. (n = 4). Statistically signi�cant differences, calculated through student’s t-test, are indicated(**P < 0.005; ***P < 0.001). e. Representative picture of soft agar assay of BTICs after overexpression ofcontrol peptide or LSD1-197-211 peptide. f. Representative picture of transwell assay to show themigration capacity of GFP overexpressed BTICs and LSD1-197-211 overexpressed BTICs. Scale barrepresents 100 μm. g. Representative morphology of suspension culture of BTICs after overexpression ofcontrol peptide or LSD1-197-211 peptide. Scale bar represents 50 μm. h. Diagram of tumor spherenumber of BTICs after overexpression of control peptide or LSD1-197-211 peptide in random 5microscopic view. Data are represented as mean ±S.D. (n = 3). Statistically signi�cant differences,calculated through student’s t-test, are indicated (**P < 0.005; ***P < 0.001). i. Relative enrichment ofH3K4me1 and H3K4me2 on Pten promoter after overexpression of GFP or LSD1-197-211 peptide inBTICs. Data are represented as mean ±S.D. (n = 3). Statistically signi�cant differences, calculatedthrough student’s t-test, are indicated (*P< 0.05; **P < 0.005).
Page 26/29
Figure 5
Speci�city of LSD1-197-211. a. Western blot to check the protein level of NR2E1 and LSD1 in 293T andBTIC-1. Actin was loaded as an internal control. b. Real-time PCR quanti�cation of the mRNA levels ofPten and Nr2e1 in control shRNA and Nr2e1 shRNA knockdown 293T cells. The data were normalizedwith Actin. Data are represented as mean ±S.D. (n = 3). Statistically signi�cant differences, calculatedthrough student’s t-test, are indicated (*P< 0.05; **P < 0.005). c. Western blot to compare the expression
Page 27/29
level of PTEN in different LSD1 peptide overexpression BTICs and control GFP overexpression BTICs.GAPDH was loaded as an internal control. d. MTT assay of the cell viability of 293T cells afteroverexpression with control or LSD1 peptides. Data are represented as mean ±S.D. (n = 3). Statisticallysigni�cant differences, calculated through student’s t-test, are indicated (*P< 0.05). e. Overall structures ofLSD1 SWIRM, ADA2 SWIRM (PDB Id: 2AQE) and SWI3 SWIRM (PDB ID: 2FQ3). All SWIRM domainscontain a central long helix, �anked by small helices. LSD1-197-211 and the corresponding region in theADA2 and SWI3 SWIRM domains are circled. Cavity/binding pocket is represented as mesh map. TheFigures are drawn with Pymol.
Page 28/29
Figure 6
Stable expression of LSD1-197-211 inhibits the proliferation of human BTICs. a. Representative picturesof suspension culture of human BTIC line 1 (hBTIC-1) transduced by lentivirus that express GFP or LSD1-197-211-GFP after induction by doxycycline for three days and six days. Light microscopy (Left),�uorescence microscopy to detect GFP (Right). Scale bar represents 50 μm. b. Diagram of tumor spherenumber of hBTIC-1 transduced by lentivirus that express GFP or LSD1-197-211-GFP after induction by

Page 29/29
doxycycline for six days. Data are represented as mean ±S.D. (n = 3). Statistically signi�cant differences,calculated through student’s t-test, are indicated (*P< 0.05; **P < 0.005). c. Representative IVIS images ofbrain tumors in nude mice transplanted with GFP or LSD1-197-211-EGFP lentivirus transduced humanBTICs after �ve weeks of doxycycline induction d. Brains of nude mice transplanted with GFP or LSD1-197-211-GFP lentivirus transduced human BTICs after seven weeks of doxycycline induction. e.Representative hematoxylin-eosin staining pictures of brains of nude mice transplanted with GFP orLSD1-197-211-GFP lentivirus transduced human BTICs after seven weeks of doxycycline induction. f. Amodel to depict the functional mechanism of NR2E1, LSD1 and LSD1-197-211 in BTICs.
Supplementary Files
This is a list of supplementary �les associated with this preprint. Click to download.
Supplementarydocument.pdf