ies webinar: energy outlook, q1 update: why 2016 is exciting for energy buyers
TRANSCRIPT
Energy Outlook: Why 2016 is Exciting for Energy Buyers
Q1 2016 Energy Market Outlook February 18, 2016
Presenters: Jonathan Lee, Senior Energy Market Intelligence Manager andIan Bowman, Director, Product Management, both with Ecova
TODAY’S TOPICS
DISTRIBUTED ENERGY RESOURCES• Opportunities and challenges as we move through 2016• Identify states that provide the best DER benefit
ENERGY MARKET UPDATE: Q1 2016• Natural Gas Production, Storage: Near-record pace• Winter Recap: One of the warmest on record for the eastern U.S.
Capitalize on low energy resources• Wholesale natural gas and electricity prices are expected to slowly rise during 2016. Upside
supply price risk is more likely than further downside moves
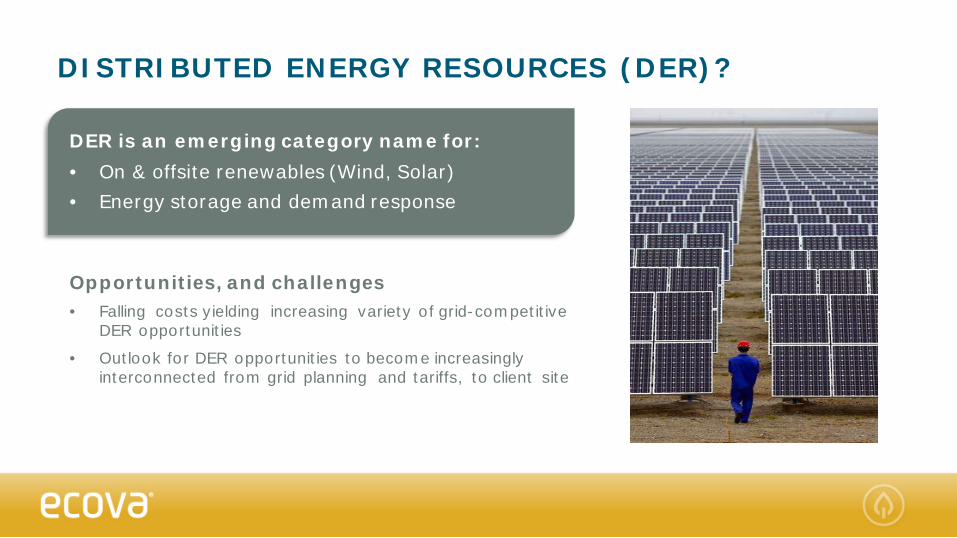
DISTRIBUTED ENERGY RESOURCES (DER)?
Opportunities, and challenges• Falling costs yielding increasing variety of grid-competitive
DER opportunities
• Outlook for DER opportunities to become increasingly interconnected from grid planning and tariffs, to client site
DER is an emerging category name for:• On & offsite renewables (Wind, Solar)• Energy storage and demand response
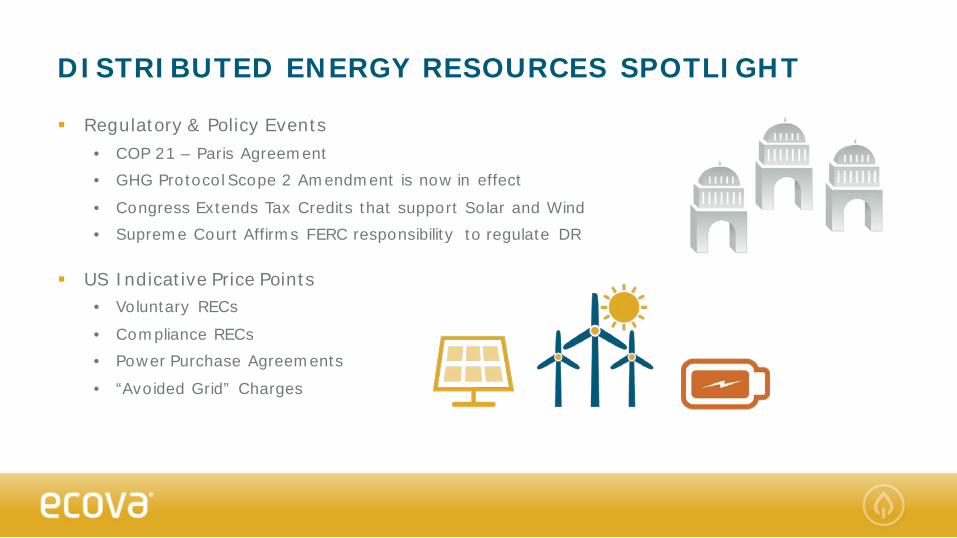
DISTRIBUTED ENERGY RESOURCES SPOTLIGHT
Regulatory & Policy Events• COP 21 – Paris Agreement• GHG Protocol Scope 2 Amendment is now in effect
• Congress Extends Tax Credits that support Solar and Wind• Supreme Court Affirms FERC responsibility to regulate DR
US Indicative Price Points• Voluntary RECs
• Compliance RECs• Power Purchase Agreements
• “Avoided Grid” Charges
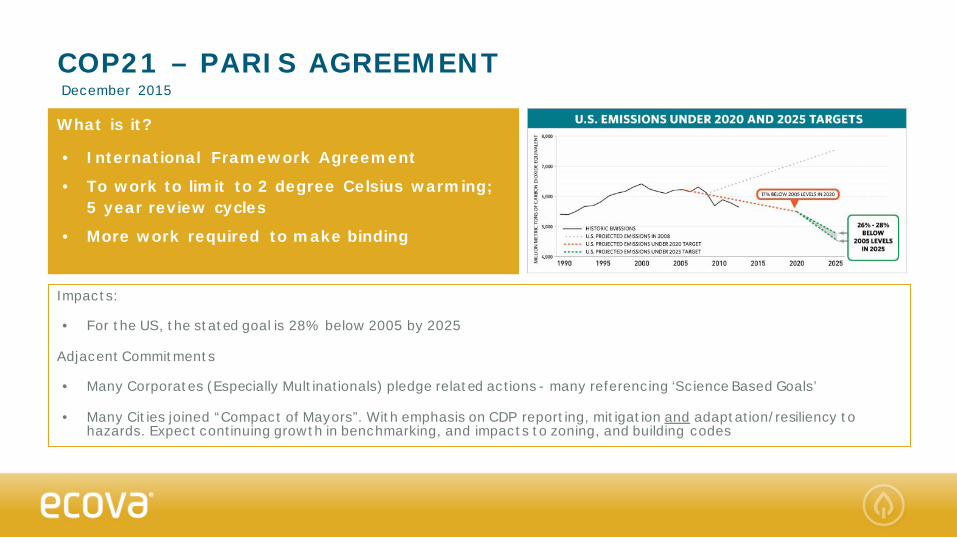
COP21 – PARIS AGREEMENTDecember 2015
What is it?
• International Framework Agreement
• To work to limit to 2 degree Celsius warming; 5 year review cycles
• More work required to make binding
Impacts:
• For the US, the stated goal is 28% below 2005 by 2025
Adjacent Commitments
• Many Corporates (Especially Multinationals) pledge related actions - many referencing ‘Science Based Goals’
• Many Cities joined “Compact of Mayors”. With emphasis on CDP reporting, mitigation and adaptation/resiliency to hazards. Expect continuing growth in benchmarking, and impacts to zoning, and building codes
TRANSITION TO ‘DUAL REPORTING’ FOR SCOPE 2 EMISSIONS January 2016
What is Scope 2 Guidance?
• An amendment to the GHG Protocol
• Focused on Purchased Electricity
• Effective now, for reporting of 2015 results
Impacts:
• GHG Reports to include both ‘Location Based’ and ‘Market Based’ calculation methods
• Consistent framework for use of RECs and other types of “Certificates”
• Participants encouraged to describe availability and their consideration of Market Based opportunities to mitigate footprint
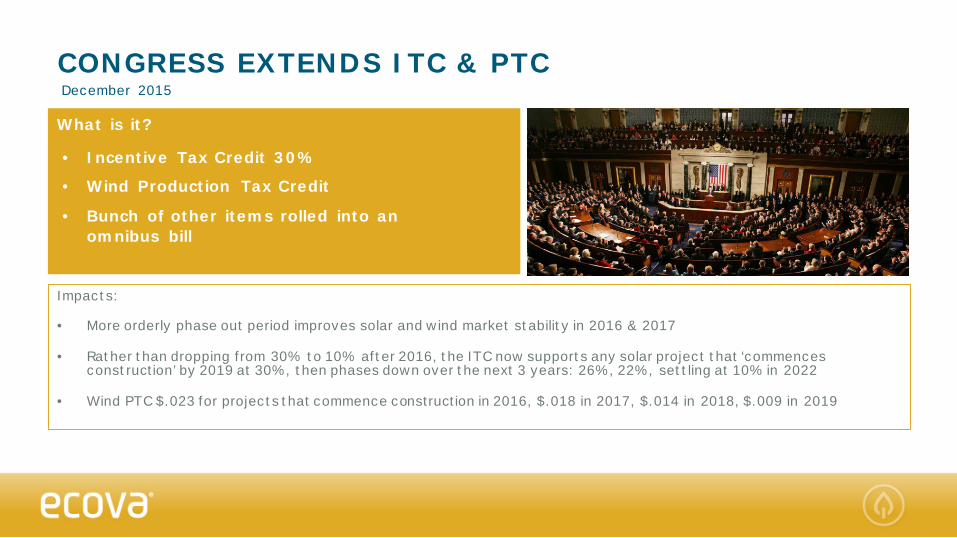
CONGRESS EXTENDS ITC & PTCDecember 2015
What is it?
• Incentive Tax Credit 30%
• Wind Production Tax Credit
• Bunch of other items rolled into an omnibus bill
Impacts:
• More orderly phase out period improves solar and wind market stability in 2016 & 2017
• Rather than dropping from 30% to 10% after 2016, the ITC now supports any solar project that ‘commences construction’ by 2019 at 30%, then phases down over the next 3 years: 26%, 22%, settling at 10% in 2022
• Wind PTC $.023 for projects that commence construction in 2016, $.018 in 2017, $.014 in 2018, $.009 in 2019
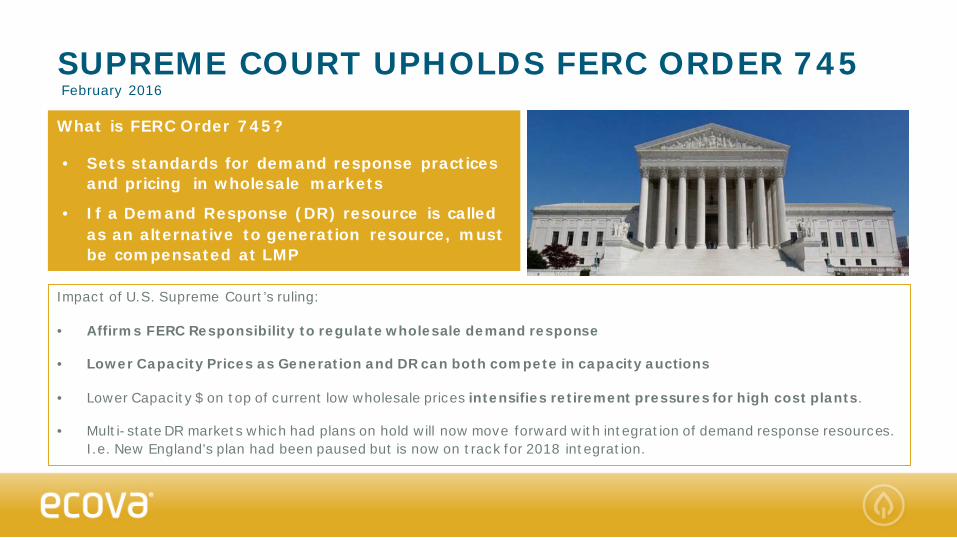
SUPREME COURT UPHOLDS FERC ORDER 745February 2016
What is FERC Order 745?
• Sets standards for demand response practices and pricing in wholesale markets
• If a Demand Response (DR) resource is called as an alternative to generation resource, must be compensated at LMP
Impact of U.S. Supreme Court’s ruling:
• Affirms FERC Responsibility to regulate wholesale demand response
• Lower Capacity Prices as Generation and DR can both compete in capacity auctions
• Lower Capacity $ on top of current low wholesale prices intensifies retirement pressures for high cost plants.
• Multi-state DR markets which had plans on hold will now move forward with integration of demand response resources. I.e. New England's plan had been paused but is now on track for 2018 integration.
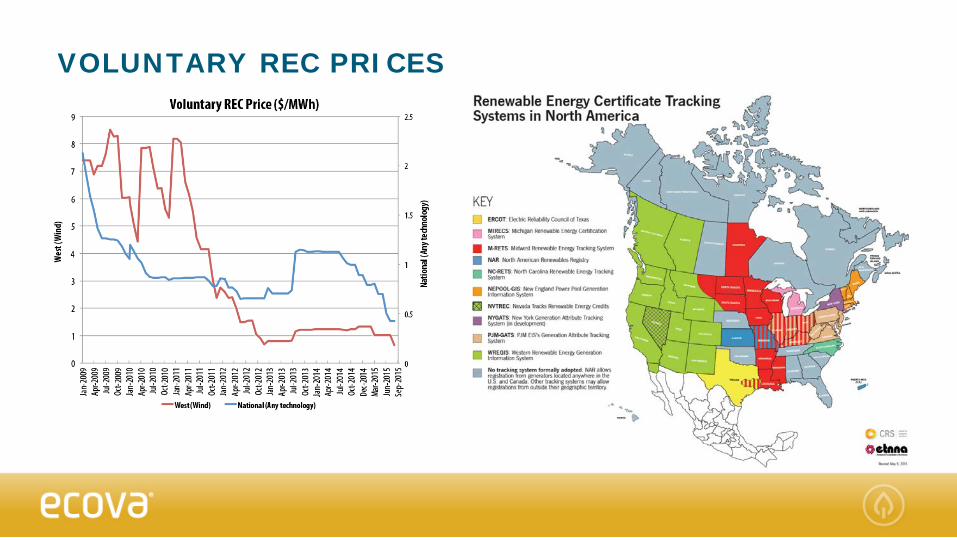
VOLUNTARY REC PRICES
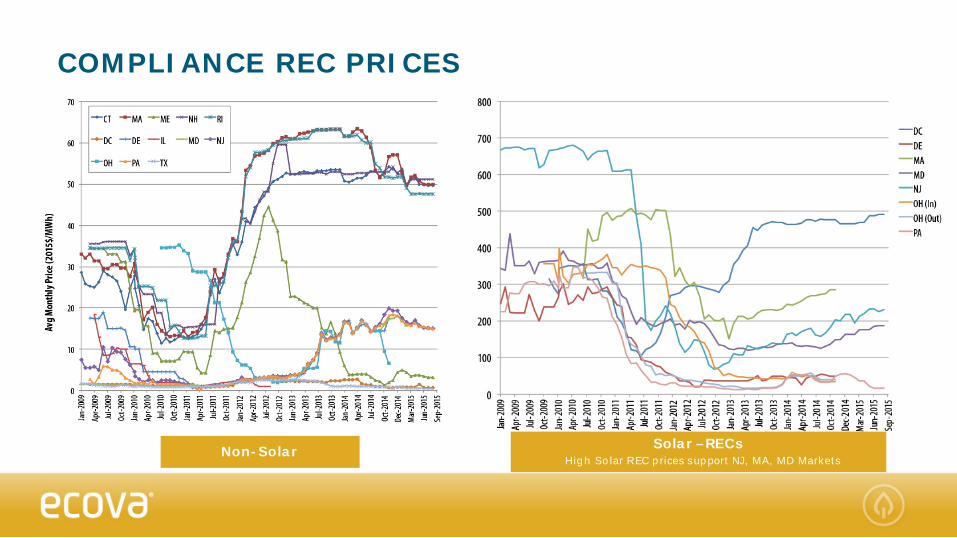
COMPLIANCE REC PRICES
Non-Solar Solar –RECs High Solar REC prices support NJ, MA, MD Markets
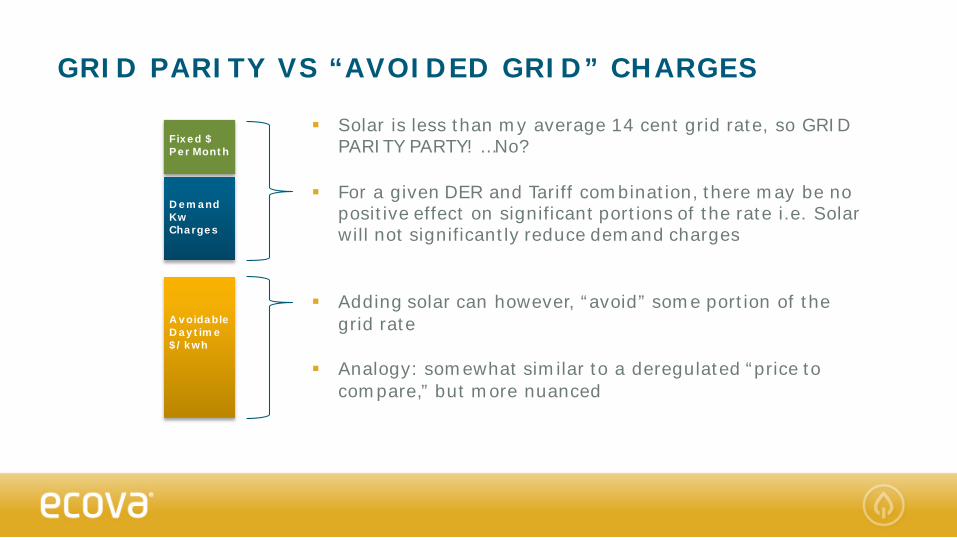
GRID PARITY VS “AVOIDED GRID” CHARGES
Solar is less than my average 14 cent grid rate, so GRID PARITY PARTY! …No?
For a given DER and Tariff combination, there may be no positive effect on significant portions of the rate i.e. Solar will not significantly reduce demand charges
Adding solar can however, “avoid” some portion of the grid rate
Analogy: somewhat similar to a deregulated “price to compare,” but more nuanced
Fixed $Per Month
DemandKw Charges
AvoidableDaytime$/kwh
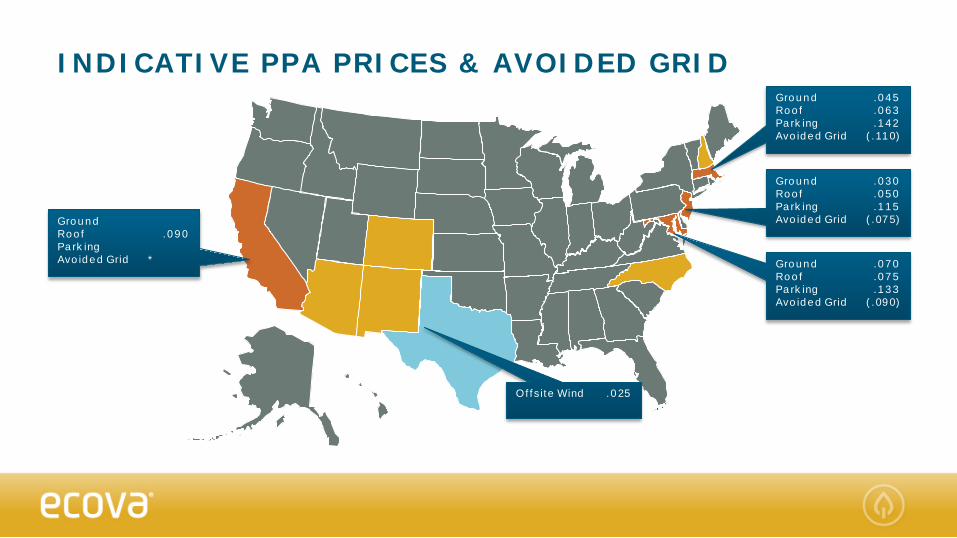
INDICATIVE PPA PRICES & AVOIDED GRID
NV
Ground .030Roof .050Parking .115Avoided Grid (.075)
Ground .045Roof .063Parking .142Avoided Grid (.110)
Ground .070Roof .075Parking .133Avoided Grid (.090)
Ground Roof .090ParkingAvoided Grid *
Offsite Wind .025
Q1 2016 ENERGY MARKET UPDATE
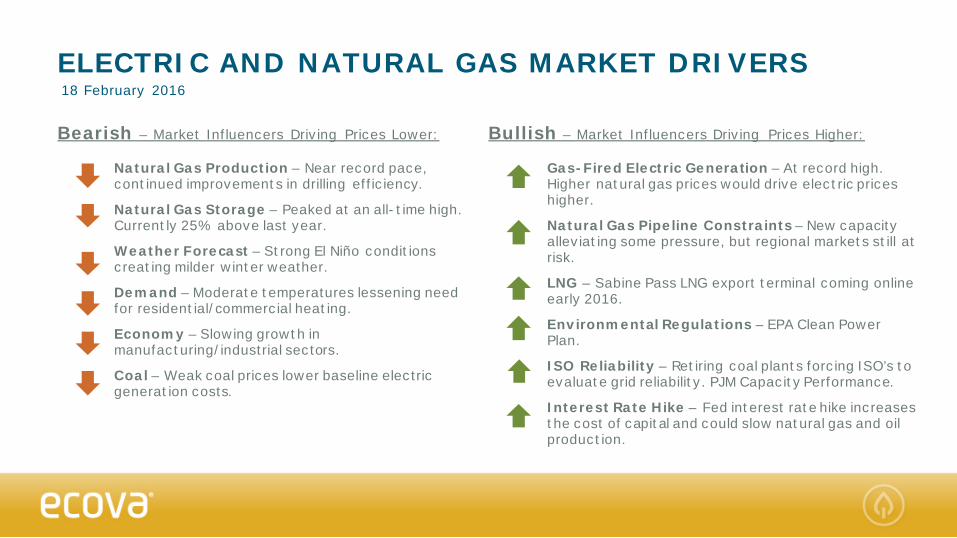
ELECTRIC AND NATURAL GAS MARKET DRIVERS18 February 2016
Bearish – Market Influencers Driving Prices Lower:
Natural Gas Production – Near record pace, continued improvements in drilling efficiency.
Natural Gas Storage – Peaked at an all-time high.Currently 25% above last year.
Weather Forecast – Strong El Niño conditions creating milder winter weather.
Demand – Moderate temperatures lessening need for residential/commercial heating.
Economy – Slowing growth in manufacturing/industrial sectors.
Coal – Weak coal prices lower baseline electric generation costs.
Bullish – Market Influencers Driving Prices Higher:
Gas-Fired Electric Generation – At record high. Higher natural gas prices would drive electric prices higher.
Natural Gas Pipeline Constraints – New capacity alleviating some pressure, but regional markets still at risk.
LNG – Sabine Pass LNG export terminal coming onlineearly 2016.
Environmental Regulations – EPA Clean Power Plan.
ISO Reliability – Retiring coal plants forcing ISO’s to evaluate grid reliability. PJM Capacity Performance.
Interest Rate Hike – Fed interest rate hike increases the cost of capital and could slow natural gas and oil production.
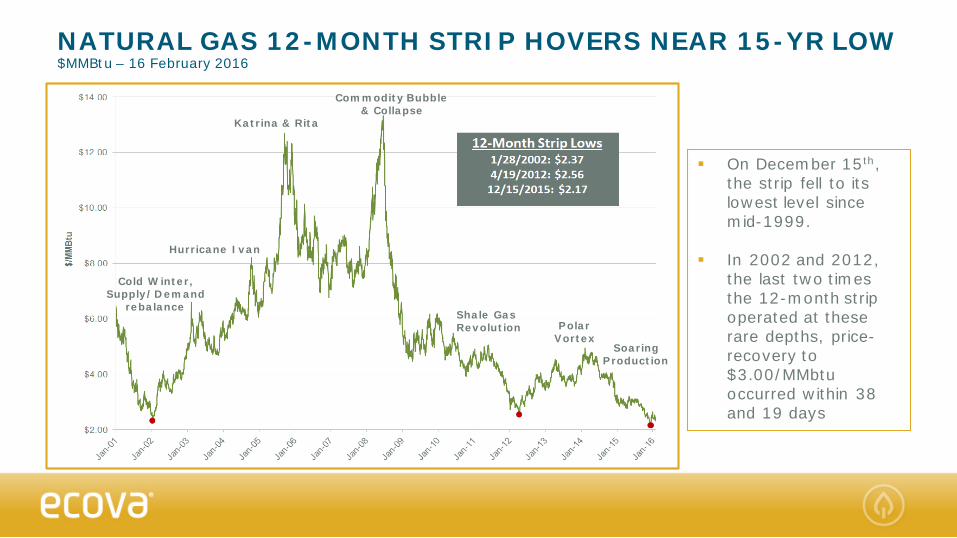
NATURAL GAS 12-MONTH STRIP HOVERS NEAR 15-YR LOW$MMBtu – 16 February 2016
On December 15th, the strip fell to its lowest level since mid-1999.
In 2002 and 2012, the last two times the 12-month strip operated at these rare depths, price-recovery to $3.00/MMbtu occurred within 38 and 19 days
Katrina & Rita
Polar Vortex
Commodity Bubble & Collapse
Cold Winter, Supply/Demand
rebalanceShale Gas Revolution
Soaring Production
Hurricane Ivan
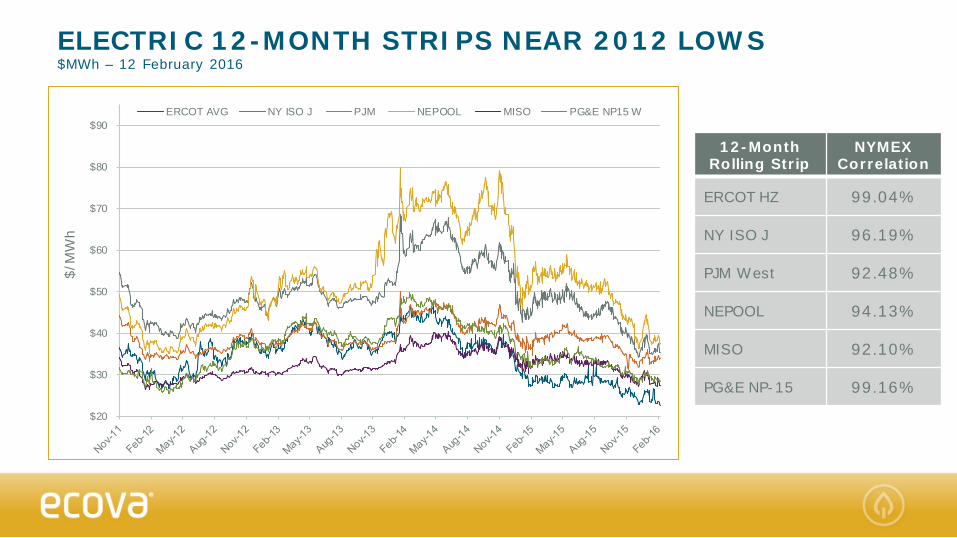
ELECTRIC 12-MONTH STRIPS NEAR 2012 LOWS$MWh – 12 February 2016
12-MonthRolling Strip
NYMEX Correlation
ERCOT HZ 99.04%
NY ISO J 96.19%
PJM West 92.48%
NEPOOL 94.13%
MISO 92.10%
PG&E NP-15 99.16%
$20
$30
$40
$50
$60
$70
$80
$90
$/M
Wh
ERCOT AVG NY ISO J PJM NEPOOL MISO PG&E NP15 W
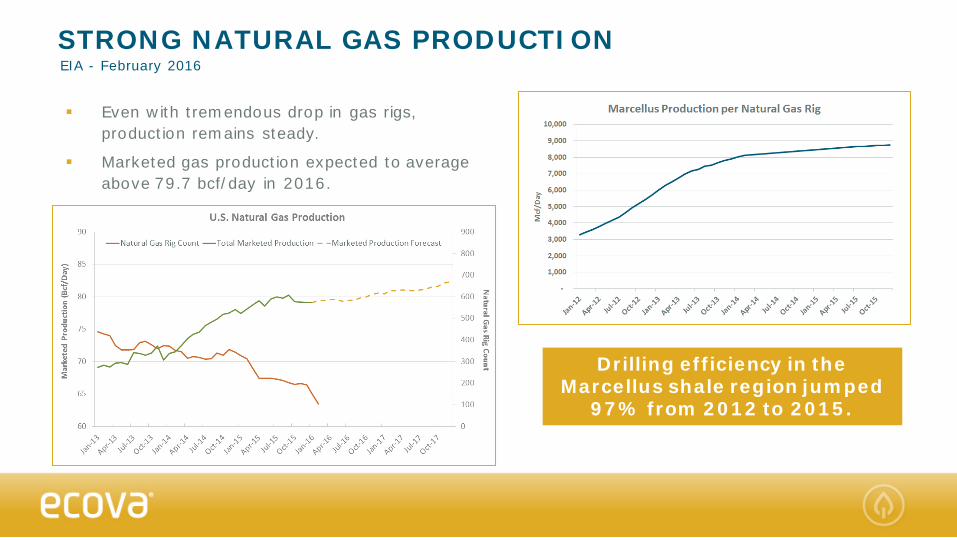
Even with tremendous drop in gas rigs, production remains steady.
Marketed gas production expected to average above 79.7 bcf/day in 2016.
STRONG NATURAL GAS PRODUCTIONEIA - February 2016
Drilling efficiency in the Marcellus shale region jumped
97% from 2012 to 2015.
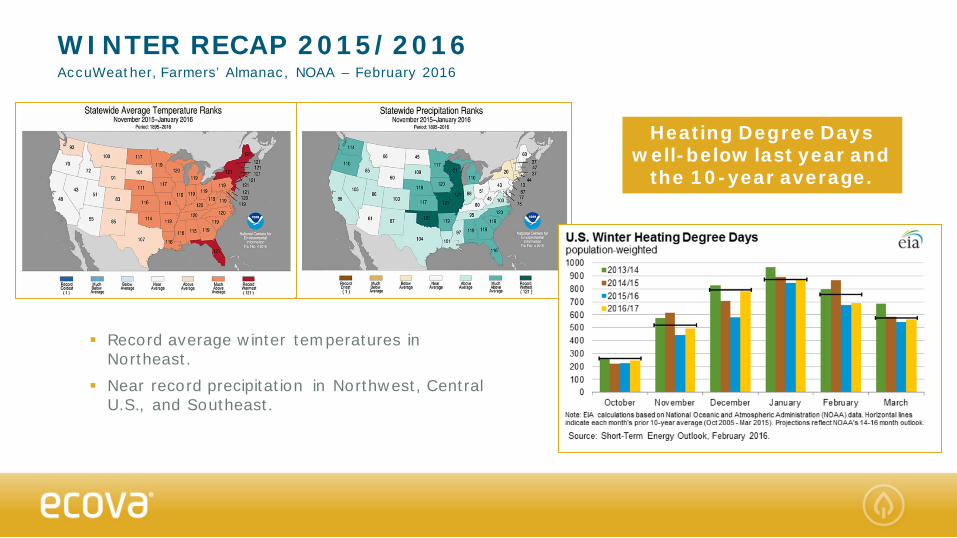
WINTER RECAP 2015/2016AccuWeather, Farmers’ Almanac, NOAA – February 2016
Record average winter temperatures in Northeast.
Near record precipitation in Northwest, Central U.S., and Southeast.
Heating Degree Days well-below last year and
the 10-year average.
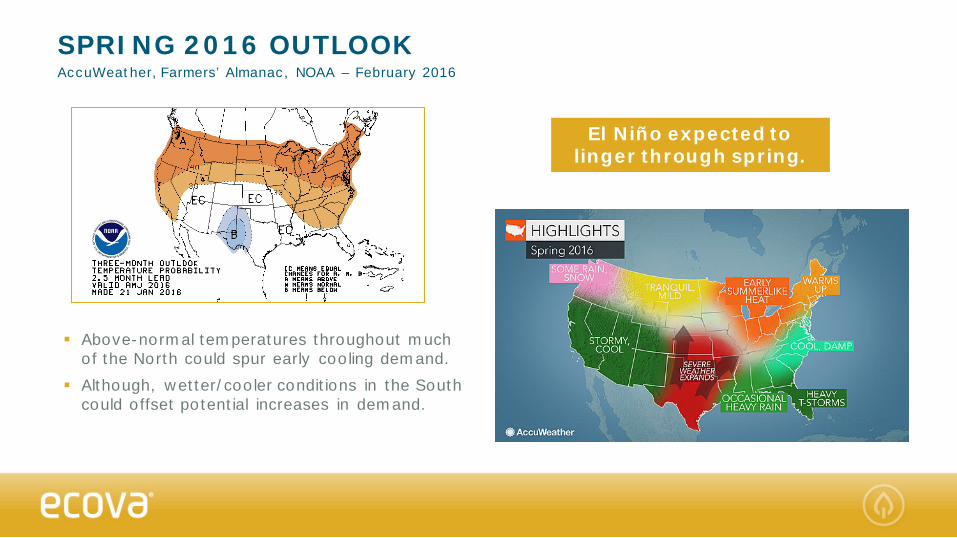
SPRING 2016 OUTLOOKAccuWeather, Farmers’ Almanac, NOAA – February 2016
Above-normal temperatures throughout much of the North could spur early cooling demand.
Although, wetter/cooler conditions in the South could offset potential increases in demand.
El Niño expected to linger through spring.
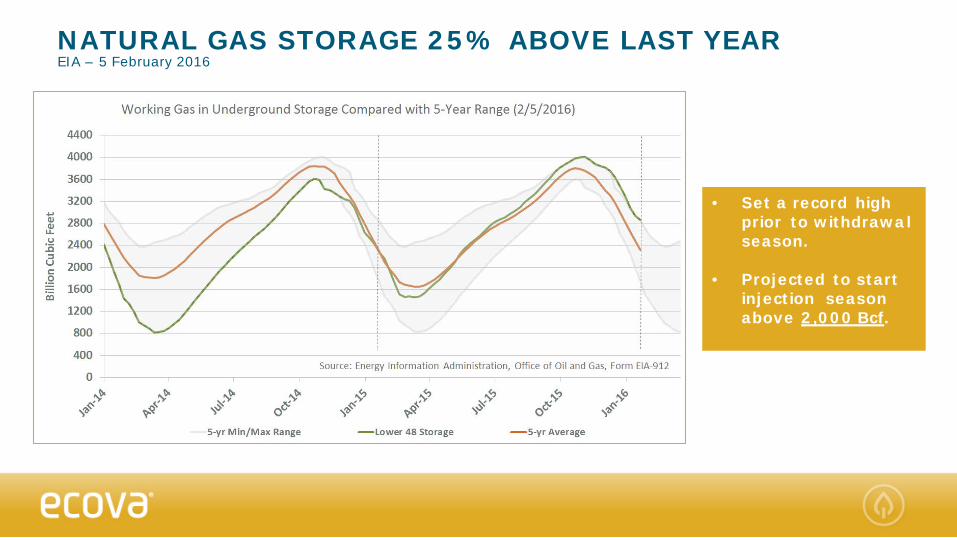
NATURAL GAS STORAGE 25% ABOVE LAST YEAREIA – 5 February 2016
• Set a record high prior to withdrawal season.
• Projected to start injection season above 2,000 Bcf.
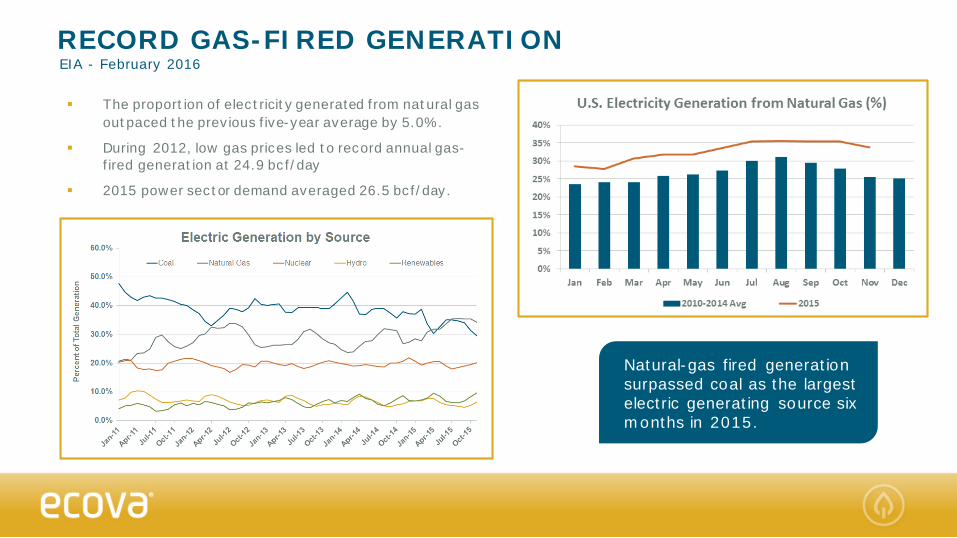
RECORD GAS-FIRED GENERATIONEIA - February 2016
The proportion of electricity generated from natural gas outpaced the previous five-year average by 5.0%.
During 2012, low gas prices led to record annual gas-fired generation at 24.9 bcf/day
2015 power sector demand averaged 26.5 bcf/day.
Natural-gas fired generation surpassed coal as the largest electric generating source six months in 2015.
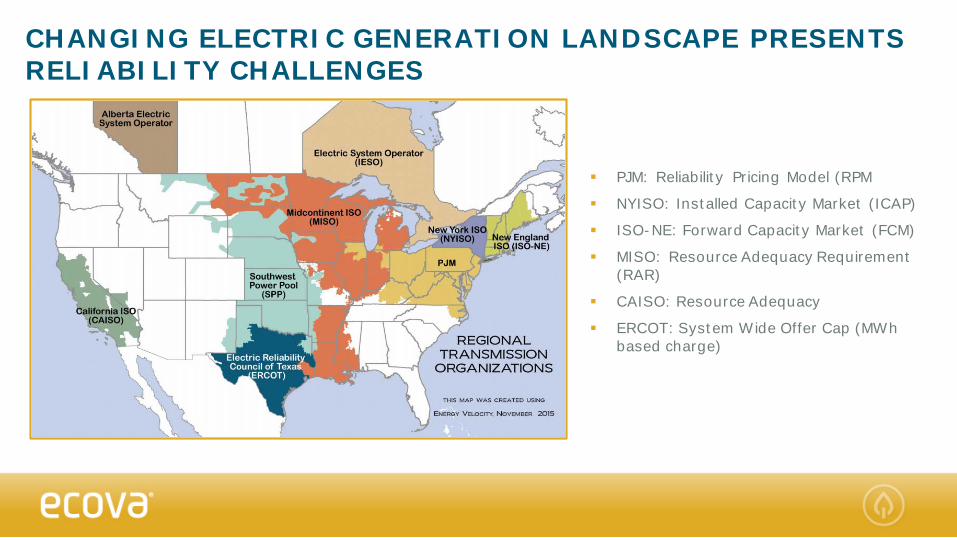
PJM: Reliability Pricing Model (RPM
NYISO: Installed Capacity Market (ICAP)
ISO-NE: Forward Capacity Market (FCM)
MISO: Resource Adequacy Requirement (RAR)
CAISO: Resource Adequacy
ERCOT: System Wide Offer Cap (MWh based charge)
CHANGING ELECTRIC GENERATION LANDSCAPE PRESENTS RELIABILITY CHALLENGES
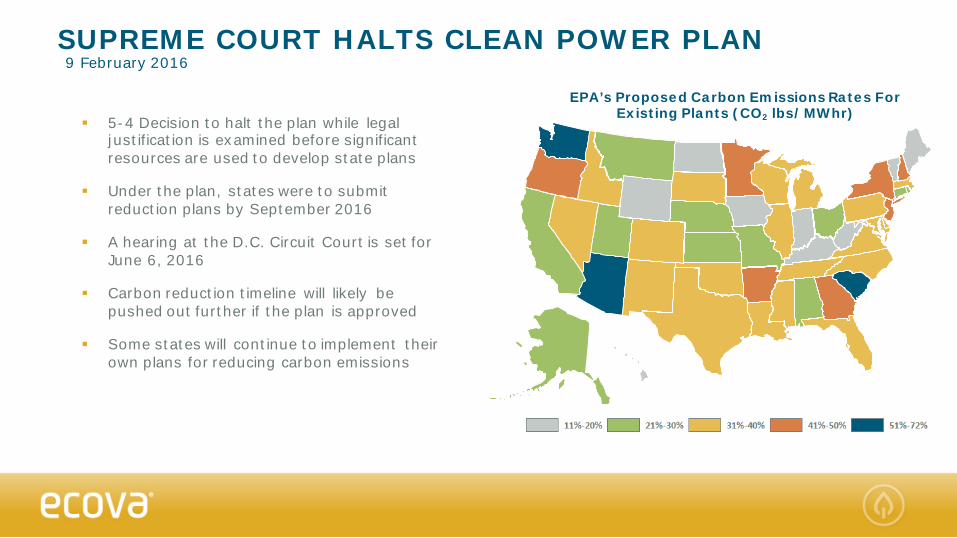
SUPREME COURT HALTS CLEAN POWER PLAN9 February 2016
5-4 Decision to halt the plan while legal justification is examined before significant resources are used to develop state plans
Under the plan, states were to submit reduction plans by September 2016
A hearing at the D.C. Circuit Court is set for June 6, 2016
Carbon reduction timeline will likely be pushed out further if the plan is approved
Some states will continue to implement their own plans for reducing carbon emissions
NV
EPA’s Proposed Carbon Emissions Rates For Existing Plants (CO2 lbs/MWhr)
$1.80
$2.30
$2.80
$3.30
$3.80
$4.30
$4.80
$/M
MB
tu
02/13/15
08/14/15
02/16/16
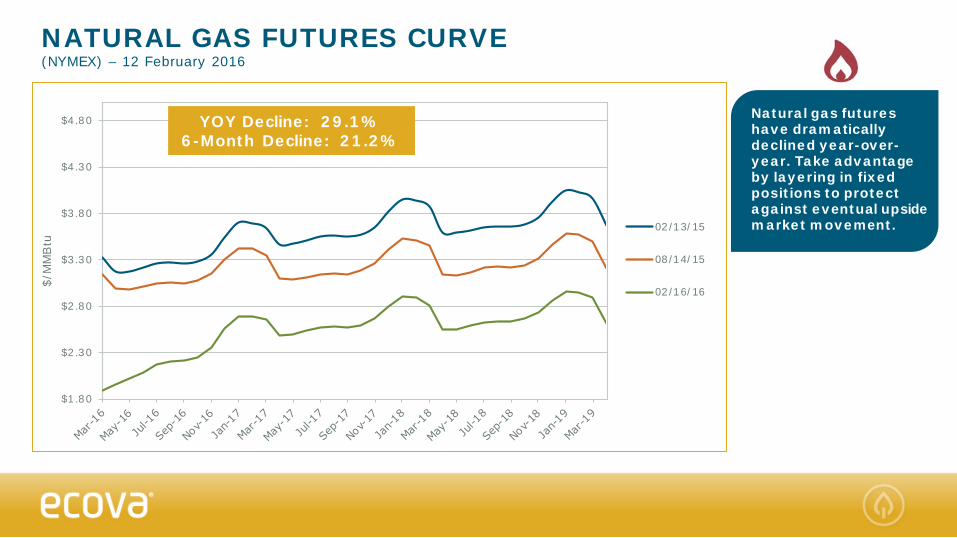
NATURAL GAS FUTURES CURVE(NYMEX) – 12 February 2016
YOY Decline: 29.1%6-Month Decline: 21.2%
Natural gas futures have dramatically declined year-over-year. Take advantage by layering in fixed positions to protect against eventual upside market movement.
$10.00
$15.00
$20.00
$25.00
$30.00
$35.00
$40.00
$45.00
$50.00
$55.00
$/M
Wh
02/12/15
08/12/15
02/12/16
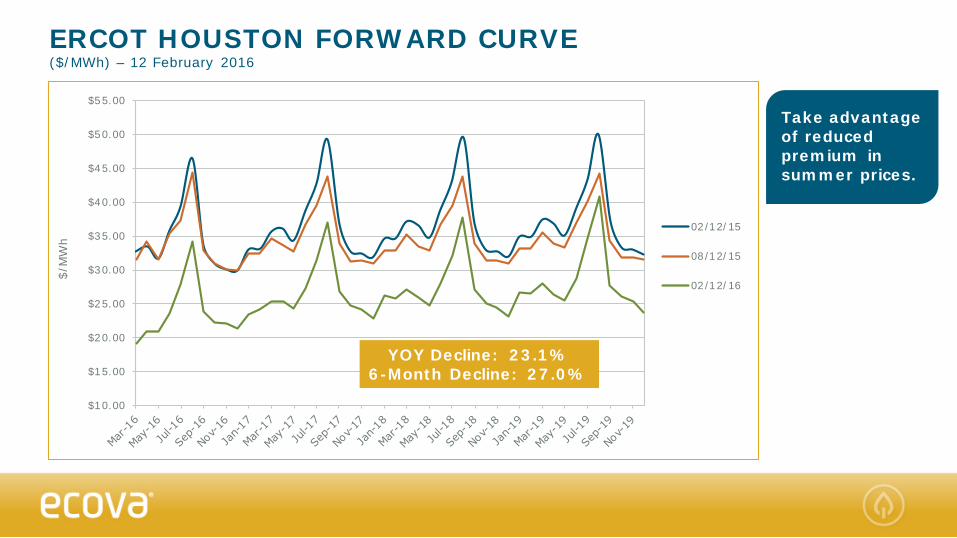
ERCOT HOUSTON FORWARD CURVE($/MWh) – 12 February 2016
YOY Decline: 23.1%6-Month Decline: 27.0%
Take advantage of reduced premium in summer prices.
$10.00
$20.00
$30.00
$40.00
$50.00
$60.00
$70.00
$80.00
$90.00
$100.00
$110.00
$/M
Wh
02/12/15
08/12/15
02/12/16
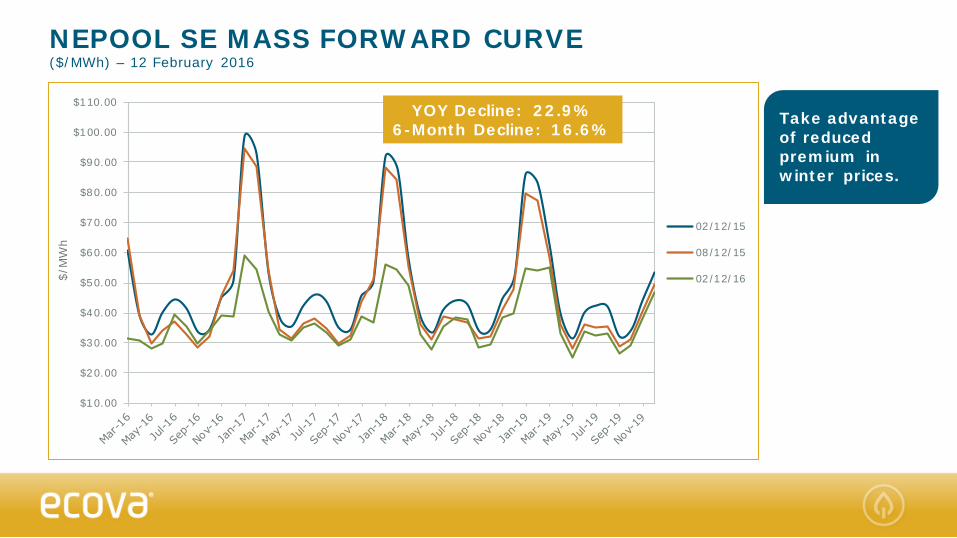
NEPOOL SE MASS FORWARD CURVE($/MWh) – 12 February 2016
YOY Decline: 22.9%6-Month Decline: 16.6%
Take advantage of reduced premium in winter prices.
MAJOR TAKEAWAYS
AREAS OF THE COUNTRY WITH ITC EXTENSION WHERE THE PPA’S ARE BETTER THAN UTILITY AVOIDED COSTS.
WHOLESALE NATURAL GAS PRICES ARE HOVERING AROUND 15-YEAR LOWS.• Strong production, healthy storage supplies, and lackluster demand weighing on the fuel.
• EL NIÑO LOWERED WINTER HEATING DEMAND.• The winter of 2015/2016 was one of the warmest on record for much of the eastern U.S.
• DEPRESSED ENERGY PRICE LEVELS PRESENT OPPORTUNITY FOR LONG-TERM APPROACH TO DEREGULATED THIRD PARTY SUPPLY CONTRACTS.
• Wholesale natural gas and electricity prices are expected to slowly rise during 2016. Upside supply price risk is more likely than further downside moves.
NEW AT ECOVA
Energy Supply Management to the Ecova Platform
New Distributed Energy ResourcesSolution
Interval Meter Data to the Ecova Platform

UPCOMING WEBINARS
ECOVA SOLUTIONS
Distributed Energy Resources: Challenging the Traditional Grid –Thursday, March 10th at 11A PST
INSIDE ENERGY & SUSTAINABILITY
IoT – A Shift in Power? – Thursday, March 31st at 11A PST

Q&A
Thank You!