preliminary energy savings analysis: ansi/ashrae/ies
TRANSCRIPT

Preliminary Energy Savings Analysis: ANSI/ASHRAE/IES Standard 90.1-2019
April 2021

(This page intentionally left blank)

Preface ii
Acknowledgments
This Report was Prepared for: U.S. Department of Energy
Office of Energy Efficiency and Renewable Energy Building Technologies Office
Energy.gov/eere/buildings
By Jian Zhang
Michael Rosenberg Jeromy Lerond
Yulong Xie Chitra Nambia
Yan Chen Reid Hart
Mark Halverson Douglas Maddox
Supriya Goel
Pacific Northwest National Laboratory

Acronyms iii
Acronyms AEO Annual Energy Outlook ANSI American National Standards Institute ASHRAE American Society of Heating, Refrigerating, and Air-Conditioning Engineers Btu British thermal unit(s) CBECS Commercial Building Energy Consumption Survey COP coefficient of performance CRAC computer room air conditioner DCV demand controlled ventilation DDC direct digital control DOAS dedicated outdoor air system DOE U.S. Department of Energy ECB Energy Cost Budget ECI energy cost intensity ECPA Energy Conservation and Production Act ERR enthalpy recovery ratio EIA Energy Information Administration EPA U.S. Environmental Protection Agency ERV energy recovery ventilator EUI energy use intensity ft2 square foot(feet) GWP Global Warming Potential HRV heat recovery ventilator HVAC heating, ventilating, and air conditioning IAM integrated assessment model IECC International Energy Conservation Code IEER integrated energy efficiency ratio IES Illuminating Engineering Society IESNA Illuminating Engineering Society of North America kft2 thousand square feet kWh thousand Watt-hour LPD lighting power density PBA principal building activity PCI Performance Cost Index PRM Performance Rating Method PNNL Pacific Northwest National Laboratory SAT supply air temperature

Preface iv
SCOP seasonal coefficient of performance SC-CO2 social cost of carbon SHGC solar heat gain coefficient SSPC Standing Standard Project Committee SWH service water heating U.S.C United State Code VAV variable air volume VRF variable-refrigerant-flow VT visible transmittance yr year(s)

Executive Summary v
Executive Summary Title III of the Energy Conservation and Production Act, as amended (ECPA), establishes requirements for DOE to review consensus-based building energy conservation standards. (42 U.S.C. 6831 et seq.) Section 304(b), as amended, of ECPA provides that whenever the ANSI/ASHRAE/IESNA1 Standard 90.1-1989 (Standard 90.1-1989 or 1989 edition), or any successor to that code, is revised, the Secretary of Energy (Secretary) must make a determination, not later than 12 months after such a revision, whether the revised code would improve energy efficiency in commercial buildings, and must publish a notice of such determination in the Federal Register. (42 U.S.C. 6833(b)(2)(A))
Standard 90.1 is developed under ANSI-approved consensus procedures2, and is under continuous maintenance by a Standing Standard Project Committee (commonly referenced as SSPC 90.1). ASHRAE has an established program for regular publication of addenda, or revisions, including procedures for timely, documented, consensus action on requested changes to the Standard.3 Standard 90.1-2019 was published in October 2019, triggering the statutorily required DOE review process.
To meet the statutory requirement, DOE conducted an analysis to quantify the expected energy savings associated with Standard 90.1-2019. This report documents the methodology used to conduct the analysis.
Based on the analysis, DOE has preliminarily determined that the 2019 edition of the ANSI/ASHRAE/IES Standard 90.1 would improve overall energy efficiency in buildings subject to the code (compared to the 2016 edition of Standard 90.1).
Methodology
The methodology applied in this analysis is consistent with that utilized for previous DOE building energy codes analyses and determinations, is designed to evaluate the impact of the updated Standard on new construction across the U.S., and is based on a combination of qualitative and quantitative assessments:
• Qualitative: The first phase of analysis was a comparative review of the textual requirements of the Standard, examining specific changes (known as “addenda”) made between Standard 90.1-2019 and the previous 2016 edition. ASHRAE publishes changes to Standard 90.1 as individual addenda to the preceding Standard and then bundles them together to form the next published edition. Addenda with direct impact on energy use were identified and their anticipated impact on energy use was determined.
• Quantitative: The second phase of analysis examined the impact of addenda having a direct impact on energy use. The quantitative phase uses whole-building energy simulation and relies upon the established DOE methodology for energy analysis, which is based on 16 representative building types across all U.S. climate zones, as defined by Standard 90.1. Energy use intensities (EUIs) by fuel type and by end-use were developed for each building type and weighted by the relative square footage of construction to estimate the difference between the aggregated national energy use under Standard 90.1-2016, which serves as the baseline, and Standard 90.1-2019.
1 ANSI – American National Standards Institute; ASHRAE – American Society of Heating, Refrigerating, and Air-Conditioning Engineers; IES – Illuminating Engineering Society; IES – Illuminating Engineering Society (previously identified as the Illuminating Engineering Society of North America, IESNA) 2 See https://www.ansi.org/about_ansi/overview/ 3 More information on the development of ANSI/ASHRAE/IES Standard 90.1 is available at http://sspc901.ashraepcs.org/index.php

vi Executive Summary
Results
In creating Standard 90.1-2019, ASHRAE published 88 addenda in total, of which:
• 29 are expected to decrease energy use (i.e., increased energy savings); • none are expected to increase energy use (i.e., decreased energy savings), and; • 59 are expected to have no direct impact on energy savings (such as administrative or clarifications or
changes to alternative compliance paths).1
New commercial buildings meeting the requirements of Standard 90.1-2019 that were analyzed in the quantitative analysis exhibit national savings (compared to Standard 90.1-2016) of approximately the following:
• 4.7 percent site energy savings; • 4.3 percent source energy savings; • 4.3 percent energy cost savings, and; • 4.2 percent carbon emissions.
The quantitative analysis relies upon prototype buildings reflecting a mix of typical U.S. building types and construction practices. In creating its prototypes, DOE leverages recent U.S. construction data that is mapped to the commercial building types defined by the Energy Information Administration (EIA) and adapted for use by Standard 90.1. In combination with resulting building type weighting factors, the prototypes represent approximately 75 percent of the total square footage of new commercial construction (Lei et al. 2020).
Site and source EUIs, energy cost indices (ECIs), carbon emissions, and SC-CO2, which vary by building type, are shown in Table ES.1 and Table ES.2 for Standard 90.1-2016 and Standard 90.1-2019, respectively. Percentage savings aggregated at the national level are shown in Figure ES.1 and Table ES.3, and analogous tables aggregated by climate zone are included in Section 4.2.
1 Addenda characterized as having no direct impact on energy savings are detailed in Appendix A:

Executive Summary vii
Figure ES.1. Percentage Savings by Building Type from 90.1-2016 to 90.1-2019
0.0% 2.0% 4.0% 6.0% 8.0% 10.0% 12.0% 14.0%
Small OfficeMedium Office
Large OfficeStand-Alone Retail
Strip MallPrimary School
Secondary SchoolOutpatient Health Care
HospitalSmall HotelLarge Hotel
Non-Refrigerated WarehouseQuick Service Restaurant
Full Service RestaurantMid-Rise Apartment
High-Rise ApartmentWeighted National Average
Percentage Savings by Building Type
Site EUI Source EUI ECI Carbon Emissions and SC-CO2

viii Executive Summary
Table ES.1. Estimated Energy Use Intensity by Building Type – Standard 90.1-2016
Building Type Prototype Building
Floor Area
Weight (%)
Whole Building Energy Metrics
Site EUI (kBtu/ft2-
yr)
Source EUI (kBtu/ft2-
yr) ECI
($/ft2-yr)
Carbon Emission (tons/kft2-
yr) SC-CO2
($/kft2-yr) Office Small Office 3.8% 27.1 77.6 $0.82 5.5 $275
Medium Office 5.0% 30.8 84.2 $0.88 5.9 $296 Large Office 3.9% 55.4 156.9 $1.65 11.1 $555
Retail Stand-Alone Retail 10.9% 48.4 114.4 $1.15 7.8 $389 Strip Mall 3.7% 52.8 133.8 $1.37 9.2 $462
Education Primary School 4.8% 43.4 107.4 $1.09 7.4 $369 Secondary School 10.9% 37.2 94.0 $0.96 6.5 $325
Healthcare Outpatient Health Care 3.4% 107.6 276.3 $2.84 19.1 $958 Hospital 4.5% 120.0 276.8 $2.77 18.7 $936
Lodging Small Hotel 1.6% 54.8 118.0 $1.16 7.8 $392 Large Hotel 4.2% 83.1 177.1 $1.73 11.7 $586
Warehouse Non-Refrigerated Warehouse 18.6% 15.7 33.2 $0.32 2.2 $110
Food Service
Quick Service Restaurant 0.3% 493.4 863.7 $7.87 53.7 $2,689
Full Service Restaurant 1.0% 336.5 649.8 $6.14 41.7 $2,090 Apartment Mid-Rise Apartment 13.7% 37.8 104.4 $1.09 7.3 $367
High-Rise Apartment 9.6% 41.3 92.0 $0.91 6.2 $308 National 100% 48.6 116.0 $1.17 7.9 $395

Executive Summary ix
Table ES.2. Estimated Energy Use Intensity by Building Type – Standard 90.1-2019
Building Type Prototype
Floor Area Weight
(%)
Whole Building Energy Metrics
Site EUI (kBtu/ft2-yr)
Source EUI (kBtu/ft2-yr)
ECI ($/ft2-yr)
Carbon Emission
(tons/kft2-yr) SC-CO2
($/kft2-yr)
Office Small Office 3.8% 25.6 73.2 $0.77 5.2 $259 Medium Office 5.0% 29.7 80.2 $0.83 5.6 $281 Large Office 3.9% 53.2 151.0 $1.59 10.7 $534
Retail Stand-Alone Retail 10.9% 46.1 106.3 $1.06 7.2 $359 Strip Mall 3.7% 51.0 127.6 $1.30 8.8 $440
Education Primary School 4.8% 40.9 101.1 $1.03 6.9 $348 Secondary School 10.9% 35.6 89.9 $0.92 6.2 $311
Healthcare Outpatient Health Care 3.4% 104.5 267.7 $2.75 18.5 $927 Hospital 4.5% 105.4 261.2 $2.66 17.9 $898
Lodging Small Hotel 1.6% 52.2 110.3 $1.07 7.3 $364 Large Hotel 4.2% 75.8 162.2 $1.59 10.7 $538
Warehouse Non-Refrigerated Warehouse 18.6% 15.5 32.5 $0.32 2.1 $107
Food Service Quick Service Restaurant 0.3% 492.5 860.9 $7.84 53.5 $2,679
Full Service Restaurant 1.0% 335.5 646.6 $6.11 41.5 $2,079 Apartment Mid-Rise Apartment 13.7% 36.5 101.5 $1.06 7.1 $358 High-Rise Apartment 9.6% 40.5 90.1 $0.89 6.0 $302 National 100% 46.3 111.0 $1.12 7.6 $379

x Executive Summary
Table ES.3. Estimated Percent Energy Savings between 2016 and 2019 Editions of Standard 90.1 – by Building Type
Building Type Prototype Building
Floor Area
Weight (%)
Savings (%)
Site EUI Source EUI ECI
Carbon Emissions & SC-CO2
Office Small Office 3.8% 5.5% 5.7% 6.1% 5.7% Medium Office 5.0% 3.6% 4.8% 5.7% 5.0% Large Office 3.9% 4.0% 3.8% 3.6% 3.8%
Retail Stand-Alone Retail 10.9% 4.8% 7.1% 7.8% 7.7% Strip Mall 3.7% 3.4% 4.6% 5.1% 5.0%
Education Primary School 4.8% 5.8% 5.9% 5.5% 5.9% Secondary School 10.9% 4.3% 4.4% 4.2% 4.3%
Healthcare Outpatient Health Care 3.4% 2.9% 3.1% 3.2% 3.2% Hospital* 4.5% 12.2% 5.6% 4.0% 4.0%
Lodging Small Hotel 1.6% 4.7% 6.5% 7.8% 7.0% Large Hotel 4.2% 8.8% 8.4% 8.1% 8.3%
Warehouse Non-Refrigerated Warehouse 18.6% 1.3% 2.1% 2.5% 2.4%
Food Service
Quick Service Restaurant 0.3% 0.2% 0.3% 0.4% 0.4%
Full Service Restaurant 1.0% 0.3% 0.5% 0.5% 0.6%
Apartment Mid-Rise Apartment 13.7% 3.4% 2.8% 2.8% 2.6% High-Rise Apartment 9.6% 1.9% 2.1% 2.2% 2.2%
National 100% 4.7% 4.3% 4.3% 4.2% *See Section 4.2 for discussion of Hospital site EUI savings

Table of Contents xi
PRELIMINARY ENERGY SAVINGS ANALYSIS ANSI/ASHRAE/IES STANDARD 90.1-2019
Table of Contents Acknowledgments ......................................................................................................................................................... ii Acronyms .................................................................................................................................................................... iii Executive Summary ....................................................................................................................................................... v 1. Introduction .......................................................................................................................................................... 1
1.1 Compliance with Standard 90.1 .................................................................................................................. 2 2. Summary of Addenda Included in Standard 90.1-2019 ....................................................................................... 3 3. Methodology ........................................................................................................................................................ 4
3.1 Overview ..................................................................................................................................................... 4 3.2 Qualitative Analysis .................................................................................................................................... 4 3.3 Quantitative Analysis .................................................................................................................................. 5
3.3.1 Building Types and Model Prototypes ............................................................................................ 6 3.3.2 Climate Zones ................................................................................................................................. 7 3.3.3 Development of Weighting Factors ................................................................................................. 8 3.3.4 Treatment of Federal Minimum Equipment Standards ................................................................... 8
3.4 Comments on Methodology ...................................................................................................................... 11 4. Results ................................................................................................................................................................ 12
4.1 Qualitative Analysis Results ..................................................................................................................... 12 4.2 Quantitative Analysis Results ................................................................................................................... 16
5. References .......................................................................................................................................................... 25 Appendix A: Addenda Not Quantified in Energy Savings Analysis ......................................................................... A.1 Appendix B: Modeling of Individual Addenda ......................................................................................................... B.1

xii Table of Contents
List of Figures Figure 1. United States Climate Zone Map ................................................................................................................... 8 Figure 2. Categorization of Addenda ........................................................................................................................... 12 Figure 3. Categorization of Quantified Addenda ......................................................................................................... 16 Figure 4. Percentage Savings by Building Type from 90.1-2016 to 90.1-2019 .......................................................... 23 Figure 5. Percentage Savings by Climate Zone from 90.1-2016 to 90.1-2019 ............................................................ 24
List of Tables Table 2.1. Number of Addenda affecting Various Sections in Standard 90.1-2019 ...................................................... 3 Table 3.1. Commercial Prototype Building Models ...................................................................................................... 7 Table 3.2. Relative Construction Volume Weights for 16 Prototype Buildings by Climate Zone (percent) ............... 10 Table 4.1. Addenda Determined to Directly Save Energy by the Qualitative Analysis of Standard 90.1-2019 .......... 13 Table 4.2. Carbon Emission Factors by Fuel Type ...................................................................................................... 17 Table 4.3. Estimated Energy Use Intensity by Building Type – Standard 90.1-2016 ................................................. 19 Table 4.4. Estimated Energy Use Intensity by Building Type – Standard 90.1-2019 ................................................. 20 Table 4.5. Estimated Energy Use Intensity by Climate Zone – Standard 90.1-2016 ................................................... 21 Table 4.6. Estimated Energy Use Intensity by Climate Zone – Standard 90.1-2019 ................................................... 22 Table 4.7. Estimated Percent Energy Savings between 2016 and 2019 Editions of Standard 90.1 – by
Building Type ............................................................................................................................................ 23 Table 4.8. Estimated Percent Energy Savings between 2016 and 2019 Editions of Standard 90.1 – by
Climate Zone ............................................................................................................................................. 24 Table B.1. Weighting Factors of Different Windows Categorized in 90.1-2016 and 90.1-2019............................... B.2 Table B.2. The Modeled ERVs in the Mid-Rise and High-Rise Apartments for 90.1-2016 and 90.1-2019 ............. B.5 Table B.3 Heat Recovery Effectiveness for Standard 90.1-2016 and 90.1-2019 Based on Required Design
EER for Mid-Rise and High-Rise Apartment Prototypes ........................................................................ B.6
Introduction 1
1. Introduction ANSI/ASHRAE/IES1 Standard 90.1 is recognized by the U.S. Congress as the national model energy code for commercial buildings under the Energy Conservation and Production Act (ECPA), as amended. (42 U.S.C 6833) With each new edition of Standard 90.1, Section 304(b) of ECPA directs the Secretary of Energy (Secretary) to make a determination as to whether the update would improve energy efficiency in commercial buildings. Standard 90.1 is developed under ANSI-approved consensus procedures2 and is under continuous maintenance by a Standing Standard Project Committee (commonly referenced as SSPC 90.1). ASHRAE has an established program for regular publication of addenda, or revisions, including procedures for timely, documented, consensus action on requested changes to the Standard.3 Standard 90.1-2019 (ASHRAE 2019), the most recent edition, was published in October 2019, triggering the statutorily required U.S. Department of Energy (DOE) review and determination process. A notice of the determination must be published in the Federal Register not later than 12 months after such revision. (42 U.S.C. 6833 (b)(2)(A)) Within two years of publication of the determination, each State is required to certify that it has reviewed and updated the provisions of its commercial building code regarding energy efficiency with respect to the revised or successor code and to include in its certification, a demonstration that the provisions of its commercial building code, regarding energy efficiency, meet or exceed the revised Standard. (42 U.S.C. 6833(b)(2)(B)(i))
On February 27, 2018, DOE issued an affirmative determination of energy savings for Standard 90.1-2016 (DOE 2017), which concluded that it would achieve greater overall energy efficiency in commercial buildings required to meet the Standard than the previous edition, Standard 90.1-2013 (83 FR 8463). Through this determination, Standard 90.1-2016 became the national model energy code for commercial buildings. Consequently, and consistent with previous determinations, it also then represents the baseline to which future changes are compared, including the current review of Standard 90.1-2019. In performing its determination, DOE recognizes that not all states adopt the national model energy code directly, and many states adopt and update their codes at different rates. Instead of adopting Standard 90.1 directly, many states adopt the International Energy Conservation Code (IECC), which includes the option to comply with Standard 90.1 by reference (ICC 2018). Separately, the DOE Building Energy Codes Program also provides technical assistance supporting states implementing building energy codes, including analysis to quantify state code impacts, tracking the status of state code adoption, and developing a suite of tools to assist states and industry stakeholders in demonstrating compliance with their codes (DOE 2020).
To fulfill its statutory directive, DOE analyzed Standard 90.1-2019 to understand its overall impact on energy efficiency in commercial buildings required to meet the Standard. Section 2 of this report summarizes specific changes (known as ‘addenda’) made between Standard 90.1-2019 and the previous 2016 edition; Section 3 documents the qualitative and quantitative analysis methodology; Section 4 presents the analysis results. In addition, Appendix A discusses addenda not included in the quantitative analysis. Appendix A also details the modeling strategies for individual addenda included in the quantitative analysis.
1 ANSI – American National Standards Institute; ASHRAE – American Society of Heating, Refrigerating, and Air-Conditioning Engineers; IES – Illuminating Engineering Society; IES – Illuminating Engineering Society (previously identified as the Illuminating Engineering Society of North America, IESNA) 2 See ANSI Essential Requirements (updated January 2020) at https://share.ansi.org/Shared%20Documents/Standards%20Activities/American%20National%20Standards/Procedures,%20Guides,%20and%20Forms/2020_ANSI_Essential_Requirements.pdf 3 More information on the development of ANSI/ASHRAE/IES Standard 90.1 is available at http://sspc901.ashraepcs.org/index.php

2 Introduction
1.1 Compliance with Standard 90.1 Standard 90.1-2019 includes several paths for compliance in order to provide flexibility to users of the Standard. The prescriptive path, which is widely considered the most traditional, establishes criteria for energy-related characteristics of individual building components, such as minimum insulation levels, maximum lighting power, and controls for heating, ventilating, and air conditioning (HVAC) systems. Some of those requirements are considered “mandatory,” meaning that they must be met even when one of the other optional paths is utilized (e.g., performance path). The other optional paths are further described below.
In addition to the prescriptive path, Standard 90.1 includes two optional whole building performance paths. The first, known as the Energy Cost Budget (ECB) method, provides flexibility in allowing a designer to “trade-off” compliance. This effectively allows a designer to not meet a given prescriptive requirement if the impact on energy cost is offset by exceeding other prescriptive requirements, as demonstrated through established energy modeling protocols. A building is deemed in compliance when the annual energy cost of the proposed design is no greater than the annual energy cost of the reference building design (baseline). In addition, Standard 90.1-2019 includes a second performance approach, the Performance Rating Method (PRM), often referred to by its location in the Standard, Appendix G. PRM is similar to ECB except that it uses a stable baseline that does not increase in stringency with each new edition of the Standard, target building performance factors which must be achieved on a whole-building basis to demonstrate compliance, and it allows credit for design features not credited in ECB. The qualitative assessment in this analysis includes addenda impacting all three paths, and the quantitative analyzes the prescriptive path only. More details are provided in Section 3.
Summary of Addenda 3
2. Summary of Addenda Included in Standard 90.1-2019
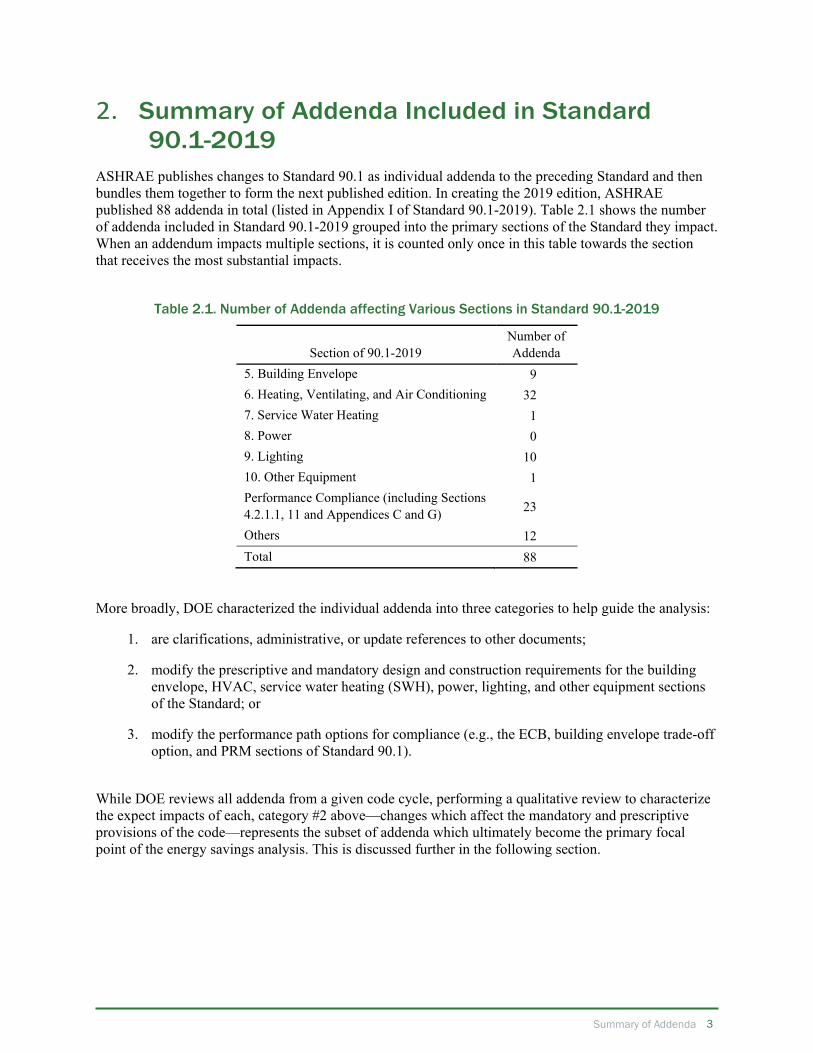
ASHRAE publishes changes to Standard 90.1 as individual addenda to the preceding Standard and then bundles them together to form the next published edition. In creating the 2019 edition, ASHRAE published 88 addenda in total (listed in Appendix I of Standard 90.1-2019). Table 2.1 shows the number of addenda included in Standard 90.1-2019 grouped into the primary sections of the Standard they impact. When an addendum impacts multiple sections, it is counted only once in this table towards the section that receives the most substantial impacts.
Table 2.1. Number of Addenda affecting Various Sections in Standard 90.1-2019
Section of 90.1-2019 Number of Addenda
5. Building Envelope 9 6. Heating, Ventilating, and Air Conditioning 32 7. Service Water Heating 1 8. Power 0 9. Lighting 10 10. Other Equipment 1 Performance Compliance (including Sections 4.2.1.1, 11 and Appendices C and G) 23
Others 12 Total 88
More broadly, DOE characterized the individual addenda into three categories to help guide the analysis:
1. are clarifications, administrative, or update references to other documents;
2. modify the prescriptive and mandatory design and construction requirements for the building envelope, HVAC, service water heating (SWH), power, lighting, and other equipment sections of the Standard; or
3. modify the performance path options for compliance (e.g., the ECB, building envelope trade-off option, and PRM sections of Standard 90.1).
While DOE reviews all addenda from a given code cycle, performing a qualitative review to characterize the expect impacts of each, category #2 above—changes which affect the mandatory and prescriptive provisions of the code—represents the subset of addenda which ultimately become the primary focal point of the energy savings analysis. This is discussed further in the following section.

4 Methodology
3. Methodology The methodology applied in this analysis is consistent with that utilized for previous DOE building energy codes analyses and determinations, evaluates the expected impact of the updated Standard on new construction, and is based on a combination of qualitative and quantitative assessments.
3.1 Overview The qualitative phase of the analysis made initial assessments as to whether an individual addendum decreased energy use, increased energy use, or did not affect energy use in a direct manner. The quantitative phase then used whole-building energy modeling and simulation to quantify the impact of the collection of addenda on overall energy use. The following steps provide a general overview of the process:
Qualitative Analysis:
1. Determine whether each addendum is applicable to the prescriptive or mandatory requirements of Standard 90.1-2019.
2. Determine whether each addendum that is applicable to the prescriptive path directly impacts energy use.
3. Of the addenda that directly impact energy use, determine whether they increase or decrease energy use.
Quantitative Analysis:
4. Of the addenda that directly impact energy use, determine those that can be reasonably quantified through energy modeling and simulation analysis.
5. Calculate whole-building results and quantify the national impact based on energy use of the addenda in step 4.
Additional detail on each phase of the analysis is provided in Sections 3.2 and 3.3.
3.2 Qualitative Analysis Expanding upon the steps presented in the previous section, the first and second steps of the qualitative analysis are used to filter out addenda that were deemed to not directly impact energy use (within the context of this analysis). Addenda were excluded if they met either of the following criteria:
1. The addenda are not applicable to the prescriptive and mandatory requirements of the Standard, meaning they only applied to the performance paths in Standard 90.1: Section 11 (Energy Cost Budget Method), Appendix C (Methodology for Building Envelope Trade-off Option), and Appendix G (Performance Rating Method). The performance paths represent optional alternatives to the prescriptive path, and generally intended to align with the prescriptive path. As the stringency of the prescriptive path is increased, the performance path rules and targets are typically updated to mirror those changes. Therefore, the use of the prescriptive and mandatory requirements effectively represents changes to the entire Standard. Additionally, the purpose of the optional performance paths is to provide design flexibility, which occurs by allowing an almost limitless number of trade-off combinations that comply with the Standard. Analytically, it is not practical or possible to model all these combinations in a manner which can be aggregated to align with the purpose of a national energy savings determination.

Methodology 5
2. The addenda affect the prescriptive path but had no impact on energy use, an undetermined impact within the scope of the analysis, or cannot be reasonably quantified through established and accepted methods of energy modeling and simulation analysis. Addenda with no impact include administrative changes or clarifications, changes to rating methods or categorization of equipment (as opposed to required efficiency levels), changes to optional alternatives, exceptions, updates of references to other documents, and text changes that are intended to improve the general usability of Standard 90.1. Addenda with undetermined impact include those related to commissioning and functional testing requirements, and to those whose impact on energy is dependent on site-specific conditions (such as shading from trees or its neighboring buildings). Changes with impacts, which do not become effective within three years from the publication of Standard 90.1-2019 (i.e., until a cutoff date of December 31, 2022), are also considered as having no impact (within the context of this analysis).
The addenda that were considered to not have a direct impact on energy use, as described above, are compiled in Appendix A. The remaining addenda were carried to the next step in the qualitative analysis, which was to make a determination of the anticipated impact on energy use (i.e., whether the addendum will decrease or increase energy use). Section 4.1 presents the results of the qualitative analysis.
3.3 Quantitative Analysis The quantitative analysis builds on established methods to assess the energy performance of new editions of Standard 90.1. As described in the previous section, whole-building energy models were used to quantify the impact of addenda on energy use. Individual building models were created to represent each unique combination of the mandatory and prescriptive requirements for Standard 90.1-2016 for each of 16 prototype building types in each of 16 climate zones. Each of these ‘compliant’ models was then duplicated, with the second version amended only to incorporate the new requirements of 90.1-2019. Additional details of the implementation into the prototype building models for each of the 17 addenda are provided in Appendix B:.
The models were simulated using EnergyPlus Version 9.0 (DOE 2018). Those addenda that were not captured through the quantitative analysis were filtered out and are labeled as such in Table 4.1 in Section 4.1. Addenda were not included in the quantitative analysis when they met one of the following criteria:
1. The addenda impact features are not representative of typical building designs. As explained in Section 3.3.1, the purpose of the prototype models is to represent common design features found in each building type in the United States. Therefore, there are less common features that are not incorporated in the prototypes, such as series energy recovery, swimming pools, exterior lighting (except for uncovered parking, building entrances and exits, and façade lighting that is typically linked with the building), parking garages, and so on. Addenda affecting these features of buildings were not captured via the prototypes in order to preserve representation of the typical building stock.
2. The addenda adopt known standard practices. The systems and their configuration in the prototype models are based on standard practice that has been widely adopted in the United States. When an addendum is to fix a loophole for an uncommon design practice, the uncommon design is not modeled in the prototypes and thus, has no affect within the quantitative analysis.
3. The addenda relate to verification or commissioning. Addenda related to verification, commissioning, and fault-detection generate savings only when there is imperfect operation. Because the models and simulation assume ideal operation, including these addenda would have no impact.
4. The addenda incorporate federal minimum equipment standards. These addenda mirror update to

6 Methodology
federal equipment standards and will improve efficiency even in the absence of their replication in Standard 90.1-2019, and therefore, they were left out of the quantitative analysis. Additional discussion is provided in Section 3.3.4.
3.3.1 Building Types and Model Prototypes The 16 prototype buildings (DOE and PNNL 2020) used in the quantitative analysis largely correspond to a classification scheme established in the 2003 DOE/Energy Information Administration (EIA) Commercial Building Energy Consumption Survey (CBECS) (EIA 2003). CBECS separates the commercial sector into 29 categories and 51 subcategories using the two variables “principal building activity” (PBA) and “detailed principal building activity” (PBAplus, for more specific activities). DOE relied heavily on these classifications in determining the buildings to be represented by the set of prototype building models. By mapping CBECS observations to each prototype building, DOE also used the CBECS building characteristics data to develop prototypes that could best represent the building stock.
The exception to this is multi-family housing buildings that are not included in CBECS but are covered by Standard 90.1 if more than three stories tall. Consequently, DOE developed mid-rise and high-rise multi-family prototype buildings to add to the 14 prototype buildings identified through the review of CBECS (Thornton et al. 2011).
Table 3.1 lists the broad building category, the prototype building, floor area of the prototype building, and its construction weight relative to the other building types. DOE developed three sizes and form factors characteristic of small, medium, and large office buildings to reflect the wide variation in office building design. Similarly, retail, education, healthcare, lodging, food service, and apartments have two representative prototypes each.
The 16 prototype buildings are representative of the characteristics of new construction in the United States. It is not feasible to simulate all building types and possible permutations of building design. Further, data are simply not available to correctly weight each possible permutation in each U.S. climate zone as a fraction of the national building construction mix. Hence, the quantitative analysis focuses on the use of prototype buildings that reflect a representative mix of typical construction practices. Together with the construction weighting factors (described in Section 3.3.3), the 16 prototypes represent approximately 75% of the total square footage of new commercial construction, including multi-family buildings more than three stories tall, consistent with the scope of Standard 90.1 (Lei et al. 2020).

Methodology 7
Table 3.1. Commercial Prototype Building Models
Building Type Prototype Building Floor Area
(ft2) Floor Area
(%)
Office Small Office 5,502 3.8% Medium Office 53,628 5.0% Large Office 498,588 3.9%
Retail Stand-Alone Retail 24,692 10.9% Strip Mall 22,500 3.7%
Education Primary School 73,959 4.8% Secondary School 210,887 10.9%
Healthcare Outpatient Health Care 40,946 3.4% Hospital 241,501 4.5%
Lodging Small Hotel 43,202 1.6% Large Hotel 122,120 4.2%
Warehouse Non-Refrigerated Warehouse 52,045 18.6%
Food Service Quick Service Restaurant 2,501 0.3% Full Service Restaurant 5,502 1.0%
Apartment Mid-Rise Apartment 33,741 13.7% High-Rise Apartment 84,360 9.6%
Total 100%
3.3.2 Climate Zones Building models were analyzed in standardized climate zones described in ASHRAE Standard 169-2013 (ASHRAE 2013). Standard 169-2013 includes nine thermal zones and three moisture regimes. The U.S. climate zones and moisture regimes are shown in Figure 1.
For this analysis, a specific climate location (city) was selected as a representative of each of the 16 climate/moisture zones found in the United States. These are also consistent with representative cities approved by the SSPC 90.1 for setting the criteria for 90.1-2019.
The 16 cities used in the current analysis are as follows:
• 1A: Honolulu, Hawaii (very hot, humid) • 2A: Tampa, Florida (hot, humid) • 2B: Tucson, Arizona (hot, dry) • 3A: Atlanta, Georgia (warm, humid) • 3B: El Paso, Texas (warm, dry) • 3C: San Diego, California (warm, marine) • 4A: New York, New York (mixed, humid) • 4B: Albuquerque, New Mexico (mixed, dry)
• 4C: Seattle, Washington (mixed, marine) • 5A: Buffalo, NY (cool, humid) • 5B: Denver, Colorado (cool, dry) • 5C: Port Angeles, Washington (cool, marine) • 6A: Rochester, Minnesota (cold, humid) • 6B: Great Falls, Montana (cold, dry) • 7: International Falls, Minnesota (very cold) • 8: Fairbanks, Alaska (subarctic/arctic)

8 Methodology
Figure 1. United States Climate Zone Map
3.3.3 Development of Weighting Factors Weighting factors that allow aggregation of the energy impact from an individual building and climate zone level to the national level were developed from construction data purchased from McGraw Hill. Details of the development are further discussed in a PNNL report (Lei et al. 2020). New construction weights were determined for each building type in each climate zone based on the county-climate zone mapping from ASHRAE Standard 169-2013. Table 3.2 lists the resulting weighting factors by climate and by prototype building used in the analysis. These data are used to develop the relative fractions of new construction floor space represented by prototype building and within the 16 climate zones.
Using the energy use intensity (EUI) statistics from each building simulation and the corresponding relative fractions of new construction floor space, DOE developed floor-space-weighted national EUI statistics by energy type for each building type and standard edition. DOE then summed these energy type-specific EUI estimates to obtain the national site energy EUI by building type and standard edition. DOE also applied national data for average energy prices, average source energy conversion rates to the energy type-specific EUI data, average carbon emission factors, and social cost of carbon (SC-CO2) to obtain estimates of national source energy EUI, national energy cost intensity (ECI), national carbon emissions, and national SC-CO2, again by building type and by standard edition.
3.3.4 Treatment of Federal Minimum Equipment Standards Standard 90.1 contains requirements for specific types of equipment that are regulated by federal efficiency standards for manufacturing and import. Addenda that adopted federal efficiency standards

Methodology 9
were excluded from the analysis to ensure that savings from energy codes and efficiency standards were not double counted. In the quantitative analysis, this was accomplished by assuming current minimum federal equipment efficiencies (i.e., as published in Standard 90.1-2019 with an effective date no later than December 31, 2022) in both the 2016 and 2019 prototype building models (with offsetting effects), which is consistent with historical DOE determination analyses. Note that the excluded addenda relate to minimum equipment efficiency levels set through the federal appliance and equipment standards rulemaking process, and not revised efficiency levels standards originating in ASHRAE Standard 90.1-2019. If the efficiency improvement is due to a change initiated in Standard 90.1, even those which may subsequently trigger an update in federal regulations, then those addenda are included in the determination savings.

10 Methodology
Table 3.2. Relative Construction Volume Weights for 16 Prototype Buildings by Climate Zone (percent)
Building Type 1A 2A 2B 3A 3B 3C 4A 4B 4C 5A 5B 5C 6A 6B 7 8 Weights by Bldg Type
Large Office 0.11 0.54 0.07 0.54 0.26 0.23 1.13 0.00 0.24 0.48 0.15 0.00 0.09 0.00 0.01 0.00 3.86
Medium Office 0.14 0.78 0.19 0.73 0.45 0.16 0.95 0.03 0.17 0.88 0.31 0.00 0.17 0.03 0.02 0.00 5.01
Small Office 0.11 0.77 0.15 0.70 0.27 0.05 0.58 0.03 0.09 0.67 0.21 0.00 0.13 0.02 0.02 0.00 3.80
Stand-Alone Retail 0.29 1.79 0.31 1.78 0.85 0.12 1.92 0.08 0.26 2.37 0.54 0.01 0.49 0.06 0.06 0.01 10.94
Strip Mall 0.16 0.63 0.14 0.70 0.42 0.09 0.66 0.02 0.09 0.61 0.12 0.00 0.06 0.01 0.01 0.00 3.71
Primary School 0.13 0.98 0.12 0.94 0.36 0.04 0.88 0.03 0.12 0.77 0.23 0.00 0.16 0.05 0.02 0.00 4.83
Secondary School 0.26 1.86 0.19 2.16 0.77 0.14 1.98 0.07 0.27 2.18 0.51 0.01 0.37 0.09 0.06 0.01 10.92
Hospital 0.09 0.75 0.11 0.63 0.32 0.10 0.92 0.03 0.13 0.95 0.23 0.01 0.20 0.03 0.03 0.00 4.52
Outpatient Health Care 0.05 0.54 0.09 0.53 0.17 0.04 0.62 0.02 0.10 0.80 0.20 0.00 0.18 0.03 0.03 0.00 3.42
Full Service Restaurant 0.03 0.18 0.03 0.17 0.08 0.01 0.16 0.01 0.02 0.19 0.04 0.00 0.03 0.00 0.00 0.00 0.97
Quick Service Restaurant 0.01 0.07 0.01 0.06 0.02 0.00 0.06 0.00 0.00 0.07 0.02 0.00 0.01 0.00 0.00 0.00 0.33
Large Hotel 0.18 0.71 0.10 0.56 0.55 0.09 0.82 0.02 0.13 0.65 0.19 0.00 0.14 0.04 0.02 0.00 4.22
Small Hotel 0.03 0.30 0.02 0.27 0.11 0.02 0.30 0.01 0.03 0.27 0.10 0.00 0.08 0.03 0.02 0.00 1.59
Non-Refrigerated Warehouse 0.53 3.53 0.63 2.77 2.23 0.18 3.69 0.05 0.54 3.14 0.82 0.00 0.37 0.03 0.04 0.00 18.56
High-Rise Apartment 1.44 1.19 0.08 0.57 0.63 0.29 3.26 0.00 0.49 1.36 0.19 0.00 0.11 0.01 0.00 0.00 9.64
Mid-Rise Apartment 0.36 2.24 0.27 1.78 1.18 0.49 3.02 0.03 0.71 2.22 0.73 0.01 0.57 0.05 0.04 0.00 13.69
Weights by Zone 3.94 16.85 2.52 14.89 8.67 2.06 20.94 0.43 3.39 17.60 4.59 0.05 3.17 0.49 0.38 0.03 100.00

11 Methodology
3.4 Comments on Methodology The goal of this analysis was to determine if the 2019 edition of Standard 90.1 is more energy-efficient relative to the 2016 edition. The approach selected to make this determination has certain limitations. These limitations are outlined below.
State Code Adoption: As discussed in the Introduction (Section 1), states adopt and update their energy codes in a variety of different manners. Some states adopt updated model codes as published while others draft state-level amendments to modify the model code. States also adopt codes at varying rates, with some states updating relatively quickly after a new edition is available, while others may remain on older editions for a longer duration. While these variables are not included in the DOE determination analysis, they ultimately affect the impacts of the model codes as applied across adopting states and localities.
Prototype Representation: Not all the addenda impacting energy use can be captured by the quantitative analysis due to the fixed nature of the prototypes, as explained in Section 3.3.1. Thus, the impact resulting from the quantitative analysis can be considered conservative. At the same time, the impact could be considered generous because the addenda that were included impacted all buildings of a given type (i.e., the weighting factors carried the impact to all buildings of a given type in a climate zone even though some of those buildings may not fit the descriptions of the prototype buildings). For example, the analysis assumes all large office buildings have water-cooled chillers—a property of the Large Office prototype. In reality, some have air-cooled, some have packaged equipment, some have variable refrigerant volume systems, etc. If the water-cooled chiller efficiency improved more than the other systems, the analysis overestimates savings. Whereas, if the efficiency improved less than the other systems, the analysis will have underestimated savings.
Combination of Qualitative & Quantitative Analysis: In any high-level analysis there is a need to balance precision, accuracy and practicality. The approach selected here addresses that by performing both a qualitative and quantitative analysis. The quantitative analysis taken together with the qualitative analysis provides a more robust and defensible determination. If the qualitative analysis determines that a large majority of addenda are expected to decrease energy use, and the quantitative analysis also shows a reduction in energy use from addenda impacting representative building designs, then taken together, the determination can be said to be more robust and reliable.

12 Results
4. Results 4.1 Qualitative Analysis Results The qualitative analysis concluded that 29 of the 88 addenda had a direct impact on energy use as defined in Section 3.2 — all 29 of the addenda listed decrease energy use in commercial buildings. The 59 remaining changes were determined to have no direct impact on energy use. A graphical summary of the qualitative analysis results is shown in Figure 2.
Figure 2. Categorization of Addenda
The 29 addenda with a direct impact are shown in Table 4.1, while the remainder are shown in Appendix A:. Six columns of information are listed for each addendum in Table 4.1:
1. Addendum: the letter addendum designation assigned by ASHRAE.
2. Code Section(s): a list of the section numbers in Standard 90.1-2016 that are affected by the addendum.
3. Description of Change: a brief description of the change made by the addendum.
4. Impact on Energy Use: the anticipated impact of the addendum on energy use.
5. Included in Quantitative Analysis: whether the addendum can be included in the forthcoming Quantitative Analysis (see Section 4.2).
6. Discussion: how the impact on energy use was determined (and why the addendum was excluded from the quantitative analysis, if applicable).
Addenda characterized as having no direct impact on energy savings are detailed in Appendix.
Decrease Energy Use, 29
No Direct Impact on Energy Use, 59

13 Results
Table 4.1. Addenda Determined to Directly Save Energy by the Qualitative Analysis of Standard 90.1-2019
Addendum Code Sections Description of Change Impact on Energy Use
Included in Quantitative
Analysis
Discussion
dn 6.5.6 Modifies exceptions to exhaust air energy recovery requirements.
Decreases Energy Use No
Excluded from quantitative analysis because series energy recovery is not modeled in the
prototypes.
a 6.4.3.4.2, 6.4.3.4.3, 6.5.1.1.4
Changes term "ventilation air" to "outdoor air" in multiple locations. Adds an exception to allow systems
intended to operate continuously not to install motorized outdoor air damper. Changes return air dampers to
require low leakage ratings.
Decreases Energy Use Yes
Reduces fan energy by allowing systems intended to operate continuously not to install motorized outdoor air damper (less pressure drop), and reduce cooling energy for systems
with air economizers because of lower leakage through return air dampers.
g 3.2, 6.4.3.9 Provides definition of "occupied-standby mode" and adds
new ventilation air requirements for zones served in occupied-standby mode.
Decreases Energy Use Yes
Requires thermostat setback and minimum variable air volume (VAV) damper reset to zero
during occupied standby model.
h 6.5.6.1 Clarifies that exhaust air ERVs should be sized to meet both heating and cooling design conditions unless one
mode is not exempted by existing exceptions.
Decreases Energy Use Yes Reduces HVAC energy by requiring adequately
sized ERVs.
j 6.4.3.8 Revises exception to demand control ventilation (DCV) requirements to clarify that the exception only applies to
systems with ERV required to meet Section 6.5.6.1.
Decreases Energy Use No
Reduces HVAC energy by preventing a bad design practice of using ERV rather than DCV in climate zones where ERVs are not required and DCV would save more energy. Excluded from
quantitative analysis because typical designs, as represented by the established prototypes, do not
use this design practice.
k 3.2, 6.4.3.3.5, 9.4.1.3
Revises definition of "networked guest room control system" and aligns HVAC and lighting time-out periods
for guest rooms.
Decreases Energy Use Yes
Reduces timeout period from 30 to 20 minutes to activate occupancy-based temperature and
ventilation setback controls for guestrooms.
t 9.4.2 Expands the exterior lighting power density (LPD)
application table to cover additional exterior spaces that are not in the exterior LPD table.
Decreases Energy Use No
Reduces lighting energy. Excluded from quantitative analysis because the exterior areas
added to the table are not modeled in the prototypes.
v 6.5.6.3 Adds heat recovery for space conditioning requirement targeted specifically at in-patient hospitals
Decreases Energy Use Yes
Requires in-patient hospitals with large chillers to recover rejected heat for use in heating water
systems.
ai Too many to
list. See Addendum ai
Restructures commissioning and functional testing requirements in all sections of Standard 90.1 to require verification or testing for smaller and simpler buildings
and commissioning for larger and more complex buildings.
Decreases Energy Use No
Excluded from quantitative analysis because the analysis is based on proper operation of controls in the prototypes and would not show savings for
improvements from verification, testing, or commissioning.

14 Results
Addendum Code Sections Description of Change Impact on Energy Use
Included in Quantitative
Analysis
Discussion
am 6.5.6.4 Adds indoor pool dehumidifier energy recovery requirement.
Decreases Energy Use No
Reduces HVAC energy. Excluded from quantitative analysis because swimming pools
are not modeled in the prototypes.
an 3.2, 10.4.6 Implements federal clean water pump requirements. Decreases
Energy Use No
Reduces pump energy through improved efficiency. Excluded from quantitative analysis
because impacted pumps are federally-regulated. (See Section 3.3.4)
ao 3.2,
6.5.3.1.3, 12
Replaces Fan Energy Grade metric with Fan Energy Index metric
Decreases Energy Use No
Reduces fan energy through improved fan efficiency. Excluded from quantitative analysis because fan power in the prototypes is set based
on the total fan power limit in the Standard, which has not been changed.
ap 6.5.3.5 Revises supply air temperature reset controls Decreases Energy Use Yes Revises supply air temperature reset
requirements.
au 6.5.2.1, Eliminates the requirement that zones with direct digital control (DDC) have air flow rates that are no more than
20% of the zone design peak flow rate.
Decreases Energy Use Yes
Replaces VAV box minimum setpoint of 20% of the design supply air rate with a setpoint
determined using Simplified Procedure in ASHRAE Standard 62.1.
aw
3.2, Tables 5.5-0
through 5.5-8, 12
Revises prescriptive fenestration U and SHGC requirements and makes them material neutral.
Decreases Energy Use Yes Improves thermal performance of most
fenestration components.
ay 6.5.6.1 Provides separate requirements for nontransient dwelling unit exhaust air energy recovery.
Decreases Energy Use Yes Requires more dwelling units to have exhaust air
energy recovery.
bb Table 9.6.1 Changes interior LPD requirements for many space types.
Decreases Energy Use Yes Reduces lighting energy with lower LPD.
bd Table 6.8.1-18 Adds new chiller table for heat pump and heat recovery chillers.
Decreases Energy Use Yes Establishes new efficiency requirement for
equipment including heat recovery chillers.
be Table 6.8.1-
11, Table 6.8.1-19
Revises computer room air conditioner (CRAC) requirements to clarify these are for floor mounted units
and adds a new table for ceiling mounted units.
Decreases Energy Use Yes Requires higher efficiency CRAC units.
bo 3.2, Tables 6.8.1.5 and F4
Adds definition of Standby Power Mode Consumption. Increases furnace efficiency requirements.
Decreases Energy Use No
Reduces heating energy through improved furnace efficiency. Excluded from quantitative
analysis because the impacted furnaces are federally-regulated. (See Section 3.3.4)
bp Tables 6.8.1.6 and F5
Adds a new table F-5 to specify DOE covered residential water boiler efficiency requirements and notes that
requirements in Table 6.8.1-6 apply only to products used outside the US. Adds standby mode and improved
efficiency as of 1/15/2021.
Decreases Energy Use No
Excluded from quantitative analysis because the impacted boilers are federally-regulated. (See
Section 3.3.4)
15 Results
Addendum Code Sections Description of Change Impact on Energy Use
Included in Quantitative
Analysis
Discussion
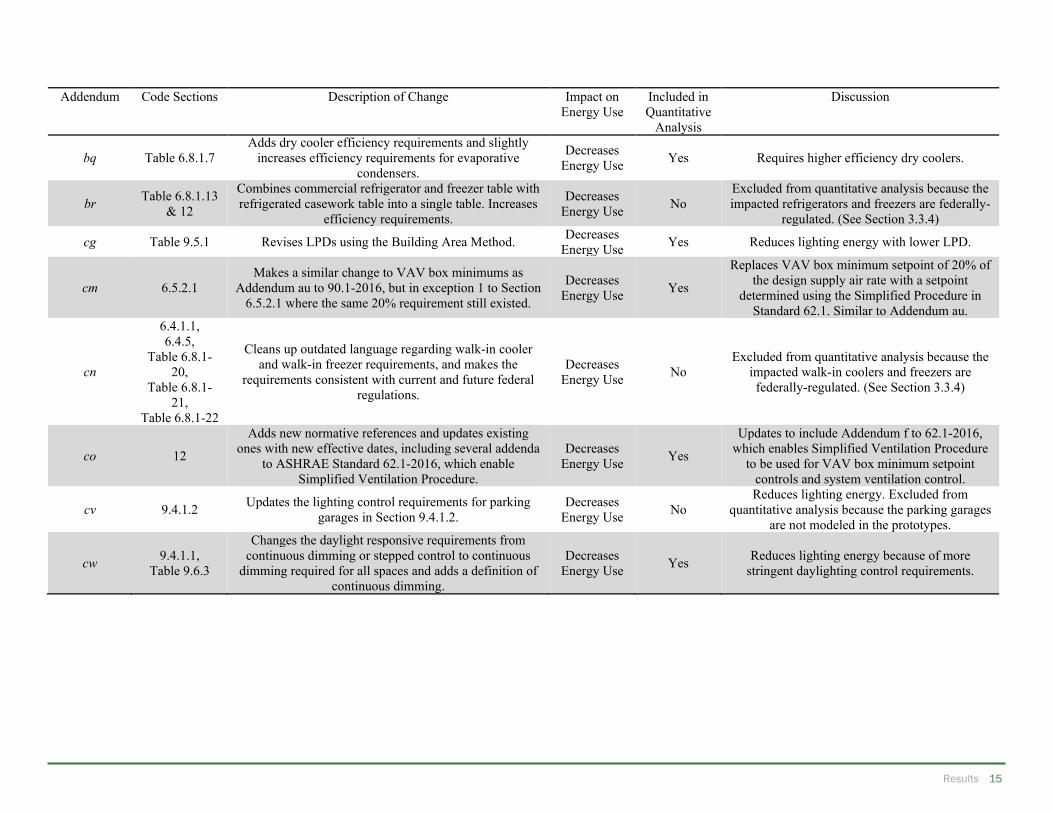
bq Table 6.8.1.7 Adds dry cooler efficiency requirements and slightly
increases efficiency requirements for evaporative condensers.
Decreases Energy Use Yes Requires higher efficiency dry coolers.
br Table 6.8.1.13 & 12
Combines commercial refrigerator and freezer table with refrigerated casework table into a single table. Increases
efficiency requirements.
Decreases Energy Use No
Excluded from quantitative analysis because the impacted refrigerators and freezers are federally-
regulated. (See Section 3.3.4)
cg Table 9.5.1 Revises LPDs using the Building Area Method. Decreases Energy Use Yes Reduces lighting energy with lower LPD.
cm 6.5.2.1 Makes a similar change to VAV box minimums as
Addendum au to 90.1-2016, but in exception 1 to Section 6.5.2.1 where the same 20% requirement still existed.
Decreases Energy Use Yes
Replaces VAV box minimum setpoint of 20% of the design supply air rate with a setpoint
determined using the Simplified Procedure in Standard 62.1. Similar to Addendum au.
cn
6.4.1.1, 6.4.5,
Table 6.8.1-20,
Table 6.8.1-21,
Table 6.8.1-22
Cleans up outdated language regarding walk-in cooler and walk-in freezer requirements, and makes the
requirements consistent with current and future federal regulations.
Decreases Energy Use No
Excluded from quantitative analysis because the impacted walk-in coolers and freezers are federally-regulated. (See Section 3.3.4)
co 12
Adds new normative references and updates existing ones with new effective dates, including several addenda
to ASHRAE Standard 62.1-2016, which enable Simplified Ventilation Procedure.
Decreases Energy Use Yes
Updates to include Addendum f to 62.1-2016, which enables Simplified Ventilation Procedure
to be used for VAV box minimum setpoint controls and system ventilation control.
cv 9.4.1.2 Updates the lighting control requirements for parking garages in Section 9.4.1.2.
Decreases Energy Use No
Reduces lighting energy. Excluded from quantitative analysis because the parking garages
are not modeled in the prototypes.
cw 9.4.1.1, Table 9.6.3
Changes the daylight responsive requirements from continuous dimming or stepped control to continuous
dimming required for all spaces and adds a definition of continuous dimming.
Decreases Energy Use Yes Reduces lighting energy because of more
stringent daylighting control requirements.

16 Results
4.2 Quantitative Analysis Results The quantitative analysis only includes those addenda that have a direct impact on energy use as described in Section 3.2 and Section 3.3. A graphical summary of the addenda included in the quantitative analysis is shown in Figure 3. The category labeled “Unquantified Energy Impact” includes those addenda that were determined to have a direct impact on energy use but are not be included in the quantitative analysis. Appendix B: describes the implementation of addenda into the prototype models.
Figure 3. Categorization of Quantified Addenda
Table 4.3 through Table 4.6 show the quantitative analysis results by building type and climate zone for Standard 90.1-2016 and 90.1-2019, respectively. The results were aggregated on a national basis for each Standard, based on the weighting factors discussed in Section 3.3.3. In these tables, site energy refers to the energy consumed at the building site, and source energy (or primary energy) refers to the energy required to generate and deliver energy to the site. To calculate source energy, conversion factors were applied to the electricity and natural gas consumption. The development of these conversion factors is explained below.
The electric energy source conversion factor of 9,957 Btu/kWh was calculated from EIA’s Annual Energy Outlook (AEO) 2020 (EIA 2020) Table 21 as follows:
• Delivered commercial electricity, 2019: 4.65 quads • Commercial electricity related losses, 2019: 8.92 quads • Total commercial electric energy use, 2019: 13.58 quads • Commercial electric source ratio, U.S. 2019: 2.92 • Source electric energy factor (3413 Btu/kWh site) 9,957 Btu/kWh2
1 Available at https://www.eia.gov/outlooks/aeo/ 2 The final conversion value is calculated using the full seven digit values available in Table 2 of AEO 2020. Other values shown in the text are rounded.
No Direct Impact on
Energy Use, 59
Direct Impact and Not Quantified, 12
Chapter 5 Envelope, 1
Chapter 6 HVAC, 13
Chapter 9 Lighting, 3
Quantified Energy
Impact, 17
Results 17
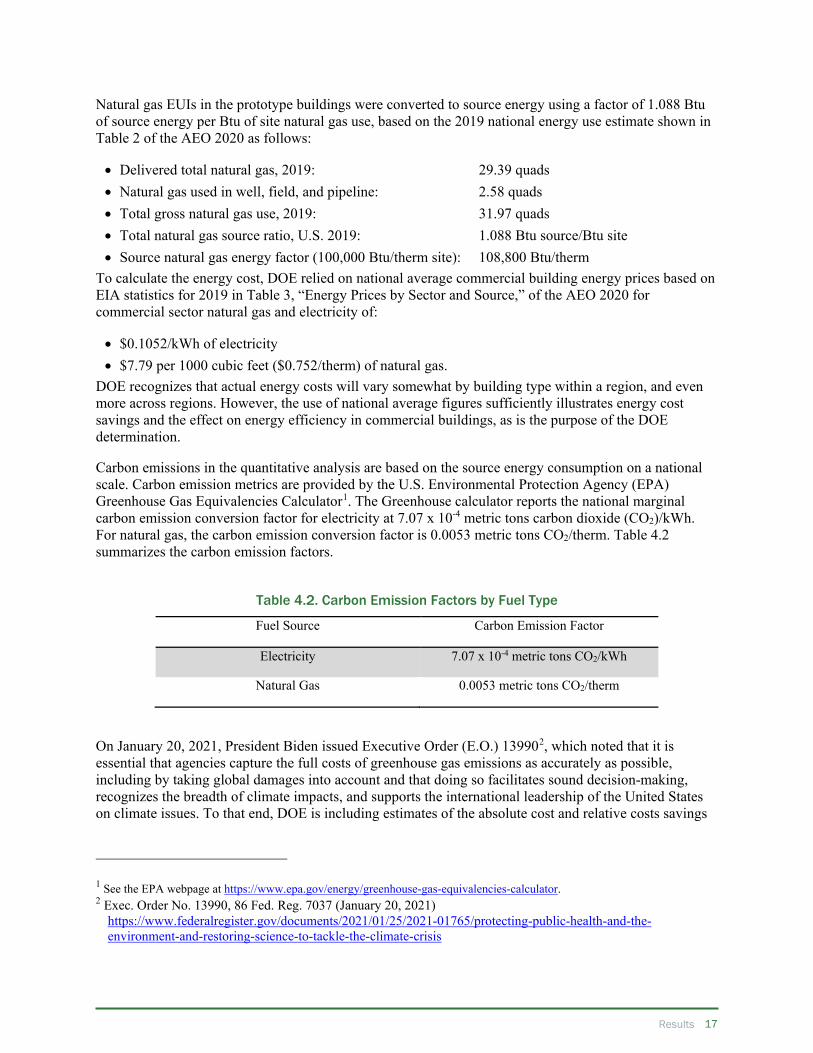
Natural gas EUIs in the prototype buildings were converted to source energy using a factor of 1.088 Btu of source energy per Btu of site natural gas use, based on the 2019 national energy use estimate shown in Table 2 of the AEO 2020 as follows:
• Delivered total natural gas, 2019: 29.39 quads • Natural gas used in well, field, and pipeline: 2.58 quads • Total gross natural gas use, 2019: 31.97 quads • Total natural gas source ratio, U.S. 2019: 1.088 Btu source/Btu site • Source natural gas energy factor (100,000 Btu/therm site): 108,800 Btu/therm
To calculate the energy cost, DOE relied on national average commercial building energy prices based on EIA statistics for 2019 in Table 3, “Energy Prices by Sector and Source,” of the AEO 2020 for commercial sector natural gas and electricity of:
• $0.1052/kWh of electricity • $7.79 per 1000 cubic feet ($0.752/therm) of natural gas.
DOE recognizes that actual energy costs will vary somewhat by building type within a region, and even more across regions. However, the use of national average figures sufficiently illustrates energy cost savings and the effect on energy efficiency in commercial buildings, as is the purpose of the DOE determination.
Carbon emissions in the quantitative analysis are based on the source energy consumption on a national scale. Carbon emission metrics are provided by the U.S. Environmental Protection Agency (EPA) Greenhouse Gas Equivalencies Calculator1. The Greenhouse calculator reports the national marginal carbon emission conversion factor for electricity at 7.07 x 10⁻⁴ metric tons carbon dioxide (CO2)/kWh. For natural gas, the carbon emission conversion factor is 0.0053 metric tons CO2/therm. Table 4.2 summarizes the carbon emission factors.
Table 4.2. Carbon Emission Factors by Fuel Type
Fuel Source Carbon Emission Factor
Electricity 7.07 x 10⁻⁴ metric tons CO2/kWh
Natural Gas 0.0053 metric tons CO2/therm
On January 20, 2021, President Biden issued Executive Order (E.O.) 139902, which noted that it is essential that agencies capture the full costs of greenhouse gas emissions as accurately as possible, including by taking global damages into account and that doing so facilitates sound decision-making, recognizes the breadth of climate impacts, and supports the international leadership of the United States on climate issues. To that end, DOE is including estimates of the absolute cost and relative costs savings
1 See the EPA webpage at https://www.epa.gov/energy/greenhouse-gas-equivalencies-calculator. 2 Exec. Order No. 13990, 86 Fed. Reg. 7037 (January 20, 2021)
https://www.federalregister.gov/documents/2021/01/25/2021-01765/protecting-public-health-and-the-environment-and-restoring-science-to-tackle-the-climate-crisis

18 Results
of greenhouse gas emissions associated with the building energy use examined in this analysis.
The principal greenhouse gas emission associated with commercial building energy use, as examined in this analysis, is CO2. DOE estimates the global social benefits of first year CO2 emission reductions using the SC-CO2 estimates presented in the Technical Support Document: Social Cost of Carbon, Methane, and Nitrous Oxide Interim Estimates under Executive Order 13990 (IWG 2021). These SC-CO2 estimates are interim values established under E.O. 13990 for use in benefit-cost analyses until an improved estimate of the impacts of climate change can be developed based on the best available science and economics. These SC-CO2 estimates are the same as those used in the Technical Support Document: Technical Update of the Social Cost of Carbon for Regulatory Impact Analysis Under Executive Order 12866 (IWG 2016), but are updated to 2020$. An unrounded value of $51.086 (2020$/Metric Ton CO2) is used in this analysis reflecting a SC-CO2 present value per metric ton of carbon dioxide emissions avoided in 2020 based on a 3% discount rate and the average global damage estimate from three integrated assessment models (IAMs).
Table 4.7 and Table 4.8 present the estimated percent energy and energy cost savings between the 2016 and 2019 editions of Standard 90.1 by building type and climate zone respectively.
Overall, the analysis indicates that Standard 90.1-2019 will result in increased energy efficiency in commercial buildings. On a weighted national average basis, Standard 90.1-2019 saves 4.7% site energy, 4.3% of source energy, 4.3% of energy cost, and 4.2% of carbon emissions and SC-CO2. Weighted national average savings results by building type and climate zone are shown in Figure 4 and Figure 5.
Of interest is the large site energy savings found in the Hospital prototype compared to source energy and cost savings. The majority of savings is due to Addendum v which requires acute care hospitals to recover chiller condenser heat to be used to offset space heating. This causes a large reduction in natural gas consumption, and a much smaller increase in electricity consumption required by the heat recovery chiller and pumping system (see Section B.2.5). Since the site-to-source conversion factor for electricity is almost three times that of natural gas and the cost per delivered Btu of electricity is about four times that of natural gas (see Section 4.2), the result is much higher savings for site energy than either of the other two metrics.

Results 19
Table 4.3. Estimated Energy Use Intensity by Building Type – Standard 90.1-2016
Building Type Prototype Building
Floor Area
Weight (%)
Whole Building Energy Metrics
Site EUI (kBtu/ft2-
yr)
Source EUI (kBtu/ft2-
yr)
ECI ($/ft2-yr)
Carbon Emission (tons/kft2-
yr)
SC-CO2 ($/kft2-yr)
Office Small Office 3.8% 27.1 77.6 $0.82 5.5 $275 Medium Office 5.0% 30.8 84.2 $0.88 5.9 $296 Large Office 3.9% 55.4 156.9 $1.65 11.1 $555
Retail Stand-Alone Retail 10.9% 48.4 114.4 $1.15 7.8 $389 Strip Mall 3.7% 52.8 133.8 $1.37 9.2 $462
Education Primary School 4.8% 43.4 107.4 $1.09 7.4 $369 Secondary School 10.9% 37.2 94.0 $0.96 6.5 $325
Healthcare Outpatient Health Care 3.4% 107.6 276.3 $2.84 19.1 $958 Hospital 4.5% 120.0 276.8 $2.77 18.7 $936
Lodging Small Hotel 1.6% 54.8 118.0 $1.16 7.8 $392 Large Hotel 4.2% 83.1 177.1 $1.73 11.7 $586
Warehouse Non-Refrigerated Warehouse 18.6% 15.7 33.2 $0.32 2.2 $110
Food Service
Quick Service Restaurant 0.3% 493.4 863.7 $7.87 53.7 $2,689
Full Service Restaurant 1.0% 336.5 649.8 $6.14 41.7 $2,090 Apartment Mid-Rise Apartment 13.7% 37.8 104.4 $1.09 7.3 $367
High-Rise Apartment 9.6% 41.3 92.0 $0.91 6.2 $308 National 100% 48.6 116.0 $1.17 7.9 $395

20 Results
Table 4.4. Estimated Energy Use Intensity by Building Type – Standard 90.1-2019
Building Type Prototype
Floor Area Weight
(%)
Whole Building Energy Metrics
Site EUI (kBtu/ft2-yr)
Source EUI (kBtu/ft2-yr)
ECI ($/ft2-yr)
Carbon Emission
(tons/kft2-yr)
SC-CO2 ($/kft2-yr)
Office Small Office 3.8% 25.6 73.2 $0.77 5.2 $259 Medium Office 5.0% 29.7 80.2 $0.83 5.6 $281 Large Office 3.9% 53.2 151.0 $1.59 10.7 $534
Retail Stand-Alone Retail 10.9% 46.1 106.3 $1.06 7.2 $359 Strip Mall 3.7% 51.0 127.6 $1.30 8.8 $440
Education Primary School 4.8% 40.9 101.1 $1.03 6.9 $348 Secondary School 10.9% 35.6 89.9 $0.92 6.2 $311
Healthcare Outpatient Health Care 3.4% 104.5 267.7 $2.75 18.5 $927 Hospital 4.5% 105.4 261.2 $2.66 17.9 $898
Lodging Small Hotel 1.6% 52.2 110.3 $1.07 7.3 $364 Large Hotel 4.2% 75.8 162.2 $1.59 10.7 $538
Warehouse Non-Refrigerated Warehouse 18.6% 15.5 32.5 $0.32 2.1 $107
Food Service Quick Service Restaurant 0.3% 492.5 860.9 $7.84 53.5 $2,679
Full Service Restaurant 1.0% 335.5 646.6 $6.11 41.5 $2,079 Apartment Mid-Rise Apartment 13.7% 36.5 101.5 $1.06 7.1 $358 High-Rise Apartment 9.6% 40.5 90.1 $0.89 6.0 $302 National 100% 46.3 111.0 $1.12 7.6 $379

Results 21
Table 4.5. Estimated Energy Use Intensity by Climate Zone – Standard 90.1-2016
Climate Zone
Climate Zone Floor Area Weight %
Whole Building Energy Metrics
Site EUI kBtu/ft2-yr
Source EUI kBtu/ft2-yr
ECI $/ft2-yr
Carbon Emission
tons/kft2-yr SC-CO2 $/kft2-yr
1A 3.9% 46.5 121.0 $1.25 8.4 $421 2A 16.9% 47.0 122.0 $1.26 8.5 $424 2B 2.5% 43.3 112.9 $1.16 7.8 $393 3A 14.9% 47.3 116.2 $1.18 8.0 $399 3B 8.7% 40.8 103.1 $1.06 7.1 $356 3C 2.1% 41.0 105.5 $1.08 7.3 $366 4A 20.9% 48.0 111.8 $1.12 7.6 $379 4B 0.4% 50.6 121.7 $1.23 8.3 $416 4C 3.4% 42.3 100.4 $1.01 6.8 $342 5A 17.6% 54.9 119.9 $1.18 8.0 $399 5B 4.6% 49.7 115.4 $1.15 7.8 $391 5C 0.1% 54.4 126.3 $1.26 8.5 $428 6A 3.2% 64.2 136.7 $1.33 9.0 $453 6B 0.5% 59.1 130.3 $1.28 8.7 $435 7 0.4% 69.9 147.0 $1.43 9.7 $485 8 0.03% 86.6 165.5 $1.56 10.6 $530
National 100% 48.6 116.0 $1.17 7.9 $395

22 Results
Table 4.6. Estimated Energy Use Intensity by Climate Zone – Standard 90.1-2019
Climate Zone
Climate Zone Floor Area Weight %
Whole Building Energy Metrics
Site EUI kBtu/ft2-yr
Source EUI kBtu/ft2-yr
ECI $/ft2-yr
Carbon Emission
tons/kft2-yr SC-CO2 $/kft2-yr
1A 3.9% 44.5 115.9 $1.19 8.0 $403 2A 16.9% 44.5 116.4 $1.20 8.1 $405 2B 2.5% 41.1 107.9 $1.11 7.5 $376 3A 14.9% 44.5 110.1 $1.12 7.6 $379 3B 8.7% 38.8 98.6 $1.01 6.8 $341 3C 2.1% 39.0 101.1 $1.04 7.0 $351 4A 20.9% 46.2 107.7 $1.08 7.3 $365 4B 0.4% 48.3 116.3 $1.18 7.9 $397 4C 3.4% 39.7 95.9 $0.97 6.5 $328 5A 17.6% 53.0 115.3 $1.13 7.7 $384 5B 4.6% 47.2 110.3 $1.11 7.5 $374 5C 0.1% 52.7 122.0 $1.22 8.2 $413 6A 3.2% 61.9 131.5 $1.28 8.7 $435 6B 0.5% 57.2 125.3 $1.23 8.3 $418 7 0.4% 67.4 141.2 $1.37 9.3 $466 8 0.03% 84.1 159.5 $1.50 10.2 $510
National 100% 46.3 111.0 $1.12 7.6 $379

Results 23
Table 4.7. Estimated Percent Energy Savings between 2016 and 2019 Editions of Standard 90.1 – by Building Type
Building Type Prototype Building
Floor Area
Weight (%)
Savings (%)
Site EUI Source EUI ECI
Carbon Emissions & SC-CO2
Office Small Office 3.8% 5.5% 5.7% 6.1% 5.7% Medium Office 5.0% 3.6% 4.8% 5.7% 5.0% Large Office 3.9% 4.0% 3.8% 3.6% 3.8%
Retail Stand-Alone Retail 10.9% 4.8% 7.1% 7.8% 7.7% Strip Mall 3.7% 3.4% 4.6% 5.1% 5.0%
Education Primary School 4.8% 5.8% 5.9% 5.5% 5.9% Secondary School 10.9% 4.3% 4.4% 4.2% 4.3%
Healthcare Outpatient Health Care 3.4% 2.9% 3.1% 3.2% 3.2% Hospital 4.5% 12.2% 5.6% 4.0% 4.0%
Lodging Small Hotel 1.6% 4.7% 6.5% 7.8% 7.0% Large Hotel 4.2% 8.8% 8.4% 8.1% 8.3%
Warehouse Non-Refrigerated Warehouse 18.6% 1.3% 2.1% 2.5% 2.4%
Food Service
Quick Service Restaurant 0.3% 0.2% 0.3% 0.4% 0.4% Full Service Restaurant 1.0% 0.3% 0.5% 0.5% 0.6%
Apartment Mid-Rise Apartment 13.7% 3.4% 2.8% 2.8% 2.6% High-Rise Apartment 9.6% 1.9% 2.1% 2.2% 2.2%
National 100% 4.7% 4.3% 4.3% 4.2%
Figure 4. Percentage Savings by Building Type from 90.1-2016 to 90.1-2019
0.0% 2.0% 4.0% 6.0% 8.0% 10.0% 12.0% 14.0%
Small OfficeMedium Office
Large OfficeStand-Alone Retail
Strip MallPrimary School
Secondary SchoolOutpatient Health Care
HospitalSmall HotelLarge Hotel
Non-Refrigerated WarehouseQuick Service Restaurant
Full Service RestaurantMid-Rise Apartment
High-Rise ApartmentWeighted National Average
Percentage Savings by Building Type
Site EUI Source EUI ECI Carbon Emissions and SC-CO2

24 Results
Table 4.8. Estimated Percent Energy Savings between 2016 and 2019 Editions of Standard 90.1 – by Climate Zone
Climate Zone
Climate Zone Floor Area Weight %
Savings (%)
Site EUI Source
EUI ECI
Carbon Emissions & SC-CO2
1A 3.9% 4.3% 4.2% 4.8% 4.2% 2A 16.9% 5.3% 4.6% 4.8% 4.5% 2B 2.5% 5.1% 4.4% 4.3% 4.3% 3A 14.9% 5.9% 5.2% 5.1% 5.1% 3B 8.7% 4.9% 4.4% 4.7% 4.2% 3C 2.1% 4.9% 4.2% 3.7% 4.0% 4A 20.9% 3.8% 3.7% 3.6% 3.7% 4B 0.4% 4.5% 4.4% 4.1% 4.4% 4C 3.4% 6.1% 4.5% 4.0% 4.2% 5A 17.6% 3.5% 3.8% 4.2% 3.9% 5B 4.6% 5.0% 4.4% 3.5% 4.3% 5C 0.1% 3.1% 3.4% 3.2% 3.5% 6A 3.2% 3.6% 3.8% 3.8% 3.9% 6B 0.5% 3.2% 3.8% 3.9% 3.9% 7 0.4% 3.6% 3.9% 4.2% 4.0% 8 0.03% 2.9% 3.6% 3.8% 3.9%
National 100% 4.7% 4.3% 4.3% 4.2%
Figure 5. Percentage Savings by Climate Zone from 90.1-2016 to 90.1-2019
0.0% 1.0% 2.0% 3.0% 4.0% 5.0% 6.0% 7.0%
1A2A2B3A3B3C4A4B4C5A5B5C6A6B
78
National
Percentage Savings by Climate Zone
Site EUI Source EUI ECI Carbon Emissions and SC-CO2

References 25
5. References 42 U.S.C. 6833. Chapter 42, U.S. Code, Section 6833. Available at http://www.gpo.gov/fdsys/pkg/USCODE-2011-title42/pdf/USCODE-2011-title42-chap81-subchapII.pdf.
42 U.S.C. 6831. Chapter 42, U.S. Code, Section 6831. Available at http://www.gpo.gov/fdsys/pkg/USCODE-2011-title42/pdf/USCODE-2011-title42-chap81-subchapII.pdf.
83 FR 8463. 2018. Federal Register Volume 83, Number 39 (February 27, 2018). Page 8463 – 8465. U.S. Government Publishing Office, Washington, D.C. Available at https://www.regulations.gov/document?D=EERE-2017-BT-DET-0046-0008.
ASHRAE. 2013. ANSI/ASHRAE Standard 169-2013. Climatic Data for Building Design Standards. American Society of Heating, Refrigerating, and Air-Conditioning Engineers, Atlanta, Georgia.
ASHRAE. 2016. ANSI/ASHRAE/IES 90.1-2016, Energy Standard for Buildings Except Low-Rise Residential Buildings. ASHRAE, Atlanta, GA.
ASHRAE. 2019. ANSI/ASHRAE/IES 90.1-2019, Energy Standard for Buildings Except Low-Rise Residential Buildings. ASHRAE, Atlanta, GA
BECP – U.S. Department of Energy, Building Energy Codes Program. 2020. Status of State Energy Code Adoption. Accessed February 14, 2020 at http://www.energycodes.gov/adoption/states.
DOE. 2018. EnergyPlus Energy Simulation Software, Version 9.0.1. U.S. Department of Energy, Washington, D.C. Accessed August 29, 2019 at https://energyplus.net/downloads.
DOE. 2017. Energy Savings Analysis: ANSI/ASHRAE/IES Standard 90.1-2016. Prepared by Athalye, R.A, M.A. Halverson, M.I. Rosenberg, B. Liu, J. Zhang, R. Hart, V.V. Mendon, S. Goel, Y. Chen, Y. Xie, and M. Zhao, Richland, WA, Pacific Northwest National Laboratory. https://www.energycodes.gov/sites/default/files/documents/02202018_Standard_90.1-2016_Determination_TSD.pdf.
DOE and PNNL. 2020. Commercial Prototype Building Models, Richland, WA, Pacific Northwest National Laboratory. Available at https://www.energycodes.gov/development/commercial/prototype_models.
EIA –U.S. Energy Information Administration. 2003. Commercial Buildings Energy Consumption Survey 2003. Energy Information Administration of U.S. Department of Energy, Washington, D.C. Available at http://www.eia.doe.gov/emeu/cbecs/contents.html.
EIA – U.S. Energy Information Administration. 2020. Annual Energy Outlook 2020. Energy Information Administration of U.S. Department of Energy, Washington, D.C. Available at https:/./www.eia.gov/outlooks/aeo/.
ICC – International Code Council. 2018. 2018 International Energy Conservation Code®. Washington D.C.
IWG - Interagency Working Group on Social Cost of Carbon. 2016. Technical Update of the Social Cost of Carbon for Regulatory Impact Analysis Under Executive Order 12866. United States Government. Available at https://www.epa.gov/sites/production/files/2016-12/documents/sc_co2_tsd_august_2016.pdf.
26 References
IWG - Interagency Working Group on Social Cost of Carbon. 2021. Social Cost of Carbon, Methane, and Nitrous Oxide. Interim Estimates under Executive Order 13990. United States Government. Available at https://www.whitehouse.gov/wp-content/uploads/2021/02/TechnicalSupportDocument_SocialCostofCarbonMethaneNitrousOxide.pdf.
Lei, X, JB Butzbaugh, Y Chen, J Zhang, and MI Rosenberg. 2020. Development of National New Construction Weighting Factors for the Commercial Building Prototype Analyses (2003-2018). PNNL-29787. Pacific Northwest National Laboratory, Richland, WA. https://www.pnnl.gov/main/publications/external/technical_reports/PNNL-23269.pdf.
Thornton B.A., M.I. Rosenberg, E.E. Richman, W. Wang, Y. Xie, J. Zhang, H. Cho, VV Mendon, R.A. Athalye, and B. Liu. 2011. Achieving the 30% Goal: Energy and Cost Savings Analysis of ASHRAE Standard 90.1-2010. PNNL-20405. Richland, WA: Pacific Northwest National Laboratory. https://www.energycodes.gov/sites/default/files/documents/BECP_Energy_Cost_Savings_STD2010_May2011_v00.pdf.

A.1 Appendix A
PRELIMINARY ENERGY SAVINGS ANALYSIS ANSI/ASHRAE/IES STANDARD 90.1-2019
Appendix A: Addenda Not Quantified in Energy Savings Analysis
Addendum Sections Affected Description of Change Discussion
bg 9.3 Adds a simplified building method for interior lighting in offices, schools, and retail buildings, and exterior lighting.
Changed provisions are an alternative to the existing requirements.
b 5.5.3.1.1 Updates reference to ANSI/CRRC S100 “Standard Test Methods for Determining Radiative Properties of Materials.” References update only.
c 3.2 Adds rooftop monitors to the definition of fixed and operable vertical fenestration. Clarification only.
d Table G3.1 1c Modifies text to make it consistent with other portions of Appendix G for projects undergoing phased permitting.
Change applies to an alternative compliance path and does not affect the prescriptive or
mandatory requirements.
e Table G3.1 11f Adds direction that service water heater (SWH) piping losses shall not be modeled.
Change applies to an alternative compliance path and does not affect the prescriptive or
mandatory requirements.
f G3.1.2.1 Modifies text to require that the capacity used for selecting the system efficiency is based on the size of the actual zone instead of the size of
the zones as combined into a single thermal block.
Change applies to an alternative compliance path and does not affect the prescriptive or
mandatory requirements.
l Table G3.1.2.9 Adds requirements for fan break horsepower for two systems. Change applies to an alternative compliance path and does not affect the prescriptive or
mandatory requirements.
m Table G3.1 5b Lowers baseline building performance air leakage and sets an air
leakage value to be used in conjunction with the air barrier verification path.
Change applies to an alternative compliance path and does not affect the prescriptive or
mandatory requirements.
n 3.2 Removes 10 unused definitions and changes the definition of “unitary cooling equipment” to “unitary air conditioners.” Clarification only.
o
3.2, 4.2.2.3, 5.5.1, 5.5.2, 5.7, 5.8, 6.7, 7.7, 8.7, 9.7, 10.7,
Revises the submittals section of the envelope and power chapters for consistency across the Standard. Administrative provisions only.

A.2 Appendix A
Addendum Sections Affected Description of Change Discussion
11.7, G1.3
p Table 6.8.1-14 Revises the rating conditions for indoor pool dehumidifiers. Clarification to rating condition.
q 5.4.3, 5.5, 5.8.3
Clarifies and restructures air leakage requirements for the building envelope. Clarification only.
r G3.1.2.6 Specifies air economizer control types for Appendix G. Change applies to an alternative compliance path and does not affect the prescriptive or
mandatory requirements.
s 4.2.1.1, 11.4.3, G2.4.1
Modifies the Performance Cost Index (PCI) equation to implement a 5% limitation on renewable energy usage and clarifies what types of
renewable energy systems are eligible.
Change applies to an alternative compliance path and does not affect the prescriptive or
mandatory requirements.
x 4.2 Clarifies compliance paths for new construction, additions, and alterations. Clarification only.
y G3.1.2.2 Provides explicit guidance on how to conduct sizing runs for Appendix G.
Change applies to an alternative compliance path and does not affect the prescriptive or
mandatory requirements.
z 11.5, G3.1.2
Modifies the formulas in Section 11 and G3.1.2.1 for removing fan energy from baseline packaged heating and cooling efficiency ratings to
cap the system capacity equations in Section 11 to levels allowed in Section 6 and provide a fixed baseline efficiency rating for Appendix G.
Change applies to an alternative compliance path and does not affect the prescriptive or
mandatory requirements.
ab 3.2 Modifies definition of “door”, “entrance door”, “fenestration”, and “sectional garage door.” Clarification only.
ac 3.2 Clarifies use of defined terms to include the term with different tense or plurality. Clarification only.
ad
5, 6, 7, 8, 9,
10, 11, G
Clarifies the requirements for showing compliance using the methods in Sections 5‐10, or Section 11, or Appendix G. Clarification only.
ae 3.2, 6.4.3.6 Clarifies humidification and dehumidification control requirements. Clarification only.

A.3 Appendix A
PRELIMINARY ENERGY SAVINGS ANALYSIS ANSI/ASHRAE/IES STANDARD 90.1-2019
Addendum Sections Affected Description of Change Discussion
ag Table G3.1 12 Accounts for the inclusion of automatic receptacle controls in a proposed building design for spaces that are not required to have them.
Change applies to an alternative compliance path and does not affect the prescriptive or
mandatory requirements.
ah 9.1.4
Updates the language and terminology of the lighting wattage section to clarify application in modern lighting systems and equipment. Also adds
a section specifically to address using DC power over Cat6 structured cable for connection of LED lighting to a remote power supply.
Clarification only.
aj
3.2, 6.4.3, 6.5.1, 6.5.2, 6.5.4
Adds new definition “process application” and uses it throughout the Standard in place of “process load.” Clarification only.
ak Tables G3.4-1 to G3.4-8
Defines solar heat gain coefficient (SHGC) baseline for buildings in zones where there is no prescriptive maximum SHGC.
Change applies to an alternative compliance path and does not affect the prescriptive or
mandatory requirements.
al Table G3.1 4, Table G3.1 7,
G3.1.2.4
Modifies requirements in Appendix G to ensure that the intent of G3.1.1(c) (separate HVAC systems for unusual loads or schedules) is
met.
Change applies to an alternative compliance path and does not affect the prescriptive or
mandatory requirements.
aq
9.2.2.3, 9.4.1.3, 9.4.4, 9.6.2,
Clarifies lighting control requirements for applications not covered in Section 9.6.2. Clarification only.
ar
G3.1.2.9, Table G3.1 12, Table G3.5.5, Table G3.5.6, Table G3.6, Table G3.9,
Table G3.9.3
Cleans up the modeling requirements for pumps in Appendix G to address unresolved comments to Addendum di to Standard 90.1-2016.
Change applies to an alternative compliance path and does not affect the prescriptive or
mandatory requirements.
as New appendix I Adds informative appendix Additional Guidance for Verification, Testing, and Commissioning
Change applies to informative appendix and does not change normative requirements.
at 11.5, G1.2.2, Adds an exception for energy used to refuel or recharge offsite vehicles.
Change applies to an alternative compliance path and does not affect the prescriptive or
mandatory requirements.
az Table G3.1 17 Clarifies how to deal with refrigeration equipment rated under AHRI 1200 in Appendix G.
Change applies to an alternative compliance path and does not affect the prescriptive or
mandatory requirements.

A.4 Appendix A
Addendum Sections Affected Description of Change Discussion
ba Table G3.1 11
Establishes a methodology for determining the baseline flow rates on projects where service water-heating is demonstrated to be reduced by
water conservation measures that reduce the physical volume of service water required, such as with low-flow showerheads.
Change applies to an alternative compliance path and does not affect the prescriptive or
mandatory requirements.
bf 5.4.3.4, 10.4.5, App E
Allows self-closing doors with air curtains as an alternative to vestibules for particular climate zones and building heights.
Changed provisions are alternative to the existing and unchanged ones.
bh 5.4.3.2, Table 5.8.3.2 Corrects omissions from Addendum q. Clarification only.
bi
11.4.1.4, 12,
C3.1.4, G2.4.4
Updates reference to Standard 140 and makes clarifications regarding application of Standard 140.
Change applies to an alternative compliance path and does not affect the prescriptive or
mandatory requirements.
bj 6.5.5.1 Adds equipment covered by Tables 6.8.1-9 through 6.8.1-16 to the list of exceptions from heat rejection requirements. Clarification only.
bk 3.2,
11.4.3.2, G2.4.2
Defines onsite electricity generation systems and clarifies that systems using the performance path must use the same electricity generation systems in the baseline as in the proposed design, except for onsite
renewable generation systems.
Change applies to an alternative compliance path and does not affect the prescriptive or
mandatory requirements.
bl Table 6.8.1.1 Updates efficiency requirements for Table 6.8.1-1 Electrically Operated Unitary Air Conditioners and Condensing Units.
Change will not be effective within three years from the publication of Standard 90.1-2019.
bm 6.4.1.1, Tables
6.8.1.2 and 6.8.1.17
Removes water, evaporatively, and ground cooled heat pumps from Table 6.8.1.2 and establishes their efficiency requirements in new table
6.8.1.18. Updates efficiency requirements for all heat pumps.
Change will not be effective within three years from the publication of Standard 90.1-2019.
bn 3.2, Tables 6.8.1.4, F1, and F3.
Adds new definitions for CEER, CCOPc, and Off-mode power consumption. Updates efficiency for PTAC, PTHP, SPVAC, SPVHP,
and room air conditioners. Updates federally regulated equipment efficiency in Appendix F.
Change will not be effective within three years from the publication of Standard 90.1-2019.
bs Tables 7.8 and F-2 Updates water heater requirements in Tables F2 and 7.8 to align with new federal requirements.
Change aligns with recent federal rulemaking that impacts the categorizations and
performance rating method of service water heaters but not (intended) the stringency of the
requirements.
bt Table 4.2.1.1 Updates Building Performance Factors used to show compliance with Appendix G.
Change applies to an alternative compliance path and does not affect the prescriptive or
mandatory requirements.

A.5 Appendix A
PRELIMINARY ENERGY SAVINGS ANALYSIS ANSI/ASHRAE/IES STANDARD 90.1-2019
Addendum Sections Affected Description of Change Discussion
bu
G3.1.1, G3.1.3.2, G3.1.3.3, G3.1.3.6,
G3.1.3.10, G3.1.3.11,
G3.1.3.12, Tables 4.2.1.1, G3.1.1-1, G3.4-1, G3.4-2, G3.4-3, G3.4-4, G3.4-5, G3.4-6, G3.4-7, G3.4-8.
Changes references from spaces to zones, corrects a conflict on heating source, clarifies when separate baseline systems are required, removes redundant footnote in Tables 4.2.1.1, G3.1.1-1, G3.4-1, corrects errors
in subsection title headings.
Change applies to an alternative compliance path and does not affect the prescriptive or
mandatory requirements.
bv
3.2, 6.2.1, 6.6.1,
6.6.6.1, 6.6.1.2, 6.6.1.3, 8.2.1, 8.6.1
Deletes computer room alternative compliance option in Standard 90.1 and instead allows an alternative path of complying with ASHRAE
Standard 90.4 for electrical and mechanical components in computer rooms greater than 10 kW.
Changed provisions are alternative to the existing and unchanged ones.
bx A6.1, Table A6.3.1-1
Adds F-factors for heated slabs that are uninsulated or insulated only under slab.
Additional factors for condition combinations not currently covered and do not change
requirements.
bz
3.2, C1.4, C2.7,
C3.1.2, C3.3,
C3.5.5.1, C3.5.8
Modifies Appendix C Envelope Tradeoff. Change applies to an alternative compliance path and does not affect the prescriptive or
mandatory requirements.
ca Table A3.2.3 Adds U-factors to Table A3.2.3 for use of continuous insulation on metal building walls with double layer cavity insulation Clarification only.
cc A9.4.6 Clarifies the limitations of the calculation procedures in A9.4.6. Clarification only.
ce 6.5.3.1.2 Removes one of three criteria for fan motor selections. Changed provisions are alternative to the existing and unchanged ones.
cf 6.4.5 Adds vacuum insulating glazing to the list of options for reach-in doors in walk-in coolers and freezers.
Changed provisions are alternative to the existing and unchanged ones.
ch 3.2, 9.4.1.1
Addresses two areas of uncertainty in the definitions of daylighted zones. Clarification only.

A.6 Appendix A
Addendum Sections Affected Description of Change Discussion
ci Table 4.2.1.1 Updates the Building Performance Factors that are used for compliance with Appendix G.
Change applies to an alternative compliance path and does not affect the prescriptive or
mandatory requirements.
cj Table 11.5.1,
Table G3.1, Table G3.7
Makes three specific changes to the lighting provisions of the Energy Cost Budget Method and the specific changes to the lighting provisions
of Appendix G.
Change applies to an alternative compliance path and does not affect the prescriptive or
mandatory requirements.
cl
3.2, 11.4.1, 11.4.1.1, 11.4.1.2,
11.4.2, 11.4.5, 11.5.2, 11.7, Table
11.5.1, Table 11.5.2-1, Table 11.5.2-3, Table
11.5.2-5
Makes changes throughout Section 11 to better align with Appendix G providing greater consistency between the two sections.
Change applies to an alternative compliance path and does not affect the prescriptive or
mandatory requirements.
cq 6.4.1.3 (new) Adds requirements for large-diameter ceiling fans to be rated in accordance with certain test methods.
Requires fans to be rated, but includes no minimum efficiency requirement.
cs Appendix E Makes many edits and updates to Informative References. References update only.
ct 12 Updates the revision date for Acceptance Test Code for open circuit cooling towers. References update only.
cu 6.4.1.4, 6.4.7 (new)
Adds 6.4.7 to require that liquid to liquid heat exchangers that fall under the scope of AHRI 400 be rated in accordance with AHRI 400. Deletes
Table 6.8.1-8 which included the same rating requirement. References update only.
cy 9.4.1 Clarifies language in an exception to the sidelighting requirements and adds natural objects to the exception. Primarily a clarification.

Appendix B B.1
Appendix B: Modeling of Individual Addenda This appendix details the modeling of the 17 addenda to Standard 90.1-2016 simulated for the quantitative analysis. They are a subset of the addenda listed in Table 4.1 and marked as “Included in Quantitative Analysis”. In the cases where individual addenda modify the same section of Standard 90.1, these addenda are discussed together. The procedures for implementing the addenda into the Standard 90.1-2016 and 90.1-2019 prototype models include identifying the changes to the prototypes required by each addendum, developing model inputs to simulate those changes, applying those changes to the prototype models, running the simulations, and extracting and post-processing the results. This section explains the addenda and their impact on energy savings, the modeling strategies, and the development of the simulation inputs for EnergyPlus. The terms “baseline” and “advanced” are used in some cases to describe the modeling of the addenda. The baseline case is Standard 90.1-2016 and the advanced case is Standard 90.1-2019. In some instances, a new addendum to Standard 90.1-2016 identifies the need for a change to baseline 2016 models. There are generally two reasons why a baseline change was necessary: (1) in the course of modeling an addendum, an opportunity to increase the accuracy of the simulation was identified and (2) to add additional detail to the models so that the impact of a particular addendum could be captured. For example, prior to the simulation of the 2019 Standard, ventilation in the Mid-rise and High-rise Apartment prototypes was changed from through the space air conditioning systems to through an exhaust-driven ventilator. This allows the accurate simulation of Addendum ay, which requires residential systems to have heat recovery.
Building Envelope Addenda B.1.1 Addendum aw: Fenestration U and SHGC Addendum Description. Addendum aw revises the prescriptive U-factor and solar heat gain coefficient (SHGC) requirements in Tables 5.5-0 through 5.5-8 for vertical fenestrations and skylights. It also modifies the vertical fenestration categories from “Nonmetal,” “Metal fixed,” “Metal operable,” and “Metal entrance door” to “Fixed,” “Operable,” and “Entrance Door.” The adjusted categorization is independent of frame material type, provides increased consistency with the International Energy Conservation Code (IECC), and helps facilitate alignment of 90.1 and IECC criteria. The revised SHGC values for operable and vertical fenestrations are slightly lower than those for fixed ones, which is to acknowledge the fact that operable windows have a larger frame-to-glass ratio and therefore lower SHGC values with the same glazing type. The addendum generally reduces U-factor for fixed metal framed windows; however; it also increases the U-factor for non-metal framed windows. Since the predominant framing is metal in commercial construction, the average U-factor is reduced, in turn reducing heat loss and gain for commercial buildings, which provides an overall reduction in both annual and peak heating and cooling loads. SHGC is slightly reduced overall, contributing further to a reduction in cooling load and energy use.
Modeling Strategy. All the prototypes have vertical fenestration (i.e., windows), and four (Stand-alone Retail, Primary School, Secondary School, and Non-refrigerated Warehouse) have skylights, which are all modeled using U-factor and SHGC inputs to WindowMaterial:SimpleGlazingSystem objects in EnergyPlus. To capture the window requirements with different categorizations introduced by this addendum, weighting factors of different window categories as shown in Table B.1 were used to calculate weighted U-factor and SHGC values for each prototype based on recent market data from Ducker.1 The weighting factors are slightly updated from those used in the previous analyses (Thornton et al. 2011). Although the required minimum ratio of visible transmittance (VT) to SHGC (VT/SHGC) is not changed
1 Detailed market data from https://www.ducker.com/ were processed by the SSPC90.1 Envelope Subcommittee.

B.2 Appendix B
PRELIMINARY ENERGY SAVINGS ANALYSIS ANSI/ASHRAE/IES STANDARD 90.1-2019
by the addendum, the new SHGC values result in different VT inputs in the prototypes.
Table B.1. Weighting Factors of Different Windows Categorized in 90.1-2016 and 90.1-2019
Vertical fenestration categories in 90.1-2016
Vertical fenestration categories in 90.1-2019
Building Prototype Nonmetal Metal - Fixed
Metal - Operable
Fixed Operable
Small Office 2.5% 95.7% 1.8% 96.9% 3.1% Medium Office 2.5% 95.7% 1.8% 96.9% 3.1%
Large Office 2.5% 95.7% 1.8% 96.9% 3.1% Stand-alone Retail 2.6% 96.2% 1.2% 97.8% 2.2%
Strip Mall 2.6% 96.2% 1.2% 97.8% 2.2% Primary School 7.5% 86.6% 5.8% 89.8% 10.2%
Secondary School 7.5% 86.6% 5.8% 89.8% 10.2% Outpatient Healthcare 3.1% 94.6% 2.3% 95.9% 4.1%
Hospital 3.1% 94.6% 2.3% 95.9% 4.1% Small Hotel 5.8% 89.7% 4.5% 92.0% 8.0% Large Hotel 5.8% 89.7% 4.5% 92.0% 8.0%
Non-Refrigerated Warehouse 2.4% 96.1% 1.5% 97.4% 2.6% Quick Service Restaurant 2.6% 96.2% 1.2% 97.8% 2.2% Full Service Restaurant 2.6% 96.2% 1.2% 97.8% 2.2%
Mid-Rise Apartment 17.3% 68.7% 14.0% 75.4% 24.6% High-Rise Apartment 17.3% 68.7% 14.0% 75.4% 24.6%
Heating, Refrigerating, and Air-Conditioning Addenda B.2.1 Addendum a: Outdoor and Return Dampers Addendum Description. Addendum a makes a few clarification changes such as modifying the term “ventilation air” to “outdoor air.” It also improves energy efficiency by requiring return dampers to meet Table 6.4.3.4.3, which means a lower leakage rate from return air to supply air than Standard 90.1-2016. This improves economizer operation by increasing the outside air entering the system during economizer mode, as leaky return air dampers result in mixing of some return air back into the mixed air, even when dampers are fully closed. In addition, an exception is added to Section 6.4.3.4.2. Without this exception, a system with continuous ventilation intake needs to have an outdoor air damper, which creates a pressure drop. With the exception, such a system without the outdoor air damper would have lower pressure drop and therefore less fan energy consumption.
Modeling Strategy. When air-side economizers are modeled in single-zone unitary systems in the baseline prototypes, their maximum fraction of outdoor over design supply air is modeled to be 70% based on field measurements for unitary systems (Davis et al. 2002), which limits the maximum outdoor air flow during economizer operation. With the lower leakage damper required by the addendum, the improvement in the economizer option is modeled as an increase in the maximum outdoor air fraction from 70% to 75%, which is approximated based on the relationship between damper leakage rates and opening positions of sample products. The savings were only captured for single-zone systems with economizers. In some systems, the design outdoor air flow fraction is already higher than 70% due to zone exhaust or ventilation needs; therefore, the impacts of the addendum on these systems are not

Appendix B B.3
modeled. Similarly, for multiple-zone variable air volume (VAV) systems, the modeled maximum outdoor air fraction is already 100%; therefore, the impacts on these are not captured.
Although the added exception to Section 6.4.3.4.2 could theoretically result in a pressure drop reduction for fans with continuous operation, the Fan Power Limitation calculation method is used in the prototypes to calculate the fan pressure drop, which only allows pressure adjustments for devices listed in Table 6.5.3.1-2 Fan Power Limitation Pressure Drop Adjustment. Because the outdoor air dampers are not in the table, the energy savings impacts were not captured.
B.2.2 Addendum g: Occupied Standby Controls Addendum Description. Standard 90.1-2016 Section 9.4.1.1 (see Table 9.6.1) already requires occupancy sensors for lighting control in certain spaces, but the available occupancy status is not required to control heating, ventilating, and air conditioning (HVAC) systems except for hotel/motel guest rooms (see Section 6.3.3.3.5). Standard 62.1-2016, referenced by Standard 90.1-2019, introduced a new definition for occupied-standby mode: when a zone is scheduled to be occupied and an occupant sensor indicates zero population within the zone. It now allows outside air ventilation to be shut off in occupied-standby mode for many occupancy categories including office and conference/meeting spaces (see Note H in Table 6.2.2.1 Minimum Ventilation Rates in Breathing Zone in Standard 62.1-2016). Addendum g requires zones that already have occupancy sensors and qualify for the occupied-standby mode to automatically enter an occupied standby mode, during which the zones should have a heating and cooling thermostat setback of 1°F and should completely shut off HVAC supply air within the deadband.
Addendum g provides energy savings for VAV systems by significantly reducing deadband airflow and thereby reducing fan, cooling, and reheat energy during the occupied-standby mode. Before this addendum, the full minimum amount of air was delivered to empty zones during the occupied-standby mode, resulting in excessive reheat to maintain temperature. Energy is saved by reducing reheat, primary air cooling, and fan use for unneeded airflow. Single-zone, dedicated outdoor air systems (DOAS) and other HVAC systems experience similar savings through shut off of airflow to temporarily unoccupied spaces unless there is a demand for thermal conditioning.
Modeling Strategy. Each thermal zone in the prototypes is mapped to an occupancy category defined in Table 6.2.2.1 in Standard 62.1-2016 and a space type defined in Table 9.6.1 in Standard 90.1-2019. The two were crossed checked to identify the zones that are required to have occupancy sensors for lighting control and their occupancy category qualifies for occupied-standby mode. They include enclosed office, conference/meeting, corridor, and lobby spaces. Because lobby and corridor spaces are not expected to be often in occupied-standby mode, the savings to these were ignored. For prototypes without detailed space type zoning such as the three office prototypes, selected zones were designated to represent the collective impacts on the prototypes.
The occupancy schedules of the impacted zones were adjusted to have a few hours of occupied-standby mode per day as baseline enhancements based on occupancy profile data from literature and engineering judgment. In the advanced models, the thermostat schedules were set to have the setback of 1°F during the standby hours. During occupied-standby mode, the single-zone HVAC systems were modeled with the supply air flow cycling with thermal load and not providing ventilation. For multiple-zone VAV systems, standby mode was modeled with the minimum VAV box damper position and the zone ventilation set to zero that results in system outdoor air flow reduction through the Ventilation Rate Procedure. The impacted prototypes include Small Office, Medium Office, Large Office, Primary School, Secondary School, Outpatient Healthcare, Small Hotel, Mid-Rise Apartment, and High-Rise Apartment.
B.2.3 Addenda h and ay: ERV Sizing and Residential Energy Recovery Addendum Description. Standard 90.1-2016 already has requirements for exhaust air energy recovery

B.4 Appendix B
PRELIMINARY ENERGY SAVINGS ANALYSIS ANSI/ASHRAE/IES STANDARD 90.1-2019
for ventilation systems based on the design supply fan airflow rate and the ratio of outdoor airflow rate to fan supply airflow rate at design conditions. Dwelling units are subject to the criteria in Table 6.5.6.1-2 Exhaust Air Energy Recovery Requirements for Ventilation Systems Operating Greater than or Equal to 8000 Hours per Year. There has been confusion as to whether heating or cooling design should be used for sizing an energy recovery ventilator (ERV).
Addendum h clarifies that the ERV equipment should meet the greater enthalpy recovery ratio (ERR) of either heating or cooling, unless one mode is specifically excluded for the climate zone by exception. This addendum is primarily a clarification.
Addendum ay provides new requirements for the nontransient dwelling unit (apartment) ERV that are distinct from other commercial buildings. Dwelling unit energy recovery uses different equipment than general commercial spaces and has a different cost effectiveness, so the addenda resulted in the ERV being required in more climate zones than under the commercial requirements. Based on the SSPC 90.1 analysis, climate zone 3C is completely exempt, while the energy recovery device selection is based on heating only in climate zones 4 through 8 and cooling only in climate zones 0 through 2. Climate zones 3A and 3B must meet both heating and cooling requirements. Smaller apartments—less than 500 square feet—are exempt in climate zones 0 through 3 and 4C and 5C.
The ERV provides energy savings by pre-heating or pre-cooling incoming outside air for ventilation using the heat energy in the exhaust air stream. Pre-treatment of the outside air reduces the energy use by the heating and cooling systems. While there is some increase in fan energy use, this is partially offset by reduced exhaust fan operation for ventilation. Overall, in the climate zones where it is required, exhaust air energy recovery will save more heating and cooling energy than the fan energy increase. The addendum specifies an enthalpy recovery ratio of at least 50% at cooling design conditions and at least 60% at heating design conditions. There are several exceptions to these requirements. The addendum increases the number of climate zones and situations where exhaust air energy recovery is required in apartments, dormitories, and residential institutions.
Modeling Strategy. All apartment units modeled in the Mid-Rise Apartment and High-Rise Apartment prototypes meet the definition of nontransient dwelling unit and their sizes are all above 500 square feet. Continuous ventilation of 55 cubic feet per minute (cfm) is provided to each dwelling unit. To better represent the typical design practice, the prototypes were recently modified from supplying ventilation airflow through the unitary air conditioner in the Mid-Rise Apartment and the water source heat pump for the High-Rise Apartment to having a local exhaust-driven ventilator in each unit. In the enhanced models, space conditioning systems cycle with thermal loads. The ventilator fan airflow rate (i.e., the outdoor airflow rate) is 55 cfm. Without an ERV, the fan power of the ventilator is estimated to be 44 Watts per unit, which is modeled with fan efficiency and pressure drop inputs in the simulation model. When an ERV is installed, an additional pressure drop is approximated to result in added fan power of 51 Watts based on a review of residential heat/energy recovery ventilator products.
The baseline prototypes, as shown in Table B.2, are required to have heat recovery ventilators (HRV) or ERVs in colder and dry climate zones. Addendum ay now requires all dwelling units to have ERVs except for climate zone 3C, and it also has different minimum ERRs for heating and cooling, as summarized in Table B.2.
EnergyPlus requires inputs in terms of heat recovery effectiveness. In order to convert the ERR values at local design conditions to effectiveness, representative data from equipment manufacturers with both ERR and effectiveness were reviewed. Both Addenda h and ay specify ERR at the local design condition rather than at an Air Conditioning, Heating, and Refrigeration Institute (AHRI) standard rating condition. Some adjustment factors from rated ERR to that at the local design conditions were derived from the product review, and these were used to calculate climate-specific heat recovery effectiveness inputs as

Appendix B B.5
shown in Table B.3.
Table B.2. The Modeled ERVs in the Mid-Rise and High-Rise Apartments for 90.1-2016 and 90.1-2019
Climate zones 90.1-2016 Table 6.5.6.1-2 90.1-2019 Section 6.5.6.1.1
Required Required Enthalpy recovery ratio (ERR)
Cooling Heating 0A No Yes 50% No minimum 0B No Yes 50% No minimum 1A No Yes 50% No minimum 1B No Yes 50% No minimum 2A No Yes 50% No minimum 2B No Yes 50% No minimum 3A No Yes 50% 60% 3B No Yes 50% 60% 3C NR Exempt NA NA 4A Yes Yes No minimum 60% 4B No Yes No minimum 60% 4C No Yes No minimum 60% 5A Yes Yes No minimum 60% 5B No Yes No minimum 60% 5C No Yes No minimum 60% 6A Yes Yes No minimum 60% 6B Yes* Yes No minimum 60% 7 Yes* Yes No minimum 60% 8 Yes* Yes No minimum 60%
* Even though cooling energy recovery is exempted, the installed HRV for heating will save sensible cooling energy.

B.6 Appendix B
PRELIMINARY ENERGY SAVINGS ANALYSIS ANSI/ASHRAE/IES STANDARD 90.1-2019
Table B.3 Heat Recovery Effectiveness for Standard 90.1-2016 and 90.1-2019 Based on Required Design EER for Mid-Rise and High-Rise Apartment Prototypes
90.1-2016 90.1-2019
Climate zones 4A, 5A, 6A 6B, 7, 8 0, 1,
2A, 3A 2B 3B 4 thru 8
Design condition used for sizing ERR Cooling Heating Cooling Cooling Cooling Heating
Required ERR at local design conditions 50% 50% 50% 50% 50% 60%
Sensible Eff. at 100% Heating Air Flow 0.67 0.50 0.67 0.63 0.62 0.60
Latent Eff. at 100% Heating Air Flow 0.45 0.00 0.45 0.38 0.35 0.00
Sensible Eff. at 75% Heating Air Flow 0.70 0.53 0.70 0.67 0.66 0.62
Latent Eff. at 75% Heating Air Flow 0.50 0.00 0.50 0.43 0.40 0.00
Sensible Eff. at 100% Cooling Air Flow 0.66 0.50 0.66 0.62 0.61 0.60
Latent Eff. at 100% Cooling Air Flow 0.41 0.00 0.41 0.33 0.31 0.00
Sensible Eff. at 75% Cooling Air Flow 0.69 0.52 0.69 0.66 0.64 0.62
Latent Eff. at 75% Cooling Air Flow 0.45 0.00 0.45 0.38 0.35 0.00
B.2.4 Addendum k: Hotel/Motel HVAC Guest Room Controls Addendum Description. Standard 90.1-2016 already requires hotel/motel guest rooms to have automatic setback thermostat setpoint and shut off ventilation for rooms that are either rented and unoccupied, or unrented and unoccupied. Addendum k clarifies the language by calling out the two modes with the same intent, and the clarification does not have quantifiable energy impacts. The addendum saves a little bit more energy by reducing the time-out period for unoccupied indication from 30 minutes to 20 minutes. Consequently, there will be 10 minutes more per cycle with reduced ventilation and setback heating and cooling, reducing energy use.
Modeling Strategy. The baseline Small Hotel and Large Hotel prototypes were already modeled to meet the control requirements through thermostat and ventilation schedules. The schedules in their advanced models were slightly adjusted to capture the added savings from the reduced time-out period.
B.2.5 Addenda v and bd: Heat Recovery Chiller and Its Efficiency Addendum Description. Addendum v adds a new code section that requires acute inpatient hospital mechanical systems to include heat recovery for space conditioning in all climate zones except 6B, 5C, 7 and 8. The requirement is limited to hospitals that include spaces that are used on a 24-hour basis and have an installed total design chilled water capacity at design conditions that exceed 300 tons (1,100 kW). The cooling capacity of the heat recovery system is required to be 7% of the total design chilled water capacity at peak design conditions.
Addendum bd adds new minimum performance requirements for air- and water-cooled heat pump chillers. The new requirements are split between two categories: cooling-only performance and heating operation. While cooling-only requirements have been defined as being the same as defined in Table

Appendix B B.7
6.8.1-3 less 5% (to take into account the impact of additional hardware needed for heat recovery), the heating performance of these machines is described by three new metrics defined in AHRI Standard 550/590: heating coefficient of performance (COPH), heat recovery coefficient of performance (COPHR) and simultaneous heating and cooling coefficient of performance (COPSHC).
Modeling Strategy. The only prototype that is targeted by the language in Addendum v is the Hospital. As per the addendum description, since the total design chilled water capacity at design conditions exceeds 300 tons in all climate zones, heat recovery chillers were modeled in all Hospital models except in 6B, 5C, 7 and 8.
Different configurations can be employed with a heat recovery chiller, such configurations include “preferential loading” or “sidestream.” In the “preferential loading” configuration, the chiller is in parallel with the other chillers, whereas in the “sidestream” configuration, the heat recovery chiller is placed in series, ahead of the other chillers; it pre-cools some of the water returning from the cooling coils. This configuration is typically preferred and hence was chosen for modeling the impact of Addendum v.
Heat recovery chillers can have a single or a double condenser bundle. The former allows the chiller to transfer the condenser heat to a hot water loop, whereas the latter allows the chiller to transfer heat to both a hot and a condenser water loop. By having the ability to reject heat to a condenser loop, the chiller heat transferred to the hot water loop can be modulated to not operate above a specific inlet water temperature and/or controlled to meet a setpoint. A double-bundled chiller was modeled to estimate the impact of Addendum v.
In EnergyPlus, most chiller objects have heat recovery capabilities whether it is through the condenser bundle or through a dedicated heat recovery bundle (double-bundled chiller). To model such a configuration, that is a “sidestream” double-bundled chiller, heat is recovered from the chiller through a dedicated heat recovery loop which is transferred to the hot water loop using an ideal water heater with (with 100% efficiency, acting as an ideal fluid-to-fluid heat exchanger). The second bundle of the chiller is connected to the condenser water loop.
To benefit from heat recovery, a hot water loop setpoint reset strategy was implemented: 140°F at 20°F outdoor air dry-bulb temperature moving linearly to 120°F at 50°F outdoor air dry-bulb temperature. A reset strategy was also implemented for the chilled water loop: 44°F at 70°F outdoor air dry-bulb moving linearly to 48°F at 55°F outdoor air dry-bulb. Ideally, the heat recovery chiller operation would be controlled based on the desired water temperature leaving the heat recovery bundle, but this strategy is not currently available in EnergyPlus. As a solution, the heat recovery chiller was simulated to provide a maximum water temperature of 120°F and controlled based on the return water temperature and hot water loop load relative to the chiller heat recovery output to minimize excess heat rejection. This control strategy was implemented in an EnergyPlus energy management system (EMS) program.
B.2.6 Addendum ap: SAT Reset Addendum Description. HVAC systems with simultaneous heating and cooling (typically multiple-zone VAV systems) were previously required to provide supply air temperature (SAT) reset except in climate zones 0A through 3A. In these climate zones, several approaches can successfully dehumidify the outside air while still providing SAT reset and reducing reheat energy use. Addendum ap extends the requirement for SAT reset to the warm and humid climate zones where it was previously excepted. The dehumidification requirements of addendum ap can be met with either a separate outside air cooling coil or alternative approaches including bypassing return air around the cooling coil, a dedicated outside air system, or series heat recovery.
Units smaller than 3000 cfm are excepted from SAT reset in climate zones 0A, 1A and 3A, with units smaller than 10,000 cfm excepted in 2A. There are also requirements that the system is designed to allow

B.8 Appendix B
PRELIMINARY ENERGY SAVINGS ANALYSIS ANSI/ASHRAE/IES STANDARD 90.1-2019
simultaneous SAT reset and dehumidification with one of the strategies discussed above.
Supply air temperature reset saves significant heating energy in VAV reheat systems that require minimum airflow for ventilation. That savings is higher in northern climate zones than in climate zones 0A through 3A, which were previously excepted because outside air dehumidification—typically performed with a low dewpoint on the supply air—is required much of the year. Dehumidification can be achieved more efficiently by separately dehumidifying the outside air, as it reduces the total volume of air that must be cooled, significantly reducing cooling energy use in all the warm and humid climate zones and allowing SAT reset that reduces reheat energy use.
Modeling Strategy. Seven prototypes have multiple-zone VAV systems, and only Hospital and Outpatient Healthcare include a few air handling units (AHUs) with active dehumidification control modeled with a zone humidistat that triggers the central cooling coils to reduce the setpoint, increasing latent cooling during dehumidification. These AHUs are not modeled with SAT reset for all climates because its interaction with the dehumidification controls and the energy use cannot be captured using the prototype models without significant custom modeling and testing. All other VAV systems are modeled with SAT reset except for 0A, 1A, 2A, and 3A, which meet the current SAT reset requirements and exceptions in Standard 90.1-2016.
To capture the savings to the AHUs without active dehumidification control, the sample HVAC system designs in the Informative Note in Addendum ap were not used. It was found that simply adding outdoor-air-temperature-based SAT reset controls to the VAV AHUs in Climate Zones 0A, 1A, 2A, and 3A was sufficient to estimate savings and did not cause much increase to the indoor humidity level.
B.2.7 Addenda au, cm, and co: DDC VAV Minimum Damper and Simplified Ventilation Procedure Addendum Description. Addendum co reflects the periodic update of Standard 90.1 normative references. It updates many references with new effective dates and adds some new references. One of them (i.e., the Addendum f to Standard 62.1-2016, Ventilation for Acceptable Indoor Air Quality), in particular, creates a “Simplified Procedure” to determine system ventilation efficiency. Addenda au and cm take advantage of the changes in Standard 62.1 to reduce the minimum airflow required in VAV boxes and outdoor air intake of the AHUs; hence, these reduce energy used to condition outdoor air intake and reheat of cooled primary air.
Addenda au and cm refer to this new minimum primary airflow rate to replace the provision in Standard 90.1 that allows VAV box minimum setpoints to be 20% of the design supply air rate. Outdoor air rates for zones with moderate occupancy density, such as offices, are generally much lower than 20% of the design supply air rate, but designers often need a higher percentage or an oversized VAV box when they follow the system ventilation efficiency specified in Standard 62.1 and its Normative Appendix A Multiple-zone System Ventilation Efficiency. With these addenda, Appendix A in Standard 62.1 becomes an alternative to the Simplified Procedure, by which designers no longer need to calculate what minimum rates are required using the multiple spaces equations in Appendix A. They now can set the minimum primary airflow to be 1.5 times the ventilation zone airflow. The system ventilation efficiency from the Simplified Procedure is generally higher than that calculated using Appendix A, which means the outdoor air intake through the AHU is less. Moreover, using percentages to determine minimums is problematic because VAV boxes are almost always oversized due to conservative load assumptions for occupants, lights, plug loads, etc. It is not unusual for boxes to be sized three or more times larger than they need to be, as was found in ASHRAE RP-1515 “Thermal and air quality acceptability in buildings that reduce energy by reducing minimum airflow from overhead diffusers.” (Arens et al. 2015) RP-1515 showed that even if the minimums were set to 20% instead of 30%, excess minimum air would have been supplied due to the oversized cooling maximum box sizing, wasting fan energy, reheat energy, and cooling energy.

Appendix B B.9
In summary, Addenda au and cm save energy by 1) reducing outdoor air intake at the central system; and 2) reducing the actual airflow minimums in VAV boxes using the cfm-based approach rather than percentage-based minimums previously used in 90.1. When the minimum airflow in VAV boxes is reduced, less air volume needs to be reheated, saving both cooling and heating energy.
Modeling Strategy. There are 7 prototype buildings with multiple-zone VAV systems (i.e., Medium Office, Large Office, Primary School, Secondary School, Outpatient Healthcare, and Hospital). Section 2.2.6 in the PNNL report Enhancements to ASHRAE Standard 90.1 Prototype Building Models (Goel et al. 2014) describes the modeling strategy used in the baseline prototypes to calculate system ventilation efficiency using Appendix A of Standard 62.1-2013. Where the efficiency is lower than 0.6, VAV box minimums of the critical zones are adjusted from 20% to be higher values to reach a target efficiency of 0.6. Then, the design outdoor air intake is determined using this efficiency and can be dynamically reset during the operation using the dynamic efficiency reflecting the zone loads at each time step. For VAV systems serving low occupancy density zones, the VAV box minimums remain at 20%.
In the advanced prototypes, the VAV box minimum, system ventilation efficiency, and design and operation outdoor air intake are based on different calculations as required by Addenda au and cm and the referenced Addendum f to Standard 62.1-2016. The VAV box minimum (Vpz-min) is changed to
Vpz-min = Voz × 1.5
Where,
Vpz-min is minimum primary airflow, and
Voz is ventilation zone airflow.
The Simplified Procedure allows the system ventilation efficiency and the corresponding outdoor air intake flow to be determined in accordance with the following equations
Ev = 0.88 * D + 0.22 for D<0.60
Ev = 0.75 for D≥0.60
Vot = Vou / Ev
Where,
Ev is the system ventilation efficiency, and
D is the occupancy diversity ratio,
Vot is the design outdoor air intake flow
Vou is the uncorrected outdoor air intake.
To simplify the calculation, we assumed D always to be greater than 0.6 for all VAV systems in the prototypes. The change in Ev from 0.6 to 0.75 results in a significant reduction in the design outdoor air intake flow. Although both editions require Multiple-Zone VAV System Ventilation Optimization Control, also known as dynamic ventilation reset, in Section 6.5.3.3 of Standard 90.1, the design outdoor air intake flow serves a maximum outdoor air, which leads to energy reduction. The dynamic ventilation reset can be modeled using native EnergyPlus controls, which are able to follow the Normative Appendix A Multiple-zone System Ventilation Efficiency in Standard 62.1-2016 during the operational hours.

B.10 Appendix B
PRELIMINARY ENERGY SAVINGS ANALYSIS ANSI/ASHRAE/IES STANDARD 90.1-2019
PNNL consulted with the SSPC 90.1 Mechanical Subcommittee experts and clarified that Appendix A is intended to be used during building operation for 90.1-2019. The reduced design outdoor air intake flow Vot calculated with the Simplified Procedure should be used as the maximum outside airflow for the dynamic ventilation reset, except for economizer mode, and the maximum is implemented in the prototypes through an EMS program.
B.2.8 Addendum be: CRAC Unit Efficiencies Addendum Description. Addendum be clarifies that the computer room air conditioners listed in Table 6.8.1-11 are floor mounted computer room units. Efficiency requirements were modified to align with current industry levels. The addendum also adds a new Table 6.8.1-19 that covers small ceiling-mounted computer room units.
Modeling Strategy. Computer rooms and IT closets were added to the Large Office prototype as part of an enhancement in 2014 (Goel et al. 2014). Computer room air conditioning (CRAC) units were modeled as water source heat pumps (WSHP) to simulate a water-cooled air conditioner during its debut into the prototypes, and the modeled efficiency was based on Standard 90.1-2010 efficiency requirements. Seasonal coefficient of performance (SCOP) was converted to coefficient of performance (COP) inputs along with performance curves that correspond to the WSHP configurations used in EnergyPlus.
The CRAC unit efficiency requirements were introduced in 90.1-2010 and were updated in 2013 and 2016; however, these interim changes were not included in the prior analysis because there was pending federal rulemaking. The analysis of Addendum be includes the change to the 90.1-2019 efficiencies. The baseline and improved COP for the CRAC units in the basement computer rooms and IT closets is based on typical equipment sizes used in data centers, even though the EnergyPlus model thermal zoning grouped areas that would be served by multiple CRAC units into a large thermal zone and modeled them as one unit.
This addendum saves energy by reducing the compressor energy needed to transfer heat from the data center area and reject it outside. Because there is less compressor heat to reject, there is also a reduction in the fan use in the dry cooler that provides heat rejection for the water cooled CRAC units.
B.2.9 Addendum bq: Heat Rejection Efficiency Addendum Description. Addendum bq raises the minimum efficiencies for axial and centrifugal fan evaporative condensers due to a change in the rating fluid to R-448A from R-507A, with R-448A having a lower Global Warming Potential (GWP). The addendum also adds axial fan, air cooled fluid coolers (better known as dry coolers) to Table 6.8.1.7. The addendum saves energy for buildings with heat rejection equipment.
Modeling Strategy. The minimum efficiency requirement for dry coolers introduced by this addendum impacts the Large Office prototype. The dry cooler in the Large Office prototype is modeled using the FluidCooler:TwoSpeed object. Since the dry cooler efficiency is not a direct EnergyPlus input, modeled efficiency must be calculated as:
Dry Cooler efficiency = pump (gpm) / fan (bhp),
Where,
fan(bhp) = fan (hp at high speed) * 0.9.
The pump flow rate is dependent on the loads it serves, and the dry cooler serves the computer rooms and IT closets, in which the loads remain relatively constant across different climate zones. Per suggestions from SSPC 90.1 Mechanical Subcommittee experts, the baseline efficiency is assumed to be 4.0 gpm/hp

Appendix B B.11
and that for the advanced model is 4.5 gpm/hp based on Addendum be.
Lighting Addenda B.3.1 Addenda bb and cg: LPD Values Addendum Description. Addendum bb modifies the lighting power density (LPD) allowances using the space-by-space method. This addendum results in changes in Table 9.6.1. Addendum cg modifies the lighting power allowances using the building area method. The values from Addendum bb (Table 9.6.1, space-by-space) were used by the SSPC 90.1 Lighting Subcommittee to update Table 9.5.1, building area method as part of Addendum cg. The changes in LPD are the result of improving lighting technology, changes in lighting baseline (model is 100% LED), changes to Illuminating Engineering Society (IES) recommended light levels, changes to space geometry assumptions, and additional room surface reflectance values. The addenda save energy in multiple ways. There is direct lighting power reduction. In addition, the reduced lighting power reduces the internal gains which reduces cooling loads and saves cooling energy. In some climate zones, the reduction in lighting power results in an increased need for heating during colder outside conditions, so there may be an increase in heating energy use. These three impacts are combined for a net savings of building energy.
Modeling Strategy. Addenda bb and cg collectively affect all prototypes. The following describes how the appropriate LPD allowance is chosen for the prototype buildings:
1. The Large Office, Medium Office, and Small Office prototypes use the office building LPD allowance from the building area method (Table 9.5.1). Similarly, the basement zone in the Large Hotel, Hospital, and the office zone in the Non-refrigerated Warehouse use the LPD allowance from the building area method.
2. Most other zones in the prototypes are mapped to a single space-by-space category and the LPD allowance from that category is used directly.
3. A few zones in the prototypes (for example, the Back Space zone in the Stand-alone Retail prototype) are considered a mix of two or more space types; in such cases, the NC3 database (Richman et al. 2008) is used to determine the mix of spaces and their proportion. This weighting is then applied to determine a single LPD allowance for those spaces.
4. A room cavity ratio adjustment has been applied to a few spaces such as corridors, and exercise rooms.
Using these rules and the values in Addenda bb and cg, the LPD allowances for all prototypes and zones were determined. The design LPD allowance is modeled in EnergyPlus as a direct input to the zone general lighting object.
B.3.2 Addendum cw: Continuous Dimming Control Addendum Description. Addendum cw changes daylight responsive requirements from either continuous dimming or stepped dimming to continuous dimming for all spaces. This measure saves energy because a stepped control cannot switch to the next lower power level until enough daylight is available to maintain the desired light level. This results in a period between steps where more than the required light level is maintained, resulting in a higher average power level that would be achieved with continuous dimming that adjusts the power smoothly to maintain just the needed lighting level. There is also a modest impact on HVAC energy use similar to the LPD reduction addenda.
Modeling Strategy. Several prototype models already have stepped daylighting control for either top lighting or side lighting, including Small, Medium, and Large Offices, Stand-alone Retail, Primary and Secondary Schools, Outpatient Healthcare, Hospital, Small and Large Hotels, Warehouse, and Quick

B.12 Appendix B
PRELIMINARY ENERGY SAVINGS ANALYSIS ANSI/ASHRAE/IES STANDARD 90.1-2019
Service and Full Service Restaurants. This addendum affects all of them. The control type in the Energyplus prototype was changed from three steps (i.e., power fraction of 0.66, 0.33, and 0) to ContinousOff (proportionally reduces the lighting power as the daylight increases until a minimum power fraction of 0.2). The lights will be completely off when the daylight reaches the target illuminance level.

Appendix B B.13
Appendix B References Arens, E., H. Zhang, T, Hoyt, S. Kaam, J. Goins, F. Bauman, Y. Zhai, T.Webster, B. West, G. Paliaga, J. Stein, R. Seidl, B. Tully, J. Rimmer, and J. Toftum. 2012. Thermal air quality acceptability in buildings that reduce energy by reducing minimum airflow from overhead diffusers. Final report for ASHRAE RP-1515.
Davis R, P Francisco, M Kennedy, D Baylon, and B Manclark. 2002. Enhanced Operations & Maintenance Procedures for Small Packaged Rooftop HVAC Systems: Protocol Development, Field Review, and Measure Assessment. Ecotope for Eugene Water & Electric Board.
Glazer, J. 2016. RP-1651 -- Development of Maximum Technically Achievable Energy Targets for Commercial Buildings. Page 190, Final report for ASHRAE RP-1651.
Goel S., R.A. Athalye, W. Wang, J. Zhang, M.I. Rosenberg, Y. Xie, and R. Hart, V. Mendon. 2014. Enhancements to ASHRAE Standard 90.1 Prototype Building Models. PNNL-23269. Richland, WA: Pacific Northwest National Laboratory. https://www.pnnl.gov/main/publications/external/technical_reports/PNNL-23269.pdf.
Richman EE, E Rauch, J Knappek, J Phillips, K Petty, and P Lopez-Rangel. 2008. “National Commercial Construction Characteristics and Compliance with Building Energy Codes: 1999-2007.” 2008 ACEEE Summer Study on Energy Efficiency in Buildings, ACEEE Publications, Washington D.C. Thornton B.A., M.I. Rosenberg, E.E. Richman, W. Wang, Y. Xie, J. Zhang, H. Cho, VV Mendon, R.A. Athalye, and B. Liu. 2011. Achieving the 30% Goal: Energy and Cost Savings Analysis of ASHRAE Standard 90.1-2010. PNNL-20405. Richland, WA: Pacific Northwest National Laboratory. https://www.energycodes.gov/sites/default/files/documents/BECP_Energy_Cost_Savings_STD2010_May2011_v00.pdf.

(This page intentionally left blank)

For more information, visit: energy.gov/eere/buildings
DOE/EE-2345 • 2021