ies webinar: energy outlook, q2 market intelligence update
TRANSCRIPT

Q2 2015 Energy Market Outlook
Energy Prices and Market Intelligence Q2 Update June 2, 2015
Presenter: Jonathan Lee, Sr Energy Market Intelligence Manager, Ecova
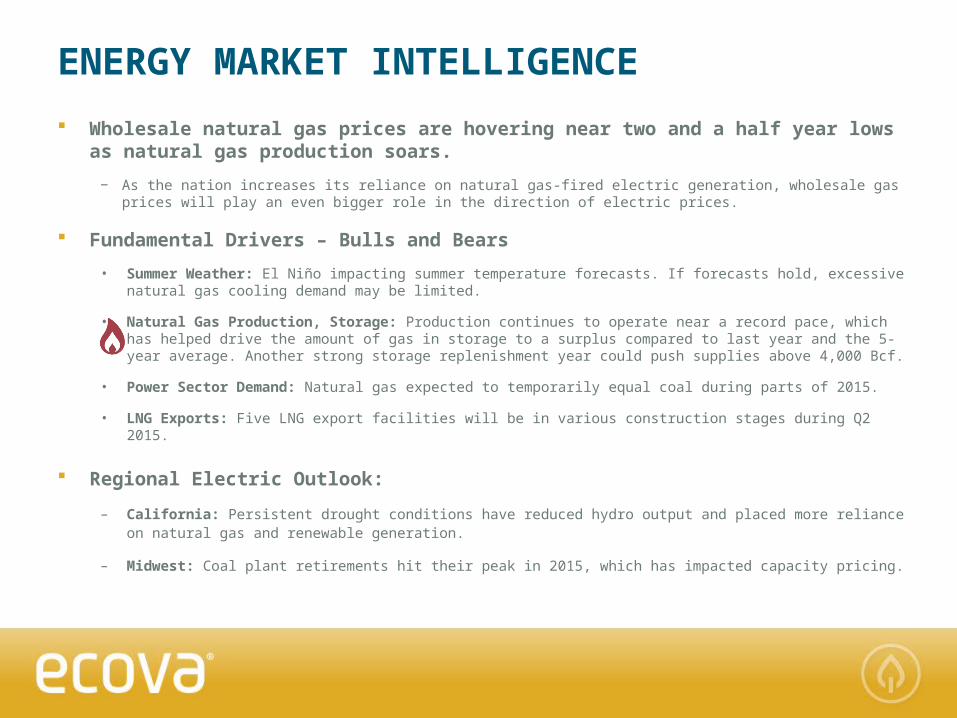
Wholesale natural gas prices are hovering near two and a half year lows as natural gas production soars.
− As the nation increases its reliance on natural gas-fired electric generation, wholesale gas prices will play an even bigger role in the direction of electric prices.
Fundamental Drivers – Bulls and Bears
• Summer Weather: El Niño impacting summer temperature forecasts. If forecasts hold, excessive natural gas cooling demand may be limited.
• Natural Gas Production, Storage: Production continues to operate near a record pace, which has helped drive the amount of gas in storage to a surplus compared to last year and the 5-year average. Another strong storage replenishment year could push supplies above 4,000 Bcf.
• Power Sector Demand: Natural gas expected to temporarily equal coal during parts of 2015.
• LNG Exports: Five LNG export facilities will be in various construction stages during Q2 2015.
Regional Electric Outlook:
– California: Persistent drought conditions have reduced hydro output and placed more reliance on natural gas and renewable generation.
– Midwest: Coal plant retirements hit their peak in 2015, which has impacted capacity pricing.
ENERGY MARKET INTELLIGENCE
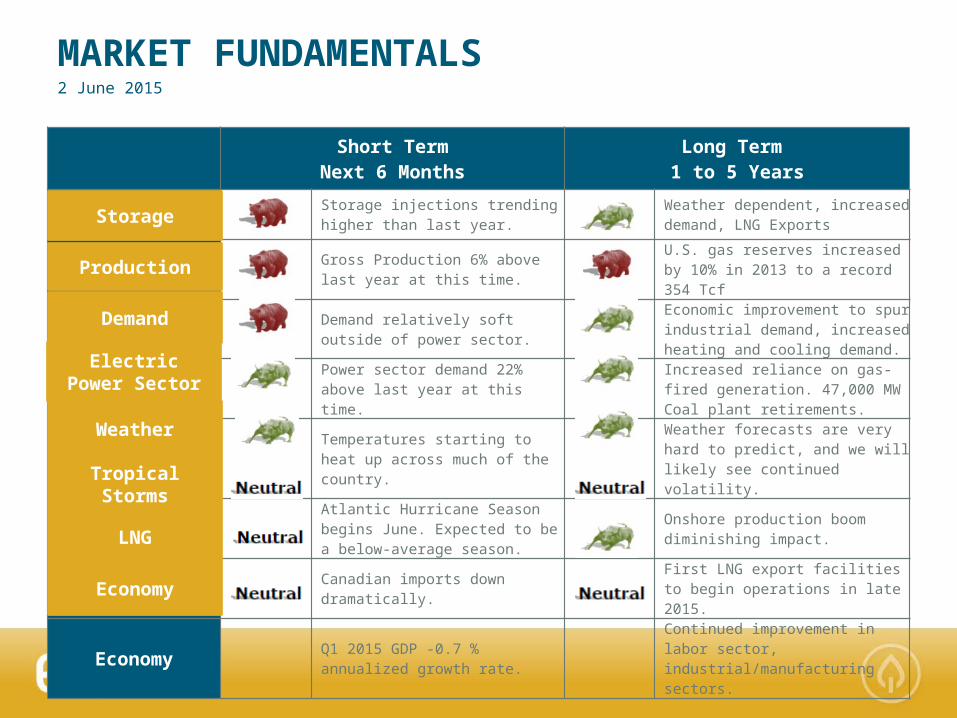
Short TermNext 6 Months
Long Term 1 to 5 Years
Storage Storage injections trending higher than last year.
Weather dependent, increased demand, LNG Exports
Production Gross Production 6% above last year at this time.
U.S. gas reserves increased by 10% in 2013 to a record 354 Tcf
Demand Demand relatively soft outside of power sector.
Economic improvement to spur industrial demand, increased heating and cooling demand.
Electric Power Sector
Power sector demand 22% above last year at this time.
Increased reliance on gas-fired generation. 47,000 MW Coal plant retirements.
Weather
Temperatures starting to heat up across much of the country.
Weather forecasts are very hard to predict, and we will likely see continued volatility.
Tropical Storms
Atlantic Hurricane Season begins June. Expected to be a below-average season.
Onshore production boom diminishing impact.
LNG
Canadian imports down dramatically.
First LNG export facilities to begin operations in late 2015.
Economy
Q1 2015 GDP -0.7 % annualized growth rate.
Continued improvement in labor sector, industrial/manufacturing sectors.
MARKET FUNDAMENTALS 2 June 2015
Storage
Production
Demand
Electric Power Sector
Weather
Tropical Storms
LNG
Economy

SUMMER 2015 OUTLOOKNOAA, Accuweather; Farmers’ Almanac - June 2015
Hot West with persistent drought conditions
Wet South could limit excessive cooling demand
Warm Midwest and Northeast
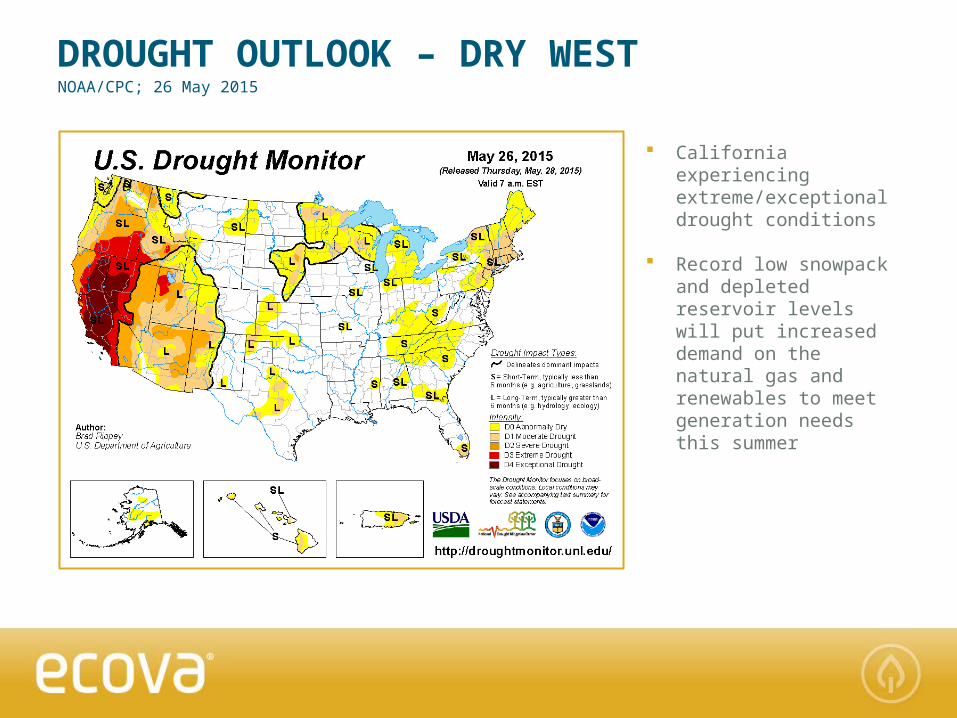
DROUGHT OUTLOOK – DRY WEST
California experiencing extreme/exceptional drought conditions
Record low snowpack and depleted reservoir levels will put increased demand on the natural gas and renewables to meet generation needs this summer
NOAA/CPC; 26 May 2015

El NIÑO SHAPING SUMMER FORECASTSNOAA – 1 June 2015
90% chance El Nino conditions will persist
through summer.
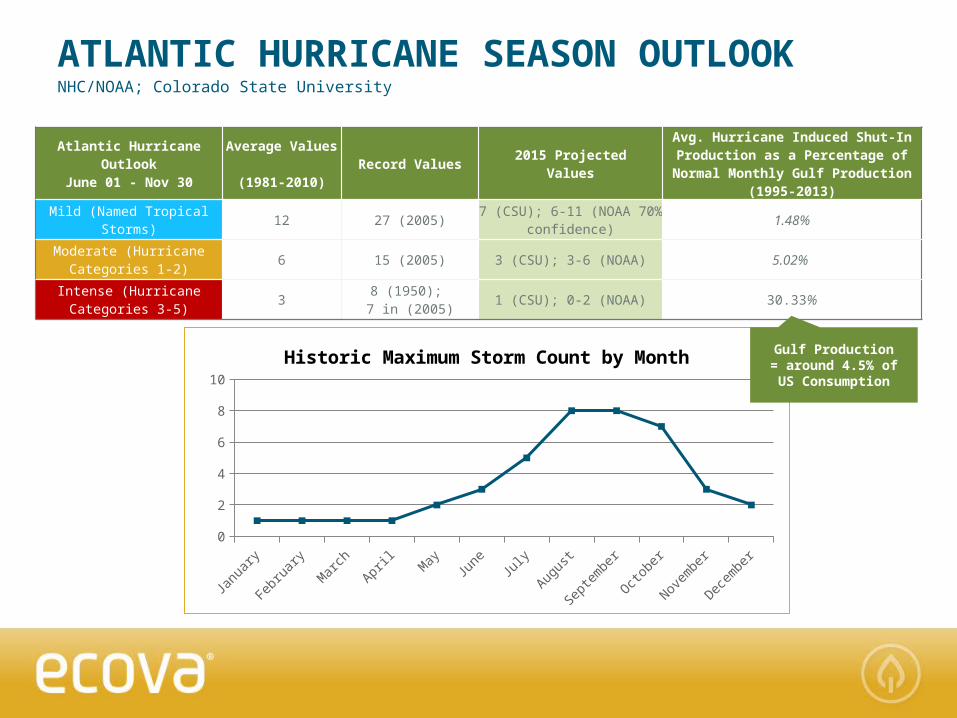
ATLANTIC HURRICANE SEASON OUTLOOKNHC/NOAA; Colorado State University
Atlantic Hurricane Outlook
June 01 - Nov 30
Average Values
(1981-2010)Record Values
2015 Projected Values
Avg. Hurricane Induced Shut-In Production as a Percentage of
Normal Monthly Gulf Production (1995-2013)
Mild (Named Tropical Storms)
12 27 (2005) 7 (CSU); 6-11 (NOAA 70% confidence)
1.48%
Moderate (Hurricane Categories 1-2)
6 15 (2005) 3 (CSU); 3-6 (NOAA) 5.02%
Intense (Hurricane Categories 3-5)
3 8 (1950); 7 in (2005)
1 (CSU); 0-2 (NOAA) 30.33%
Janu
ary
Febru
ary
Mar
chApr
ilM
ayJu
ne July
Augus
t
Septe
mbe
r
Octob
er
Novem
ber
Decem
ber
0123456789
Historic Maximum Storm Count by Month Gulf Production = around 4.5% of US Consumption
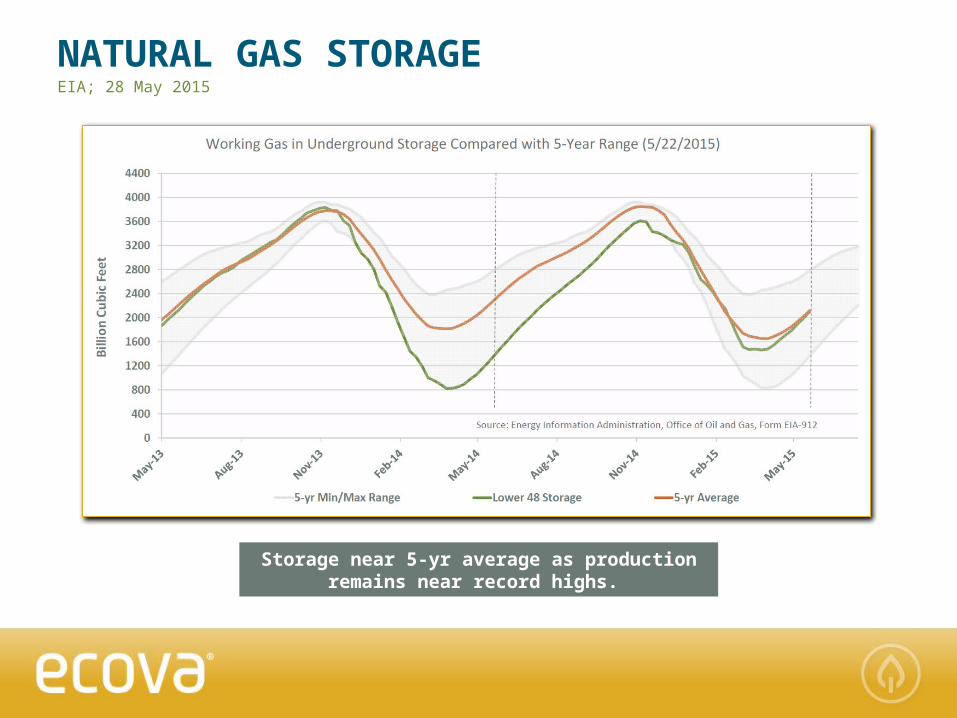
NATURAL GAS STORAGEEIA; 28 May 2015
Storage near 5-yr average as production remains near record highs.
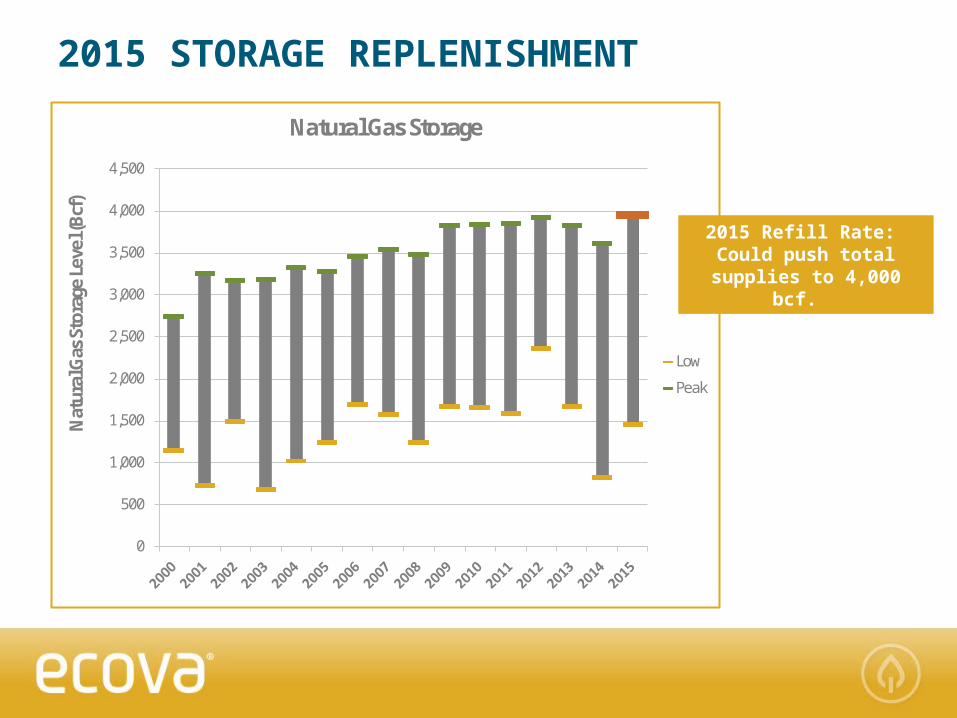
2015 STORAGE REPLENISHMENT
0
500
1,000
1,500
2,000
2,500
3,000
3,500
4,000
4,500
Nat
ural
Gas
Sto
rage
Leve
l (Bc
f)
Natural Gas Storage
Low
Peak
2015 Refill Rate: Could push total
supplies to 4,000 bcf.
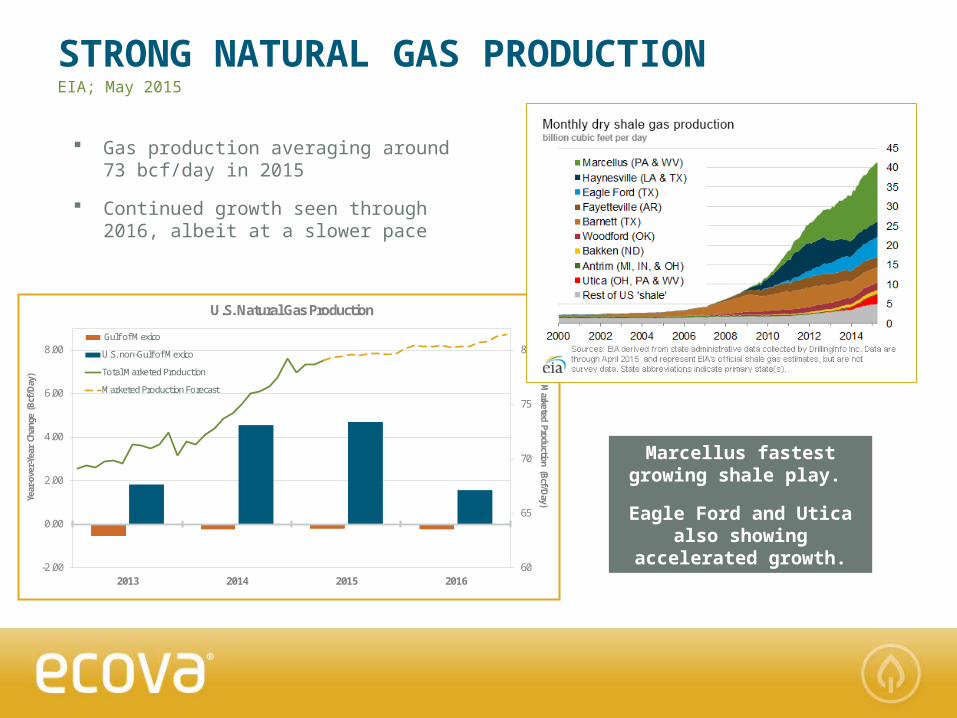
STRONG NATURAL GAS PRODUCTIONEIA; May 2015
60
65
70
75
80
-2.00
0.00
2.00
4.00
6.00
8.00
2013 2014 2015 2016
Marketed Production (Bcf/D
ay)Year
-ove
r-Ye
ar C
hang
e (B
cf/D
ay)
U.S. Natural Gas Production
Gulf of Mexico
U.S. non-Gulf of Mexico
Total Marketed Production
Marketed Production Forecast
Gas production averaging around 73 bcf/day in 2015
Continued growth seen through 2016, albeit at a slower pace
Marcellus fastest growing shale play.
Eagle Ford and Utica also showing
accelerated growth.
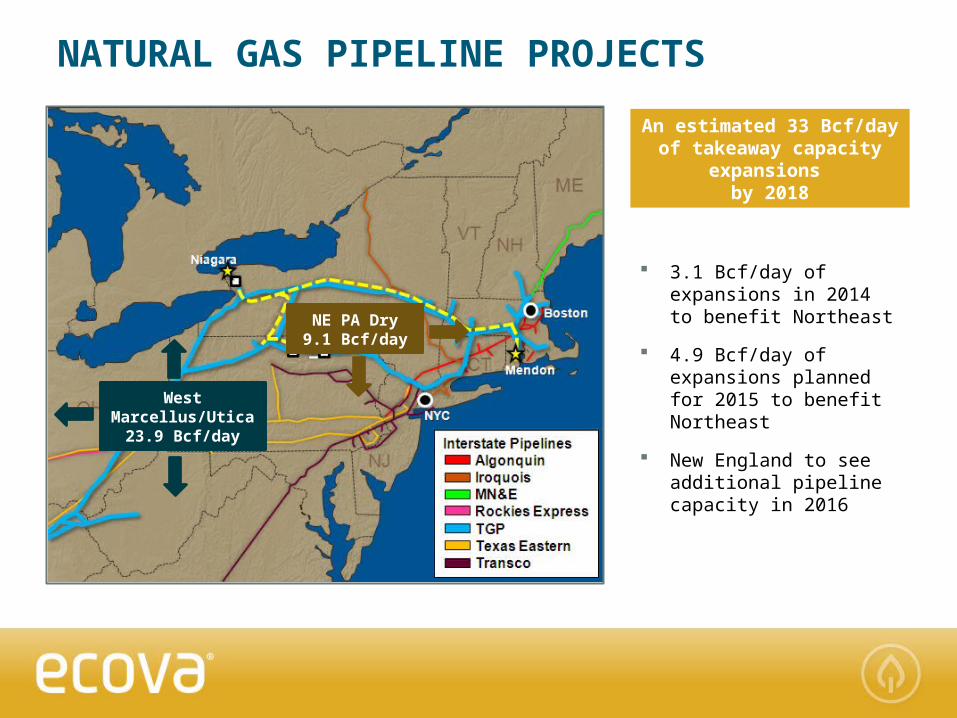
NATURAL GAS PIPELINE PROJECTS
NE PA Dry9.1 Bcf/day
West Marcellus/Utica
23.9 Bcf/day
An estimated 33 Bcf/day of takeaway capacity
expansions by 2018
3.1 Bcf/day of expansions in 2014 to benefit Northeast
4.9 Bcf/day of expansions planned for 2015 to benefit Northeast
New England to see additional pipeline capacity in 2016
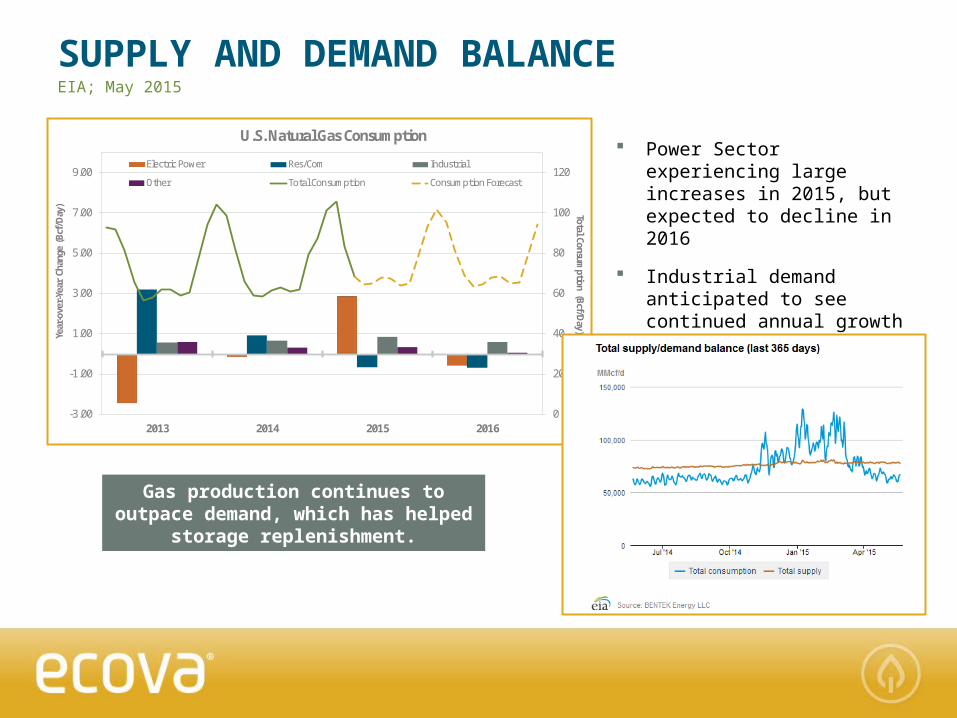
SUPPLY AND DEMAND BALANCE
Gas production continues to outpace demand, which has
helped storage replenishment.
Power Sector experiencing large increases in 2015, but expected to decline in 2016
Industrial demand anticipated to see continued annual growth
EIA; May 2015
0
20
40
60
80
100
120
-3.00
-1.00
1.00
3.00
5.00
7.00
9.00
2013 2014 2015 2016
Total Consumption (Bcf/D
ay)
Year
-ove
r-Ye
ar C
hang
e (B
cf/D
ay)
U.S. Natural Gas Consumption
Electric Power Res/Com Industrial
Other Total Consumption Consumption Forecast
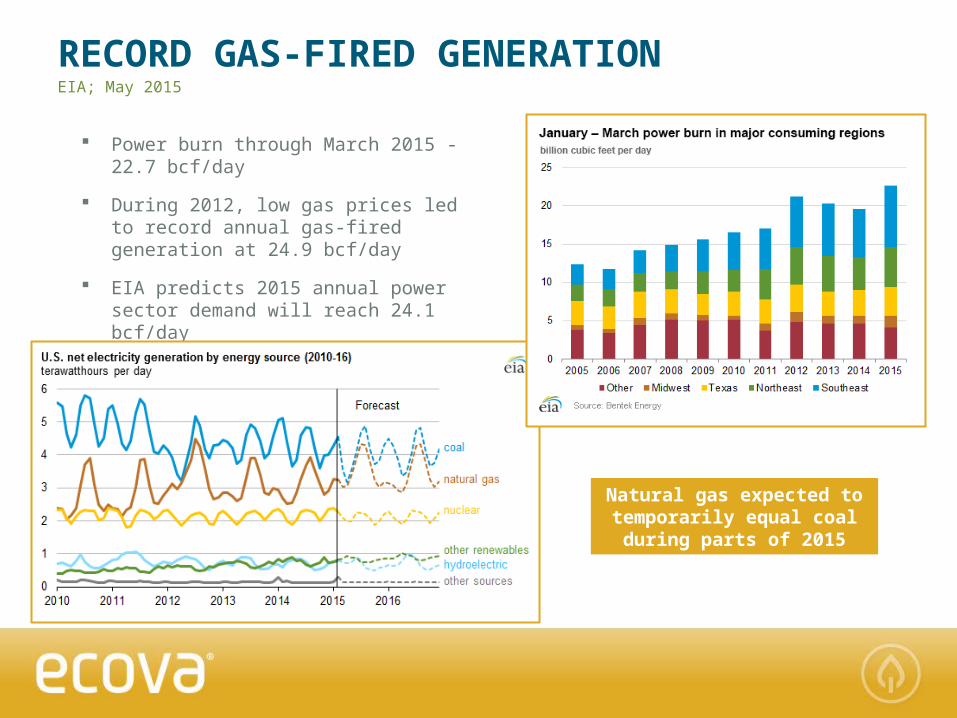
RECORD GAS-FIRED GENERATIONEIA; May 2015
Power burn through March 2015 - 22.7 bcf/day
During 2012, low gas prices led to record annual gas-fired generation at 24.9 bcf/day
EIA predicts 2015 annual power sector demand will reach 24.1 bcf/day
Natural gas expected to temporarily equal coal during parts of 2015
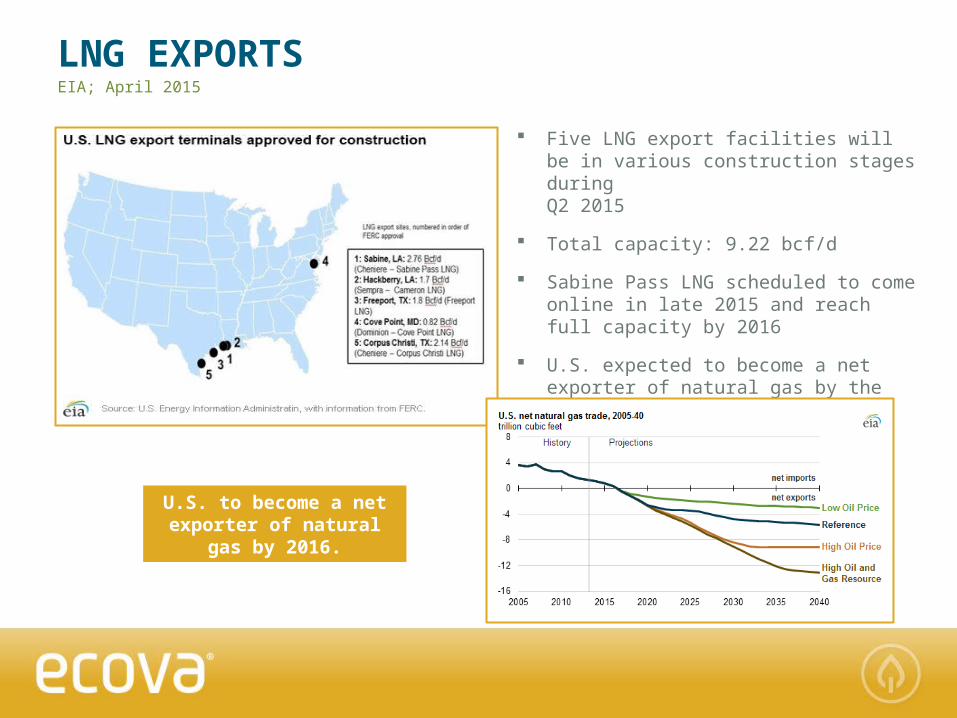
LNG EXPORTSEIA; April 2015
Five LNG export facilities will be in various construction stages during Q2 2015
Total capacity: 9.22 bcf/d
Sabine Pass LNG scheduled to come online in late 2015 and reach full capacity by 2016
U.S. expected to become a net exporter of natural gas by the end of 2016
U.S. to become a net exporter of natural
gas by 2016.
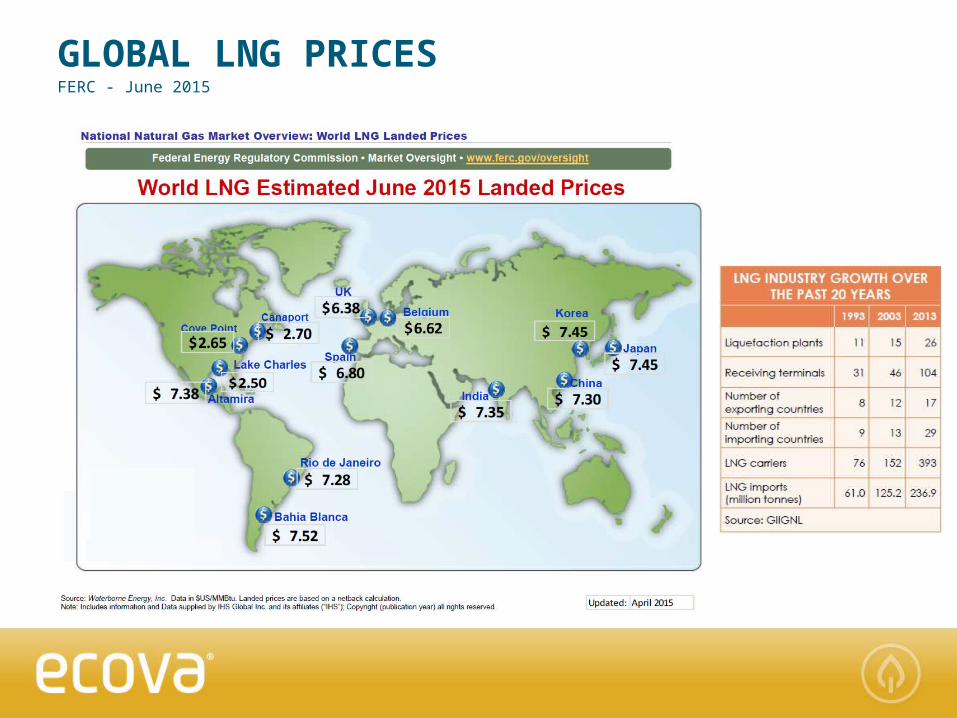
GLOBAL LNG PRICESFERC - June 2015
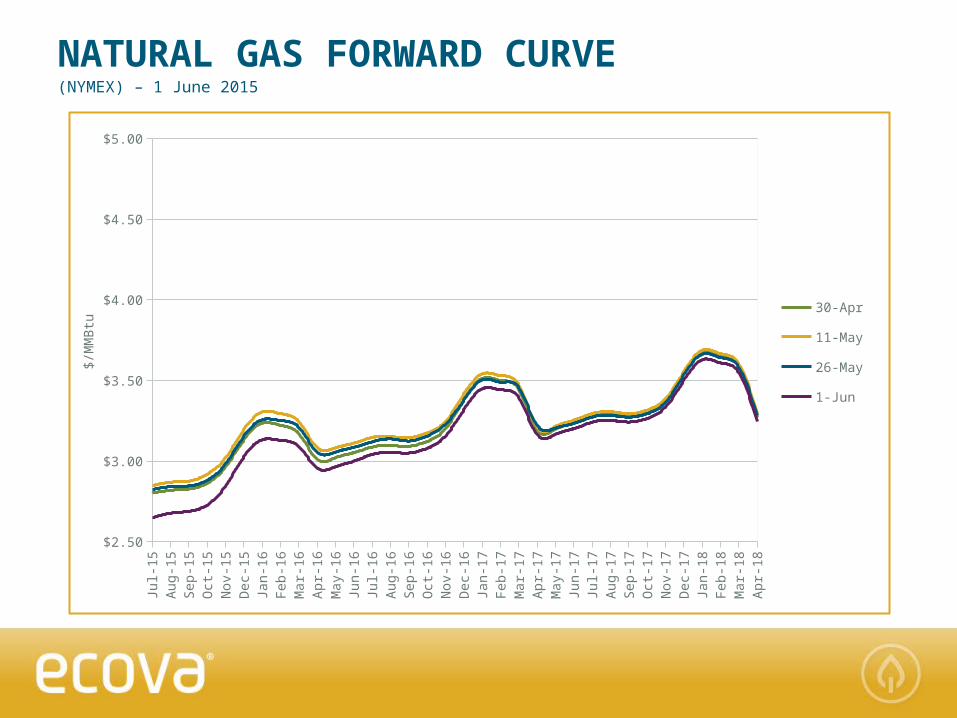
NATURAL GAS FORWARD CURVE(NYMEX) – 1 June 2015
Natural Gas Curve Remains Near Lowest
Level Since 2012
Jul-
15
Aug-1
5Sep-1
5O
ct-1
5N
ov-1
5D
ec-
15
Jan-1
6Fe
b-1
6M
ar-
16
Apr-
16
May-1
6Ju
n-1
6Ju
l-16
Aug-1
6Sep-1
6O
ct-1
6N
ov-1
6D
ec-
16
Jan-1
7Fe
b-1
7M
ar-
17
Apr-
17
May-1
7Ju
n-1
7Ju
l-17
Aug-1
7Sep-1
7O
ct-1
7N
ov-1
7D
ec-
17
Jan-1
8Fe
b-1
8M
ar-
18
Apr-
18
$2.50
$3.00
$3.50
$4.00
$4.50
$5.00
30-Apr
11-May
26-May
1-Jun
$/M
MB
tu
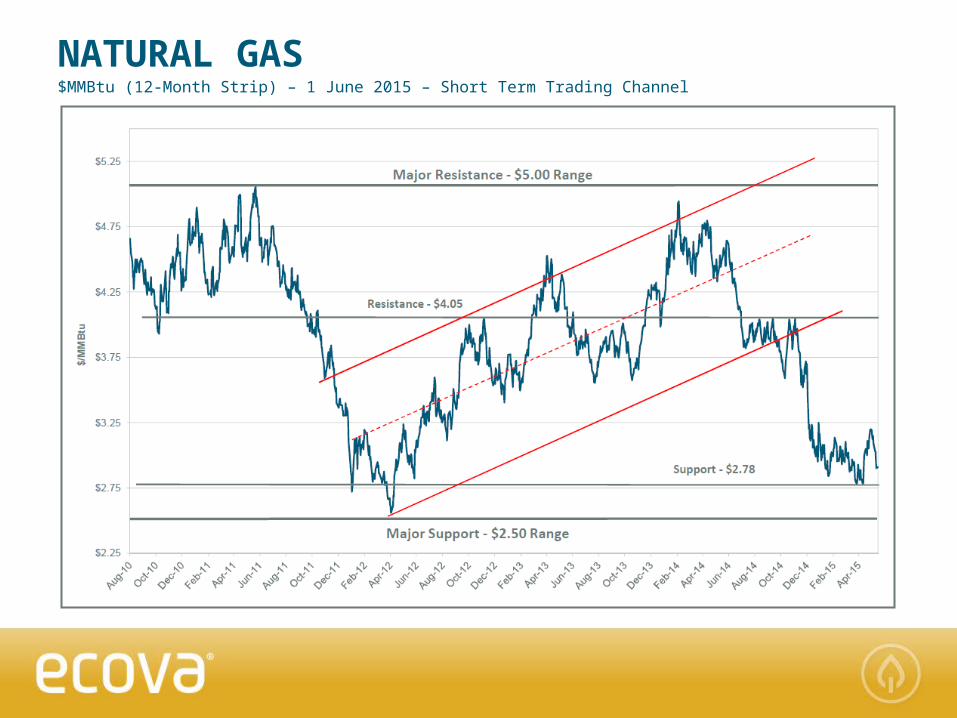
NATURAL GAS$MMBtu (12-Month Strip) – 1 June 2015 – Short Term Trading Channel
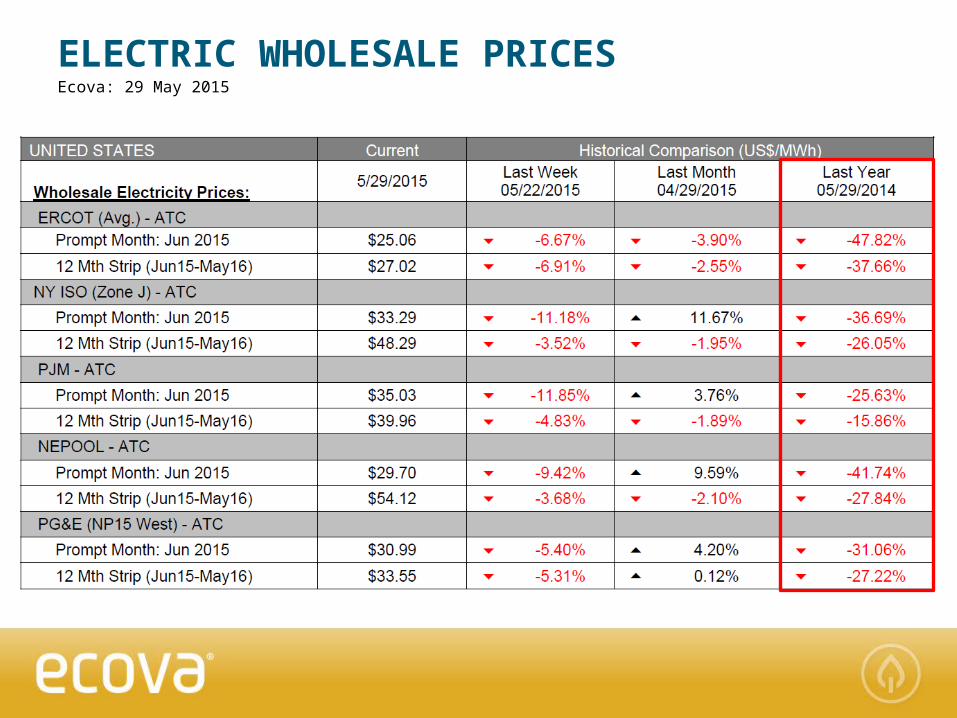
ELECTRIC WHOLESALE PRICESEcova: 29 May 2015

Jan-
12
Apr-1
2
Jul-1
2
Oct-1
2
Jan-
13
Apr-1
3
Jul-1
3
Oct-1
3
Jan-
14
Apr-1
4
Jul-1
4
Oct-1
4
Jan-
15
Apr-1
5$25
$35
$45
$55
$65
$75
$85
$95 ERCOT AVG NY ISO J PJM NEPOOL PG&E NP15 W
Pri
ce p
er
MW
h
WHOLESALE ELECTRICITY$MWh (12-Month Strip) – 29 May 2015
CA and ERCOT lowest level since 2012
NYISO, NEPOOL, and PJM lower, but winter reliability risks still priced in
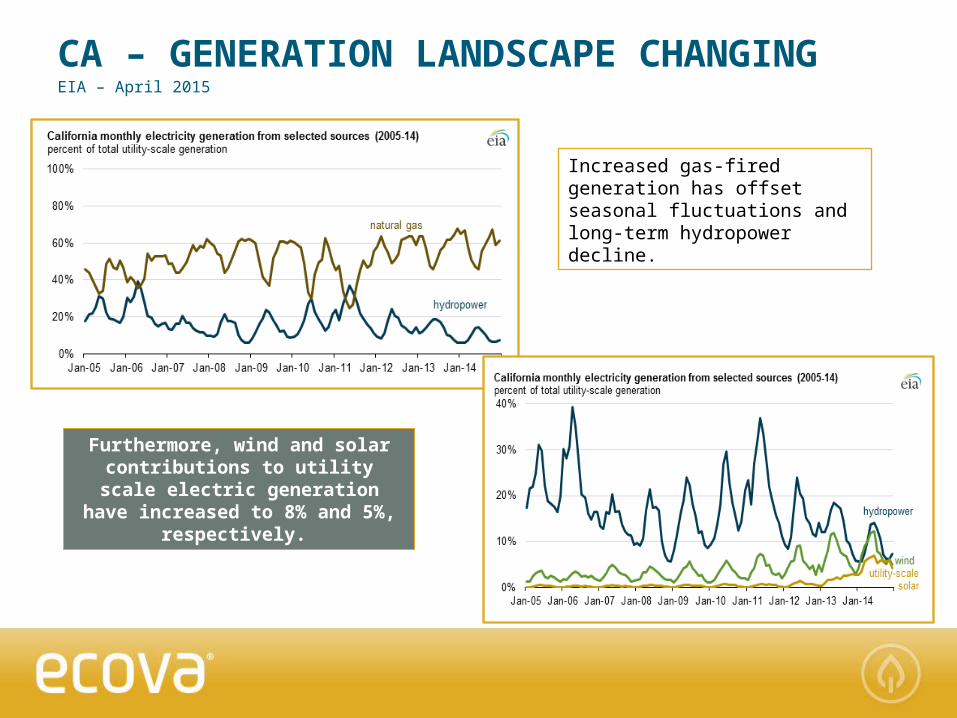
CA – GENERATION LANDSCAPE CHANGINGEIA – April 2015
Increased gas-fired generation has offset seasonal fluctuations and long-term hydropower decline.
Furthermore, wind and solar contributions to utility scale
electric generation have increased to 8% and 5%,
respectively.
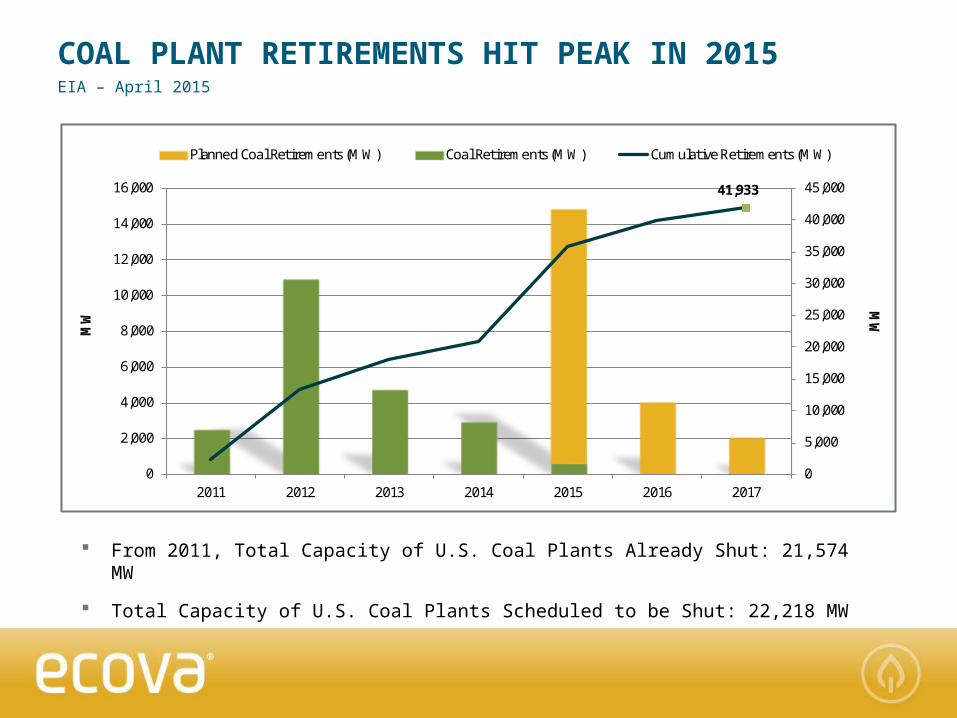
COAL PLANT RETIREMENTS HIT PEAK IN 2015EIA – April 2015
From 2011, Total Capacity of U.S. Coal Plants Already Shut: 21,574 MW
Total Capacity of U.S. Coal Plants Scheduled to be Shut: 22,218 MW
41,933
0
5,000
10,000
15,000
20,000
25,000
30,000
35,000
40,000
45,000
0
2,000
4,000
6,000
8,000
10,000
12,000
14,000
16,000
2011 2012 2013 2014 2015 2016 2017
MW
MW
Planned Coal Retirements (MW) Coal Retirements (MW) Cumulative Retirements (MW)
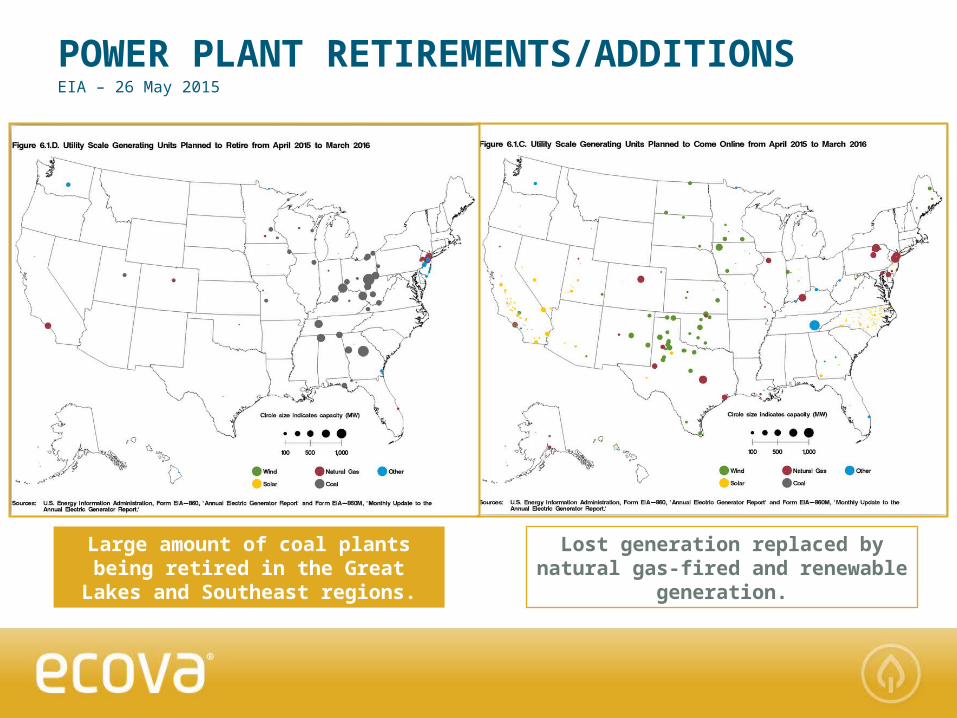
POWER PLANT RETIREMENTS/ADDITIONSEIA – 26 May 2015
Large amount of coal plants being retired in the Great Lakes
and Southeast regions.
Lost generation replaced by natural gas-fired and renewable
generation.
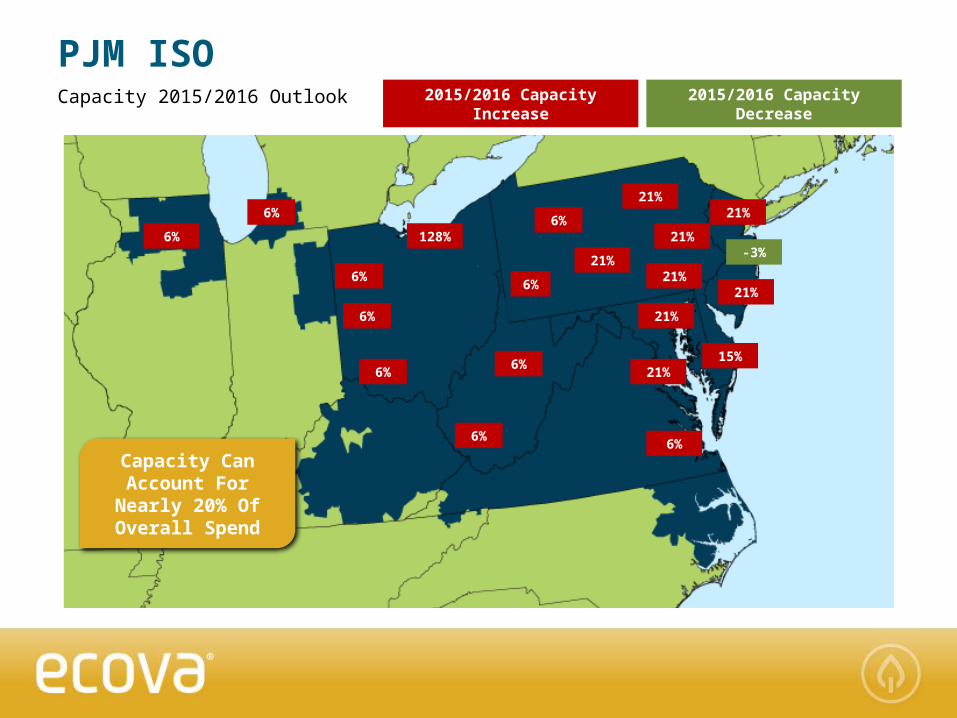
PJM ISO
6%
2015/2016 Capacity Increase
2015/2016 Capacity Decrease
6%6%
128%
6%
6%
6%
6%
6%
6%
21%
21%
6%
21%
21%
21%21%
21%
15%21%
-3%
Capacity Can Account For
Nearly 20% Of Overall Spend
Capacity 2015/2016 Outlook
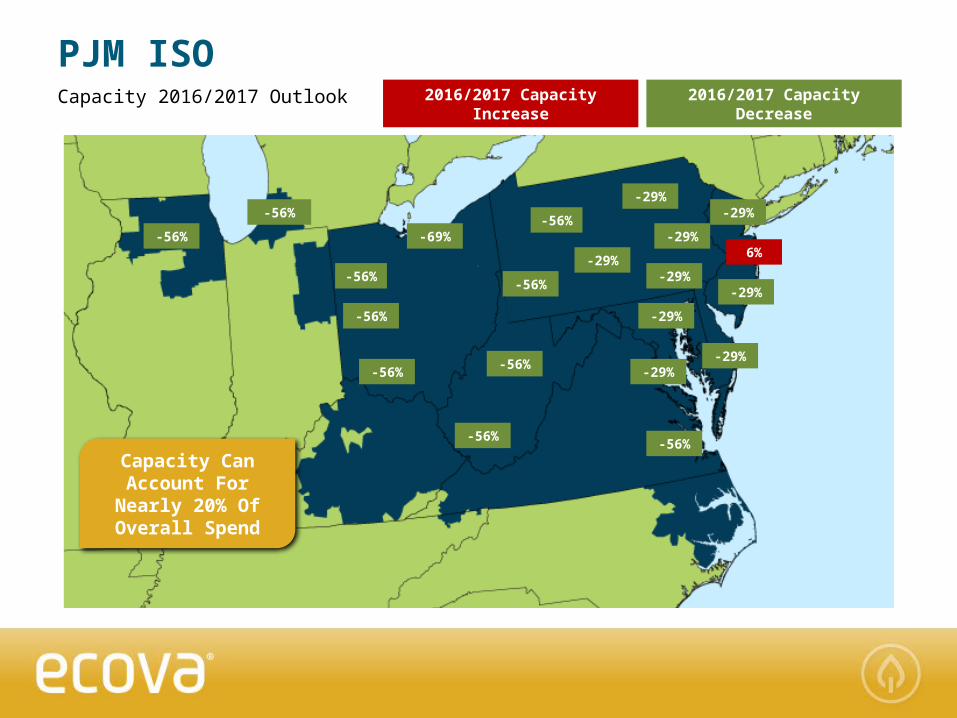
Capacity 2016/2017 Outlook
-56%
2016/2017 Capacity Increase
2016/2017 Capacity Decrease
-56%
-56%-
69%
-56%
-56%
-56%
-56%
-56%
-56%
-29%
-29%
-56%
-29%
-29%
-29%
-29%
-29%
-29%-
29%
6%
Capacity Can Account For
Nearly 20% Of Overall Spend
PJM ISO

MISO CAPACITY2015/2016 Auction Clearing Price Overview - April 2015
Ameren Illinois will experience a significant increase in capacity rates in 15/16
Potential impact to pricing between $7.00 - $9.00/MWh
Jump largely due to the retirement of coal-plants in the region
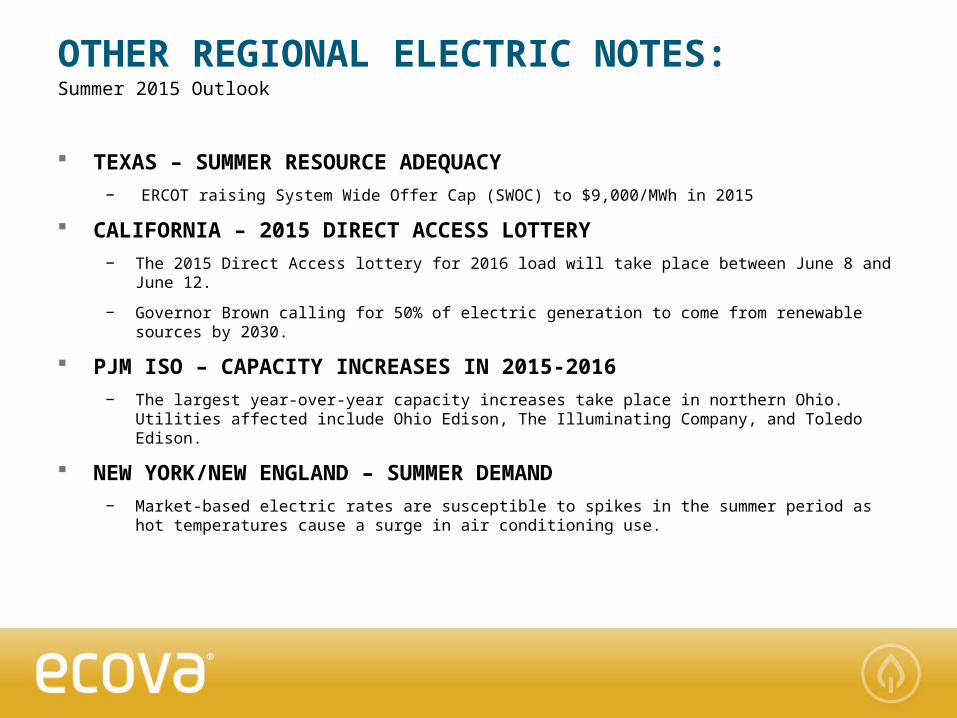
OTHER REGIONAL ELECTRIC NOTES:Summer 2015 Outlook
TEXAS – SUMMER RESOURCE ADEQUACY− ERCOT raising System Wide Offer Cap (SWOC) to $9,000/MWh in 2015
CALIFORNIA – 2015 DIRECT ACCESS LOTTERY− The 2015 Direct Access lottery for 2016 load will take place between June 8 and June 12.
− Governor Brown calling for 50% of electric generation to come from renewable sources by 2030.
PJM ISO – CAPACITY INCREASES IN 2015-2016− The largest year-over-year capacity increases take place in northern Ohio. Utilities affected
include Ohio Edison, The Illuminating Company, and Toledo Edison.
NEW YORK/NEW ENGLAND – SUMMER DEMAND− Market-based electric rates are susceptible to spikes in the summer period as hot
temperatures cause a surge in air conditioning use.
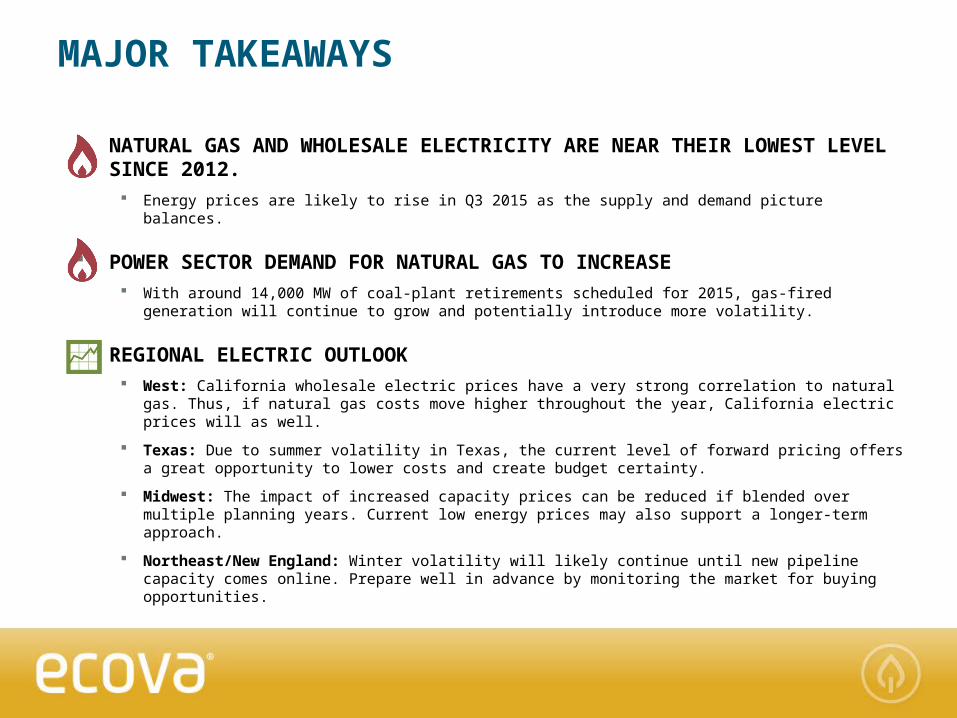
NATURAL GAS AND WHOLESALE ELECTRICITY ARE NEAR THEIR LOWEST LEVEL SINCE 2012.
Energy prices are likely to rise in Q3 2015 as the supply and demand picture balances.
POWER SECTOR DEMAND FOR NATURAL GAS TO INCREASE With around 14,000 MW of coal-plant retirements scheduled for 2015, gas-fired generation will
continue to grow and potentially introduce more volatility.
REGIONAL ELECTRIC OUTLOOK West: California wholesale electric prices have a very strong correlation to natural gas. Thus,
if natural gas costs move higher throughout the year, California electric prices will as well.
Texas: Due to summer volatility in Texas, the current level of forward pricing offers a great opportunity to lower costs and create budget certainty.
Midwest: The impact of increased capacity prices can be reduced if blended over multiple planning years. Current low energy prices may also support a longer-term approach.
Northeast/New England: Winter volatility will likely continue until new pipeline capacity comes online. Prepare well in advance by monitoring the market for buying opportunities.
MAJOR TAKEAWAYS
INSIDE ENERGY & SUSTAINABILITY WEBINARS
Tap into Water Saving Opportunities – June 25th at 11a PST
Questions, comments, suggestions? [email protected]
ENERGY PRICE HUB
Ecova’s all-in-one resource page for market intelligence and timely energy insights http://www.ecova.com/news-media/energy-price-hub.aspx
RELATED RESOURCES

Q&A

Thank you!