idea, 31st january 2013
TRANSCRIPT
7/29/2019 Idea, 31st January 2013
http://slidepdf.com/reader/full/idea-31st-january-2013 1/11
Please refer to important disclosures at the end of this report 1
EBITDA 1,473 1,423 3.6 1,345 9.6
EBITDA margin (%) 26.4 26.8 (36)bp 26.7 (32)bp
Source: Company, Angel Research
For 3QFY2013, Idea Cellular (Idea) reported mixed results with revenue coming
in in-line with expectations while operating margin surprised negatively. The
company’s total network minutes grew by 5.2% qoq, leading to a growth in
network traffic to 132bn min. The average revenue per minute (ARPM) declined
by 0.5% qoq to ` 0.41 due to decline in non-voice revenues’ share to 14.6% from15.6% in 2QFY2013. The Management indicated that the company has not hiked
headline tariff (as of now), but has only reduced promotional offers, that too in
specific circles.
For 3QFY2013, Idea reported a consolidated revenue of
` 5,579cr, up 5.0% qoq, on the back of a sharp qoq increase in minutes of usage
(MOU) to 384min, up 7.0% qoq. The company’s EBITDA margin declined by
36bp qoq to 26.4% primarily because of qoq increase in access costs (up 40bp),
network costs (up 20bp) and subscriber acquisition, advertisement and promotion
expenses (up 40bp). The PAT came in at ` 229cr, down 4.8% qoq, marred by a
forex loss of ` 13.3cr as against a forex gain of ` 18.0cr in 2QFY2013.
During 3QFY2013, Idea won back 1,800MHz spectrum
in all its seven circles in the 2G auction conducted by the government in
November 2012, for which licenses had been quashed by the Supreme Court.
Post the 2G auction, only four operators have pan-India presence. Idea’s
Management indicated that the company has not hiked headline tariff (as of now)
and has only reduced promotional offers, that too in specific circles. However, it
reiterated its stance that tariff hikes are becoming imminent. Going forward, we
expect ARPMs to improve as Idea has hiked tariffs via reduction of promotional
offers. This should offset the rising input and regulatory costs. With increase in
tariff rates expected going ahead, we have factored in a revenue CAGR of 10.7%
over FY2012-14E. Idea still remains surrounded by regulatory uncertainties in the
sector such as one-time spectrum fee and spectrum refarming. With the 2G
auctions coming up in March 2013, we expect partial resolution of these
uncertainties, and the same would be a positive for the sector as a whole.
Key financials (Consolidated, Indian GAAP)
% chg 22.9 24.6 26.0 13.0 8.3
% chg 8.3 (9.4) (16.3) 33.4 33.5
EBITDA margin (%) 27.4 24.5 26.1 26.6 27.7
P/E (x) 39.0 41.4 51.5 38.6 28.9
P/BV (x) 3.1 3.0 2.9 2.7 2.4
RoE (%) 8.0 7.0 5.5 6.9 8.4
RoCE (%) 7.0 5.5 7.8 8.6 10.3
EV/Sales (x) 3.6 3.1 2.6 2.3 2.0
EV/EBITDA (x) 13.2 12.6 9.9 8.5 7.3
Source: Company, Angel Research
CMP ` 113
Target Price -
Investment Period -
Stock Info
Sector
Net debt ( ` cr) 11,682
Bloomberg Code
Shareholding Pattern (%)
Promoters 45.9
MF / Banks / Indian Fls 6.4
FII / NRIs / OCBs 15.7Indian Public / Others 32.0
Abs. (%) 3m 1yr 3yr
Sensex 8.5 18.6 22.3
Idea 33.9 24.8 93.1
Face Value ( ` )
BSE Sensex
Nifty
Reuters Code
37,263
0.7
124/71
37,358
Telecom
Avg. Daily Volume
Market Cap ( ` cr)
Beta
52 Week High / Low
10
20,005
6,056
IDEA.BO
IDEA@IN
+91 22 3935 7800 Ext: 6819
Performance highlights
3QFY2013 Result Update | Telecom
January 30, 2013
7/29/2019 Idea, 31st January 2013
http://slidepdf.com/reader/full/idea-31st-january-2013 2/11
Idea Cellular | 3QFY2013 Result Update
January 30, 2013 2
Exhibit 1: 3QFY2013 – Financial performance (Consolidated, Indian GAAP)
Operating expenditure 4,105 3,891 5.5 3,686 11.4 12,065 10,436 15.6
Dep. and amortization 884 853 3.6 757 16.6 2,569 2,197 16.9
EBIT 590 570 3.5 587 0.4 1,763 1,538 14.6
Interest charges 242 216 11.7 288 (16.1) 725 828 (12.5)
Other income - - - - -
PBT 348 354 (1.5) 299 16.3 1,038 710 46.1
Income tax 120 114 5.3 98 21.9 335 226 48.3
PAT 229 240 (4.8) 201 13.6 703 484 45.1
Minority interest
EPS ( ` ) 0.7 0.7 (4.8) 0.6 13.7 2.1 1.5 45.2
EBITDA margin (%) 26.4 26.8 (36)bp 26.7 (32)bp 26.4 26.4 6bp
EBIT margin (%) 10.6 10.7 (15)bp 11.7 (110)bp 10.8 10.9 (10)bp
PAT margin (%) 4.1 4.5 (42)bp 4.0 10bp 4.3 3.4 87bp
Source: Company, Angel Research
Exhibit 2: 3QFY2013 – KPI data for the mobility business
ARPM ( ` /min) 0.41 0.41 (0.7) 0.41 (0.5) 0.43 (5.1)
MOU (min) 384 364 5.4 359 7.0 369 4.1 ARPU ( ` /month) 158 151 4.8 148 6.8 159 (0.6)
Subscriber base (mn) – EoP 114 115 (1.0) 116 (1.4) 106 7.0
EPM ( `/min) 0.11 0.12 (4.7) 0.11 (1.7) 0.12 (5.1)
Source: Company, Angel Research
Exhibit 3: 3QFY2013 – Actual vs Angel estimates
Net revenue 5,579 5453 2.3
EBITDA margin (%) 26.4 27.1 (65)bp
PAT 229 251 (9.1)
Source: Company, Angel Research
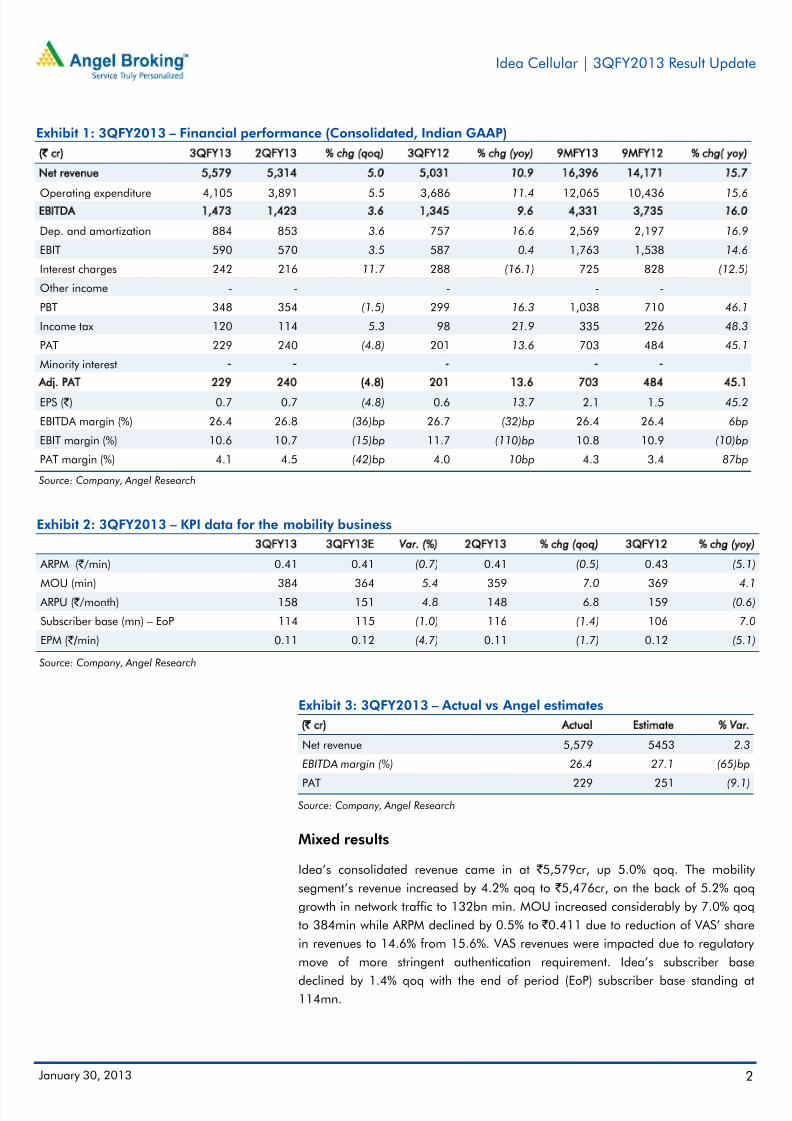
Mixed results
Idea’s consolidated revenue came in at ` 5,579cr, up 5.0% qoq. The mobility
segment’s revenue increased by 4.2% qoq to ` 5,476cr, on the back of 5.2% qoq
growth in network traffic to 132bn min. MOU increased considerably by 7.0% qoq
to 384min while ARPM declined by 0.5% to ` 0.411 due to reduction of VAS’ share
in revenues to 14.6% from 15.6%. VAS revenues were impacted due to regulatory
move of more stringent authentication requirement. Idea’s subscriber base
declined by 1.4% qoq with the end of period (EoP) subscriber base standing at114mn.
7/29/2019 Idea, 31st January 2013
http://slidepdf.com/reader/full/idea-31st-january-2013 3/11
Idea Cellular | 3QFY2013 Result Update
January 30, 2013 3
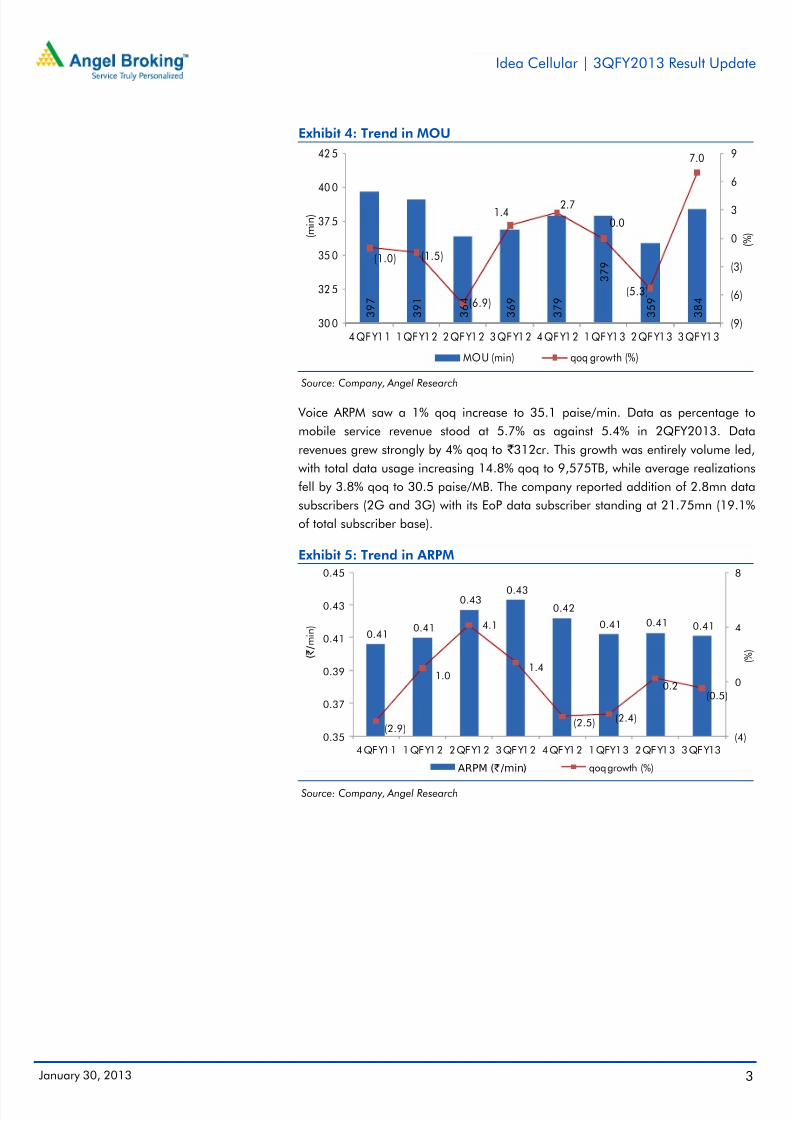
Exhibit 4: Trend in MOU
Source: Company, Angel Research
Voice ARPM saw a 1% qoq increase to 35.1 paise/min. Data as percentage to
mobile service revenue stood at 5.7% as against 5.4% in 2QFY2013. Data
revenues grew strongly by 4% qoq to ` 312cr. This growth was entirely volume led,
with total data usage increasing 14.8% qoq to 9,575TB, while average realizations
fell by 3.8% qoq to 30.5 paise/MB. The company reported addition of 2.8mn data
subscribers (2G and 3G) with its EoP data subscriber standing at 21.75mn (19.1%
of total subscriber base).
Exhibit 5: Trend in ARPM
Source: Company, Angel Research
3 9 7
3 9 1
3 6 4
3 6 9
3 7 9
3 7 9
3 5 9
3 8 4
(1.0) (1.5)
(6.9)
1.42.7
0.0
(5.3)
7.0
(9)
(6)
(3)
0
3
6
9
30 0
32 5
35 0
37 5
40 0
42 5
4QFY11 1QFY12 2QFY12 3QFY12 4QFY12 1QFY13 2QFY13 3QFY13
( % ) ( m
i n )
MOU (min) qoq growth (%)
0.410.41
0.430.43
0.42
0.41 0.41 0.41
(2.9)
1.0
4.1
1.4
(2.5) (2.4)
0.2(0.5)
(4)
0
4
8
0.35
0.37
0.39
0.41
0.43
0.45
4QFY11 1QFY12 2QFY12 3QFY12 4QFY12 1QFY13 2QFY13 3QFY13
( % )
( ` / m i n )
ARPM (`/min) qoq growth (%)
7/29/2019 Idea, 31st January 2013
http://slidepdf.com/reader/full/idea-31st-january-2013 4/11
Idea Cellular | 3QFY2013 Result Update
January 30, 2013 4
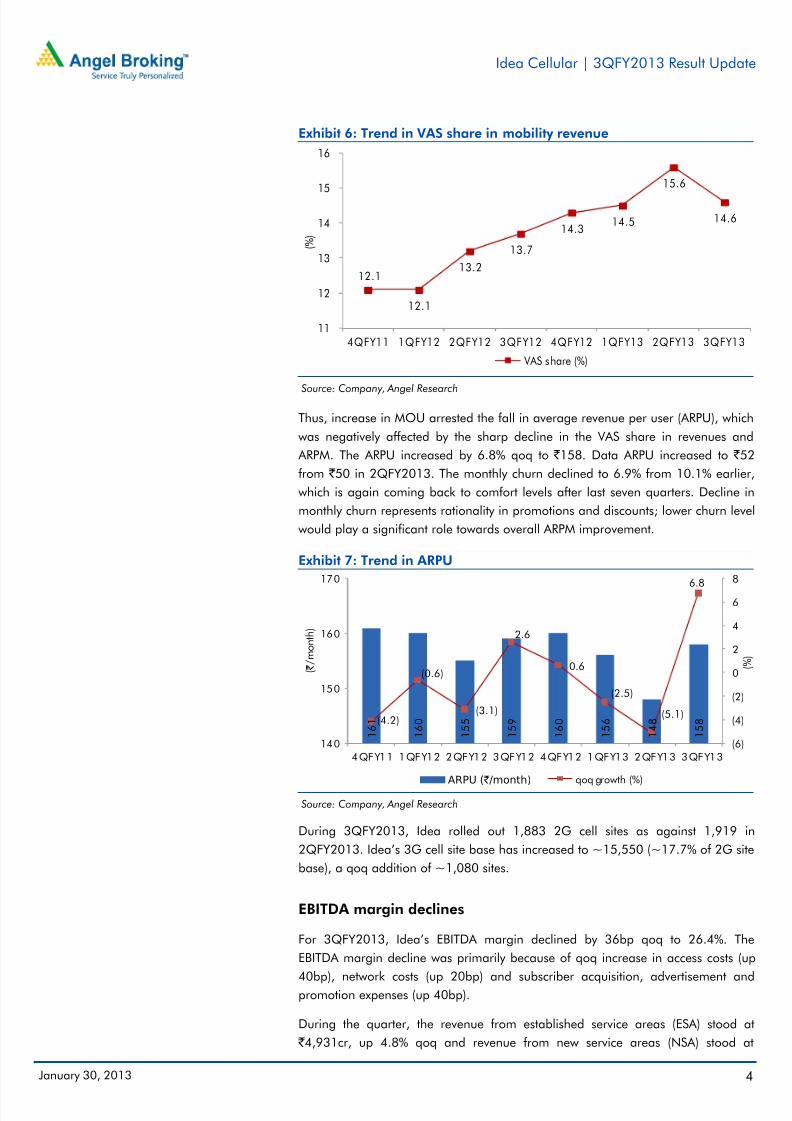
Exhibit 6: Trend in VAS share in mobility revenue
Source: Company, Angel Research
Thus, increase in MOU arrested the fall in average revenue per user (ARPU), which
was negatively affected by the sharp decline in the VAS share in revenues and
ARPM. The ARPU increased by 6.8% qoq to ` 158. Data ARPU increased to ` 52
from ` 50 in 2QFY2013. The monthly churn declined to 6.9% from 10.1% earlier,
which is again coming back to comfort levels after last seven quarters. Decline in
monthly churn represents rationality in promotions and discounts; lower churn level
would play a significant role towards overall ARPM improvement.
Exhibit 7: Trend in ARPU
Source: Company, Angel Research
During 3QFY2013, Idea rolled out 1,883 2G cell sites as against 1,919 in
2QFY2013. Idea’s 3G cell site base has increased to ~15,550 (~17.7% of 2G site
base), a qoq addition of ~1,080 sites.
EBITDA margin declines
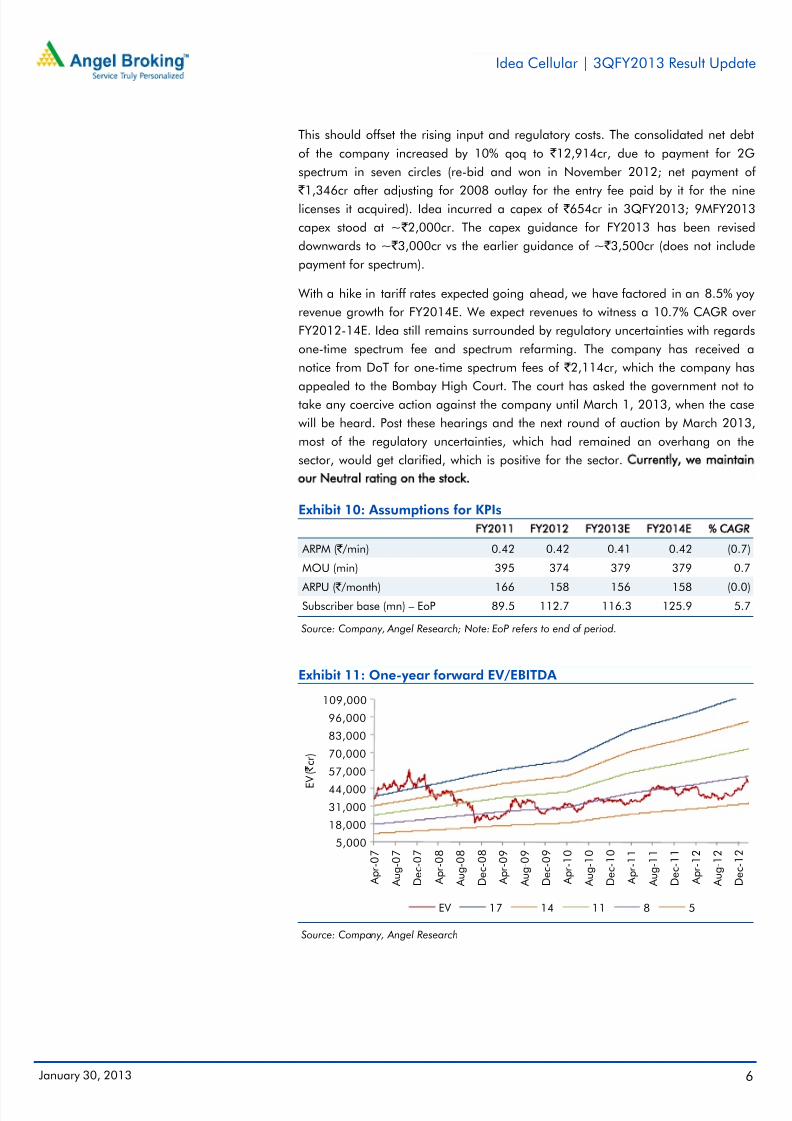
For 3QFY2013, Idea’s EBITDA margin declined by 36bp qoq to 26.4%. The
EBITDA margin decline was primarily because of qoq increase in access costs (up
40bp), network costs (up 20bp) and subscriber acquisition, advertisement andpromotion expenses (up 40bp).
During the quarter, the revenue from established service areas (ESA) stood at
` 4,931cr, up 4.8% qoq and revenue from new service areas (NSA) stood at
12.1
12.1
13.2
13.7
14.314.5
15.6
14.6
11
12
13
14
15
16
4QFY11 1QFY12 2QFY12 3QFY12 4QFY12 1QFY13 2QFY13 3QFY13
( % )
VAS share (%)
1 6 1
1 6 0
1 5 5
1 5 9
1 6 0
1 5 6
1 4 8
1 5 8(4.2)
(0.6)
(3.1)
2.6
0.6
(2.5)
(5.1)
6.8
(6)
(4)
(2)
0
2
4
6
8
140
150
160
170
4QFY11 1QFY12 2QFY12 3QFY12 4QFY12 1QFY13 2QFY13 3QFY13
( % )
( ` / m o n
t h )
ARPU (`/month) qoq growth (%)
7/29/2019 Idea, 31st January 2013
http://slidepdf.com/reader/full/idea-31st-january-2013 5/11
Idea Cellular | 3QFY2013 Result Update
January 30, 2013 5
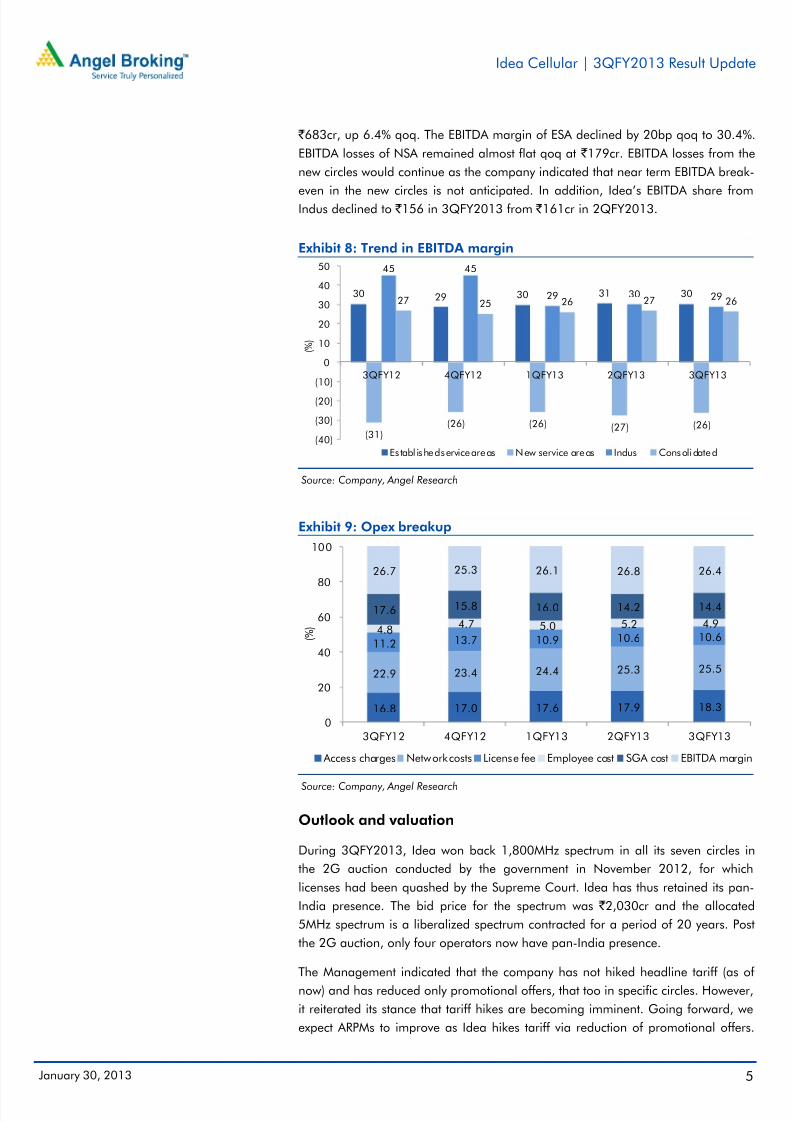
` 683cr, up 6.4% qoq. The EBITDA margin of ESA declined by 20bp qoq to 30.4%.
EBITDA losses of NSA remained almost flat qoq at ` 179cr. EBITDA losses from the
new circles would continue as the company indicated that near term EBITDA break-
even in the new circles is not anticipated. In addition, Idea’s EBITDA share fromIndus declined to ` 156 in 3QFY2013 from ` 161cr in 2QFY2013.
Exhibit 8: Trend in EBITDA margin
Source: Company, Angel Research
Exhibit 9: Opex breakup
Source: Company, Angel Research
Outlook and valuation
During 3QFY2013, Idea won back 1,800MHz spectrum in all its seven circles in
the 2G auction conducted by the government in November 2012, for which
licenses had been quashed by the Supreme Court. Idea has thus retained its pan-
India presence. The bid price for the spectrum was ` 2,030cr and the allocated
5MHz spectrum is a liberalized spectrum contracted for a period of 20 years. Post
the 2G auction, only four operators now have pan-India presence.
The Management indicated that the company has not hiked headline tariff (as of
now) and has reduced only promotional offers, that too in specific circles. However,
it reiterated its stance that tariff hikes are becoming imminent. Going forward, we
expect ARPMs to improve as Idea hikes tariff via reduction of promotional offers.
30 29 30 31 30
(31)(26) (26) (27) (26)
45 45
29 30 2927 25 26 27 26
(40)
(30)
(20)
(10)
0
10
20
30
40
50
3QFY12 4QFY12 1QFY13 2QFY13 3QFY13
( % )
Es tabl ished service areas New service areas Indus Consolidated
16.8 17.0 17.6 17.9 18.3
22.9 23.4 24.4 25.3 25.5
11.2 13.7 10.9 10.6 10.64.8
4.7 5.0 5.2 4.9
17.6 15.8 16.0 14.2 14.4
26.7 25.3 26.1 26.8 26.4
0
20
40
60
80
100
3QFY12 4QFY12 1QFY13 2QFY13 3QFY13
( % )
Access charges Network costs License fee Employee cost SGA cost EBITDA margin
7/29/2019 Idea, 31st January 2013
http://slidepdf.com/reader/full/idea-31st-january-2013 6/11
Idea Cellular | 3QFY2013 Result Update
January 30, 2013 6
This should offset the rising input and regulatory costs. The consolidated net debt
of the company increased by 10% qoq to ` 12,914cr, due to payment for 2G
spectrum in seven circles (re-bid and won in November 2012; net payment of
` 1,346cr after adjusting for 2008 outlay for the entry fee paid by it for the nine
licenses it acquired). Idea incurred a capex of ` 654cr in 3QFY2013; 9MFY2013
capex stood at ~ ` 2,000cr. The capex guidance for FY2013 has been revised
downwards to ~ ` 3,000cr vs the earlier guidance of ~ ` 3,500cr (does not include
payment for spectrum).
With a hike in tariff rates expected going ahead, we have factored in an 8.5% yoy
revenue growth for FY2014E. We expect revenues to witness a 10.7% CAGR over
FY2012-14E. Idea still remains surrounded by regulatory uncertainties with regards
one-time spectrum fee and spectrum refarming. The company has received a
notice from DoT for one-time spectrum fees of ` 2,114cr, which the company has
appealed to the Bombay High Court. The court has asked the government not totake any coercive action against the company until March 1, 2013, when the case
will be heard. Post these hearings and the next round of auction by March 2013,
most of the regulatory uncertainties, which had remained an overhang on the
sector, would get clarified, which is positive for the sector.
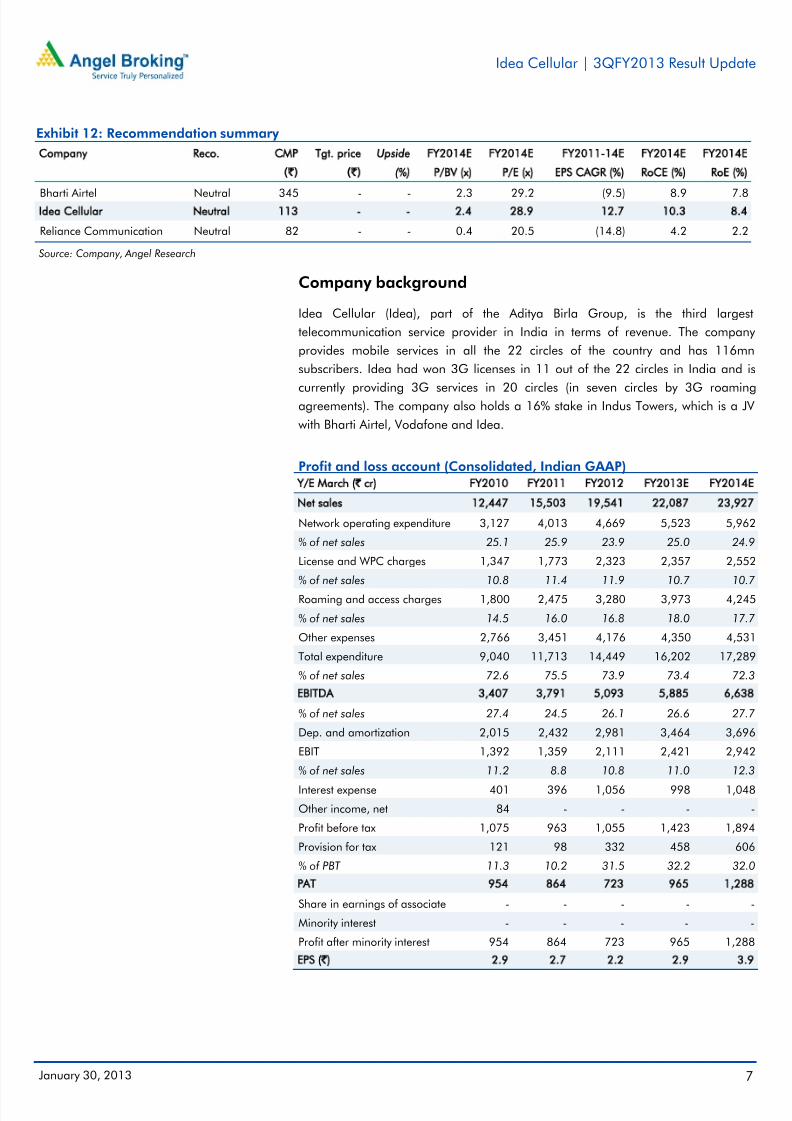
Exhibit 10: Assumptions for KPIs
ARPM ( ` /min) 0.42 0.42 0.41 0.42 (0.7)
MOU (min) 395 374 379 379 0.7
ARPU ( ` /month) 166 158 156 158 (0.0)Subscriber base (mn) – EoP 89.5 112.7 116.3 125.9 5.7
Source: Company, Angel Research; Note: EoP refers to end of period.
Exhibit 11: One-year forward EV/EBITDA
Source: Company, Angel Research
5,000
18,000
31,000
44,000
57,000
70,000
83,000
96,000
109,000
A p r -
0 7
A u g - 0
7
D e c - 0
7
A p r -
0 8
A u g - 0
8
D e c - 0
8
A p r -
0 9
A u g - 0
9
D e c - 0
9
A p r -
1 0
A u g - 1
0
D e c - 1
0
A p r -
1 1
A u g - 1
1
D e c - 1
1
A p r -
1 2
A u g - 1
2
D e c - 1
2
E
V ( ` c r )
EV 17 14 11 8 5
7/29/2019 Idea, 31st January 2013
http://slidepdf.com/reader/full/idea-31st-january-2013 7/11
Idea Cellular | 3QFY2013 Result Update
January 30, 2013 7
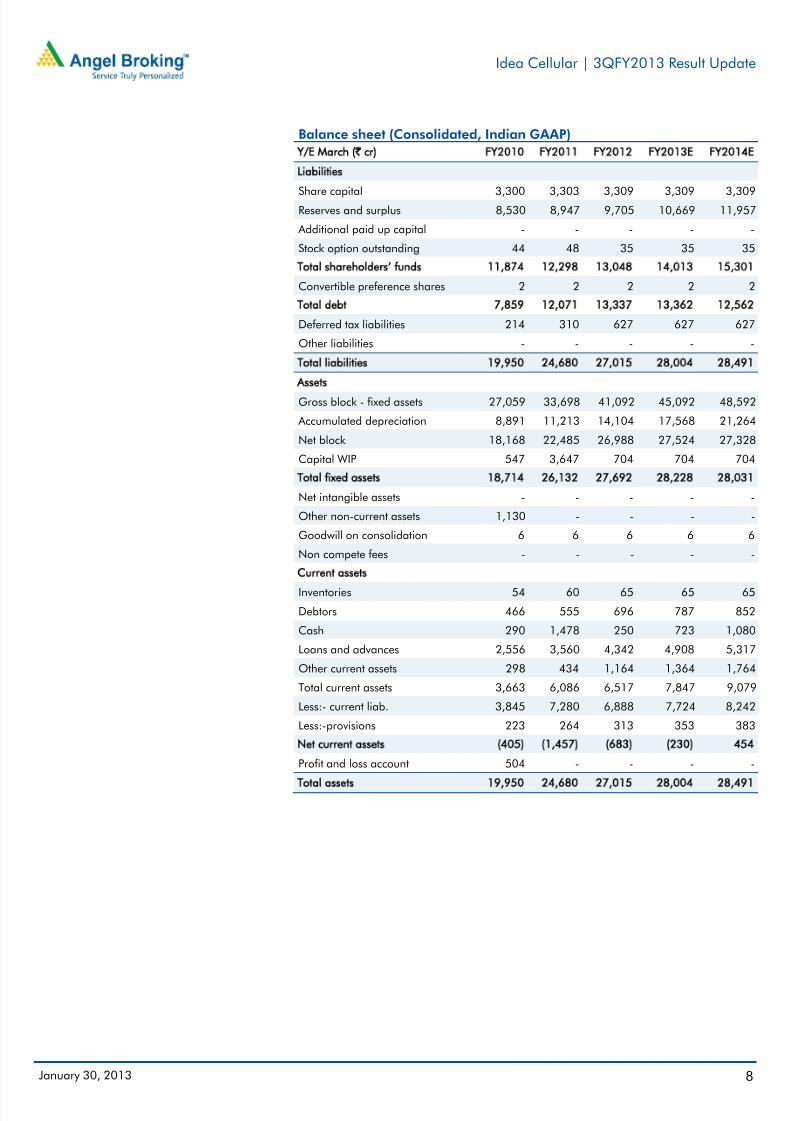
Exhibit 12: Recommendation summary
Bharti Airtel Neutral 345 - - 2.3 29.2 (9.5) 8.9 7.8
Reliance Communication Neutral 82 - - 0.4 20.5 (14.8) 4.2 2.2
Source: Company, Angel Research
Company background
Idea Cellular (Idea), part of the Aditya Birla Group, is the third largest
telecommunication service provider in India in terms of revenue. The company
provides mobile services in all the 22 circles of the country and has 116mn
subscribers. Idea had won 3G licenses in 11 out of the 22 circles in India and is
currently providing 3G services in 20 circles (in seven circles by 3G roamingagreements). The company also holds a 16% stake in Indus Towers, which is a JV
with Bharti Airtel, Vodafone and Idea.
Profit and loss account (Consolidated, Indian GAAP)
Network operating expenditure 3,127 4,013 4,669 5,523 5,962
% of net sales 25.1 25.9 23.9 25.0 24.9
License and WPC charges 1,347 1,773 2,323 2,357 2,552
% of net sales 10.8 11.4 11.9 10.7 10.7
Roaming and access charges 1,800 2,475 3,280 3,973 4,245
% of net sales 14.5 16.0 16.8 18.0 17.7
Other expenses 2,766 3,451 4,176 4,350 4,531
Total expenditure 9,040 11,713 14,449 16,202 17,289
% of net sales 72.6 75.5 73.9 73.4 72.3
% of net sales 27.4 24.5 26.1 26.6 27.7
Dep. and amortization 2,015 2,432 2,981 3,464 3,696
EBIT 1,392 1,359 2,111 2,421 2,942
% of net sales 11.2 8.8 10.8 11.0 12.3
Interest expense 401 396 1,056 998 1,048
Other income, net 84 - - - -
Profit before tax 1,075 963 1,055 1,423 1,894
Provision for tax 121 98 332 458 606
% of PBT 11.3 10.2 31.5 32.2 32.0
Share in earnings of associate - - - - -
Minority interest - - - - -
Profit after minority interest 954 864 723 965 1,288
7/29/2019 Idea, 31st January 2013
http://slidepdf.com/reader/full/idea-31st-january-2013 8/11
Idea Cellular | 3QFY2013 Result Update
January 30, 2013 8
Balance sheet (Consolidated, Indian GAAP)
Share capital 3,300 3,303 3,309 3,309 3,309Reserves and surplus 8,530 8,947 9,705 10,669 11,957
Additional paid up capital - - - - -
Stock option outstanding 44 48 35 35 35
Convertible preference shares 2 2 2 2 2
Deferred tax liabilities 214 310 627 627 627
Other liabilities - - - - -
Gross block - fixed assets 27,059 33,698 41,092 45,092 48,592
Accumulated depreciation 8,891 11,213 14,104 17,568 21,264
Net block 18,168 22,485 26,988 27,524 27,328
Capital WIP 547 3,647 704 704 704
Net intangible assets - - - - -
Other non-current assets 1,130 - - - -
Goodwill on consolidation 6 6 6 6 6
Non compete fees - - - - -
Inventories 54 60 65 65 65
Debtors 466 555 696 787 852
Cash 290 1,478 250 723 1,080
Loans and advances 2,556 3,560 4,342 4,908 5,317
Other current assets 298 434 1,164 1,364 1,764
Total current assets 3,663 6,086 6,517 7,847 9,079
Less:- current liab. 3,845 7,280 6,888 7,724 8,242
Less:-provisions 223 264 313 353 383
Profit and loss account 504 - - - -
7/29/2019 Idea, 31st January 2013
http://slidepdf.com/reader/full/idea-31st-january-2013 9/11
Idea Cellular | 3QFY2013 Result Update
January 30, 2013 9
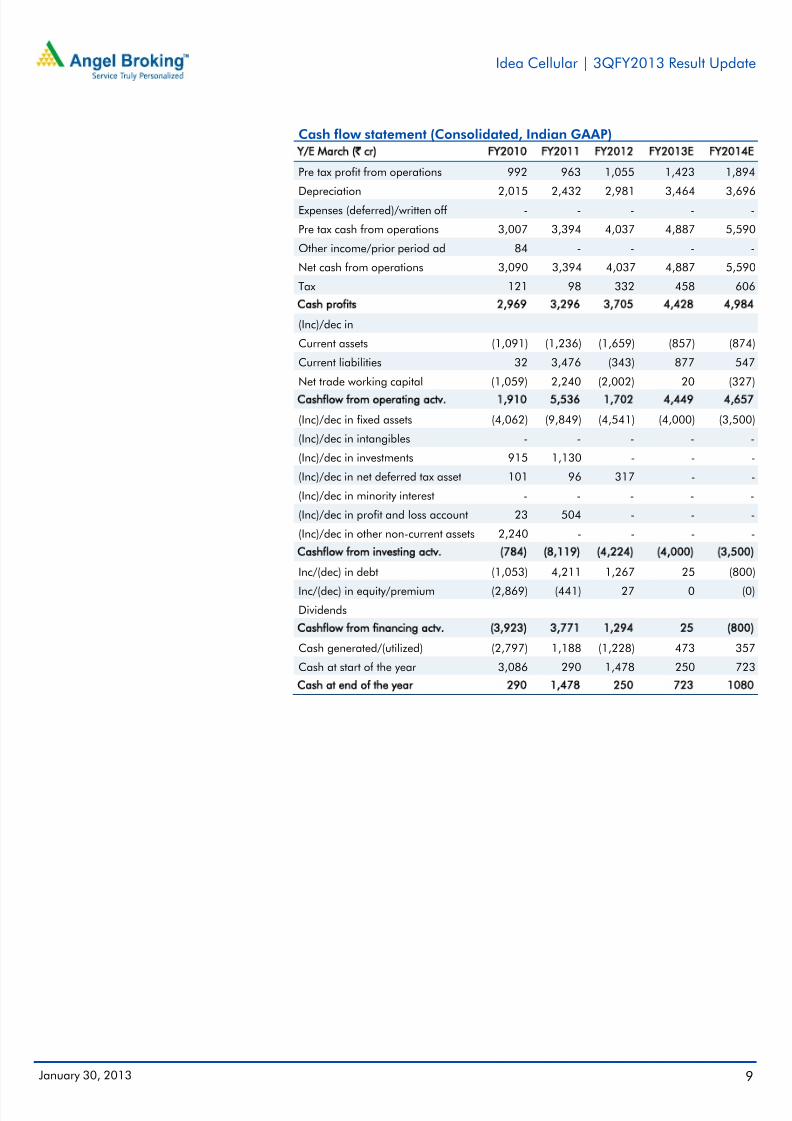
Cash flow statement (Consolidated, Indian GAAP)
Pre tax profit from operations 992 963 1,055 1,423 1,894
Depreciation 2,015 2,432 2,981 3,464 3,696Expenses (deferred)/written off - - - - -
Pre tax cash from operations 3,007 3,394 4,037 4,887 5,590
Other income/prior period ad 84 - - - -
Net cash from operations 3,090 3,394 4,037 4,887 5,590
Tax 121 98 332 458 606
(Inc)/dec in
Current assets (1,091) (1,236) (1,659) (857) (874)
Current liabilities 32 3,476 (343) 877 547
Net trade working capital (1,059) 2,240 (2,002) 20 (327)
(Inc)/dec in fixed assets (4,062) (9,849) (4,541) (4,000) (3,500)
(Inc)/dec in intangibles - - - - -
(Inc)/dec in investments 915 1,130 - - -
(Inc)/dec in net deferred tax asset 101 96 317 - -
(Inc)/dec in minority interest - - - - -
(Inc)/dec in profit and loss account 23 504 - - -
(Inc)/dec in other non-current assets 2,240 - - - -
Inc/(dec) in debt (1,053) 4,211 1,267 25 (800)
Inc/(dec) in equity/premium (2,869) (441) 27 0 (0)
Dividends
Cash generated/(utilized) (2,797) 1,188 (1,228) 473 357
Cash at start of the year 3,086 290 1,478 250 723
7/29/2019 Idea, 31st January 2013
http://slidepdf.com/reader/full/idea-31st-january-2013 10/11
Idea Cellular | 3QFY2013 Result Update
January 30, 2013 10
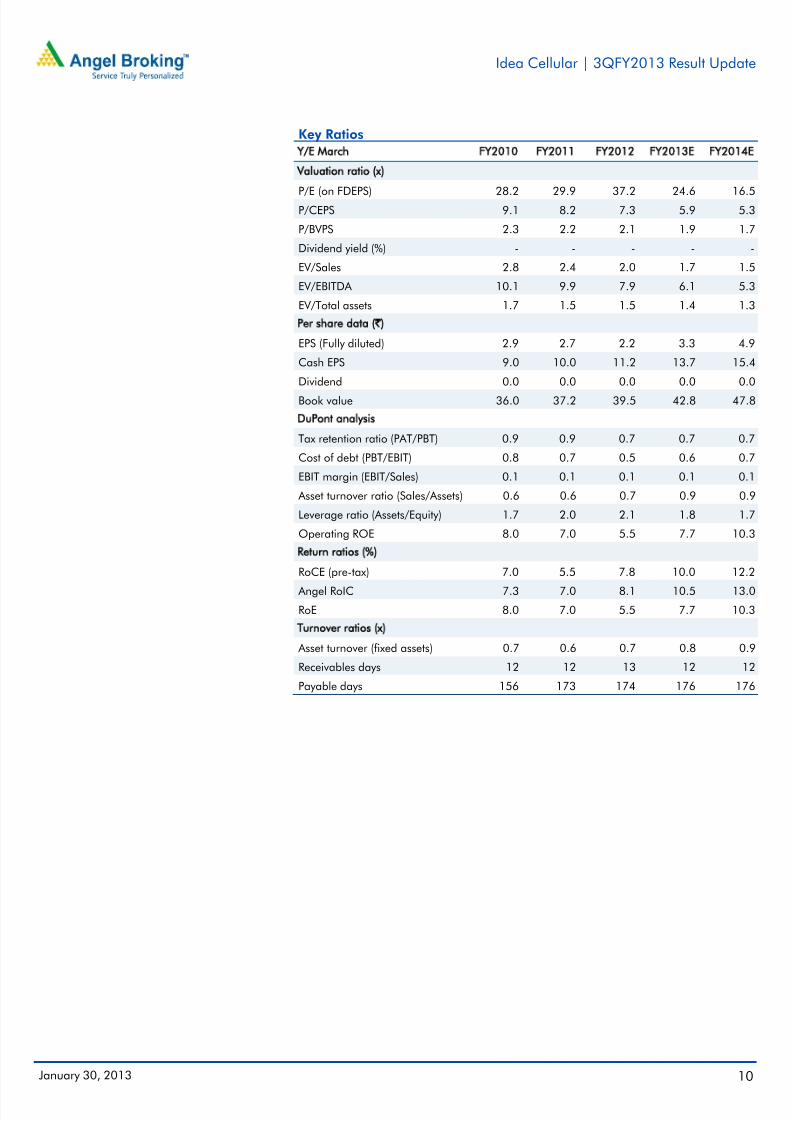
Key Ratios
P/E (on FDEPS) 28.2 29.9 37.2 24.6 16.5P/CEPS 9.1 8.2 7.3 5.9 5.3
P/BVPS 2.3 2.2 2.1 1.9 1.7
Dividend yield (%) - - - - -
EV/Sales 2.8 2.4 2.0 1.7 1.5
EV/EBITDA 10.1 9.9 7.9 6.1 5.3
EV/Total assets 1.7 1.5 1.5 1.4 1.3
EPS (Fully diluted) 2.9 2.7 2.2 3.3 4.9
Cash EPS 9.0 10.0 11.2 13.7 15.4
Dividend 0.0 0.0 0.0 0.0 0.0
Book value 36.0 37.2 39.5 42.8 47.8
Tax retention ratio (PAT/PBT) 0.9 0.9 0.7 0.7 0.7
Cost of debt (PBT/EBIT) 0.8 0.7 0.5 0.6 0.7
EBIT margin (EBIT/Sales) 0.1 0.1 0.1 0.1 0.1
Asset turnover ratio (Sales/Assets) 0.6 0.6 0.7 0.9 0.9
Leverage ratio (Assets/Equity) 1.7 2.0 2.1 1.8 1.7
Operating ROE 8.0 7.0 5.5 7.7 10.3
RoCE (pre-tax) 7.0 5.5 7.8 10.0 12.2
Angel RoIC 7.3 7.0 8.1 10.5 13.0
RoE 8.0 7.0 5.5 7.7 10.3
Asset turnover (fixed assets) 0.7 0.6 0.7 0.8 0.9
Receivables days 12 12 13 12 12
Payable days 156 173 174 176 176
7/29/2019 Idea, 31st January 2013
http://slidepdf.com/reader/full/idea-31st-january-2013 11/11
Idea Cellular | 3QFY2013 Result Update
January 30, 2013 11
Research Team Tel: 022 - 3935 7800 E-mail: [email protected] Website: www.angelbroking.com
This document is solely for the personal information of the recipient, and must not be singularly used as the basis of any investment
decision. Nothing in this document should be construed as investment or financial advice. Each recipient of this document should make
such investigations as they deem necessary to arrive at an independent evaluation of an investment in the securities of the companies
referred to in this document (including the merits and risks involved), and should consult their own advisors to determine the merits and
risks of such an investment.
Angel Broking Limited, its affiliates, directors, its proprietary trading and investment businesses may, from time to time, make
investment decisions that are inconsistent with or contradictory to the recommendations expressed herein. The views contained in this
document are those of the analyst, and the company may or may not subscribe to all the views expressed within.
Reports based on technical and derivative analysis center on studying charts of a stock's price movement, outstanding positions and
trading volume, as opposed to focusing on a company's fundamentals and, as such, may not match with a report on a company's
fundamentals.
The information in this document has been printed on the basis of publicly available information, internal data and other reliablesources believed to be true, but we do not represent that it is accurate or complete and it should not be relied on as such, as thisdocument is for general guidance only. Angel Broking Limited or any of its affiliates/ group companies shall not be in any way responsible for any loss or damage that may arise to any person from any inadvertent error in the information contained in this report .
Angel Broking Limited has not independently verified all the information contained within this document. Accordingly, we cannot testify,nor make any representation or warranty, express or implied, to the accuracy, contents or data contained within this document. While Angel Broking Limited endeavours to update on a reasonable basis the information discussed in this material, there may be regulatory,compliance, or other reasons that prevent us from doing so.
This document is being supplied to you solely for your information, and its contents, information or data may not be reproduced,
redistributed or passed on, directly or indirectly.
Angel Broking Limited and its affiliates may seek to provide or have engaged in providing corporate finance, investment banking orother advisory services in a merger or specific transaction to the companies referred to in this report, as on the date of this report or in
the past.
Neither Angel Broking Limited, nor its directors, employees or affiliates shall be liable for any loss or damage that may arise from or in
connection with the use of this information.
Note: Please refer to the important `Stock Holding Disclosure' report on the Angel website (Research Section). Also, pleaserefer to the latest update on respective stocks for the disclosure status in respect of those stocks. Angel Broking Limited andits affiliates may have investment positions in the stocks recommended in this report.
Disclosure of Interest Statement Idea Cellular
1. Analyst ownership of the stock No
2. Angel and its Group companies ownership of the stock No
3. Angel and its Group companies' Directors ownership of the stock No
4. Broking relationship with company covered No
Buy (> 15%) Accumulate (5% to 15%) Neutral (-5 to 5%)Reduce (-5% to -15%) Sell (< -15%)
Note: We have not considered any Exposure below ` 1 lakh for Angel, its Group companies and Directors