hain celestial is - iis windows...
TRANSCRIPT

Hain Celestial is . . .2008 ANNUAL REPORT

SELECTED PRODUCTS
Hain Celestial is… providing natural and organic products that consumers love.
2008 ANNUAL REPORT 1
People Driven We capitalize on the talents of our dedicated people to drive our business and geographic expansion.
Innovative We introduce innovative products that produce solid sales every year, including a record $1 billion in fi scal year 2008.
Strategic We execute growth strategies aimed at creating long-term shareholder value.
Financially Strong We generate strong cash fl ow and maintain a strong balance sheet to fuel our growth.
The Hain Celestial Group,
headquartered in Melville, N.Y.,
is a leading natural and organic
products company in North
America and Europe. Hain Celestial
is a leader across many natural
food and personal care categories,
with well-known brands that
include: Celestial Seasonings®,
Terra®, Garden of Eatin’®, Health
Valley®, WestSoy®, Earth’s Best®,
Arrowhead Mills®, MaraNatha®,
SunSpire®, DeBoles®, Hain Pure
Foods®, FreeBird™, Plainville
Farms®, Hollywood®, Spectrum
Naturals®, Spectrum Essentials®,
Walnut Acres Organic®, Westbrae
Natural®, Imagine®, Rice Dream®,
Soy Dream®, Rosetto®, Ethnic
Gourmet®, Casbah®, Nile Spice®,
Yves Veggie Cuisine®, Granose®,
Realeat®, Linda McCartney®, Daily
Bread™, Grans Noirs®, Lima®,
Natumi®, JASON®, Zia® Natural
Skincare, Avalon Organics®, Alba
Botanica®, Queen Helene®, Tushies®
and TenderCare®. The Company’s
principal specialty product lines
include Estee® sugar-free products
and Alba® non-fat dry milk and
fl avored shakes. Hain Celestial has
been providing A Healthy Way of
Life™ since 1993. The Hain Celestial
Group common stock trades on
The NASDAQ® Global Select Market
under symbol HAIN.
For more information, please
visit the Company’s web site at
www.hain-celestial.com.
COMPANY PROFILE
. . .
2 THE HAIN CELESTIAL GROUP, INC.
During the fi scal year,
Hain Celestial
Passed the $1 billion sales milestone;
Delivered double-digit growth in
sales and adjusted earnings;
Acquired several brands in fast-
growing categories that strengthened
its portfolio and enabled it to
expand in—or enter—new product
categories and distribution channels;
Continued to satisfy consumer
demand by introducing more than
50 new and innovative products that
garnered consumer acceptance
and generated sales that surpassed
the industry average for new products;
Boosted productivity and drove new
effi ciencies in all business units,
including a Stock Keeping Unit
rationalization and reorganization
principally in Personal Care;
Hain Celestial is… able to overcome a tough economic environment to build long-term shareholder value.
Strengthened its commitment
to corporate social responsibility
by continuing to foster a culture
of environmental accountability.
These operating achievements and
others led to signifi cant industry
recognition for the Company,
including being selected as one of
“2008’s Best Green Companies for
America’s Children” by Working
Mother magazine, receiving a “Best
Green Companies Award 2008”
by The Sunday Times of London and
being named as one of the “Top 100
Beauty Companies Worldwide”
by Women’s Wear Daily.
How did Hain Celestial deliver
record performance in such
challenging times? More importantly,
how will the Company sustain this
strong performance in the future?
Irwin D. Simon, Hain Celestial’s
President, Chief Executive Offi cer
and Chairman of the Board, recently
set out to respond to these questions
and provide answers aimed at
assisting its shareholders and
customers in understanding exactly
what Hain Celestial is all about.
OVERVIEW OF FISCAL YEAR 2008
In spite of an exceptionally tough operating environment, fi scal
year 2008 was a time of fi nancial growth and solid performance.
It was also a period in which the Company made marked progress
toward fulfi lling our mission of becoming the leading marketer,
manufacturer and seller of natural and organic products.
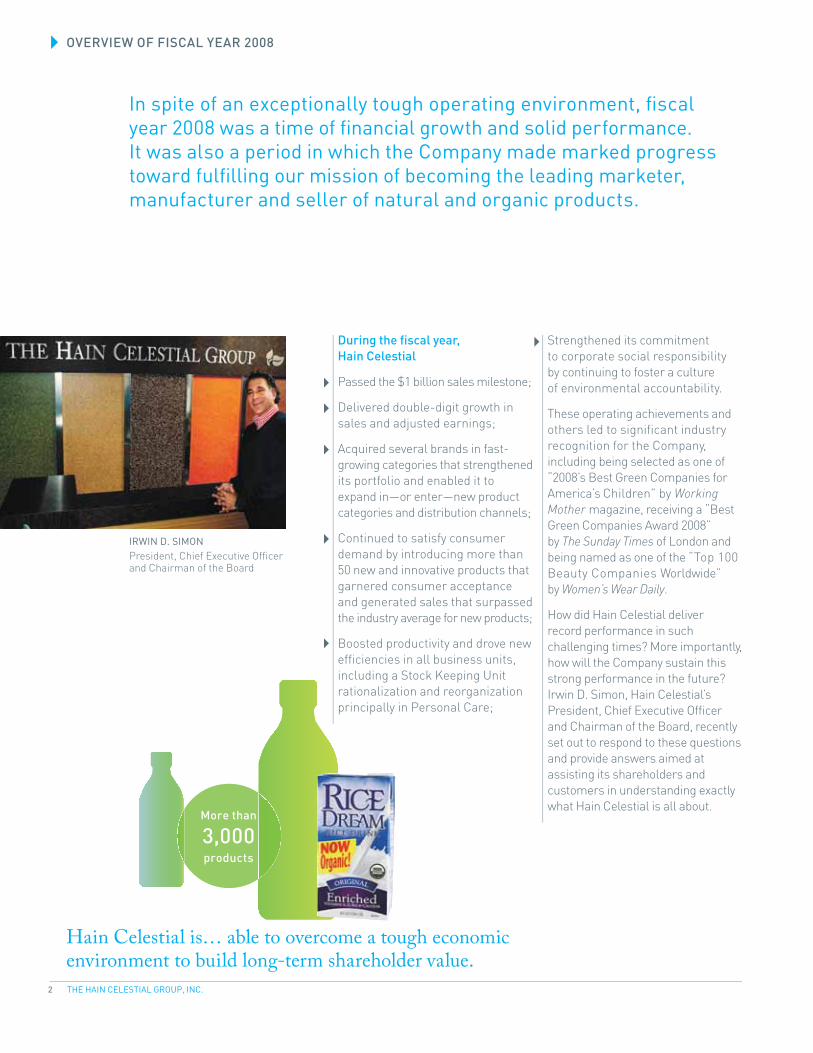
IRWIN D. SIMON
President, Chief Executive Offi cer and Chairman of the Board
More than
3,000products

2008 ANNUAL REPORT 3
Q Hain Celestial performed at
record levels in fi scal year 2008 in
spite of an extremely challenging
global economy, rising commodity
prices and infl ationary pressures.
What are the secrets to the
Company’s success?
I believe that Hain Celestial is well
positioned to perform in virtually
every economic cycle. We have proven
operating and fi nancial strategies
and an effective management team
to execute them. We have a portfolio
of brands that are well-regarded
by consumers in a sector of the
market that’s been growing steadily.
Our commitment to stringent quality
standards allows us to produce
healthful products that can be
marketed cost effi ciently across a
broad array of distribution channels
that have grown and expanded every
year. We are nimble enough to
implement price increases, as
needed, and productivity initiatives
that have mitigated short-term
economic pressures. Our balance
sheet is strong, and we have
stringent internal guidelines for
acquisitions that require our
transactions to measure up. Last
but not least, we have dedicated
employees around the world, many
of whom are shareholders, which
means that their interests are
directly aligned with those of our
investors. These factors and others
helped us to deliver growth in fi scal
year 2008, in spite of the external
environmental conditions. They
also positioned us advantageously
for future growth.
Q Hain Celestial delivered record
sales in fi scal year 2008. That’s
a milestone of which you must
be very proud.
You’re right. In fi scal year 2008, we
delivered $1 billion in sales, and
we had more than 3,000 products
and over 40 brands in the Hain
Celestial family, including Grocery
and Snack brands such as
Celestial Seasonings®, Earth’s
Best®, Terra®, Rice Dream® and
Garden of Eatin’®, and Personal
Care brands such as Alba
Botanica®, Avalon Organics® and
JASON®, to name a few. Compare
that with fi scal year 1998, when we
delivered just $174 million in
sales. You can see how far we’ve
come—and how far we still can go.
Over$1 billionin sales
Q&A WITH THE CHAIRMAN
Selected as one
of “2008’s Best
Green Companies
for America’s
Children”

4 THE HAIN CELESTIAL GROUP, INC.
Q Are you concerned in the
current economy that consumers
may migrate back to conventional
products and more traditional
consumer packaged goods?
Consumers are deeply loyal to our
brands, and they’ve demonstrated
that they’re willing to pay a little
more for products that are better for
them. Our grocery, snacks and tea
products sell for an average price
of $3.99 in the United States and a
10% to 15% premium over
conventional products.
So we’re not talking about luxury
foods—we’re talking about
consumer staples. People today
want to be healthy; these are folks
who work out vigorously to remain
fi t. They’re better informed about
what’s on product labels, they know
they have to eat right to remain
healthy, and they’re staying home
more often than ever to eat.
We reported record sales in a year
when fuel and commodity prices
hit all-time highs. We believe that’s
a resounding endorsement of the
strength of our brands, the priority
that consumers place on our
healthful products, and the “staying
power” that our products have in
consumers’ budgets.
2008
2007
2006
2005
2004
2003
Our grocery, snacks
and tea products sell for
an average price of
$3.99in the United States
OUR INTEGRATED APPROACH HAS ENABLED US TO TRANSFORM
LITTLE-KNOWN BRANDS INTO MAJOR SUCCESS STORIES.
2008 ANNUAL REPORT 5
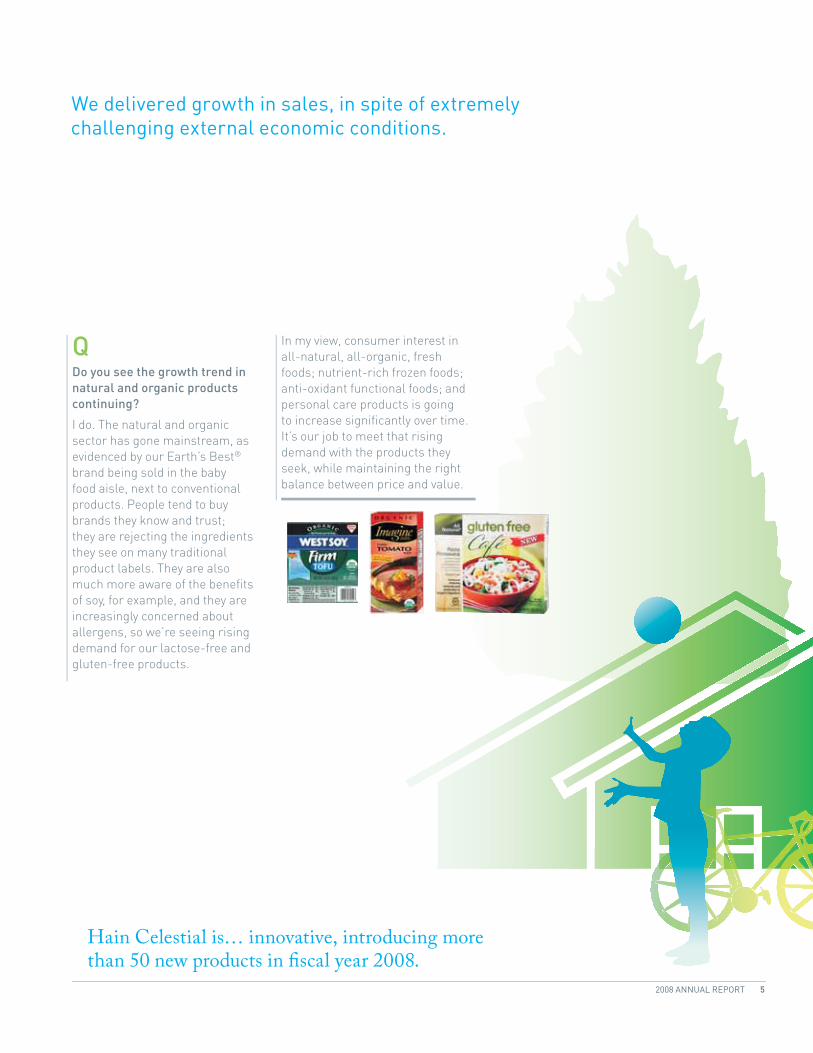
Q Do you see the growth trend in
natural and organic products
continuing?
I do. The natural and organic
sector has gone mainstream, as
evidenced by our Earth’s Best®
brand being sold in the baby
food aisle, next to conventional
products. People tend to buy
brands they know and trust;
they are rejecting the ingredients
they see on many traditional
product labels. They are also
much more aware of the benefi ts
of soy, for example, and they are
increasingly concerned about
allergens, so we’re seeing rising
demand for our lactose-free and
gluten-free products.
In my view, consumer interest in
all-natural, all-organic, fresh
foods; nutrient-rich frozen foods;
anti-oxidant functional foods; and
personal care products is going
to increase signifi cantly over time.
It’s our job to meet that rising
demand with the products they
seek, while maintaining the right
balance between price and value.
We delivered growth in sales, in spite of extremely
challenging external economic conditions.
Hain Celestial is… innovative, introducing more than 50 new products in fi scal year 2008.
6 THE HAIN CELESTIAL GROUP, INC.
Q You’ve expanded the Company
through a combination of internal
and external growth. What is Hain
Celestial’s acquisition strategy,
and what value does the Company
add to the businesses it acquires?
Our acquisition strategy is simple,
yet highly disciplined. We acquire
market-leading brands in fast-
growing categories that complement
our existing brands, product lines
and categories—or open new
distribution channels for us. During
fi scal year 2008, we capitalized on
that strategy by making several key
acquisitions in the United States
and the United Kingdom. We then
add value to those acquisitions by
integrating the brands under our
centralized management team,
applying our marketing expertise
to energize the brands, and
harnessing our innovative skills
to improve taste and extend the
product lines into different
categories. We also apply pricing
and cost disciplines to build
margins and drive sales through
our distribution channels, including
grocers, supermarkets, mass-
marketers and specialty retailer
customers. Our integrated
approach has enabled us to
transform little-known brands
into major success stories like
Celestial Seasonings®, Earth’s
Best® and Terra®.
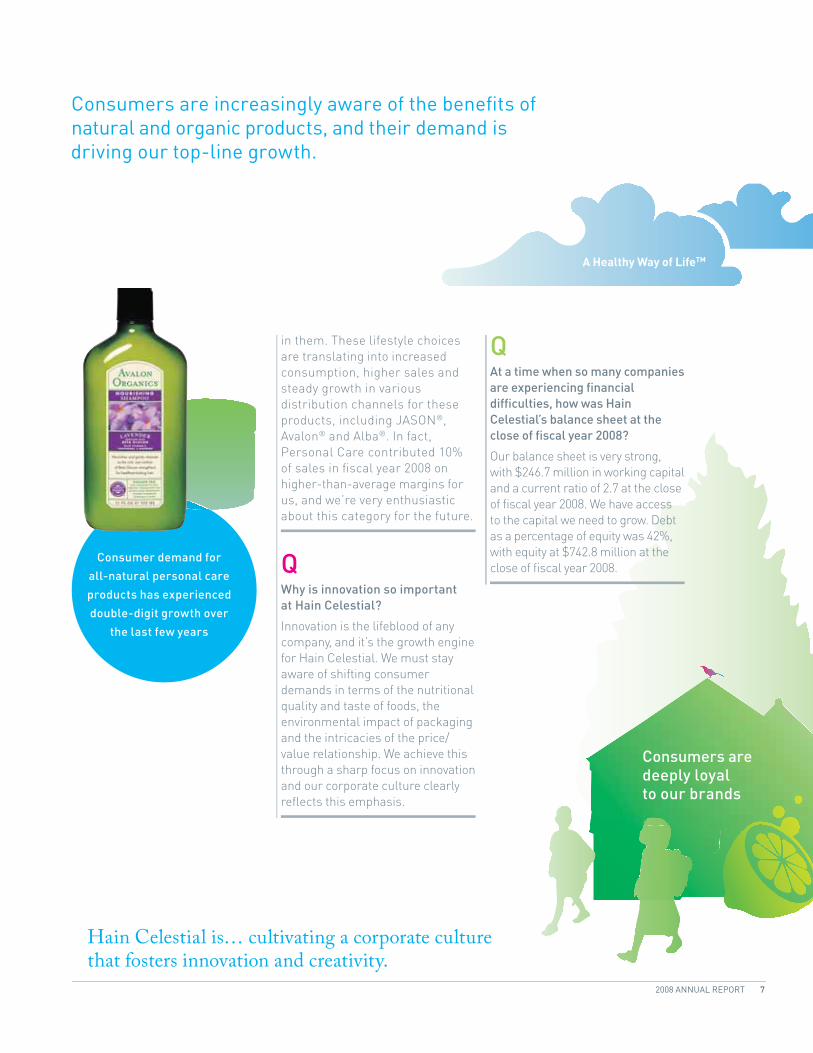
QPersonal Care is growing in
importance at Hain Celestial.
Where does it fi t at a company
that has principally been engaged
in the manufacturing and
distribution of food products?
Consumer demand for all-natural
personal care products has
experienced double-digit growth
over the last few years, driven
by the same factors that are
boosting demand for healthful
foods. Consumers are seeking to
live healthy lifestyles in every
aspect—what they put on their
bodies, as well as what they put
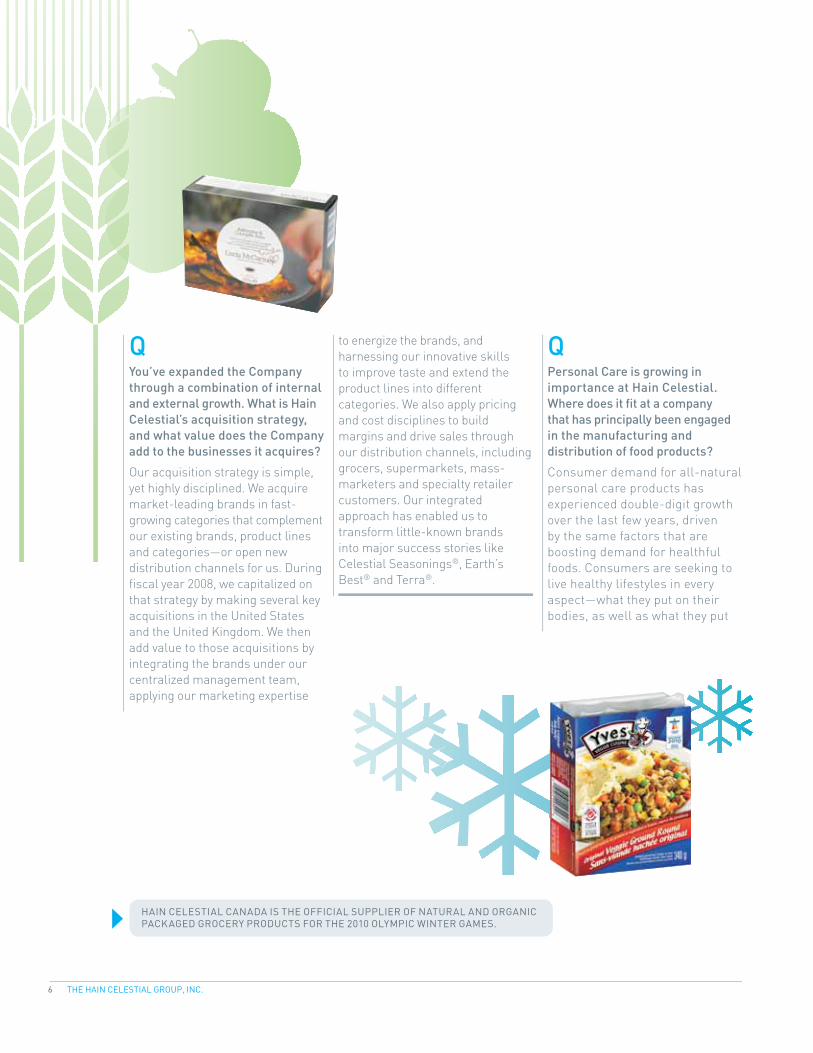
HAIN CELESTIAL CANADA IS THE OFFICIAL SUPPLIER OF NATURAL AND ORGANIC
PACKAGED GROCERY PRODUCTS FOR THE 2010 OLYMPIC WINTER GAMES.
2008 ANNUAL REPORT 7
Consumers are deeply loyal to our brands
Q At a time when so many companies
are experiencing fi nancial
diffi culties, how was Hain
Celestial’s balance sheet at the
close of fi scal year 2008?
Our balance sheet is very strong,
with $246.7 million in working capital
and a current ratio of 2.7 at the close
of fi scal year 2008. We have access
to the capital we need to grow. Debt
as a percentage of equity was 42%,
with equity at $742.8 million at the
close of fi scal year 2008.
in them. These lifestyle choices
are translating into increased
consumption, higher sales and
steady growth in various
distribution channels for these
products, including JASON®,
Avalon® and Alba®. In fact,
Personal Care contributed 10%
of sales in fi scal year 2008 on
higher-than-average margins for
us, and we’re very enthusiastic
about this category for the future.
QWhy is innovation so important
at Hain Celestial?
Innovation is the lifeblood of any
company, and it’s the growth engine
for Hain Celestial. We must stay
aware of shifting consumer
demands in terms of the nutritional
quality and taste of foods, the
environmental impact of packaging
and the intricacies of the price/
value relationship. We achieve this
through a sharp focus on innovation
and our corporate culture clearly
refl ects this emphasis.
Hain Celestial is… cultivating a corporate culture that fosters innovation and creativity.
Consumers are increasingly aware of the benefi ts of
natural and organic products, and their demand is
driving our top-line growth.
Consumer demand for
all-natural personal care
products has experienced
double-digit growth over
the last few years
A Healthy Way of LifeTM
8 THE HAIN CELESTIAL GROUP, INC.
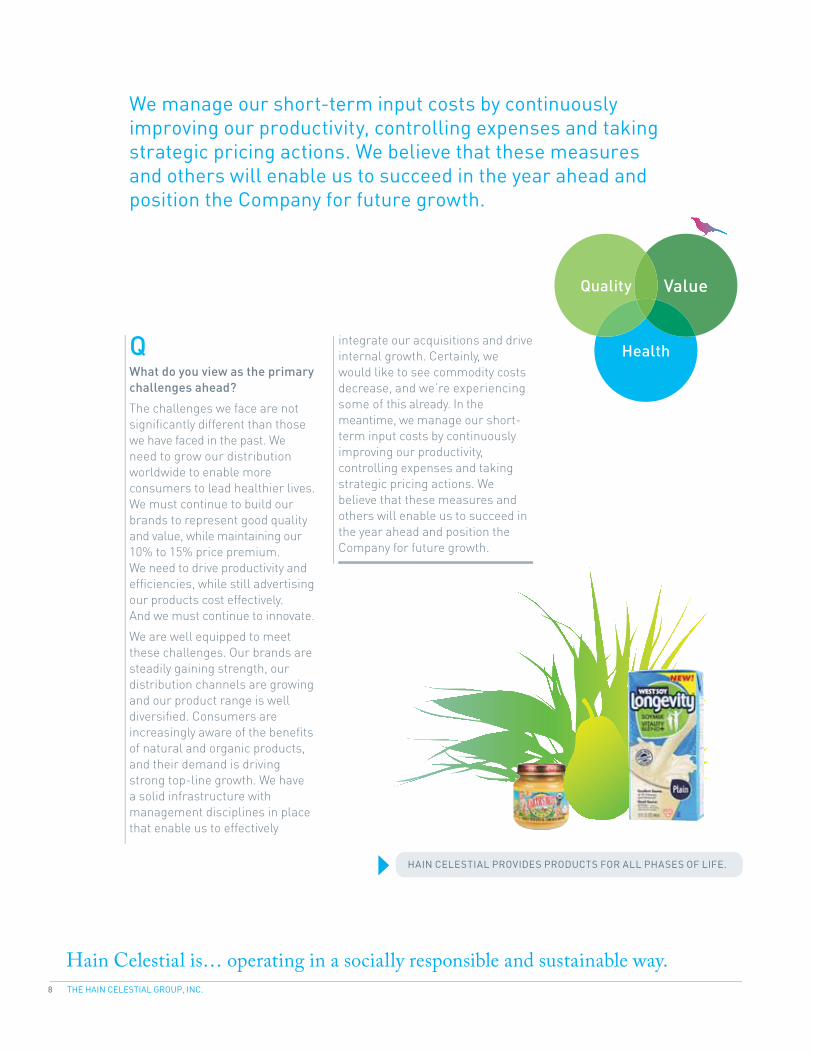
Q What do you view as the primary
challenges ahead?
The challenges we face are not
signifi cantly different than those
we have faced in the past. We
need to grow our distribution
worldwide to enable more
consumers to lead healthier lives.
We must continue to build our
brands to represent good quality
and value, while maintaining our
10% to 15% price premium.
We need to drive productivity and
effi ciencies, while still advertising
our products cost effectively.
And we must continue to innovate.
We are well equipped to meet
these challenges. Our brands are
steadily gaining strength, our
distribution channels are growing
and our product range is well
diversifi ed. Consumers are
increasingly aware of the benefi ts
of natural and organic products,
and their demand is driving
strong top-line growth. We have
a solid infrastructure with
management disciplines in place
that enable us to effectively
integrate our acquisitions and drive
internal growth. Certainly, we
would like to see commodity costs
decrease, and we’re experiencing
some of this already. In the
meantime, we manage our short-
term input costs by continuously
improving our productivity,
controlling expenses and taking
strategic pricing actions. We
believe that these measures and
others will enable us to succeed in
the year ahead and position the
Company for future growth.
Hain Celestial is… operating in a socially responsible and sustainable way.
We manage our short-term input costs by continuously
improving our productivity, controlling expenses and taking
strategic pricing actions. We believe that these measures
and others will enable us to succeed in the year ahead and
position the Company for future growth.
HAIN CELESTIAL PROVIDES PRODUCTS FOR ALL PHASES OF LIFE.
Health
ValueQuality

Financial Results . . .THE HAIN CELESTIAL GROUP
2008 ANNUAL REPORT 9

10 THE HAIN CELESTIAL GROUP, INC.
Fiscal 2008 Financial Highlights
(1) Operating results adjusted to exclude the effects of $7.5 million ($5.4 million net of tax), or $.13 per share, of start-up and integration costs in the United Kingdom; $10.8 million
($6.9 million net of tax), or $.16 per share of SKU rationalization and other reorganization costs; $5.8 million ($3.5 million net of tax), or $.08 per share of professional fees
related to the review of the Company’s stock option practices; $2.1 million ($2.9 million net of tax), or $.07 per share, of stock-based compensation expense. Net income also
adjusted to exclude the gain on the sale of a joint venture interest of $1.2 million, net of tax, or $.03 per share.
(2) Operating results adjusted to exclude the effects of $1.7 million ($1.1 million net of tax), or $.03 per share, of start-up costs at the Company’s West Chester frozen foods facility
and $0.3 million ($0.2 million net of tax), of professional fees related to the review of the Company’s stock option practices. Net income also adjusted to exclude a gain on the
sale of Biomarché of $1.2 million, net of tax, or $.03 per share.
(3) Operating results adjusted to exclude the effects of $3.2 million ($2.0 million net of tax), or $.05 per share, of stock-base compensation and $0.9 million ($0.6 million net of
tax), or $.02 per share, for the completion of the 2005 SKU rationalization program.
(4) See Consolidated Financial Statements beginning on Page 26.
(Dollars in thousands, except per share amounts) 2006(1) 2007(2) 2008(3)
Net Sales $738,557 $900,432 $1,056,371
Operating income 69,195 86,055 102,966
Net income 38,891 47,532 58,659
Net income per share—diluted $ 1.00 $ 1.16 $ 1.40
Capital expenditures $ 14,479 $ 11,411 $ 19,811
Depreciation and amortization 12,549 15,692 19,980
Property, plant and equipment, net 119,830 114,901 159,089
Working capital $172,933 $198,524 $ 246,726
Long-term debt 151,229 215,446 308,220
Stockholders’ equity 618,092 696,956 742,811
Average shares outstanding 38,912 41,108 41,765
Current Ratio 3.0 2.7 2.7
Debt/equity 24.5% 30.9% 41.5%
Stockholders’ equity per share $ 15.96 $ 17.41 $ 18.50
NET SALES
(dollars in millions)
OPERATING INCOME
(dollars in millions)
NET INCOME
(dollars in millions)
$738.6$69.2
$38.9
$47.5
$58.7
$86.0
$103.0
$900.4
$1,056
2006 2007 2008 2006[1] 2007[2] 2008[3] 2006[1] 2007[2] 2008[3]
0
100
200
300
400
500
600
700
800
900
1,000
1,100
1,200
0
10
20
30
40
50
60
70
80
90
100
110
120
0
10
20
30
40
50
60
70
We acquired Avalon Natural Products, Inc., with its
Avalon Organics and Alba Botanica brand of personal
care products, nSpired Natural Foods, Inc., with
its MaraNatha natural and organic nut butters and
SunSpire natural and organic chocolate products
and Spectrum Organic Products, Inc., a leading
manufacturer and marketer of natural and organic
culinary oils, vinegars, condiments and butter
substitutes under the Spectrum Naturals brand
and nutritional supplements under the Spectrum
Essentials brand.
We expanded the scope of our European operations
with the acquisitions of the fresh prepared food
business based in Luton, England from the H.J. Heinz
Company, L.P., the Linda McCartney brand (under
license) frozen meat-free business based in the United
Kingdom and Daily Bread, Ltd., a London-based
producer of branded fresh prepared foods for the
foodservice channel in the United Kingdom.
We entered the specialty poultry business with
the formation of Hain Pure Protein Corporation, a
50.1%-owned subsidiary. Hain Pure Protein has since
acquired the natural, organic and antibiotic-free
chicken business of College Hill Poultry; the assets
and business of Plainville Turkey Farm, Inc., a leading
supplier of natural and antibiotic-free whole turkeys and
deli turkey products and a turkey production facility and
distribution center in New Oxford, Pennsylvania.
All of our acquisitions have been accounted for as
purchases. Consequently, their operations are included
in our results of operations from the respective dates
of acquisition.
In August 2007, we sold our interest in a joint venture
in Belgium that manufactured and sold rice cakes. In
September 2007, we sold our minority interest in Halo,
Purely for Pets, Inc., which we had acquired in fi scal 2006.
In August 2006, we sold our Biomarché operations,
a Belgium-based provider of fresh organic fruits and
vegetables, which we acquired in fi scal 2002.
2008 ANNUAL REPORT 11
Management’s Discussion and Analysis of Financial Condition
and Results of Operations
general
We manufacture, market, distribute and sell natural,
organic, specialty and snack food products and
natural personal care products under brand names
which are sold as “better-for-you” products. We are a
leader in many of the top natural food and personal care
products categories. Our products are sold primarily to
specialty and natural food distributors and are marketed
to supermarkets, natural food stores, and other retail
classes of trade including mass-market retailers, drug
store chains, food service channels and club stores. We
manufacture internationally and our products are sold
in more than 50 countries. Our brand names are well
recognized in the various market categories they serve.
We have acquired numerous brands since our formation
and we will seek future growth through internal
expansion as well as the acquisition of complementary
brands. We consider the acquisition of natural and
organic food and personal care products companies and
product lines as an integral part of our business strategy.
We believe that by integrating our various brands, we
will achieve economies of scale and enhanced market
penetration. Our business strategy is to integrate all of
our brands under one management team and employ a
uniform marketing, sales and distribution program.
We capitalize on our brand equity and the distribution
achieved through each of our acquisitions with strategic
introductions of new products that complement existing
lines to enhance revenues and margins.
Our consolidated net sales increased 17.3% in fi scal 2008
compared to the year earlier period as a result of growth
in our existing brands and the impact of acquisitions.
During the three fi scal years ended June 30, 2008,
we made a number of acquisitions, which expanded
our product offerings in fast growing categories and
complemented our existing brands:
12 THE HAIN CELESTIAL GROUP, INC.
critical accounting policies
Our fi nancial statements are prepared in accordance
with accounting principles generally accepted in the
United States. Our signifi cant accounting policies
are described in Note 2 to the consolidated fi nancial
statements. The policies below have been identifi ed as
the critical accounting policies we use which require
us to make estimates and assumptions that affect the
reported amounts of assets and liabilities at the date
of the fi nancial statements and amounts of income and
expenses during the reporting periods presented. We
believe in the quality and reasonableness of our critical
accounting policies; however, it is possible that materially
different amounts would be reported under different
conditions or using assumptions different from those
that we have consistently applied. Our critical accounting
policies are as follows, including our methodology for
estimates made and assumptions used:
REVENUE RECOGNITION AND SALES INCENTIVES
Sales are recognized when the earnings process is
complete, which occurs when products are shipped in
accordance with terms of agreements, title and risk of
loss transfer to customers, collection is probable and
pricing is fi xed or determinable. Sales are reported
net of sales incentives, which include trade discounts
and promotions and certain coupon costs. Shipping and
handling costs billed to customers are included in
reported sales. Allowances for cash discounts are
recorded in the period in which the related sale
is recognized.
VALUATION OF ACCOUNTS AND CHARGEBACKS RECEIVABLE
We perform ongoing credit evaluations on existing and
new customers daily. We apply reserves for delinquent
or uncollectible trade receivables based on a specifi c
identifi cation methodology and also apply a general
reserve based on the experience we have with our trade
receivables aging categories. Credit losses have been
within our expectations in recent years. While one of our
customers represented approximately 13% of our trade
receivable balance at June 30, 2008, we believe there was
no credit exposure at that time.
Based on cash collection history and other statistical
analysis, we estimate the amount of unauthorized
deductions that our customers have taken to be
repaid and collectible in the near future in the form of
a chargeback receivable. While our estimate of this
receivable balance could be different had we used
different assumptions and judgments, historically our
cash collections of this type of receivable have been
within our expectations and no signifi cant write-offs have
occurred during the most recent three fi scal years.
There can be no assurance that we would have the same
experience with our receivables during different economic
conditions, or with changes in business conditions, such
as consolidation within the food industry and/or a change
in the way we market and sell our products.
INVENTORY
Our inventory is valued at the lower of actual cost or
market, utilizing the fi rst-in, fi rst-out method. We provide
write-downs for fi nished goods expected to become
non-saleable due to age and specifi cally identify and
provide for slow moving or obsolete raw ingredients
and packaging.
PROPERTY, PLANT AND EQUIPMENT
Our property, plant and equipment is carried at cost and
depreciated or amortized on a straight-line basis over
the lesser of the estimated useful lives or lease life,
whichever is shorter. We believe the asset lives assigned
to our property, plant and equipment are within the
ranges/guidelines generally used in food manufacturing
and distribution businesses. Our manufacturing
plants and distribution centers, and their related assets,
are periodically reviewed to determine if any impairment
exists by analyzing underlying cash fl ow projections.
2008 ANNUAL REPORT 13
At this time, we believe no impairment exists on the
carrying value of such assets. Ordinary repairs and
maintenance are expensed as incurred.
ACCOUNTING FOR ACQUISITIONS
Part of our growth strategy has included the acquisition
of numerous businesses. The purchase price of these
acquisitions has been determined after due diligence
of the acquired business, market research, strategic
planning, and the forecasting of expected future results
and synergies. Estimated future results and expected
synergies are subject to revisions as we integrate each
acquisition and attempt to leverage resources.
Our acquisitions have been accounted for using the
purchase method of accounting as defi ned under SFAS
No. 141, “Business Combinations.” We estimated the
fair values of the assets acquired in each acquisition
as of the date of acquisition and these estimates are
subject to adjustment. These estimates are subject to
fi nal assessments of the fair value of property, plant
and equipment, intangible assets, operating leases and
deferred income taxes. We complete these assessments
as soon as practical. We are not aware of any information
that would indicate that the fi nal purchase price alloca-
tions for acquisitions completed in fi scal 2008 would differ
meaningfully from preliminary estimates. See Note 6 to
the Notes to Consolidated Financial Statements.
In connection with some of our acquisitions, we have
undertaken certain restructurings of the acquired businesses
to realize effi ciencies and potential cost savings. Our
restruc turing activities include the elimination of
duplicate facilities, reductions in staffi ng levels, and
other costs associated with exiting certain activities of
the businesses we acquire. The estimated cost of these
restructuring activities are included as costs of the
acquisition and, as such, affect the ultimate recording of
goodwill consistent with the guidance of Emerging Issues
Task Force (“EITF”) Issue No. 95-3, “Recognition of Liabilities
in Connection with a Purchase Business Combination.”
It is typical for us to rationalize the product lines of
businesses acquired within the fi rst year or two after
an acquisition. These rationalizations often include
elimination of portions of the product lines acquired, the
reformulation of recipes and formulas used to produce
the products, and the elimination of customers that
do not meet our credit standards. In certain instances,
it is necessary to change co-packers used to produce
the products. Each of these activities soon after an
acquisition may have the effect of reducing sales to
a level lower than that of the business acquired and
operated prior to our acquisition. As a result, pro forma
information regarding sales cannot and should not be
construed as representative of our growth rates.
STOCK-BASED COMPENSATION
We provide compensation benefi ts in the form of stock
options and restricted stock to employees and non-
employee directors under several stock-based plans. We
account for stock-based awards in accordance with the
provisions of SFAS No. 123(R), “Share-Based Payment.”
SFAS No. 123(R) requires that share-based compensation
be measured at fair value at the date of grant and
expensed in the consolidated statement of income
over the requisite service period. The fair value of stock
option awards is estimated on the date of grant using the
Black-Scholes option pricing model and is recognized
in expense over the vesting period of the options using
the straight-line method. The Black-Scholes option
pricing model requires various assumptions, including
the expected volatility of our stock, the expected term of
the option, the risk-free interest rate and the expected
dividend yield. Expected volatility is based on historical
volatility of our common stock. The risk-free rate for the
expected term of the option is based on the U.S. Treasury
yield curve in effect at the time of grant. The fair value
of restricted stock awards is equal to the market value of
the Company’s common stock on the date of grant and is
recognized in expense over the vesting period using the
straight-line method.

14 THE HAIN CELESTIAL GROUP, INC.
SFAS No. 123(R) also requires that we recognize
compensation expense for only that portion of
stock-based awards that are expected to vest. We
utilize historical employee termination behavior to
determine our estimated forfeiture rates. If the actual
forfeitures differ from those estimated by management,
adjustments to compensation expense will be made
in future periods.
SEGMENTS
SFAS No. 131 defi nes an operating segment as that
component of an enterprise (i) that engages in business
activities from which it may earn revenues and incur
expenses, (ii) whose operating results are regularly
reviewed by the enterprise’s chief operating decision
maker (“CODM”) to make decisions about resources to
be allocated to the segment and assess its performance,
and (iii) for which discrete fi nancial information is
available. SFAS No. 142 defi nes a reporting unit as an
operating segment or one level below an operating
segment if the component constitutes a business for
which discrete fi nancial information is available and
segment management regularly reviews the operating
results of that component. The Company has determined
that it operates in one segment, the sale of natural
and organic products, including food, beverage and
personal care products, and further that such single
segment includes six reporting units in the annual
test of Goodwill for impairment. Characteristics of the
Company’s operations which are relied on in making
these determinations include the similarities apparent
in the Company’s products in the natural and organic
consumer markets, the commonality of the Company’s
customers across brands, the Company’s unifi ed
marketing strategy, and the nature of the fi nancial
information used by the CODM, described below, other
than information on sales and direct product costs, by
brand. The Company’s six reporting units are Grocery
(including snacks); Tea; Personal Care; Protein; Canada;
and Europe. The Company has further determined that
its Chairman of the Board and Chief Executive Offi cer
is the Company’s CODM as defi ned in SFAS No. 131, and
is also the manager of the Company’s single segment.
In making decisions about resource allocation and
performance assessment, the Company’s CODM
focuses on sales performance by brand using internally
generated sales data as well as externally developed
market consumption data acquired from independent
sources, and further reviews certain data regarding
standard costs and standard gross margins by brand. In
making these decisions, the CODM receives and reviews
certain Company consolidated quarterly and year-to-
date information; however, the CODM does not receive or
review any discrete fi nancial information by geographic
location, business unit, subsidiary, division or brand.
The CODM reviews and approves capital spending on a
Company consolidated basis rather than at any lower
unit level. The Company’s Board of Directors receives
the same quarterly and year-to-date information as the
Company’s CODM.
INTANGIBLES
Goodwill is no longer amortized and the value of an
identifi able intangible asset is amortized over its useful
life unless the asset is determined to have an indefi nite
useful life. The carrying value of goodwill, which is
allocated to the Company’s six reporting units, and other
intangible assets with indefi nite useful lives are tested
annually for impairment.
The identifi cation and measurement of goodwill
impairment involves the estimation of the fair value of
reporting units. The estimates of fair value of our reporting
units are based on the best information available as
of the date of the assessment, and include the use of
management projections, estimates and assumptions as
to the future performance and expected cash fl ows of the
operations. Future cash fl ows can be affected by changes
in industry or market conditions, the rate and extent to
which anticipated synergies or cost savings are realized
with newly acquired entities and other factors.

2008 ANNUAL REPORT 15
recent accounting pronouncements
In September 2006, the FASB issued SFAS No. 157,
“Fair Value Measurements” (“SFAS No. 157”). SFAS
No. 157 defi nes fair value, establishes a framework for
measuring fair value and expands disclosure of fair
value measurements. SFAS No. 157 applies under other
accounting pronouncements that require or permit fair
value measurements and accordingly, does not require
any new fair value measurements. SFAS No. 157 is
effective for fi nancial statements issued for fi scal years
beginning after November 15, 2007. We have not yet
assessed the impact, if any, that the implementation of
SFAS No. 157 will have on our consolidated results of
operations or fi nancial condition.
In February 2007, the FASB issued SFAS No. 159, “The Fair
Value Option for Financial Assets and Financial Liabilities”
(“SFAS No. 159”). SFAS No. 159 allows companies to choose
to measure certain fi nancial instruments and certain other
items at fair value. The statement requires that unrealized
gains and losses are reported in earnings for items
measured using the fair value option and establishes
presentation and disclosure requirements. SFAS No. 159
is effective July 1, 2008 for the Company. We have not yet
assessed the impact, if any, SFAS No. 159 may have on our
consolidated fi nancial statements.
In December 2007, the FASB issued SFAS No. 141(R),
“Business Combinations” (“SFAS No. 141(R)”). SFAS
No. 141(R) replaces SFAS No. 141, “Business Combinations,”
however, it retains the basic requirements of SFAS No. 141
that the acquisition method of accounting (previously
referred to as the purchase method) be used for all
business combinations. SFAS No. 141(R) requires the
acquiring entity in a business combination to recognize
the identifi able assets acquired, liabilities assumed and
any noncontrolling interest in the business acquired at
their acquisition-date fair values and generally requires
acquisition-related costs to be expensed as incurred.
SFAS No. 141(R) also provides guidance for recognizing
and measuring the goodwill acquired in a business
combination and determines what information to disclose
to enable users of the fi nancial statements to evaluate the
nature and fi nancial effects of the business combination.
The provisions of SFAS No. 141(R) must be applied
prospectively and are effective for the Company’s fi scal
year ending June 30, 2010 for all business combinations
occurring on or after July 1, 2009. We have not yet assessed
the impact that the implementation of SFAS No. 141(R)
will have on our consolidated results of operations or
fi nancial condition.
In December 2007, the FASB also issued SFAS No. 160,
“Noncontrolling Interests in Consolidated Financial
Statements, an Amendment of ARB No. 51” (“SFAS
No. 160”). SFAS No. 160 establishes new accounting
and reporting standards for a noncontrolling interest
in a subsidiary, which is sometimes referred to as
minority interest, and for the deconsolidation of a
subsidiary. Among other requirements, SFAS No. 160
establishes accounting and reporting standards that
require noncontrolling interests to be reported as a
separate component of equity in the consolidated fi nancial
statements, changes in a parent’s ownership interest while
the parent retains its controlling interest be accounted
for as equity transactions and that consolidated net
income include the amounts attributable to both the
parent and the noncontrolling interest, with disclosure of
those amounts on the face of the consolidated statement
of income. SFAS No. 160 is effective beginning in the
Company’s fi scal year ending June 30, 2010 and must
be applied prospectively, except for the presentation
and disclosure requirements, which will be applied
retrospectively for all periods presented. We have not
yet assessed the impact that the implementation of
SFAS No. 160 will have on our consolidated results of
operations or fi nancial condition.
16 THE HAIN CELESTIAL GROUP, INC.
results of operations
FISCAL 2008 COMPARED TO FISCAL 2007
NET SALES
Net sales for the year ended June 30, 2008 were
$1.056 billion, an increase of $155.9 million, or 17.3%, over
net sales of $900.4 million for the year ended June 30, 2007.
Net sales of our grocery brands increased 15.5% to
$534.0 million, as a result of strong performance from
our Earth’s Best, Arrowhead Mills, Imagine Soup and Rice
Dream and Spectrum brands, successful new product
introductions and the inclusion of sales of the MaraNatha
and SunSpire brands acquired in March 2008. Sales of
our snacks brands increased 3.4% to $99.8 million, led by
increased sales of our Garden of Eatin’ and Terra brands.
Net sales of our Celestial Seasonings tea brand increased
modestly to $93.1 million despite sluggish consumption
and a highly competitive environment for shelf space. Net
sales of our personal care brands increased almost 25% in
fi scal 2008 to $117.2 million. Sales growth of our Alba and
Avalon brands have accelerated since we acquired them at
the beginning of the third quarter of fi scal 2007, as we have
successfully expanded the distribution of these brands into
additional channels.
Sales by our Hain Pure Protein unit increased to
$90.6 million, from $34.7 million in 2007, as we expanded
our product offerings with the acquisition of Plainville
Turkey Farms in early fi scal 2008. In March 2008, we
signifi cantly increased our capacity to process turkeys
with the acquisition of Pilgrim’s Pride’s New Oxford, PA
processing operations.
Sales of our products in the United States increased
21.8% to $824.1 million in fi scal 2008 from $676.5 million
in the prior year.
Sales of our brands in Canada increased 17.1%, as we
recorded sales growth for almost all of our brands. We
saw strong sales growth in our snacks, tea, soups and
our Spectrum brands. Sales in Europe increased 8.5%, to
$180.2 million, including sales in the fourth quarter from
our newly-acquired Daily Bread brand.
GROSS PROFIT
Gross profi t for the year ended June 30, 2008 was
$284.3 million, an increase of $22.9 million, or 8.8%, from
last year’s gross profi t of $261.4 million. Gross profi t in
fi scal 2008 was 26.9% of net sales compared to 29.0% of
net sales for 2007.
The decrease in gross profi t percentage resulted from
a number of factors, including $6.9 million, or 70 basis
points, of charges recorded in connection with our SKU
rationalization program. Increased sales of lower margin
poultry products from our expanded Hain Pure Protein
unit impacted our gross margin by approximately 60 basis
points. Lower relative contribution from our Celestial
Seasonings tea brand, approximately $7.5 million of
start-up costs incurred associated with a new production
line at our Fakenham, England frozen foods facility and
higher ingredient and packaging costs, increasing health
care costs, as well as higher energy, logistics and other
transportation costs also impacted our gross profi t
unfavorably. We implemented price increases across all
of our operating units which, together with ongoing cost
savings initiatives, partially offset these cost increases.
SELLING, GENERAL AND ADMINISTRATIVE EXPENSES
Selling, general and administrative expenses increased
by $30.1 million, or 17.0%, to $207.6 million in 2008 from
$177.5 million in 2007. Selling, general and administrative
expenses as a percentage of net sales were 19.6% in
fi scal 2008 as compared to 19.7% in fi scal 2007.
Selling, general and administrative expenses have
increased as a result of costs brought on with the
acquisitions we made in fi scal 2008 and 2007, including
increased amortization expense on purchased
2008 ANNUAL REPORT 17
intangibles. Selling, general and administrative expense
in fi scal 2008 includes $2.1 million of equity compensation
expense recorded in accordance with SFAS No. 123R.
We recorded $3.9 million of charges related to our SKU
rationalization and reorganization activities during
fi scal 2008. We also incurred $5.8 million of additional
professional fees related to the review of our stock option
practices and defense of the related derivative lawsuits
during the year ended June 30, 2008.
OPERATING INCOME
Operating income was $76.8 million in 2008 compared to
$84.0 million in 2007. Operating income as a percentage
of net sales was 7.3% in 2008 compared to 9.3% in 2007.
The decrease in operating income was primarily a result
of the SKU rationalization charges, the professional fees
incurred in connection with our stock options review and
litigation and the equity compensation expenses recognized.
INTEREST AND OTHER EXPENSES, NET
Interest and other expenses, net were $11.3 million for
the year ended June 30, 2008 compared to $6.9 million for
fi scal 2007.
Interest expense in fi scal 2008 was approximately
$13.8 million and was partially offset by interest
income earned of $1.7 million. Interest expense
totaled $11.3 million in 2007 and was partially offset by
$2.5 million of interest income earned. Our interest
expense was primarily related to the $150 million of
5.98% senior notes we issued in the fourth quarter of
fi scal 2006 and borrowings under our revolving credit
facility. We realized approximately $2.3 million of foreign
currency gains during fi scal 2008. We recognized a
gain of approximately $2.0 million in the fi rst quarter
of fi scal 2008 on the sale of an equity interest in a joint
venture which manufactures rice cakes in Belgium.
At the end of August 2006 we sold Biomarché, our
Belgium-based provider of fresh organic fruits and
vegetables, and recognized a gain on the disposal of
approximately $3.4 million, net of a $3.3 million charge for
goodwill allocated to that component of the reporting unit.
INCOME BEFORE INCOME TAXES
Income before income taxes in 2008 amounted to
$65.4 million compared to $77.1 million in 2007. The
decrease is attributable to the aforementioned decrease
in operating income and the increase in interest and
other expenses, net.
INCOME TAXES
The provision for income taxes includes Federal, foreign,
state and local income taxes. Our income tax expense
was $24.2 million in fi scal 2008 compared to $29.6 million
in 2007. Our effective tax rate was 37.0% in 2008
compared to 38.4% in 2007.
The effective rate differs from statutory rates due
to the effect of state and local taxes, tax rates in foreign
jurisdic tions and certain nondeductible expenses. Our
effective tax rate will change from year to year based on
factors including, but not limited to, the geographical
mix of earnings, enacted tax legislation and tax audit
settlements. Our effective tax rate in 2008 decreased
as a result of the mix of the Company’s income in
foreign jurisdictions and a higher utilization of avail-
able foreign tax credits. Our effective tax rate in 2007
included the unfavorable impact of the $3.3 million of
nondeductible goodwill expensed in connection with the
sale of Biomarché.
NET INCOME
Net income in 2008 was $41.2 million, or $0.99 per diluted
share, compared to $47.5 million, or $1.16 per diluted share
in 2007. The decrease was attributable to the afore-
mentioned decrease in income before income taxes.
18 THE HAIN CELESTIAL GROUP, INC.
FISCAL 2007 COMPARED TO FISCAL 2006
NET SALES
Net sales for the year ended June 30, 2007 were
$900.4 million, an increase of $161.8 million, or 21.9%,
over net sales of $738.6 million for the year ended
June 30, 2006. Sales of grocery and snacks increased
with the strong performance of our Earth’s Best, Garden
of Eatin’, Arrowhead Mills, Health Valley and Spectrum
brands and from successful new product introductions.
Net sales of our Celestial Seasonings tea brand were
down principally as a result of continued warmer than
normal temperatures in North America and lower
consumption of green tea. Sales of our personal care
brands increased as a result of strong growth from our
Jason brand, sales of the brands we acquired from Para
Laboratories in the third quarter of 2006 and the inclusion
of sales of our Avalon and Alba brands, acquired during
the third quarter of fi scal 2007. Sales for our brands in
Canada were fl at, with increased sales of our refrigerated
and frozen products offset by decreased sales of tea.
Sales in Europe increased primarily as a result of the
inclusion of our United Kingdom operations, acquired
during the fourth quarter of fi scal 2006 and the second
quarter of fi scal 2007.
GROSS PROFIT
Gross profi t for the year ended June 30, 2007 was
$261.4 million, an increase of $48.1 million, or 22.5%,
from last year’s gross profi t of $213.4 million. Gross
profi t in fi scal 2007 was 29.0% of net sales compared to
28.9% of net sales for 2006. The increase in gross profi t
percentage was principally the result of the addition of
higher margin personal care products from our recently
acquired Avalon and Alba brands, partially offset by
approximately $1.7 million of start-up costs incurred in
the fi rst half of the year associated with a new production
line at our West Chester frozen foods facility, lower
relative contribution from our Celestial Seasonings tea
brand and the inclusion of our United Kingdom operations
which were acquired after the third quarter of fi scal 2006,
for a full year. In the United Kingdom, we continued to
co-pack for the previous owner at one of the facilities
under an agreement allowing for a minimal margin.
Our gross margin generated in the United Kingdom was
depressed even though the arrangement helped absorb
what otherwise would be unabsorbed overhead. The
effect on our gross profi t percentage for the year ended
June 30, 2007 was a 100 basis point reduction from the
lower margins in the United Kingdom. Gross margin
in 2006 included $0.9 million, or 0.1%, of charges for our
2005 SKU rationalization program. Our gross margin
performance has also been negatively impacted by the
increasing costs of petroleum, ingredients, health care
and other input costs. We have offset these increasing
costs with the successful implementation of price
increases for selected products we sell, and with a
sharper focus on operating effi ciencies, including the
positive effects of our 2005 SKU rationalization program.
SELLING, GENERAL AND ADMINISTRATIVE EXPENSES
Selling, general and administrative expenses increased
by $29.2 million, or 19.7%, to $177.5 million in 2007 from
$148.3 million in 2006. Selling, general and administrative
expenses increased primarily as a result of costs associated
with the businesses we acquired in fi scal 2007 and 2006.
In addition, we had increased amortization expense on
purchased intangibles related to our recent acquisitions and
increased professional fees during the year ended June 30,
2007. Selling, general and administrative expenses in
fi scal 2006 included a $3.2 million expense for stock option
compensation under SFAS No. 123(R). Selling, general
and administrative expenses as a percentage of net sales
declined to 19.7% in fi scal 2007 as compared to 20.1% in
fi scal 2006, primarily as a result of the reduction in stock
option compensation expense.
2008 ANNUAL REPORT 19
OPERATING INCOME
Operating income was $84.0 million in 2007 compared to
$65.1 million in 2006. Operating income as a percentage
of net sales was 9.3% in 2007 compared to 8.8% in 2006.
The increase in operating income was a result of our
increased net sales and gross profi t.
INTEREST AND OTHER EXPENSES, NET
Interest and other expenses, net were $6.9 million for
the year ended June 30, 2007 compared to $5.9 million
for fi scal 2006. Interest expense totaled $11.3 million in
2007, which was primarily related to the $150 million
of 5.98% senior notes we issued in the fourth quarter
of last fi scal year and borrowings we made early in the
third quarter of fi scal 2007 under our revolving credit
facility to partially fund the acquisition of Avalon Natural
Products, Inc. The interest expense was partially offset by
$2.5 million of interest income earned. Interest expense
in fi scal 2006 was approximately $6.5 million and was
partially offset by interest income earned of $0.9 million.
In the fi rst quarter of fi scal 2007, we sold Biomarché,
our Belgium-based provider of fresh organic fruits and
vegetables and recognized a gain on the disposal of
approximately $3.4 million, net of a $3.3 million write-off
of allocated goodwill.
INCOME BEFORE INCOME TAXES
Income before income taxes in 2007 amounted to
$77.1 million compared to $59.1 million in 2006. The
increase was attributable to the aforementioned increase
in operating income offset by the increase in interest and
other expenses, net.
INCOME TAX EXPENSE
Our income tax expense was $29.6 million in fi scal 2007
compared to $22.8 million in 2006. Our effective tax
rate was 38.4% in 2007 compared to 38.5% in 2006. Our
effective tax rate in 2007 included the unfavorable impact
of the $3.3 million of nondeductible goodwill expensed in
connection with the sale of Biomarché.
NET INCOME
Net income in 2007 was $47.5 million, or $1.16 per diluted
share, compared to $36.4 million, or $0.93 per diluted share
in 2006. The increase was attributable to the afore-
mentioned increase in income before income taxes, and
for per share amounts, offset by a 5.6% increase in the
number of weighted average shares outstanding used in
the computation.
liquidity and capital resources
We fi nance our operations and growth primarily with the
cash fl ows we generate from our operations and from
both long-term fi xed-rate borrowings and borrowings
available to us under our Credit Facility.
Our working capital was $246.7 million at June 30, 2008,
an increase of $48.2 million from $198.5 million at
the end of fi scal 2007. This was due principally to a
$46.6 million increase in inventories, a $23.5 million
increase in accounts receivable and an $8.9 million increase
in other current assets, offset by a $28.8 million increase in
accounts payable and other current liabilities and a
decrease of $2.0 million in cash. The increases in our
accounts receivable, inventories and accounts payable
were partially attributable to the recent acquisitions
we made. Our inventories also increased as a result
of higher levels of ingredient inventory carried for our
Earth’s Best brand and the increases in the costs of
ingredients. Accounts receivable also increased as a
result of our higher sales volume. Our days’ sales in
receivables improved to 41 days compared to 43 days
in the year-ago period.
Our cash balance decreased $2.0 million during the year
ended June 30, 2008 to $58.5 million as of June 30, 2008.
We maintain our cash and cash equivalents primarily
in money market funds or their equivalent. As of
June 30, 2008, all of our investments mature in less than
three months. Accordingly, we do not believe that our
20 THE HAIN CELESTIAL GROUP, INC.
investments have signifi cant exposure to interest rate
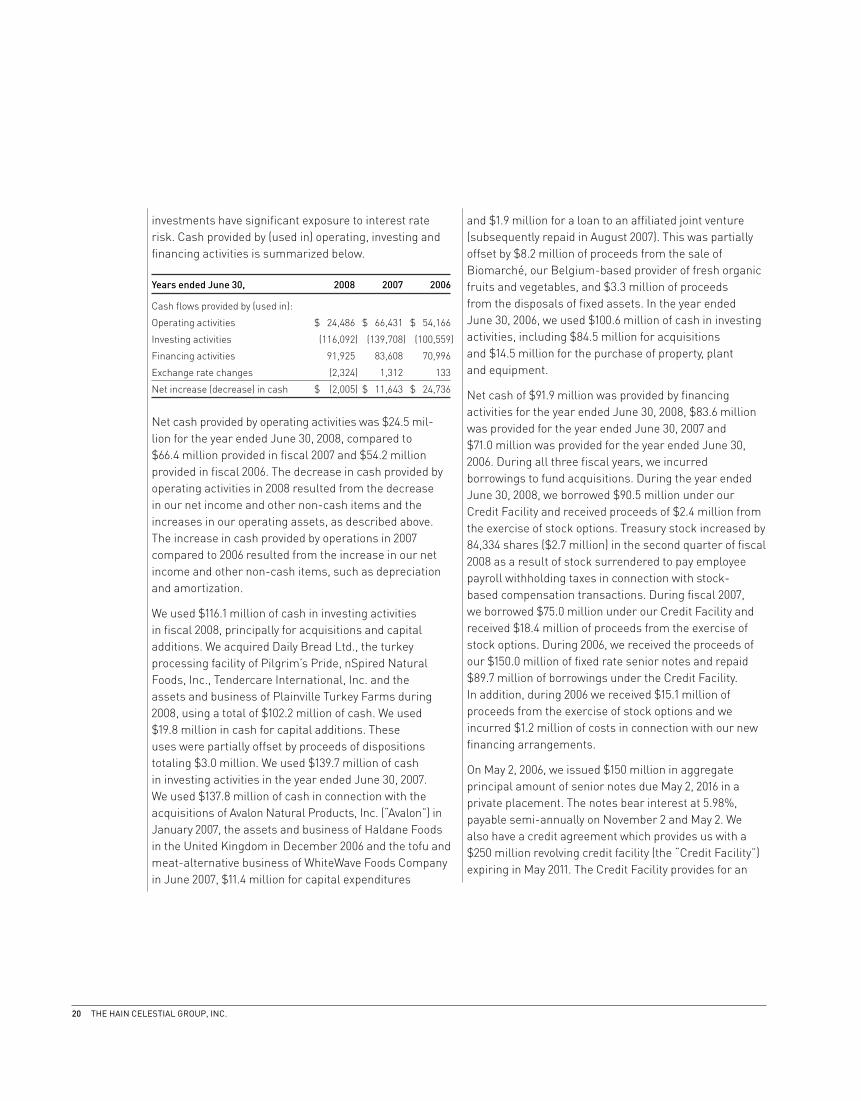
risk. Cash provided by (used in) operating, investing and
fi nancing activities is summarized below.
Years ended June 30, 2008 2007 2006
Cash fl ows provided by (used in):
Operating activities $ 24,486 $ 66,431 $ 54,166
Investing activities (116,092) (139,708) (100,559)
Financing activities 91,925 83,608 70,996
Exchange rate changes (2,324) 1,312 133
Net increase (decrease) in cash $ (2,005) $ 11,643 $ 24,736
Net cash provided by operating activities was $24.5 mil-
lion for the year ended June 30, 2008, compared to
$66.4 million provided in fi scal 2007 and $54.2 million
provided in fi scal 2006. The decrease in cash provided by
operating activities in 2008 resulted from the decrease
in our net income and other non-cash items and the
increases in our operating assets, as described above.
The increase in cash provided by operations in 2007
compared to 2006 resulted from the increase in our net
income and other non-cash items, such as depreciation
and amortization.
We used $116.1 million of cash in investing activities
in fi scal 2008, principally for acquisitions and capital
additions. We acquired Daily Bread Ltd., the turkey
processing facility of Pilgrim’s Pride, nSpired Natural
Foods, Inc., Tendercare International, Inc. and the
assets and business of Plainville Turkey Farms during
2008, using a total of $102.2 million of cash. We used
$19.8 million in cash for capital additions. These
uses were partially offset by proceeds of dispositions
totaling $3.0 million. We used $139.7 million of cash
in investing activities in the year ended June 30, 2007.
We used $137.8 million of cash in connection with the
acquisitions of Avalon Natural Products, Inc. (“Avalon”) in
January 2007, the assets and business of Haldane Foods
in the United Kingdom in December 2006 and the tofu and
meat-alternative business of WhiteWave Foods Company
in June 2007, $11.4 million for capital expenditures
and $1.9 million for a loan to an affi liated joint venture
(subsequently repaid in August 2007). This was partially
offset by $8.2 million of proceeds from the sale of
Biomarché, our Belgium-based provider of fresh organic
fruits and vegetables, and $3.3 million of proceeds
from the disposals of fi xed assets. In the year ended
June 30, 2006, we used $100.6 million of cash in investing
activities, including $84.5 million for acquisitions
and $14.5 million for the purchase of property, plant
and equipment.
Net cash of $91.9 million was provided by fi nancing
activities for the year ended June 30, 2008, $83.6 million
was provided for the year ended June 30, 2007 and
$71.0 million was provided for the year ended June 30,
2006. During all three fi scal years, we incurred
borrowings to fund acquisitions. During the year ended
June 30, 2008, we borrowed $90.5 million under our
Credit Facility and received proceeds of $2.4 million from
the exercise of stock options. Treasury stock increased by
84,334 shares ($2.7 million) in the second quarter of fi scal
2008 as a result of stock surrendered to pay employee
payroll withholding taxes in connection with stock-
based compensation transactions. During fi scal 2007,
we borrowed $75.0 million under our Credit Facility and
received $18.4 million of proceeds from the exercise of
stock options. During 2006, we received the proceeds of
our $150.0 million of fi xed rate senior notes and repaid
$89.7 million of borrowings under the Credit Facility.
In addition, during 2006 we received $15.1 million of
proceeds from the exercise of stock options and we
incurred $1.2 million of costs in connection with our new
fi nancing arrangements.
On May 2, 2006, we issued $150 million in aggregate
principal amount of senior notes due May 2, 2016 in a
private placement. The notes bear interest at 5.98%,
payable semi-annually on November 2 and May 2. We
also have a credit agreement which provides us with a
$250 million revolving credit facility (the “Credit Facility”)
expiring in May 2011. The Credit Facility provides for an
2008 ANNUAL REPORT 21
uncommitted $100 million accordion feature, under
which the facility may be increased to $350 million. The
Credit Facility and the senior notes are guaranteed by
substantially all of our current and future direct and
indirect domestic subsidiaries. Loans under the Credit
Facility bear interest at a base rate (greater of the
applicable prime rate or Federal Funds Rate plus an
applicable margin) or, at our option, the reserve adjusted
LIBOR rate plus an applicable margin. As of June 30,
2008 and June 30, 2007, $150.0 million was outstanding
under the senior notes at an interest rate of 5.98%. As of
June 30, 2008, there were $155.5 million of borrowings
outstanding under the Credit Facility. We are required
by the terms of the Credit Facility and the senior notes
to comply with customary affi rmative and negative
covenants for facilities and notes of this nature.
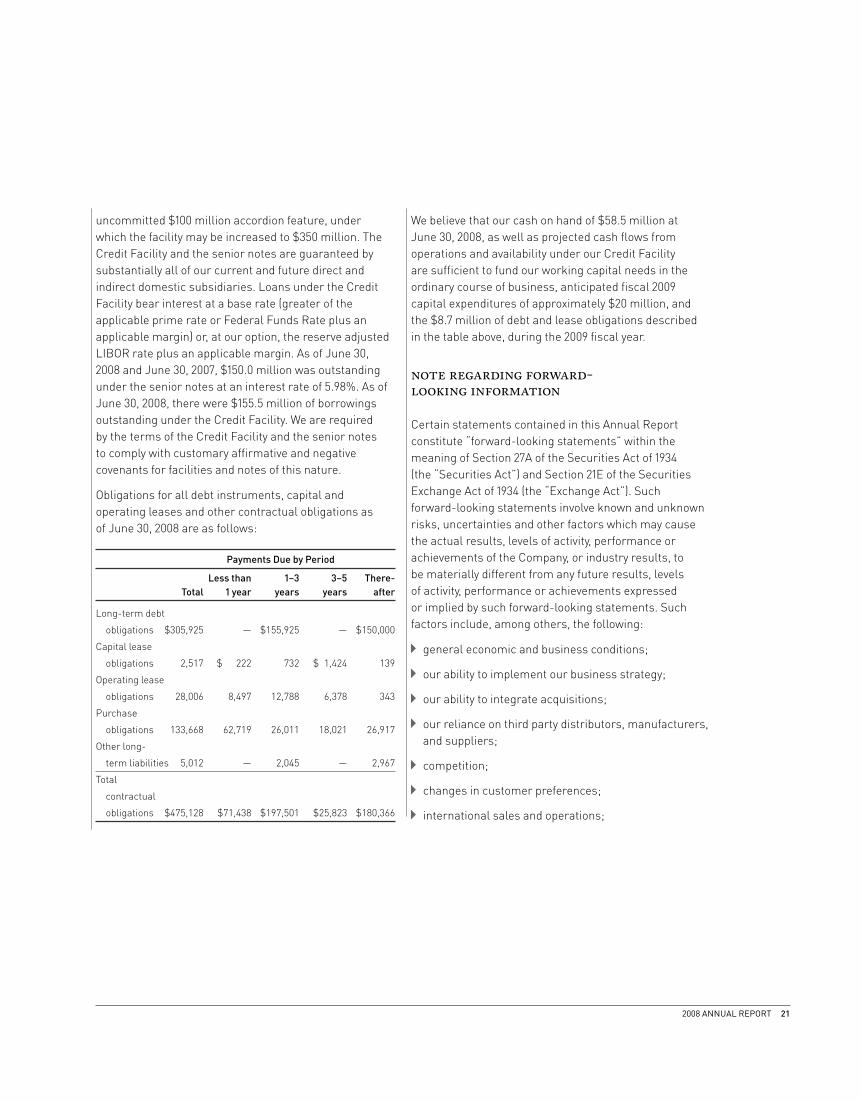
Obligations for all debt instruments, capital and
operating leases and other contractual obligations as
of June 30, 2008 are as follows:
Payments Due by Period
Less than 1–3 3–5 There-
Total 1 year years years after
Long-term debt
obligations $305,925 — $155,925 — $150,000
Capital lease
obligations 2,517 $ 222 732 $ 1,424 139
Operating lease
obligations 28,006 8,497 12,788 6,378 343
Purchase
obligations 133,668 62,719 26,011 18,021 26,917
Other long-
term liabilities 5,012 — 2,045 — 2,967
Total
contractual
obligations $475,128 $71,438 $197,501 $25,823 $180,366
We believe that our cash on hand of $58.5 million at
June 30, 2008, as well as projected cash fl ows from
operations and availability under our Credit Facility
are suffi cient to fund our working capital needs in the
ordinary course of business, anticipated fi scal 2009
capital expenditures of approximately $20 million, and
the $8.7 million of debt and lease obligations described
in the table above, during the 2009 fi scal year.
note regarding forward-looking information
Certain statements contained in this Annual Report
constitute “forward-looking statements” within the
meaning of Section 27A of the Securities Act of 1934
(the “Securities Act”) and Section 21E of the Securities
Exchange Act of 1934 (the “Exchange Act”). Such
forward-looking statements involve known and unknown
risks, uncertainties and other factors which may cause
the actual results, levels of activity, performance or
achievements of the Company, or industry results, to
be materially different from any future results, levels
of activity, performance or achievements expressed
or implied by such forward-looking statements. Such
factors include, among others, the following:
general economic and business conditions;
our ability to implement our business strategy;
our ability to integrate acquisitions;
our reliance on third party distributors, manufacturers,
and suppliers;
competition;
changes in customer preferences;
international sales and operations;

22 THE HAIN CELESTIAL GROUP, INC.
availability and retention of key personnel;
escalating fuel and commodity costs;
the resolution of the SEC’s inquiry and litigation
regarding our stock option practices; and
changes in or the failure to comply with
government regulations.
As a result of the foregoing and other factors, no
assurance can be given as to the future results, levels of
activity and achievements and neither the Company nor
any person assumes responsibility for the accuracy and
completeness of these statements.
The Company’s Annual Report on Form 10-K for the year
ended June 30, 2008 includes a discussion of additional
factors that could cause actual results to differ from
expectations. The Company notes these factors as
permitted by the Private Securities Litigation Reform Act
of 1995.
SUPPLEMENTARY QUARTERLY FINANCIAL DATA:
Unaudited quarterly fi nancial data (in thousands, except
per share amounts) for fi scal 2008 and 2007 is
summarized as follows:
Three Months Ended
September 30, December 31, March 31, June 30,
2007 2007 2008 2008
Net sales $237,245 $276,233 $264,632 $278,261
Gross profi t(a) 68,851 79,144 68,722 67,592
Operating income(b) 18,305 29,262 17,431 11,758
Income before
income taxes(c) 17,346 24,950 13,903 9,246
Net income 10,820 15,582 8,315 6,504
Basic earnings per
common share $ 0.27 $ 0.39 $ 0.21 $ 0.16
Diluted earnings
per common
share $ 0.26 $ 0.37 $ 0.20 $ 0.16
Three Months Ended
September 30, December 31, March 31, June 30,
2006 2006 2007 2007
Net sales $209,895 $230,190 $238,027 $222,320
Gross profi t(d) 58,830 69,871 70,738 61,991
Operating income 16,880 24,925 23,540 18,632
Income before
income taxes(e) 15,060 23,171 20,248 18,613
Net income 8,739 14,213 12,390 12,140
Basic earnings per
common share $ 0.23 $ 0.36 $ 0.31 $ 0.30
Diluted earnings
per common
share $ 0.22 $ 0.34 $ 0.30 $ 0.29
(a) Gross profi t was negatively impacted by approximately $1.1 million ($0.7 million net
of tax) for the three months ended September 30, 2007, $2.1 million ($1.3 million
net of tax) for the three months ended December 31, 2007, $1.8 million ($1.1 million net
of tax) for the three months ended March 31, 2008 and $2.5 million ($2.3 million net of
tax) for the three months ended June 30, 2008 as a result of start-up and integration
costs at our Fakenham, UK frozen foods factory. Gross profi t was also negatively
impacted by approximately $6.0 million ($3.7 million net of tax) for the three months
ended March 31, 2008 and $0.9 million ($0.6 million net of tax) for the three months ended
June 30, 2008 as a result of SKU rationalization and reorganization actions.
(b) Operating income was also negatively impacted by approximately $2.3 million
($1.4 million net of tax) for the three months ended September 30, 2007, $1.7 mil-
lion ($1.1 million net of tax) for the three months ended December 31, 2007,
$0.7 million ($0.4 million net of tax) for the three months ended March 31, 2008 and
$1.1 million ($0.6 million net of tax) for the three months ended June 30, 2008
as a result of expenses incurred in connection with the review of the Company’s
stock option practices and defense of the related derivative lawsuits and $0.4 million
($0.3 million net of tax) for the three months ended September 30, 2007, $(0.1) mil-
lion ($(0.1) million net of tax) for the three months ended December 31, 2007,
$(0.5) million ($(0.3) million net of tax) for the three months ended March 31, 2008 and
$2.3 million ($2.9 million net of tax) for the three months ended June 30, 2008 for stock
compensation related expenses. Operating income was negatively impacted
by approximately $2.5 million ($1.5 million net of tax) for the three months ended
March 31, 2008 and $1.4 million ($0.8 million net of tax) for the three months
ended June 30, 2008 as a result of SKU rationalization and reorganization actions.
(c) Income before income taxes includes a gain of $2.0 million ($1.2 million net of
tax) in the three months ended September 30, 2007 on the disposal of the Company’s
investment in a rice cake manufacturing joint venture.
(d) Gross profi t was negatively impacted by approximately $1.1 million ($0.7 million net
of tax) for the three months ended September 30, 2006, and $0.6 million ($0.4 million
net of tax) for the three months ended December 31, 2006, as the result of start-up
costs associated with a new production line at the Company’s West Chester, PA frozen
foods facility.
(e) Income before income taxes includes a gain of $3.4 million ($1.2 million net of
tax) in the three months ended September 30, 2006 on the disposal of Biomarché,
a Belgium-based provider of fresh organic fruits and vegetables.

2008 ANNUAL REPORT 23
seasonality
Our tea brand primarily manufactures and markets
hot tea products and, as a result, its quarterly results
of operations refl ect seasonal trends resulting from
increased demand for its hot tea products in the cooler
months of the year. In addition, some of our other products
(e.g., baking and cereal products and soups) also show
stronger sales in the cooler months while our snack food
and certain of our prepared food product lines are stronger
in the warmer months. In years where there are warm
winter seasons, our sales of cooler weather products,
which typically increase in our second and third fi scal
quarters, may be negatively impacted. Sales of our turkey
products are strongest in the second quarter of our
fi scal year, coinciding with seasonal holidays.
Quarterly fl uctuations in our sales volume and operating
results are due to a number of factors relating to our
business, including the timing of trade promotions,
advertising and consumer promotions and other factors,
such as seasonality, inclement weather and unanticipated
increases in labor, commodity, energy, insurance or other
operating costs. The impact on sales volume and operating
results due to the timing and extent of these factors can
signifi cantly impact our business. For these reasons,
you should not rely on our quarterly operating results as
indications of future performance.
impact of inflation
Infl ation has caused increased ingredient, fuel, labor
and benefi ts costs and in some cases has materially
increased our operating expenses. For more information
regarding ingredient costs, see “Quantitative and Qualitative
Disclosures About Market Risk—Ingredient Inputs Price
Risk,” below. To the extent permitted by competition, we
seek to recover increased costs through a combination
of price increases, new product innovation and by
implementing process effi ciencies and cost reductions.
quantitative and qualitative disclosures about market risk
MARKET RISK
The principal market risks (i.e., the risk of loss arising
from adverse changes in market rates and prices) to
which the Company is exposed are:
interest rates on debt and cash equivalents,
foreign exchange rates, generating translation and
transaction gains and losses, and
ingredient inputs.
INTEREST RATES
We centrally manage our debt and cash equivalents,
considering investment opportunities and risks, tax
consequences and overall fi nancing strategies. Our
cash equivalents consist primarily of commercial paper
and obligations of U.S. Government agencies. As of
June 30, 2008, we had $155.5 million of variable rate
debt outstanding. Assuming current cash equivalents
and variable rate borrowings, a hypothetical change in
average interest rates of one percentage point would not
have a material effect on our fi nancial position, results of
operations or cash fl ows over the next fi scal year.
24 THE HAIN CELESTIAL GROUP, INC.
FOREIGN OPERATIONS
Operating in international markets involves exposure to
movements in currency exchange rates, which are volatile
at times. The economic impact of currency exchange rate
movements is complex because such changes are often
linked to variability in real growth, infl ation, interest rates,
governmental actions and other factors. Consequently,
isolating the effect of changes in currency does not
incorporate these other important economic factors.
These changes, if material, could cause adjustments to
our fi nancing and operating strategies. During fi scal 2008,
approximately 22.9% of our net sales were generated from
sales outside the United States, while such sales outside
the United States were 24.9% of net sales in 2007 and 19.3%
of net sales in 2006.
We expect sales from non-U.S. markets to possibly
represent an increasing portion of our total net sales in
the future. Our non-U.S. sales and operations are subject
to risks inherent in conducting business abroad, many of
which are outside our control, including:
periodic economic downturns and unstable
political environments;
price and currency exchange controls;
fl uctuations in the relative values of currencies;
unexpected changes in trading policies, regulatory
requirements, tariffs and other barriers;
compliance with applicable foreign laws; and
diffi culties in managing a global enterprise,
including staffi ng, collecting accounts receivable and
managing distributors.
INGREDIENT INPUTS PRICE RISK
The Company purchases ingredient inputs such as
wheat, corn, soybeans, canola oil and fruit as well
as packaging materials to be used in its operations.
These inputs are subject to price fl uctuations that may
create price risk. We do not attempt to hedge against
fl uctuations in the prices of the ingredients by using
future, forward, option or other derivative instruments.
As a result, the majority of our future purchases of
these items are subject to changes in price. We may
enter into fi xed purchase commitments in an attempt
to secure an adequate supply of specifi c ingredients.
These agreements are tied to specifi c market prices.
Market risk is estimated as a hypothetical 10% increase
or decrease in the weighted average cost of our primary
inputs as of June 30, 2008. Based on our cost of goods
sold during the twelve months ended June 30, 2008,
such a change would have resulted in an increase or
decrease to cost of sales of approximately $41 million. We
attempt to offset the impact of input cost increases with
a combination of cost savings initiatives and effi ciencies
and price increases to our customers.

2008 ANNUAL REPORT 25
THE STOCKHOLDERS AND BOARD OF DIRECTORS OF
THE HAIN CELESTIAL GROUP, INC. AND SUBSIDIARIES
We have audited the accompanying consolidated balance sheets of The Hain Celestial Group, Inc. (the “Company”) and
Subsidiaries as of June 30, 2008 and 2007, and the related consolidated statements of income, stockholders’ equity,
and cash fl ows for each of the three years in the period ended June 30, 2008. These fi nancial statements are the
responsibility of the Company’s management. Our responsibility is to express an opinion on these fi nancial statements
based on our audits.
We conducted our audits in accordance with the standards of the Public Company Accounting Oversight Board
(United States). Those standards require that we plan and perform the audit to obtain reasonable assurance about
whether the fi nancial statements are free of material misstatement. An audit includes examining, on a test basis,
evidence supporting the amounts and disclosures in the fi nancial statements. An audit also includes assessing the
accounting principles used and signifi cant estimates made by management, as well as evaluating the overall fi nancial
statement presentation. We believe that our audits provide a reasonable basis for our opinion.
In our opinion, the fi nancial statements referred to above present fairly, in all material respects, the consolidated
fi nancial position of The Hain Celestial Group, Inc. and Subsidiaries at June 30, 2008 and 2007, and the consolidated
results of their operations and their cash fl ows for each of the three years in the period ended June 30, 2008, in
conformity with U.S. generally accepted accounting principles.
As described in Note 5 to the consolidated fi nancial statements, during the fourth quarter of 2007, the Company adopted
Securities and Exchange Commission Staff Accounting Bulletin No. 108, Considering the Effects of Prior Year Misstatements
when Quantifying Misstatements in the Current Year Financial Statements (“SAB No. 108”). In accordance with the transition
provisions of SAB No. 108, the Company recorded an adjustment to retained earnings effective July 1, 2006 for the
correction of prior period misstatements.
As described in Note 2 to the consolidated fi nancial statements, during the fi rst quarter of 2008, the Company
adopted Financial Accounting Standards Board Financial Interpretation No. 48, Accounting for Uncertainty in Income
Taxes (“FIN No. 48”). In accordance with the provisions of FIN No. 48, the Company recorded an adjustment to
retained earnings effective July 1, 2007.
We also have audited, in accordance with the standards of the Public Company Accounting Oversight Board
(United States), the effectiveness of The Hain Celestial Group, Inc.’s internal control over fi nancial reporting as of
June 30, 2008, based on criteria established in Internal Control—Integrated Framework issued by the Committee
of Sponsoring Organizations of the Treadway Commission and our report dated August 28, 2008 expressed an
unqualifi ed opinion thereon.
/s/ Ernst & Young LLP
Melville, New York
August 28, 2008
Report of Independent Registered Public Accounting Firm
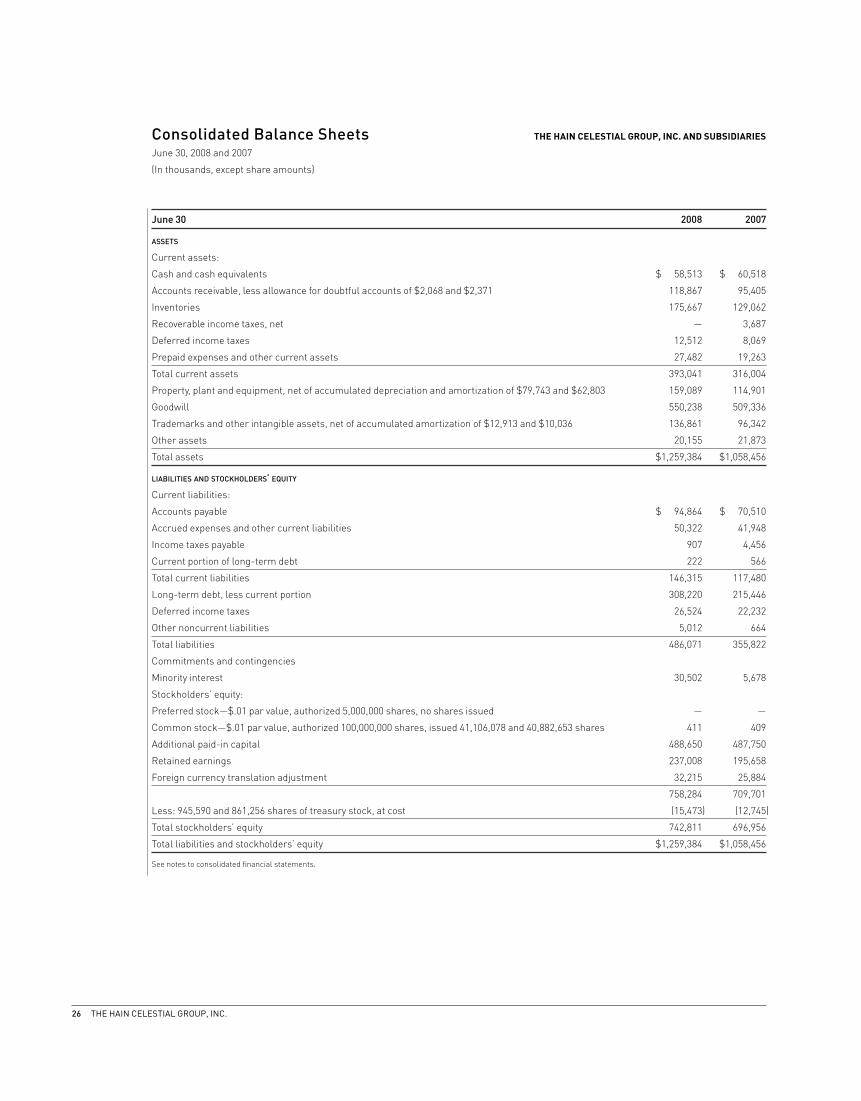
26 THE HAIN CELESTIAL GROUP, INC.
June 30 2008 2007
ASSETS
Current assets:
Cash and cash equivalents $ 58,513 $ 60,518
Accounts receivable, less allowance for doubtful accounts of $2,068 and $2,371 118,867 95,405
Inventories 175,667 129,062
Recoverable income taxes, net — 3,687
Deferred income taxes 12,512 8,069
Prepaid expenses and other current assets 27,482 19,263
Total current assets 393,041 316,004
Property, plant and equipment, net of accumulated depreciation and amortization of $79,743 and $62,803 159,089 114,901
Goodwill 550,238 509,336
Trademarks and other intangible assets, net of accumulated amortization of $12,913 and $10,036 136,861 96,342
Other assets 20,155 21,873
Total assets $1,259,384 $1,058,456
LIABILITIES AND STOCKHOLDERS’ EQUITY
Current liabilities:
Accounts payable $ 94,864 $ 70,510
Accrued expenses and other current liabilities 50,322 41,948
Income taxes payable 907 4,456
Current portion of long-term debt 222 566
Total current liabilities 146,315 117,480
Long-term debt, less current portion 308,220 215,446
Deferred income taxes 26,524 22,232
Other noncurrent liabilities 5,012 664
Total liabilities 486,071 355,822
Commitments and contingencies
Minority interest 30,502 5,678
Stockholders’ equity:
Preferred stock—$.01 par value, authorized 5,000,000 shares, no shares issued — —
Common stock—$.01 par value, authorized 100,000,000 shares, issued 41,106,078 and 40,882,653 shares 411 409
Additional paid-in capital 488,650 487,750
Retained earnings 237,008 195,658
Foreign currency translation adjustment 32,215 25,884
758,284 709,701
Less: 945,590 and 861,256 shares of treasury stock, at cost (15,473) (12,745)
Total stockholders’ equity 742,811 696,956
Total liabilities and stockholders’ equity $1,259,384 $1,058,456
See notes to consolidated fi nancial statements.
Consolidated Balance Sheets THE HAIN CELESTIAL GROUP, INC. AND SUBSIDIARIES
June 30, 2008 and 2007
(In thousands, except share amounts)

2008 ANNUAL REPORT 27
Year ended June 30 2008 2007 2006
Net sales $1,056,371 $900,432 $738,557
Cost of sales 772,062 639,002 525,205
Gross profi t 284,309 261,430 213,352
Selling, general and administrative expenses 207,553 177,453 148,295
Operating income 76,756 83,977 65,057
Interest and other expenses, net 11,311 6,885 5,911
Income before income taxes 65,445 77,092 59,146
Provision for income taxes 24,224 29,610 22,779
Net income $ 41,221 $ 47,482 $ 36,367
Net income per share:
Basic $ 1.03 $ 1.21 $ 0.97
Diluted $ 0.99 $ 1.16 $ 0.93
Weighted average common shares outstanding:
Basic 40,077 39,315 37,643
Diluted 41,765 41,108 38,912
See notes to consolidated fi nancial statements.
Consolidated Statements of Income THE HAIN CELESTIAL GROUP, INC. AND SUBSIDIARIESYEARS ENDED JUNE 30, 2008, 2007 AND 2006
(In thousands, except share amounts)

28 THE HAIN CELESTIAL GROUP, INC.
Foreign
Common Stock Additional Currency Compre-
Amount Paid-In Retained Treasury Stock Translation hensive
Shares at $.01 Capital Earnings Share Amount Adjustment Total Income
Balance at June 30, 2005 37,475,998 $375 $416,563 $116,965 861,256 $(12,745) $10,048 $531,206
Exercise of stock options 1,009,099 10 15,408 15,418
Issuance of common stock 1,098,574 11 21,784 21,795
Non-cash compensation charge 4,213 4,213
Tax benefi t from stock options 1,744 1,744
Comprehensive income:
Net income 36,367 36,367 $36,367
Translation adjustments 7,349 7,349 7,349
Total comprehensive income $43,716
Balance at June 30, 2006 39,583,671 396 459,712 153,332 861,256 (12,745) 17,397 618,092
Cumulative effect of adjustments
from the adoption of SAB No. 108,
net of taxes (5,156) (5,156)
Adjusted balance at June 30, 2006 39,583,671 396 459,712 148,176 861,256 (12,745) 17,397 612,936
Exercise of stock options 1,102,518 11 18,396 18,407
Issuance of common stock 196,464 2 5,607 5,609
Non-cash compensation charge 1,031 1,031
Tax benefi t from stock options 3,004 3,004
Comprehensive income:
Net income 47,482 47,482 $47,482
Translation adjustments 8,487 8,487 8,487
Total comprehensive income $55,969
Balance at June 30, 2007 40,882,653 409 487,750 195,658 861,256 (12,745) 25,884 696,956
Adoption of FIN No. 48 129 129
Exercise of stock options 223,425 2 2,414 2,416
Non-cash compensation charge (1,871) (1,871)
Tax benefi t from stock options 357 357
Shares withheld for payment of
employee payroll taxes due on
shares issued under stock-based
compensation plans 84,334 (2,728) (2,728)
Comprehensive income:
Net income 41,221 41,221 $41,221
Translation adjustments 6,331 6,331 6,331
Total comprehensive income $47,552
Balance at June 30, 2008 41,106,078 $411 $488,650 $237,008 945,590 $(15,473) $32,215 $742,811
See notes to consolidated fi nancial statements.
Consolidated Statements of Stockholders’ Equity THE HAIN CELESTIAL GROUP, INC. AND SUBSIDIARIES
Years ended June 30, 2008, 2007 and 2006
(In thousands, except per share and share data)

2008 ANNUAL REPORT 29
Year ended June 30 2008 2007 2006
CASH FLOWS FROM OPERATING ACTIVITIES
Net income $ 41,221 $ 47,482 $ 36,367
Adjustments to reconcile net income to net cash provided by operating activities:
Depreciation and amortization 19,980 15,692 12,549
Gain on dispositions (2,003) (3,401) —
Deferred income taxes 3,496 10,877 5,048
Tax benefi t of nonqualifi ed stock options 357 4,276 2,269
Excess tax benefi t of nonqualifi ed stock options — (1,136) (647)
Other non-cash items, net 2,277 1,167 1,175
Non-cash compensation (1,871) 1,031 4,213
Increase (decrease) in cash attributable to changes in operating assets and liabilities,
net of amounts applicable to acquired brands:
Accounts receivable (13,326) (9,365) (12,418)
Inventories (31,335) (9,793) (9,841)
Other current assets (5,766) 4,984 (2,311)
Other assets (3,167) (2,702) 769
Accounts payable and accrued expenses 12,942 9,014 10,432
Income taxes, net 1,681 (1,695) 6,561
Net cash provided by operating activities 24,486 66,431 54,166
CASH FLOWS FROM INVESTING ACTIVITIES
Acquisitions of brands, net of cash acquired (102,206) (137,849) (84,480)
Proceeds from dispositions 3,031 8,160 —
Purchases of property and equipment (19,811) (11,411) (14,479)
Proceeds from disposals of property and equipment 869 3,303 —
(Loan to) repayment from affi liate 2,025 (1,911) —
Equity investments — — (1,600)
Net cash used in investing activities (116,092) (139,708) (100,559)
CASH FLOWS FROM FINANCING ACTIVITIES
Proceeds from senior notes — — 150,000
Proceeds (payments) from bank revolving credit facility, net 90,500 65,000 (89,700)
Repayments of other long-term debt, net (631) (907) (3,854)
Costs in connection with bank fi nancing — (28) (1,201)
Shares withheld for payment of employee payroll taxes (2,728) — —
Loan from minority interest shareholder 2,368 — —
Proceeds from exercise of stock options, net of related expenses 2,416 18,407 15,104
Excess tax benefi ts from share-based compensation — 1,136 647
Net cash provided by fi nancing activities 91,925 83,608 70,996
Effect of exchange rate changes on cash (2,324) 1,312 133
Net increase (decrease) in cash and cash equivalents (2,005) 11,643 24,736
Cash and cash equivalents at beginning of year 60,518 48,875 24,139
Cash and cash equivalents at end of year $ 58,513 $ 60,518 $ 48,875
See notes to consolidated fi nancial statements.
Consolidated Statements of Cash Flows THE HAIN CELESTIAL GROUP, INC. AND SUBSIDIARIES
Years ended June 30, 2008, 2007 and 2006
(In thousands)

30 THE HAIN CELESTIAL GROUP, INC.
1. business
The Hain Celestial Group, Inc., a Delaware corporation,
and its subsidiaries (collectively, the “Company,” and
herein referred to as “we,” “us,” and “our”) manufacture,
market, distribute and sell natural and organic food
and personal care products under brand names which
are sold as “better-for-you” products. We are a leader
in many of the top natural food categories, with such
well-known food brands as Celestial Seasonings®,
Hain Pure Foods®, Westbrae Natural®, WestSoy®, Rice
Dream®, Soy Dream®, Imagine®, Walnut Acres Organic®,
Ethnic Gourmet®, Rosetto®, Little Bear Organic Foods®,
Bearitos®, Arrowhead Mills®, MaraNatha®, SunSpire®,
Health Valley®, Breadshop’s®, Casbah®, Spectrum
Naturals®, Spectrum Essentials®, Hollywood®, Garden
of Eatin’®, Terra®, Harry’s Premium Snacks®, Boston’s
The Best You’ve Ever Tasted®, Lima®, Grains Noirs®,
Natumi®, Yves Veggie Cuisine®, DeBoles®, Earth’s
Best®, Nile Spice®, Linda McCartney® (under license),
Daily Bread™, Realeat®, Granose®, and TofuTown®. The
Company’s principal specialty product lines include
Estee® sugar-free products and Alba®. Our natural and
organic personal care products are marketed under
the Avalon Organics®, Alba Botanica®, JASON®, Zia®,
Orjene®, Shaman Earthly Organics®, Heather’s®, Queen
Helene®, Batherapy®, Shower Therapy®, Footherapy®,
Tushies® and TenderCare® brands. Our natural and
organic antibiotic-free chicken is marketed under
the FreeBird™ brand and our antibiotic-free turkey is
marketed under the Plainville Farms® brand.
We operate in one business segment: the sale of natural
and organic food and personal care products. During
the three years ended June 30, 2008, approximately 47%,
46% and 47% of our revenues were derived from products
that are manufactured within our own facilities with
53%, 54% and 53% produced by various co-packers. In
fi scal 2008, 2007 and 2006, there was no co-packer who
manufactured 10% or more of our products.
2. summary of significant accounting policies
In the Notes to Consolidated Financial Statements, all
dollar amounts, except per share data, are in thousands
unless otherwise indicated.
CONSOLIDATION POLICY
Our accompanying consolidated fi nancial statements
include the accounts of the Company and all of its wholly-
owned and majority-owned subsidiaries. Intercompany
accounts and transactions have been eliminated in
consolidation. Investments in affi liated companies in which
the company exercises signifi cant infl uence, but which it
does not control, are accounted for in the accompanying
consolidated fi nancial statements under the equity
method of accounting. As such, consolidated net income
includes the company’s equity portion of current earnings
or losses of such companies. Investments in which the
company does not exercise signifi cant infl uence (generally
less than a 20 percent ownership interest) are accounted
for under the cost method.
USE OF ESTIMATES
The fi nancial statements are prepared in accordance
with accounting principles generally accepted in the
United States. The accounting principles we use require
us to make estimates and assumptions that affect the
reported amounts of assets and liabilities at the date
of the fi nancial statements and amounts of income and
expenses during the reporting periods presented. We
believe in the quality and reasonableness of our critical
accounting policies; however, it is likely that materially
different amounts would be reported under different
conditions or using assumptions different from those that
we have consistently applied.
CASH AND CASH EQUIVALENTS
The Company considers cash and cash equivalents to
include cash in banks, commercial paper and deposits
Notes to Consolidated Financial Statements
2008 ANNUAL REPORT 31
with fi nancial institutions that can be liquidated without
prior notice or penalty. The Company considers all
highly liquid investments with an original maturity of
three months or less to be cash equivalents.
VALUATION OF ACCOUNTS AND CHARGEBACKS RECEIVABLE AND
CONCENTRATION OF CREDIT RISK
We perform ongoing credit evaluations on existing and
new customers daily. We apply reserves for delinquent
or uncollectible trade receivables based on a specifi c
identifi cation methodology and also apply an additional
reserve based on the experience we have with our trade
receivables aging categories. Credit losses have been
within our expectations in recent years. While one of our
customers represented 13% of our trade receivables
balance as of June 30, 2008 and 16% of our trade
receivables balance as of June 30, 2007, we believe there
is no credit exposure at this time.
Based on cash collection history and other statistical
analysis, we estimate the amount of unauthorized
deductions our customers have taken that we expect to
be repaid in the near future in the form of a chargeback
receivable. Our estimate of this receivable balance
($2.5 million at June 30, 2008 and $2.4 million at
June 30, 2007) could be different had we used different
assumptions and judgments.
During the year ended June 30, 2008, sales to
one customer and its affi liates approximated 20% of
net sales. In fi scal 2007 sales to one customer and its
affi liates approximated 20% of net sales. In fi scal 2006,
sales to one customer and its affi liates approximated
21% of net sales.
INVENTORY
Our inventory is valued at the lower of actual cost or
market, utilizing the fi rst-in, fi rst-out method. We provide
write-downs for fi nished goods expected to become non-
saleable due to age and specifi cally identify and provide for
slow moving or obsolete raw ingredients and packaging.
PROPERTY, PLANT AND EQUIPMENT
Our property, plant and equipment is carried at cost
and depreciated or amortized on a straight-line basis
over the estimated useful lives or lease life, whichever
is shorter. We believe the asset lives assigned to our
property, plant and equipment are within ranges
generally used in consumer products manufacturing and
distribution businesses. Our manufacturing plants
and distribution centers, and their related assets, are
periodically reviewed to determine if any impairment
exists by analyzing underlying cash fl ow projections.
At this time, we believe no impairment of the carrying
value of such assets exists. Ordinary repairs and
maintenance are expensed as incurred. We utilize the
following ranges of asset lives:
Buildings and improvements 10–40 years
Machinery and equipment 3–20 years
Furniture and fi xtures 3–15 years
Leasehold improvements are amortized over the shorter
of the respective initial lease term or the estimated useful
life of the assets, and generally range from 3 to 15 years.
INTANGIBLES
Goodwill is no longer amortized and the value of an
identifi able intangible asset is amortized over its useful life
unless the asset is determined to have an indefi nite useful
life. The carrying value of goodwill, which is allocated to
reporting units, and other intangible assets with indefi nite
useful lives are tested annually for impairment.
REVENUE RECOGNITION AND SALES INCENTIVES
Sales are recognized when the earnings process is
complete, which occurs when products are shipped in
accordance with terms of agreements, title and risk of
loss transfer to customers, collection is probable and
pricing is fi xed or determinable. Sales are reported net
of sales incentives, which include trade discounts and
promotions and certain coupon costs. Shipping
and handling costs billed to customers are included in
32 THE HAIN CELESTIAL GROUP, INC.
reported sales. Allowances for cash discounts are recorded
in the period in which the related sale is recognized.
FOREIGN CURRENCY TRANSLATION
Financial statements of foreign subsidiaries are
translated into U.S. dollars at current rates, except
that revenues, costs and expenses are translated
at average rates during each reporting period. Net
exchange gains or losses resulting from the translation
of foreign fi nancial statements and the effect of
exchange rate changes on intercompany transactions
of a long-term investment nature are accumulated and
credited or charged directly to a separate component of
stockholders’ equity and other comprehensive income.
RESEARCH AND DEVELOPMENT COSTS
Research and development costs are expensed as
incurred and are included in selling, general and
administrative expenses in the accompanying consolidated
fi nancial statements. Research and development costs
amounted to $1.7 million in fi scal 2008, $1.5 million in fi scal
2007 and $1.2 million in fi scal year 2006. Our research and
development expenditures do not include the expenditures
on such activities undertaken by co-packers who develop
numerous products on their own initiative with the
expectation that we will accept their new product ideas
and market them under our brands. These efforts by
co-packers have resulted in a substantial number of our
new product introductions. We are unable to estimate the
amount of expenditures made by co-packers on research
and development; however, we believe such activities and
expenditures are important to our continuing ability to
introduce new products.
ADVERTISING COSTS
Media advertising costs, which are included in selling,
general and administrative expenses, amounted to
$8.2 million in fi scal 2008, $7.5 million in fi scal 2007 and
$5.4 million in fi scal year 2006. Such costs are expensed
as incurred.
INCOME TAXES
We follow the liability method of accounting for income
taxes. Under the liability method, deferred taxes are
determined based on the differences between the
fi nancial statement and tax bases of assets and liabilities
at enacted rates in effect in the years in which the
differences are expected to reverse. Valuation allowances
are provided for deferred tax assets to the extent it is
more likely than not that deferred tax assets will not be
recoverable against future taxable income.
We adopted FASB Financial Interpretation No. 48 (“FIN
No. 48”), “Accounting for Uncertainty in Income Taxes,”
at the beginning of fi scal year 2008. As a result of the
adoption of FIN No. 48, we recognize liabilities for
uncertain tax positions based on the two-step process
prescribed by the interpretation. The fi rst step requires
us to determine if the weight of available evidence
indicates that the tax position has met the threshold for
recognition; therefore, we must evaluate whether it is
more likely than not that the position will be sustained
on audit, including resolution of any related appeals
or litigation processes. The second step requires us
to measure the tax benefi t of the tax position taken, or
expected to be taken, in an income tax return as the
largest amount that is more than 50% likely of being
realized upon ultimate settlement. We reevaluate the
uncertain tax positions each quarter based on factors
including, but not limited to, changes in facts or
circumstances, changes in tax law, effectively settled
issues under audit, and new audit activity. Depending
on the jurisdiction, such a change in recognition or
measurement may result in the recognition of a tax
benefi t or an additional charge to the tax provision in the
period. We record interest and penalties in our provision
for income taxes.
SHIPPING AND HANDLING COSTS
We include the costs associated with shipping and
handling of our inventory as a component of cost of sales.
2008 ANNUAL REPORT 33
FAIR VALUES OF FINANCIAL INSTRUMENTS
Financial instruments consist primarily of investments
in cash and cash equivalents, trade accounts receivable,
accounts payable and debt obligations. The Company
estimates the fair value of fi nancial instruments
based on interest rates available to the Company and
by comparison to quoted market prices. At June 30,
2008 and 2007, we had $25.0 million and $40.5 million
invested in corporate money market securities, including
commercial paper, repurchase agreements, variable rate
instruments and bank instruments. These securities
are classifi ed as cash equivalents as their maturities
when purchased are less than three months. At June 30,
2008 and 2007, the carrying amounts of cash and cash
equivalents, accounts receivable, income taxes receivable
and payable and accounts payable are considered to be
representative of their respective fair values due to their
short-term nature. The carrying amounts of the notes
payable to banks are considered to be representative
of their respective fair values as their interest rates are
based on market rates. The estimated fair value of the
Company’s senior notes payable was approximately
$150 million at June 30, 2008 and June 30, 2007.
STOCK-BASED COMPENSATION
The Company has employee and director stock-based
compensation plans which are more fully described
in Note 14. Effective July 1, 2005, the Company adopted
Statement of Financial Accounting Standards No. 123(R)
(“SFAS No. 123(R)”), “Share-Based Payment,” to account
for stock-based compensation, using the modifi ed
prospective transition method. Under that transition
method, compensation cost is recognized for the vested
portion of stock-based payments granted on or after
July 1, 2005, based on the grant-date fair value estimated
in accordance with the provisions of SFAS No. 123(R) and
for all stock-based payments granted prior to, but not
yet vested as of July 1, 2005, based on the grant-date fair
value estimated in accordance with the original provisions
of SFAS No. 123. Prior to the adoption of SFAS No. 123(R),
the vesting of all outstanding options was accelerated
during the year ended June 30, 2005. As a result, there is
no compensation expense recognized in operating results
during the years ended June 30, 2008, 2007 and 2006 for
stock options granted prior to July 1, 2005.
The fair value of stock-based compensation awards is
recognized in expense over the vesting period of the
award, using the straight-line method. The fair value
of employee stock options is determined on the date of
grant using the Black-Scholes option pricing model. The
Company has used historical volatility in its estimate
of expected volatility. The expected life represents the
period of time (in years) for which the options granted
are expected to be outstanding. The Company used
the simplifi ed method for determining expected life as
permitted in SEC Staff Accounting Bulletin 107 for options
qualifying for such treatment (“plain-vanilla” options)
due to the limited history the Company currently has
with option exercise activity. The risk-free interest rate
is based on the U.S. Treasury yield curve. Restricted
stock awards are valued at the market value of our
common stock on the date of grant and recognized in
expense over the vesting period of the awards using the
straight-line method.
SFAS No. 123(R) also requires that compensation
expense be recognized for only that portion of stock-
based awards that are expected to vest. Therefore, we
apply estimated forfeiture rates that are derived from
historical employee termination activity to reduce the
amount of compensation expense recognized. If the
actual forfeitures differs from the estimate, additional
adjustments to compensation expense may be required
in future periods.
The Company receives an income tax deduction for
restricted stock grants when they vest and for stock
options exercised by employees in certain tax jurisdictions
equal to the excess of the market value of our common
stock on the date of exercise over the option price. Excess
tax benefi ts (tax benefi ts resulting from tax deductions in

34 THE HAIN CELESTIAL GROUP, INC.
excess of compensation cost recognized) are classifi ed
as a cash fl ow provided by fi nancing activities in the
accompanying Consolidated Statement of Cash Flows in
accordance with SFAS No. 123(R).
VALUATION OF LONG-LIVED ASSETS
We periodically evaluate the carrying value of long-lived
assets to be held and used in the business, other than
goodwill and intangible assets with indefi nite lives, when
events and circumstances occur indicating that the
carrying amount of the asset may not be recoverable.
An impairment is recognized when the estimated
undiscounted cash fl ows associated with the asset
or group of assets is less than their carrying value. If
the carrying value of a long-lived asset is considered
impaired, a loss is recognized based on the amount by
which the carrying value exceeds the fair market value
for assets to be held and used.
DEFERRED FINANCING COSTS
Eligible costs associated with obtaining debt fi nancing
are capitalized and amortized over the related term of
the applicable debt instruments, which approximates the
effective interest method.
RECENT ACCOUNTING PRONOUNCEMENTS
In September 2006, the FASB issued SFAS No. 157,
“Fair Value Measurements” (“SFAS No. 157”). SFAS
No. 157 defi nes fair value, establishes a framework for
measuring fair value and expands disclosure of fair
value measurements. SFAS No. 157 applies under other
accounting pronouncements that require or permit
fair value measurements and accordingly, does not
require any new fair value measurements. SFAS No.
157 is effective for fi nancial statements issued for fi scal
years beginning after November 15, 2007. We have not
yet assessed the impact, if any, that the implementation
of SFAS No. 157 will have on our consolidated results of
operations or fi nancial condition.
In February 2007, the FASB issued SFAS No. 159, “The
Fair Value Option for Financial Assets and Financial
Liabilities” (“SFAS No. 159”). SFAS No. 159 allows
companies to choose to measure certain fi nancial
instruments and certain other items at fair value. The
statement requires that unrealized gains and losses
are reported in earnings for items measured using
the fair value option and establishes presentation and
disclosure requirements. SFAS No. 159 is effective July 1,
2008 for the Company. We have not yet assessed the
impact that SFAS No. 159 may have on our consolidated
fi nancial statements.
In December 2007, the FASB issued SFAS No. 141(R),
“Business Combinations” (“SFAS No. 141(R)”).
SFAS No. 141(R) replaces SFAS No. 141, “Business
Combinations,” however, it retains the basic
requirements of the former Statement that the
acquisition method of accounting (previously referred
to as the purchase method) be used for all business
combinations. SFAS No. 141(R) requires the acquiring
entity in a business combination to recognize the
identifi able assets acquired, liabilities assumed and
any noncontrolling interest in the business acquired at
their acquisition-date fair values and generally requires
acquisition-related costs to be expensed as incurred.
SFAS No. 141(R) also provides guidance for recognizing
and measuring the goodwill acquired in a business
combination and determines what information to
disclose to enable users of the fi nancial statements to
evaluate the nature and fi nancial effects of the business
combination. The provisions of SFAS No. 141(R) must be
applied prospectively and are effective for the Company’s
fi scal year ending June 30, 2010 for all business
combinations occurring on or after July 1, 2009. We have
not yet assessed the impact that the implementation of
SFAS No. 141(R) may have on our consolidated results
of operations or fi nancial condition.
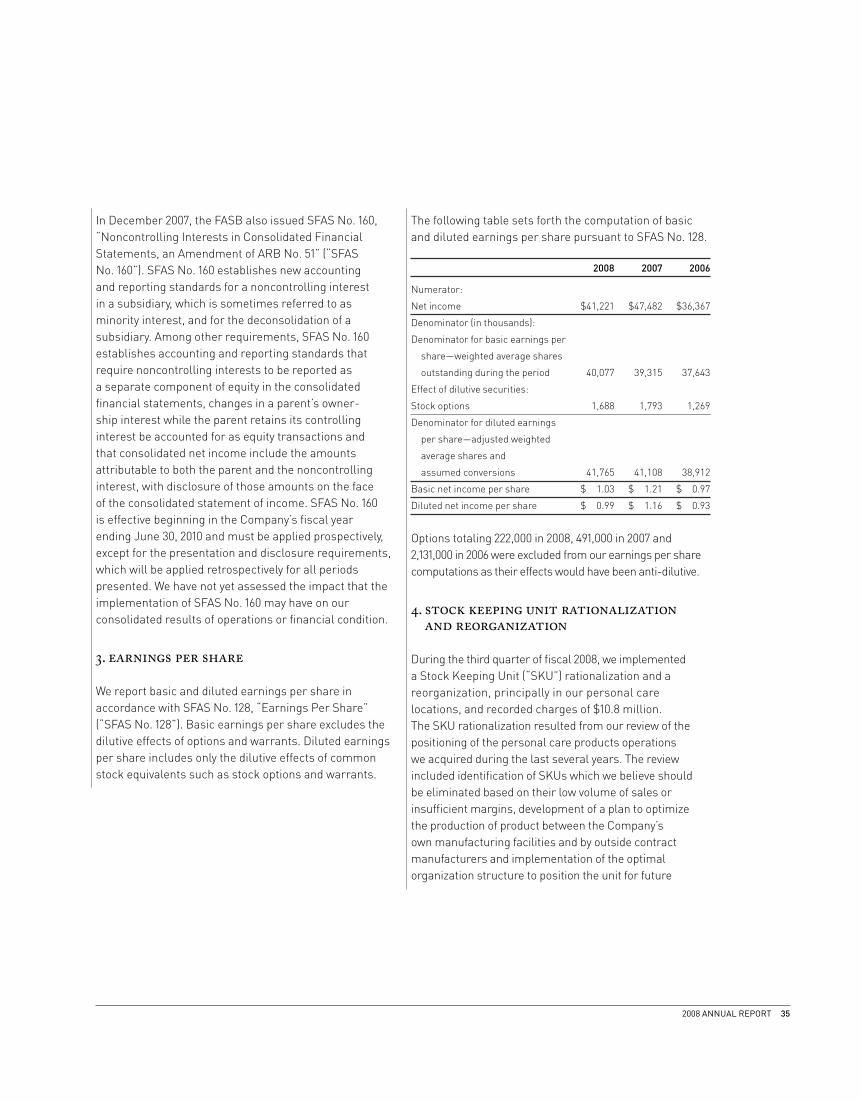
2008 ANNUAL REPORT 35
In December 2007, the FASB also issued SFAS No. 160,
“Noncontrolling Interests in Consolidated Financial
Statements, an Amendment of ARB No. 51” (“SFAS
No. 160”). SFAS No. 160 establishes new accounting
and reporting standards for a noncontrolling interest
in a subsidiary, which is sometimes referred to as
minority interest, and for the deconsolidation of a
subsidiary. Among other requirements, SFAS No. 160
establishes accounting and reporting standards that
require noncontrolling interests to be reported as
a separate component of equity in the consolidated
fi nancial statements, changes in a parent’s owner-
ship interest while the parent retains its controlling
interest be accounted for as equity transactions and
that consolidated net income include the amounts
attributable to both the parent and the noncontrolling
interest, with disclosure of those amounts on the face
of the consolidated statement of income. SFAS No. 160
is effective beginning in the Company’s fi scal year
ending June 30, 2010 and must be applied prospectively,
except for the presentation and disclosure requirements,
which will be applied retrospectively for all periods
presented. We have not yet assessed the impact that the
implementation of SFAS No. 160 may have on our
consolidated results of operations or fi nancial condition.
3. earnings per share
We report basic and diluted earnings per share in
accordance with SFAS No. 128, “Earnings Per Share”
(“SFAS No. 128”). Basic earnings per share excludes the
dilutive effects of options and warrants. Diluted earnings
per share includes only the dilutive effects of common
stock equivalents such as stock options and warrants.
The following table sets forth the computation of basic
and diluted earnings per share pursuant to SFAS No. 128.
2008 2007 2006
Numerator:
Net income $41,221 $47,482 $36,367
Denominator (in thousands):
Denominator for basic earnings per
share—weighted average shares
outstanding during the period 40,077 39,315 37,643
Effect of dilutive securities:
Stock options 1,688 1,793 1,269
Denominator for diluted earnings
per share—adjusted weighted
average shares and
assumed conversions 41,765 41,108 38,912
Basic net income per share $ 1.03 $ 1.21 $ 0.97
Diluted net income per share $ 0.99 $ 1.16 $ 0.93
Options totaling 222,000 in 2008, 491,000 in 2007 and
2,131,000 in 2006 were excluded from our earnings per share
computations as their effects would have been anti-dilutive.
4. stock keeping unit rationalization and reorganization
During the third quarter of fi scal 2008, we implemented
a Stock Keeping Unit (“SKU”) rationalization and a
reorganization, principally in our personal care
locations, and recorded charges of $10.8 million.
The SKU rationalization resulted from our review of the
positioning of the personal care products operations
we acquired during the last several years. The review
included identifi cation of SKUs which we believe should
be eliminated based on their low volume of sales or
insuffi cient margins, development of a plan to optimize
the production of product between the Company’s
own manufacturing facilities and by outside contract
manufacturers and implementation of the optimal
organization structure to position the unit for future

36 THE HAIN CELESTIAL GROUP, INC.
growth. As a result, cost of sales for fi scal 2008 includes
charges of approximately $6.9 million related to ingredient,
packaging and fi nished goods inventories, including the
costs of disposal, for SKUs being eliminated. Selling,
general and administrative expense includes charges of
$2.3 million related to assets that will not have continuing
value and $1.6 million for severance.
The change in the liability for the SKU rationalization
activities for the year ended June 30, 2008 was as follows:
Asset
write-downs Severance Total
Charges $ 9,221 $1,596 $10,817
Amounts utilized (4,759) (431) (5,190)
Liability balance June 30, 2008 $ 4,462 $1,165 $ 5,627
5. staff accounting bulletin no. 108, considering the effects of prior year misstatements when quantifying misstatements in current year financial statements
In September 2006, the Securities and Exchange
Commission (“SEC”) issued Staff Accounting Bulletin
No. 108, “Considering the Effects of Prior Year
Misstatements when Quantifying Misstatements in
Current Year Financial Statements” (“SAB No. 108”).
SAB No. 108 provides guidance on how prior year
misstatements should be taken into consideration when
quantifying misstatements in current year fi nancial
statements for purposes of determining whether the
current year’s fi nancial statements are materially
misstated. The transition provisions of SAB No. 108
permit the Company to adjust for the cumulative effect
on retained earnings of immaterial errors relating to
prior years. SAB No. 108 also requires the adjustment
of any prior quarterly fi nancial statements within the
fi scal year of adoption for the effects of such errors on
the quarters when the information is next presented.
Such adjustments do not require previously fi led reports
with the SEC to be amended.
We adopted SAB No. 108 in fi scal 2007 and elected to
record the effects of applying SAB No. 108 using the
cumulative effect transition method which resulted in the
correction of the carrying values of assets and liabilities
as of July 1, 2006 with an offsetting adjustment recorded
to the opening balance of retained earnings. We adjusted
the beginning retained earnings for fi scal 2007 for
“Accrued Trade Promotional Expenses,” described below.
Historically, we have evaluated uncorrected differences
utilizing the “rollover” approach. The rollover approach
quantifi es a misstatement based on the amount of the
error originating in the current year income statement.
Thus, this approach ignores the effects of correcting the
portion of the current year balance sheet misstatement
that originated in prior years (i.e., it ignores the “carryover
effects” of prior year misstatements). We believe that our
assessment of uncorrected differences in periods prior to
the adoption of SAB No. 108 and the conclusions reached
regarding the qualitative and quantitative effects of such
uncorrected differences were appropriate.
ACCRUED TRADE PROMOTIONAL EXPENSE
We adjusted our beginning retained earnings for
fi scal 2007 to recognize a reserve for expected trade
promotional expenses for certain locations. The
Company determined that two of its reporting units were
not recording trade promotional expenses on a basis
consistent with the Company’s other reporting units.
The total cumulative impact, net of tax, as of July 1, 2006
was as follows:
Current assets $ 3,290
Current liabilities $(8,446)
Retained earnings $ 5,156

2008 ANNUAL REPORT 37
6. acquisitions and disposals
We account for acquisitions using the purchase method of
accounting, and accordingly, the results of operations for
each acquisition have been included in our consolidated
results from their respective acquisition dates.
FISCAL 2008
On April 2, 2008, we acquired Daily Bread, Ltd., a London-
based producer of branded fresh prepared foods for
the foodservice channel in the United Kingdom, for
approximately $36.5 million in cash plus transaction
costs. The acquisition of Daily Bread broadens our
existing prepared foods operations with a branded fresh
platform which we expect will strengthen our ability to
expand our fresh operations across the United Kingdom
and Europe. The purchase price excludes contingency pay-
ments we may be obligated to pay. The contingency
payments are based on the achievement by the acquired
business of certain fi nancial targets over an approximate
two-year period following the date of acquisition. Such
payments, which could total £5.0 million (approximately
$10.0 million at the June 30, 2008 exchange rate),
will be charged to goodwill if and when paid. No such
contingency payments have been made since the
acquisition. The Company is in the process of obtaining
a valuation for acquired intangible assets. Based on
our preliminary purchase price allocation, we recorded
goodwill of $28.3 million at June 30, 2008, which is not
deductible for tax purposes.
On March 10, 2008, Hain Pure Protein Corporation
(“Hain Pure Protein”), a 50.1%-owned subsidiary, acquired
certain assets including the turkey production facility
and distribution center of Pilgrim’s Pride Corporation
in New Oxford, Pennsylvania for a total consideration of
$19.1 million in cash, including transaction costs. This
acquisition provides additional scale with the capacity to
meet increasing volume demands and expands our ability
to offer branded, premium poultry products.
On March 6, 2008, we acquired nSpired Natural Foods,
Inc., with its MaraNatha and SunSpire brands, for
approximately $37.6 million in cash, including transaction
costs. MaraNatha is a leading brand of natural and
organic nut butters and SunSpire is a leader in natural
and organic chocolate products. The addition of
MaraNatha is expected to strengthen our position in
the growing nut butter category and SunSpire provides
us entry into the natural candy category. We are in the
process of obtaining valuations for acquired tangible
and intangible assets and allocating the purchase price.
Based on estimated fair values at the acquisition date,
our preliminary purchase price allocation includes
goodwill of $24.1 million, which is not deductible for
tax purposes.
On December 7, 2007, we acquired TenderCare
International, Inc., a marketer and distributor of
chlorine-free and gel-free natural diapers and baby
wipes under the TenderCare and Tushies brand names,
for approximately $3.9 million in cash. The acquisition
is expected to strengthen our position in the natural
and organic sector with the expansion into diapers and
wipes. The purchase price was allocated to the tangible
and intangible assets acquired, including $4.8 million of
goodwill, which is not deductible for tax purposes.
The purchase price allocations for these acquisitions are
preliminary and may be revised as additional information
becomes available. Any change in the fair value of the net
assets acquired will change the amount of the purchase
price allocable to goodwill. The balance sheet at June 30,
2008 includes the assets acquired and liabilities assumed
valued on a preliminary basis at fair market value at the
dates of purchase. We are in the process of performing
the procedures required to fi nalize the purchase
price allocations for the above fi scal 2008 acquisitions;
however, these procedures are in the early stages and are
expected to be completed during fi scal 2009. Any required
adjustments to the preliminary purchase price will be
recorded in the period fi nalized.

38 THE HAIN CELESTIAL GROUP, INC.
On August 29, 2007, Hain Pure Protein acquired the
assets and business of Plainville Turkey Farm, Inc.,
a leading supplier of natural and antibiotic-free whole
turkeys and deli turkey products to the natural and
grocery channels in the Northeast and Mid-Atlantic
regions. The purchase price was approximately
$26.3 million in cash, including transaction costs,
plus contingent future earn-out payments based on
the earnings before interest, taxes, depreciation and
amortization of Plainville for the fi rst fi ve fi scal years
after acquisition, with a maximum potential payment
of $3 million. The Plainville acquisition expands our
specialty poultry business with a well-recognized
industry leader. During the quarter ended June 30, 2008,
the Company fi nalized the purchase price allocation and
assigned $7.1 million to identifi able intangible assets,
of which $1.3 million have been assigned fi nite lives and
are being amortized. The excess of the purchase price
over the estimated fair value of the net assets acquired
was $1.0 million and was recorded as goodwill, which is
deductible for tax purposes.
On August 4, 2007, we completed the sale of our interest
in a joint venture in Belgium that manufactured and
sold rice cakes and was accounted for using the equity
method. We recognized a pretax gain of approximately
$2.0 million in connection with the sale in the fi rst
quarter of fi scal 2008, which is included in “Interest and
other expenses, net” in the accompanying consolidated
statements of income.
In September 2007, we sold our minority interest in
Halo, Purely for Pets, Inc. for approximately $1.7 million.
This investment was made in June 2006 and accounted
for using the equity method. The Company recognized
a pretax gain of $0.3 million on the sale, which is
included in “Interest and other expenses, net” in the
accompanying consolidated statements of income.
FISCAL 2007
On June 8, 2007, we acquired the tofu and meat-
alternative business of WhiteWave Foods Company, a
subsidiary of Dean Foods Company. The product line
includes baked and grilled tofu, seitan, tempeh and
other traditional tofu items which are sold under the
TofuTown® and WestSoy® brand names. The acquisition
comple ments our existing Yves Veggie Cuisine® product
line, strengthening and expanding our fresh, meat-free
alternative product offerings. The total consideration paid
was approximately $2.2 million, including transaction
costs. No goodwill resulted from the transaction since
assets acquired exceeded consideration paid. The excess
of the net assets required over the purchase price was
allocated as a reduction of fi xed assets.
On January 11, 2007, we acquired Avalon Natural
Products, Inc. (“Avalon”), a leader in the natural products
category in the areas of skin care, hair care, bath and
body and sun care, for approximately $126.1 million in
cash, including transaction costs. We believe that the
addition of the Avalon Organics®, Alba Botanica® and
Alba Organics™ brands provides us with a stronger,
broader product portfolio in the natural and organic
personal care products category. The acquisition was
funded with available cash balances and borrowings
under our Credit Facility (see Note 11). During the
quarter ended March 31, 2008, the Company fi nalized the
purchase price allocation and has assigned $27.9 million
to identifi able intangible assets, of which $2.3 million
have been assigned fi nite lives and are being amortized.
The excess of the purchase price over the estimated fair
value of the net assets acquired was $92.8 million and
was recorded as goodwill, which is not deductible for tax
purposes. The following table summarizes the allocation
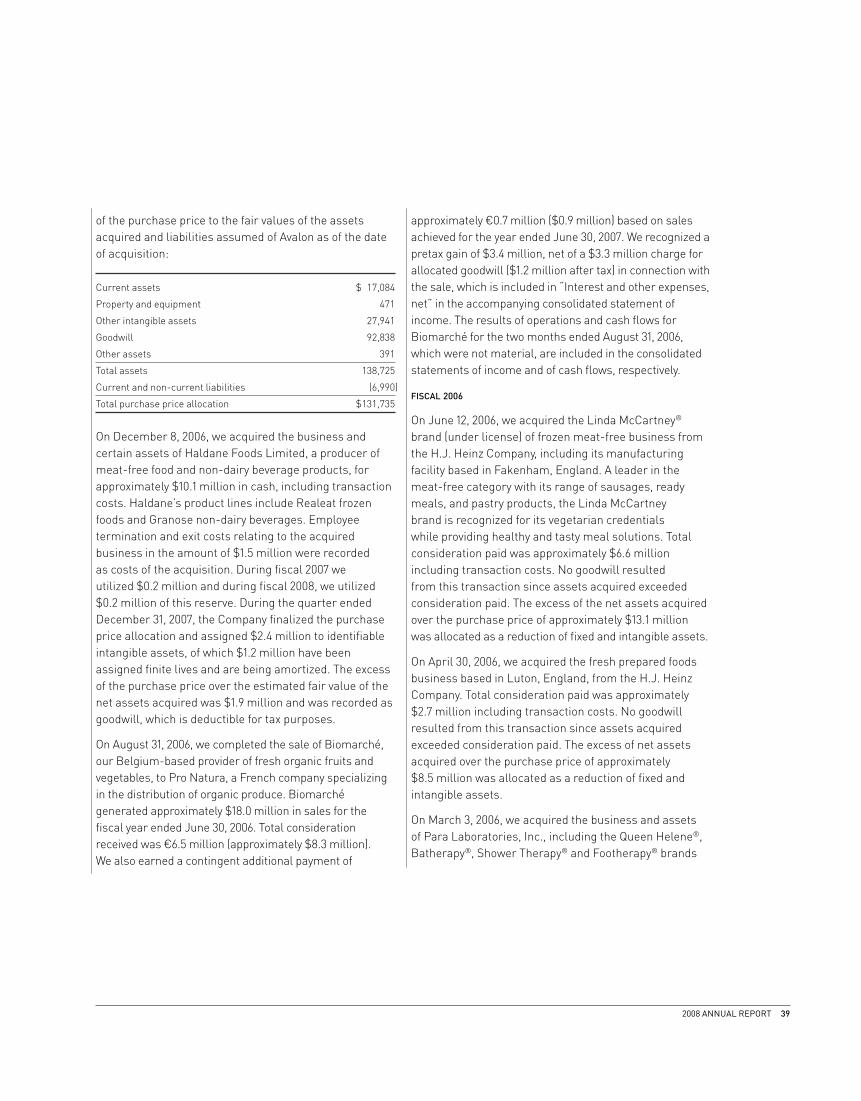
2008 ANNUAL REPORT 39
of the purchase price to the fair values of the assets
acquired and liabilities assumed of Avalon as of the date
of acquisition:
Current assets $ 17,084
Property and equipment 471
Other intangible assets 27,941
Goodwill 92,838
Other assets 391
Total assets 138,725
Current and non-current liabilities (6,990)
Total purchase price allocation $131,735
On December 8, 2006, we acquired the business and
certain assets of Haldane Foods Limited, a producer of
meat-free food and non-dairy beverage products, for
approximately $10.1 million in cash, including transaction
costs. Haldane’s product lines include Realeat frozen
foods and Granose non-dairy beverages. Employee
termination and exit costs relating to the acquired
business in the amount of $1.5 million were recorded
as costs of the acquisition. During fi scal 2007 we
utilized $0.2 million and during fi scal 2008, we utilized
$0.2 million of this reserve. During the quarter ended
December 31, 2007, the Company fi nalized the purchase
price allocation and assigned $2.4 million to identifi able
intangible assets, of which $1.2 million have been
assigned fi nite lives and are being amortized. The excess
of the purchase price over the estimated fair value of the
net assets acquired was $1.9 million and was recorded as
goodwill, which is deductible for tax purposes.
On August 31, 2006, we completed the sale of Biomarché,
our Belgium-based provider of fresh organic fruits and
vegetables, to Pro Natura, a French company specializing
in the distribution of organic produce. Biomarché
generated approximately $18.0 million in sales for the
fi scal year ended June 30, 2006. Total consideration
received was €6.5 million (approximately $8.3 million).
We also earned a contingent additional payment of
approximately €0.7 million ($0.9 million) based on sales
achieved for the year ended June 30, 2007. We recognized a
pretax gain of $3.4 million, net of a $3.3 million charge for
allocated goodwill ($1.2 million after tax) in connection with
the sale, which is included in “Interest and other expenses,
net” in the accompanying consolidated statement of
income. The results of operations and cash fl ows for
Biomarché for the two months ended August 31, 2006,
which were not material, are included in the consolidated
statements of income and of cash fl ows, respectively.
FISCAL 2006
On June 12, 2006, we acquired the Linda McCartney®
brand (under license) of frozen meat-free business from
the H.J. Heinz Company, including its manufacturing
facility based in Fakenham, England. A leader in the
meat-free category with its range of sausages, ready
meals, and pastry products, the Linda McCartney
brand is recognized for its vegetarian credentials
while providing healthy and tasty meal solutions. Total
consideration paid was approximately $6.6 million
including transaction costs. No goodwill resulted
from this transaction since assets acquired exceeded
consideration paid. The excess of the net assets acquired
over the purchase price of approximately $13.1 million
was allocated as a reduction of fi xed and intangible assets.
On April 30, 2006, we acquired the fresh prepared foods
business based in Luton, England, from the H.J. Heinz
Company. Total consideration paid was approximately
$2.7 million including transaction costs. No goodwill
resulted from this transaction since assets acquired
exceeded consideration paid. The excess of net assets
acquired over the purchase price of approximately
$8.5 million was allocated as a reduction of fi xed and
intangible assets.
On March 3, 2006, we acquired the business and assets
of Para Laboratories, Inc., including the Queen Helene®,
Batherapy®, Shower Therapy® and Footherapy® brands

40 THE HAIN CELESTIAL GROUP, INC.
of skin care, hair care, and body care products, which
are sold through drug stores, supermarkets and mass
retailers. The total consideration paid was approximately
$28.1 million in cash, $2.5 million in stock, plus the
assumption of certain liabilities. The purchase price
includes contingent consideration of $3.0 million paid
during fi scal 2008 based on the achievement by the
acquired business of certain fi nancial targets over
the approximate two-year period following the date of
acquisition. The purchase price was allocated to the
tangible and identifi able intangible assets acquired and
liabilities assumed based on their fair values at the
acquisition date. The Company has assigned $10.3 million
to identifi able intangible assets, predominantly trade
names which are not being amortized. The excess of the
purchase price over the estimated fair value of net assets
acquired was $16.9 million and was recorded as goodwill,
which is deductible for tax purposes.
On December 16, 2005, we acquired Spectrum Organic
Products, Inc. Spectrum is a California-based leading
manufacturer and marketer of natural and organic
culinary oils, vinegars, condiments and butter substitutes
under the Spectrum Naturals® brand and nutritional
supplements under the Spectrum Essentials® brand.
Spectrum’s products are sold mainly through natural food
retailers. Spectrum shareholders received $0.7035 per
share, consisting of $0.3485 per share in cash and
$0.355 per share in Hain shares, valuing the Hain shares
at $19.80 per share as provided in the merger agreement.
We issued approximately 900,000 shares in connection
with this acquisition. The total consideration paid was
approximately $29.3 million in cash, $17.4 million in stock
plus the assumption of certain liabilities. The purchase
price was allocated to the tangible and identifi able
intangible assets acquired and liabilities assumed
based on their fair values at the acquisition date. The
Company has assigned $18.3 million to identifi able
intangible assets, predominantly trade names which are
not being amortized. The excess of the purchase price
over the estimated fair value of net assets acquired was
$16.5 million and was recorded as goodwill, which is not
deductible for tax purposes.
On July 1, 2005, we acquired the assets of College Hill
Poultry of Fredericksburg, PA through Hain Pure Protein
Corporation, which is a joint venture with Pegasus
Capital Advisors, LP, a private equity fi rm. We control
50.1% of the joint venture. Hain Pure Protein’s brand of
natural and organic antibiotic-free chickens are raised
on family farms and grain-fed without antibiotics or
animal by-products. FreeBird™ customers include
super naturals and conventional supermarkets, natural
food stores and foodservice outlets. The purchase price
consisted of approximately $4.7 million in cash as well as
the assumption of certain liabilities.
The following table presents unaudited pro forma
information about net sales and net income had the
operations of the acquisitions described above been
combined with our business on the fi rst day of the
periods shown. The following pro forma combined results
of operations have been provided for illustrative purposes
only, and do not purport to be indicative of the actual
results that would have been achieved by the Company
for the periods presented or that will be achieved by the
combined company in the future.
2008 2007 2006
Net sales $1,114,057 $1,049,749 $1,014,596
Net income $ 41,742 $ 46,542 $ 37,017
Earnings per share:
Basic $ 1.04 $ 1.18 $ 0.97
Diluted $ 1.00 $ 1.13 $ 0.94
Weighted average shares:
Basic 40,077 39,315 38,125
Diluted 41,765 41,108 39,394
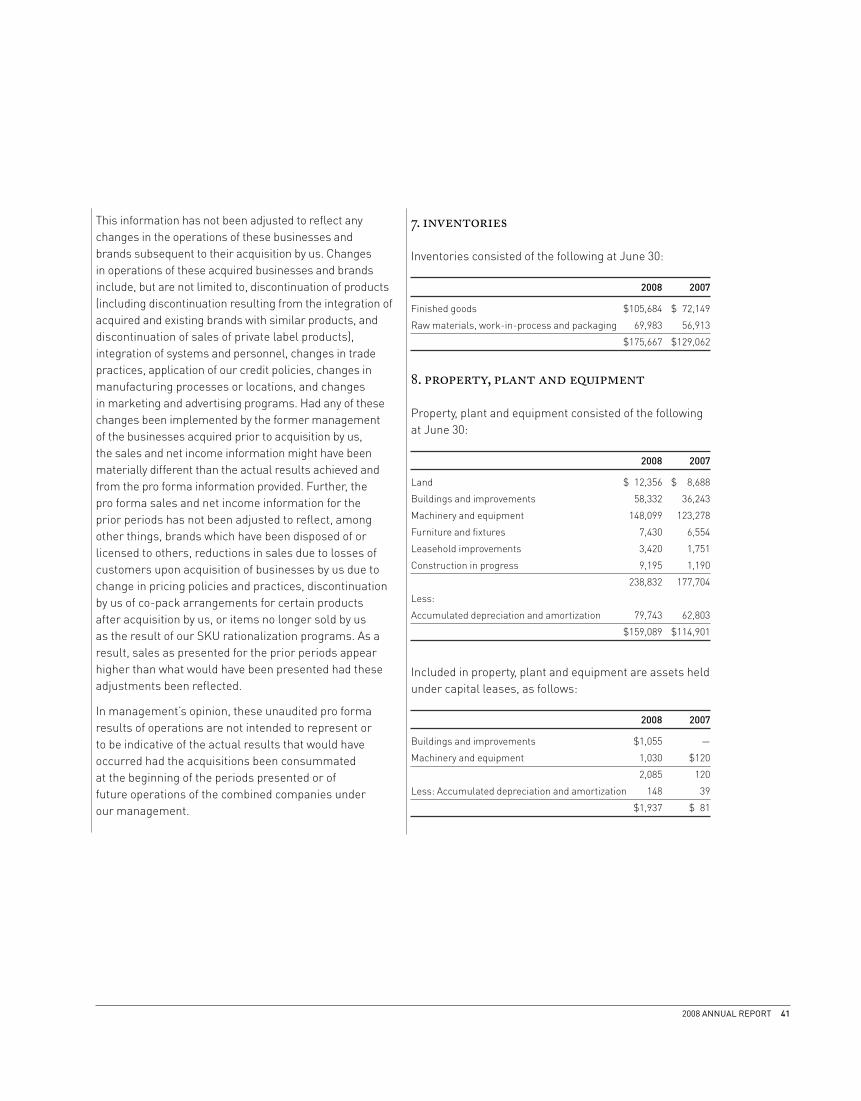
2008 ANNUAL REPORT 41
This information has not been adjusted to refl ect any
changes in the operations of these businesses and
brands subsequent to their acquisition by us. Changes
in operations of these acquired businesses and brands
include, but are not limited to, discontinuation of products
(including discontinuation resulting from the integration of
acquired and existing brands with similar products, and
discontinuation of sales of private label products),
integration of systems and personnel, changes in trade
practices, application of our credit policies, changes in
manufacturing processes or locations, and changes
in marketing and advertising programs. Had any of these
changes been implemented by the former management
of the businesses acquired prior to acquisition by us,
the sales and net income information might have been
materially different than the actual results achieved and
from the pro forma information provided. Further, the
pro forma sales and net income information for the
prior periods has not been adjusted to refl ect, among
other things, brands which have been disposed of or
licensed to others, reductions in sales due to losses of
customers upon acquisition of businesses by us due to
change in pricing policies and practices, discontinuation
by us of co-pack arrangements for certain products
after acquisition by us, or items no longer sold by us
as the result of our SKU rationalization programs. As a
result, sales as presented for the prior periods appear
higher than what would have been presented had these
adjustments been refl ected.
In management’s opinion, these unaudited pro forma
results of operations are not intended to represent or
to be indicative of the actual results that would have
occurred had the acquisitions been consummated
at the beginning of the periods presented or of
future operations of the combined companies under
our management.
7. inventories
Inventories consisted of the following at June 30:
2008 2007
Finished goods $105,684 $ 72,149
Raw materials, work-in-process and packaging 69,983 56,913
$175,667 $129,062
8. property, plant and equipment
Property, plant and equipment consisted of the following
at June 30:
2008 2007
Land $ 12,356 $ 8,688
Buildings and improvements 58,332 36,243
Machinery and equipment 148,099 123,278
Furniture and fi xtures 7,430 6,554
Leasehold improvements 3,420 1,751
Construction in progress 9,195 1,190
238,832 177,704
Less:
Accumulated depreciation and amortization 79,743 62,803
$159,089 $114,901
Included in property, plant and equipment are assets held
under capital leases, as follows:
2008 2007
Buildings and improvements $1,055 —
Machinery and equipment 1,030 $120
2,085 120
Less: Accumulated depreciation and amortization 148 39
$1,937 $ 81
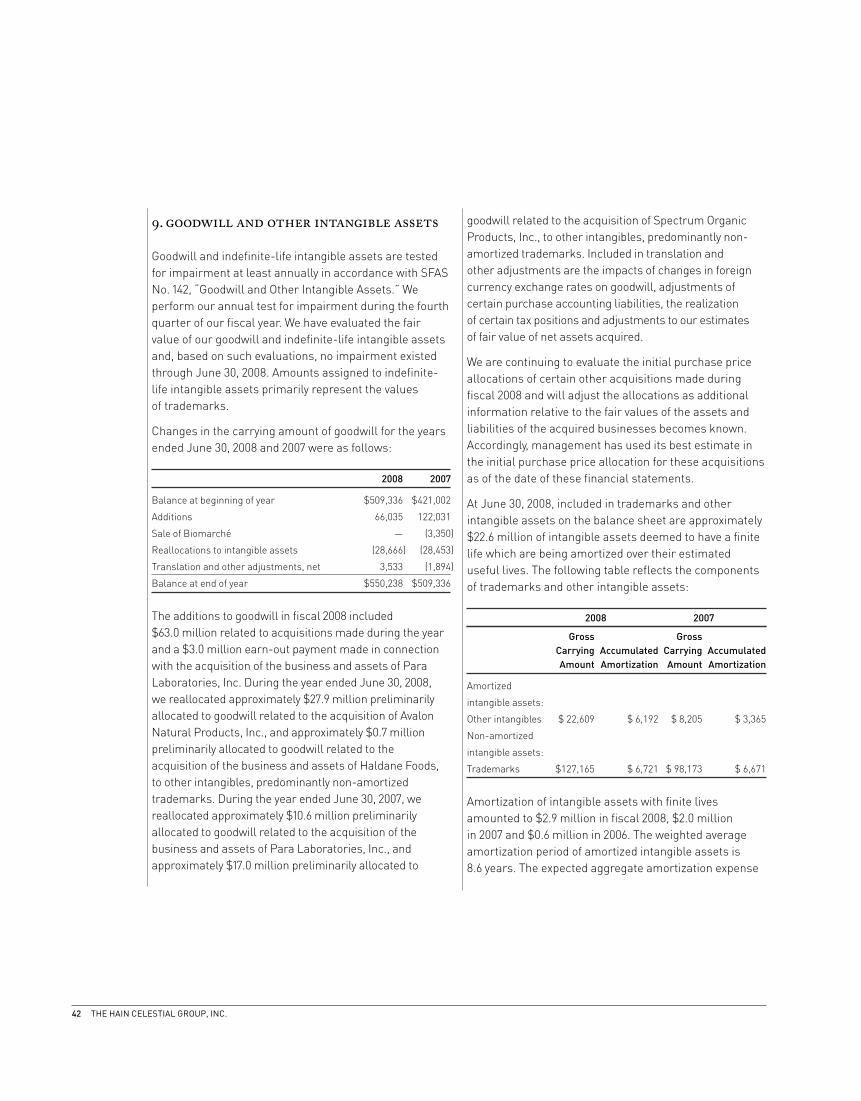
42 THE HAIN CELESTIAL GROUP, INC.
9. goodwill and other intangible assets
Goodwill and indefi nite-life intangible assets are tested
for impairment at least annually in accordance with SFAS
No. 142, “Goodwill and Other Intangible Assets.” We
perform our annual test for impairment during the fourth
quarter of our fi scal year. We have evaluated the fair
value of our goodwill and indefi nite-life intangible assets
and, based on such evaluations, no impairment existed
through June 30, 2008. Amounts assigned to indefi nite-
life intangible assets primarily represent the values
of trademarks.
Changes in the carrying amount of goodwill for the years
ended June 30, 2008 and 2007 were as follows:
2008 2007
Balance at beginning of year $509,336 $421,002
Additions 66,035 122,031
Sale of Biomarché — (3,350)
Reallocations to intangible assets (28,666) (28,453)
Translation and other adjustments, net 3,533 (1,894)
Balance at end of year $550,238 $509,336
The additions to goodwill in fi scal 2008 included
$63.0 million related to acquisitions made during the year
and a $3.0 million earn-out payment made in connection
with the acquisition of the business and assets of Para
Laboratories, Inc. During the year ended June 30, 2008,
we reallocated approximately $27.9 million preliminarily
allocated to goodwill related to the acquisition of Avalon
Natural Products, Inc., and approximately $0.7 million
preliminarily allocated to goodwill related to the
acquisition of the business and assets of Haldane Foods,
to other intangibles, predominantly non-amortized
trademarks. During the year ended June 30, 2007, we
reallocated approximately $10.6 million preliminarily
allocated to goodwill related to the acquisition of the
business and assets of Para Laboratories, Inc., and
approximately $17.0 million preliminarily allocated to
goodwill related to the acquisition of Spectrum Organic
Products, Inc., to other intangibles, predominantly non-
amortized trademarks. Included in translation and
other adjustments are the impacts of changes in foreign
currency exchange rates on goodwill, adjustments of
certain purchase accounting liabilities, the realization
of certain tax positions and adjustments to our estimates
of fair value of net assets acquired.
We are continuing to evaluate the initial purchase price
allocations of certain other acquisitions made during
fi scal 2008 and will adjust the allocations as additional
information relative to the fair values of the assets and
liabilities of the acquired businesses becomes known.
Accordingly, management has used its best estimate in
the initial purchase price allocation for these acquisitions
as of the date of these fi nancial statements.
At June 30, 2008, included in trademarks and other
intangible assets on the balance sheet are approximately
$22.6 million of intangible assets deemed to have a fi nite
life which are being amortized over their estimated
useful lives. The following table refl ects the components
of trademarks and other intangible assets:
2008 2007
Gross Gross
Carrying Accumulated Carrying Accumulated
Amount Amortization Amount Amortization
Amortized
intangible assets:
Other intangibles $ 22,609 $ 6,192 $ 8,205 $ 3,365
Non-amortized
intangible assets:
Trademarks $127,165 $ 6,721 $ 98,173 $ 6,671
Amortization of intangible assets with fi nite lives
amounted to $2.9 million in fi scal 2008, $2.0 million
in 2007 and $0.6 million in 2006. The weighted average
amortization period of amortized intangible assets is
8.6 years. The expected aggregate amortization expense
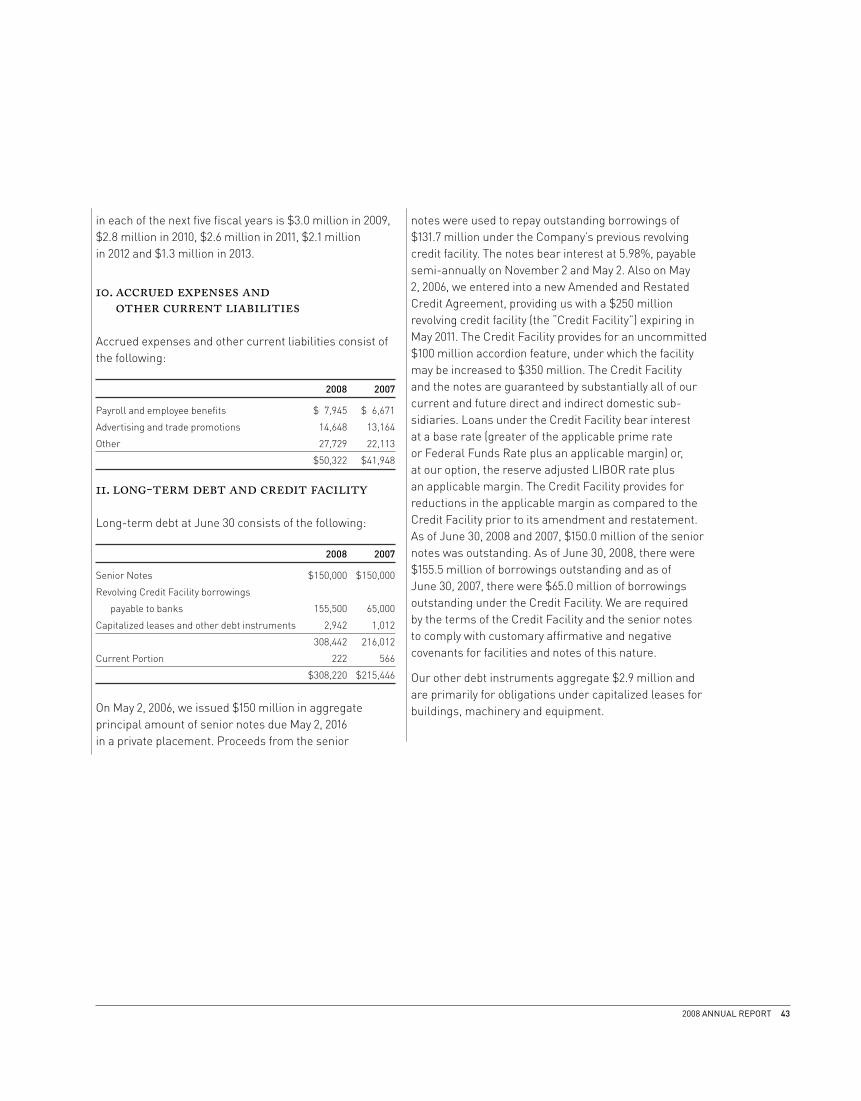
2008 ANNUAL REPORT 43
in each of the next fi ve fi scal years is $3.0 million in 2009,
$2.8 million in 2010, $2.6 million in 2011, $2.1 million
in 2012 and $1.3 million in 2013.
10. accrued expenses and other current liabilities
Accrued expenses and other current liabilities consist of
the following:
2008 2007
Payroll and employee benefi ts $ 7,945 $ 6,671
Advertising and trade promotions 14,648 13,164
Other 27,729 22,113
$50,322 $41,948
11. long-term debt and credit facility
Long-term debt at June 30 consists of the following:
2008 2007
Senior Notes $150,000 $150,000
Revolving Credit Facility borrowings
payable to banks 155,500 65,000
Capitalized leases and other debt instruments 2,942 1,012
308,442 216,012
Current Portion 222 566
$308,220 $215,446
On May 2, 2006, we issued $150 million in aggregate
principal amount of senior notes due May 2, 2016
in a private placement. Proceeds from the senior
notes were used to repay outstanding borrowings of
$131.7 million under the Company’s previous revolving
credit facility. The notes bear interest at 5.98%, payable
semi-annually on November 2 and May 2. Also on May
2, 2006, we entered into a new Amended and Restated
Credit Agreement, providing us with a $250 million
revolving credit facility (the “Credit Facility”) expiring in
May 2011. The Credit Facility provides for an uncommitted
$100 million accordion feature, under which the facility
may be increased to $350 million. The Credit Facility
and the notes are guaranteed by substantially all of our
current and future direct and indirect domestic sub-
sidiaries. Loans under the Credit Facility bear interest
at a base rate (greater of the applicable prime rate
or Federal Funds Rate plus an applicable margin) or,
at our option, the reserve adjusted LIBOR rate plus
an applicable margin. The Credit Facility provides for
reductions in the applicable margin as compared to the
Credit Facility prior to its amendment and restatement.
As of June 30, 2008 and 2007, $150.0 million of the senior
notes was outstanding. As of June 30, 2008, there were
$155.5 million of borrowings outstanding and as of
June 30, 2007, there were $65.0 million of borrowings
outstanding under the Credit Facility. We are required
by the terms of the Credit Facility and the senior notes
to comply with customary affi rmative and negative
covenants for facilities and notes of this nature.
Our other debt instruments aggregate $2.9 million and
are primarily for obligations under capitalized leases for
buildings, machinery and equipment.
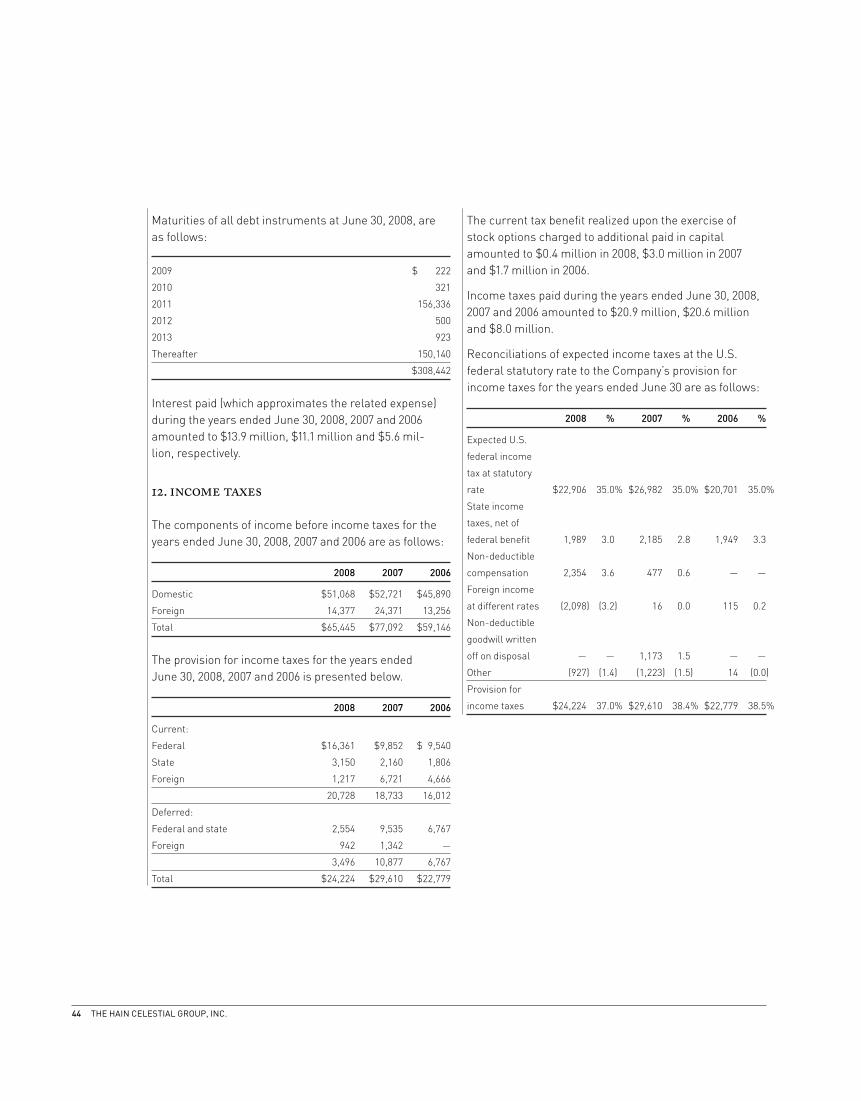
44 THE HAIN CELESTIAL GROUP, INC.
Maturities of all debt instruments at June 30, 2008, are
as follows:
2009 $ 222
2010 321
2011 156,336
2012 500
2013 923
Thereafter 150,140
$308,442
Interest paid (which approximates the related expense)
during the years ended June 30, 2008, 2007 and 2006
amounted to $13.9 million, $11.1 million and $5.6 mil-
lion, respectively.
12. income taxes
The components of income before income taxes for the
years ended June 30, 2008, 2007 and 2006 are as follows:
2008 2007 2006
Domestic $51,068 $52,721 $45,890
Foreign 14,377 24,371 13,256
Total $65,445 $77,092 $59,146
The provision for income taxes for the years ended
June 30, 2008, 2007 and 2006 is presented below.
2008 2007 2006
Current:
Federal $16,361 $9,852 $ 9,540
State 3,150 2,160 1,806
Foreign 1,217 6,721 4,666
20,728 18,733 16,012
Deferred:
Federal and state 2,554 9,535 6,767
Foreign 942 1,342 —
3,496 10,877 6,767
Total $24,224 $29,610 $22,779
The current tax benefi t realized upon the exercise of
stock options charged to additional paid in capital
amounted to $0.4 million in 2008, $3.0 million in 2007
and $1.7 million in 2006.
Income taxes paid during the years ended June 30, 2008,
2007 and 2006 amounted to $20.9 million, $20.6 million
and $8.0 million.
Reconciliations of expected income taxes at the U.S.
federal statutory rate to the Company’s provision for
income taxes for the years ended June 30 are as follows:
2008 % 2007 % 2006 %
Expected U.S.
federal income
tax at statutory
rate $22,906 35.0% $26,982 35.0% $20,701 35.0%
State income
taxes, net of
federal benefi t 1,989 3.0 2,185 2.8 1,949 3.3
Non-deductible
compensation 2,354 3.6 477 0.6 — —
Foreign income
at different rates (2,098) (3.2) 16 0.0 115 0.2
Non-deductible
goodwill written
off on disposal — — 1,173 1.5 — —
Other (927) (1.4) (1,223) (1.5) 14 (0.0)
Provision for
income taxes $24,224 37.0% $29,610 38.4% $22,779 38.5%

2008 ANNUAL REPORT 45
Deferred income taxes refl ect the net tax effects of
temporary differences between the carrying amount of
assets and liabilities for fi nancial reporting purposes and
the amounts used for income tax purposes. Components
of our deferred tax assets (liabilities) as of June 30 are
as follows:
2008 2007
Current deferred tax assets:
Basis difference on inventory $5,420 $2,695
Allowance for doubtful accounts 226 548
Reserves not currently deductible 6,866 4,826
Current deferred tax assets 12,512 8,069
Noncurrent deferred tax liabilities:
Difference in amortization (22,709) (18,966)
Basis difference on property and equipment (13,678) (11,782)
Noncurrent deferred tax assets:
Net operating loss and tax credit carryforwards 11,679 7,140
Stock options as compensation 2,986 3,470
Other (406) 196
Valuation allowances (4,396) (2,290)
Noncurrent deferred tax liabilities, net (26,524) (22,232)
$(14,012) $(14,163)
We have U.S. tax credit carryforwards of $3.0 million at
June 30, 2008 with various expiration dates through 2018.
We have U.S. federal tax net operating losses available
for carryforward at June 30, 2008 of $14.4 million that
were generated by certain subsidiaries prior to their
acquisition and have expiration dates through 2028.
The use of pre-acquisition operating losses is subject
to limitations imposed by the Internal Revenue Code.
We do not anticipate that these limitations will affect
utilization of the carryforwards prior to their expiration.
The Company and various subsidiaries have state tax net
operating loss carryforwards of $6.2 million at June 30,
2008 with varying expiration dates. We also have foreign
net operating losses of approximately $2.5 million which
are available to reduce future income tax payments in
Germany and Belgium. Of the $11.7 million deferred tax
asset for credit and net operating loss carryforwards at
June 30, 2008, the Company considers it unlikely that a
portion of these tax benefi ts will be realized; a $4.4 mil-
lion valuation allowance has been established against
these respective deferred tax assets.
As of June 30, 2008, the Company had approximately
$35.0 million of undistributed earnings of foreign
subsidiaries for which taxes have not been provided as
the Company has invested or expects to invest these
undistributed earnings indefi nitely. If in the future
these earnings are repatriated to the U.S., or if the
Company determines such earnings will be remitted in
the foreseeable future, additional tax provisions would
be required. Due to complexities in the tax laws and
the assumptions that would have to be made, it is not
practicable to estimate the amounts of income taxes that
might be payable if some or all of such earnings were
to be remitted.
As disclosed in Note 2, the Company adopted the
provisions of FIN No. 48 effective July 1, 2007. As a result,
we recognized a decrease of approximately $0.1 million
in the liability for unrecognized tax benefi ts, which was
accounted for as a cumulative effect adjustment to
reduce retained earnings. The total amount of gross
unrecognized tax benefi ts at the date of adoption
was $2.6 million, including interest and penalties of
$0.2 million. Included in this balance is $0.5 million that,
if recognized, would impact the effective income tax rate.
Unrecognized tax benefi ts activity for the year ended
June 30, 2008 is summarized below:
Balance at July 1, 2007 $2,614
Additions based on tax positions related to prior years 82
Reductions relating to settlements with taxing authorities (428)
Balance at June 30, 2008 $2,268
If all of the unrecognized tax benefi ts at June 30, 2008
were recognized, approximately $0.3 million would
impact the effective tax rate.
46 THE HAIN CELESTIAL GROUP, INC.
The Company records interest and penalties on tax
uncertainties as a component of the provision for
income taxes. The Company recognized approximately
$0.1 million of interest and penalties related to the
above unrecognized benefi ts within income tax expense
for the year ended June 30, 2008. The Company had
accrued approximately $0.4 million and $0.3 million
for interest and penalties at the end of fi scal 2008 and
2007, respectively.
The Company and its subsidiaries fi le income tax
returns in the U.S. federal jurisdiction, various U.S.
state jurisdictions and several foreign jurisdictions.
With few exceptions, the Company is no longer subject
to U.S. federal, state and local, or non-U.S. income tax
examinations by tax authorities for years before 2003.
Given the uncertainty regarding when tax authorities will
complete their examinations and the possible outcomes
of their examinations, a current estimate of the range of
reasonably possible signifi cant increases or decreases of
income tax that may occur within the next twelve months
cannot be made. The Company’s federal income tax
returns for fi scal years 2004 through 2006 are currently
being audited by the Internal Revenue Service. Although
proposed adjustments have not been received for these
years and the outcome of in-progress tax audits is always
uncertain, management believes the ultimate outcome
of the audit will not have a material impact on the
Company’s consolidated fi nancial statements.
13. stockholders’ equity
PREFERRED STOCK
We are authorized to issue “blank check” preferred stock
(up to 5 million shares) with such designations, rights
and preferences as may be determined from time to
time by the Board of Directors. Accordingly, the Board
of Directors is empowered to issue, without stockholder
approval, preferred stock with dividends, liquidation,
conversion, voting, or other rights which could
decrease the amount of earnings and assets available
for distribution to holders of our Common Stock. At
June 30, 2008 and 2007, no preferred stock was issued
or outstanding.
COMMON STOCK ISSUED—BUSINESS ACQUISITIONS
As part of the Spectrum and Para Laboratories
acquisitions consummated during fi scal 2006, a total
of 998,092 common shares were issued to the sellers,
valued at approximately $20.1 million in the aggregate.
(See Note 6.)
In connection with our strategic alliance with Yeo Hiap
Seng, Limited, we issued 100,482 common shares in
September 2005 valued at approximately $2.0 million
and 196,464 common shares in May 2007 valued at
approximately $6.0 million. (See Note 15.)
14. stock-based compensation
The Company has various plans under which the
Company’s offi cers, senior management, other key
employees and directors may be granted options to
purchase the Company’s common stock or other forms of
equity-based awards. We had stock option and restricted
stock awards outstanding under seven long-term incentive
plans as of June 30, 2008.
2002 Long-Term Incentive and Stock Award Plan, as
amended. In October 2002, we adopted the 2002 Long-
Term Incentive and Stock Award Plan. The plan provides
for the granting of stock options and other equity
awards to employees, directors and consultants to
purchase shares of our common stock. An aggregate
of 1,600,000 shares of common stock were originally
reserved for issuance under this plan. In December 2003,
the plan was amended to increase the number of shares
issuable by 1,500,000 shares and in November 2005,
the plan was further amended to increase the number
of shares issuable by 750,000 shares bringing the total
shares issuable under this plan to 3,850,000.
2008 ANNUAL REPORT 47
At the 2006 Annual Meeting of Stockholders, the plan was
amended to increase the number of shares issuable by
2,000,000 shares to 5,850,000 shares. All of the options
granted to date under the plan have been incentive or
non-qualifi ed stock options providing for the exercise
price equal to the fair market price at the date of grant
and expiration ten years after the date of grant. Effective
December 1, 2005, new stock option awards granted
under the plan expire seven years after the date of grant.
Vesting terms are determined at the discretion of the
Company. No awards shall be granted under this plan
after December 1, 2015. During fi scal years 2006 and 2007,
no options were granted under this plan. During fi scal
year 2008, options to purchase 590,839 shares were
granted under this plan at a price of $30.35 per share,
as well as, 417,829 shares of restricted stock. At June 30,
2008, 1,945,185 options and 409,004 unvested restricted
shares were outstanding under this plan. There were
1,233,351 options available for grant under this plan.
2000 Directors Stock Option Plan, as amended. In May 2000,
we adopted the 2000 Directors Stock Option Plan.
The plan originally provided for the granting of stock
options to non-employee directors to purchase up to
an aggregate of 750,000 shares of our common stock.
In December 2003, the plan was amended to increase
the number of shares issuable by 200,000 shares to
950,000 shares. All of the options granted to date under
the plan have been non-qualifi ed stock options providing
for the exercise price equal to the fair market price
at the date of grant and expiration ten years after the
date of grant. Effective December 1, 2005, new awards
granted under the plan will expire seven years after the
date of grant. During fi scal years 2006, 2007 and 2008,
no options were granted under this plan. At June 30,
2008, 482,500 options were outstanding. There were
264,500 options available for grant under this plan.
At June 30, 2008 there were 3,666,536 options outstanding
that were granted under fi ve other prior Hain and
Celestial Seasonings plans. Although no further
awards can be granted under those plans, the options
outstanding continue in accordance with the terms of the
respective plans.
Total stock-based compensation expenses included
in selling, general and administrative expense in the
consolidated statements of income were $(1,871) for 2008,
$1,031 for 2007 and $4,213 for 2006. At June 30, 2008 there
was $14,759 of unrecognized compensation expense,
which will be recognized over a weighted average period
of approximately 3 years.
SFAS No. 123(R) requires that contractual commitments
to issue stock options be recorded as compensation
cost whether or not the options have been granted.
The Company’s employment agreement with Irwin
Simon, its Chief Executive Offi cer (“CEO”), contains
such a commitment; however the options which were
to be awarded in July 2005, July 2006 and July 2007
were not granted at the those times. Under SFAS
No. 123(R), regardless of whether the options are ever
granted, either currently or in the future, a non-cash
accounting expense is required to be recorded during
the year leading up to the anticipated grant date under
the contract. This period is defi ned in SFAS No. 123(R)
as the “requisite service period.” The requisite service
period related to the July 2005 un-granted options
was completed on June 30, 2005, which was prior
to the required implementation of SFAS No. 123(R)
and, therefore, no expense has been recorded for the
July 2005 options. The requisite service period related to
the July 2006 un-granted options was completed during
the fi scal year ended June 30, 2006. On April 1, 2008, the
Compensation Committee of the Company’s Board of
Directors recommended and the Board approved equity
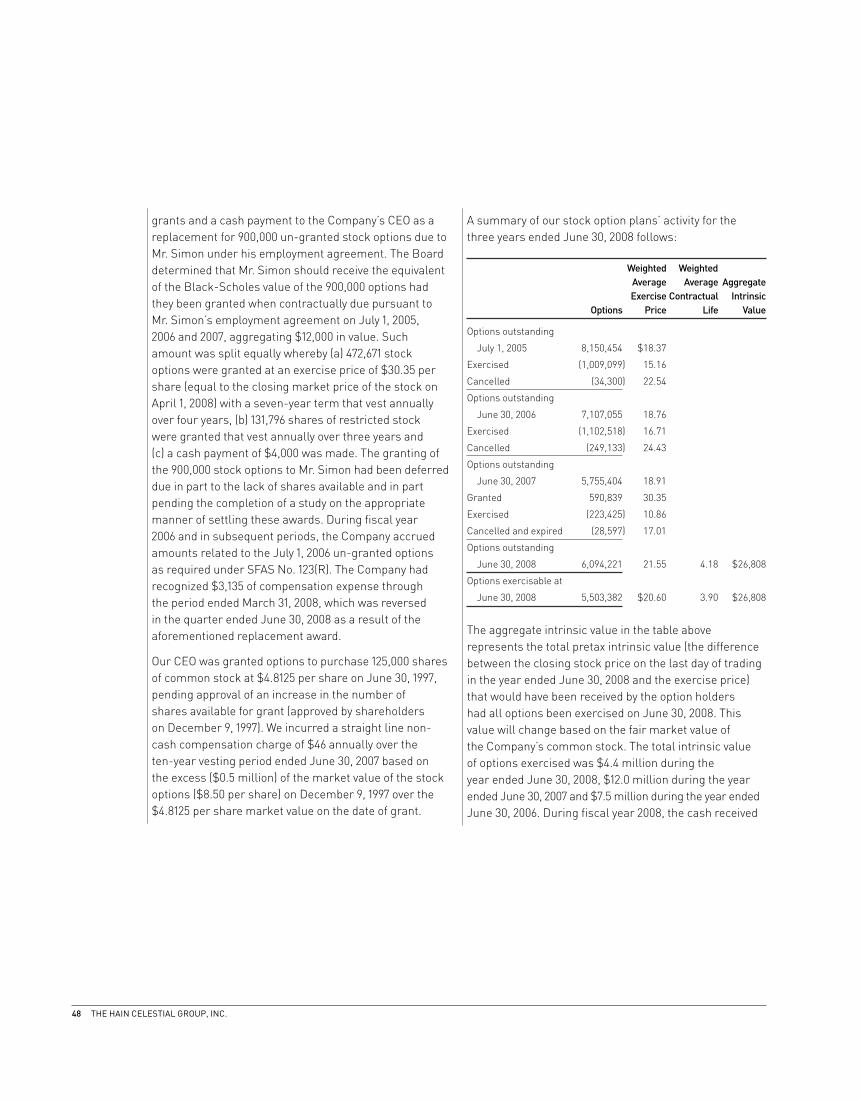
48 THE HAIN CELESTIAL GROUP, INC.
grants and a cash payment to the Company’s CEO as a
replacement for 900,000 un-granted stock options due to
Mr. Simon under his employment agreement. The Board
determined that Mr. Simon should receive the equivalent
of the Black-Scholes value of the 900,000 options had
they been granted when contractually due pursuant to
Mr. Simon’s employment agreement on July 1, 2005,
2006 and 2007, aggregating $12,000 in value. Such
amount was split equally whereby (a) 472,671 stock
options were granted at an exercise price of $30.35 per
share (equal to the closing market price of the stock on
April 1, 2008) with a seven-year term that vest annually
over four years, (b) 131,796 shares of restricted stock
were granted that vest annually over three years and
(c) a cash payment of $4,000 was made. The granting of
the 900,000 stock options to Mr. Simon had been deferred
due in part to the lack of shares available and in part
pending the completion of a study on the appropriate
manner of settling these awards. During fi scal year
2006 and in subsequent periods, the Company accrued
amounts related to the July 1, 2006 un-granted options
as required under SFAS No. 123(R). The Company had
recognized $3,135 of compensation expense through
the period ended March 31, 2008, which was reversed
in the quarter ended June 30, 2008 as a result of the
aforementioned replacement award.
Our CEO was granted options to purchase 125,000 shares
of common stock at $4.8125 per share on June 30, 1997,
pending approval of an increase in the number of
shares available for grant (approved by shareholders
on December 9, 1997). We incurred a straight line non-
cash compensation charge of $46 annually over the
ten-year vesting period ended June 30, 2007 based on
the excess ($0.5 million) of the market value of the stock
options ($8.50 per share) on December 9, 1997 over the
$4.8125 per share market value on the date of grant.
A summary of our stock option plans’ activity for the
three years ended June 30, 2008 follows:
Weighted Weighted
Average Average Aggregate
Exercise Contractual Intrinsic
Options Price Life Value
Options outstanding
July 1, 2005 8,150,454 $18.37
Exercised (1,009,099) 15.16
Cancelled (34,300) 22.54
Options outstanding
June 30, 2006 7,107,055 18.76
Exercised (1,102,518) 16.71
Cancelled (249,133) 24.43
Options outstanding
June 30, 2007 5,755,404 18.91
Granted 590,839 30.35
Exercised (223,425) 10.86
Cancelled and expired (28,597) 17.01
Options outstanding
June 30, 2008 6,094,221 21.55 4.18 $26,808
Options exercisable at
June 30, 2008 5,503,382 $20.60 3.90 $26,808
The aggregate intrinsic value in the table above
represents the total pretax intrinsic value (the difference
between the closing stock price on the last day of trading
in the year ended June 30, 2008 and the exercise price)
that would have been received by the option holders
had all options been exercised on June 30, 2008. This
value will change based on the fair market value of
the Company’s common stock. The total intrinsic value
of options exercised was $4.4 million during the
year ended June 30, 2008, $12.0 million during the year
ended June 30, 2007 and $7.5 million during the year ended
June 30, 2006. During fi scal year 2008, the cash received
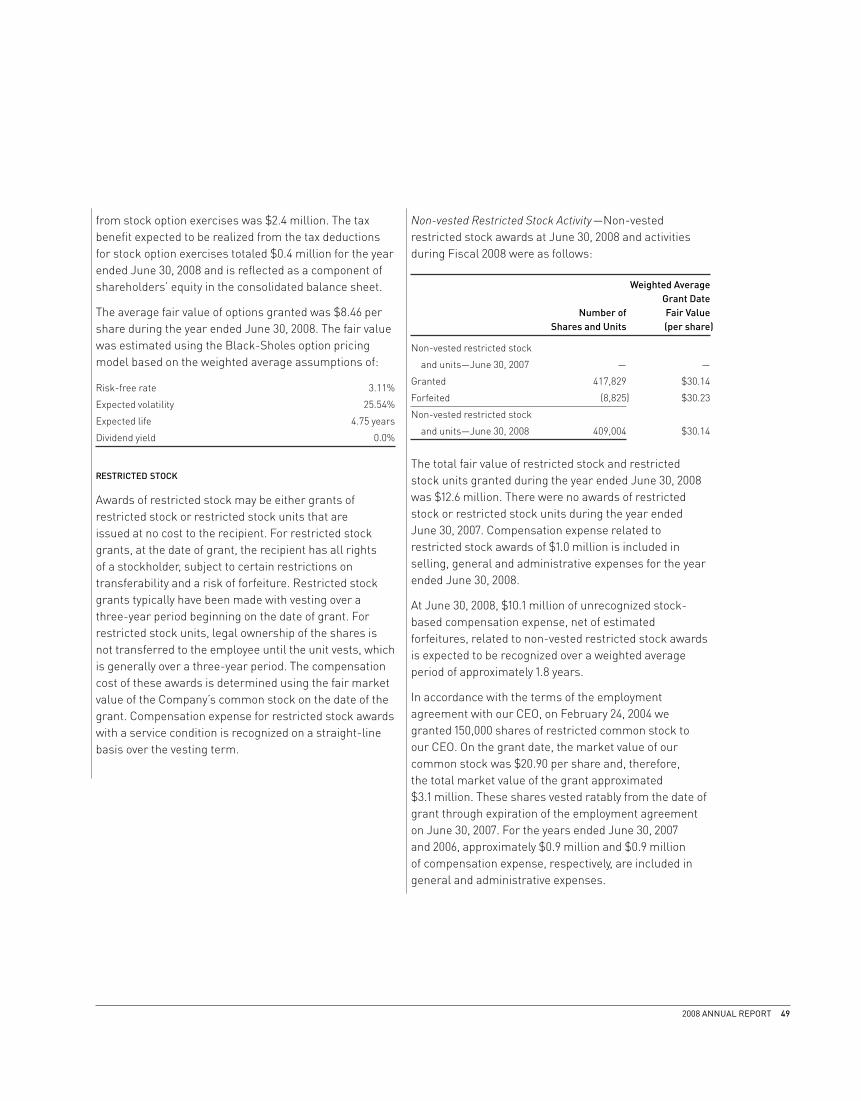
2008 ANNUAL REPORT 49
from stock option exercises was $2.4 million. The tax
benefi t expected to be realized from the tax deductions
for stock option exercises totaled $0.4 million for the year
ended June 30, 2008 and is refl ected as a component of
shareholders’ equity in the consolidated balance sheet.
The average fair value of options granted was $8.46 per
share during the year ended June 30, 2008. The fair value
was estimated using the Black-Sholes option pricing
model based on the weighted average assumptions of:
Risk-free rate 3.11%
Expected volatility 25.54%
Expected life 4.75 years
Dividend yield 0.0%
RESTRICTED STOCK
Awards of restricted stock may be either grants of
restricted stock or restricted stock units that are
issued at no cost to the recipient. For restricted stock
grants, at the date of grant, the recipient has all rights
of a stockholder, subject to certain restrictions on
transferability and a risk of forfeiture. Restricted stock
grants typically have been made with vesting over a
three-year period beginning on the date of grant. For
restricted stock units, legal ownership of the shares is
not transferred to the employee until the unit vests, which
is generally over a three-year period. The compensation
cost of these awards is determined using the fair market
value of the Company’s common stock on the date of the
grant. Compensation expense for restricted stock awards
with a service condition is recognized on a straight-line
basis over the vesting term.
Non-vested Restricted Stock Activity—Non-vested
restricted stock awards at June 30, 2008 and activities
during Fiscal 2008 were as follows:
Weighted Average
Grant Date
Number of Fair Value
Shares and Units (per share)
Non-vested restricted stock
and units—June 30, 2007 — —
Granted 417,829 $30.14
Forfeited (8,825) $30.23
Non-vested restricted stock
and units—June 30, 2008 409,004 $30.14
The total fair value of restricted stock and restricted
stock units granted during the year ended June 30, 2008
was $12.6 million. There were no awards of restricted
stock or restricted stock units during the year ended
June 30, 2007. Compensation expense related to
restricted stock awards of $1.0 million is included in
selling, general and administrative expenses for the year
ended June 30, 2008.
At June 30, 2008, $10.1 million of unrecognized stock-
based compensation expense, net of estimated
forfeitures, related to non-vested restricted stock awards
is expected to be recognized over a weighted average
period of approximately 1.8 years.
In accordance with the terms of the employment
agreement with our CEO, on February 24, 2004 we
granted 150,000 shares of restricted common stock to
our CEO. On the grant date, the market value of our
common stock was $20.90 per share and, therefore,
the total market value of the grant approximated
$3.1 million. These shares vested ratably from the date of
grant through expiration of the employment agreement
on June 30, 2007. For the years ended June 30, 2007
and 2006, approximately $0.9 million and $0.9 million
of compensation expense, respectively, are included in
general and administrative expenses.
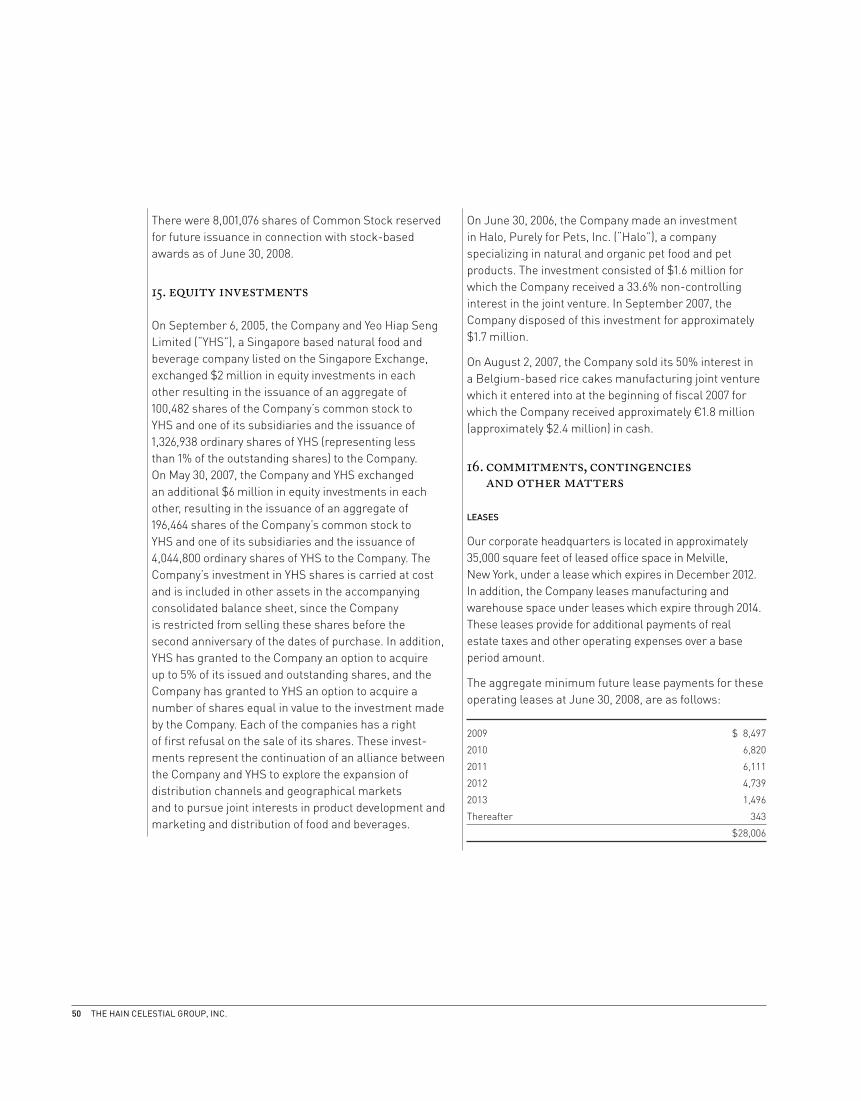
50 THE HAIN CELESTIAL GROUP, INC.
There were 8,001,076 shares of Common Stock reserved
for future issuance in connection with stock-based
awards as of June 30, 2008.
15. equity investments
On September 6, 2005, the Company and Yeo Hiap Seng
Limited (“YHS”), a Singapore based natural food and
beverage company listed on the Singapore Exchange,
exchanged $2 million in equity investments in each
other resulting in the issuance of an aggregate of
100,482 shares of the Company’s common stock to
YHS and one of its subsidiaries and the issuance of
1,326,938 ordinary shares of YHS (representing less
than 1% of the outstanding shares) to the Company.
On May 30, 2007, the Company and YHS exchanged
an additional $6 million in equity investments in each
other, resulting in the issuance of an aggregate of
196,464 shares of the Company’s common stock to
YHS and one of its subsidiaries and the issuance of
4,044,800 ordinary shares of YHS to the Company. The
Company’s investment in YHS shares is carried at cost
and is included in other assets in the accompanying
consolidated balance sheet, since the Company
is restricted from selling these shares before the
second anniversary of the dates of purchase. In addition,
YHS has granted to the Company an option to acquire
up to 5% of its issued and outstanding shares, and the
Company has granted to YHS an option to acquire a
number of shares equal in value to the investment made
by the Company. Each of the companies has a right
of fi rst refusal on the sale of its shares. These invest-
ments represent the continuation of an alliance between
the Company and YHS to explore the expansion of
distribution channels and geographical markets
and to pursue joint interests in product development and
marketing and distribution of food and beverages.
On June 30, 2006, the Company made an investment
in Halo, Purely for Pets, Inc. (“Halo”), a company
specializing in natural and organic pet food and pet
products. The investment consisted of $1.6 million for
which the Company received a 33.6% non-controlling
interest in the joint venture. In September 2007, the
Company disposed of this investment for approximately
$1.7 million.
On August 2, 2007, the Company sold its 50% interest in
a Belgium-based rice cakes manufacturing joint venture
which it entered into at the beginning of fi scal 2007 for
which the Company received approximately €1.8 million
(approximately $2.4 million) in cash.
16. commitments, contingencies and other matters
LEASES
Our corporate headquarters is located in approximately
35,000 square feet of leased offi ce space in Melville,
New York, under a lease which expires in December 2012.
In addition, the Company leases manufacturing and
warehouse space under leases which expire through 2014.
These leases provide for additional payments of real
estate taxes and other operating expenses over a base
period amount.
The aggregate minimum future lease payments for these
operating leases at June 30, 2008, are as follows:
2009 $ 8,497
2010 6,820
2011 6,111
2012 4,739
2013 1,496
Thereafter 343
$28,006
2008 ANNUAL REPORT 51
Rent expense charged to operations for the years
ended June 30, 2008, 2007 and 2006 was approximately
$8.9 million, $7.1 million and $5.4 million, respectively.
DEFINED CONTRIBUTION PLANS
We have a 401(k) Employee Retirement Plan (“Plan”)
to provide retirement benefi ts for eligible employees.
All full-time employees of Hain and our wholly-owned
domestic subsidiaries that have attained the age of 21
are eligible to participate upon completion of 30 days
of service. On an annual basis, we may, in our sole
discretion, make certain matching contributions. For
the years ended June 30, 2008, 2007 and 2006, we made
contributions to the Plan of $0.4 million, $0.4 million and
$0.3 million, respectively.
Our subsidiary, Hain Celestial Canada ULC, has its own
separate Registered Retirement Employee Savings Plan
for those employees residing in Canada. Employees of
Hain Celestial Canada who meet eligibility requirements
may participate in that plan.
FOREIGN EXCHANGE RISK MANAGEMENT
We have no involvement with derivative fi nancial
instruments and do not use them for trading purposes.
We may enter into foreign currency options or forward
exchange contracts to hedge certain foreign currency
transactions. The intent of this practice would be to
minimize the impact of foreign exchange rate movements
on our operating results. As of June 30, 2008, we had no
outstanding forward exchange contracts.
During the year ended June 30, 2008, we realized
approximately $2.3 million of foreign currency gains.
17. legal proceedings
From time to time, we are involved in litigation incidental
to the ordinary conduct of our business.
A purported shareholder derivative action was fi led against
the Company (solely as a nominal defendant) and certain
current and former offi cers and directors on September 21,
2006 in the Supreme Court of the State of New York,
County of Suffolk, alleging breaches of fi duciary duties
and unjust enrichment in connection with the Company’s
past stock option practices. The plaintiff seeks unspecifi ed
damages, disgorgement of options, attorneys’ fees and
expenses, and other unspecifi ed equitable relief from the
defendants. A second purported shareholder derivative
action was fi led on October 31, 2006 in the same court,
against substantially the same defendants and containing
substantially the same allegations, adding a claim of
breach of fi duciary duty. The two actions were consolidated
by a Court Order dated March 3, 2008. In the consolidated
complaint served on April 18, 2008, the defendant’s time to
respond to the consolidated complaint has been extended,
with the understanding that a date for such response
will be set at a conference with the Court scheduled for
October 22, 2008.
Disposition of pending litigation related to these matters
is not expected by management to have a material
adverse effect on our business, results of operations or
fi nancial condition.
On June 15, 2007, the Company announced that it had
been informed by the SEC that it was conducting an
informal inquiry into its stock option practices. The
Company is cooperating with the SEC’s investigation.
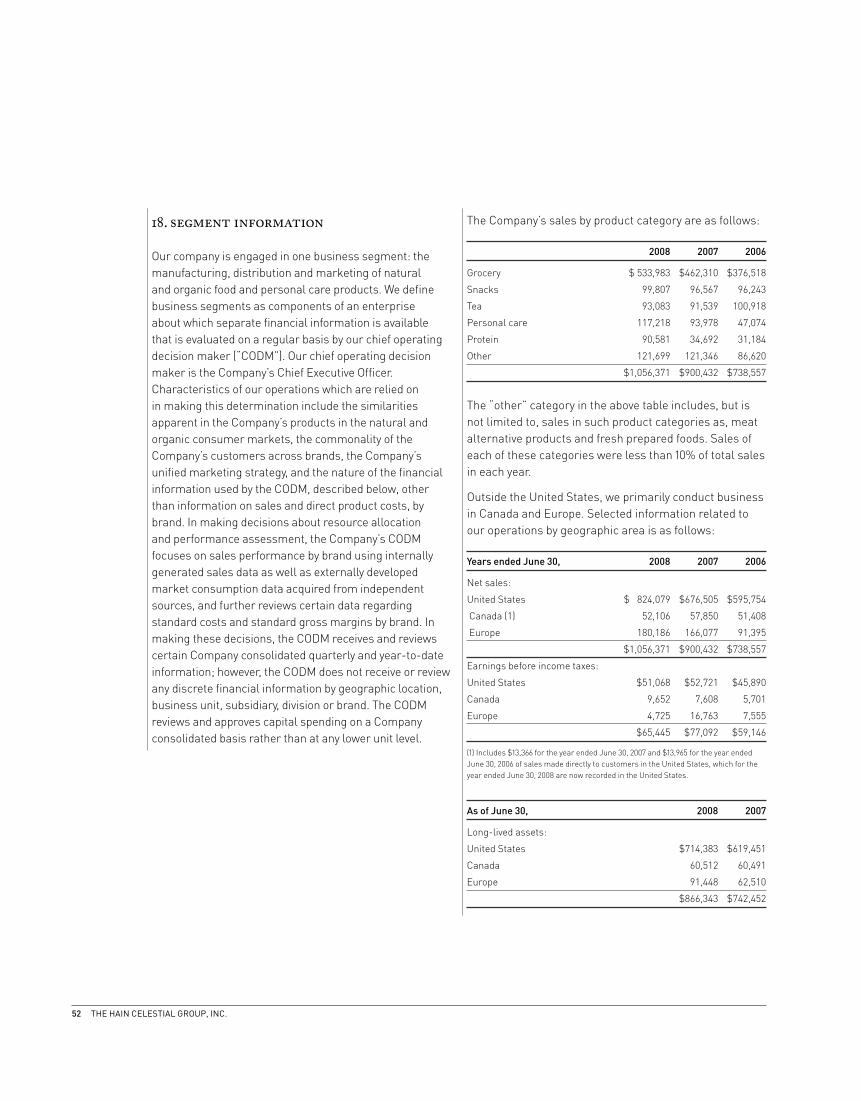
52 THE HAIN CELESTIAL GROUP, INC.
18. segment information
Our company is engaged in one business segment: the
manufacturing, distribution and marketing of natural
and organic food and personal care products. We defi ne
business segments as components of an enterprise
about which separate fi nancial information is available
that is evaluated on a regular basis by our chief operating
decision maker (“CODM”). Our chief operating decision
maker is the Company’s Chief Executive Offi cer.
Characteristics of our operations which are relied on
in making this determination include the similarities
apparent in the Company’s products in the natural and
organic consumer markets, the commonality of the
Company’s customers across brands, the Company’s
unifi ed marketing strategy, and the nature of the fi nancial
information used by the CODM, described below, other
than information on sales and direct product costs, by
brand. In making decisions about resource allocation
and performance assessment, the Company’s CODM
focuses on sales performance by brand using internally
generated sales data as well as externally developed
market consumption data acquired from independent
sources, and further reviews certain data regarding
standard costs and standard gross margins by brand. In
making these decisions, the CODM receives and reviews
certain Company consolidated quarterly and year-to-date
information; however, the CODM does not receive or review
any discrete fi nancial information by geographic location,
business unit, subsidiary, division or brand. The CODM
reviews and approves capital spending on a Company
consolidated basis rather than at any lower unit level.
The Company’s sales by product category are as follows:
2008 2007 2006
Grocery $ 533,983 $462,310 $376,518
Snacks 99,807 96,567 96,243
Tea 93,083 91,539 100,918
Personal care 117,218 93,978 47,074
Protein 90,581 34,692 31,184
Other 121,699 121,346 86,620
$1,056,371 $900,432 $738,557
The “other” category in the above table includes, but is
not limited to, sales in such product categories as, meat
alternative products and fresh prepared foods. Sales of
each of these categories were less than 10% of total sales
in each year.
Outside the United States, we primarily conduct business
in Canada and Europe. Selected information related to
our operations by geographic area is as follows:
Years ended June 30, 2008 2007 2006
Net sales:
United States $ 824,079 $676,505 $595,754
Canada (1) 52,106 57,850 51,408
Europe 180,186 166,077 91,395
$1,056,371 $900,432 $738,557
Earnings before income taxes:
United States $51,068 $52,721 $45,890
Canada 9,652 7,608 5,701
Europe 4,725 16,763 7,555
$65,445 $77,092 $59,146
(1) Includes $13,366 for the year ended June 30, 2007 and $13,965 for the year ended
June 30, 2006 of sales made directly to customers in the United States, which for the
year ended June 30, 2008 are now recorded in the United States.
As of June 30, 2008 2007
Long-lived assets:
United States $714,383 $619,451
Canada 60,512 60,491
Europe 91,448 62,510
$866,343 $742,452
2008 ANNUAL REPORT 53
Management, including our Chief Executive Offi cer and our Chief Financial Offi cer, is responsible for establishing and
maintaining adequate internal control over fi nancial reporting. The Company’s internal control system was designed to
provide reasonable assurance to the Company’s management and board of directors regarding the preparation and fair
presentation of the published fi nancial statements in accordance with generally accepted accounting principles.
Management assessed the effectiveness of our internal control over fi nancial reporting as of June 30, 2008. In making
this assessment, management used the criteria set forth by the Committee on Sponsoring Organizations of the
Treadway Commission in Internal Control—Integrated Framework. Based on our assessment, we believe that, as of
June 30, 2008, our internal control over fi nancial reporting is effective based on those criteria.
The Company’s internal control over fi nancial reporting as of June 30, 2008 has been audited by Ernst & Young LLP,
the independent registered public accounting fi rm who also audited the Company’s consolidated fi nancial statements.
Ernst & Young’s attestation report on management’s assessment of the Company’s internal control over fi nancial
reporting follows.
Management’s Report on Internal Control Over Financial Reporting

54 THE HAIN CELESTIAL GROUP, INC.
THE STOCKHOLDERS AND BOARD OF DIRECTORS OF
THE HAIN CELESTIAL GROUP, INC. AND SUBSIDIARIES
We have audited The Hain Celestial Group, Inc.’s (the “Company”) and Subsidiaries internal control over fi nancial
reporting as of June 30, 2008, based on criteria established in Internal Control—Integrated Framework issued by
the Committee of Sponsoring Organizations of the Treadway Commission (the COSO criteria). The Company’s
management is responsible for maintaining effective internal control over fi nancial reporting and for its assessment
of the effectiveness of internal control over fi nancial reporting included in the accompanying Management’s Report on
Internal Control over Financial Reporting. Our responsibility is to express an opinion on the Company’s internal control
over fi nancial reporting based on our audit.
We conducted our audit in accordance with the standards of the Public Company Accounting Oversight Board
(United States). Those standards require that we plan and perform the audit to obtain reasonable assurance about
whether effective internal control over fi nancial reporting was maintained in all material respects. Our audit included
obtaining an understanding of internal control over fi nancial reporting, assessing the risk that a material weakness
exists, testing and evaluating the design and operating effectiveness of internal control based on the assessed risk,
and performing such other procedures as we considered necessary in the circumstances. We believe that our audit
provides a reasonable basis for our opinion.
A company’s internal control over fi nancial reporting is a process designed to provide reasonable assurance regarding
the reliability of fi nancial reporting and the preparation of fi nancial statements for external purposes in accordance
with generally accepted accounting principles. A company’s internal control over fi nancial reporting includes those
policies and procedures that (1) pertain to the maintenance of records that, in reasonable detail, accurately and
fairly refl ect the transactions and dispositions of the assets of the company; (2) provide reasonable assurance that
transactions are recorded as necessary to permit preparation of fi nancial statements in accordance with generally
accepted accounting principles, and that receipts and expenditures of the company are being made only in accordance
with authorizations of management and directors of the company; and (3) provide reasonable assurance regarding
prevention or timely detection of unauthorized acquisition, use, or disposition of the company’s assets that could have
a material effect on the fi nancial statements.
Because of its inherent limitations, internal control over fi nancial reporting may not prevent or detect misstatements. Also,
projections of any evaluation of effectiveness to future periods are subject to the risk that controls may become inadequate
because of changes in conditions, or that the degree of compliance with the policies or procedures may deteriorate.
In our opinion, the Company maintained, in all material respects, effective internal control over fi nancial reporting as
of June 30, 2008, based on the COSO criteria.
We also have audited, in accordance with the standards of the Public Company Accounting Oversight Board (United States),
the consolidated balance sheets of The Hain Celestial Group, Inc. and Subsidiaries as of June 30, 2008 and 2007, and the
related consolidated statements of income, stockholders’ equity, and cash fl ows for each of the three years in the period
ended June 30, 2008 of the Company and our report dated August 28, 2008 expressed an unqualifi ed opinion thereon.
/s/Ernst & Young LLP
Melville, New York
August 28, 2008
Report of Independent Registered Public Accounting Firm
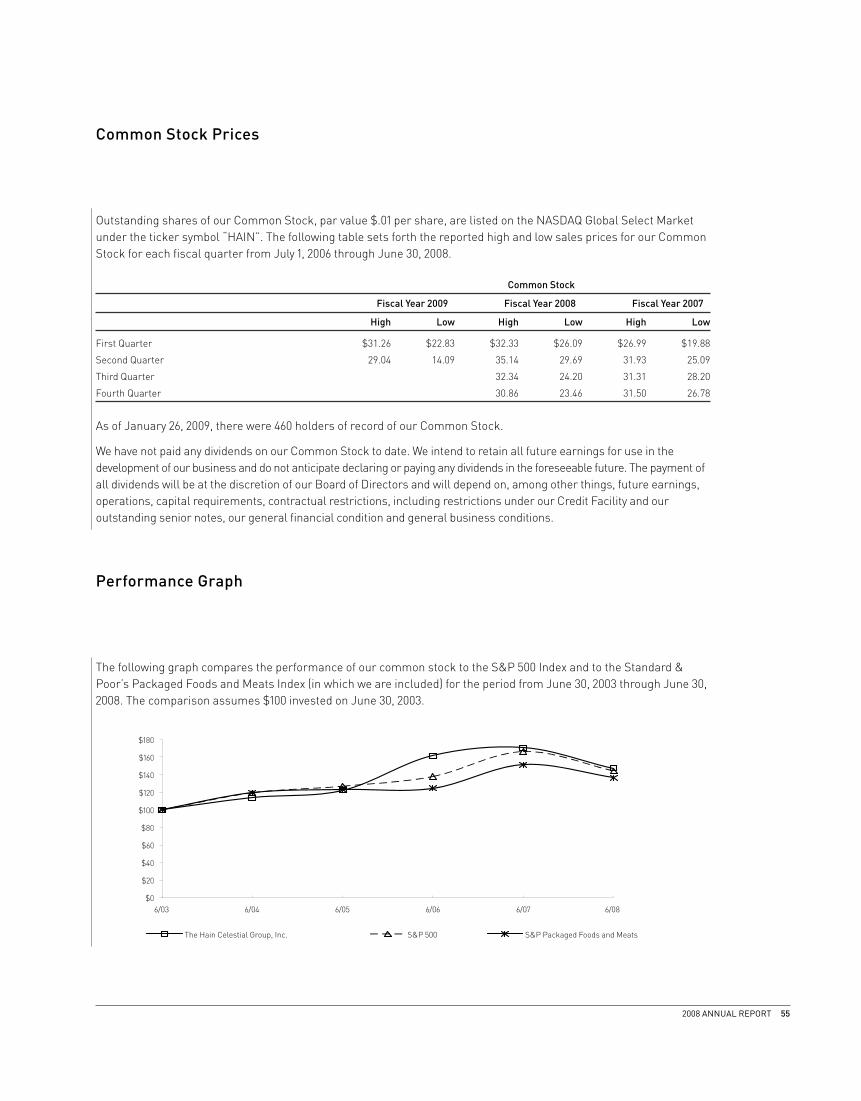
2008 ANNUAL REPORT 55
Outstanding shares of our Common Stock, par value $.01 per share, are listed on the NASDAQ Global Select Market
under the ticker symbol “HAIN”. The following table sets forth the reported high and low sales prices for our Common
Stock for each fi scal quarter from July 1, 2006 through June 30, 2008.
Common Stock
Fiscal Year 2009 Fiscal Year 2008 Fiscal Year 2007
High Low High Low High Low
First Quarter $31.26 $22.83 $32.33 $26.09 $26.99 $19.88
Second Quarter 29.04 14.09 35.14 29.69 31.93 25.09
Third Quarter 32.34 24.20 31.31 28.20
Fourth Quarter 30.86 23.46 31.50 26.78
As of January 26, 2009, there were 460 holders of record of our Common Stock.
We have not paid any dividends on our Common Stock to date. We intend to retain all future earnings for use in the
development of our business and do not anticipate declaring or paying any dividends in the foreseeable future. The payment of
all dividends will be at the discretion of our Board of Directors and will depend on, among other things, future earnings,
operations, capital requirements, contractual restrictions, including restrictions under our Credit Facility and our
outstanding senior notes, our general fi nancial condition and general business conditions.
The following graph compares the performance of our common stock to the S&P 500 Index and to the Standard &
Poor’s Packaged Foods and Meats Index (in which we are included) for the period from June 30, 2003 through June 30,
2008. The comparison assumes $100 invested on June 30, 2003.
Common Stock Prices
Performance Graph
$0
$20
$40
$60
$80
$100
$120
$140
$160
$180
6/03 6/04 6/05 6/06 6/07 6/08
$180$180
$160$160
$140$140
$120$120
$100$100
$80$80
$60$60
$40$40
$20$20
$0$0
6/03 6/04 6/05 6/06 6/07 6/08
The Hain Celestial Group, Inc. S&P 500 S&P Packaged Foods & MeatsThe Hain Celestial Group, Inc. S&P 500 S&P Packaged Foods and Meats

56 THE HAIN CELESTIAL GROUP, INC.
The following information has been summarized from our fi nancial statements. The information set forth below is not
necessarily indicative of results of future operations, and should be read in conjunction with Management’s Discussion
and Analysis of Financial Condition and Results of Operations, and the consolidated fi nancial statements and related
notes thereto included in this Annual Report and in our Annual Report on Form 10-K to fully understand factors that
may affect the comparability of the information presented below.
Year Ended June 30 2008 2007 2006 2005 2004
Operating results:
Net sales $1,056,371 $ 900,432 $738,557 $619,967 $544,058
Net income $ 41,221 $ 47,482 $ 36,367 $ 24,061 $ 25,263
Basic earnings per common share $ 1.03 $ 1.21 $ 0.97 $ 0.66 $ 0.72
Diluted earnings per common share $ 0.99 $ 1.16 $ 0.93 $ 0.65 $ 0.70
Financial position:
Working capital $ 246,726 $ 198,524 $172,933 $123,541 $129,190
Total assets $1,259,384 $1,058,456 $877,684 $707,136 $684,231
Long-term debt $ 308,220 $ 215,446 $151,229 $ 92,271 $104,294
Stockholders’ equity $ 742,811 $ 696,956 $618,092 $531,206 $500,351
Selected Financial Data
The Company has included the required Chief Executive Offi cer and Chief Financial Offi cer certifi cations regarding the
Company’s public disclosure as exhibits to its Annual Report on Form 10-K for the year ended June 30, 2008 fi led with
the Securities and Exchange Commission. Available on the Company’s corporate web site, www.hain-celestial.com, are
charters for all standing committees of the board of directors (including audit, compensation and corporate governance
and nominating); codes of conduct and corporate governance guidelines.
Certification and Governance
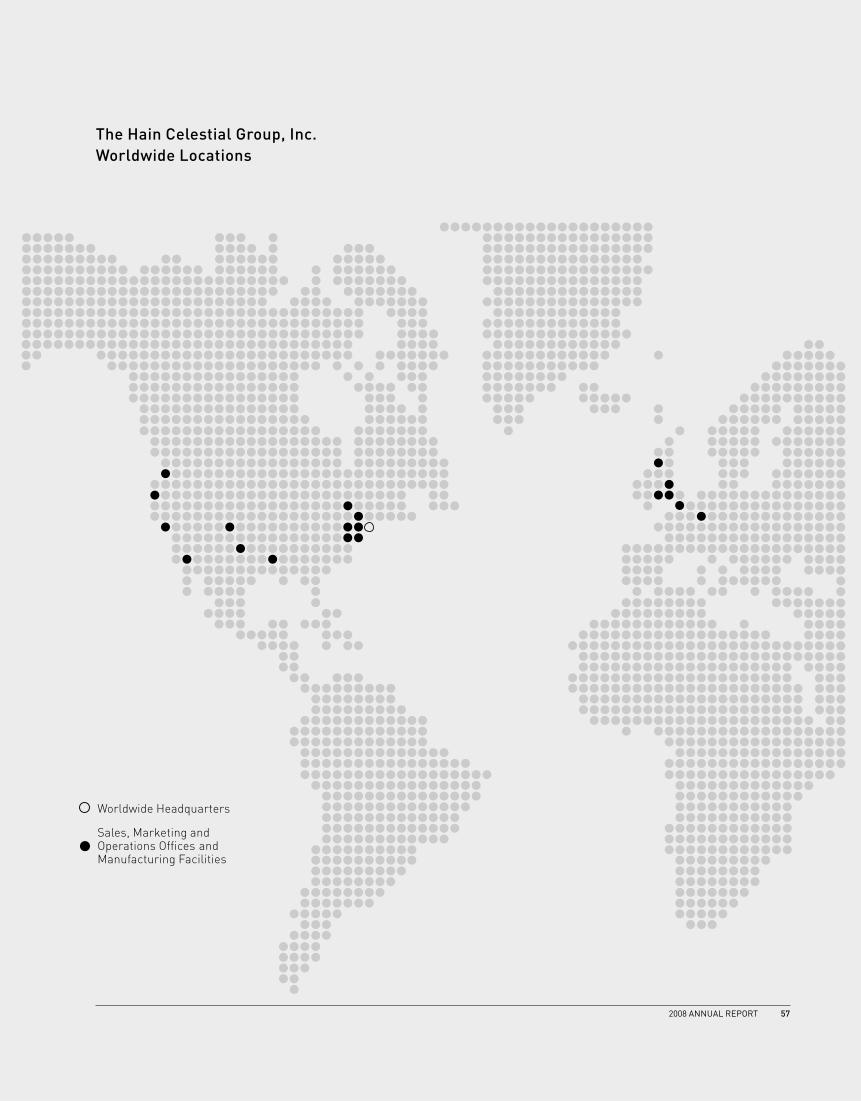
Worldwide Headquarters
Sales, Marketing and Operations Offi ces and Manufacturing Facilities
The Hain Celestial Group, Inc.
Worldwide Locations
2008 ANNUAL REPORT 57

58 THE HAIN CELESTIAL GROUP, INC.
worldwide headquarters THE HAIN CELESTIAL GROUP
58 South Service Road
Melville, NY 11747-2342
+1-631-730-2200
sales, marketing and operations offices
manufacturing facilities
AVALON NATURAL PRODUCTS
ALBA BOTANICA
SPECTRUM NATURALS
SPECTRUM ESSENTIALS
1105 Industrial Avenue
Petaluma, CA 94952-1141
+1-707-347-1200
CELESTIAL SEASONINGS
4600 Sleepytime Drive
Boulder, CO 80301-3292
+1-303-530-5300
GROCERY AND SNACKS
58 South Service Road
Melville, NY 11747-2342
+1-631-730-2200
HAIN CELESTIAL CANADA
180 Attwell Drive, Suite 410
Toronto, ON M9W 6A9
+1-416-849-6210
HAIN CELESTIAL EUROPE
Rue de la Montagne 30-34
1000 Brussels
Belgium
+32 (0) 2 6097651
HAIN CELESTIAL UK
Unit 23 Britannia Estate
Leagrave Road
Luton, LU3 1RJ
United Kingdom
+44 (0) 1582 401177
NEW OXFORD FOODS
4870 York Road
New Oxford, PA 17350-9401
+1-717-624-2191
PERSONAL CARE
3515 Eastham Drive
Culver City, CA 90232-2440
+1-310-838-7543
NORTH AMERICA
ARROWHEAD MILLS
110 South Lawton
Hereford, TX 79045-5802
CELESTIAL SEASONINGS
4600 Sleepytime Drive
Boulder, CO 80301-3292
DEBOLES
104 North Common Street
Shreveport, LA 71101-2614
FREEBIRD
220 North Center Street
Fredericksburg, PA 17026-9723
MARANATHA
710 Jefferson Avenue
Ashland, OR 97520-3702
PERSONAL CARE
8468 Warner Drive
Culver City, CA 90232-2429
PLAINVILLE FARMS
7830 Plainville Road
Plainville, NY 13137
ROSETTO AND ETHNIC GOURMET
700 Old Fern Hill Road
West Chester, PA 19380-4274
TERRA
60 Knickerbocker Road
Moonachie, NJ 07074-1613
WESTSOY TOFU
6123 Arapahoe Road
Boulder, CO 80303-1401
YVES VEGGIE CUISINE
1638 Derwent Way
Delta, BC V3M 6R9
EUROPE
DAILY BREAD LIMITED
D12-D17
New Covent Garden Market
Nine Elms Lane
London SW8 5LL
United Kingdom
GRAINS NOIRS
Rue Joseph Schols 13-15
B 1080 Brussels
Belgium
HAIN CELESTIAL UK
Unit 23 Brittania Estate
Leagrave Road
Luton LU3 1 RJ
United Kingdom
HAIN CELESTIAL NON-DAIRY UK
54 Derby Street
Manchester M8 8HF
United Kingdom
HAIN CELESTIAL FROZEN FOODS UK
Holt Road
Fakenham
Norfolk NR21 8EH
United Kingdom
LIMA
Industrielaan 9
B 9990 Maldegem
Belgium
NATUMI
Im Auel 88
D 53783 Eitorf
Germany
The Hain Celestial Group, Inc.
2008 ANNUAL REPORT 59
Corporate Data
To learn more about our brands and products, or to fi nd a store near you that carries our products, visit our website at
www.hain-celestial.com or call Consumer Relations at 800-434-HAIN (4246).
CONSUMER RELATIONS
Consumers seeking more information about our
products should direct their inquiries to the Consumer
Relations Department.
Telephone: 800-434-HAIN (4246)
Email: [email protected]
HUMAN RESOURCES
The Hain Celestial Group provides employment for
approximately 3,000 full and part-time employees. For
more information about career opportunities please visit
www.hain-celestial.com/careers.
EQUAL EMPLOYMENT OPPORTUNITY
The Hain Celestial Group hires, trains, promotes, and
compensates employees and makes all other employment
decisions, without regard to race, color, sex, sexual
orientation, age, religion, national origin, disability or
other protected conditions or characteristics. We have
affi rmative action programs in place at all domestic
locations to ensure equal opportunity for every employee.
For more information about Equal Employment
Opportunity, please visit www.hain-celestial.com/careers.
TRANSFER AGENT & REGISTRAR
Continental Stock Transfer & Trust Co.
17 Battery Place, New York, NY 10004
212-509-4000
INDEPENDENT REGISTERED PUBLIC ACCOUNTING FIRM
Ernst & Young LLP
395 North Service Road, Melville, NY 11747
COUNSEL
DLA Piper LLP (US)
1251 Avenue of the Americas, New York, NY 10020-1104
COMMON STOCK
NASDAQ® Global Select Market
Ticker symbol: HAIN
WEBSITES
An overview of the Company, as well as information about our
brands and products, is available at our corporate websites:
United States: www.hain-celestial.com
Canada: www.hain-celestial.ca
United Kingdom: www.hain-celestial.co.uk
European Union: www.hain-celestial.eu
THE HAIN CELESTIAL GROUP, INC.
The Hain Celestial Group, headquartered in Melville, NY, is
a leading natural and organic products company in North
America and Europe. Hain Celestial is a leader across
many natural food and personal care categories with
well-known brands that include: Celestial Seasonings®,
Terra®, Garden of Eatin’®, Health Valley®, WestSoy®,
Earth’s Best®, Arrowhead Mills®, MaraNatha®, SunSpire®,
DeBoles®, Hain Pure Foods®, FreeBird™, Plainville
Farms®, Hollywood®, Spectrum Naturals®, Spectrum
Essentials®, Walnut Acres Organic®, Westbrae Natural®,
Imagine®, Rice Dream®, Soy Dream®, Rosetto®, Ethnic
Gourmet®, Casbah®, Nile Spice®, Yves Veggie Cuisine®,
Granose®, Realeat®, Linda McCartney®, Daily Bread™,
Grans Noirs®, Lima®, Natumi®, JASON®, Zia® Natural
Skin Care, Avalon Organics®, Alba Botanica®, Queen
Helene®, Tushies® and TenderCare®. The Company’s
principal specialty product lines include Estee® sugar-
free products and Alba® non-fat dry milk and fl avored
shakes. Hain Celestial has been providing A Healthy Way
of Life™ since 1993.
ANNUAL MEETING
The 2008 Annual Meeting of Shareholders will be held
at 12:00 PM on Wednesday, March 11, 2009, at the
Company’s New Oxford Foods facility, 4870 York Road,
New Oxford, PA 17350-9401.
INVESTOR RELATIONS
Securities analysts and investors seeking more
information about the Company should direct their
inquiries to Mary Celeste Anthes, Vice President—
Corporate Relations. Investors may obtain, at no charge,
a copy of Hain Celestial’s 2008 annual report to the
Securities and Exchange Commission on Form 10-K at
www.hain-celestial.com or by contacting Investor Relations.
Telephone: 631-730-2460
Email: [email protected]
MEDIA RELATIONS
Members of the media seeking more information about
the Company should direct their inquiries to the Media
Relations Department.
Telephone: 631-730-2200
Email: [email protected]
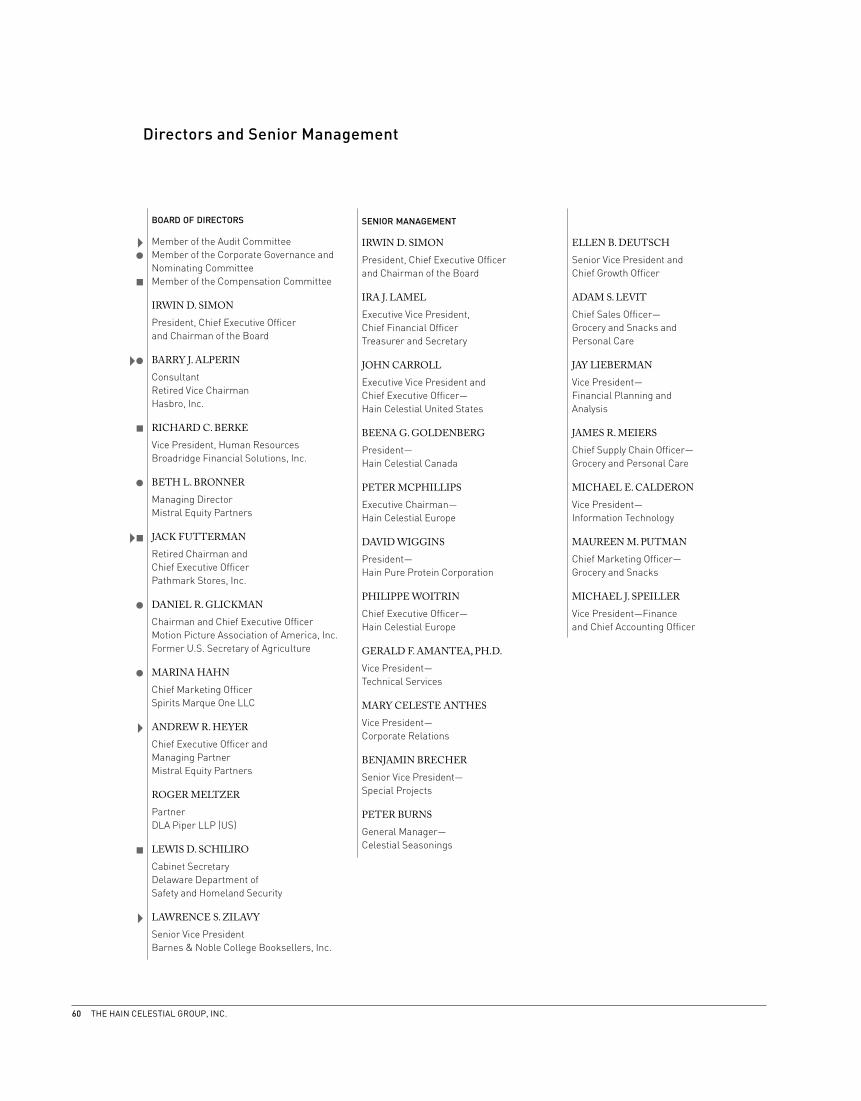
60 THE HAIN CELESTIAL GROUP, INC.
BOARD OF DIRECTORS
Member of the Audit Committee
Member of the Corporate Governance and
Nominating Committee
Member of the Compensation Committee
IRWIN D. SIMONPresident, Chief Executive Offi cer
and Chairman of the Board
BARRY J. ALPERINConsultant
Retired Vice Chairman
Hasbro, Inc.
RICHARD C. BERKEVice President, Human Resources
Broadridge Financial Solutions, Inc.
BETH L. BRONNER Managing Director
Mistral Equity Partners
JACK FUTTERMAN Retired Chairman and
Chief Executive Offi cer
Pathmark Stores, Inc.
DANIEL R. GLICKMAN Chairman and Chief Executive Offi cer
Motion Picture Association of America, Inc.
Former U.S. Secretary of Agriculture
MARINA HAHN Chief Marketing Offi cer
Spirits Marque One LLC
ANDREW R. HEYERChief Executive Offi cer and
Managing Partner
Mistral Equity Partners
ROGER MELTZERPartner
DLA Piper LLP (US)
LEWIS D. SCHILIROCabinet Secretary
Delaware Department of
Safety and Homeland Security
LAWRENCE S. ZILAVY Senior Vice President
Barnes & Noble College Booksellers, Inc.
SENIOR MANAGEMENT
IRWIN D. SIMONPresident, Chief Executive Offi cer
and Chairman of the Board
IRA J. LAMELExecutive Vice President,
Chief Financial Offi cer
Treasurer and Secretary
JOHN CARROLLExecutive Vice President and
Chief Executive Offi cer—
Hain Celestial United States
BEENA G. GOLDENBERGPresident—
Hain Celestial Canada
PETER MCPHILLIPSExecutive Chairman—
Hain Celestial Europe
DAVID WIGGINSPresident—
Hain Pure Protein Corporation
PHILIPPE WOITRINChief Executive Offi cer—
Hain Celestial Europe
GERALD F. AMANTEA, PH.D.Vice President—
Technical Services
MARY CELESTE ANTHESVice President—
Corporate Relations
BENJAMIN BRECHERSenior Vice President—
Special Projects
PETER BURNSGeneral Manager—
Celestial Seasonings
ELLEN B. DEUTSCHSenior Vice President and
Chief Growth Offi cer
ADAM S. LEVITChief Sales Offi cer—
Grocery and Snacks and
Personal Care
JAY LIEBERMANVice President—
Financial Planning and
Analysis
JAMES R. MEIERSChief Supply Chain Offi cer—
Grocery and Personal Care
MICHAEL E. CALDERONVice President—
Information Technology
MAUREEN M. PUTMANChief Marketing Offi cer—
Grocery and Snacks
MICHAEL J. SPEILLERVice President—Finance
and Chief Accounting Offi cer
Directors and Senior Management

NASDAQ® is a registered trademark of The NASDAQ Stock Market, Inc.
The Hain Celestial Group, Inc.
58 South Service Road
Melvile, NY 11747
+1-631-730-2200
www.hain-celestial.com
©2008 The Hain Celestial Group, Inc.
All Rights Reserved. Product or brand names used in this annual report may
be trademarks or registered trademarks of The Hain Celestial Group, Inc.
Printed on 30% post-consumer fiber paper.
All paper manufactured alcohol-free.Desi
gned b
y A
ddis
on O
ptions
ww
w.a
ddis
onoptions.
com
Ill
ust
ration b
y S
teve
Jak
obs
Exe
cutive
Photo
gra
phy
by
Tara
n M
org
anSELECTED BRANDS
30%
