global vehicle remarketing 2002images.adesainc.com/publicweb/analytserv/gvr/2002/gvr_2002.pdfthe...
TRANSCRIPT

GLOBAL VEHICLE REMARKETING 2002U.S. & CANADIAN MARKETS

ADESA ANALYTICAL SERVICES
ADESA Corporation’s Chief Economist, Tom Kontos leads the company’s effort to provide value-added
analytical services to ADESA customers, the media, and the investment community. These services range
from ADESA’s award-winning publication series, Global Vehicle Remarketing to custom analysis of whole-
sale price trends for ADESA’s remarketing clients.
In January 2001, ADESA introduced Global Vehicle Remarketing: U.S. & Canadian Markets (GVR). As
shown in the opening section of that report, the U.S. and Canadian markets represent over one-third of the
world’s vehicle population. Coverage of the $78 billion vehicle remarketing industry in these two critical
markets, in which ADESA Corporation is a leading player, will continue on an annual basis in GVR.
In June 2001, ADESA introduced Pulse, which provides a quarterly review and outlook of economic
indicators pertinent to the industry. In addition to GVR and Pulse, ADESA Analytical Services plans
to periodically issue other reports in the Global Vehicle Remarketing series, on topics including:
• Vehicle remarketing in Europe and other world markets.
• Comprehensive coverage of ancillary remarketing services such as dealer financing, transportation and
marshalling, reconditioning and certification, repossession, title processing, vehicle importation, etc.
• The salvage market.
• The role of Internet technology in vehicle remarketing.
ADESA provides these valuable reports on a complimentary basis to its key clients and industry contacts.
For information concerning subscription to this report series, please call 317/249-4251, or visit our web
corner at www.adesa.com under “The Industry’s Pulse.”
Other Analytical Services available to ADESA clients include:
• Custom analysis of remarketing clients’ vehicle sales at auction.
• Presentations at client meetings.
• Production of auction dealer surveys and other targeted surveys.
To learn more about these services, please contact Tom Kontos, Vice President, Industry Relations
& Analytical Services, at 317/249-4235 or [email protected].
Welcome to the second edition of Global Vehicle Remarketing: U.S.& Canadian Markets (GVR). This annual
edition focuses on the United States and Canadian vehicle markets, where over one-third of the world’s
vehicles operate.
ADESA Corporation has a unique vantage point from which to explore this industry – both in terms
of the broad scope of the company’s remarketing services and its leading position in both the U.S. and
Canada. In the U.S., ADESA is the second largest and fastest growing vehicle auction provider, and
in Canada, the largest. ADESA is also the third largest provider of “total loss” vehicle recovery (salvage
auction) services in the two countries. The company is also allied with several other automotive services
affiliates of parent company, ALLETE, a uniquely diversified, publicly held corporation (see “About ADESA
Corporation and ALLETE Automotive Services” on page 65). These combined operations and capabilities
make ADESA the broadest-based vehicle remarketing services network in North America.
Since the inaugural edition of this report in January 2001, ADESA Analytical Services (described on the
inside front cover) has launched Global Vehicle Remarketing’s Pulse, a quarterly update of vehicle remar-
keting industry economic indicators. With the industry uncertainty caused by events following the horrors
of September 11, ADESA Analytical Services issued a “White Paper” on “The Impact of War and Recession
on Vehicle Remarketing” between the summer and winter editions of Pulse. Future reports in the Global
Vehicle Remarketing (GVR) series will continue to expand both the breadth and depth of coverage to
include key vehicle remarketing markets throughout the world and selected topics within specific market
segments. Look for this and other timely information relating to vehicle remarketing on ADESA’s
website (see link below).
We hope you will find new insights in this second edition, and we welcome your opinions and suggestions.
Tom Kontos
Vice President, Industry Relations
& Analytical Services
ADESA Corporation
January 2002
www.adesa.com/kontoskorner
PREFACE
Tom Kontos

TABLE OF CONTENTS
Introduction . . . . . . . . . . . . . . . . . . . . . . . . . . . . . . . . . . . . . . . . . . . . . . .4
Summary and Outlook . . . . . . . . . . . . . . . . . . . . . . . . . . . . . . . . . . . . . . .5
New and Used Vehicle Sales in the U.S. & Canada . . . . . . . . . . . . . . . .7
2001 at a Glance . . . . . . . . . . . . . . . . . . . . . . . . . . . . . . . . . . . . . . . .8
Historical Volume Trends . . . . . . . . . . . . . . . . . . . . . . . . . . . . . . . . .11
Automotive Finance Trends . . . . . . . . . . . . . . . . . . . . . . . . . . . . . .13
Used Vehicle Sales Volume Projections . . . . . . . . . . . . . . . . . . . . . .17
The Vehicle Remarketing Industry . . . . . . . . . . . . . . . . . . . . . . . . . . . .25
Vehicle Remarketing Defined . . . . . . . . . . . . . . . . . . . . . . . . . . . . . .26
Vehicle Flows in the U.S. . . . . . . . . . . . . . . . . . . . . . . . . . . .26
The Vehicle Remarketing Value Chain . . . . . . . . . . . . . . . . .28
A Remarketer’s Checklist . . . . . . . . . . . . . . . . . . . . . . . . . . .31
Vehicle Suppliers . . . . . . . . . . . . . . . . . . . . . . . . . . . . . . . . . . . . . . .35
Manufacturers . . . . . . . . . . . . . . . . . . . . . . . . . . . . . . . . . . .35
Automotive Finance Companies . . . . . . . . . . . . . . . . . . . . . .36
Rental Companies . . . . . . . . . . . . . . . . . . . . . . . . . . . . . . . .38
Commercial Fleets . . . . . . . . . . . . . . . . . . . . . . . . . . . . . . . .39
Dealers . . . . . . . . . . . . . . . . . . . . . . . . . . . . . . . . . . . . . . . . .42
Auction Sales Volume Projections . . . . . . . . . . . . . . . . . . . . . . . . . .51
Wholesale Market Trends . . . . . . . . . . . . . . . . . . . . . . . . . . . . . . . . . . .53
Analysis of AuctionNet Database . . . . . . . . . . . . . . . . . . . . . . . . . . .54
Analysis of ADESA Database . . . . . . . . . . . . . . . . . . . . . . . . . . . . . .60
Wholesale Market Outlook . . . . . . . . . . . . . . . . . . . . . . . . . . . . . . . .62
About the Author . . . . . . . . . . . . . . . . . . . . . . . . . . . . . . . . . . . . . . . . . . .64
About ADESA and ALLETE Automotive Services . . . . . . . . . . . . . . . .65
4
INTRODUCTION
New Vehicle Sales
Scrappage
Ownership or Lease Period
Ownership or Lease Period
RemarketingVehicles in Operation
(VIO)
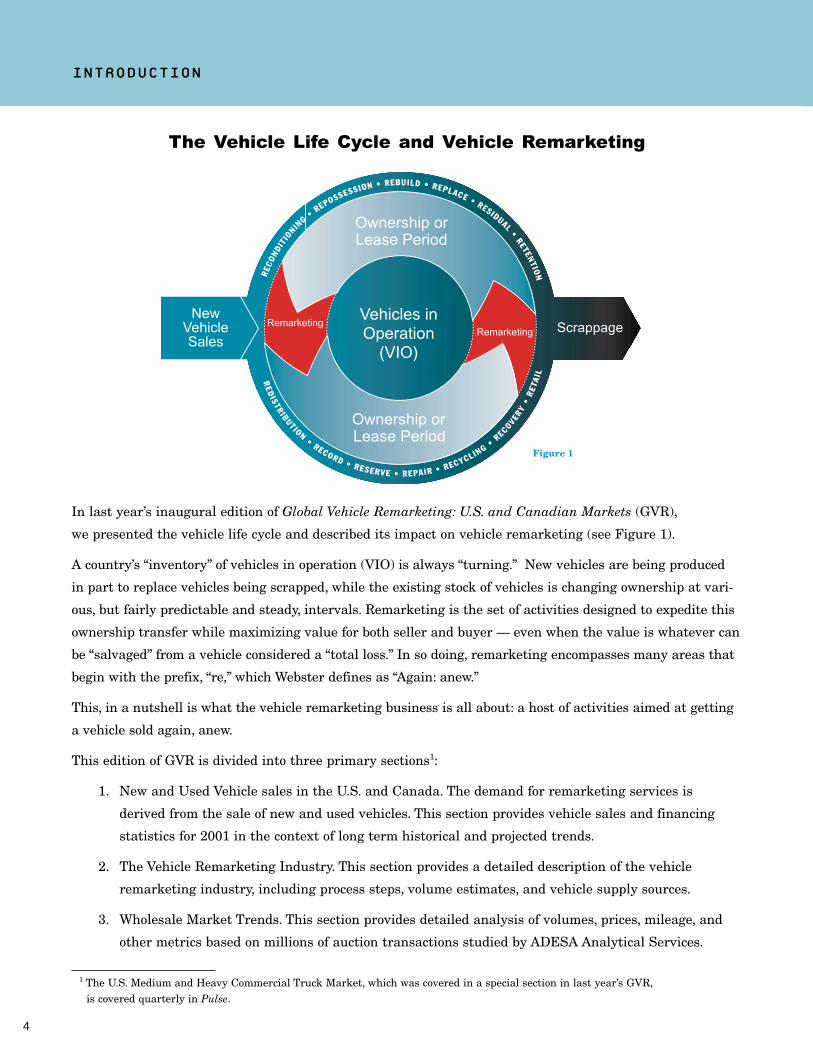
The Vehicle Life Cycle and Vehicle Remarketing
Remarketing
REC
ONDI
TIONIN
G• REPOSSESSION • REBUILD • REPLACE • RESIDUAL
•RETEN
TION
RED
ISTR IBUT ION•
RECORD • RESERVE • REPAIR • RECYCLING•
RECOVERY
•R
ETA
IL
Figure 1
In last year’s inaugural edition of Global Vehicle Remarketing: U.S. and Canadian Markets (GVR),
we presented the vehicle life cycle and described its impact on vehicle remarketing (see Figure 1).
A country’s “inventory” of vehicles in operation (VIO) is always “turning.” New vehicles are being produced
in part to replace vehicles being scrapped, while the existing stock of vehicles is changing ownership at vari-
ous, but fairly predictable and steady, intervals. Remarketing is the set of activities designed to expedite this
ownership transfer while maximizing value for both seller and buyer — even when the value is whatever can
be “salvaged” from a vehicle considered a “total loss.” In so doing, remarketing encompasses many areas that
begin with the prefix, “re,” which Webster defines as “Again: anew.”
This, in a nutshell is what the vehicle remarketing business is all about: a host of activities aimed at getting
a vehicle sold again, anew.
This edition of GVR is divided into three primary sections1:
1. New and Used Vehicle sales in the U.S. and Canada. The demand for remarketing services is
derived from the sale of new and used vehicles. This section provides vehicle sales and financing
statistics for 2001 in the context of long term historical and projected trends.
2. The Vehicle Remarketing Industry. This section provides a detailed description of the vehicle
remarketing industry, including process steps, volume estimates, and vehicle supply sources.
3. Wholesale Market Trends. This section provides detailed analysis of volumes, prices, mileage, and
other metrics based on millions of auction transactions studied by ADESA Analytical Services.
1 The U.S. Medium and Heavy Commercial Truck Market, which was covered in a special section in last year’s GVR,is covered quarterly in Pulse.

5
The first part of this report focuses on new and used vehicle sales in the U.S. and Canada upon which
the vehicle remarketing industry in these two countries depends. Fortunately, new and used vehicle sales
volumes were at or near record levels in both countries during 2001. New light vehicle sales reached a
near-record 17.2 million units in the U.S. and a record 1.6 million units in Canada, for a total of 18.7 mil-
lion units in the two countries combined. Used vehicle sales topped 42.6 million units in the U.S. (matching
ADESA Analytical Services’ projection in last year’s GVR) and reached 2.1 million units in Canada, yield-
ing a total of 44.7 million units for both countries combined. Total used vehicle sales in the U.S. in 2001
broke the record set in 1995 by 866,000 units.
Zero-percent financing was the key factor leading to 2001’s emergence as the second best new vehicle sales
year ever. Coupled with more conservative residual values, and therefore higher monthly payments, on
automotive leases, zero-percent financing furthered the trend towards declining lease penetration (leases as
a percent of total retail sales). Although consumer leasing continues to play an important role in both the
new and used vehicle markets, and has helped propel both to record sales, lease penetration has dropped
from over 30% to under 25% in the U.S., and from over 45% to under 35% in Canada.
Zero-percent financing and other low-APR programs also made new vehicle purchases more attractive to
consumers visiting franchised dealership lots in 2001, and this led to a modest drop in used vehicle sales
by franchised dealers both in the U.S. and in Canada.
Residual value losses on off-lease vehicles in the U.S. averaged $987 in 2000 (the latest year for which data
is available), but a smaller percentage of leased vehicles went full-term and were returned to the lessor.
This is good news for automotive finance companies looking for signs that the worst of the residual value
crisis may be over.
Vehicles in operation (VIO) in the U.S. climbed from 213.3 million in 2000 to 216.7 million in 2001, and
from 17.6 million in 1998 to 19.2 million in 1999 (the latest year for which data is available) in Canada.
This growth in VIO is the basis for our five-year projections of used vehicle sales by vehicle age. ADESA
Analytical Services conservatively projects used vehicle sales in the U.S. to grow from 42.6 million units in
2001 to 46.5 million units in 2006 – an increase of nearly four million units (9%). This is a milder projection
than the projection in last year’s report because of an anticipated correction in new vehicle sales (which
represent additions to VIO) back to long-term trend levels over the next several years, after record new
SUMMARY AND OUTLOOK

6
GLOBAL VEHICLE REMARKETING
auto sales in 1999 through 2001. The forecast also shows a decline in vehicles three years old or less for
the same reason, as well as from declining off-lease volumes due to lower lease penetration. With improved
vehicle durability, more older used vehicles will be sold in the years to come.
The second part of this report provides a detailed description of the vehicle remarketing industry, includ-
ing process steps, volume estimates, and vehicle supply sources. Making use of available industry data,
ADESA Analytical Services estimates that the vehicle remarketing industry in the U.S. and Canada chan-
neled net sales of 9.6 million units into the retail used vehicle market in 2001. These vehicles came from
a number of sources including dealers, manufacturers, automotive finance companies, rental companies
and commercial fleets. Key vehicle types examined in this report include program and rental “risk”
vehicles, off-lease vehicles, repossessions, and commercial fleet vehicles. Volumes from these sources are
summarized in Figure 42 on page 50 of this report.
Using our projections of used vehicle sales, along with an analysis of historical trends in auction sales by
model age, ADESA Analytical Services projects U.S. and Canada auction sales volumes to grow from 9.6
million units in 2001 to nearly 10.0 million units in 2003. Volumes are projected to taper modestly there-
after to 9.9 million units annually, primarily due to declining off-lease volumes.
The third part of this report provides an analysis of wholesale market trends and a market outlook for 2002
and beyond. The analysis shows that auction prices in late 2001 had significantly declined, primarily due to:
1. zero-percent financing incentives on new vehicles,
2. rental fleet downsizing in the aftermath of September 11, and
3. continued high volumes of off-lease units.
These general price trends vary by vehicle age, model class, and market segment and are amply covered
in this report and in the recently released Winter 2001 issue of Pulse.
Another important market barometer is sold volume as a percent of offered volume (conversion rate).
Conversion rates were also down during most of 2001 as evidenced by the ADESA Auction Dealer
Optimism Index. A positive sign is that this index, which shows the year-on-year variance in dealer con-
signment conversion rates, turned positive in November and December, which bodes well for the wholesale
market outlook in 2002 (see page 62 and the Winter 2001 edition of Pulse for further details).

New and UsedVehicle Sales in the U.S. &
Canada
7

GLOBAL VEHICLE REMARKETING
8
2001 at a Glance
Figure 2 succinctly shows the strength of new and used vehicle sales in the U.S. and Canada during 2001.
U.S. Canada TotalNew Vehicle Sales 17,177 1,568 18,745
Used Vehicle Sales 42,624 2,090 44,714 Franchised Dealers 15,945 929 16,874 Independent Dealers 14,416 377 14,793 Private Individuals 12,263 784 13,047
Total Vehicle Sales 59,801 3,658 63,459
Light Vehicle Sales in the U.S. and Canada in 2001
(000s of Units Sold)
Figure 2 Source: Automotive News Data Center, CNW Marketing/Research,
DesRosiers Automotive Consultants, and ADESA Analytical Services.
* CNW data for U.S. franchised dealer used vehicle sales includes sales at affiliated
used car lots operated by the franchised dealer under a different name than its new car
stores. CNW also includes off-lease vehicles purchased by lessees. These factors combine
to make CNW’s figures higher than those reported by the National Automobile Dealers
Association (NADA).
As the table shows, the two markets combined for 63.5 million total vehicle sales, of which 44.7 million
(70%) were used vehicles and 18.7 million (30%) were new vehicles. The U.S. had the second best new
vehicle sales year ever behind 2000’s 17.4 million units, while Canada had a new record year.
On the used vehicle side, the U.S. came in at 42.6 million units for 2001, essentially matching the projection
we made in last year’s GVR, and exceeding the 2000 sales total by more than one million units. This
represents a new record, breaking the old record set in 1995 by 866,000 units. Canadian used vehicle sales
in 2001 were essentially flat compared to 2000. Figure 3 shows new and used vehicle sales for 2001
compared to 2000.
*

NEW AND USED VEHICLE SALES IN THE U.S.& CANADA
9
United States 2001 2000 Amount Percent
New Vehicle Sales 17,177 17,410 (233) -1.3%
Used Vehicle Sales 42,624 41,620 1,003 2.4% Franchised Dealers 15,945 16,178 (232) -1.4% Independent Dealers 14,416 13,559 856 6.3% Private Individuals 12,263 11,883 379 3.2%
Total Vehicle Sales 59,801 59,030 770 1.3%
Canada 2001 2000 Amount Percent
New Vehicle Sales 1,568 1,545 23 1.5%
Used Vehicle Sales 2,090 2,123 (33) -1.6% Franchised Dealers 929 934 (5) -0.5% Independent Dealers 377 371 6 1.6% Private Individuals 784 818 (34) -4.2%
Total Vehicle Sales 3,658 3,668 (10) -0.3%
Increase/(Decrease)
Increase/(Decrease)
Figure 3 Source: Automotive News Data Center, CNW Marketing/Research DesRosiers Automotive
Consultants, and ADESA Analytical Services.
Light Vehicle Sales in the U.S. and Canada — 2001 vs 2000
(000s of Units Sold)
Considering the impact of the recession that began in March 2001 and the shocking events of September
11, vehicle sales in 2001 exceeded most analysts’ expectations.1 Franchised dealers in both the U.S. and
Canada sold fewer used vehicles in 2001 than in 2000, as zero-percent financing and other incentives drove
more store traffic to their new car departments. Independent dealers in both countries more than offset the
lost used auto sales of franchised dealers.
1 For a detailed discussion of the impacts of war and recession on vehicle remarketing see ADESA’s Winter 2001 Pulsereport and http://www.adesa.com/KontosKorner/WarAndRecession.htm.

10
Figure 4 combines sales volumes with average price data to arrive at the total value of new and used
vehicle sales transactions in the U.S. and Canada. As the table shows, the value of used vehicle sales
almost matched that of new vehicles, even in a near-record new-car sales year.
Memo:2001 2000
Volume Average Value AverageUnited States (000s) Price ($Billions) Price
New Vehicle Sales 17,177 $21,850
Used Vehicle Sales 42,624 $8,578 Franchised Dealers 15,945 12,132 Independent Dealers 14,416 8,071 Private Individuals 12,263 4,319
Total Vehicle Sales 59,801 $12,493
Memo:2001 2000
Volume Average Value* AverageCanada (000s) Price* ($Billions) Price*
New Vehicle Sales 1,568 $24,000 $38 $24,477
Used Vehicle Sales 2,090 $9,479 $20 $9,678 Franchised Dealers 929 13,000 $12 13,334 Independent Dealers 377 7,000 $3 7,153 Private Individuals 784 6,500 $5 6,654
Total Vehicle Sales 3,658 $15,704 $57 $15,911
* In Canadian dollars. 2001 Figures are preliminary estimates.
$21,507
$8,61812,2388,2754,316
$12,321
$369
$36719511953
$737
Light Vehicle Sales Transactions in the U.S. and Canada
Figure 4 Source: Automotive News Data Center, CNW Marketing/Research and ADESA Analytical Services.
GLOBAL VEHICLE REMARKETING
11
Historical Volume Trends
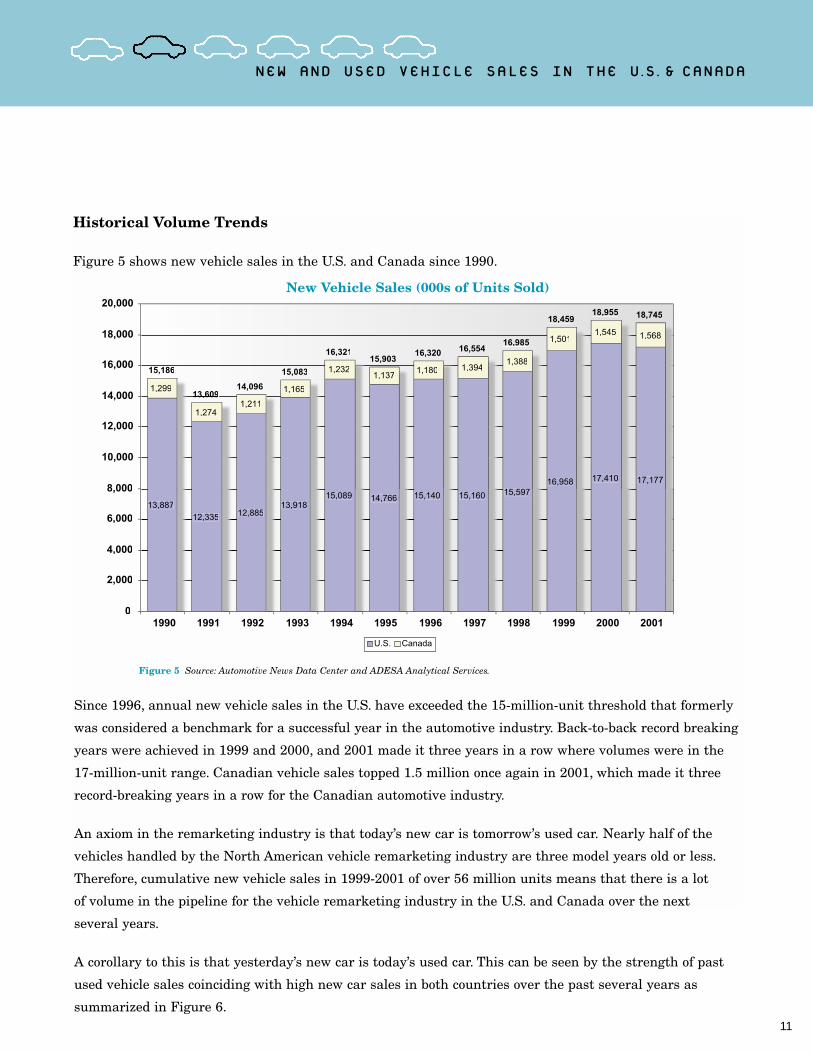
Figure 5 shows new vehicle sales in the U.S. and Canada since 1990.
New Vehicle Sales (000s of Units Sold)
Figure 5 Source: Automotive News Data Center and ADESA Analytical Services.
13,88712,335 12,885
13,91815,089 14,766 15,140 15,160 15,597
16,958 17,410 17,177
1,299
1,2741,211
1,165
1,2321,137
1,180 1,3941,388
1,5011,545 1,568
15,186
13,60913,60914,096
15,083
16,32115,903
16,320 16,55416,985
18,45918,955 18,745
0
2,000
4,000
6,000
8,000
10,000
12,000
14,000
16,000
18,000
20,000
1990 1991 1992 1993 1994 1995 1996 1997 1998 1999 2000 2001
U.S. Canada
Since 1996, annual new vehicle sales in the U.S. have exceeded the 15-million-unit threshold that formerly
was considered a benchmark for a successful year in the automotive industry. Back-to-back record breaking
years were achieved in 1999 and 2000, and 2001 made it three years in a row where volumes were in the
17-million-unit range. Canadian vehicle sales topped 1.5 million once again in 2001, which made it three
record-breaking years in a row for the Canadian automotive industry.
An axiom in the remarketing industry is that today’s new car is tomorrow’s used car. Nearly half of the
vehicles handled by the North American vehicle remarketing industry are three model years old or less.
Therefore, cumulative new vehicle sales in 1999-2001 of over 56 million units means that there is a lot
of volume in the pipeline for the vehicle remarketing industry in the U.S. and Canada over the next
several years.
A corollary to this is that yesterday’s new car is today’s used car. This can be seen by the strength of past
used vehicle sales coinciding with high new car sales in both countries over the past several years as
summarized in Figure 6.
NEW AND USED VEHICLE SALES IN THE U.S.& CANADA

12
U.S. Used Vehicle Sales (000s of Units Sold)
Canada Used Vehicle Sales (000s of Units Sold)
1,025 970872
984848 934 929
434319
321
361
283
371 377
1,134
1,0061,001
1,050
765
818 784
2,593
2,2952,194
2,395
1,896
2,123 2,090
0
500
1,000
1,500
2,000
2,500
3,000
1995 1996 1997 1998 1999 2000 2001
Franchised Dealers Independent Dealers Private Individuals
Figure 6 Source: CNW Marketing/Research, DesRosiers Automotive Consultants, and ADESA Analytical Services.
GLOBAL VEHICLE REMARKETING

13
Even with new vehicle sales at 17-million-unit levels, franchised dealers in the U.S. continue to sell around
16-million used units annually. In fact, franchised dealers have sold more used vehicles than new vehicles
on a cumulative basis since 1990 (185 million used versus 180 million new). Along with strong and steady
sales by independent used car dealers, this is testimony to the ability of the used vehicle market and
remarketing industry to process the trade-ins and other vehicles cycling back from many years of strong
new vehicle sales. This is a pattern that can be expected to continue.
Automotive Finance Trends 1
In the automotive industry, 2001 will be remembered as the year of the zero-percent financing program
that represented automakers’ response to the events of September 11 combined with dismal economic news.
The program was the major factor contributing to record new vehicle sales in October, and as we’ve said
elsewhere, made Detroit look better than Washington in terms of stimulating the economy. However, this
program and other low-APR financing incentives, combined with more conservative lease residual value-
setting, has caused a shift in consumer automotive financing from loans to leases that has important conse-
quences for the vehicle remarketing industry.
As stated in last year’s GVR, consumer leasing has been the most important market trend affecting the vehicle
remarketing industry over the last decade. With more companies exiting the leasing business, and with greater
use of installment loan financing, many industry observers are wondering whether leasing has run its course
and whether the industry should be poised for a reversal of the volume gains from which it has benefited.
Some perspective on this issue can be gained from looking at leasing’s growth since 1990 as shown in Figure 7.
Whether one looks at units leased (per data from CNW Marketing/Research) or Federal Reserve data on
the dollar value of outstanding leases, it is clear that leasing grew significantly throughout the 1990s,
plateaued in 2000, and began decreasing in 2001.
The decline in leasing since 2000 can also be seen in Figure 8, which shows monthly lease penetration (the
percentage of total new vehicle retail sales represented by lease financing) over the last two years.
Lease penetration has fallen almost five percentage points over the past two years, from 30.5% of new light
vehicle retail sales (i.e., excluding fleet sales) to 24.8%. This decline in lease penetration has important
ramifications for off-lease volumes destined for the vehicle remarketing industry over the next few years,
as discussed on page 37.
1 Although this section focuses on automotive finance trends in the U.S., similar trends in new car financing have been seen in Canada. Leasing, which
had grown to over 45% of retail auto sales during the 1990s, contracted at rates similar to those in the U.S., starting in 2000 as low-rate financing made
inroads on lease penetration rates. ADESA Analytical Services estimates that lease penetration in Canada now stands at less than 35% of retail sales.
NEW AND USED VEHICLE SALES IN THE U.S.& CANADA

14
Lease Penetration
(Leases as a Percent of Total New Vehicle Retail Sales)
Figure 8 Source: CNW Marketing/Research and ADESA Analytical Services.
24.8%%
30.5%
0.0%
5.0%
10.0%
15.0%
20.0%
25.0%
30.0%
35.0%
Jan-
00
Feb
-00
Mar
-00
Apr
-00
May
-00
Jun-
00
Jul-0
0
Aug
-00
Sep
-00
Oct
-00
Nov
-00
Dec
-00
Jan-
01
Feb
-01
Mar
-01
Apr
-01
May
-01
Jun-
01
Jul-0
1
Aug
-01
Sep
-01
Oct
-01
Nov
-01
Dec
-01
Growth of Consumer Leasing
Figure 7 Source: Federal Reserve Board, CNW Marketing/Research, and ADESA Analytical Services.
0
500
1,000
1,500
2,000
2,500
3,000
3,500
4,000
4,500
$0
$20,000
$40,000
$60,000
$80,000
$100,000
$120,000
$140,000
CNW Consumer Leases (Units) Federal Reserve Board Consumer Leases Outstanding ($Millions)
Jan-
90
May
-90
Sep
-90
Jan-
91
May
-91
Sep
-91
Jan-
92
May
-92
Sep
-92
Jan-
93
May
-93
Sep
-93
Jan-
94
May
-94
Sep
-94
Jan-
95
May
-95
Sep
-95
Jan-
96
May
-96
Sep
-96
Jan-
97
May
-97
Sep
-97
Jan-
98
May
-98
Sep
-98
Jan-
99
May
-99
Sep
-99
Jan-
00
May
-00
Sep
-00
Jan-
01
May
-01
Sep
-01
GLOBAL VEHICLE REMARKETING
15
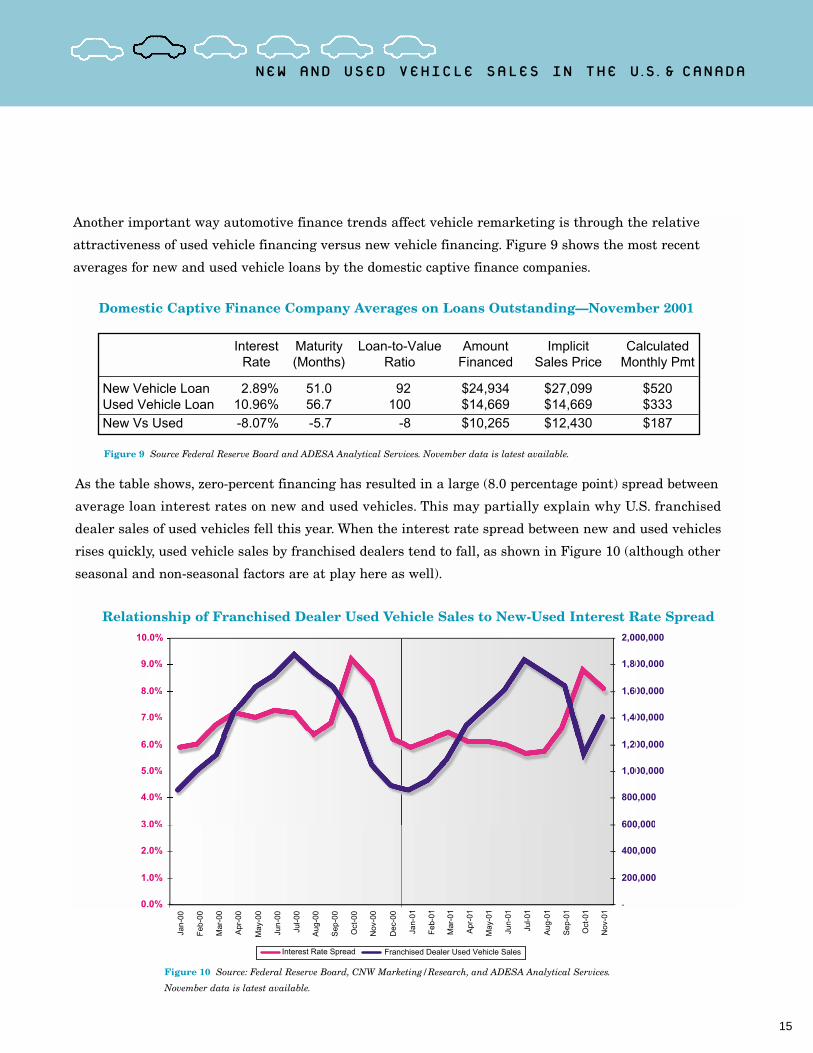
Another important way automotive finance trends affect vehicle remarketing is through the relative
attractiveness of used vehicle financing versus new vehicle financing. Figure 9 shows the most recent
averages for new and used vehicle loans by the domestic captive finance companies.
Domestic Captive Finance Company Averages on Loans Outstanding—November 2001
Figure 9 Source Federal Reserve Board and ADESA Analytical Services. November data is latest available.
Interest Maturity Loan-to-Value Amount Implicit CalculatedRate (Months) Ratio Financed Sales Price Monthly Pmt
New Vehicle Loan 2.89% 51.0 92 $24,934 $27,099 $520Used Vehicle Loan 10.96% 56.7 100 $14,669 $14,669 $333New Vs Used -8.07% -5.7 -8 $10,265 $12,430 $187
Relationship of Franchised Dealer Used Vehicle Sales to New-Used Interest Rate Spread
0.0%
1.0%
2.0%
3.0%0%
4..0%
5..0%
6..0%
7..0%
8..0%
9..0%
10..0%
Jan-
00
Feb
-00
Mar
-00
Apr
-00
May
-00
Jun-
00
Jul-0
0
Aug
-00
Sep
-00
Oct
-00
Nov
-00
Dec
-00
Jan-
01
Feb
-01
Mar
-01
Apr
-01
May
-01
Jun-
01
Jul-0
1
Aug
-01
Sep
-01
Oct
-01
Nov
-01
200,000
400,000
600,000600
0,000800
00,0001,00
00,0001,20
00,0001,40
00,0001,60
00,0001,80
00,0002,00
Interest Rate Spread Franchised Dealer Used Vehicle Sales
Figure 10 Source: Federal Reserve Board, CNW Marketing/Research, and ADESA Analytical Services.
November data is latest available.
As the table shows, zero-percent financing has resulted in a large (8.0 percentage point) spread between
average loan interest rates on new and used vehicles. This may partially explain why U.S. franchised
dealer sales of used vehicles fell this year. When the interest rate spread between new and used vehicles
rises quickly, used vehicle sales by franchised dealers tend to fall, as shown in Figure 10 (although other
seasonal and non-seasonal factors are at play here as well).
NEW AND USED VEHICLE SALES IN THE U.S.& CANADA
16
Analysis of Full-Term Leases Returned Lessors
Figure 11 Source: Consumer Bankers Association and ADESA Analytical Services.
$1,160
$1,663
$2,516 $2,532
17%%
27%27%
35%
31%
$0
$500
$1,000
$1,500
$2,000
$2,500
$3,000
$3,500
$4,000
1997 1998 1999 20000%
5%
10%
15%
20%
25%
30%
35%
40%
Wtd. Avg. Residual Value Loss Per Vehicle % of All Leases
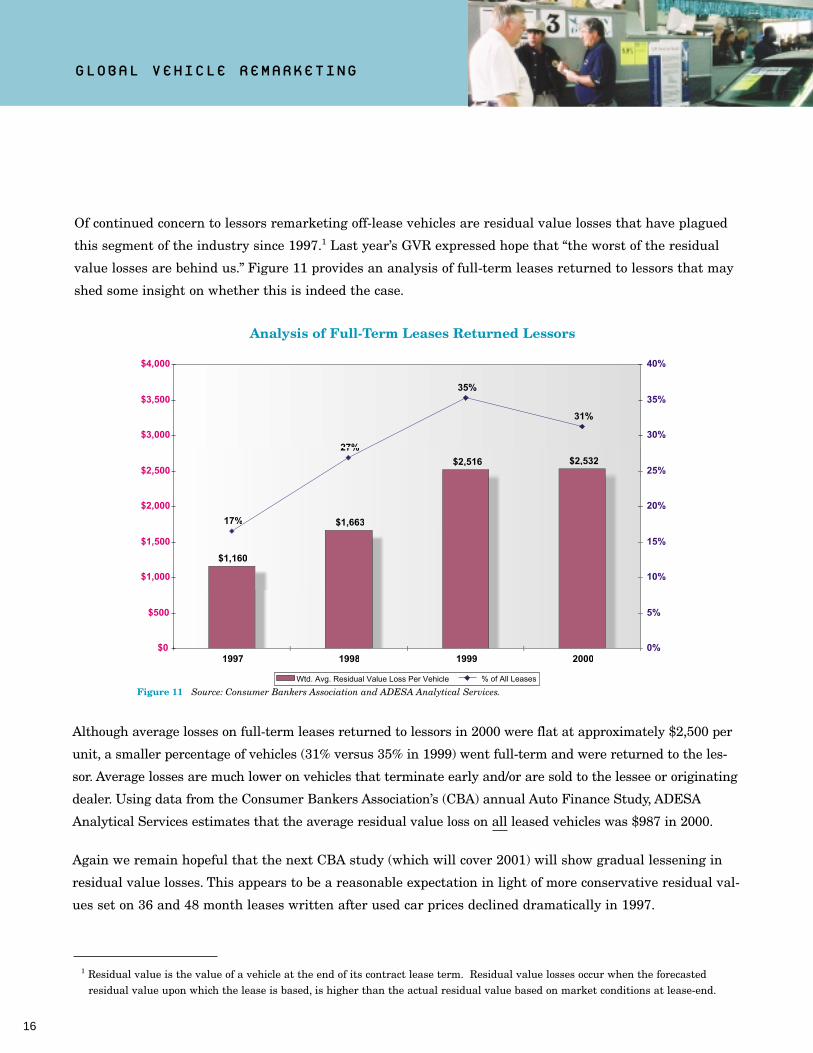
Of continued concern to lessors remarketing off-lease vehicles are residual value losses that have plagued
this segment of the industry since 1997.1 Last year’s GVR expressed hope that “the worst of the residual
value losses are behind us.” Figure 11 provides an analysis of full-term leases returned to lessors that may
shed some insight on whether this is indeed the case.
1 Residual value is the value of a vehicle at the end of its contract lease term. Residual value losses occur when the forecasted residual value upon which the lease is based, is higher than the actual residual value based on market conditions at lease-end.
Although average losses on full-term leases returned to lessors in 2000 were flat at approximately $2,500 per
unit, a smaller percentage of vehicles (31% versus 35% in 1999) went full-term and were returned to the les-
sor. Average losses are much lower on vehicles that terminate early and/or are sold to the lessee or originating
dealer. Using data from the Consumer Bankers Association’s (CBA) annual Auto Finance Study, ADESA
Analytical Services estimates that the average residual value loss on all leased vehicles was $987 in 2000.
Again we remain hopeful that the next CBA study (which will cover 2001) will show gradual lessening in
residual value losses. This appears to be a reasonable expectation in light of more conservative residual val-
ues set on 36 and 48 month leases written after used car prices declined dramatically in 1997.
GLOBAL VEHICLE REMARKETING

17
Used Vehicle Sales Volume Projections
In last year’s GVR, ADESA Analytical Services presented a five-year projection of used vehicle sales in the U.S.
using a methodology based on “parc turn,” that is, used vehicle sales as a percent of the existing stock of vehi-
cles in operation (VIO).1 Historical parc turns were calculated by vehicle age and applied to projections of VIO
to arrive at projected used vehicle sales. Last year this methodology yielded a 2001 used vehicle sales projection
of 42,665,000 which was 41,084 units (0.1%) higher than actual 2001 U.S. sales of 42,623,916.
Figure 12 shows total vehicles in operation in the U.S. by vehicle age.
Total U.S. Vehicles in Operation by Vehicle Age Thru July 1 of each year
000s Vehicles
Figure 12 Source: R.L. Polk & Co., Goldman, Sachs & Co., and ADESA Analytical Services.
0%
10%
20%
30%
40%
50%
60%
70%
80%
90%
100%
1990 1991 1992 1993 1994 1995 1996 1997 1998 1999 2000 2001 2002 2003 2004 2005 2006
10+ years old8-9 years old6-7 years old4-5 years old2-3 years old0-1 years old*
History Projection
1990 1991 1992 1993 1994 1995 1996 1997 1998 1999 2000 2001 2002 2003 2004 2005 2006
0-1 years old* 8,872 8,480 8,048 8,627 9,561 10,132 10,651 10,246 10,649 12,172 13,104 12,396 10,515 10,934 11,249 11,584 11,725
2-3 years old 29,104 26,931 24,924 24,570 25,423 27,641 29,447 28,854 27,708 28,942 30,188 32,455 31,182 28,301 27,341 28,227 28,571
4-5 years old 28,993 28,891 28,758 26,670 24,552 23,957 24,587 26,522 28,562 27,854 26,932 27,922 29,308 31,175 30,225 27,386 27,719
6-7 years old 26,676 28,056 28,262 28,248 27,971 25,761 23,611 23,022 23,854 25,573 27,327 26,588 25,955 27,002 28,184 29,955 30,320
8-9 years old 17,000 21,146 25,127 26,692 26,844 26,480 26,378 24,442 22,603 21,923 22,553 24,081 26,078 25,473 24,816 25,825 26,140
10+ years old 64,707 63,949 65,955 70,949 74,365 79,470 83,620 87,985 91,667 93,045 93,196 93,241 95,719 98,083 101,762 103,632 104,894
175,352 177,454 181,074 185,756 188,717 193,441 198,294 201,071 205,043 209,509 213,300 216,683 218,758 220,967 223,577 226,609 229,368
* Excludes current and one year old vehicle registrations (net of scrappage) that occur after July 1 of each year.
1 Vehicles in operation (VIO) refers to the number of registered vehicles in a given geography. Typically, VIO is used in reference to acountry’s vehicle population. VIO is also called “parc” by some analysts; the latter is an international term and is not misspelled.
NEW AND USED VEHICLE SALES IN THE U.S.& CANADA
18
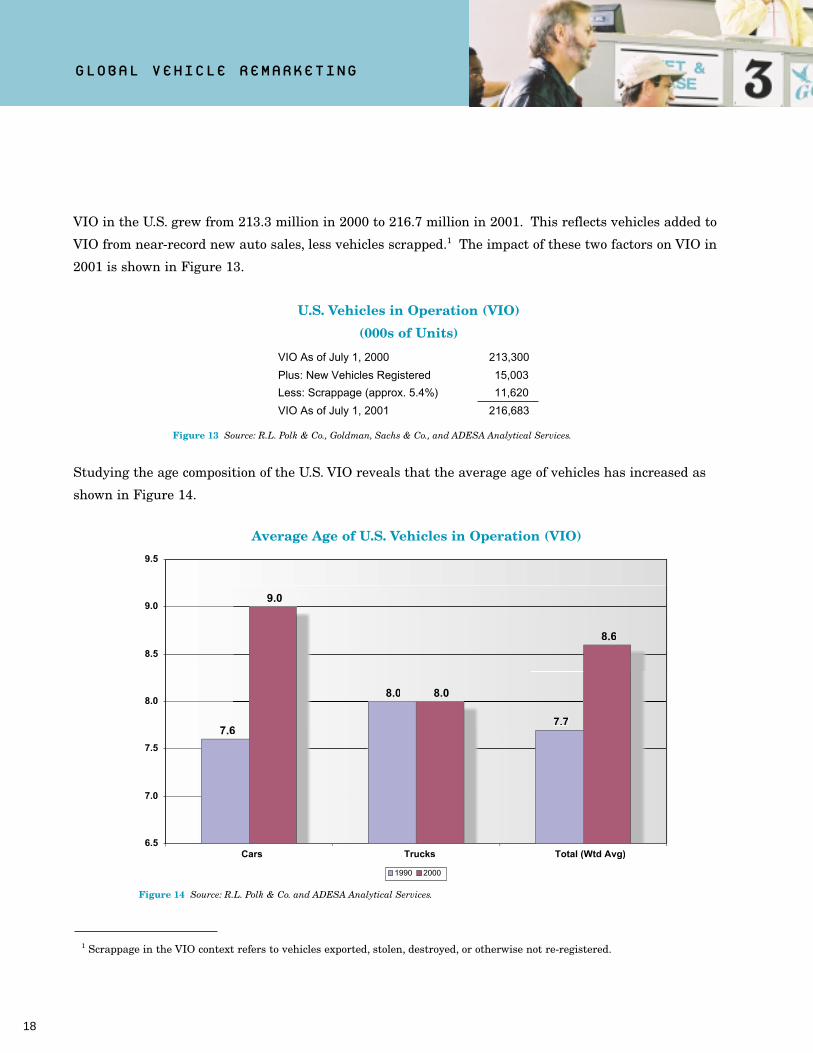
VIO in the U.S. grew from 213.3 million in 2000 to 216.7 million in 2001. This reflects vehicles added to
VIO from near-record new auto sales, less vehicles scrapped.1 The impact of these two factors on VIO in
2001 is shown in Figure 13.
1 Scrappage in the VIO context refers to vehicles exported, stolen, destroyed, or otherwise not re-registered.
U.S. Vehicles in Operation (VIO)
(000s of Units)
Figure 13 Source: R.L. Polk & Co., Goldman, Sachs & Co., and ADESA Analytical Services.
VIO As of July 1, 2000 213,300
Plus: New Vehicles Registered 15,003
Less: Scrappage (approx. 5.4%) 11,620
VIO As of July 1, 2001 216,683
Average Age of U.S. Vehicles in Operation (VIO)
Figure 14 Source: R.L. Polk & Co. and ADESA Analytical Services.
7.66
8.0
7.7
9.0
8.0
8.6
6.5
7.0
7.5
8.0
8.5
9.0
9.5
Cars Trucks Total (Wtd Avg)
1990 2000
Studying the age composition of the U.S. VIO reveals that the average age of vehicles has increased as
shown in Figure 14.
GLOBAL VEHICLE REMARKETING

19
This is primarily due to quality improvements that allow vehicles to stay in operation longer.1 Survival
rates for vehicles (determined by calculating the period of time required for half the vehicles originally reg-
istered in a given year to still be in the VIO) have been variously estimated at 13 to 16 years. For the vehi-
cle remarketing industry, quality improvements continue to extend the potential life of a vehicle between
owners, but they also extend the vehicle’s life overall. On balance, this is positive for the industry because
each longer-lasting vehicle in the VIO still has the potential to change hands three to four times during its
lifetime, even if the time between ownership-changes grows.
As stated in last year’s GVR, there is about a one-in-five chance that a vehicle in operation will be sold in the
used vehicle market during any year, although this average varies greatly by age of vehicle. Applying the same
methodology used in last year’s GVR projections, i.e., calculating parc turn rates by vehicle age, yields the five-
year used vehicle sales projections (along with a breakout of sales by age) summarized in Figure 15.
It should be noted that the expected growth in VIO as forecast this year by Goldman, Sachs & Co. is lower
than projected last year. This is because new vehicle sales in 2001 greatly exceeded most analysts’ (includ-
ing Goldman, Sachs’) expectations. The anticipated correction in new vehicle sales back to long-term trend
levels has been, in effect, delayed by one year. Therefore, the resulting forecast for used vehicle sales reach-
es 46.5 million units by 2006 in this year’s forecast, rather than in 2005 as in last year’s version. Neverthe-
less, used vehicle volumes are projected to be healthy throughout the forecast period, growing at a 1.7%
compound annual growth rate (CAGR).
1 The lack of growth in the average age of trucks is not due to lack of improvements in truck quality and durability. Rather, it isdue to the greatly increased sales of minivans, SUVs, pickups and other trucks in recent years. With more people buying newtrucks, the average age of the truck population is younger than it otherwise would be.
NEW AND USED VEHICLE SALES IN THE U.S.& CANADA

20
The forecast also shows a decline in sales of used vehicles that are three years old or less. This reflects expecta-
tions that both new vehicle sales and leasing will decline in the coming years, making fewer nearly-new units
available in the used vehicle market. Nevertheless, record new vehicle sales and leasing in 1999 through 2001
will result in excellent availability and sale of late-model (especially five-year-old) units throughout the
forecast period. In addition, the improved durability discussed previously in this section will result in
improved availability and sale of older units (greater than seven model years old), which are typically
sold by independent dealers and the public.
2001-2006Vehicle age up to: 2001 2002 2003 2004 2005 2006 CAGR*One-Year 848 757 727 751 773 782 -1.6%Two-Year 1,478 1,525 1,390 1,254 1,299 1,315 -2.3%Three-Year 2,215 2,439 2,515 2,291 2,065 2,090 -1.2%
Four-Year 3,873 3,828 4,211 4,342 3,953 4,001 0.7%Five-Year 4,078 4,484 4,430 4,870 5,020 5,081 4.5%Six-Year 5,325 4,591 5,047 4,984 5,477 5,544 0.8%Seven-Year 5,149 5,690 4,907 5,396 5,330 5,395 0.9%Eight-Year 5,650 5,919 6,551 5,655 6,221 6,297 2.2%
Nine-Year 4,102 4,532 4,756 5,275 4,563 4,619 2.4%Ten-Year 2,755 2,688 2,979 3,134 3,489 3,531 5.1%
Eleven-Year+ 7,151 7,234 7,306 7,482 7,711 7,805 1.8%
Total 42,624 43,688 44,819 45,434 45,901 46,460 1.7%
Projected U.S. Used Vehicle Sales Volumes (000s)
*Compound annual growth rate.
Projected Used Vehicle Sales Volumes (000s)
— By Vehicle Age —
Figure 15 Source: ADESA Analytical Services.
GLOBAL VEHICLE REMARKETING
-
5,000
10,000
15,000
20,000
25,000
30,000
35,000
40,000
45,000
50,000
20012001 20022002 20032003 20042004 20052005 20062006
Eleven-Year+Ten-YearNine-YearEight-YearSeven-YearSix-YearFive-YearFour-YearThree-YearTwo-YearOne-Year
21
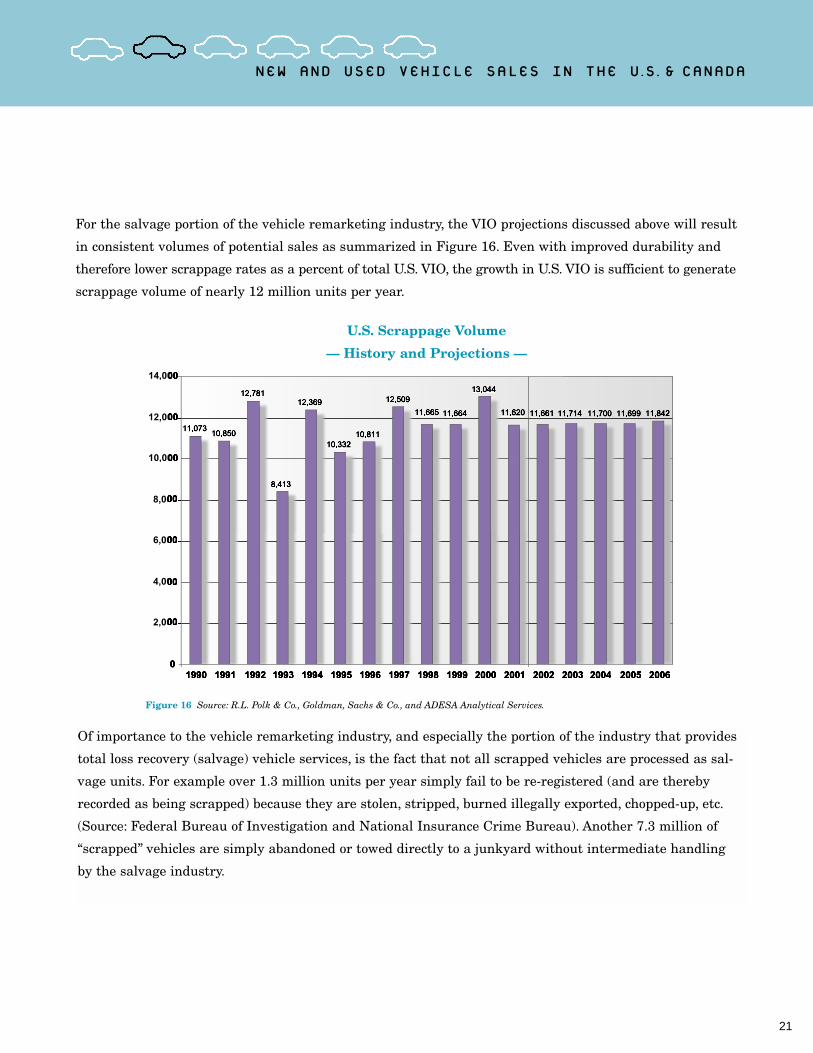
Of importance to the vehicle remarketing industry, and especially the portion of the industry that provides
total loss recovery (salvage) vehicle services, is the fact that not all scrapped vehicles are processed as sal-
vage units. For example over 1.3 million units per year simply fail to be re-registered (and are thereby
recorded as being scrapped) because they are stolen, stripped, burned illegally exported, chopped-up, etc.
(Source: Federal Bureau of Investigation and National Insurance Crime Bureau). Another 7.3 million of
“scrapped” vehicles are simply abandoned or towed directly to a junkyard without intermediate handling
by the salvage industry.
For the salvage portion of the vehicle remarketing industry, the VIO projections discussed above will result
in consistent volumes of potential sales as summarized in Figure 16. Even with improved durability and
therefore lower scrappage rates as a percent of total U.S. VIO, the growth in U.S. VIO is sufficient to generate
scrappage volume of nearly 12 million units per year.
U.S. Scrappage Volume
— History and Projections —
Figure 16 Source: R.L. Polk & Co., Goldman, Sachs & Co., and ADESA Analytical Services.
2,00
4,00
6,00
8,00
10,00
12,00
14,000
NEW AND USED VEHICLE SALES IN THE U.S.& CANADA

22
ADESA Analytical Services estimates that approximately 2.7-3.0 million units of the 11.7 million units
of annual scrappage are processed through the salvage vehicle remarketing industry. However, the portion
of total scrappage handled by this industry is expected to grow by 3-5% per year, which, along with the
stability of projected scrappage volumes, assures a steady growth to this industry.
In Canada, VIO has grown significantly as shown in Figure 17.
1 Last year’s GVR showed an estimate of used vehicle sales also performed by DesRosiers that was based on parc turn.That methodology yielded an estimate of annual Canadian used vehicle sales of 3.0 million units.
Total Vehicles in Operation — Canada
Figure 17 Source: Ward’s Communications and ADESA Analytical Services. 1999 data is latest available.
16,66816,86116 861
17,078
17,581
19,217
15,000
15,500
16,000
16,500
17,000
17,500
18,000
18,500
19,000
19,500
1995 1996 1997 1998 1999
GLOBAL VEHICLE REMARKETING
Despite the growth in VIO, current estimates of used vehicle sales in Canada put forth by DesRosiers
Automotive Consultants conservatively project 2002 used vehicle sales to be flat with 2001 at 2.1 million
units. (Figure 18 shows the DesRosiers estimate by seller type.) Also, the DesRosiers estimates show a
decline in used vehicle sales from 2.6 million units in 1995 to 2.1 million units in 2000 and 2001.1

23
It is possible that the discrepancy between Canadian VIO growth and used vehicle sales is due in part to
exports of wholesale used vehicles out of Canada. This has been prompted by comparatively low Canadian
used vehicle prices and a weak Canadian dollar relative to the U.S. dollar. ADESA Analytical Services
believes Canadian used vehicle exports will diminish over time, and the growth in VIO shown in Figure 17
would indicate that future used vehicle sales beyond 2002 should grow towards the 3.0 million-unit level
presented in last year’s GVR.
Projected 2002 Used Vehicle Sales in Canada (000s of Units Sold)
Figure 18 Source: DesRosiers Automotive Consultants.
938938(45.4%)
379(18.4%)
747747(336.2%)
Franchised Dealers Independent Dealers Private Individuals
Total Sales Volume = 2.1 million units
NEW AND USED VEHICLE SALES IN THE U.S.& CANADA
Based on ADESA Analytical Services projections presented in this section, the combined U.S. and Canadian
used vehicle markets will represent nearly 50 million units in annual sales by 2006 -- up over 11% from the
45 million units sold in the two countries in 2001.


The Vehicle Remarketing
Industry
25

26
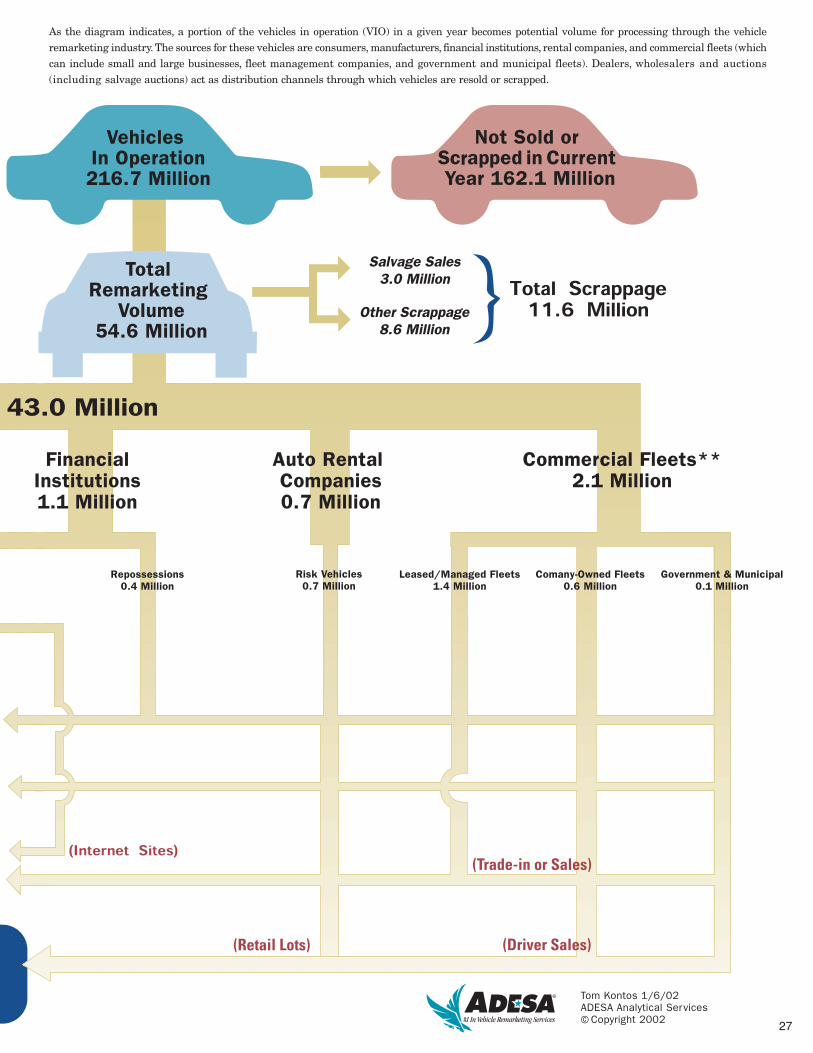
* Based on estimated volumes (in units) for 2001 and best available data for cross-reference. No estimates are provided where information is insufficient.** Includes approximately 0.3 million units of medium and heavy duty commercial trucks.*** See Figure 42, page 50 for details on auction volume sources.
***
Vehicle Remarketing Defined
This year’s GVR again includes
this diagram showing the flow
of used vehicles through the
remarketing process, along
with updated volume
estimates for the U.S.
27
As the diagram indicates, a portion of the vehicles in operation (VIO) in a given year becomes potential volume for processing through the vehicle remarketing industry. The sources for these vehicles are consumers, manufacturers, financial institutions, rental companies, and commercial fleets (whichcan include small and large businesses, fleet management companies, and government and municipal fleets). Dealers, wholesalers and auctions(including salvage auctions) act as distribution channels through which vehicles are resold or scrapped.
Tom Kontos 1/6/02ADESA Analytical Services Copyright 2002

Customer contact& notification;
lease termination
Economiesof ScaleNational
DistributionChannel
TechnologyDevelopment
and Web-based Services
HumanResources
and CustomerService
Orientation
Customizedinternetreporting
capabilities
In-housetrucking fleet
Affiliatedtransport
companies
Strategicallylocated
transportterminalsOUTBOUND
LOGISTICS
Customizedconsultativeanalysis of
results
Title search& processingcapabilities;
paymentprocessing
Skip tracing,collateral
recovery & otherrepossesion-
related services
Search, preview,post vehicles
on-line
Market Reports and Analytical
Services
Vehicletracking
Pick up& delivery to
central strategiclocation
SERVICE
Figure 19 depicts the vehicle
remarketing process in the form
of a value chain that involves
logistics, vehicle reconditioning
operations, promotional activities,
and other services. A checklist
has also been provided on page
31, to help individuals charged
with maximizing returns on
vehicles being remarketed, as a
reminder of the multitude of
services that the remarketing
industry can provide.
28

Managementand
Sales Expertise
Securedstorage
Vehicle historyand electronic
condition reports
Certificationdiagnosis &mechanical
reconditioning
Reconditioning& vehicle
enhancementrecommendations
Body & paintwork;
vehicleenhancementand detailing
Databasemarketing to
targeted buyersfor traditional or
on-line sales
Nationaladvertising inautomotive
industrypublications
Education &training to
expand dealerawareness anduse of auctions
Customizedpromotional
campaigns such asspecial sales events and buyer incentives
MARKETING& SALES
OPERATIONS
INBOUNDLOGISTICS
Vehicle conditionreport andequipment/option listing
Auction LocationsBody & Paint Facilities
Mechanical ShopsDetailing CentersTransport Trucks
etc.
Figure 19
29


31
A REMARKETER’S CHECKLIST FOR MAXIMIZING VALUE*
Logistical Services:______ Pick-up______ Collateral Recovery______ Marshalling______ Secured Storage______ Delivery
Reconditioning Services:Inspection Services:______ Vehicle history check (odometer, theft, title,
frame damage, flood or hail damage, salvage)______ Condition report (paper)______ Electronic Condition Report______ Digital photos______ Lease-end inspections______ Lot inventory audits
Detail Services:______ Car Wash (Automated or hand wash)______ Wash and Vacuum______ Full Detailing______ Enhanced Detailing (includes clay bar
treatment and three-step buffing)
Body & Paint Services:______ Paintless Dent Repair (PDR)______ Air brush service______ Complete body repair and paint refinishing______ Upholstery repair______ Glass repair______ Glass replacement______ Appearance enhancements (e.g., stripes)
Mechanical Services:______ Mechanical inspection services - pre-auction sale______ Certification-Level Inspection and Diagnosis______ Selected mechanical services performed
by certified technicians______ Complete mechanical repair services______ Tire replacement______ Mechanical inspection services - post-auction sale
Marketing Services:______ Database marketing research______ Advertising (Auction-level)______ Advertising (National-level)______ Telemarketing______ Broadcast fax and e-mail______ Direct mail______ Promotions
Web-based Services:______ Locate auctions of interest______ Review auction schedules______ Preview auction inventory______ Preview online inventory______ Online searches for specific vehicles______ Review auction market reports______ Post vehicles on-line______ Track vehicles being remarketed______ Purchase vehicles at set prices online______ Bid on vehicles online (Live)______ Bid on vehicles online (Set timeframe)______ Dealership management software tools______ Used parts locator
Administrative Services:______ Title processing______ Auction market reports______ Specialized reports to client's specs______ Check processing______ Electronic funds transfer______ Dealer Financing______ Retail Financing
Outsourced Services:______ Coordinated national remarketing______ Repossession services______ Lease-end services______ Title services
Analytical Services:______ Reports on industry trends______ Custom analysis based on client needs______ Presentations______ Surveys
* This worksheet can be used as a handy reference. These services may also be tailored as needed to meet the specific needs of medium and heavy commercial vehicle remarketers and insurance companies remarketing salvage vehicles. To inquire about any of the services listed on this page, please call ADESA Corporation at 317/249-4265.


THE VEHICLE REMARKETING INDUSTRY
33
The survey also confirms the scale of the industry in terms of acreage for storing and processing vehicles,
with the average auction located on 65 acres and operating seven lanes. The largest auctions have as many
as 339 acres and 27 lanes. The breadth of services offered at a typical auction – including auto detailing,
mechanical repair, body and paint repair, transportation, and dealer financing – require an average of 255
full and part-time employees.
Figure 21 shows historical trends in auction vehicle sales per the NAAA survey plus ADESA Analytical
Services’ estimate for 2001.
U.S. and Canada Auction Vehicle Sales by Source
Figure 21 Source: National Auto Auction Association (NAAA) and ADESA Analytical Services.
3,428(36%)
3,762(41%)
3,963(43%)
3,857(45%)
3,991(42%)
3,398(37%)
3,293(36%)2,945
(34%)
1,945(20%)1,797
(19%)1,739(19%)1,723
(20%)
207(2%)324
(3%)233(2%)138
(1%)
0
2,000
4,000
6,000
8,000
10,000
12,000
1998 1999 2000 2001
Dealers Fleets and Leasing Companies Manufacturers Other
Total = 8,662 Total = 9,228 Total = 9,280 Total = 9,571
North American Auction Industry Sales Transactions
Figure 20 Source: National Auto Auction Association, and ADESA Analytical Services.
1997 1998 1999 2000
Gross Value of Vehicles Sold ($Billions) $56.6 $66.7 $76.5 $77.6
Units Sold (000s) 7,354 8,662 9,228 9,280
Average Price/Unit $7,693 $7,700 $8,288 $8,361
Sitting squarely in the middle of the remarketing process are the 285-plus wholesale auctions in the U.S.
and Canada that are members of the National Auto Auction Association (NAAA). Since 1997, NAAA has
been conducting a member survey, which shows that the value of wholesale transactions had reached
$77.6 billion in 2000 as shown in Figure 20.

GLOBAL VEHICLE REMARKETING
34
As these figures show, auction industry volumes in the U.S. and Canada have grown from 7.4 million units
in 1997 to an estimated 9.6 million units in 2001, with 9.1 million units being sold in the U.S. and 500,000
in Canada. Volumes from dealers have dropped from 45% of total sales to 36%, and have also dropped in
absolute terms from 3.9 to 3.4 million units annually. However, these volumes have been more than offset
by volumes coming from institutional consignors such as automobile manufacturers and their finance arms,
banks, auto rental companies and commercial fleets. To a great degree, this trend reflects the rapid growth
of leasing that results in more vehicles being handled by automotive finance companies off-lease rather
than as trade-ins to dealers. In addition, this trend towards greater auction use by major corporations con-
firms the efficiency and value of the auction-centered services provided by the vehicle remarketing industry.
Estimated 2001 Auction Volumes by Major Supply Source
(000’s of Units)
Figure 22 Source: ADESA Analytical Services.
Source of Vehicles Entered Sold % Sold Entered SoldDealers 8,204 3,290 40% 52% 36%Fleets and Leasing Companies* 5,343 3,793 71% 34% 42%Manufacturers** 2,228 1,850 83% 14% 20%Other*** 143 119 84% 1% 1%Total 15,917 9,053 57% 100% 100%
Source of Vehicles Entered Sold % Sold Entered SoldDealers 345 138 40% 43% 27%Fleets and Leasing Companies* 262 198 76% 33% 38%Manufacturers** 96 94 99% 12% 18%Other*** 101 88 87% 13% 17%Total 804 518 64% 100% 100%
Source of Vehicles Entered Sold % Sold Entered SoldDealers 8,549 3,428 40% 51% 36%Fleets and Leasing Companies* 5,605 3,991 71% 34% 42%Manufacturers** 2,323 1,945 84% 14% 20%Other*** 244 207 85% 1% 2%Total 16,722 9,571 57% 100% 100%
Units % of Total
United StatesUnits % of Total
CanadaUnits % of Total
Total United States and Canada
* Includes off-lease vehicles sold in “open” auction sales.** Includes off-lease vehicles sold in “closed,” “factory” auction sales.
*** Includes salvage units sold by insurance companies and other consignment sales.
ADESA Analytical Services also developed a breakout of 2001 sales for the U.S. and Canada based on the
NAAA survey (see Figure 22).
Vehicle Suppliers
The following sections provide details on the major suppliers of vehicles to the vehicle remarketing industry.
Manufacturers
Many of the major manufacturers have established “programs” by which they sell vehicles to auto rental
companies at a guaranteed repurchase price (or a guaranteed depreciation rate) if certain contractual
terms are met. This gives manufacturers an outlet for new vehicle sales (especially important when retail
customer demand decreases and inventories would otherwise rise or plants would have to be shut down).
Program vehicles are also a source of profitable late-model (current model year or last year’s model), low-
mileage (average around 23,000 miles) used units in good condition and often with remaining warranty.
Manufacturers typically make these vehicles available exclusively to their dealers either through “closed,”
“factory” sales or on password-protected web sites (these web sites may be provided by auction companies
or third-party providers).
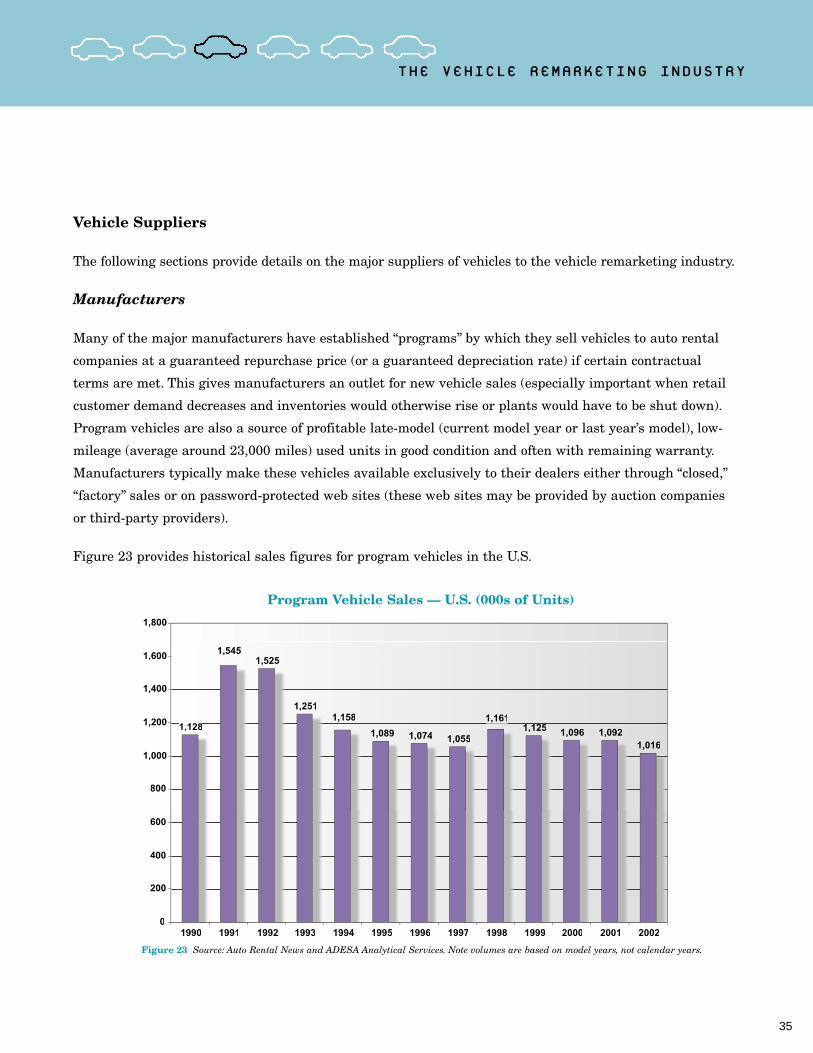
Figure 23 provides historical sales figures for program vehicles in the U.S.
35
THE VEHICLE REMARKETING INDUSTRY
Program Vehicle Sales — U.S. (000s of Units)
1,128
1,5451,525
1,2511,158
1,089 1,074 1,055
1,161,1,125 1,096 1,092
1,016
00
200
400
600
800
1,0000
1,2000
1,4000
1,6000
1,800
1990 1991 1992 1993 1994 1995 1996 1997 1998 1999 2000 2001 2002
Figure 23 Source: Auto Rental News and ADESA Analytical Services. Note volumes are based on model years, not calendar years.

36
Program vehicle sales have declined by about 500,000 units since their peak in 1991. At that time, manu-
facturers used program vehicles as a “lever” to keep plant utilization high during the 1990-91 recession.
In this year’s recession, manufacturers primarily used zero-percent financing and other retail incentives
rather than increased program vehicle sales to accomplish the same goal. ADESA Analytical Services
expects program vehicle supply to the U.S. vehicle remarketing industry to remain at the one-million-unit
level for the foreseeable future.
From discussions with the remarketing departments of the major manufacturers in Canada, ADESA
Analytical Services expects approximately 150,000 program units annually to be sold through auctions
and auction-owned websites for the foreseeable future. This represents 30% of total annual Canadian
remarketing industry volume.
Automotive Finance Companies
A second major source of vehicles to the remarketing industry are captive (i.e., the finance arms of the
major automobile manufacturers) and non-captive (e.g., banks, credit unions, etc.) automotive finance
companies. In years past, these companies furnished mostly repossessed vehicles to auctions, amounting
to approximately one million units annually.1 Since the early 1990s, however, the bulk of units remarketed
by these companies are off-lease vehicles.
To determine projected off-lease volumes returning for wholesale remarketing in the U.S., the estimates
shown in Figure 24 were utilized.
Estimates of Lease Termination Outcomes
Figure 24 Source: ADESA Analytical Services using data as noted.
Latest Research Results
Termination Outcome NADA CNW M/R CBA** Average 2001 2002
Lessee Takes Possession 16% 25% 26% 22% 711 689
Dealer Takes Possession 20% 32% 15% 22% 711 689
Lessor Takes Possession* 64% 43% 59% 56% 1,810 1,753
Total 100% 100% 100% 100% 3,233 3,130
*** Includes month-to-month, lease conversions, repossession, insurance loss, etc.*** Consumer Bankers Association. Weighted average of early- and full-term leases.*** Based on CNW Marketing/Research totals (000s of units).
Off-Lease Volumes***
1 During recessions, loan default rates and therefore repossessions rise. This is one of several factors that provide stability to vehicleremarketing volumes despite cyclical fluctuations in the general economy and in the automotive industry.
GLOBAL VEHICLE REMARKETING

37
With projected declines in lease volumes (discussed on pages 13-14), ADESA Analytical Services projects
off-lease volumes in the U.S. to decrease significantly over the next five years as shown in Figure 25.
Despite these declines, off-lease volumes available for wholesale remarketing will remain at historically
high levels over the next five years.
Off-Lease Volumes Returning for Wholesale Remarketing (000s of Units)
Figure 25 Source: CNW Marketing/Research and ADESA Analytical Services.
200250
500588
662
848907
1,198
1,582
1,9181,856
1,810 1,753
1,672
1,523
1,3091,248
0
2000
4000
6000
8000
1,0000
1,2000
1,4000
1,6000
1,8000
2,0000
1990 1991 1992 1993 1994 1995 1996 1997 1998 1999 2000 2001 2002 2003 2004 2005 2006
History Projections
In Canada, around 40% of retail sales in 1999 and 2000 were leases (although lease penetration in 2001
dropped due to attractive loan financing availability), and around 41% of off-lease vehicles return to the
lessor (per DesRosiers Automotive Consultants). As a result, off-lease volumes available for wholesale
remarketing are expected to average around 250,000 units annually over the next two years. Beyond
2003, ADESA Analytical Services expects a similar tapering in off-lease volumes as that projected for
the U.S., to an ultimate volume of approximately 175,000 units by 2006.
THE VEHICLE REMARKETING INDUSTRY
Trends in Consumer Leasing 1990 1991 1992 1993 1994 1995 1996 1997 1998 1999 2000 2001 2002 2003 2004 2005 2006
New Light Vehicle SalesVolumes (000s)
13,887 12,335 12,885 13,918 15,089 14,766 15,140 15,160 15,597 16,958 17,410 17,177 15,750 15,570 16,051 16,568 16,750Consumer Leases 574 743 1,203 1,852 2,519 2,648 2,963 3,424 3,587 4,146 4,162 3,607 3,348 3,181 3,278 3,314 3,350Off-Lease Returns 400 500 1,000 1,591 1,688 2,186 2,846 3,261 3,302 3,366 3,437 3,233 3,130 3,040 2,820 2,470 2,400Off-Lease Volumes Returning for Wholesale Remarketing 200 250 500 588 662 848 907 1,198 1,582 1,918 1,856 1,810 1,753 1,672 1,523 1,309 1,248
Consumer Leases as a Percent of New Light Vehicle Sales 4% 6% 9% 13% 17% 18% 20% 23% 23% 24% 24% 21% 21% 20% 20% 20% 20%Remarketing Volumes as a Percent of Off-Lease Returns 50% 50% 50% 37% 39% 39% 32% 37% 48% 57% 54% 56% 56% 55% 54% 53% 52%
History Projections
38
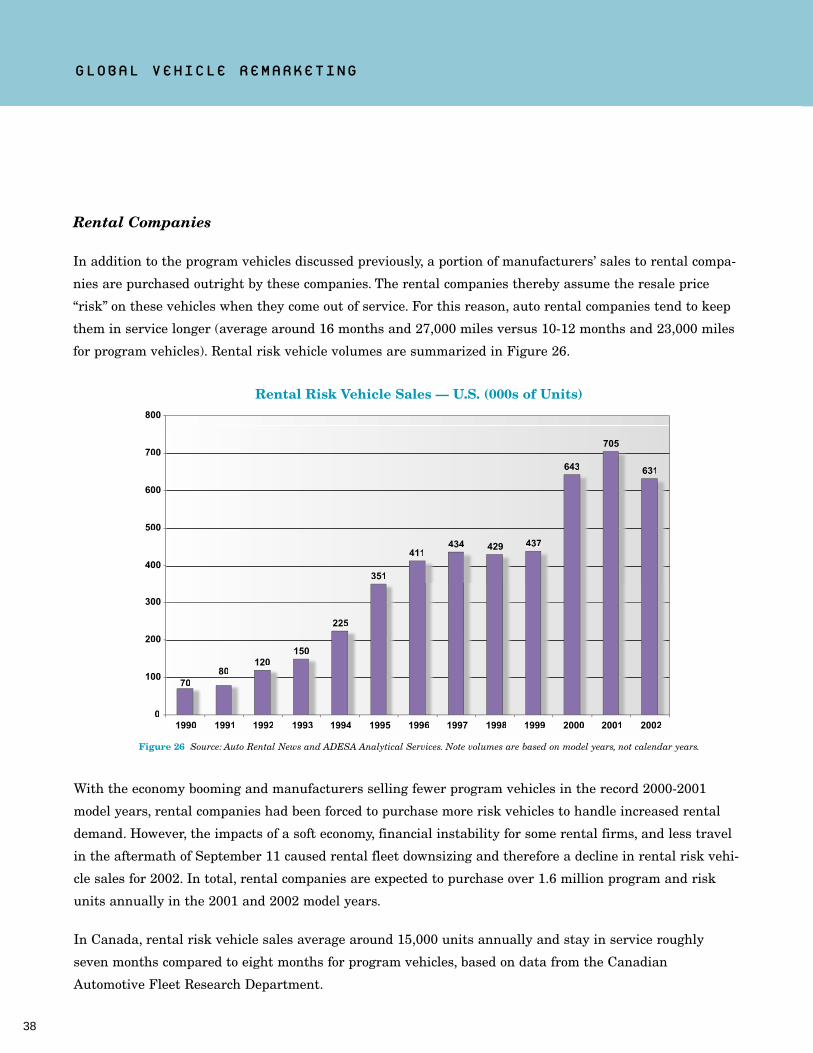
Rental Companies
In addition to the program vehicles discussed previously, a portion of manufacturers’ sales to rental compa-
nies are purchased outright by these companies. The rental companies thereby assume the resale price
“risk” on these vehicles when they come out of service. For this reason, auto rental companies tend to keep
them in service longer (average around 16 months and 27,000 miles versus 10-12 months and 23,000 miles
for program vehicles). Rental risk vehicle volumes are summarized in Figure 26.
Rental Risk Vehicle Sales — U.S. (000s of Units)
7080
120150
225
351
411434 429 437
643
705
631
0
1000
2000
3000
4000
5000
6000
7000
800
1990 1991 1992 1993 1994 1995 1996 1997 1998 1999 2000 2001 2002
With the economy booming and manufacturers selling fewer program vehicles in the record 2000-2001
model years, rental companies had been forced to purchase more risk vehicles to handle increased rental
demand. However, the impacts of a soft economy, financial instability for some rental firms, and less travel
in the aftermath of September 11 caused rental fleet downsizing and therefore a decline in rental risk vehi-
cle sales for 2002. In total, rental companies are expected to purchase over 1.6 million program and risk
units annually in the 2001 and 2002 model years.
In Canada, rental risk vehicle sales average around 15,000 units annually and stay in service roughly
seven months compared to eight months for program vehicles, based on data from the Canadian
Automotive Fleet Research Department.
GLOBAL VEHICLE REMARKETING
Figure 26 Source: Auto Rental News and ADESA Analytical Services. Note volumes are based on model years, not calendar years.

39
Commercial Fleets
Another important source of vehicle remarketing supply is commercial fleets.1 There are 15.2 million
commercial fleet vehicles in the U.S. – or seven percent of the nation’s 216.7 million-unit vehicle population.
Figure 27 breaks out commercial fleet vehicle volumes by fleet type.
Total Fleet Vehicles in Service by Fleet Type
Total Vehicles = 15.2 millions
Figure 27 Source: Automotive Fleet and ADESA Analytical Services. Fleet size based on 2000 vehicle
registrations (latest available).
Businesses (10 or more units)
39.3%
Businesses (4-10 units)18.7%
Government21.7%
Rental12.0%
Utilities5.4%
Other Municipal*3.0%
* Includdes police, taxi, etc.
000s Units
Segment Cars Trucks Total % of Total
Businesses (4-10 units) 1,173 1,662 2,835 18.7%
Businesses (10 or more units) 2,950 3,026 5,976 39.3%
Subtotal Businesses 4,123 4,688 8,811 58.0%
Government 883 2,408 3,291 21.7%
Utilities 317 498 815 5.4%
Other Municipal* 442 8 450 3.0%
Subtotal Government/Municipal 1,642 2,914 4,556 30.0%
Rental 1,581 248 1,829 12.0%
Total 7,346 7,850 15,196 100.0%
Memo:
Vehicle Type Percent 48.3% 51.7% 100.0%
* Includes police, taxi, etc.
1 For excellent sources of detailed information on commercial vehicle fleets in the U.S. and Canada, see the annual “Fact Book”editions of Automotive Fleet and Canadian Automotive Fleet magazines, published by Bobit Publishing Company.
THE VEHICLE REMARKETING INDUSTRY

40
These fleets can be owned outright by the business, government, and municipal organizations that operate
the vehicles, or they can be leased from, and managed by, fleet management companies as summarized in
Figure 28.
Company-Owned Fleet Vehicles in Service
Figure 28 Source: Automotive Fleet and ADESA Analytical Services. Fleet size based on 2000 vehicle registrations
(latest available).
634 738 1,372 14.0%1,218 1,456 2,674 27.3%
1,852 2,194 4,046 41.3%
752 2,010 2,762 28.2%
281 445 726 7.4%430 7 437 4.5%
1,463 2,462 3,925 40.1%
1,569 248 1,817 18.6%
4,884 4,904 9,788 100.0%
49.9% 50.1% 100.0%
539 924 1,463 27.1%1,732 1,570 3,302 61.1%
2,271 2,494 4,765 88.1%
131 398 529 9.8%
36 53 89 1.6%12 1 13 0.2%
179 452 631 11.7%
12 0 12 0.2%
2,462 2,946 5,408 100.0%
45.5% 54.5% 100.0%
000s Units
Segment Cars Trucks Total % of Total
Businesses (4-10 units)
Businesses (10 or more units)
Subtotal Businesses
Government
Utilities
Other Municipal*
Subtotal Government/Municipal
Rental
Total
Memo:
Vehicle Type Percent
000s Units
Segment Cars Trucks Total % of Total
Businesses (4-10 units)
Businesses (10 or more units)
Subtotal Businesses
Government
Utilities
Other Municipal*
Subtotal Government/Municipal
Rental
Total
Memo:
Vehicle Type Percent
Leased/Managed Fleet Vehicles in Service
GLOBAL VEHICLE REMARKETING

41
All of this volume represents auction market potential – either traditional or Internet-based. However, fleet
management companies and large company-owned fleets (including rental companies discussed previously)
are the groups within these categories that most favor auctions for their vehicle remarketing.
Commercial fleet vehicle remarketing volumes also tend to be stable throughout the business cycle because
fleet managers use and replace these vehicles based on fairly consistent policies. Figure 29 shows average
turnback mileage and prices for commercial fleet vehicles.
Average Turnback Mileage and Prices for Commercial Fleet Vehicles — 2001
Figure 29 Source: Automotive Fleet and ADESA Analytical Services.
Average Mileage Average Price
Average Average Service Average Average AverageMonthly Life in Turnback Capitalized Depreciation Turnback
Segment Miles Months Mileage Cost Per Month Price
Compact Cars 2,034.00 21.07 42,856 $14,524 $276.63 $8,695
Intermediate Cars 1,967.67 25.80 50,766 $17,751 $345.14 $8,847
Minivans 2,160.00 27.10 58,536 $20,092 $381.70 $9,748
SUVs 2,104.67 25.07 52,764 $24,962 $475.00 $13,054
Full-Size Vans 1,901.33 29.43 55,956 $18,448 $308.22 $9,377
Light Trucks 2,321.00 30.43 70,628 $20,012 $347.22 $9,446
Figure 30 Source: Canadian Automotive Fleet, Automotive Fleet, and ADESA Analytical Services.
Fleet as aRetailCountry Fleet Total % of Total
Canada 1,298,923 293,232 1,592,155 18.4%
U.S. 14,269,650 2,734,915 17,004,565 16.1%
2000 New Registrations
Commercial fleet vehicle sales in Canada make up a slightly higher percentage of total new vehicle sales
than in the U.S., as seen in Figure 30.
ADESA Analytical Services estimates annual Canadian commercial fleet vehicle sales available for
wholesale remarketing to be approximately 85,000 units.
THE VEHICLE REMARKETING INDUSTRY

42
Dealers
There are 22,150 franchised (new vehicle) dealerships and 54,150 independent (non-franchised dealers
selling used vehicles only) in the U.S. In Canada, there are an estimated 3,550 franchised dealers, and
estimates of the number of independent dealers range from 11,400 to 21,750. These retailers combine to
sell 30.3 million used units in the U.S. and 1.3 million units in Canada. Figure 31 shows the decline in
franchised dealerships in the U.S. and Canada. In both countries, the number of franchised dealerships
declined by 11% from 1990 through 2001.
Number of Franchised Dealerships in the U.S. and Canada
Figure 31 Source: NADA, DesRosiers Automotive Consultants, and ADESA Analytical Services.
20,500
21,000
21,5000
22,0000
22,5000
U.S
.
Can
ada
23,0000
23,5000
24,0000
24,5000
25,0000
25,500
3,3003,300
3,4003,400
5005003,53,5
6006003,63,6
7007003,73,7
8008003,83,8
9009003,93,9
0000004,04,0
4,1004,100
U.S. 24,825 24,200 23,500 22,950 22,850 22,800 22,750 22,700 22,600 22,400 22,250 22,150
Canada 4,000 3,964 3,966 3,872 3,855 3,819 3,714 3,608 3,543 3,535 3,569 3,550
1990 1991 1992 1993 1994 1995 1996 1997 1998 1999 2000 2001
This is part of a consolidation trend that is amplified by the growth of publicly held dealership groups,
most of which fall into the top 100 dealership groups in the U.S. Figure 32 captures the consolidation trend
by examining the share of several measures of total franchised dealership activity accounted for by the top
100 dealer groups.
GLOBAL VEHICLE REMARKETING

43
Although the top 100 dealer groups now represent 15% of total dealership revenue, their share of used
vehicle sales volume remains relatively low – especially when sales by independent dealers are included.
Dealers earn a substantial amount of profit from selling used vehicles. For franchised dealers, who sell
both new and used vehicles, average gross profits from used vehicles match those of new vehicles, even
though the used vehicle ties up almost 50% less capital. Independent dealers generally sell a lower priced
and older vehicle, but their profitability is even better on a per-unit basis. Buy-Here/Pay-Here dealers tend
to sell the least expensive vehicle of all dealer types, and yet their profitability is the highest on a per-unit
basis (especially when finance profits are added in). These observations are supported by the data in Figure 33.
Top 100 Dealer Groups Share of Total Franchised Dealerships
Figure 32 Source: Automotive News Data Center and ADESA Analytical Services. 2000 data is latest available.
4.3%
8.0%
4.6%
7.0%
9.8%
4.8%
8.6%
5.0%
7.5%
10.6%
5.7%
10.1%
5.8%
8.8%
12.2%
6.33%
11.2%
5.6%%%
9.2%
14.1%
7.6%
12.4%
6.7%
10.5%
14.8%
7.8%
13.6%
6.6%
10.9%
14.9%
0.0%
2.0%
4.0%
6.0%
8.0%
10.0%
12.0%
14.0%
16.0%
Total # of Dealerships Total New Vehicles Sold Total Used Vehicles Sold Total All Vehicles Sold Total Group Revenue
1995 1996 1997 1998 1999 2000
THE VEHICLE REMARKETING INDUSTRY

Dealers have choices in the means by which they source their used vehicle inventory. Obviously, dealers can
obtain used vehicles through trade-ins. This involves negotiation between dealer and customer and overlaps
into the negotiations taking place on the vehicle the dealer is trying to sell. Dealer experience in favorably
negotiating new car trades results in a modest gross profit advantage for new car trade-ins versus some
auction-sourced units (see Figure 34). However, dealers recently have been generating their greatest prof-
its on vehicles (often off-lease units) they purchase at auction from finance companies in fleet/lease sales.
$1,509
$1,532
$1,541
$1,556
$1,631
$1,686
61$2,0
$0 $500 $1,000 $1,500 $2,000 $2,500
Street Purrcchase
Used Vehicle TTrade
Auctions - Closed “Faccctory”
Auctions - Open “OOOther”
Wholesssalers
New Vehicle TTrade
Auctions - Open “Fleet/LLeease”
44
Gross Profit by Source of Vehicles Retailed by Franchised Dealers
Figure 34 Source: NADA Dealer Academy and ADESA Analytical Services. Based on 2001 data for franchised dealers..
U.S. Dealer Profitability (All data is on a per-vehicle basis)
Buy Here/Independent Pay Here
New Used Dealers** DealersAverage Retail Sales Price $25,632 $13,882 $10,942 $6,721
Average Gross Profit $1,539 $1,534 $1,722 $3,471***Gross Profit % 6.0% 11.1% 15.7% 51.6%
* Per NADA. Represents 2001 year-to-date data through November (latest available).** Per NIADA. Based on 2000 data (latest available).*** Includes finance income.
Franchised Dealers*
Figure 33 Source: NADA, National Independent Automobile Dealers Association (NIADA) and ADESA Analytical Services.
GLOBAL VEHICLE REMARKETING

45
Although dealers also make good margins on vehicles purchased from wholesalers1, they often lose money
on vehicles they sell to wholesalers (referred to as “wholesaling”). Figure 35 shows the range of gross profits
on vehicles wholesaled.
18
46)
7)
($200)
($150)
($100)
($50)
$0
$50
$100
$150
High
Average
Low
$188
$69
-$49
-$222
-$436
-$546
-$923$92-$1,000
-$800
-$600
-$400
-$200
$0
$200
$400
1 to 10 11 to 20 21 to 30 31 to 45 46 to 60 61 to 90 Over 90
Gross Profit Per Used Vehicle Wholesaled by Franchised DealersOverall Average at Various Dealerships By Days in Inventory
1 Wholesalers (also called brokers) buy used vehicles from dealers and corporate fleets (including rental and government fleets),and sell to other dealers, often via auction. Wholesalers profit from “arbitraging” the difference in price.
2 ADESA Analytical Services has performed detailed analysis that confirms this. Interested dealers may call Tom Kontos (317) 249-4235 for details.
3 AuctionNet prices reflect wholesale prices for both franchised and independent dealers and therefore should not be compareddirectly with the NADA retail prices, which are for franchised dealers only, to attempt to calculate used vehicle gross profit margins. Also, NADA average retail prices include sales of vehicles not sourced at auction. Wholesale price trends are discussed at length in the third part of this report.
Figure 35 Source: NADA Dealer Academy and ADESA Analytical Services. Based on 2001 data for franchised dealers.
ADESA Analytical Services estimates that more than half the trade-ins that U.S. franchised dealers
wholesale (a total of seven million units), or roughly 3.6 million units, are sold to wholesalers and the rest
(3.4 million units) are wholesaled via auction. The competitive bidding environment of auctions versus the
arbitrage profit motivation of wholesalers will often result in higher gross margins for vehicles wholesaled
by franchised dealers at auction.2
At the net profit level, auction-sourced vehicles may generate more F&I (Finance and Insurance) income
because of their often-superior condition and higher value. In addition, auction prices appear to have been rising
more slowly than retail used vehicle prices for franchised dealers, as shown in Figure 36.3 This is an indication
that gross profits on used vehicles sourced at auction have been increasing for franchised dealers in the U.S.
THE VEHICLE REMARKETING INDUSTRY

46
Gross Profit by Days in Inventory
Figure 37 Source: NADA Dealer Academy and ADESA Analytical Services. Based on 2001 data for franchised dealers.
Another important factor in determining dealer profitability on used vehicles is quickness of inventory
turnover. Figure 37 shows that dealers generate considerably more gross profit (and not coincidentally,
often incur lower reconditioning costs) on vehicles that sell within 45 days.
$0
$2,000
$4,000
$6,000
$8,000
$10,000
$12,000
$14,000
$16,000
Jan-93 Jan-94 Jan-95 Jan-96 Jan-97 Jan-98 Jan-99 Jan-00 Jan-01
NADA Avg Retail Price AuctionNet Wholesale
Wholesale and Retail Price Trends
Figure 36 Source: NADA, AuctionNet and ADESA Analytical Services.
$0
$200
$400
$600
$800
$1,000
$1,200
$1,400
$1,600
$1,800
$2,000
%0%
%5%
%10%
%15%
%20%
%25%
%30%
%35%
$ Per Unit $1,717 $1,862 $1,840 $1,715 $1,554 $1,308 $829Margin % 33% 18% 12% 11% 7% 9% 9%
1 to 10 11 to 20 21 to 30 31 to 45 46 to 60 61 to 90 Over 90
$337
$473$485 $505
$456
$499
$465
$0
$100
$200
$300
$400
$500
$600
1 to 10 11 to 20 21 to 30 31 to 45 46 to 60 61 to 90 Over 90
GLOBAL VEHICLE REMARKETING
Reconditioning Investment by Days in Inventory
($ Per Unit Retailed)
47
By using auctions to proactively obtain used vehicles that are targeted to a specific market and clientele,
dealers can maximize turns and therefore gross profits in their increasingly important used vehicle operations.
Dealers should also have an aging policy that enforces wholesaling of vehicles that have been in inventory
beyond a specified number of days. To help arrive at this, a profile of gross profits by vehicle age such as
the one in Figure 37 should be built for the dealer’s own inventory. A fact worth remembering that the
instructors at the NADA Dealer Academy stress to their students is that a 90-day-old unit has been in
inventory for 25% of the model year – a sizeable portion of that year’s depreciation. When vehicles exceed
the specified days, liquidating them via the robust market environment available at auction will often yield
sales prices that exceed those achievable through wholesalers, although this must be assessed against the
convenience and transportation cost avoidance that wholesalers can provide.1
As dealers consider which types of vehicles they might be interested in proactively obtaining at auction,
Figures 38 and 39 should be helpful.
Figure 38 shows that U.S. franchised and independent dealers make more money on higher priced vehicles
but the gross margin percentage drops. Franchised dealers do a little better profit-wise than independent
dealers within each category, but the data shown in Figure 33 on page 44 would imply that independent
dealers strategically select their vehicle price “mix” in such a way that they exceed franchised dealers’
profits on a weighted average basis.
Figure 39 shows that there is good money to be made regardless of model age and model class. Franchised
and independent dealers will often specialize in vehicles within specific age and model class categories, and
base their auction purchases accordingly.
THE VEHICLE REMARKETING INDUSTRY
1 ADESA Analytical Services can help dealers assess the trade-offs between wholesaling units via wholesalers versus auctions.Interested dealers may call Tom Kontos (317) 249-4235 for details.

48
Gross Profit by Dealer Type and Retail Price
Figure 38 Source: CNW Marketing/Research and ADESA Analytical Services. Based on 2000 data (latest available).
$00
$500
$1,0000
$1,5000
$2,0000
$2,5000
$3,0000
$3,5000
$4,0000
$4,50000
Less ThanLess Than$5,000
$ 5,001-$ 5 001$7,000
$ 7,001-$ 7 001$10,000
$10,001-$10 001$14,000
$14,001-$14 001$17,000
$17,001-$17 001$25,000
$25,001-$25 001$35,000
$35,001-$35 001$50,000
0%
5%
%10%
%15%
%20%
%25%
%30%
%35%
40%40%
Independent $ Per Unit Franchised $ Per Unit Independent Margin % Franchised Margin %
Gross Profit by Model Class
Figure 39 Source: NADA Dealer Academy and ADESA Analytical Services. Based on 2001 data.
$0
$200
$400
$600
$800
$1,000
$1,200
$1,400
$1,600
$1,800
%0%
%5%
%10
%15
%20
%25
$ Per Unit $1,709 $1,664 $1,647 $1,649 $1,595 $1,482 $1,163Margin % 9% 10% 10% 15% 17% 19% 24%
Current MY 1MY-Old 2MY-Old 3MY-Old 4MY-Old 5MY-Old 6+MY-Old$0
$500
$1,000
$1,500
$2,000
$2,500
%0%
%2%
%4%
%6%
%8%
%10
%12
%14
%16
18%
20%
$ Per Unit $1,958 $1,507 $1,468 $1,446 $1,628 $1,550 $1,741Margin % 11% 13% 17% 16% 18% 8% 16%
Luxury Standard Intermediate Compact All Pickups All Vans Other
GLOBAL VEHICLE REMARKETING
Gross Profit by Model Age

49
Wholesale prices for various types and ages of vehicles will vary seasonally and based on availability, so deal-
ers who shop often at auction will be better prepared to capitalize on opportunities to buy low and sell high,
thereby generating attractive grosses. It is clear from Figures 40 and 41 that franchised and independent
dealers are making effective use of auctions in obtaining a sizeable portion of their used vehicle inventories.
Sources of Used Vehicles Retailed by Franchised Dealers — U.S.
0%
10%
20%
30%
40%
50%
60%
70%
80%
90%
100%
OtherStreet PurchaseAuction PurchaseTrade-in on Used VehicleTrade-in on New Vehicle
55%
1982 2000
39%
22%
21%
6%33%
14%
4%3% 3%
% o
f T
ota
l Use
d V
ehic
les
Ret
aile
d
Auctions Attended by Independent Dealers — U.S.
Figure 41 Source: NIADA and ADESA Analytical Services.
23.5% 23.5% 24.3%
29.2% 26.5% 26.9%
25.9%27.5% 27.4%
21.4% 22.5% 21.4%
0%
10%
20%
30%
40%
50%
60%
70%
80%
90%
100%
1998 1999 2000
9 or more5-83-41-2
Number ofAuction SalesPer Month
Figure 40 Source: NADA and ADESA Analytical Services.
THE VEHICLE REMARKETING INDUSTRY
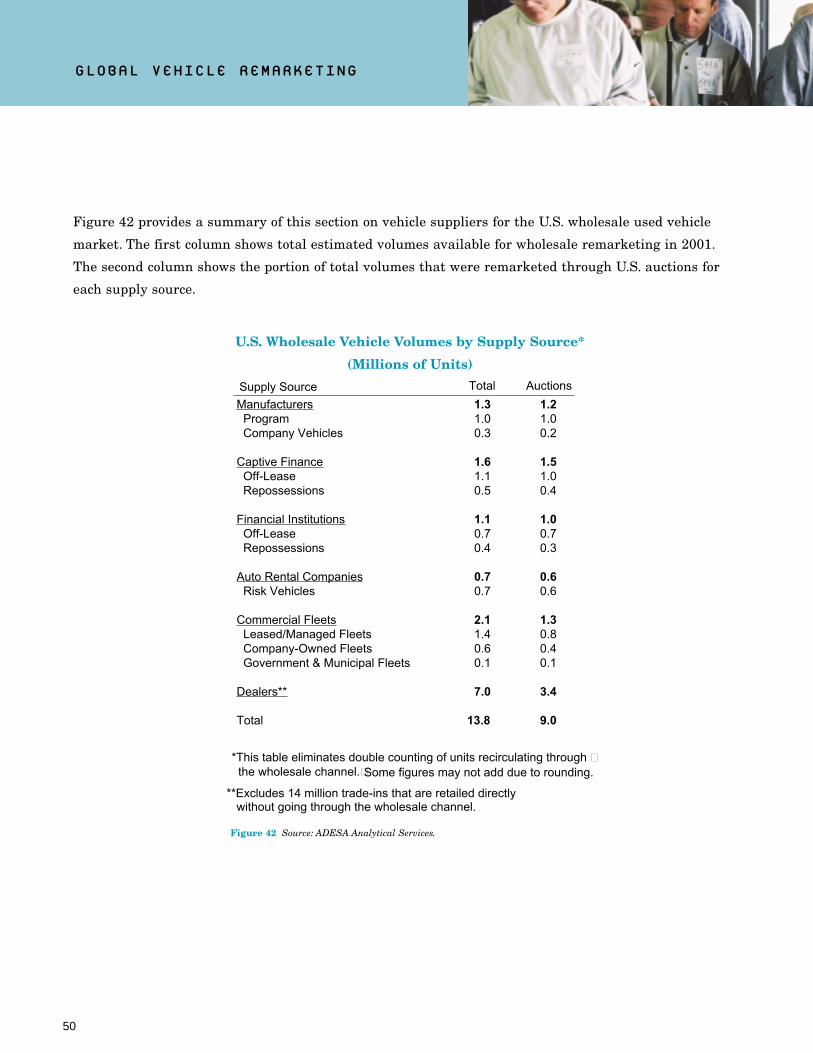
50
Figure 42 provides a summary of this section on vehicle suppliers for the U.S. wholesale used vehicle
market. The first column shows total estimated volumes available for wholesale remarketing in 2001.
The second column shows the portion of total volumes that were remarketed through U.S. auctions for
each supply source.
U.S. Wholesale Vehicle Volumes by Supply Source*
(Millions of Units)
Figure 42 Source: ADESA Analytical Services.
Supply Source Total Auctions
Manufacturers 1.3 1.2 Program 1.0 1.0 Company Vehicles 0.3 0.2
Captive Finance 1.6 1.5 Off-Lease 1.1 1.0 Repossessions 0.5 0.4
Financial Institutions 1.1 1.0 Off-Lease 0.7 0.7 Repossessions 0.4 0.3
Auto Rental Companies 0.7 0.6 Risk Vehicles 0.7 0.6
Commercial Fleets 2.1 1.3 Leased/Managed Fleets 1.4 0.8 Company-Owned Fleets 0.6 0.4 Government & Municipal Fleets 0.1 0.1
Dealers** 7.0 3.4
Total 13.8 9.0
*This table eliminates double counting of units recirculating through � the wholesale channel.�
Some figures may not add due to rounding.
**Excludes 14 million trade-ins that are retailed directly without going through the wholesale channel.
GLOBAL VEHICLE REMARKETING

51
Auction Sales Volume Projections
The previous sections have shown that the U.S. auction market stands at approximately nine million units
and the Canadian market represents another 500,000 units. Figure 43 shows ADESA Analytical Services’
projection of U.S. auction volumes based on the NAAA survey discussed previously. The projection also ref-
erences historical trends in auction sales by vehicle age using the AuctionNet® database1 and applying
these patterns to the projection of used vehicle sales shown in Figure 15 on page 20.
Projected U.S. Auction Sales Volumes (000s)
— By Vehicle Age —
Figure 43 Source: ADESA Analytical Services.
0
1,000
2,000
3,000
4,000
5,000
6,000
7,000
8,000
9,000
10,000
2001 2002 2003 2004 2005 2006
Eleven-Year+Ten-YearNine-YearEight-YearSeven-YearSix-YearFive-YearFour-YearThree-YearTwo-YearOne-Year
2001-2006
Vehicle age up to: 2001 2002 2003 2004 2005 2006 CAGR
One-Year 812 725 696 719 740 749 -1.6%
Two-Year 1,149 1,186 1,081 975 1,010 1,023 -2.3%
Three-Year 1,301 1,433 1,477 1,346 1,213 1,228 -1.2%
Four-Year 1,977 1,955 2,150 2,217 2,018 2,043 0.7%Five-Year 596 656 648 712 734 743 4.5%
Six-Year 782 674 741 732 804 814 0.8%Seven-Year 568 627 541 595 588 595 0.9%Eight-Year 511 536 593 512 563 570 2.2%Nine-Year 364 402 422 468 405 410 2.4%Ten-Year 311 304 336 354 394 399 5.1%Eleven-Year+ 680 736 743 761 784 794 3.1%
Total 9,053 9,233 9,429 9,391 9,254 9,367 0.7%
Projected U.S. Auction Sales Volumes (000s)
1 AuctionNet is a joint venture between NADA and NAAA. AuctionNet collects data on approximately five millionauction transactions annually from nearly 150 of the largest U.S. auctions.
THE VEHICLE REMARKETING INDUSTRY

52
Total auction industry volumes in the two countries are expected to climb from 9.3 million in 2000 (the
latest NAAA survey data available) to a peak of 10.0 million in 2003 and remain at near-peak levels
through the remainder of the forecast period.
These projections were corroborated with published interviews of vehicle remarketers from the manufacturer,
captive finance, fleet/lease, and other market segments and with the estimates of returning program,
off-lease, rental risk, commercial fleet, and repossessions, and dealer consignment discussed in previous
sections of this report. Volumes are greatest for three and four-year-old vehicles throughout the forecast
period as continued strong volumes of off-lease units, along with trade-ins from record new vehicle sales
years in 1999-2001, return for remarketing.
Layering on ADESA Analytical Services’ estimate of Canadian auction sales yields the projection for total
auction sales in the U.S. and Canada shown in Figure 44.
U.S. and Canada Auction Sales Volumes
Figure 44 Source: ADESA Analytical Services.
8,2108,746 8,796 9,053 9,233 9,429 9,391 9,254 9,367
452
482 485518
528540 537 530 536
8,662
9,228 9,2809,5719 571 9,7619,761 9,969 9,928 9,7849,784 9,903
0
2,000
4,000
6,000
8,000
10,000
12,000
1998 1999 2000 2001 (est) 2002 2003 2004 2005 2006
U.S. Canada
History Projection
GLOBAL VEHICLE REMARKETING

Wholesale Market Trends
53

54
ADESA Analytical Services regularly provides coverage and analysis from the extensive AuctionNet data-
base of over five million annual transactions from nearly 150 of the largest U.S. auctions, including those
of ADESA as well as other auction companies. This data is supplemented with cross-sectional information
from ADESA’s database of approximately two million annual transactions taking place at ADESA’s network
of 52 auctions in the U.S. and Canada. In this section of GVR, we look at long-term trends in this data to
shed light on wholesale prices, volumes and other market metrics.
Analysis of AuctionNet Database
AuctionNet began issuing reports of auction transactions in 1993. Figure 45 shows average auction prices
according to those reports since that time.
AuctionNet Price Trends*
Figure 45 Source: AuctionNet and ADESA Analytical Services.
$0
$1,000
$2,000
$3,000
$4,000
$5,000
$6,000
$7,0007 000
$88,000
$99,000
$100,000
$11,000
$122,000
$13,000
Jan-93 Jan-94 Jan-95 Jan-96 Jan-97 Jan-98 Jan-99 Jan-00 Jan-01
*On vehicles up to seven model years old.
Ave
rag
e P
rice
GLOBAL VEHICLE REMARKETING

55
As the graph indicates, wholesale prices (on vehicles up to seven model years old) climbed steadily from
1993 through 1996, starting at an average of around $8,500 in 1993 to over $10,000 by 1996. This was a
period during which used vehicle demand grew as used car quality and affordability became more attrac-
tive. Wholesale prices began declining in 1997, as manufacturers increased new vehicle incentives just as
a large number of vehicles were coming off-lease. In 1998 and 1999, average prices began to increase again
as higher-priced SUVs began entering the used vehicle market at unprecedented levels. By 1999, average
prices had climbed above $11,000. This masked the fact that the underlying market was still soft due
to continued high new car incentives and high returning off-lease volumes.
By late 2000, the wholesale vehicle model class sales mix had reached a steadier state, and price declines
for SUVs drove market averages below $11,000. In late 2001, average prices plunged towards $10,000
primarily due to:
1. zero-percent financing incentives on new vehicles,
2. rental fleet downsizing in the aftermath of September 11, and
3. continued high volumes of off-lease units.
As of December 2001, average AuctionNet prices stood at $10,245, down 4.7% from $10,751
in December 2000.
Another trend that can be studied using AuctionNet data is the shift in age mix of wholesale vehicle
sales. Figure 46 shows AuctionNet sales volume trends by vehicle age.1
1 The percentages in the graph are based on sales of vehicles under seven model years old only. The percentages in the graphs wouldall be lower if they were stated in terms of all model years. Information on vehicles older than seven model years is unavailable forthe entire timeframe of this chart, but generally, these vehicles represent approximately 20% of total auction sales.
WHOLESALE MARKET TRENDS

56
The chart confirms the drop in program vehicle volume (0-1 year-old models) and dealer
trades (mostly older than three model years), and the gain in off-lease volume (initially,
mostly 2-3 year-olds, although more recently, there is a growing number of 4 year-old vehicles).1
Figure 47 shows how average mileage varied by vehicle age for 2001.
AuctionNet Volume Trends by Vehicle Age
(Percent of total sales of vehicles under seven model years only.)
Figure 46 Source: AuctionNet and ADESA Analytical Services.
49% 47% 45%41%
36% 34% 33% 31% 33%
18% 19% 24% 29% 36% 39% 40% 41% 38%
20% 18% 16% 17%16% 16% 17% 17% 17%
13% 16% 15% 14% 12% 11% 10% 11% 12%
0%
10%
20%
30%
40%
50%
60%
70%
80%
90%
100%
1993 1994 1995 1996 1997 1998 1999 2000 2001
0-1 year-old models 2-3 year-old models 4-5 year-old models 6-7 year-old models
1 In Pulse, ADESA Analytical Services regularly provides analysis of AuctionNet price trends by these age groupings,as well as by sale type, vehicle model class, and other relevant segments.
GLOBAL VEHICLE REMARKETING
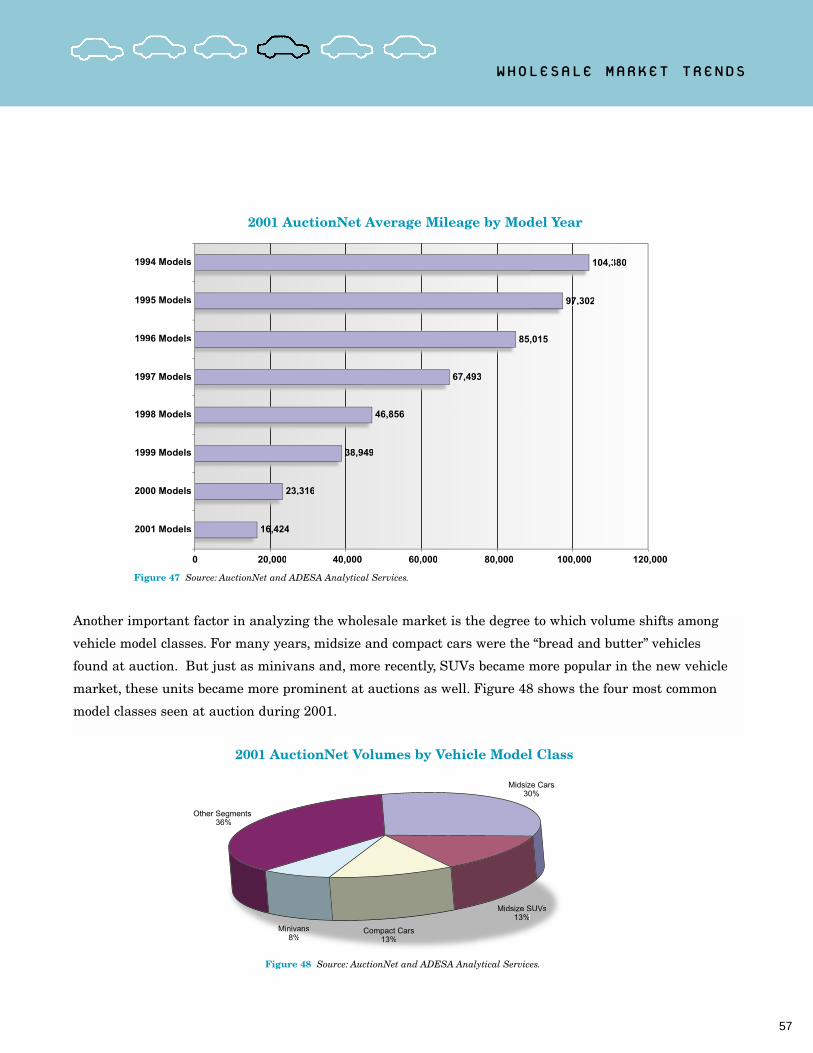
Another important factor in analyzing the wholesale market is the degree to which volume shifts among
vehicle model classes. For many years, midsize and compact cars were the “bread and butter” vehicles
found at auction. But just as minivans and, more recently, SUVs became more popular in the new vehicle
market, these units became more prominent at auctions as well. Figure 48 shows the four most common
model classes seen at auction during 2001.
57
2001 AuctionNet Average Mileage by Model Year
Figure 47 Source: AuctionNet and ADESA Analytical Services.
16,4246
23,316
38,9493
46,856
67,493
85,015
97,3027
380104,3
0 20,000 40,000 60,000 80,000 100,000 120,000
2001 Models
2000 Models
1999 Models
1998 Models
1997 Models
1996 Models
1995 Models
1994 Models
2001 AuctionNet Volumes by Vehicle Model Class
Midsize Cars30%
Midsize SUVs13%
Compact Cars13%
Minivans8%
Other Segments36%36%
WHOLESALE MARKET TRENDS
Figure 48 Source: AuctionNet and ADESA Analytical Services.

58
Price trends for these segments during 2000 and 2001 are shown in Figure 49.
AuctionNet Price Trends by Model Class
Figure 49 Source: AuctionNet and ADESA Analytical Services.
$0
$2,000
$4,000
$6,000
$8,000
$10,000
$12,000
$14,000
$16,000
Ave
rag
e P
rice
Compact Cars Midsize Cars Midsize SUVs Minivans
Jan-
00
Feb
-00
Mar
-00
Apr
-00
May
-00
Jun-
00
Jul-0
0
Aug
-00
Sep
-00
Oct
-00
Nov
-00
Dec
-00
Jan-
01
Feb
-01
Mar
-01
Apr
-01
May
-01
Jun-
01
Jul-0
1
Aug
-01
Sep
-01
Oct
-01
Nov
-01
Dec
-01
As the graph shows, prices for these segments dropped most precipitously in the weeks and months
following September 11.
Within these model classes, vehicles of various makes and models are sold. Figure 50 shows the top
25 vehicles sold at auction during 2001.
GLOBAL VEHICLE REMARKETING

59
Top 25 Auction Vehicles by Volume in 2001
Figure 50 Source: AuctionNet and ADESA Analytical Services.
Percent ofMake Model/Series Avg Price Total Volume Cumulative
1 FORD TAURUS-V6 $8,445 3% 3%2 TOYOTA CAMRY $9,083 2% 5%3 FORD TRUCK EXPLORER-V6 $11,708 2% 7%4 FORD TRUCK EXPLORER $11,507 2% 9%5 HONDA ACCORD $8,228 2% 11%6 FORD TRUCK WINDSTAR-V6 $10,673 2% 12%7 NISSAN ALTIMA-4 CYL. $8,896 1% 14%8 CHEVROLET TRUCK BLAZER-V6 $12,390 1% 15%9 FORD TRUCK EXPEDITION-V8 $17,960 1% 16%
10 TOYOTA COROLLA-4 CYL. $8,099 1% 18%11 FORD TRUCK F150 PICKUP $10,315 1% 19%12 FORD ESCORT-4 CYL. $5,403 1% 20%13 DODGE INTREPID-V6 $9,082 1% 21%14 MAZDA 626 $8,230 1% 22%
15 CHEVROLET MALIBU-V6 $9,008 1% 23%
16 SATURN SATURN-4 CYL. $5,882 1% 24%
17 PONTIAC GRAND AM SE-4 CYL. $8,897 1% 25%18 FORD TRUCK RANGER $7,428 1% 26%
19 MERCURY SABLE-V6 $9,571 1% 27%
20 CHEVROLET CAVALIER-L4 $6,302 1% 28%
21 FORD TRUCK F150 PICKUP-V8 $11,634 1% 29%
22 CHEVROLET LUMINA-V6 $7,044 1% 30%
23 PONTIAC GRAND PRIX-V6 $9,228 1% 31%
24 DODGE NEON-4 CYL. $5,760 1% 32%
25 JEEP GRAND CHEROKEE-6 CYL. $11,887 1% 33%
As the table shows, the top 25 vehicles represent one-third of total auction volume. Prices for these vehicles
vary greatly by model year, mileage, trim level, condition, sale type, region, seasonality, reconditioning level,
and other market factors.
WHOLESALE MARKET TRENDS

60
Analysis of ADESA Database
Analysis of auction price trends by major market segment is provided in Figure 51.
Auction Price Trends by Market Segment
(Average Prices)
Figure 51 Source: ADESA Analytical Services.
$4,000
$5,000
$6,000
$7,000
$8,000
$9,000
$10,000
$11,000
$12,000
$13,000
$14,000
$15,000
Program Off-Lease Commercial Fleet Rental Risk Dealer Consignment
Ja
n-0
0
Feb-0
0
Mar-
00
Apr-
00
May-0
0
Ju
n-0
0
Ju
l-0
0
Au
g-0
0
Se
p-0
0
Oct-
00
No
v-0
0
De
c-0
0
Ja
n-0
1
Fe
b-0
1
Ma
r-0
1
Ap
r-0
1
Ma
y-0
1
Ju
n-0
1
Ju
l-0
1
Au
g-0
1
Se
p-0
1
Oct-
01
No
v-0
1
De
c-0
1
Note that the highest priced vehicles on average are factory program vehicles and off-lease
vehicles, followed in descending order by rental risk, commercial fleet, and dealer consignment
units. Note also the steep drop in prices in October and November after the September 11
attacks. December results were encouraging, as prices rose across all market segments. This
is a positive indicator for the all-important spring market going into 2002.
Figure 52 provides Canadian auction price trends for dealer consignment vehicles. The graph
shows a similar drop after September 11 to that witnessed in the U.S. data, with a similarly
modest recovery in December.
GLOBAL VEHICLE REMARKETING

61
Conversion rates (sold volume as a percent of offered volume) are another key indicator of the robustness of
the auction market. This because when the bidding environment is strong (i.e., when there are large numbers
of potential buyers all bidding aggressively), higher prices are achieved and few vehicles are “no-saled” (not
sold because the seller’s price targets were not reached). High conversion rates, therefore, are a proxy for
dealer optimism, because more dealers attend auctions and bid aggressively when they know potential
retail profits are high. Sellers also become more accepting of the current price environment and begin to
acknowledge, “today’s dollar is your best dollar” by accepting prevailing bids rather than “no-selling” units.
Figure 53 provides an index of dealer optimism at auctions based on the year-on-year variance in dealer
consignment conversion rates at ADESA auctions.
Canadian Auction Price Trends ($ Canadian)
— Dealer Consignment Vehicles —
Figure 52 Source: ADESA Analytical Services.
$10,057$10,497
$11,195
$11,915$12,237 $12,084
$13,029
$11,945 $12,122
$10,279
$8,978$9,321
$00
$2,0000
$4,0000
$6,0000
$8,0000
$10,0000
$12,0000
$14,00000
Jan-01J 01 Feb-01F b 01 Mar-01M 01 Apr-01A 01 May-01M 01 Jun-01J 01 Jul-01J l 01 Aug-01A 01 Sep-01S 01 Oct-01O 01 Nov-01N 01 Dec-01D 01
WHOLESALE MARKET TRENDS

62
Dealer optimism at auctions by this measure was low in late-1996 to mid-1997, and this was also a period
of price softening. In late-1997 to mid-1999, dealer optimism and the market were strong. In late-1999 and
2000, large volumes of returning off-lease vehicles – especially sport utility trucks – dampened prices and
conversion rates dropped.
This continued into 2001 and prices dropped even more as new vehicle incentives rose during the recession
to keep new car sales from falling. The events of September 11 hurt dealer optimism as expressed by this
index even more. Thankfully, optimism improved in November and December.
Wholesale Market Outlook
The first year of the new millennium was certainly an unforgettable one for reasons well beyond the scope
of this report. Clearly, the onset of recession and war had impacts on the vehicle remarketing industry and
the automotive market it serves just as these factors affected every other sector of the U.S. and Canadian
economies. Similar to Detroit’s support of the war effort during World War II, the domestic manufacturers
implemented a plan designed to keep the economy “rolling” (and, of course, help increase their own sales
and market share), even as fiscal and monetary policies were seeming to have only minimal effect.
ADESA Auction Dealer Optimism Index
(Year-on Year % Pt Change in Dealer Consignment Conversion Rate)
Figure 53 Source: ADESA Analytical Services.
-10.0%
-8.0%
-6.0%
-4.0%
-2.0%
0.0%
2.0%
4.0%
6.0%
8.0%
Jan-9
6
Ma
r-96
Ma
y-9
6
Ju
l-96
Se
p-9
6
No
v-9
6
Jan-9
7
Ma
r-9
7
Ma
y-9
7
Ju
l-9
7
Se
p-9
7
No
v-9
7
Jan-9
8
Ma
r-9
8
Ma
y-9
8
Ju
l-9
8
Se
p-9
8
No
v-9
8
Jan-9
9
Ma
r-99
Ma
y-9
9
Ju
l-99
Se
p-9
9
No
v-9
9
Jan-0
0
Ma
r-00
Ma
y-0
0
Ju
l-00
Se
p-0
0
No
v-0
0
Jan-0
1
Ma
r-0
1
Ma
y-0
1
Ju
l-0
1
Se
p-0
1
No
v-0
1
GLOBAL VEHICLE REMARKETING
A D E S A2001 Auction Dealer Optimism Index Jan Feb Mar Apr May Jun Jul Aug Sep Oct Nov Dec%Pt Change in Dealer Consignment -0.4% -4.2% -4.1% -1.3% -1.9% -4.6% -4.5% -3.0% -6.3% -9.1% 1.1% 1.3%

63
This commendable initiative, nonetheless, had some negative implications for vehicle remarketing, as thou-
sands of trade-ins suddenly entered the market. Dealers attempting to wholesale these vehicles at auction
got a case of “reverse sticker shock” as they realized these units, which were often late-model used cars, had
to compete with already high levels of off-lease volume and heavy auction volumes from rental fleet down-
sizing in the aftermath of September 11.
At this juncture (early 2002) this “bubble” of oversupply has already been worked off. As zero-percent financ-
ing programs end, we believe more consumers will be attracted to used vehicles – especially in light of the
still-soft economy. Manufacturers may help franchised dealers sell new car trades and auction purchases
through renewed emphasis on certified pre-owned programs as well as favorable used car finance rates.
Savvy dealers who bought low during the period of oversupply should be able to weather inventory holding
periods because of low interest rates for dealer flooring. These dealers will be able to recoup their purchase
and holding costs and generate attractive gross profits that will drive subsequent auction purchases --
especially during the spring. Auction prices and conversion rates should continue to improve gradually,
although they will remain limited by still-high levels of new car incentives and off-lease volumes.
As we move into the middle of 2002, ADESA Analytical Services expects that an improving economy will
generate still more used car traffic, which will result in a better balance between used vehicle supply and
demand. More conservative residual values on 36-month leases written in 1999 should better match mar-
ket values, which will be a welcome prospect for lessors in 2002. With most analysts forecasting a new
vehicle sales year under 16 million units, down over one million units from 2001, new car incentives are not
going away any time soon, as manufacturers fight to maintain sales and market share. However, currently
low new car inventories, as well as scheduled and announced cutbacks in production, may limit incentives
to more tolerable levels, as new car supply is better balanced to reduced new car demand.
In the longer run, the falloff in lease penetration in favor of low-rate installment loan financing will mean
longer cycle times and fewer off-lease vehicles returning to the used vehicle market. Along with projected
declines in new car sales to long-term trend levels for the next few years – after three 17 million-unit sales
years in a row – these late-model supply reductions should allow overall used vehicle prices to return to
positive growth rates.
In short, 2002 should be a pivotal year in the used car market as several months of severe price declines
come to an end and wholesale market values are restored to positive, albeit moderate, growth. As always,
it will be important to study how these overall trends vary by market and vehicle model class segment, and
this will remain a key focus area for our quarterly publication, Pulse, as well as other ADESA Analytical
Services reports. Please stay tuned.
WHOLESALE MARKET TRENDS

64
GLOBAL VEHICLE REMARKETING
About the Author
Tom Kontos is Vice President, Industry Relations & Analytical Services with ADESA Corporation. In this
position, Mr. Kontos interfaces with members of the media, Wall Street and automotive analysts, and key
ADESA clients to provide information and insight on economic trends in the vehicle remarketing industry,
of which ADESA is a major player. Mr. Kontos also provides analytical services to internal and external
ADESA audiences in the form of annual market reports, periodic reports on used vehicle price trends,
web-based information products, dealer surveys, and other strategic studies.
Prior to joining ADESA, Mr. Kontos helped launch and was the principal author of the ADT Automotive
Used Car Market Report – a comprehensive annual analysis of strategic trends and issues relating to
the 40-million-unit US used vehicle market. The publication, which Mr. Kontos saw through five editions,
was extremely well received by the automotive industry, often cited in the trade press, and honored with
research awards. His new report series for ADESA, Global Vehicle Remarketing, has followed suit, recently
winning the prestigious Keystone Award from the Public Relations Society of America for excellence in an
investor relations project.
Mr. Kontos has more than 18 years experience in market research, financial analysis, and strategic
planning. In addition to his automotive industry experience, he has conducted economic analysis of the
mining, agricultural, and construction sectors through his experience with W.R. Grace & Co., Vulcan
Materials Company, and Rogers Group, Inc.
A native of Washington, D.C., Mr. Kontos holds Bachelor and Master of Science degrees in Mineral
Resource Economics from The Pennsylvania State University. He has taught at Birmingham-Southern
College and Trevecca University and is enrolled in the Masters of Liberal Arts and Science program at
Vanderbilt University. He resides with his wife, Rhonda, and two children, Alyssa and Theo, on their small
horse-farm in Noblesville, Indiana.

65
ABOUT ADESA AND ALLETE AUTOMOTIVE SERVICES
ADESA Corporation, based in Indianapolis, Indiana, is a wholly owned subsidiary of ALLETE, Inc. ADESA
Corporation is the only vehicle remarketing company in the U.S. and Canada with leading positions in both:
1. wholesale used vehicle auctions at 52 locations, and
2. total loss recovery (salvage) operations (ADESA IMPACT) at 24 locations.
These strategically located facilities provide a full range of logistical and vehicle reconditioning services in
addition to hosting large-volume, wholesale auctions. ADESA also has affiliate businesses in automotive
finance (AFC), vehicle inspections (AutoVIN), remarketing, repossession and titling services (PAR), vehicle
transportation and logistical services (Great Rigs), vehicle importation (AIS), eServices, and commercial
remarketing services (CRS). Combined with these businesses, ADESA’s 76 strategically located used vehicle
and salvage auctions represent North America’s leading remarketing services network.
• ADESA IMPACT operates 24 salvage auctions throughout the U.S. and Canada, making ADESA
the third largest salvage auction company in North America. ADESA’s recent acquisition of
ComSearch, Inc. provides Internet-based technology in the related auto parts location and
insurance adjustment business. ComSearch is a used parts locator connecting 2,500 salvage
yards across the U.S.
• Automotive Finance Corporation (AFC). AFC is the largest provider of floor planning for
independent car dealers in North America. Floor planning is the provision of 30 to 45 day inventory
loans for approved dealers. After approval, dealers may purchase their inventory from over 400
auctions and other locations that have been pre-approved.
• AutoVIN vehicle inspection services, which provides electronically transmitted inspection reports
and digital images.
• PAR North America. PAR is a network of strategic auction locations nationwide, handling a broad
range of vehicle remarketing needs. PAR provides services to banks and other financial
institutions, fleet-lease companies, and manufacturers who wish to outsource their remarketing
functions. Services provided by PAR include transportation, lease-end pickup, repossession, recondi-
tioning and coordinated auction selection and sales services. PAR also provides comprehensive title
services and pre-term, lease-end processing, as well as auction sale administration and personal
representation on sale day, with 48-hour turn-around of sale proceeds. PAR’s affiliation with
EndTrust Lease End Services further expands its capabilities into the areas of lease portfolio
risk analysis and optimization.

ABOUT ADESA AND ALLETE AUTOMOTIVE SERVICES
66
• Great Rigs. With over 130 rigs, Great Rigs is one of the nation’s largest independent auto
transporters, specializing in business-to-business moves of all types. Based in Birmingham,
Alabama, the company offers nationwide auto transport pick-up and delivery services through
strategically placed terminals across the United States.
• ADESA Importation Services (AIS). Headquartered in Flint, Michigan with importation facilities
in Buffalo, New York, Flint, Michigan, Grand Forks, North Dakota, Sweetgrass, Montana and
Blaine, Washington, AIS imports vehicles from coast to coast and is the U.S.’s largest registered
independent, commercial importer. The company provides a full range of importation services,
including marshalling, transportation, brokerage, titling, tax processing, and speedometer/odometer
conversions from metric to the U.S. measuring system.
• ADESA eServices. ADESA has a full array of eServices that allow dealers to preview inventories
in upcoming auction sales, bid on and purchase vehicles online, review auction market reports, and
better manage their dealership operations – all from their portable or desktop computers. Sellers
can use ADESA eTools to sell their inventories on various remarketing web sites and manage their
auction inventories using AASC’s AutoIMS (Auto Auction Services Corporation’s Inventory
Management System).
• ADESA Commercial Remarketing Services (CRS). CRS is a heavy and medium duty truck and
trailer auction company that sells through seven fixed-site auctions across the country. ADESA CRS
provides a series of support services to the heavy duty truck industry, including strategically located
repossession drop sites, comprehensive condition assessments, reconditioning services, Internet sale
inventory and live auction sales.
ALLETE, Inc., based in Duluth, Minnesota, is a uniquely diversified corporation with energy and automotive
services at its core. Its workforce of 14,000 employees is engaged in providing electric power to people and
businesses in the upper Midwest and a full range of automotive services in 42 states and Canada. Besides
the automotive services holdings described above, ALLETE’s holdings include an electric utility, Minnesota
Power, that serves 145,000 residents of Minnesota and Wisconsin and some of the nation’s largest industrial
customers. ALLETE also owns Enventis Telecom, a growing fiber optic communications provider, and BNI
Coal of North Dakota. Other ALLETE investments include short-term securities, a stake in several
electro-technology companies, Florida real estate and water resource holdings in the Southeastern U.S.
The statements contained in this report and statements that the company may make orally in connection with this report that are nothistorical facts are forward-looking statements. Actual results may differ materially from those projected in the forward-looking state-ments. These forward-looking statements involve risk and uncertainties and investors are directed to the risks discussed in documentsfiled by ALLETE, Inc, ADESA Corporation’s parent company, with the Securities and Exchange Commission.

NOTES

NOTES

ADESA Ark-La-Tex 318-938-7903ADESA Atlanta 770-251-9881ADESA Austin 512-873-4000ADESA Birmingham 205-640-1010ADESA Boston 508-626-7000ADESA Buffalo 716-542-3300ADESA Calgary 403-912-4400ADESA Charlotte 704-587-7653ADESA Cincinnati/Dayton 513-746-4000ADESA Clearwater 727-573-3630ADESA Cleveland 330-467-8280ADESA Colorado Springs 719-391-6600ADESA Concord 978-263-7400ADESA Dallas 972-288-7585ADESA Des Moines 515-986-1200ADESA Edmonton 780-465-4900ADESA Golden Gate 510-657-5660ADESA Halifax 902-873-3686ADESA Houston 281-580-1800ADESA Indianapolis 317-838-8000ADESA Jacksonville 904-764-1004ADESA Kansas City 816-525-1100ADESA Kitchener 519-622-9500ADESA Knoxville 865-988-8000ADESA Lansing 517-322-2444ADESA Lexington 606-263-5163ADESA Little Rock 501-945-2444ADESA Los Angeles 909-361-9400ADESA Memphis 901-365-6300ADESA Moncton 506-857-0198ADESA Montreal 450-472-4400ADESA New Jersey 908-725-2200ADESA Ocala 352-351-5100ADESA Orlando-Sanford 407-323-4090ADESA Ottawa 613-443-4400ADESA Phoenix 480-961-1161ADESA Pittsburgh 724-662-4500ADESA Sacramento 916-388-8899ADESA San Antonio 210-434-4999ADESA San Diego 619-661-5565ADESA Saskatoon 306-242-8771ADESA Seattle 253-735-1600ADESA Southern Indiana 812-526-9731ADESA St. John's 709-364-3250ADESA St. Louis 314-475-9311ADESA Tampa 813-620-3600ADESA Toronto 905-790-7653ADESA Tulsa 918-437-9044ADESA Vancouver 604-525-6371ADESA Vancouver CAG 604-580-0011ADESA Winnipeg 204-697-4400ADESA Wisconsin 608-742-8245
ADESA Impact East Providence 401-434-8760ADESA Impact East Taunton 508-823-7440ADESA Impact Salem 603-893-2300ADESA Impact Clinton 207-126-2004ADESA Impact Saco 207-283-1141ADESA Impact Essex 802-872-7838ADESA Impact Jacksonville 904-764-1004ADESA Impact Montgomery 914-567-6360ADESA Impact Colonie 518-861-5171ADESA Impact Miami 305-685-6363ADESA Impact Concord 508-823-7440ADESA Impact Buffalo 716-542-6859Impact Calgary 403-285-1411Impact Edmonton 780-451-8015Impact Halifax 902-873-3933Impact Hamilton 866-467-2284Impact London 519-457-4125Impact Moncton 506-855-5297Impact Montreal 405-452-4043Impact Ottawa 613-443-3171Impact Sudbury 705-560-2723Impact Toronto 905-642-2882Impact Vancouver 403-285-1411Impact Quebec City 405-452-4043
Corporate Headquarters:U.S. (Indianapolis) 317-815-1100Canada (Mississauga) 905-896-4400
ADESA Salvage Auction ADESA Vehicle Auction
ADESA Vehicle Auction
ADESA Salvage Auction
ADESA Salvage/Vehicle Auction

310 E. 96TH STREET SUITE 400, INDIANAPOLIS, IN 46240 WEB ADDRESS: WWW.ADESA.COM
GL
OB
AL
VE
HI C L E R E M
AR
KE
TI
NG
GVR