food authenticity and adulteration testing using trace...
TRANSCRIPT

The world leader in serving science
Food authenticity and adulteration testing using trace elemental and inorganic mass spectrometric techniques
Michal Godula, Ph.D.
Thermo Fisher Scientific
2
Overview
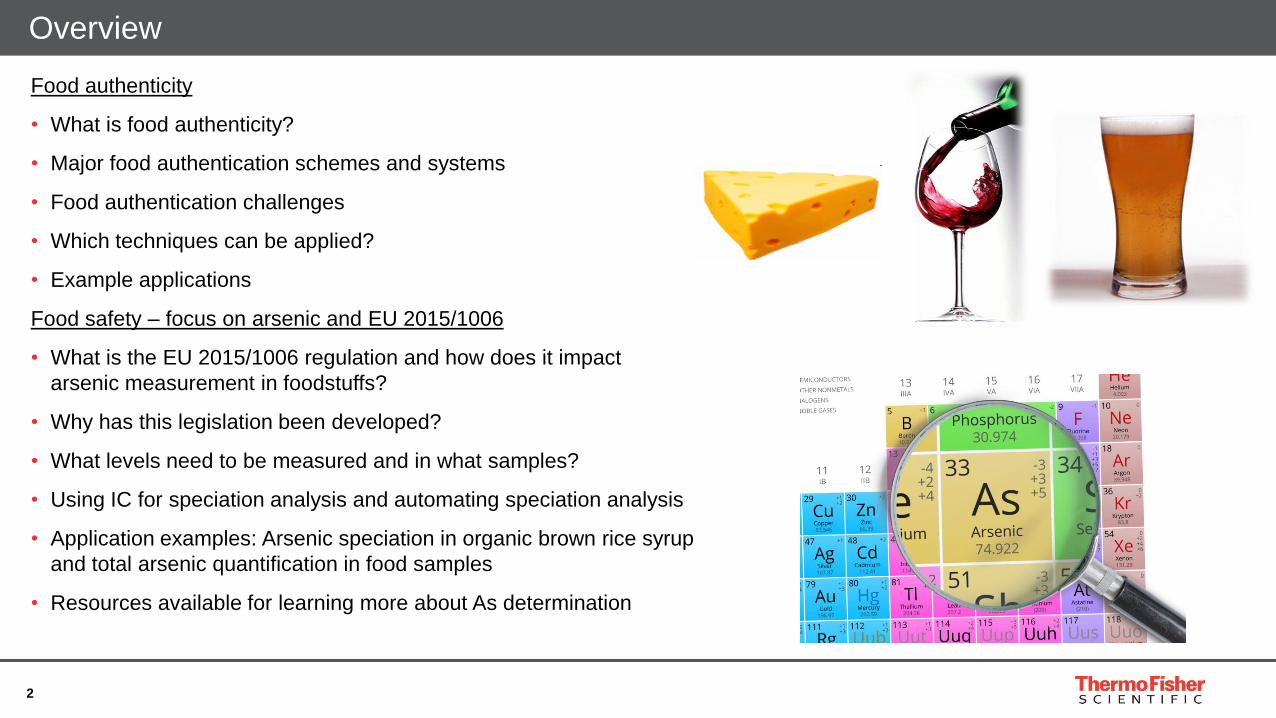
Food authenticity
• What is food authenticity?
• Major food authentication schemes and systems
• Food authentication challenges
• Which techniques can be applied?
• Example applications
Food safety – focus on arsenic and EU 2015/1006
• What is the EU 2015/1006 regulation and how does it impact
arsenic measurement in foodstuffs?
• Why has this legislation been developed?
• What levels need to be measured and in what samples?
• Using IC for speciation analysis and automating speciation analysis
• Application examples: Arsenic speciation in organic brown rice syrup
and total arsenic quantification in food samples
• Resources available for learning more about As determination

3
What is food authenticity?
• Food authenticity is about misrepresentation by either mislabeling or by
adulterating, usually with lower cost material
• Typical examples:
− Wine authenticity – illegal sugar addition to grape juice
− Addition of sugar to honey
− Addition of hazelnut oil to olive oils
− Mislabeling geographical origin (wine, olive oil)
− Mislabeling organic food products
− Adulteration of meat with cheaper species

4
Major food authentication schemes and systems
• Protected Designation of Origin (PDO)
covers agricultural products and foodstuffs which are produced, processed and
prepared in a given geographical area using recognized know-how.
• Protected Geographical Indication (PGI)
covers agricultural products and foodstuffs closely linked to the geographical area.
At least one of the stages of production, processing or preparation takes place in
the area.
• Traditional Speciality Guaranteed (TSG)
highlights traditional character
• DOOR (Database of Origin and Registration) Database
> 1200 entries for different foods (e.g olive oils, wines, cheeses, honey, beer)
from multiple countries
See http://ec.europa.eu/agriculture/quality/ and http://ec.europa.eu/idabc/en/document/5360/5637.html for further information
Council Regulation (EC) No 510/2006
of 20 March 2006
Council Regulation (EC) No 509/2006
of 20 March 2006

5
Food authentication challenges
• Chemically identical foods or identical chemical entities
• Unique marker compounds rarely found - more often small analytical differences (isotopic patterns)
• Large natural variability based on climatic conditions, fertilizers used, variety, processing……
• Techniques must be able to distinguish small differences
• Databases of authentic foods must be available to understand natural variability
6
Which techniques can be applied?
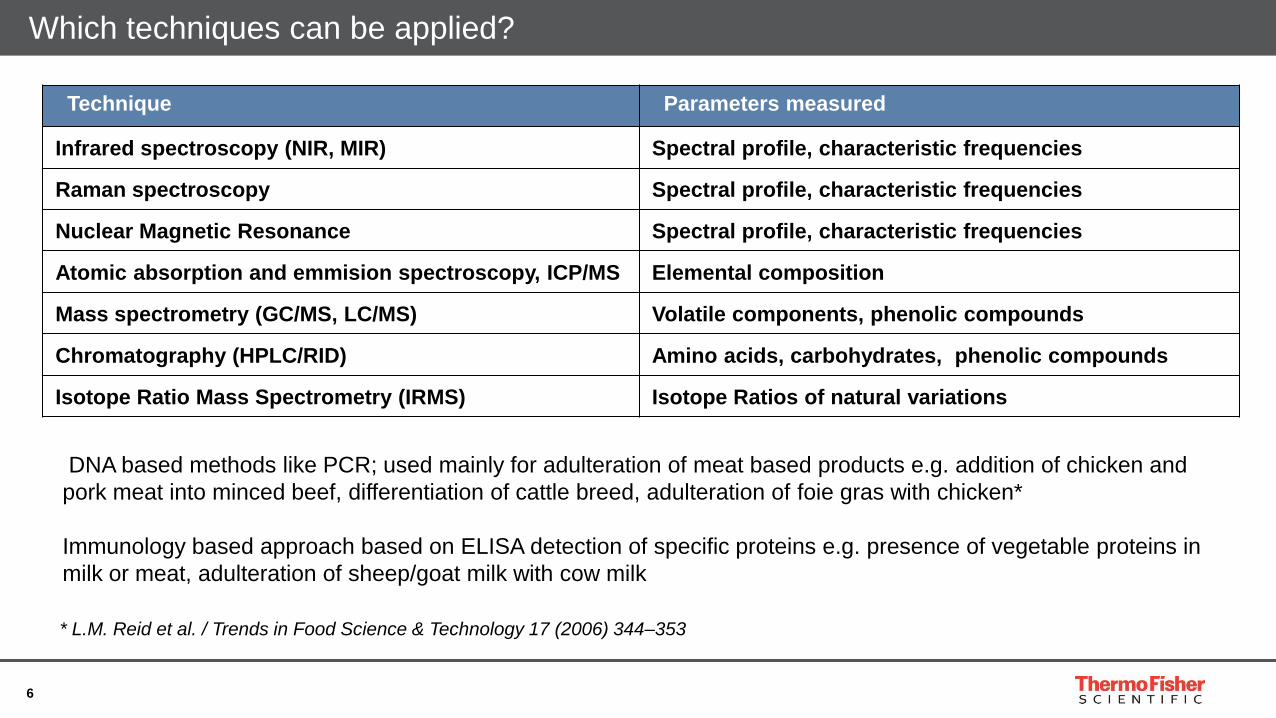
Technique Parameters measured
Infrared spectroscopy (NIR, MIR) Spectral profile, characteristic frequencies
Raman spectroscopy Spectral profile, characteristic frequencies
Nuclear Magnetic Resonance Spectral profile, characteristic frequencies
Atomic absorption and emmision spectroscopy, ICP/MS Elemental composition
Mass spectrometry (GC/MS, LC/MS) Volatile components, phenolic compounds
Chromatography (HPLC/RID) Amino acids, carbohydrates, phenolic compounds
Isotope Ratio Mass Spectrometry (IRMS) Isotope Ratios of natural variations
DNA based methods like PCR; used mainly for adulteration of meat based products e.g. addition of chicken and
pork meat into minced beef, differentiation of cattle breed, adulteration of foie gras with chicken*
Immunology based approach based on ELISA detection of specific proteins e.g. presence of vegetable proteins in
milk or meat, adulteration of sheep/goat milk with cow milk
* L.M. Reid et al. / Trends in Food Science & Technology 17 (2006) 344–353

7
Data analysis: Chemometric approach
• Large number of variables involved, e.g. delta value, elemental composition,
mass spectra, compound concentration etc.
• Multivariate analysis must be applied
• Supervised or unsupervised methods
• Unsupervised: classification of sample without any knowledge about the origin
• Supervised: similarity of unknown to authentic material
• Choosing appropriate approach is the key to successful analysis
Unsupervised methods
• ANOVA, MANOVA
• Principal Component Analysis (PCA) - reduces dimensionality
• Cluster Analysis (CA) - grouping of samples based on their similarity
Supervised methods (discriminant techniques)
• Linear discriminant analysis (LDA) - characterize or separate two or more classes
• Partial Least Squares (PLS) - fundamental relations between two matrices
• Artificial Neural Networks (ANN) - complex relationships modelling
Gonzalves, A, Trends in Analytical
Chemistry, Vol. 28, No. 11, 2009

8
Isotopes - sources of variation
9
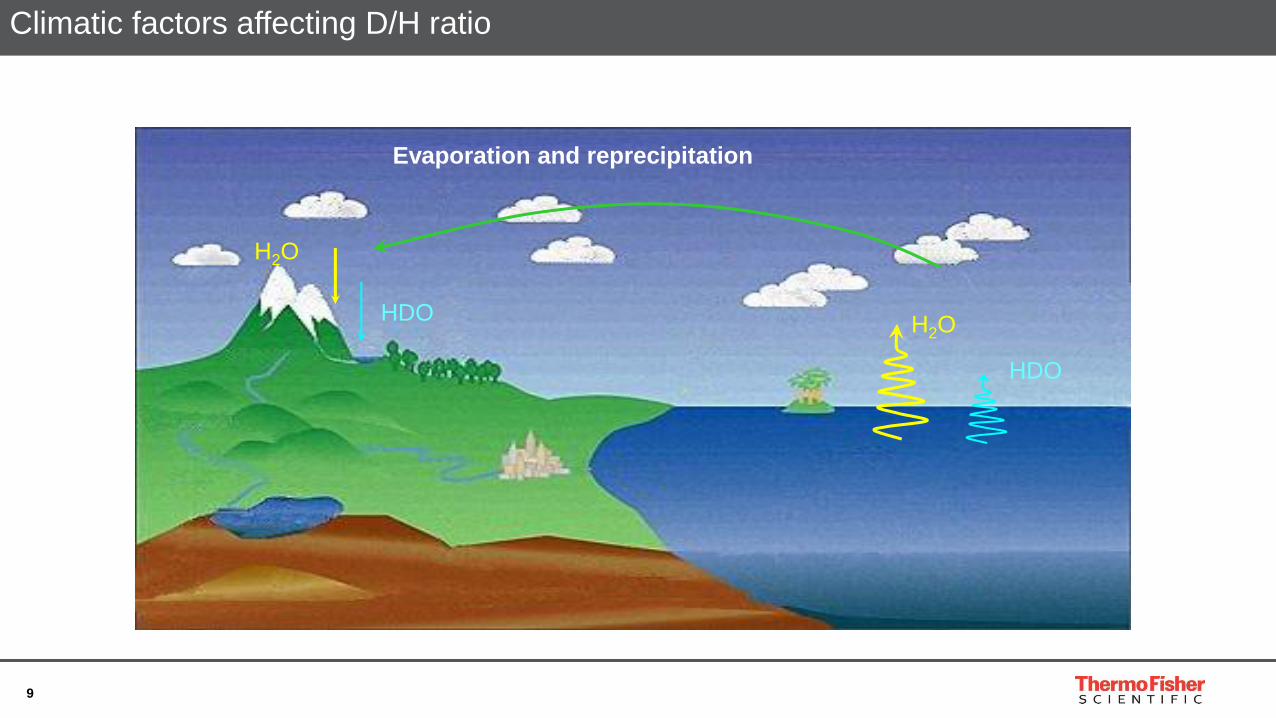
H2O
HDO
HDO
H2O
Evaporation and reprecipitation
Climatic factors affecting D/H ratio

10
Produced by James Elhringer (University of Utah)
Interpolated 2H of precipitation

11
IRMS – information delivered
That‘s where the information is
• Precise isotope ratios of
Element Minor Isotope Natural Abundance [%]
Hydrogen 2H (D) 0.01557
Carbon 13C 1,11140
Nitrogen 15N 0.36630
Oxygen 18O 0.20004
Sulfur 34S 4.21500

12
Capillary Reactor
DELTA V
GC Separation Elemental Analyzer
Conversion
Ref. gases
Open
Split
Reactor
On-line
Conversion GC Separation
of complex mixtures
2H and 18O or
13C, 15N and 34S
2H or 18O or 13C or 15N
of all Compounds
BSIA Bulk
Stable
Isotope
Analysis
CSIA Compound
Specific
Isotope
Analysis
DELTA V
Ref. gases
Open
Split
Different approaches to IRMS
13
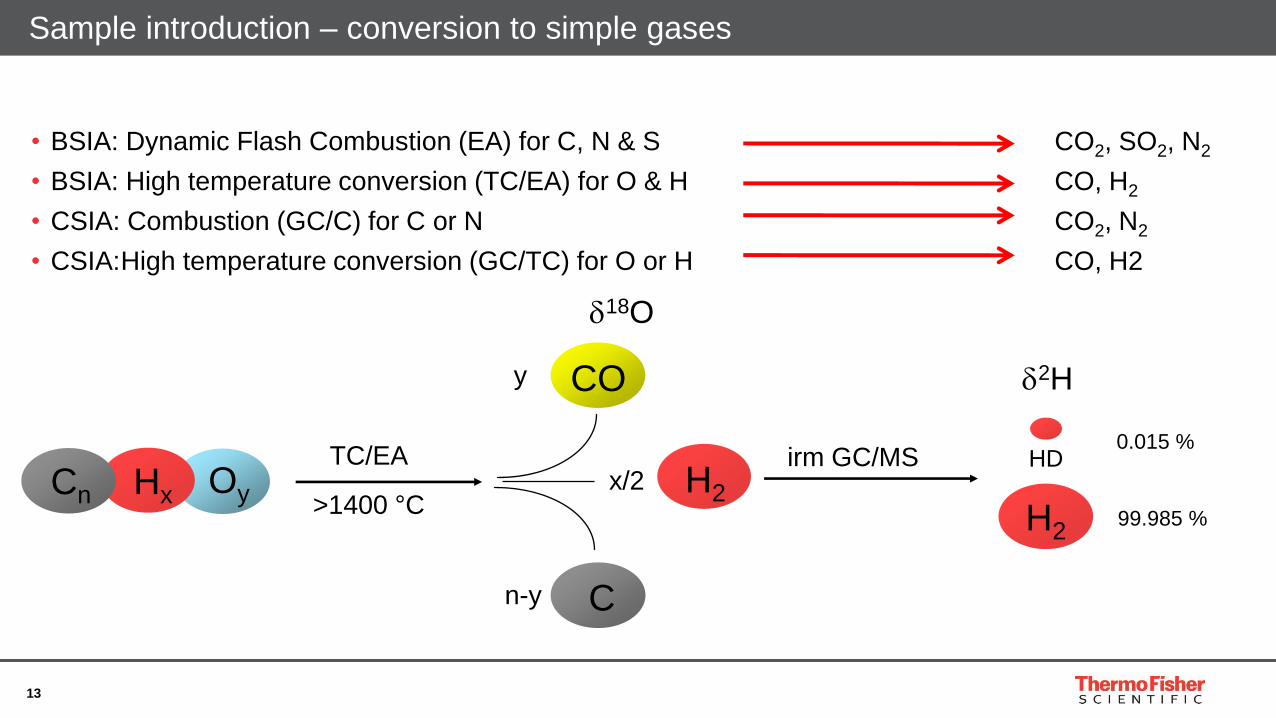
• BSIA: Dynamic Flash Combustion (EA) for C, N & S CO2, SO2, N2
• BSIA: High temperature conversion (TC/EA) for O & H CO, H2
• CSIA: Combustion (GC/C) for C or N CO2, N2
• CSIA: High temperature conversion (GC/TC) for O or H CO, H2
Sample introduction – conversion to simple gases
Cn
TC/EA Hx Oy H2
x/2
CO y
C n-y
>1400 °C
irm GC/MS 0.015 %
2H
99.985 % H2
HD
18O

14
Multi collectors for simultaneous detection
H2
N2
CO
O2
CO2
SO2
Principles of multicollector IRMS

15
Bulk Stable Isotope Analysis: The Thermo Scientific™ EA IsoLink™ IRMS System
• Allows simultaneous determination of C,
N and S or O and H
• CNS analysis in less than 10 mins, including
a very small sample amounts (< 5 μg)
• Provides chromatographic profile of the
sample AND isotopic ratio information
• Helium Management (HeM) Module offers
> 60% He saving
• All-in-one fully automated, modular EA–IRMS
solution for all CNSOH applications
For further information go to www.thermofisher.com and search for EA IsoLink IRMS

16
EA–IRMS: C analysis of ethanol
• δ13C can be used to determine if wines have been adulterated with sugar
• See Applications note AN30147

17
EA–IRMS: δ15N in tomatoes
• Depending on the fertilizer the N isotope signature in plants can differ. Mineral fertilizers show
low δ15N values while organic fertilization by compost results in higher δ15N values.
• This allows discrimination of organic from non-organic produced vegetables.
0.0
2.0
4.0
6.0
8.0
10.0
12.0
15N
[‰]

18
EA–IRMS: H and O in hazelnut oil
• Edible oils are commonly protected by regional designations (PDO) and subject to strong quality
controls. This makes them a target for fraud. The example shows that O and H isotopes can
distinguish between oils of different geographical origin.

19
Extending the application of EA-IRMS: Honey adulteration
• Problem: Addition of cheap sugars to honey
• Current analytical approach:
• EA-IRMS to assess 13C value of honey and its protein fraction (limit of
detection ~ 7% of C4 sugar addition)
• Low sensitivity for sugars analysis, so need an enhanced approach
• Solution: irm-LC/MS using the LC IsoLinkTM interface allows:
• Comparison of 13C value of different sugars
• Determination of the sugar pattern
• Higher sensitivity - 100x more sensitive than direct EA-IRMS
• See our application note AN30024 - Testing honey adulteration by
δ13C-EA/LC-IRMS for full details

20
Honey adulteration examples
Honey 1 Honey 2 Honey 5
TMO appnot e30024
21
Summary and conclusions
• Isotope Ratio Mass Spectrometry shown to be an ideal approach for
food authenticity testing
• Provides high isotope ratio accuracy and precision enabling clear identification of
adulteration or provenance of food products
• Covers a wide range of isotope groups – C, H, N, S and O