energy outlook 2030 - bp · 2025. oil . coal . gas . hydro . nuclear . ... share of power...
TRANSCRIPT

January 2013

© BP 2013
Contents
Introduction
Global energy trends
Outlook 2030: Fuel by fuel
Implications
Energy Outlook 2030

© BP 2013
Introduction
Global energy trends
Outlook 2030: Fuel by fuel
Implications
Energy Outlook 2030

© BP 2013
0
3
6
9
12
1990 2010 2030
OECDnon-OECD
0
2
4
6
8
1990 2010 2030
OECDNon-OECD
0
25
50
75
100
1990 2010 2030
OECDNon-OECD
Population, income and energy growth
Energy Outlook 2030
Billion
Population GDP
Trillion $2011 PPP Billion toe
Primary energy

© BP 2013
Industrialisation drives energy growth
OECD
Non-OECD
Billion toe
Energy Outlook 2030
0
3
6
9
12
15
18
1990 2010 2030
OECD
Non-OECD
0
3
6
9
12
15
18
1990 2010 2030
Other
Power generation
Transport
By primary use By fuel By region
Oil
Coal
Gas
Billion toe Billion toe
Industry
0
3
6
9
12
15
18
1990 2010 2030
Hydro Nuclear
Renew.*
Oil
Coal
Gas
*Includes biofuels

© BP 2013
The power sector leads primary energy growth
Growth by sector and fuel, 2011-2030
Growth by sector and region, 2011-2030
-1
0
1
2
3
Tra
nsp
ort
Ind
ust
ry
Oth
er
Po
wer
Hydro
Nuclear
Renew.
Electricity
Gas
Biofuels
Oil
Coal
Final energy use Inputs to power
Billion toe
-1
0
1
2
3
Tra
nsp
ort
Ind
ust
ry
Oth
er
Po
wer
RoW
Middle East
China &India
OECD
Final energy use Inputs to power
Billion toe
Energy Outlook 2030

© BP 2013
0
3
6
9
12
15
18
1990 2000 2010 2020 2030
FSU
S&C America
N. America
Middle East
Europe
Asia Pacific
Africa
Emerging economies dominate energy production
OECD
Non-OECD
Billion toe
Energy Outlook 2030
0
3
6
9
12
15
18
1990 2000 2010 2020 2030
OECD
Non-OECD
Billion toe

© BP 2013 Energy Outlook 2030
Shares of world primary energy
0%
10%
20%
30%
40%
50%
1965 1980 1995 2010 2025
Oil
Coal
Gas
Hydro
Nuclear Renewables*
*Includes biofuels
Fuel shares and energy prices
0
20
40
60
80
100
120
1965 1980 1995 2010
Oil - Brent
Gas - basket
Coal - basket
Energy prices $2011/boe

© BP 2013 Energy Outlook 2030
0.0
0.1
0.2
0.3
0.4
0.5
1870 1890 1910 1930 1950 1970 1990 2010 2030
Energy intensity by region
Toe per thousand $2011 GDP (PPP)
China
US
World EU*
0
50
100
150
200
0
10
20
30
40
50
1970 1990 2010 2030
GDP (RHS)
Energy
Energy and GDP
Billion toe Trillion $2011 (PPP)
Energy efficiency improvements
*Euro4 (France, Italy, Germany, UK) pre-1970

© BP 2013
Energy supply growth
12
13
14
15
16
17
2011 OECD Non-OECD
2011 Oil Naturalgas
Coal Non-fossil
Demand Supply
Energy Outlook 2030
Tight Other
Shale
Other
Nuclear Hydro
Renew.*
Billion toe
2030 level
*Includes biofuels

© BP 2013
0
20
40
60
Asi
a P
acif
ic
N. A
mer
ica
S. &
C.
Am
eric
a
Afr
ica
Eu
rop
e &
Eu
rasi
a
Mid
dle
Eas
t
GasOil
Shale gas and tight oil: resources and production
Billion toe
Current resources Production in 2030
Energy Outlook 2030
0.0
0.3
0.6
0.9
Asi
a P
acif
ic
N. A
mer
ica
S. &
C.
Am
eric
a
Afr
ica
Eu
rop
e &
Eu
rasi
a
Mid
dle
Eas
t
Billion toe

© BP 2013
US tight oil and shale gas: infrastructure requirements
Onshore oil & gas rigs 2011
Thousands
Oil wells drilled and output
0
1
2
3
4
5
0
3
6
9
12
15
Bakken Canada Colombia
2012* 20112010 Output
Mb/d
Energy Outlook 2030
(RHS)
0.0
0.5
1.0
1.5
2.0
Thousands
*Annualised from 1Q-3Q data

© BP 2013
Introduction
Global energy trends
Outlook 2030: Fuel by fuel
Implications
Energy Outlook 2030

© BP 2013
0%
2%
4%
6%
8%
10%
0%
20%
40%
60%
1965 1978 1991 2004 2017 2030
Oil as % of primary energyOil cost as % of GDP (RHS)
High oil prices are reducing oil’s share of primary energy
0%
25%
50%
75%
100%
1965 1978 1991 2004 2017 2030
Power
Other
Industry
Transport
% of energy
Oil share in sector Oil share of energy and GDP
% of GDP
Energy Outlook 2030

© BP 2013
0
1
2
3
1990 2010 2030
Electricity
Gas
Coal
Biofuels
Oil - road
Oil - non-road0
3
6
9
12
1995 2005 2015 2025
EUUS light vehiclesChina
Global transport demand
Transport demand by fuel
Billion toe
Fuel economy of new cars
Litres per 100 km
Energy Outlook 2030

© BP 2013
0%
2%
4%
6%
8%
10%
0
2
4
6
8
10
2000 2010 2020 2030
ChinaRussiaS. AmericaN. America
Liquids supply by type
30%
45%
0
15
30
45
60
75
90
105
1990 2000 2010 2020 2030
OPEC NGLs
OPEC crude
Biofuels
Oil sands
Tight oil
Other non-OPEC
Mb/d
NGLs
OPEC share (RHS)
Global supply growth and tight oil
Energy Outlook 2030
Tight oil output
% of total (RHS)
Mb/d

© BP 2013
Role of the Americas
-3
0
3
6
9
12
15
18
1990-00 2000-10 2010-20 2020-30
Americas EuropeFSU Middle EastAfrica Asia Pacific
Supply growth by decade
Mb/d
15
20
25
30
35
1990 2000 2010 2020 2030
Americas
Middle East
Americas surpass Middle East
Mb/d
Energy Outlook 2030
© BP 2013
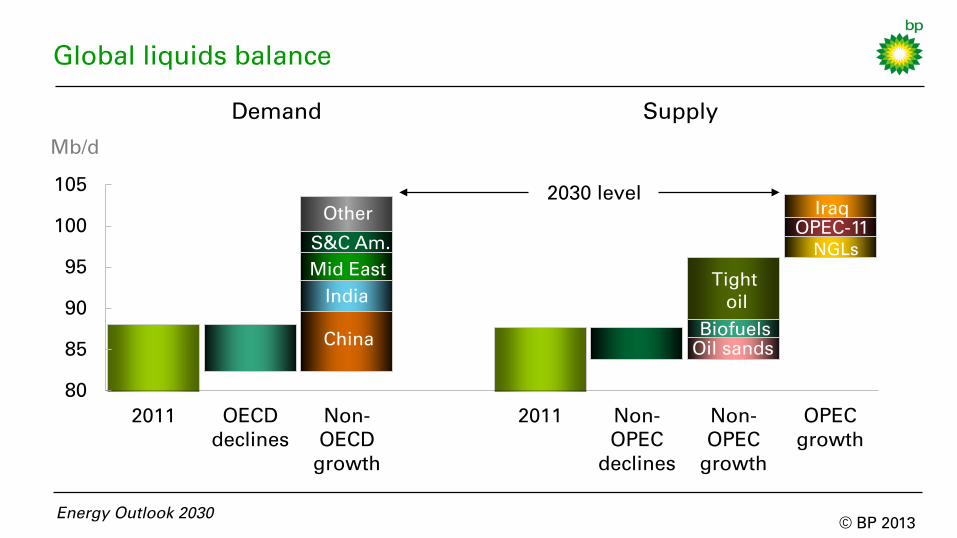
Global liquids balance
80
85
90
95
100
105
2011 OECDdeclines
Non-OECD
growth
2011 Non-OPEC
declines
Non-OPEC
growth
OPECgrowth
Mb/d
Demand Supply
India Mid East
China
NGLs OPEC-11
Other
S&C Am.
NGLs Iraq
2030 level
Energy Outlook 2030
Tight oil
Biofuels Oil sands

© BP 2013
27
30
33
36
0
3
6
9
2000 2010 2020 2030
Spare capacityCall on OPEC (RHS)
Unconventional oil and the call on OPEC
Mb/d
Call on OPEC & spare capacity
Mb/d
Unconventionals share of net global supply growth
0%
25%
50%
75%
100%
2000-10 2010-20 2020-30
Biofuels
Oil sands
Tight oil
Energy Outlook 2030

© BP 2013
Shale gas and global supply growth
Energy Outlook 2030
Bcf/d
Gas production by type and region
0
100
200
300
400
500
1990 2000 2010 2020 2030
Non-OECD otherNon-OECD shaleOECD shaleOECD other
0%
6%
12%
18%
0
20
40
60
80
1990 2000 2010 2020 2030
RoWChinaEurope & EurasiaCanada & MexicoUS
Shale gas production
Bcf/d
% of total (RHS)

© BP 2013 Energy Outlook 2030
-20
0
20
40
60
80
100
120
1990 2010 2030
Net pipeline importsNet LNG importsShale gas productionOther domestic production
Energy Outlook 2030
Shale gas: regional growth
Bcf/d China Bcf/d N. America Bcf/d EU
Sources of gas supply, by region
-20
0
20
40
60
80
100
120
1990 2010 2030-20
0
20
40
60
80
100
120
1990 2010 2030

© BP 2013
Gas trade and market integration
Energy Outlook 2030
0%
5%
10%
15%
20%
0
20
40
60
80
1990 2000 2010 2020 2030
LNG
Bcf/d
LNG exports
% of total consumption
(RHS)
LNG diversification
0
2
4
6
8
10
1991 1996 2001 2006 2011
Suppliers per importer
Customers per exporter

© BP 2013 Energy Outlook 2030
250
300
350
400
450
500
2011 OECD Non-OECD 2011 Non-shale Shale
N. America Other OECD
Middle East
China
Other non-OECD
Non-OECD
Energy Outlook 2030
Global gas balance
Bcf/d
Demand Supply
2030 level
OECD

© BP 2013
Coal consumption
Power
Oil
Industry
Coal demand by region
OECD
China
India
Billion toe
Energy Outlook 2030
China
India
OECD
China
Other Non-OECD India
China
India
OECD 0
1
2
3
4
5
1990 2000 2010 2020 2030
OECD
China
Other non-OECD India
China
India
OECD
Billion toe
Coal demand by sector
0
1
2
3
4
5
1990 2000 2010 2020 2030
Power
Industry
Other

© BP 2013
Non-fossil fuels
0.0
0.5
1.0
1.5
2.0
1990 2000 2010 2020 2030
Renewables
Biofuels
Hydro
Nuclear
Billion toe
Renewables in power
Biofuels
OECD
0.0
0.5
1.0
1.5
2.0
1990 2000 2010 2020 2030
Non-OECD
Billion toe
Energy Outlook 2030
© BP 2013
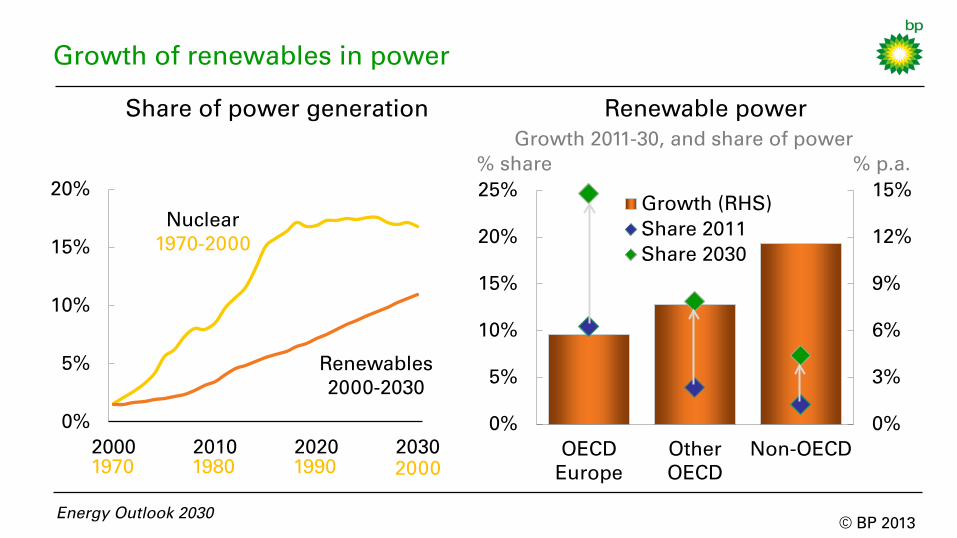
Growth of renewables in power
OECD
Non-OECD
0%
5%
10%
15%
20%
2000 2010 2020 2030
Nuclear 1970-2000
Renewables 2000-2030
1970 1980 1990 2000
0%
3%
6%
9%
12%
15%
0%
5%
10%
15%
20%
25%
OECDEurope
OtherOECD
Non-OECD
Growth (RHS)Share 2011Share 2030
Renewable power
% p.a. % share
Share of power generation
Energy Outlook 2030
Growth 2011-30, and share of power

© BP 2013
Electricity share of final consumption
Energy Outlook 2030
0%
10%
20%
30%
40%
50%
1990 2010 2030
Other
Industry
Transport
Power generation and electricity use
Shares of power output
0%
20%
40%
60%
80%
100%
1970 1990 2010 2030
Renew.
Nuclear
Coal
Oil
Hydro
Gas

© BP 2013
Introduction
Global energy trends
Outlook 2030: Fuel by fuel
Implications
Energy Outlook 2030

© BP 2013
0%
50%
Oil and gas: reserves and production
2011 reserves 2030 output
% share of global total
Key:
Europe N. America
S. & C. America Africa
Middle East
FSU
Asia Pacific
Energy Outlook 2030
Net exporters 2011 Net importers 2011

© BP 2013
Tight oil and shale gas uncertainties
Share of global supply growth
0
2
4
6
8
10
2010 2020 2030
RangeBP
Range of tight oil forecasts (excludes NGLs)
Mb/d
Energy Outlook 2030
0%
25%
50%
75%
2000-10 2010-20 2020-30
Shale gasTight oil
0
20
40
60
80
100
120
2010 2020 2030
RangeBP
Bcf/d
Range of shale gas forecasts

© BP 2013
-80
-60
-40
-20
0
20
40
60
1990 2000 2010 2020 2030
China
US
EU
Energy imbalances to GDP ratio
Energy Outlook 2030
Energy imbalances
China EU US
-1,200
-900
-600
-300
0
300
1990
2010
2030
1990
2010
2030
1990
2010
2030
OilGasCoal
Mtoe Toe per $Mln GDP PPP
Energy imbalances: import profiles

© BP 2013
0
200
400
600
800
1000
1200
1990 2000 2010 2020 2030
Saudi Arabia
Russia
Africa
Energy imbalances to GDP ratio
Energy Outlook 2030
Energy imbalances Saudi Arabia Africa Russia
0
200
400
600
800
1990
2010
2030
1990
2010
2030
1990
2010
2030
OilGasCoal
Mtoe Toe per $Mln GDP PPP
Energy imbalances: export profiles

© BP 2013
Oil
Gas
CO2 emissions and primary energy
Billion tonnes CO2
Energy Outlook 2030
Growth of CO2 emissions
% p.a.
0
3
6
9
12
15
18
0
10
20
30
40
50
1970 1990 2010 2030
Emissions fromenergy use
Primary energy(RHS)
Billion toe
-2%
0%
2%
4%
6%
8%
China EU US
1970-1990
1990-2010
2010-2030
Energy and carbon emissions

© BP 2013
Conclusion
0%
1%
2%
3%
4%
Population
Income per
capita
Economic growth
Efficiency gains
New supply
% p.a. Economic growth needs energy
Competition and innovation are the key to meeting this need − energy efficiency
− new supplies
Energy security and climate change remain challenges
Energy Outlook 2030

January 2013

© BP 2013
Data sources
Baker Hughes, Houston, Texas
BP p.l.c., BP Statistical Review of World Energy, London, United Kingdom, June 2012
BP p.l.c., BP Energy Outlook 2030, London, United Kingdom, January 2012
Center for International Comparisons of Production, Income and Prices at the University of Pennsylvania, Heston, A., Summers, R., Aten, B., Penn World Table Version 7.1, Nov 2012.
Energy Information Administration, International Energy Outlook , Washington, D.C., United States, 2012
GIIGNL, Paris, France
International Council for Clean Transportation, Global passenger vehicle standards update. August 2012
International Energy Agency, CO2 Emissions from Fuel Combustion, Paris, France, 2012
International Energy Agency, Energy Balances of Non-OECD Countries, Paris, France, 2012
International Energy Agency, Energy Balances of OECD Countries, Paris, France, 2012
International Energy Agency, World Energy Outlook 2012, Paris, France, 2012
Oxford Economics Ltd, Oxford, UK
PIRA Energy Group, New York, NY, United States
Rühl C., Appleby P., Fennema J., Naumov A., Schaffer ME. (2012). Economic development and the demand for energy: a historical perspective on the next 20 years. Energy Policy, vol 50, pp. 109-116.
Smith Bits S.T.A.T.S.
UN Population Division, World Population Prospects: The 2010 Revision, New York, United States, 2011
US Environmental Protection Agency, Light-Duty Automotive Technology, Carbon Dioxide Emissions, and Fuel Economy Trends: 1975 Through 2011. March 2012
World Bank, World Bank Commodity Price Data (Pink Sheet), November 2012
Plus various official sources
Energy Outlook 2030