energy conversion and management - welcome to eps · system through decreasing the temperature, ......
TRANSCRIPT

Energy Conversion and Management 105 (2015) 782–790
Contents lists available at ScienceDirect
Energy Conversion and Management
journal homepage: www.elsevier .com/locate /enconman
Evaluation of optimal dual axis concentrated photovoltaic thermalsystem with active ventilation using Frog Leap algorithm
http://dx.doi.org/10.1016/j.enconman.2015.08.0330196-8904/� 2015 Elsevier Ltd. All rights reserved.
⇑ Corresponding author. Tel.: +98 914 915 6215.E-mail address: [email protected] (A. Khalilnejad).
H. Gholami a, A.I. Sarwat b, H. Hosseinian a, A. Khalilnejad b,⇑a Electrical Engineering Department, Amirkabir University of Technology (AUT), Tehran, Iranb Electrical Engineering Department, Center of Energy, Power & Sustainability (EPS), Florida International University (FIU), Miami, USA
a r t i c l e i n f o a b s t r a c t
Article history:Received 13 April 2015Accepted 11 August 2015Available online 27 August 2015
Keywords:CPVT systemTriple-junction cellFrog Leap algorithmSolar trackerActive ventilation
In this study, design and optimization of a concentrated photovoltaic thermal (CPVT) system consideringelectrical, mechanical, and economical aspects is investigated. For this purpose, each section of the sys-tem is simulated in MATLAB, in detail. Triple-junction photovoltaic cells, which are the most recent tech-nology, are used in this study. They are more efficient in comparison to conventional photovoltaic cells.Unlike ordinary procedures, in this work active ventilation is used for absorbing the thermal power ofradiation, using heat storage tanks, which not only results in increasing the electrical efficiency of thesystem through decreasing the temperature, but also leads to storing and managing produced thermalenergy and increasing the total efficiency of the system up to 85 percent. The operation of the CPVTsystem is investigated for total hours of the year, considering the needed thermal load, meteorologicalconditions, and hourly radiation of Khuznin, a city in Qazvin province, Iran. Finally, the collector usedfor this system is optimized economically, using frog leap algorithm, which resulted in the cost of13.4 $/m2 for a collector with the optimal distance between tubes of 6.34 cm.
� 2015 Elsevier Ltd. All rights reserved.
1. Introduction
In recent years, the concentrated photovoltaic thermal (CPVT)systems have been rapidly developed [1,2]. In these systems, theradiation is transmitted to cells, using reflectors. With this method,the incident radiation to the cells increases significantly [3–8]. TheCPV consists of three parts including the absorber, concentrator,and solar radiation tracker. The absorber consists of the solar cellpart and the thermal ventilation system. The concentrator focusesthe radiation to the absorber. As the CPV works with the beamradiation, the absorber and concentrator should follow the positionof the sun to maximize the incident beam radiation. In order toconcentrate the radiation, two major technologies of Fresnel lens[9,10] and parabolic concentrators [11] can be used. Plus, in recentyears, triple-junction solar cells have been widely investigated. Inthese systems, when increasing the current, the voltage increasesin logarithmic scale [12]. Also, they are less affected by tempera-ture variation in comparison with silicon based samples [9]. Basedon the level of concentration, there are three major concentratorswith low, medium, and high rate of concentration. In a study in2010, a solar system with low rate of concentration is discussed.
The model was used to perform a sensitivity analysis in order tohighlight the relevance of the leading working parameters (suchas irradiance) in system performance [13]. In 2011, instead ofimplementation of conventional cells, the usage of cells with effi-cient operation such as GaAs with a linear concentrator is investi-gated [14]. In another study in 2011, a case study in Sweden, a lowconcentrating CPVT system is performed and a complete method-ology to characterize, simulate, and evaluate concentrating photo-voltaic/thermal hybrids is proposed [15]. In 2012, the operation ofsingle and double-axis solar tracker system installed on the roof ofa building is analyzed [16].
The obtained thermal power can be used for both heating andcooling purposes which are described in recent studies [17,18]. In2013, performance analysis of a novel concentrating photovoltaiccombined system is performed. Also, energy and exergy analysesof the system is evaluated, economical analysis is performed, andthe experimental results are compared to data obtained by the con-trol system [19]. In 2014, the optical performance of a CPVT systemis evaluated. The theoretical model of the optical performance ofthe system under real application condition was established andthe outdoor experiment was carried out to compare the simulationevaluation [20]. In 2015, parametric performance analysis of aconcentrated photovoltaic co-generation system equipped with athermal storage tank is done. The system utilized dual-axis tracker
H. Gholami et al. / Energy Conversion and Management 105 (2015) 782–790 783
and multiple solar energy collector (SEC) modules and a forcedcooling system [21]. In another study in 2015, analysis of U-shaped solar energy collector of a CPVT system is evaluated, numer-ically and experimentally [22].
In the previous studies, the optimization of an active ventilationsystem of the concentrated solar collectors, considering hourlyoperation of the CPVT system for a long term period, has not beenperformed. The optimal dimensions of the thermal absorbingsystem and its economical aspects are discussed in this work.
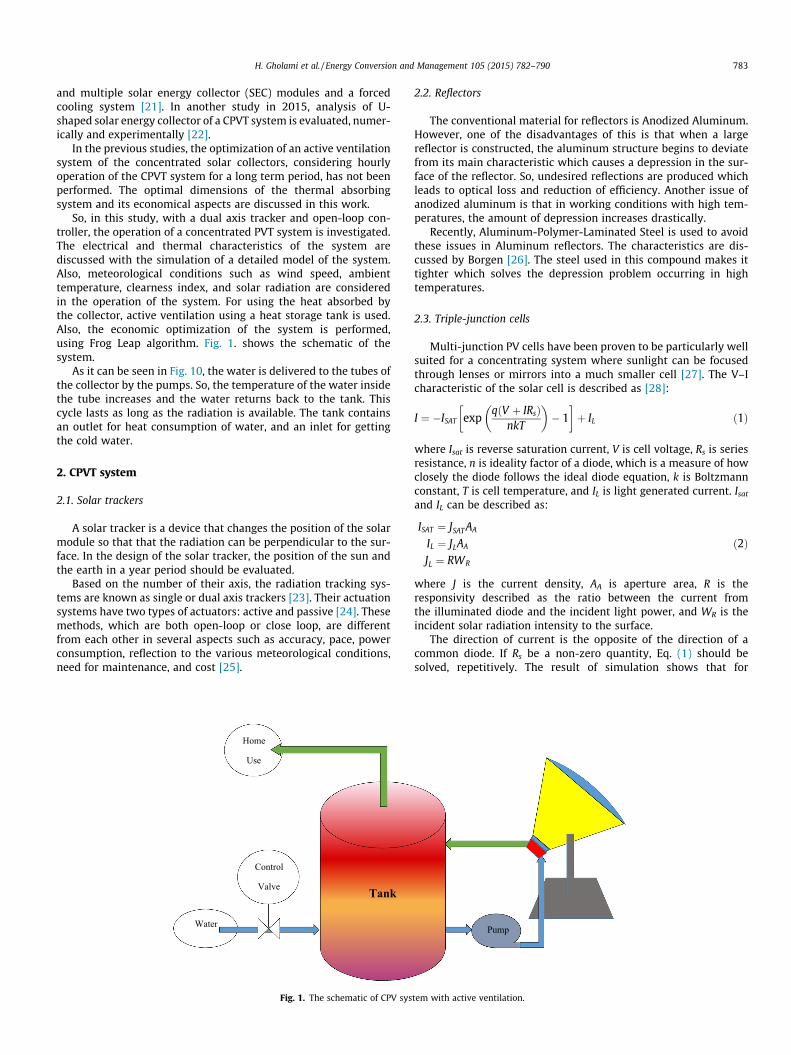
So, in this study, with a dual axis tracker and open-loop con-troller, the operation of a concentrated PVT system is investigated.The electrical and thermal characteristics of the system arediscussed with the simulation of a detailed model of the system.Also, meteorological conditions such as wind speed, ambienttemperature, clearness index, and solar radiation are consideredin the operation of the system. For using the heat absorbed bythe collector, active ventilation using a heat storage tank is used.Also, the economic optimization of the system is performed,using Frog Leap algorithm. Fig. 1. shows the schematic of thesystem.
As it can be seen in Fig. 10, the water is delivered to the tubes ofthe collector by the pumps. So, the temperature of the water insidethe tube increases and the water returns back to the tank. Thiscycle lasts as long as the radiation is available. The tank containsan outlet for heat consumption of water, and an inlet for gettingthe cold water.
2. CPVT system
2.1. Solar trackers
A solar tracker is a device that changes the position of the solarmodule so that that the radiation can be perpendicular to the sur-face. In the design of the solar tracker, the position of the sun andthe earth in a year period should be evaluated.
Based on the number of their axis, the radiation tracking sys-tems are known as single or dual axis trackers [23]. Their actuationsystems have two types of actuators: active and passive [24]. Thesemethods, which are both open-loop or close loop, are differentfrom each other in several aspects such as accuracy, pace, powerconsumption, reflection to the various meteorological conditions,need for maintenance, and cost [25].
Tank
Home
Use
Water
Control
Valve
Fig. 1. The schematic of CPV sys
2.2. Reflectors
The conventional material for reflectors is Anodized Aluminum.However, one of the disadvantages of this is that when a largereflector is constructed, the aluminum structure begins to deviatefrom its main characteristic which causes a depression in the sur-face of the reflector. So, undesired reflections are produced whichleads to optical loss and reduction of efficiency. Another issue ofanodized aluminum is that in working conditions with high tem-peratures, the amount of depression increases drastically.
Recently, Aluminum-Polymer-Laminated Steel is used to avoidthese issues in Aluminum reflectors. The characteristics are dis-cussed by Borgen [26]. The steel used in this compound makes ittighter which solves the depression problem occurring in hightemperatures.
2.3. Triple-junction cells
Multi-junction PV cells have been proven to be particularly wellsuited for a concentrating system where sunlight can be focusedthrough lenses or mirrors into a much smaller cell [27]. The V–Icharacteristic of the solar cell is described as [28]:
I ¼ �ISAT expqðV þ IRsÞ
nkT
� �� 1
� �þ IL ð1Þ
where Isat is reverse saturation current, V is cell voltage, Rs is seriesresistance, n is ideality factor of a diode, which is a measure of howclosely the diode follows the ideal diode equation, k is Boltzmannconstant, T is cell temperature, and IL is light generated current. Isatand IL can be described as:
ISAT ¼ JSATAA
IL ¼ JLAA
JL ¼ RWR
ð2Þ
where J is the current density, AA is aperture area, R is theresponsivity described as the ratio between the current fromthe illuminated diode and the incident light power, and WR is theincident solar radiation intensity to the surface.
The direction of current is the opposite of the direction of acommon diode. If Rs be a non-zero quantity, Eq. (1) should besolved, repetitively. The result of simulation shows that for
Pump
tem with active ventilation.

Table 1Parameters of the cell.
Symbol Value Unit
JSAT 1.01(10�20) at 25 �C A/cm2
AA 0.27 C m2
n 2.44 –i 1.6 � 10�19 C
1 eVK 8.62 � 10�5 eV/KRS1 0.011 XRS0 40 XK 1.75 –W 0.0901 W/cm2
WR 0.139 A/WEg 1.6 eVC 1 –
784 H. Gholami et al. / Energy Conversion and Management 105 (2015) 782–790
congruity of the data, the series resistance should be dependent ofabsorbed power by the cell, shown in the following equation:
RS ¼ RS0=XK þ RS1 ð3Þ
where Rs0 is the series resistance at low intensity, X is concentra-tion, Rs1 is the series resistance at high flux, and K is the series resis-tance intensity coefficient. The Eq. (3) is represented in Fig. 2 [29].As can be seen the resistance is a function of the number of photonsreceived at the surface. Also, the dependence of the electrical sys-tem of photovoltaic cells on the temperature is expressed as [30]:
JSATðTÞ � T3þc=2 exp � Eg
kT
� �ð4Þ
where Eg is the effective energy gap. With describing the V–I char-acteristics, the open circuit voltage and short Circuit current can beobtained as following:
Isc ¼ IL
VOC ¼ kTq ln IL
ISATþ 1
� � ð5Þ
Also, the maximum voltage and current can be derived fromrepetitively solving of the following equation which is the deriva-tive of Eq. (1):
VMP ¼ nkTq
lnILISAT
� IMP
ISATþ 1
� �� IMPRS ð6Þ
So, the efficiency and fill factor (FF) is given in the followingequations:
FF ¼ IMPVMP
IscVOCð7Þ
g ¼ IMPVMP
WAAð8Þ
where W is the incident solar radiation intensity. According to thementioned equations, the electrical section of the system is simu-lated. The parameters needed for simulation are given in Table 1which is a sample constructed in Spectrolab Inc., a wholly ownedsubsidiary of The Boeing Company [29,31].
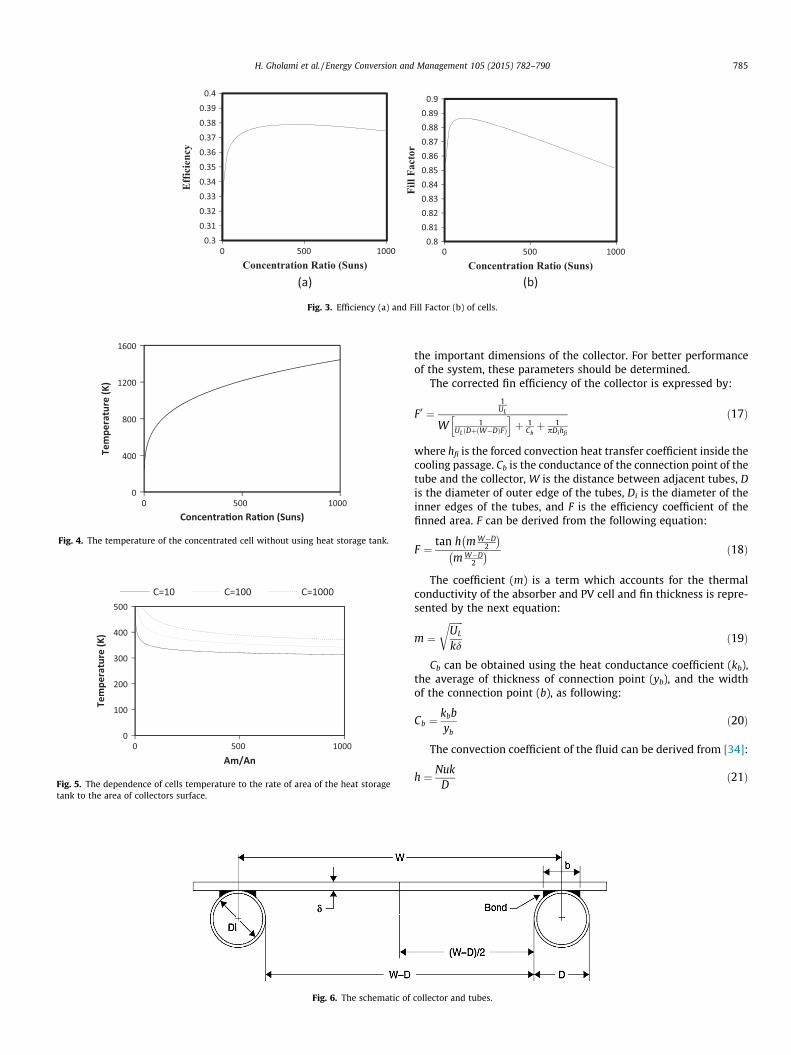
The efficiency and fill factor is shown in Fig. 3. As can be seen,the efficiency is almost constant when the concentration ratiorises. However, the fill factor decreases, gradually, leading to lesspower production.
2.4. Ventilation
Two major procedures of ventilation of solar collectors areactive ventilation and passive ventilation. With passive ventilation,the heat generated in the surface of the collector is transmitted tothe air by heat sink. With active ventilation, the heat can be used
0
0.2
0.4
0.6
0.8
1
100010010
Rs (
ohm
s)
Concentration Ration (Suns)
Fig. 2. The series resistance of the cell.
for cooling or heating purposes. So, active ventilation converts aCPV system to a CPVT system. The heat can be produced by convec-tion or radiation. When the heat balance is confirmed, the follow-ing equation can be derived for concentrated solar cells [32]:
Ac:S� Ac � S � g� AHS � e � rðT4 � T4aÞ � AHShcðT � TaÞ ¼ 0 ð9Þ
where Ac is the area of the cell, S is the solar power received to thesurface of cell, g is the electrical efficiency, AHS is the area of heatstorage tank, e emitting coefficient, r is Estefan–Boltzmann con-stant, hc is the convection coefficient, T is the cell temperature,and Ta is the ambient temperature.
As shown in Fig. 4, if a heat storage tank is not used, the temper-ature of the surface of the cells raises drastically. For example, for aconcentration rate of 500, the temperature reaches up to 1000 K.
The effect of the heat storage tank on the temperature of cells isshown in Fig. 5. As it can be seen, the temperature decreases signif-icantly due to absorbing of the heat by the fluid inside the tubes.
The energy loss from the collector is obtained from [33]:
Qloss ¼Tp � Ta
RL¼ ULAcðTP � TaÞ ð10Þ
where UL is the total heat loss coefficient, and TP is the collector’stemperature. UL can be expressed as:
UL ¼ Ut þ Ub þ Ue ð11Þwhere Ut, Ub, and Ue are the heat loss coefficients of top, bottom, andedges of the collector, respectively.
The heat loss from the top of the collector is due to radiationand convection. Convection and radiation loss coefficients aredescribed as:
hc ¼ 8:6V0:6
L0:4ð12Þ
hr ¼ erðT2P þ T2
aÞðTP þ TaÞ ð13Þwhere V is the wind speed and L is the length of the collector. So,
Ut ¼ hc þ hr ð14ÞThe heat loss coefficients of bottom and edges of the collector
are derived from:
Ub ¼ kbtb
ð15Þ
Ue ¼ kete
ð16Þ
where t and k are thickness of the tube and the conductance coeffi-cient, respectively. Fig. 6 shows the thermal system representing
(a) (b)
0.30.31
0.32
0.330.34
0.350.36
0.370.38
0.390.4
0 500 1000
Eff
icie
ncy
Concentration Ratio (Suns)
0.80.810.820.830.840.850.860.870.880.89
0.9
0 500 1000
Fill
Fact
or
Concentration Ratio (Suns)
Fig. 3. Efficiency (a) and Fill Factor (b) of cells.
0
400
800
1200
1600
0 500 1000
Tem
pera
ture
(K)
Concentra�on Ra�on (Suns)
Fig. 4. The temperature of the concentrated cell without using heat storage tank.
0
100
200
300
400
500
0 500 1000
Tem
pera
ture
(K)
Am/An
C=10 C=100 C=1000
Fig. 5. The dependence of cells temperature to the rate of area of the heat storagetank to the area of collectors surface.
Fig. 6. The schematic of
H. Gholami et al. / Energy Conversion and Management 105 (2015) 782–790 785
the important dimensions of the collector. For better performanceof the system, these parameters should be determined.
The corrected fin efficiency of the collector is expressed by:
F 0 ¼1UL
W 1ULðDþðW�DÞFÞ
h iþ 1
Cbþ 1
pDihfi
ð17Þ
where hfi is the forced convection heat transfer coefficient inside thecooling passage. Cb is the conductance of the connection point of thetube and the collector, W is the distance between adjacent tubes, Dis the diameter of outer edge of the tubes, Di is the diameter of theinner edges of the tubes, and F is the efficiency coefficient of thefinned area. F can be derived from the following equation:
F ¼ tan h mW�D2
� mW�D
2
� ð18Þ
The coefficient (m) is a term which accounts for the thermalconductivity of the absorber and PV cell and fin thickness is repre-sented by the next equation:
m ¼ffiffiffiffiffiffiUL
kd
rð19Þ
Cb can be obtained using the heat conductance coefficient (kb),the average of thickness of connection point (yb), and the widthof the connection point (b), as following:
Cb ¼ kbbyb
ð20Þ
The convection coefficient of the fluid can be derived from [34]:
h ¼ NukD
ð21Þ
collector and tubes.

Table 2The constants value in Eq. (22) [33].
Pr a b m n
0.7 0.00398 0.0114 1.66 1.1210 0.00236 0.00857 1.66 1.131 0.00172 0.00281 1.66 1.29
NoYes
Hourly solar andclimate data
Simula�onliza�onini�a
Heat storagecalcula�on
Output value for onehour
Calcula�on for CPV andcollector
Radia�onexists?
Fig. 7. Flowchart of calculation process.
786 H. Gholami et al. / Energy Conversion and Management 105 (2015) 782–790
where D, k, and Nu are the radius of the tube, the heat conductancecoefficient, and Nusselt number, respectively. Nu can be derivedfrom:
Nu ¼ Nu1 þ awm
1þbwn
w ¼ RePrDL
ð22Þ
where Re, Pr, and L are Reynolds number, Prandtl number, andlength of collector, respectively. Re is expressed by:
Re ¼ 4 _mpDl
ð23Þ
where _m and l are density and viscosity of the fluid, respectively.The values of a, b, m, n and, Nu1 are given in Table 2.
The heat removal efficiency factor is given in the followingequation:
FR ¼ _mCP
AcUL1� exp �AcULF
0
_mCp
� �� �ð24Þ
This coefficient is the ration of obtained energy in a practical sit-uation to the obtained energy when the temperature of the cell isequal to the temperature of the fluid. Cp is the specific heat of thecollector cooling medium. So, the absorbed heat by the fluid can bederived from the following equation:
Qu ¼ AcFRðS� ULðTi � TaÞÞ ð25Þwhere Ti is the cooling medium inlet temperature. The thermal effi-ciency is given by
gth ¼Qu
Sð26Þ
The temperature of the surface of the collector is given by thefollowing equation
Tp ¼ Ti þ Qu
AcFRULð1� FRÞ ð27Þ
Also, fin thickness, which is an important factor in the designingof the system, is given by [35]
d ¼
joðW�bW1=4�tÞ2W�bW1=4�t1
UL1
F0ULW�p
h i�bW1=4�t�1
kð28Þ
where
jo ¼ UL12
p ¼ 1phfiDi
ð29Þ
3. Simulation of the system
With active ventilation, the CPV system is converted to a com-bined heat and power (CHP) system. Fig. 7, represents the flow-chart of calculations process of the system.
If the radiation is available, the temperature rises drastically,and with using temperature sensor the pumps start to work andthe whole system calculations are performed. Otherwise, just theheat storage tank’s calculations are done. The tank is insulated
and the heat capacity of it is 16 (KW/K m2) [36]. Before the calcu-lation process, the different kinds of energy stored in the tank canbe mentioned as following:
� Etank,i: the stored energy in the tank and it is equal to:
Etan k ¼ mtan kcpðTtan k � TaÞ ð30Þwhere mtank is the mass of water inside the tank, and Ttank is thetemperature of it.� Ein: the inlet energy to the tank from the ventilation system,which is equal to:
Ein ¼ Qu ð31Þ� Ecitywater: the inlet energy to the tank from the inlet water,described as following:
Ecitywater ¼ mincpðTa � T0Þ ð32Þ
where min is the mass of inlet water and T0 is the referencetemperature.� Euse: the consumed energy due to outflow of the warm waterfrom the tank for heating purposes, which is expressed as:
Euse ¼ musecpðTtan k � T0Þ ð33Þ
Where muse is the mass of outlet water.� Eloss: the loss energy from the walls of the tank, which isdescribed as the following equation:
Eloss ¼ Atan kRtan kðTtan k � TairÞ ð34Þ
where Rtank is the heat capacity of the tank. Also, Atank is the area ofwalls of the heat storage tank.
For the calculation of the energy of the tank, there should beenergy balance between the mentioned energies, as following:
Etan k;i ¼ Etan k;i�1 þ Ein;i þ Ecitywater;i � Euse;i � Eloss;i ð35Þ
where i index represents each hour of the system’s operation. Ttankcan be derived from the following equation:
Ttan k ¼ ðEtan k=ðmtan k � cpÞÞ þ T0 ð36Þ

0
5
10
15
20
25
0 100 200 300
Win
d Sp
eed
(m/s
)
Time (Day)
Fig. 9. Wind Profile of Khuznin.
Table 3Input parameters of the thermal system.
Parameter Value Unit
m 400 kgR 16 kW/K m2
Cp 4200 J/kg KAtank 2.5052 m2
Kcopper 385 w/m KKwater 0.596 w/m KL 1 me 0.03r 5.67e�8 J/s m2 K4
l 1e�3 Pa sT0 298.15 K
H. Gholami et al. / Energy Conversion and Management 105 (2015) 782–790 787
3.1. Radiation and meteorological data
The meteorological data of the location in which the system issimulated and analyzed is based on Khuznin, a city in Qazvin pro-vince, Iran. This city has a longitude of 35.861� and a latitude of49.758� with clean and mild climatic conditions [36]. The hourlyradiation for a year depends on various factors such as the numberof bright hours of the day, the clearness index, the ambient tem-perature, the latitude of the region, and the view factor of thesky to ground. The radiation calculation process is described inour previous study [36]. The equation of total hourly radiation isexpressed as:
IT ¼ IbRb þ Id;isoFc�s þ Id;csRb þ Id;HzFc�Hz þ IgFc�g ð37Þ
where Ib is the incident beam radiation, Rb is the geometric factordefined as the ratio of the beam radiation on tilted surface to thaton horizontal surface at any time, id is the diffused incidentradiation, Ig is the reflected radiation, and F is the view factor ofthe surface to sky and ground.
Fig. 8a shows the total and beam hourly radiation for a dual axissolar tracker. The ratio of total and beam radiation for a collectorwith a dual axis tracker to a fixed collector with optimal surfaceangle of 38� is 1.34 and 1.65, respectively. Fig. 8b, shows the inci-dent radiation fractions to the surface of a dual axis collector forthe first day of the year. The total energy received at the surfaceis 15.95 MJ/m2 with 70.52, 19.84, and 9.64 percent for beam, dif-fused, and reflected radiation, respectively. Also, the hourly windspeed data for the region is shown in Fig. 9. The average windspeed is 4.87 m/s.
3.2. Optimization of the system using frog leap algorithm
The frog leap is an algorithm taken from nature. In this algo-rithm, a group of frogs (a set of answers), is divided into severalsub branches, where each frog has its own behavior and can obtainthe behavior of the other frogs through their evolution [37,38].Based on this method, in the following, the optimization of the sys-tem is discussed. The cost per square meter of a collector isexpressed in the following equation [39]:
C ¼ Mdþ RMðt2 þ 2DitÞ4W
ð38Þ
where M is the cost of fin material per unit material volume, R isratio of cost per unit volume of tube material to cost per unit vol-ume of fin material. With the combination of the cost function
(a)
0
200
400
600
800
0 60 120 180 240 300 360
G (W
/m2)
Time (Day)
Radia�on Beam Radia�on
Fig. 8. (a)Total and Beam hourly radiation and (b) fr
and the equations, described in the previous section, the cost func-tion can be described as:
C ¼ Mk
joðW � bW1=4 � tÞ2W�bW1=4�t1
UL1
F0ULW�p
h i�bW1=4�t� 1
0BBBBBB@
1CCCCCCA
þ pt2RM4W
þ 2ptbRM4W3=4 ð39Þ
As can be seen, the cost of the system is the function of differentparameters and variables. So, the optimization is essential. Also,the parameters of the thermal system are given in Table 3.
4. Results and discussion
For evaluation of the system, firstly, the system is simulatedwith the conventional dimensions from Table 4. Then, the system
(b)
0
200
400
600
0 6 12 18 24
G (W
/m2)
Time (h)
Total BeamDiffused Reflected
actions of radiation to a dual axis solar tracker.

Table 4Frog Leap parameters for the optimization of system.
Populationsize
Chromosomesize
Number ofmemeplex
Number of frogs ineach memeplex
Iteration
48 1 4 12 100
788 H. Gholami et al. / Energy Conversion and Management 105 (2015) 782–790
is optimized considering the efficiency of the system to be fixedwith the minimum cost of the system. So, the thermal characteris-tics of the system remain the same. The optimization parametersare given in Table 4. In the optimization process the number ofselected frogs for each step is equal to 4. The lower amounts reducethe speed of local communication and the higher amounts causethe data not to be properly transferred between memeplexes.
1
10
100
1000
0 50 100
Cost
($/m
2)
Itera�on
Frog Leap PSO
Fig. 10. The convergence of optimization.
Table 5Optimization results.
Parameter Optimization result Conventional dimensions
W 0.06341 m 0.1 mDi 0.0045 m 0.0135 mDo 0.006 m 0.015 md 5.91e�5 m 5e�4 mNumber of tubes 15 10
(a) (b
0
2
4
6
8
10
12
0 120 240 360
Curr
ent (
A)
Time (Day)
Imp Isc
0
2
4
0 120
Volta
ge (V
)
Time
Vmp
Fig. 11. Electrical characte
Also, the convergence of the Frog Leap is shown in Fig. 10. As itcan be seen, the convergence point of the optimization is in the41st iteration. Also, the particle swarm optimization (PSO) isimplemented to the system, which gives the same result in the84th iteration. The optimization results are shown in Table 5.The optimal calculated cost is 13.44 $/m2. It should be mentioned,in the optimization procedure, that PV cost is not taken into con-sideration as PV material will not be optimized due to the fact thatthe PV is treated as a ready manufactured product on which nochanges or modifications whatsoever can be done.
The electrical characteristics of cells of the system are shown inFig. 11. The maximum voltage and current point are illustrated inthe figure. These points give the average efficiency of 37 percent.Also the average fill factor is 0.86.
The average household daily water consumption with 6 con-sumers is considered 400 liters [40]. The usual consumption timeis from 7 a.m. to 12 midnight. So, in the 17 h, the consumption is23.5 liters per hour. Also, the volume of the tank is considered300 liters and the amount of pumping of water is 72 liters per hour.The tank is a cylindrical shape with the radius of 0.4 m and theheight of 0.596 m.
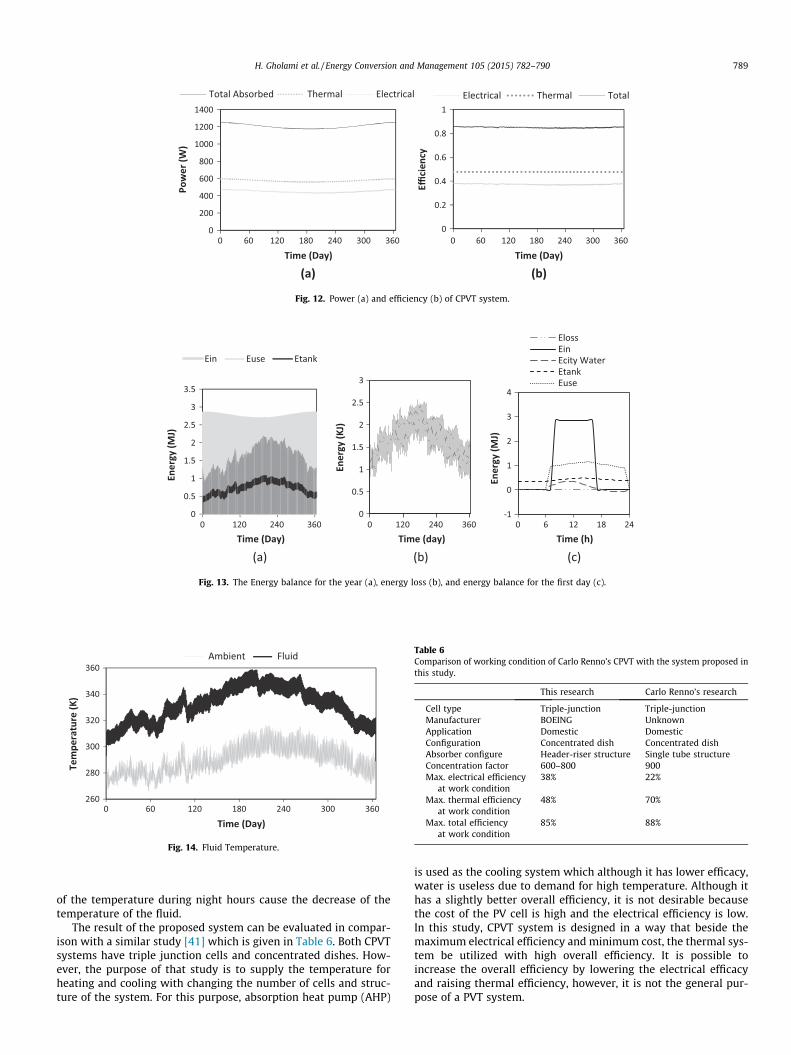
The results are based on hourly simulation of the system duringthe year. The absorbed power which produces the electrical andthermal power is shown in Fig. 12a. As can be seen, the fluctuationof power is almost 8 percent, during the year. The averageabsorbed power is 1200W which produces average electrical andthermal powers of 450 W, and 575.8 W, respectively. Also, the effi-ciency of the system is shown in Fig. 12b. Although the radiationand temperature fluctuate during the year, the efficiency of thesystem remains almost constant at 85 percent with more shareof thermal efficiency at an average amount of 47.68 percent. Thecalculated efficiencies are for the light hours when radiation existsto generate power.
The energy balance of the fluid in the heat storage tank is shownin Fig. 13. As can be seen, the power loss increases with the amountof energy in the tank. The energy loss during the year is 14 MJwhich is 0.15 percent of Ein. Also, the used energy during the yearis 15.5 GJ. As is seen in Fig. 13c. after sunset, when there is notabsorbed energy, the energy in the storage tank can satisfy theconsumption.
The fluid temperature, shown in Fig. 14, is derived from theenergy balance equation and follows the pattern of the collector’stemperature. The daily fluctuation of the temperature is causedby the variation of radiation. The lack of radiation and the decrease
) (c)
240 360
(Day)
Voc
0.8
0.82
0.84
0.86
0.88
0.9
0 120 240 360
Fill
Fact
or
Time (Day)
ristics of the system.
(a) (b)
0
200
400
600
800
1000
1200
1400
0 60 120 180 240 300 360
Pow
er (W
)
Time (Day)
Total Absorbed Thermal Electrical
0
0.2
0.4
0.6
0.8
1
0 60 120 180 240 300 360
Effici
ency
Time (Day)
Electrical Thermal Total
Fig. 12. Power (a) and efficiency (b) of CPVT system.
(a) (b) (c)
0
0.5
1
1.5
2
2.5
3
3.5
0 120 240 360
Ener
gy (M
J)
Time (Day)
Ein Euse Etank
0
0.5
1
1.5
2
2.5
3
0 120 240 360
Ener
gy (K
J)
Time (day)
-1
0
1
2
3
4
0 6 12 18 24
Ener
gy (M
J)
Time (h)
ElossEinEcity WaterEtankEuse
Fig. 13. The Energy balance for the year (a), energy loss (b), and energy balance for the first day (c).
260
280
300
320
340
360
0 60 120 180 240 300 360
Tem
pera
ture
(K)
Time (Day)
Ambient Fluid
Fig. 14. Fluid Temperature.
Table 6Comparison of working condition of Carlo Renno’s CPVT with the system proposed inthis study.
This research Carlo Renno’s research
Cell type Triple-junction Triple-junctionManufacturer BOEING UnknownApplication Domestic DomesticConfiguration Concentrated dish Concentrated dishAbsorber configure Header-riser structure Single tube structureConcentration factor 600–800 900Max. electrical efficiency
at work condition38% 22%
Max. thermal efficiencyat work condition
48% 70%
Max. total efficiencyat work condition
85% 88%
H. Gholami et al. / Energy Conversion and Management 105 (2015) 782–790 789
of the temperature during night hours cause the decrease of thetemperature of the fluid.
The result of the proposed system can be evaluated in compar-ison with a similar study [41] which is given in Table 6. Both CPVTsystems have triple junction cells and concentrated dishes. How-ever, the purpose of that study is to supply the temperature forheating and cooling with changing the number of cells and struc-ture of the system. For this purpose, absorption heat pump (AHP)
is used as the cooling system which although it has lower efficacy,water is useless due to demand for high temperature. Although ithas a slightly better overall efficiency, it is not desirable becausethe cost of the PV cell is high and the electrical efficiency is low.In this study, CPVT system is designed in a way that beside themaximum electrical efficiency and minimum cost, the thermal sys-tem be utilized with high overall efficiency. It is possible toincrease the overall efficiency by lowering the electrical efficacyand raising thermal efficiency, however, it is not the general pur-pose of a PVT system.

790 H. Gholami et al. / Energy Conversion and Management 105 (2015) 782–790
5. Conclusion
In this study, operation of multi junctional concentrated photo-voltaic thermal systems has been simulated and evaluated usingthe hourly radiation for Qazvin province for a one year period. Bydesigning an active ventilation for the CPVT system, it is concludedthat not only the electrical efficiency of the system is increased, butalso, the total efficiency is increased to about 85 percent, due to useof generated thermal power. The thermal section of the system isoptimized with Frog Leap algorithm to minimize the cost of thesystem without changing its efficiency, resulting in 13.4 ($/m2)as the cost of a collector. Also, the simulations show that the tem-perature of the collector decreases, significantly, with using theheating storage tank. So, active ventilation, besides providing aneconomic optimization of the system, can improve the issues ofthe system with regard to passive ventilation and low efficiency.
Finally, it is suggested that in future studies, the optimization ofthe system be performed with consideration of the grid and thecost of heat generated by fossil fuels. Also, the optimization canbe performed prioritizing consumer demand, so that the minimumtemperature needed for the consumer is considered as the basis ofheat power generation, during a year-long period of operation.
References
[1] Sharaf OZ, Orhan MF. Concentrated photovoltaic thermal (CPVT) solar collectorsystems: Part II – Implemented systems, performance assessment, and futuredirections. Renew Sustain Energy Rev 2015;50(C):1566–633.
[2] Marini S, Strada C, Villa M, Berrettoni M, Zerlia T. How solar energy andelectrochemical technologies may help developing countries and theenvironment. Energy Convers Manage 2014;87:1134–40.
[3] Zahedi A. Review of modeling details in relation to low-concentration solarconcentrating photovoltaic. Renew Sustain Energy Rev 2011;15:1609–14.
[4] Calise F, d’Accadia MD, Vicidomini M, Scarpellin M. Design and simulation of aprototype of a small-scale solar CHP system based on evacuated flat-plate solarcollectors and Organic Rankine Cycle. Energy Convers Manage2015;90:347–63.
[5] Gafurov T, Usaola J, Prodanovic M. Modelling of concentrating solar powerplant for power system reliability studies. IET Renew Power Gener 2015;9(2):120–30.
[6] Calise F, d’Accadia MD, Roselli C, Sasso M, Tariello F. Desiccant-based AHUinteracting with a CPVT collector: simulation of energy and environmentalperformance. Sol Energy 2014;103:574–94.
[7] Baig Hasan, Sellami Nazmi, Chemisana Daniel, Rosell Joan, Mallick Tapas K.Performance analysis of a dielectric based 3D building integratedconcentrating photovoltaic system. Sol Energy 2014;103:525–40.
[8] Xu Z, Kleinstreuer C. Concentration photovoltaic–thermal energy co-generation system using nanofluids for cooling and heating. Energy ConversManage 2014;87:504–12.
[9] Zhai H, Dai YJ, Wu JY, Wang RZ, Zhang LY. Experimental investigation andanalysis on a concentrating solar collector using linear Fresnel lens. EnergyConvers Manage 2010;51:48–55.
[10] Chemisana D, Ibanez M, Rossel JI. Characterization of a photovoltaic-thermalmodule for Fresnel linear concentrator. Energy Convers Manage 2011;52(10):3234–40.
[11] Vossier A, Chemisana D, Flamant G, Dollet A. Very high fluxes for concentratingphotovoltaic: considerations from simple experiments and modeling.Renewable Energy 2012;38:31–9.
[12] Cotal H, Fetzer C, Boisvert J, Kinsey G, King R, Hebert P, et al. IIIeVmultijunction solar cells for concentrating photovoltaics. Energy Environ Sci2009;2:174–92.
[13] Reis F, Brito MC, Corregidor V, Wemans J, Sorasio G. Modeling the performanceof low concentration photovoltaic systems. Sol Energy Mater Sol Cells 2010;94(7):1222–6.
[14] Li M, Li GL, Ji X, Yin F, Xua L. The performance analysis of the troughconcentrating solar photovoltaic/thermal system. Energy Convers Manage2011;52:2378–83.
[15] Bernardo LR, Perers B, Håkansson H, Karlsson B. Performance evaluation of lowconcentrating photovoltaic/thermal systems: a case study from Sweden. SolEnergy 2011;85(7):1499–510.
[16] Tina GM, Scandura PF. Case study of a grid connected with a batteryphotovoltaic system: V-trough concentration vs. single-axis tracking. EnergyConvers Manage 2012;64:569–78.
[17] Natarajan Sendhil K, Katz M, Ebner R, Weingaertner S, Aßländer O, Cole A, et al.Experimental validation of a heat transfer model for concentratingphotovoltaic system. Appl Therm Eng 2012;33:175–82.
[18] Chemisana D, López-Villada J, Coronas A, Ignasi Rosell J, Lodi C. Buildingintegration of concentrating systems for solar cooling applications. ApplTherm Eng 2013;50:1472–9.
[19] Kandilli C. Performance analysis of a novel concentrating photovoltaiccombined system. Energy Convers Manage 2013;67:186–96.
[20] Guiqiang L, Gang P, Ming Y, Jie J, Yuehong S. Optical evaluation of a novel staticincorporated compound parabolic concentrator with photovoltaic/thermalsystem and preliminary experiment. Energy Convers Manage2014;85:204–11.
[21] Hussain MI, Lee GH. Parametric performance analysis of a concentratedphotovoltaic co-generation system equipped with a thermal storage tank.Energy Convers Manage 2015;92:215–22.
[22] Hussian M, Lee GH. Experimental and numerical studies of a U-shaped solarenergy collector to track the maximum CPV/T system output by varying theflow rate. Energy Convers Manage 2015;76:735–42.
[23] IEC. Specifications of Solar Trackers Used for Photovoltaic Systems. 82/651/DTS: IEC 62727 TS Ed.1, 2012.
[24] Dong Han, Zhichao Wang, Huan Shen, Guili Xu, Fangpei Li. Research andDesign on a Rubust Sun-Tracker. In: International Conference on SustainablePower Generation and Supply, April 2009, p. 1–6.
[25] Lee Chia-Yen, Chou Po-Cheng, Chiang Che-Ming, Lin Ciu-Feng. Sun trackingsystems: a review. J Sensors 2009;9:3875–90.
[26] Brogren M, Helgesson A, Karlsson B, Nilsson J, Roos A. Optical properties,durability and system aspects of a new aluminiumpolymer-laminated steelreflector for solar concentrators. Sol Energy Mater Sol Cells 2004;82:387–412.
[27] Wang Z, Zhang H, Wen D, Zhao W, Zhou Z. Characterization of the InGaP/InGaAs/Ge triple-junction solar cell with a two-stage dish-style concentrationsystem. Energy Convers Manage 2013;76:177–84.
[28] Partain LD. Solar cells and their applications. In: 1st ed., Chapter 1, LD Partain,editor. New York, John Wiley & Sons, 1995.
[29] Spectrolab Inc. A Boeing Company. Analytical Model for C1MJ and C3MJ CDO-100 Solar Cells and CCAs. CPV Solar Cell Products. 2009, p. 1–5.
[30] Simon M Sze, Kwok K Ng. Physics of semiconductor devices. In: 2nd ed., 2006.p. 88, eq. 46.
[31] King R, et al. Metamorphic III–V materials, sublattice disorder, and multi-junction solar cell approaches with over 37% cell efficiency. In: Proc 19thEuropean Solar Cell Conf & Exhibition, Paris, France, 2004.
[32] Min Cui, Nuofu Chen, Xiaoli Yang, Yu Wang, Yiming Bai, Xingwang Zhang.Thermal analysis and test for single concentrator solar cells. J Semiconduct2009;30(4):1–4.
[33] Fox Robert W, Pritchard Philip J, McDonald Alan T. Introduction to fluidmechanics. John Wiley & Sons; 2011. 8th ed.
[34] Duffie, Beckman. Solar engineering of thermal processes. 3rd ed. New York,USA: John Wiley & Sons Inc; 2006.
[35] Kerzmann T, Schaefer L. System simulation of a linear concentratingphotovoltaic system with an active cooling system. Renewable Energy2012;41:254–61.
[36] Gholami H, Khalilnejad A, Gharehpetian GB. Electrothermal performance andenvironmental effects of optimal photovoltaic-thermal system. EnergyConversion and Management. 2015.
[37] Zhu GY, Zhang WB. An improved Shuffled Frog-leaping Algorithm to optimizecomponent pick-and-place sequencing optimization problem. Expert SystAppl: Int J 2014;41(15):6818–29.
[38] Lu K, Ting L, KemingW, Hanbing Z, makoto T, Bin Y. An improved shuffled frog-leaping algorithm for flexible job shop scheduling problem. Algorithms 2015;8(1):19–31.
[39] Charalambous PG, Kalogirou SA, Maidment GG, Yiakoumetti K. Optimization ofthe photovoltaic thermal (PV/T) collector absorber. Sol Energy2011;85:871–80.
[40] ASHRAE. ASHRAE handbook: heating, ventilating, and air conditioningapplications, inch-pound edition. American Society of Heating Ventilatingand Air Conditioning, 2003.
[41] Renno C. Optimization of a concentrating photovoltaic thermal (CPV/T) systemused for a domestic application. Appl Therm Eng 2014;67:396–408.