electronic supplimentry information coumarin platform … · electronic supplimentry information 1...
TRANSCRIPT

ELECTRONIC SUPPLIMENTRY INFORMATION
1
A selective hydrolytic and restructuring approach through a Schiff base design on a coumarin platform for “turn-on” fluorogenic sensing of Zn2+†
Abha Pandey,a Sharad Kumar Asthana,a Anand Prakash,b Jagat Kumar Roy,b Ida Tiwari,a and K. K. Upadhyaya*
Department of Chemistry (Centre of Advanced Study), Institute of Science, Banaras Hindu University, Varanasi, Uttar Pradesh, India-221005,
*Corresponding author: Tel: +91 542 670 2488E-mail: drkaushalbhu@ yahoo.co.in; [email protected], Tel: +91-542-6702488
bDepartment of Zoology, Institute of Science, Banaras Hindu University, Varanasi-221005, Varanasi, Uttar Pradesh, India-221005
______________________________________________________________________________________________________________________________________________
Table of Contents
S No. Figures Captions Page No.
Experimental section 4-61. Table S1 Crystal data and structure refinement for CMD, NSA and CM-Zn-CM’ 72. Table S2 Important bond lengths and bond angles for the complex CM-Zn-CM’ 83. Figure S1 IR spectrum of 4-Methyl 7-hydroxy- coumarin 94. Figure S2 IR spectrum of ACM 105. Figure S3 1H NMR spectrum of ACM (in CDCl3) 116. Figure S4 IR spectrum for ACM-Hz 127. Figure S5 1H NMR spectrum of ACM-Hz (in CDCl3) 138. Figure S6 IR spectrum of CMD 149. Figure S7 1H NMR spectrum of CMD (in CDCl3) 1510. Figure S8 13C NMR spectrum of CMD (in CDCl3) 1611. Figure S9 ESI-MS spectrum of CMD. 17
Electronic Supplementary Material (ESI) for Dalton Transactions.This journal is © The Royal Society of Chemistry 2019

ELECTRONIC SUPPLIMENTRY INFORMATION
2
12. Figure S10 IR spectrum of CM-Zn-CM’+NSA crystal 18
13. Figure S11 1H NMR spectrum of crystals of CM-Zn-CM’+NSA (in DMSO-d6) 19
14. Figure S12 Mass Spectrum of crystals of CM-Zn-CM’+NSA. 20
15. Figure S13 IR spectrum of NSA 21
16. Figure S14 1H NMR spectrum of NSA (in DMSO-d6) 22
17. Figure S15 13C NMR spectrum of NSA (in DMSO-d6) 23
18. Figure S16 Mass Spectrum of NSA 24
19. Figure S17 IR spectrum of CM 25
20. Figure S18 1H NMR spectrum of CM (in DMSO-d6) 26
21. Figure S19 13C NMR spectrum of CM (in DMSO-d6) 27
22. Figure 20 ESI-Mass Spectrum of CM 28
23. Figure S21 IR spectrum of CM-Zn-CM 29
24. Figure S22 1H NMR spectrum of CM-Zn-CM (in DMSO-d6) 30
25. Figure S23 13C NMR spectrum of CM-Zn-CM (in DMSO-d6) 31
26. Figure S24 Solid state fluorescence spectra of CMD (λex = 420 nm) and NSA (λex = 425 nm). 32
37. Figure S25 Supramecular architecture showing 2D layer based inter-chain H-bondings (b) Torsion of phenyl ring and coumarin ring at an angle of ∼4°. (c) Crystal structure of CMD showing π–π stacking interaction into head-to-tail arrangement. (d) Hydrogen bonds between π-stacked columns.
33
38. Scheme S1 Crystallizing mechanism of complex of CMD with zinc acetate in DMSO+ethanol mixture after layering with Dichloromethane
34
39. Figure S26 Ortep view of single crystals of NSA with displacement ellipsoids at 50% probability. 34
40. Figure S27 (a) UV-vis spectra of CMD (10 μM) in Ethanol upon addition of Zn2+ (10 equiv.) 35

ELECTRONIC SUPPLIMENTRY INFORMATION
3
41. Figure S27 (b) UV-vis titration spectra of CMD (10 μM) in Ethanol upon concomitant addition of Zn2+ (0-17.5 equiv.) 35
42. Figure S28 (a) Photograph showing naked eye color change of CMD (10 μM) under visible (365 nm) light in presence of different metal ions
36
43. Figure S28(b) UV-visible spectrum of CMD (10 μM) with different metal ions (10 equiv.) in Ethanolic medium 36
44. Figure S29 Schematic representation of CMD showing quenching of PET phenomenon due to intramolecular hydrogen bonding 37
45. Figure S30 Fluorescence spectra showing effect of counter anions of zinc on the fluorescence behaviour of CMD 37
46. Figure S31 Reaction-time profile of CMD (1 μM) in presence of ZnOAc (10 equiv.) 38
47. Figure S32 Calibration curve for determination of detection limit of CMD for Zn2+ by fluorescence titration data. 39
48. Figure S33 Mass spectrum of CMD after addition of Zn2+ (200 to 500 range) 40
49. Figure S34 Mass spectrum of CMD after addition of Zn2+ (800 to 1500 range) 41
50. Figure S35 Partial 1H NMR time dependent spectra showing the gradual change in NMR upon addition of 10 equiv. of Zn2+ in CMD and comparision with 1H NMR spectrum of purely synthesized compounds .
42
51. Figure S36a) Emission spectra of ACM, ACM-Hz, CMD, NSA and CM with and without Zn2+.(b) Emission spectra of CM, CM-Zn-CM, CM-Zn-CM’ with and without Zn2+.
43
52. Figure S36 (b) Photograph showing fluorescence color change of 1(CMD), 2(CMD+Zn2+), 3(CM), 4(CM+Zn2+), 5(ACM-Hz), 6(ACM-Hz+Zn2+), 7(NSA), 8(NSA+ Zn2+), 9(ACM) and 10(ACM+Zn2+) (under visible light) in presence of different metal ions in Ethanol.
43
53. Figure S37 Absorption spectra of CMD and NSA with and without Zn2+ 4454. Figure 38 SEM image of CMD and CMD+Zn2+ 45
55. Figure S39 (a) Graph showed the percent cell viability of compound CMD measured through MTT assay at 24 h and of treatment of CMD and different concentration range of (2, 5, 10, 15, 20, 25, 30 µg/ ml media). Graph was plotted against concentration (X- axis) to relative cell viability (Y-axis). (b) Graph showing the half maximal inhibitory concentration (IC50) range of the CMD and it was near the 25 µg and thus we exposed the cells within the range of IC50 value.
46

ELECTRONIC SUPPLIMENTRY INFORMATION
4
EXPERIMENTAL SECTION
1.1 Instrumentation:
The IR Spectra were recorded on JASCO-FTIR Spectrophotometer while 1H NMR and 13C NMR spectra were
recorded on JEOL AL 500 FT NMR Spectrometer. Mass spectrometric analysis was carried out on a Brukar Compass data
analysis spectrometer. Electronic spectra were recorded at room temperature (298 K) on a UV-1700 pharmaspec
spectrophotometer with quartz cuvette (path length=1 cm). Emission spectra were recorded on JY HORIBA Fluorescence
spectrophotometer.
1.2 Materials and methods:
All reagents for synthesis were purchased from Sigma-Aldrich and were used without any further purification. All
titration experiments were carried at room temperature. All the cations were used as their chloride salts. The 1H NMR
spectra were recorded by using tetramethylsilane (TMS) as an internal reference standard.
1.3 Cell culture
SiHa and HeLa cells were used in this study. Cells were maintained in the Dulbecco's modified Eagle's medium (DMEM, HiMedia),
10% fetal bovine serum (Invitrogen), and 1X antibiotic cocktail (HiMedia) and incubated in a 5% CO2 incubator at 37˚C. Cells were
washed with I x PBS and trypsinized before seeding for experimental setup. Cells were seeded onto gelatin-coated 6-well plates and
cultured for 24 h.

ELECTRONIC SUPPLIMENTRY INFORMATION
5
1.4 Cellular imaging methodology
Fluorescent property of the compound CMD with or without presence of Zn++ was studied on the SiHa cell line. Overnight grown
more than 60 % confluent cells were used for experiment. cells were seeded in glass cover slip added 6- well plate and allowed to
grow in complete media which was prepared in DMEM with 10% FBS and 1X antibiotic cocktail. Overnight grown cells were treated
with 10µM and 20µM CMD without Zn2+ and in the presence of Zn2+(5 times higher than CMD concentration) incubated for 6h on.
Cells were washed with 1X PBS and fixed with 4% PFA for 15 min followed by 3 times 0.1% PBST washing, further stained with
DAPI for 10 min and again washed with 0.1% PBST. Unstained DAPI were removed by washing with 0.1% PBST, 3 times further
cells were mount in DABCO and imaging under confocal microscope and analyzed by LSM510-Meta software.
1.5 Cell viability experiment:
MTT assay: To check the cell viability of cells in the presence of CMD MTT (3-(4, 5-dimethylthiazol-2-yl)-2,5-diphenyl-
2H-tetrazolium bromide) colorimetric assay was done. Hela cells were seeded (1 × 10⁴ cells/well) in a 96-well plate in 100
µl complete media and incubated for 24 h at 37°C and 5% CO2. After 24 h of incubation culture were replaced with fresh
media containing CMD with varying concentrations for 24 h or 48 h. After required period of incubation of compound, cells
were washed with 1X PBS and then 10µl of MTT solution (HiMedia) (5 mg ml-1 stock prepared in 1X PBS) in 100 µl of
medium were added in culture and incubated for 3h at 37°C. After sometime formazan crystals were formed which in the
presence of dimethyl sulfoxide (DMSO) dissolved and develops color in 10 to 15 minutes that was measured by a micro
plate reader (Bio-RAD 680, USA) at 570 nm.

ELECTRONIC SUPPLIMENTRY INFORMATION
6
1.6 Determination of Quantum yield (Φ)
For measurement of the quantum yields of various species, we recorded the absorbance of the compounds in aqueous
medium. The emission spectra were recorded using the maximal excitation wavelengths, and the integrated areas of the
fluorescence-corrected spectra were measured. The quantum yields were then calculated by comparison with quinine
sulphate (0.1M H2SO4, Φs = 0.58 in water) as reference using the following equation:
Φx = Φs × (Ix/Is) × (As/Ax) × (nx/ns)2
Where, x & s indicate the unknown and standard solution respectively, Φ is the quantum yield, I is the integrated area under
the fluorescence spectra, A is the absorbance and n is the refractive index of the solvent.
1.7 X-ray diffraction studies:
The single crystal X-ray diffraction measurements were carried out on an Oxford Diffraction Xcalibur system with a Ruby
CCD detector as well as on a Bruker SMART APEX CCD diffractometer using graphite-monochromated MoKa radiation (k
= 0.71073 Å). All the determinations of unit cell and intensity data were performed with graphite monochromated Mo-Kα
radiation (λ=0.71073 A°). Data for the ligands and metal complex were collected at room temperature liquid nitrogen
temperature. The structures were solved by direct methods, using Fourier techniques and refined by full-matrix least-squares
on F2 using the SHELXTL-97 program package.S1 Crystal data and details of the structure determination for CMD, NSA
and CM-Zn-CM’ are summarized in Table S1. CCDC no. of CMD and CM-Zn-CM’ are CCDC 1588901 and 1836451
respectively which contain the supplementary crystallographic data for this paper. These data can be obtained free of charge
from the Cambridge Crystallographic Data Centre via http://www.ccdc.cam.ac.uk/cgi-bin/catreq.cgi.
References: S1. (a) G. M. Sheldrick, SHELXL-97, Program for X-ray Crystal Structure Refinement, Göttingen University, Göttingen, Germany, 1997;
(b) G. M. Sheldrick, SHELXS-97, Program for X-ray Crystal Structure Solution, Göttingen University, Göttingen, Germany, 1997.

ELECTRONIC SUPPLIMENTRY INFORMATION
7
TABLE S1: Crystal data of CMD, NSA and CM-Zn-CM’Identification code CMD NSA CM-Zn-CM’CCDC No. CCDC 1588901 CCDC 1856059 CCDC 1836451Empirical formula C22H23N3O4 C11 H15 N2 O C53 H60 N6 O18 S4 Zn2
Formula weight 393.43 191.25 1328.05Temperature 100(2)K 100(2) K 273(2)KCrystal system Monoclinic Triclinic Monoclinicspace group P2(1)/c P-1 P 21/nUnit cell dimensions a= 10.2228(5)Å , alpha=90 (2)deg.
b= 10.0210(5)Å, beta=95.874(2)deg.c= 18.7682(10) Å, gamma=90 deg.
a = 6.8677(10) A alpha = 78.996(5) deg.b = 8.2475(12) A beta = 69.498(4) deg.c = 9.6475(14) A gamma = 83.187(4) deg.
a= 18.1235(8), alpha =90 deg.b= 16.7124(7), beta= 102.8000(10) deg.c=20.6274(9), gamma = 90 deg.
Volume 1912.57(17)Å3 501.63(13) A^3 6092.5(5) Å3
Z 4 2 4Density (calculated) 1.366 mg m-3 1.266 Mg/m^3 1.448
Absorption coefficient 0.095 mm^-1 0.083 mm^-1 0.998 mm^-1F(000) 832 206 2752Crystal size 0.21 x 0.18 x 0.14 mm 0.19 x 0.16 x 0.11 mm 0.28 x 0.20 x 0.15 mmCrystal color and habit Orange, Block Yellow, Block shape Yellow, Block
Diffractometer 'Bruker APEX-II CCD' 'Bruker APEX-II CCD' 'Bruker APEX-II CCD'Theta range for data collection 2.807 to 28.354 deg. 3.118 to 28.372 deg. 2.363 to 28.477 deg
Limiting indices -13<=h<=13, -13<=k<=13, -24<=l<=25
-9<=h<=9, -11<=k<=11, -12<=l<=12 -24<=h<=24, -22<=k<=22, -27<=l<=27
Reflections collected / unique 23087/ 4775 [R(int) = 0.0760] 7764 / 2497 [R(int) = 0.0741] 91447 / 15293 [R(int) = 0.1181]
Completeness to theta = 25.00 99.9 % 99.6 % 99.9 %Refinement method Full-matrix least-squares on F^2 Full-matrix least-squares on F^2 Full-matrix least-squares on F^2Data / restraints / parameters 4775 / 0 / 290 2497 / 0 / 130 15293 / 66 / 814Goodness-of-fit on F2 0.959 1.042 1.035Final R indices [I>2sigma(I)] R1 = 0.0657, wR2 = 0.1454 R1 = 0.0656, wR2 = 0.1701 R1 = 0.0690, wR2 = 0.1421R indices (all data) R1 = 0.1599, wR2 = 0.1874 R1 = 0.0823, wR2 = 0.1881 R1 = 0.1289, wR2 = 0.1626
Largest diff. peak and hole 0.0.241 and -0.292 e.A^-3 0.356 and -0.354 e.A^-3 0.964 and -1.300 e.A^-3

ELECTRONIC SUPPLIMENTRY INFORMATION
8
TABLE S2: IMPORTANT BOND LENGTH AND BOND ANGLE FOR THE COMPLEX

ELECTRONIC SUPPLIMENTRY INFORMATION
9
Figure S1: IR spectrum of 4-methyl-7-hydroxycoumarinol

ELECTRONIC SUPPLIMENTRY INFORMATION
10
Figure S2: IR spectrum of ACM

ELECTRONIC SUPPLIMENTRY INFORMATION
11
Figure S3: 1H NMR spectrum of ACM (in CDCl3)

ELECTRONIC SUPPLIMENTRY INFORMATION
12
Figure S4: IR spectrum of ACM-Hz

ELECTRONIC SUPPLIMENTRY INFORMATION
13
Figure S5: 1H NMR spectrum of ACM-Hz (in DMSO-d6)

ELECTRONIC SUPPLIMENTRY INFORMATION
14
Figure S6: IR spectrum of CMD
ELECTRONIC SUPPLIMENTRY INFORMATION
15
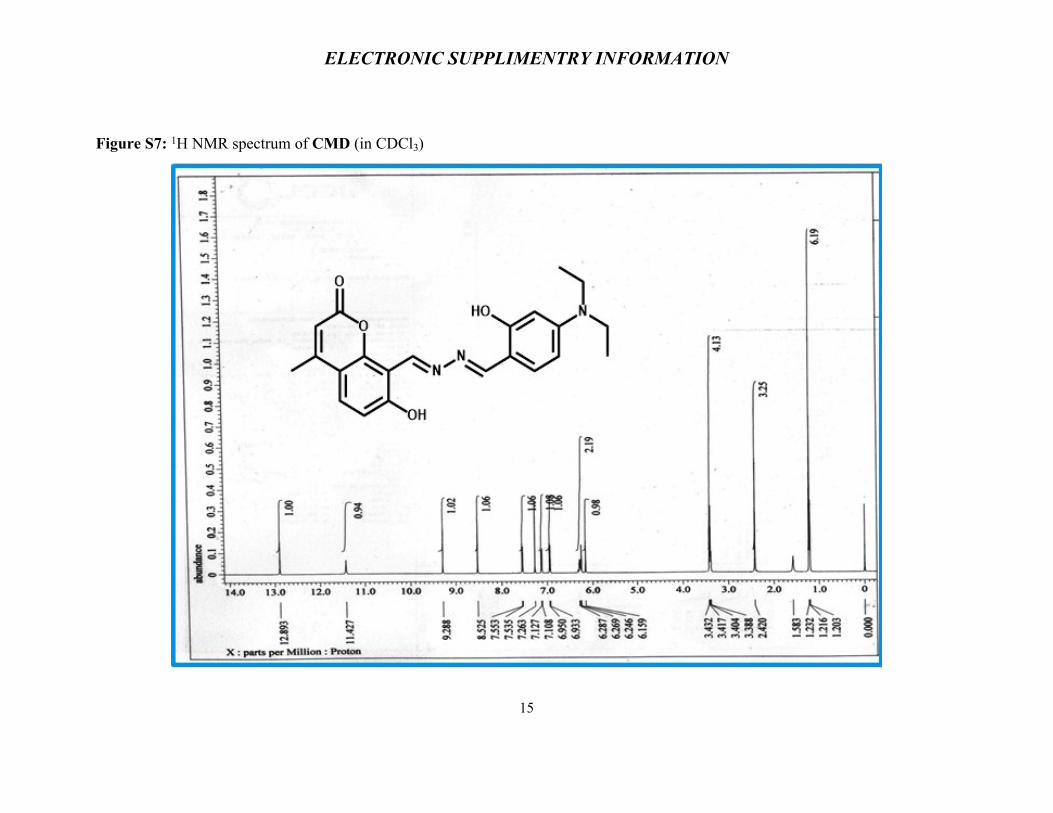
Figure S7: 1H NMR spectrum of CMD (in CDCl3)

ELECTRONIC SUPPLIMENTRY INFORMATION
16
Figure S8: 13C NMR spectrum of CMD (in CDCl3)

ELECTRONIC SUPPLIMENTRY INFORMATION
17
Figure S9: ESI-Mass Spectrum of CMD

ELECTRONIC SUPPLIMENTRY INFORMATION
18
Figure S10: IR spectrum of CM-Zn-CM’+NSA crystal

ELECTRONIC SUPPLIMENTRY INFORMATION
19
Figure S11: 1H NMR spectrum of crystals of CM-Zn-CM’+NSA (in DMSO-d6)

ELECTRONIC SUPPLIMENTRY INFORMATION
20
Figure S12: Mass Spectrum of crystals of CM-Zn-CM’+NSA.

ELECTRONIC SUPPLIMENTRY INFORMATION
21
Figure S13: IR spectrum of NSA

ELECTRONIC SUPPLIMENTRY INFORMATION
22
Figure S14: 1H NMR spectrum of NSA (in DMSO-d6)

ELECTRONIC SUPPLIMENTRY INFORMATION
23
Figure S15: 13C NMR spectrum of NSA (in DMSO-d6)

ELECTRONIC SUPPLIMENTRY INFORMATION
24
Figure S16: Mass Spectrum of NSA
ELECTRONIC SUPPLIMENTRY INFORMATION
25
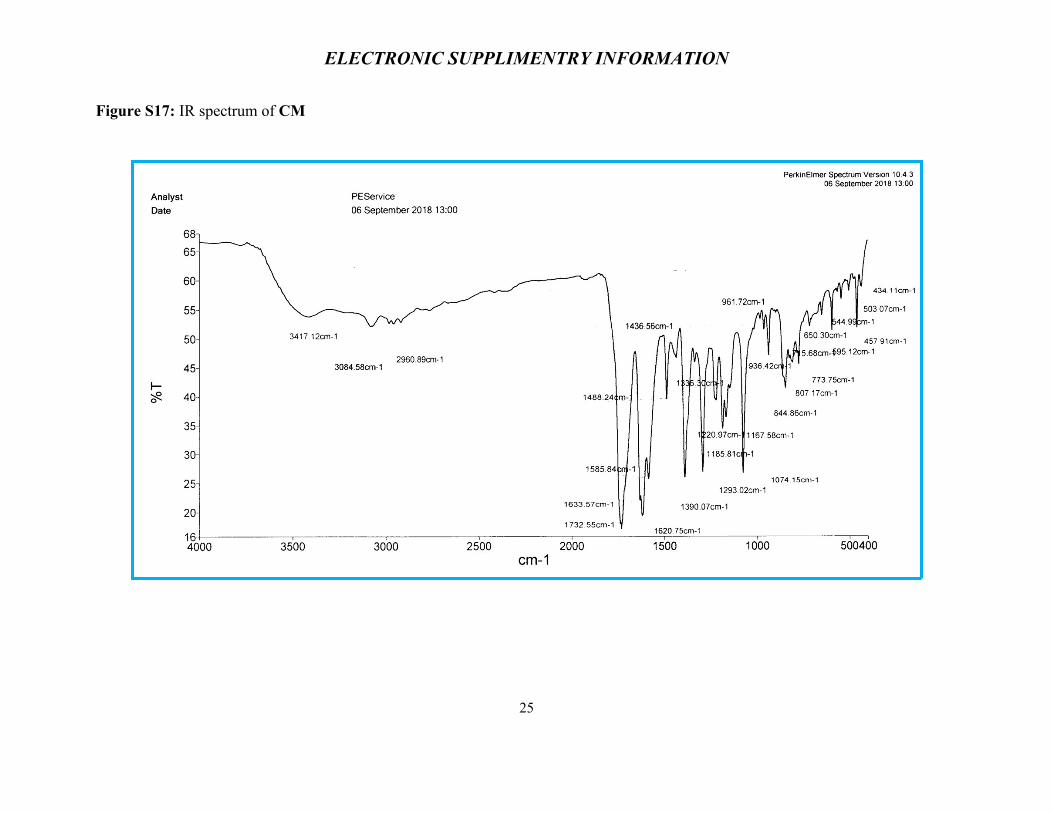
Figure S17: IR spectrum of CM

ELECTRONIC SUPPLIMENTRY INFORMATION
26
Figure S18: 1H NMR spectrum of CM (in DMSO-d6)

ELECTRONIC SUPPLIMENTRY INFORMATION
27
Figure S19: 13C NMR spectrum of CM (in DMSO-d6)

ELECTRONIC SUPPLIMENTRY INFORMATION
28
Figure 20: ESI-Mass Spectrum of CM

ELECTRONIC SUPPLIMENTRY INFORMATION
29
Figure S21: IR spectrum of CM-Zn-CM

ELECTRONIC SUPPLIMENTRY INFORMATION
30
Figure S22: 1H NMR spectrum of CM-Zn-CM (in DMSO-d6)

ELECTRONIC SUPPLIMENTRY INFORMATION
31
Figure S23: 13C NMR spectrum of CM-Zn-CM (in DMSO-d6)

ELECTRONIC SUPPLIMENTRY INFORMATION
32
Figure S24: Solid state fluorescence spectra of CMD (λex = 420 nm) and NSA (λex = 425 nm).

ELECTRONIC SUPPLIMENTRY INFORMATION
33
Figure S25: (a) Supramecular architecture showing 2D layer based inter-chain H-bondings (b) Torsion of phenyl ring and
coumarin ring at an angle of ∼4°. (c) Crystal structure of CMD showing π–π stacking interaction into head-to-tail
arrangement. (d) Hydrogen bonds between π-stacked columns.

ELECTRONIC SUPPLIMENTRY INFORMATION
34
Scheme S1: Showing crystallizing mechanism of complex of CMD with zinc acetate in DMSO+ethanol mixture after layering with Dichloromethane
Figure S26: showing ortep view of a single crystals of NSA with displacement ellipsoids at 50% probability.

ELECTRONIC SUPPLIMENTRY INFORMATION
35
Figure S27 (a): UV-vis spectra of CMD (10 μM) in Ethanol upon addition of Zn2+ (10 equiv.)
Figure S27 (b): UV-vis titration spectra of CMD (10 μM) in Ethanol upon concomitant addition of Zn2+ (0-17.5 equiv.)

ELECTRONIC SUPPLIMENTRY INFORMATION
36
Figure S28 (a): Photograph showing naked eye color change of CMD (10 μM) under visible (365 nm) light in presence of different metal ions
Figure S28(b): UV-visible spectrum of CMD (10 μM) with different metal ions (10 equiv.) in Ethanolic medium

ELECTRONIC SUPPLIMENTRY INFORMATION
37
Figure S29: Schematic representation of CMD showing quenching of PET phenomenon due to intramolecular hydrogen bonding
Figure S30: Fluorescence spectra showing effect of counter anions of zinc on the fluorescence behaviour of CMD

ELECTRONIC SUPPLIMENTRY INFORMATION
38
Figure S31: Reaction-time profile of CMD (1 μM) in presence of ZnOAc (10 equiv.)

ELECTRONIC SUPPLIMENTRY INFORMATION
39
Figure S32: Calibration curve for determination of detection limit of CMD for Zn2+ by fluorescence titration data.

ELECTRONIC SUPPLIMENTRY INFORMATION
40
Figure S33: Mass spectrum of CMD after addition of Zn2+ (200 to 500 range)

ELECTRONIC SUPPLIMENTRY INFORMATION
41
Figure S34: Mass spectrum of CMD after addition of Zn2+ (800 to 1500 range)
ELECTRONIC SUPPLIMENTRY INFORMATION
42
Fig. 35 Partial 1H NMR spectra change with time upon addition of Zn2+ (10 equiv.) in CMD (DMSO-d6) and the comparison of 1H NMR peaks of resultant in-situ synthesized products with purely synthesized compounds CM, ACM-Hz and NSA.

ELECTRONIC SUPPLIMENTRY INFORMATION
43
Figure S36 (a): (a) Emission spectra of ACM, ACM-Hz, CMD, NSA and CM with and without Zn2+.(b) Emission spectra of CM, CM-Zn-CM, CM-Zn-CM’+NSA .

ELECTRONIC SUPPLIMENTRY INFORMATION
44
Figure S36 (b): Photograph showing fluorescence color change of 1(CMD), 2(CMD+Zn2+), 3(CM), 4(CM+Zn2+), 5(ACM-Hz), 6(ACM-Hz+Zn2+), 7(NSA), 8(NSA+ Zn2+), 9(ACM) and 10(ACM+Zn2+) (under visible light) in presence of different metal ions in Ethanol.
Figure S37: Absorption spectra of CMD and NSA with and without Zn2+

ELECTRONIC SUPPLIMENTRY INFORMATION
45
Figure 38: SEM image of CMD and CMD+Zn2+.

ELECTRONIC SUPPLIMENTRY INFORMATION
46
Figure S39: (a)Graph showed the percent cell viability of compound CMD measured through MTT assay at 24 h and of treatment of CMD and different concentration range of (2, 5, 10, 15, 20, 25, 30 µg/ ml media). Graph was plotted against

ELECTRONIC SUPPLIMENTRY INFORMATION
47
concentration (X- axis) to relative cell viability (Y-axis). (b)Graph showing the half maximal inhibitory concentration (IC50) range of the CMD and it was near the 25 µg and thus we exposed the cells within the range of IC50 value.