cocoa yield evaluation and some … · les rendements dans les systèmes agro-forestiers du centre...
TRANSCRIPT

i
COCOA YIELD EVALUATION AND SOME IMPORTANT
YIELD FACTORS IN SMALL HOLDER THEOBROMA
CACAO AGROFORESTS IN BOKITO- CENTRE CAMEROON
BY:
Eltson ETECKJI FONKENG
Thesis presented in partial fulfillment of the requirements for obtaining the
diplôme d’Ingénieur Agronome - learing option crop science
DECEMBER 2014
UNIVERSITY OF DSCHANG
*******
FACULTY OF AGRONOMY AND
AGRICULTURAL SCIENCES
*******
DEPARTMENT OF CROP
SCIENCE
UNIVERSITE DE DSCHANG
*******
FACULTE D’AGRONOMIE ET DES
SCIENCES AGRICOLES
*******
DEPARTEMNT
D’AGRICULTURE

ii
COCOA YIELD EVALUATION AND SOME IMPORTANT
YIELD FACTORS IN SMALL HOLDER THEOBROMA
CACAO AGROFORESTS IN BOKITO- CENTRE CAMEROON
BY:
Eltson ETECKJI FONKENG
Ingénieur des Travaux Agricoles - learing option Crop Science
DECEMBER 2014
REPUBLIC OF CAMEROON
Peace-Work-Fatherland
*******
UNIVERSITY OF DSCHANG
*******
FACULTY OF AGRONOMY AND
AGRICULTURAL SCIENCES
*******
DEPARTMENT OF CROP
SCIENCE
REPUBLIQUE DU CAMEROUN
Paix-Travail-Patrie
*******
UNIVERSITE DE DSCHANG
*******
FACULTE D’AGRONOMIE ET DES
SCIENCES AGRICOLES
*******
DEPARTEMNT
D’AGRICULTURE
Supervisor
Dr. MVONDO AWONO Jean-Pierre
Senior lecturer at FASA
University of Dschang
Internship master
Dr. Ing Stéphane SAJ
Researcher at CIRAD
Co-supervisor
Dr. Beyegue Djonko Honore
Assistant lecturer at FASA
University of Dschang

i
CERTIFICATE OF ORIGINALITY
I the undersigned, Eltson ETECKJI FONKENG, testify that the present thesis is the fruit of
my personal work carried out within the framework of the SAFSE project at CIRAD (Centre
International de Recherche Agronomique pour le Développement) under the supervision of
Dr. Ing. Stephane Saj (CIRAD) my internship master and academic supervision of Dr
MVONDO AWONO Jean Pierre (Senior lecturer and head of Department of the Department
of crop science at the Faculty of Agronomy and Agricultural Sciences of the University of
Dschang) and Dr. Beyegue Djonko Honore (Assistant lecturer at the Department of crop
science of the Faculty of agronomy and agricultural sciences of the University of Dschang).
This thesis is authentic and has not been previously used in obtaining any university degree
or diploma.
The head of department
Date: …/…/…
Author
Eltson ETECKJI FONKENG
Date…/…../….
Supervisor
Dr. MVONDO AWONO JeanPierre
Date…/…../….
Cosupervisor
Dr. Beyegue Djonko Honore
Date…/…../….

ii
ABSTRACT
Cocoa is one of the five most important cash crops of central and West Africa. Cocoa is inter
cropped with several forest and high value tree species that provide shade to the cocoa tree
and additional income and different products for the farmers. This cocoa cultivation system
causes minimum damage to the environment as well as providing numerous other advantages
when compared to conventional monoculture system. The yields in this agroforestry system
in Centre Cameroon and the factors which mostly affect them are reviewed. The aim is to
evaluate the yields and highlight the factors governing yields in this system in view of
optimising the yields while respecting the environment. This work was carried out from April
to October 2014 in the Centre region of Cameroon (one of the main cocoa producing areas in
Cameroon) precisely in Bokito sub division.
The approach used in this work consists in randomly selecting 54 samples of dimensions
40 m x 20 m (800 m2) from already characterised cocoa agroforest (with respect to age and
preceding land occupation) in Bokito in 2013. And on each sample, data on the number of
pods (produced, ripe, diseased and destroyed by animals) was collected for yield evaluations.
Further data on cocoa population (height, architectural type, diameter at breast height) and
associate population (number of fruit trees, tree production per year) was collected for
analysis of the management structure and state of cocoa farms.
It was observed at the end of the study that the potential yield on average in Bokito is 819.2
kg/ha and that there was no significant difference of yields with respect to preceding land
occupation but there was with respect to the age of the farm. Potential yield also increases
significantly with cocoa tree basal area. Potential yield revealed a weak positive relationship
with the mean height of cocoa trees and a strong positive relationship with carbon stocks.
Pertaining to fruit trees, it was observed that citrus fruits trees appeared on top of the priority
list of farmers as companion trees for cocoa when creating their farms. It is concluded that
potential yield greatly depends on the structure of the cocoa plants and that fruit trees
providing food and a source of revenue other than cocoa is preferred to other trees by the
farmers.

iii
RÉSUMÉ
Le cacao est l’une des principales cultures de rente en Afrique Centrale et de l’Ouest. Il est
cultivé en association avec plusieurs espèces d’arbres forestiers et d’espèces d’arbres à
grande valeur ajoutée qui fournissent de l’ombrage aux cacaoyers et assurent également un
surplus de revenu aux producteurs. Ce système de culture du cacao cause moins de dégâts
environnementaux et présente de nombreux avantages par rapport au système conventionnel
de monoculture. Les rendements dans les systèmes agroforestiers du centre Cameroun et
certains facteurs dont ils dépendent sont étudiés dans la présente étude. L’objectif est
d’évaluer les rendements et de faire ressortir les facteurs déterminants dans ces systèmes en
vue de leur optimisation agronomique tout en respectant l’environnement. Ce travail a été
effectué entre Avril et Octobre 2014 dans la région du Centre Cameroun (un des principaux
bassins de production du cacao) précisément dans l’arrondissement de Bokito.
La méthodologie adoptée pour ce travail a consisté à sélectionner de manière aléatoire 54
parcelles de dimension 40 m x 20 m (800 m2) préalablement caractérisées en 2013 en
fonction de l’âge et du précédent cultural dans le cadre d’autres études. Chaque parcelle a fait
l’objet de collecte de données sur le nombre de cabosses produites, mûres, pourries et
rongées, en vue de l’estimation des rendements en cacao marchand. Des données ont été
collectées sur la structure des populations de cacaoyers (hauteur, type architectural et
diamètre à hauteur de poitrine) et sur le nombre d’espèces fruitières comprises dans les
peuplements associés pour l’analyse des stratégies de gestion des champs par les agriculteurs.
Les résultats montrent que le rendement potentiel en cacao marchand à Bokito est de 819.2
kg/ha et qu’il n’est pas dépendant du précédent cultural mais est fonction de l’âge de la
cacaoyère. Il est également démontré que ce rendement potentiel augmente significativement
avec la surface terrière des cacaoyers. Une faible corrélation positive entre le rendement
potentiel et la hauteur moyenne des cacaoyers a été observée de même qu’une forte
association entre le rendement potentiel et le stock de carbone du peuplement cacaoyer. En ce
qui concerne les espèces fruitières, il en ressort que les paysans ont une préférence pour les
agrumes comme espèces à associer au cacao. En conclusion on peut dire que la structure du
peuplement cacaoyer influence largement le rendement potentiel et que ces espèces fruitières
fournissent à la fois de la nourriture et sont une source de revenu supplémentaire aux
cacaoculteurs.

iv
DEDICATION
This work is dedicated to God almighty for the strength he has given me throughout my life
and to the Fonkeng’s family for their constant love and support in all my undertakings.

v
ACKNOWLEDGEMENTS
I must acknowledge the fact that my entire training period has been successful from the
beginning to now due to the help of many people to whom I am grateful.
I will like to thank and bless the name of the Lord Jesus Christ for all he has done and will
keep on doing to me throughout my life.
My special appreciation goes to my internship master Dr. Ing. Stephane Saj for the enormous
support and sacrifices he had to make even on a sick bed to make sure my work went on hitch
free. I say big thanks to you sir.
To my academic supervisors Dr. Mvondo Awono Jeanpierre and Dr. Beyegue Djonko
Honore for accepting to supervise my work given they all have very busy schedules.
I wish to thank the dean of the Faculty of agronomy and agricultural sciences of the
university of Dschang (former) Prof. Manjeli Yacouba and (present) Prof. Mvondo Ze
Antoine David as well as the whole teaching body of the faculty for all the guidance
throughout my five years training program especially to Prof. Tabi Fritz Oben for always
being available to help.
I also wish to thank the regional director of Cirad Patrice Grimaud for permitting me to carry
out my research work within his structure and providing all needs for the proper functioning
of my research work.
I will like to thank my parents Mr. and Mrs Fonkeng for never sparing any effort in making
me a better man. You are the best parents a child could hope for. And to my brothers and
sisters for your love I say thanks.
I will like to thank Mr. Agoume Alfred, Mr. Emmanuel Bouambi, Mr and Mrs Bidias Jean
Paul for the enormous sacrifices they made for me during my stay in Bokito.
Last but not the least, thanks to my friends Essola Etoa, Malla Marriette, Tarla Justin, Ngako
Boli, Bakemhe Madeleine, Amya Elomo, Kenfack Armelle and to all those I could not
mention here.

vi
TABLE OF CONTENTS
ABSTRACT ............................................................................................................................... ii
RÉSUMÉ ................................................................................................................................. iii
DEDICATION .......................................................................................................................... iv
ACKNOWLEGDEMENTS .......................................................... Erreur ! Signet non défini.v
TABLE OF CONTENTS .......................................................................................................... vi
TABLE OF FIGURES .............................................................................................................. ix
LIST OF TABLES ..................................................................................................................... x
LIST OF ANNEXES .......................................................................................................... xiiXI
Chapter 1 INTRODUCTION ................................................................................................. 121
1.1 Context of study ........................................................................................................... 121
1.2 Problem statement ............................................................................................................ 3
1.3 Objectives of the study..................................................................................................... 4
1.4 Hypothesis of the study .................................................................................................... 4
1.5 Importance of study ......................................................................................................... 4
1.6 Limitations of the study ................................................................................................... 5
Chapter 2 LITERATURE REVIEW .......................................................................................... 6
2.1 Definitions and characterization of concepts ................................................................... 7
2.1.1 Agroforestry and agroforestry systems ......................................................................... 7
2.1.2 Chronosequence ............................................................................................................ 7
2.1.3 Biomass ......................................................................................................................... 8
2.1.4 Biodiversity ................................................................................................................... 8
2.1.5 Climate change.............................................................................................................. 8
2.1.6 Ecosystem services ....................................................................................................... 9
2.2 Over view of cocoa .......................................................................................................... 9
2.2.1 Growing cocoa .............................................................................................................. 9
2.2.2 Origins of cocoa and its spread around the world......................................................... 9
vii
2.2.3 Recent research information on cocoa ........................................................................ 10
2.2.4 Ecology of cocoa......................................................................................................... 13
2.2.5 The plant ..................................................................................................................... 14
2.2.6 Cocoa tree varieties (cocoa bean types) or cocoa groups ........................................... 16
2.2.7 Pests and diseases of cocoa ......................................................................................... 16
2.2.8 Planting material ......................................................................................................... 17
2.2.9 Establishment of a cocoa farm .................................................................................... 18
2.2.10 Uses of cocoa ............................................................................................................ 18
2.2.11. Harvesting and postharvest processing................................................................... 18
Chapter 3: MATERIALS AND METHODS ........................................................................... 20
3.1 Study site and sampling ................................................................................................. 20
3.1.1 Secondary data ............................................................................................................ 22
3.1.2 Primary data ................................................................................................................ 22
3.2 Methodology .................................................................................................................. 23
3.2.1 Evaluation of yields .................................................................................................... 23
3.2.1.1 Potential yield evaluation ......................................................................................... 23
3.2.1.2 Actual yield evaluation. ........................................................................................... 25
3.3 Possible sources of variation in yields. .......................................................................... 28
3.3.1 The age of the farm ..................................................................................................... 28
3.3.2 The preceding land occupation or vegetation ............................................................. 28
3.3.3 The structure of the cocoa population ......................................................................... 29
3.3.4. Botanical composition and vegetation structure of the sample ................................. 30
3.3.4.1 The density of cocoa trees/ha ................................................................................... 30
3.3.4.2 Associated trees management and conservation ...................................................... 30
3.3.4.3 Basal area ................................................................................................................. 31
3.3.4.4 Cocoa biomass and carbon stocks............................................................................ 32
3.3.4.5 Pest and disease pressure ......................................................................................... 33

viii
3.4 Statistical analyses ......................................................................................................... 33
Chapter 4: RESULTS AND DISCUSSIONS .......................................................................... 34
4.1 Yield evaluations and variables ..................................................................................... 34
4.1.1 Actual yield ............................................................................................................. 3635
4.2 Effect of the structure of the cocoa population .............................................................. 36
4.2.1 Architectural profile .................................................................................................... 36
4.3 Botanical composition and vegetation structure ............................................................ 37
4.3.1 Density ........................................................................................................................ 37
4.3.2 Basal area .................................................................................................................... 39
4.3.3 Cocoa biomass and carbon stocks........................................................................... 4039
4.3.4 Associated trees management and conservation ..................................................... 4241
4.3.5 Pest and disease pressure ............................................................................................ 44
4.4 Relationship between cocoa yields and yield factors ................................................ 4544
Chapter 5: CONCLUSIONS AND RECOMMENDATIONS. ........................................... 4847
5.1 Conclusions ................................................................................................................ 4847
5.2 Recommendations ...................................................................................................... 4847
5.2.1 Research institutions ............................................................................................... 4948
5.2.2 The state and nongovernmental organisations ....................................................... 4948
5.2.3 The local farmers. ................................................................................................... 4948
REFERENCES ................................................................................................................ 5049
ANNEX........................................................................................................................ 5554

ix
TABLE OF FIGURES
Figure 1: Localisation of study zone .................................................................................... 2021
Figure 2: Schematic representation of sample plots ............................................................ 2123
Figure 3: Schematic representation of the method of pod counting. ................................... 2427
Figure 4: Method of systematic selection of 16 sample cocoa trees.................................... 2529
Figure 5: Schematic representation for evaluation of damaged pods. ................................. 2732
Figure 6: Picture of the method of avoiding double counting ripe pods. ............................ 2833
Figure 7: Cocoa architectural types ..................................................................................... 2935
Figure 8: Histogram showing the number of farms per yield class. .................................... 3442
Figure 9: Plot showing the evolution of potential yields with age. ..................................... 3544
Figure 10: Histogram showing the evolution of architectural types with age. .................... 3746
Figure 11: Histogram of cocoa tree density with respect to age. ......................................... 3847
Figure 12: Histogram of tree dry biomass, carbon stocks and basal area with age. ........... 4152
Figure 13: Evolution of cocoa carbon stocks and potential yield with age. ........................ 4253
Figure 14: Histogram of the frequency of fruit trees in Bokito. .......................................... 4354
Figure 15: Principal component analysis graph. .................................................................. 4659

x
LIST OF TABLES
Table 1: number of fields sampled with respect to age of farms and precedent culture. ..... 2124
Table 2: Average cocoa density of farms with respect to the age of the farms. .................. 3841
Table 3: Average basal area with respect to age of cocoa farms ......................................... 3943
Table 4: Average cocoa dry biomass and carbon stocks with respect to age of cocoa farms.
.............................................................................................................................................. 4044
Table 5: Species richness with respect to age ...................................................................... 4347
Table 6: Average notation of destructions caused by Mirids .............................................. 4548
LIST OF ANNEX
Annex 1 Data sheet for putting in data of counted pods in a farm…………………………...55
Annex 2 Data sheet for putting data on architectural type, number of ripe pods per tree and
per plot………………………………………………………………………………………..56
Annex 3 Canker accumulation on stem of cocoa due to mired attacks……………………...57
Annex 4 Pearson’s correlation matrix58
Annex 5: Data sheet for inventory of associated fruit tree species…………………………..59

xi

xii
Chapter 1: INTRODUCTION
1.1 Context of study
Cacao, one of the world's most important perennial crops, is almost exclusively explored for
chocolate manufacturing. There are 56 million cocoa farmers worldwide. 4050 million
people depend upon cocoa for their livelihood. About 90 % 95 % of all cocoa is produced
by smallholder farmers (World cocoa foundation (WCF), 2010. The typical size of a
smallholder farm is about three hectares, with a very large proportion of the farms in the size
group of two to five hectares. (WCF, 2010). Most cacao varieties cultivated belong to three
groups: Criollo, Forastero and Trinitario that vary according to morphology, genetic and
geographical origins. The names Criollo, Forastero and Trinitario indicate the three main
types or groups of populations of Theobroma. cacao as proposed by Cheesman (1944). The
rise in demand for cocoa bean seeds is fiendishly high but production is still not sufficient
even with the increase in surface area cultivated. Generally, in West and Central Africa,
cocoa is one of the main cash crops cultivated by the local population. West and Central
Africa’s principal cocoa (Theobroma cacao L.) producing countries (in order of importance)
are Cote d’Ivoire, Ghana, Nigeria, Cameroon, and Togo (Duguma et al, 2001). Among these
5 countries, Ivory Coast, Ghana, Nigeria and Cameroon produce three quarter of the world’s
production with respectively 1.5 million, 1 million, 0.24 million and 0.29 million tons (ICCO,
2013).
It is estimated that there are over 400,000 households producing cocoa in Cameroon (Losch
et al., 1994) but this number is much higher today. Since the late 1980s, the cocoa sector has
been subjected to several economic shocks that have led to new institutional and
organizational frameworks. This was particularly the case with countries such as Cameroon
and Ivory Coast whose economies depended heavily on the cocoa sector. The drastic fall in
the world cocoa and other commodity prices at the time contributed to substantial cuts in civil
servants salaries, significant (50%) currency devaluation, freezes on employment, tax hikes
and a reduction of state employees in both countries (Duguma et al., 2001). Cocoa farmers
and many state employees who lost their jobs or faced salary cuts responded to the crisis by
increasing their activity in food crop production to compensate for lost income. This in turn

2
led to a very significant increase in forest clearing with its attendant profound negative
environmental impacts (deforestationloss of biodiversity, exposition of soil to erosionrisk of
soil fertility loss), economic and political consequences. With the low world prices prevailing
over the past years, the economic sustainability of agricultural systems has been put in
serious question.
Due to the problems posed by the current economic situation which favoured deforestation
and thus loss of biodiversity, the government had to intervene by implementing several
structural reforms like the liberalisation of the cocoa sector in 1992 (Duguma et al., 2001)
which led to little or no support to local farmers in the cocoa sector. The local people on their
part responded to this by crop diversification where they cropped cocoa with food crops as
well as tree species. In central Cameroon, cocoa cropping is based on an agroforestry system
in which cocoa trees are always grown in association with forest or fruit tree species that
farmers preserve or introduce when the forest is felled. Cocoa trees are subsequently planted
in the cleared areas (Duguma et al., 2001). For numerous households, diversification of
revenue sources appeared to be the survival strategy (Jagoret et al., 2009).
This work takes place within the context of the SAFSE (Recherche de compromis entre
productions et services écosystémiques fournis par les systèmes agroforestiers) project hosted
by Cirad (Centre International de Recherche Agronomique pour le Développement). To attain
its goals, the project is divided into four work packages (WP) each concerning a particular
discipline and the working teams on the field.
WP0: Animation and coordination of the project around a shared conceptual
framework.
WP1: Characterisation of the composition, structure and dynamics of the system.
WP2: Production services and other ecosystem services in agroforest systems,
interactions and compromises. Our work is based in this work package.
WP3: Analysis of possible improvements of AFS (agroforestry systems) through
technical and institutional innovations.
The present study is situated in work package 2 and it is carried out in the project after the
WP0 and WP1 have been carried out i.e. after animation and coordination of the project
around a shared conceptual framework and characterisation of the composition, structure and
dynamics of the system and this was done in 2013. Specifically it is in WP2T1Opération4b
‘evaluation sur le long terme des systèmes agroforestiers à base de cacaoyer installés en zone

3
de transition forêtsavane et impact de leur composition et de leur structure sur la fertilité du
sol.’ The objectives of this work package 2, task 1, and operation b are:
analyses in the long run of the transformation of savannahs into complex cocoa based
agroforest systems through the evolution of the composition and structure of the
different populations (cocoa and associate productions).
compare in the long run the evolution of the structure of complex cocoa based agro
forest systems on savannahs to those on forest galleries.
evaluate the impact of the composition and structure of cocoa based agroforests
systems on the evolution of soil fertility in function of the two preceding vegetation or
land occupation (forest and savannah).
1.2 Problem statement
The problem that arises with complex cocoa agroforestry systems despite all the advantages
they have over other production systems is the little or no information available on the actual
and potential yield of these systems. The proportion of the potential yield that actually gets to
the farmer is not known. So evaluation of the yields in this system is of focal interest and the
extent to which certain yield factors affect yields is not properly understood.
Quantifying food production capacity on every hectare of current farmland in a consistent
and transparent manner is needed to inform decisions on policy, research, development and
investment that aim to affect future crop yields and land use and to inform onground action
by local farmers through their knowledge networks (Yield gap analysis with local to global
relevance). Potential yields are theoretical yields. It is location specific because of the
climate, but in theory not dependent on soil properties assuming that the required water and
nutrients can be added through management (which, of course, is not practical or cost
effective in cases where major soil constraints, such as salinity or physical barriers to root
proliferation, are difficult to overcome) (van Ittersum et al., 2013).
Despite the advantages agroforestry systems have over monoculture systems, production is
usually low when we consider only these advantages. This thus prompts the following
questions to be asked;
What is the potential and actual yield of cocoa in complex cocoa agroforest systems in
Bokito and how does the age and preceding culture influence these yields.
To answer this question, the following secondary questions are to be answered:
what is the effect of the age and preceding culture on yield?
what are the average weight and the number of bean seeds per cocoa pod?

4
what is the proportion of pods that reach maturity and are harvested by the
farmer?
1.3 Objectives of the study
Generally, the study is designed to optimise the yields in cocoa agroforests in Bokito.
Specifically the study seeks to:
evaluate both the actual and potential yields of cocoa in the complex
agroforestry system in Bokito;
evaluate the extent to which the potential yields depend on the age of the
plants;
evaluate the extent to which the potential yields depend on the preceding
vegetation;
determine what proportion of potential yields actually gets to the farmer (actual
yield).
1.4 Hypothesis of the study
Hypotheses resulting from research questions which were investigated in this study are the
following:
potential yield depends on system’s age (hypothesis 1);
potential yield depends on system’s preceding vegetation (hypothesis 2);
potential yield depends on interaction between age and preceding vegetation (hypothesis 3);
proportion of the potential yield actually perceived by the farmers depends on the level of
the pest and diseases pressure (hypothesis 4).
1.5 Importance of study
Cocoa is a crop of great importance to the local population of Cameroon especially those in
the cocoa production basins of the country (Centre, South West and South regions). The
economic crisis in Cameroon led to the drop of cocoa prices on the international market and
consequently led to decrease in the standard of living of the cocoa farmers.
In Cameroon, farmers opted for an increase in cocoa cropped surface areas and a composition
of a multiusage cocoa farm to make up for loss of revenue due to fluctuations of prices in the
market (Zapfack et al., 2002) which in turn has its negative effects on the environment.
On a scientific scale, this study will contribute to the bulk of knowledge on cocoa agro
forests and will serve also as a data base for subsequent research on yield and yield
improvements in cocoa agroforests.

5
On a local scale, the state and the agricultural extension workers will be able to use the results
from the study to develop better policy and advice farmers on better management of their
fields to close the yield gap between the potential and the actual yield in their farms. It will
also provide information necessary for the creation of new cocoa farms in the region so as to
optimise production.
1.6 Limitations of the study
The study could not evaluate fully the actual yields in Bokito due to the fact that farmers
were harvesting cocoa pods while the study was going on to satisfy their immediate needs.
This has surely contributed to bias estimations made for actual yield. In addition, the study
did not take into consideration other food crops. So quantifying the total amount of all other
useful produce from cocoa agroforests in Bokito would not be possible with this study.

6
Chapter 2: LITERATURE REVIEW
Cocoa was introduced into Cameroon by colonial powers in the coastal areas of the country
notably in the south west region of the country. Production was mostly done in monoculture
plantations. In Cameroon, fifth world cocoa producer, the cultivation of cocoa is mainly done
in traditional systems and it represents 91.9% of plantations in 2001 (Durot, 2013). The soils
here are highly weathered, deep and leached soils. But today cocoa production is carried out
mostly in agroforestry systems. The agroforestry systems in centre Cameroon and south
Cameroon are similar in that they are characterised by a great diversity of plants ranging from
fruit trees, forest tree species to diverse food crops. This is also noticed in the south west
region where cocoa is grown but with lesser diversity of species. This gives it a multistrata
system with different structural arrangements. Because of these, they are termed complex
agroforestry systems but more due to the diversity of species encountered. Only a limited
proportion of cocoa farms are monoculture due to the fact that most farmers are poor and
can’t afford the large inputs required for monoculture cropping of cocoa.
Agroforestry is the deliberated introduction or retention of arboreal species and or animals
with food crops on the same unit of land. In the transitional area between the forest and the
Savannah of Cameroon, Gokowski and Dury (1999) mentioned the existence of fruit tree
species such as Mangifera indica, Persea americana, Dacyrodes edulis, Citrus reticula,
Citrus sinensis, Elaeis guinensis, Cola nitida, and Irvingia gabonensis. In a survey conducted
in 37 cocoa plantations in Southern Cameroon, Zapfack et al., (2002) revealed the existence
of 116 plant species. This shows the management system adopted by the local farmers to
solve their problems and this is diversification of crops.
The 20102011 world harvest was 4.3 million tons (MT) with Africa supplying 74.8% which
corresponds to 3.2 MT, revealing a yield increase of 18.5% as compared to the previous year.
The harvest for 20112012 was lower, 4.011 MT and this due to the drought conditions that
prevailed in West Africa this season (ICCO, 2013).West Africa had a decent cocoa crop in
2012/13 (OctoberSeptember), totalling 2.76 MT, 2% lower than last season, owing to falls in
production in Ivory Coast and Ghana. The outlook for the 2013/14 season is troubled, with a
drop in fertiliser usage in Ivory Coast and Ghana likely to reduce yields, cutting production
for the region to 2.62 MT (Aithnard, 2011). Cameroon in the 2011/2012 season produced 207

7
000 tons (T) and estimates for the 2012/2013 season was 225 000 T while forecasts for the
2013/2014 season are placed at 210 000 T (ICCO, 2014).
To better understand this work, certain key definitions will be discussed and a general review
of cocoa done covering the taxonomy, production and postharvest handling of cocoa as well
as recent research on cocoa yields carried out so far and which we could lay hands on in
literature.
2.1 Definitions and characterization of concepts
2.1.1 Agroforestry and agroforestry systems
Agroforestry is any sustainable landuse system that maintains or increases total yields by
combining food crops (annuals) with tree crops (perennials) and/or livestock on the same unit
of land, either alternately or at the same time, using management practices that suit the social
and cultural characteristics of the local people and the economic and ecological conditions of
the area. Reijntjes et al., (1995).
Baumer (1987) defines an agroforestry system as a technique and mode of land use in which
trees (forest component), are voluntarily associated on the same piece of land to food crops
and or animals either simultaneously or sequentially. From this definition it can be deduced
that there are three main types of agroforestry systems and these are:
agrosylvicultural systems (food crops associated to trees)
sylvopastoral systems (trees associated to animals)
agro sylvo pastoral system (food crops associated to trees and animals)
But according to Foresta and Michon (1993) there are two groups of agroforestry systems
which are: simple and complex agroforestry systems. The simple agroforestry systems are
those containing a very limited number of species associated while the complex ones are
those containing a high number of species associated.
In this study, both Baumer’s and Foresta and Michon’s definitions are integrated in the view
of an agroforestry system.
2.1.2 Chronosequence
A chronosequence (in forest sciences) is a set of forested sites that share similar attributes but
are of different ages. Since many processes in forest ecology take a long time (decades or
centuries) to develop, chronosequence methods are used to represent and study the time
dependent development of a forest. Field data from a chronosequence can be collected in a

8
short period of several months. For example, chronosequences are often used to study the
changes in plant communities during succession.
2.1.3 Biomass
Biomass is the total number of living organisms in a given area, expressed in terms of living
or dry weight per unit area or the total amount of living material in a given habitat,
population, or sample. Specific measures of biomass are generally expressed in dry weight
(after removal of all water from the sample) per unit area of land or unit volume of water.
2.1.4 Biodiversity
Biological diversity, or the shorter "biodiversity," (biodiversity) simply means the
diversity, or variety, of plants and animals and other living things in a particular area or
region. For instance, the species that inhabit Yaoundé are different from those in Garoua.
Biodiversity also means the number, or abundance of different species living within a
particular region.
In practice, "biodiversity" suggests sustaining the diversity of species in each ecosystem as
we plan human activities that affect the use of land and natural resources. Maintaining a wide
diversity of species in each ecosystem is necessary to preserve the web of life that sustains all
living things. In his 1992 bestseller, "The Diversity of Life," famed Harvard University
biologist Edward O. Wilson known as the "father of biodiversity," said, "It is reckless to
suppose that biodiversity can be diminished indefinitely without threatening humanity itself."
This tells us that to solve most of our problems, we are to conserve as much as possible the
biodiversity in our environment.
2.1.5 Climate change
Climate is usually defined as the “average weather condition” in a place for long periods of
time. It includes patterns of temperature, precipitation (rain or snow), humidity, wind and
seasons. Climate change is a significant and lasting change in the statistical distribution of
weather patterns over periods ranging from decades to millions of years. It may be a change
in average weather conditions, or in the distribution of weather around the average conditions
(i.e., more or fewer extreme weather events). Climate change is caused by factors such as
biotic processes, variations in solar radiation received by Earth, plate tectonics, and volcanic
eruptions. Certain human activities have also been identified as significant causes of recent
climate change, often referred to as "global warming".

9
2.1.6 Ecosystem services
Ecosystem services are the actual lifesupport functions, such as cleansing, recycling, and
renewal, and they confer many intangible aesthetic and cultural benefits as well conditions
and processes through which natural ecosystems, and the species which make them up,
sustain and fulfil human life. They maintain biodiversity and the production of ecosystem
goods, such as seafood, forage, timber, biomass fuels, natural fibre, and many
pharmaceuticals, industrial products, and their precursors (Daily, 1997).
Ecosystem services can be classified into:
supporting services: The services that are necessary for the production of all
other ecosystem services including soil formation, photosynthesis, primary
production, nutrient cycling and water cycling.
provisioning services: The products obtained from ecosystems, including food,
fibre, fuel, genetic resources, biochemicals, natural medicines,
pharmaceuticals, ornamental resources and fresh water;
regulating services: The benefits obtained from the regulation of ecosystem
processes, including air quality regulation, climate regulation, water regulation,
erosion regulation, water purification, disease regulation, pest regulation,
pollination, natural hazard regulation;
cultural services: The nonmaterial benefits people obtain from ecosystems
through spiritual enrichment, cognitive development, reflection, recreation and
aesthetic experiences – thereby taking account of landscape values.
2.2 Over view of cocoa
2.2.1 Growing cocoa
2.2.2 Origins of cocoa and its spread around the world
The genus Theobroma originated millions of years in South America to the east of the Andes.
All the species of this genus originate from the humid tropical forests in the equatorial
Americas where they are exploited and used in the kitchen and in the production of refreshing
drinks (Mossu, 1990). Theobroma has been divided into twentytwo species of which T.
cacao is the most widely known ( ICCO, 2013) and according Mossu (1990), it is the only
specie commercially cultivated for grain production destined for the production of chocolate
or the extraction of cocoa butter. It was the Maya who provided tangible evidence of cacao as
a domesticated crop. The Aztec culture, dominant in Mesoamerica from the fourteenth

10
century to the Conquest, placed much emphasis on the sanctity of cacao (ICCO, 2013). They
attributed the divine origin of cocoa to the serpent God ‘Quetzacoalt’ and in the sacrifices
offered to the god the cocoa drink used was called ‘xocoatl’ from which originates the name
chocolate. This may be the reason why Carolius Linnaeus (the father of modern taxonomy)
named cultivated cocoa Theobroma cacao L. after the Greek words for god Theos, and
Broma which means food and translated to English gives ‘food for the gods’.
From the equatorial Americas, cocoa spread to the other parts of the world, first to Europe by
Herrnan Cortés, leader of an expedition in 1519 to the Aztec empire, who returned to Spain in
1528 bearing the Aztec recipe for xocoatl (chocolate drink) with him. It then was introduced
to Spain from where it spread throughout Europe. In Africa, Amelonado cacao from Brazil
was planted in Principe in 1822, Sao Tomé in 1830 and Fernando Po (today Malabo) in 1854,
then in Nigeria in 1874 and Ghana in 1879. There was already a small plantation in Bonny,
eastern Nigeria established by Chief Iboningi in 1847, as well as other plantations run by the
Coker family and established by the Christian missions. The seeds planted in Ghana were
brought from Fernando Po by Tetteh Quarshie or his apprentice Adjah, after previous
attempts by the Dutch (1815) and the Swiss (1843) to introduce cocoa in Ghana had failed. In
Cameroon, cocoa was introduced during the colonial period of 1925 to 1939 (ICCO, 2013).
2.2.3 Recent research information on cocoa
The relatively low productivity of cocoa in most cocoa producing countries and Cameroon in
particular could be attributed to a number of reasons, including poor farm maintenance
practices, planting lowyielding varieties, the incidence of pest and diseases, decline in soil
fertility, inconsistency in rainfall pattern and nonadoption of improved technologies. Cocoa
agroforest is the intercropping of cocoa trees with fruit, commercial or noncommercial
timber, or fastgrowing and highvalue tree species as well (Duguma et al., 2001). The
adoption of environmentally sound and sustainable cocoa production through cocoa agro
forest has been suggested as a useful technology to improve cocoa yields in Ghana, and other
cocoa producing countries where marginal lands are increasingly being brought under
cultivation (Asare, 2005; Boateng, 2008). Savannah’s, thus have lower production aptitudes
than forest zones case of central Cameroon where savannahs are increasingly being
transformed into cocoa agroforests. Up till date due to the diversity and complexity of such a
technological package and also due to the fact that there is a great variation in environmental

11
and socio economic conditions of the areas where cocoa is cultivated and those who farm
cocoa, there is little information available on the yield level of this system of farming.
In Cameroon, there are three main cocoa producing regions which are, the Centre, South, and
Southwest regions. Cocoa agroforestry systems in Cameroon have existed for a very long
time and have evolved with time, so in evaluating the yields of this system, emphasis has to
be placed on the age of the farms so as to be able to study the longterm dynamics of yields in
this system as such chronosequential study of this system is necessary.
In Cameroon, Losch et al., (1991) report yields of 300 kg/ha under slight shade conditions.
According to Jagoret et al., 2011, in Bokito, 45% of the cocoa plantations are 40 years old
and cocoa growing had mainly begun developing in the 1950. He also registered a yield of
326 kg/ha of dry cocoa in Bokito but on average for the central region he reported fermented
dried cocoa yields of 255 kg/ ha. It is worth noting that the potential yield of cocoa in the
forest transition zone in central Cameroon increases with the age of the farm with an increase
from 424 kg/ha of dry cocoa bean to 888 kg/ha in farms created on savannah and from
421kg/ha to 733 kg/ha in farms established on forest galleries (Jagoret, 2011) this shows that
managing strategies adopted by farmers have transformed savannah’s into cocoa production
zones and this challenges the cocoa expert’s view that savannahs have low production
potential for cocoa .
As of fruit trees, in the southern region of Cameroon, Dacryodes edulis, Irvingia gabonensis
and Ricinodendron heudelotii can produce 1.5, 0.65 and 1.87 units per tree and a bag of these
fruits weighs 68, 56 and 84 kg respectively (Ndoye, 1995). In the cocoabased agroforestry
systems in the forest transition zone in Cameroon, Massein G., 2000 reports a possible
production of 140 and 130 kg of fruits per tree for Persea americana and Mangifera indica.
One of the reasons why farmers keep on growing cocoa in this multispecific system in Centre
Cameroon is that they can sell the fruits from the associated trees (which are a source of
revenue other than cocoa) and also, the fruits are used for improving on the personal and
family diet.
Cocoa cultivation is advised by research to be done after clearing of forest and should be
done under no shade as monoculture or under slight shade. But when cocoa is cultivated
without shade, its optimum productivity can be obtained only if all other environmental
factors are favourable: availability of mineral elements in sufficient quantities, regular supply
of fertilizers, well distributed rainfall, protection against mirids (Braudeau, 1969). If not, the

12
absence of shade on the contrary has a depressive effect on the yields which are satisfying in
the short run but strongly decrease with time (Ahenkorah et al., 1974; Jadin, 1992).
Clayey soils with a good amount of organic matter are most suitable for cocoa production
(Mossu, 1990) and Jagoret et al., 2012 confirms Mossu’s prescription by adding that sandy
clayey soils with over 3% organic matter in the top soil are most suitable for cocoa
production. Further, according to Jagoret et al. (2012) Bokito (Mbam and Inoubou division,
centre region of Cameroon), our study site: forest transition zone is characterised by soil and
climatic conditions not favourable for cocoa cultivation. Bokito has an annual rainfall of
13001500mm/year (Jagoret et al, 2009(1)) which is well below the required amount of
rainfall needed by the plant per year. Also, bokito has a dry season exceeding 3months with
rainfall under 70mm which leads to tree death under monoculture conditions (Jagoret et al.,
2009(2)). Again according to Jagoret et al (2011) the annual average temperature of Bokito is
25 ºC and the soils are slightly desaturated soils. But surprisingly farmers in this region are
establishing cocoa farms on savannah’s which are not recommended by scientist and they
have been growing cocoa trees for a long time which seems to be an innovation that
challenges the expert advice of cocoa agronomist (Jagoret et al., 2012). This leaves us to
believe that these agroforestry systems are sustainable systems. Presumably, enhanced
production in these systems when compared to monoculture systems result from improved
resource status associated with common agroforestry processes; efficient nutrient cycling,
improved soil characteristics, modified light infiltration, enhanced moisture availability and
reduced weed competition (Ahenkorah et al, 1987; Hartemink, 2005).
Like most other African countries, the local farmers here produce with little or no farm inputs
since they have low access to inorganic fertilizers and pesticides. Multistrata planting
schemes integrating both upper canopy trees and cocoa (Theobroma cacao L.) are
purposefully developed by farmers to diversify farm products, secure land tenure, provide
shade for cocoa seedlings and increase biophysical advantages like improvement of soil
fertility for production (Isaac et al., 2007), control of insect attacks on crops and reducing the
incidence of diseases and many others.
Agroforestry systems have some draw backs like the fact that the too much shade they
provide may favour the development of diseases. Also, the amount of competition is very
high which may have negative effects on the development and growth of cocoa. But even if
shade may compete for growth resources, they reduce the stress of coffee (Coffea spp.) and

13
cacao (Theobroma cacao) by ameliorating adverse climatic conditions and nutritional
imbalances. For example, shade trees buffer high and low temperature extremes by as much
as 5 °C and can produce up to 14 Mg ha–1yr–1 of litter fall and pruning residues, containing up
to 340 kg N ha–1yr–1(Beer et al., 1998). Tree species can influence biogeochemistry through
variation in the quantity and chemistry of their litter, and associated impacts on the soil
heterotrophic community (Reich et al., 2005) thus they offer numerous advantages as
compared to monoculture systems.
2.2.4 Ecology of cocoa
Soil-climate requirements for cocoa cultivation
Climate factors
Climate is considered as all meteorological phenomena and environmental conditions that
directly influence the life of the cocoa tree. The main factors are: Temperature: Cocoa plants
respond well to relatively high temperatures, with a maximum annual average of 30 32ºC
and a minimum average of 18 21ºC and Rainfall: Cocoa trees are very sensitive to a soil
water deficiency. Rainfall should be plentiful and well distributed throughout the year. An
annual rainfall level of between 1,500mm and 2,000 mm is generally preferred Braudeau,
1969). Rainfall less than 100mm per month should not exceed three months if not the growth
and productivity of the tree is fiendishly compromised. The above two factors account for the
relative humidity of the environment. Cocoa tress love very high relative humidity and the
optimum is often as much as 100% during the day, falling to 7080% during the night.
Soil conditions
Cocoa needs a soil containing coarse particles and with a reasonable quantity of nutrients, to
a depth of 1.5 m to allow the development of a good root system. Below that level it is
desirable not to have impermeable material, so that excess water can drain away. Cocoa will
withstand waterlogging for short periods, but excess water should not linger. The cocoa tree
is sensitive to a lack of water, so the soil must have both water retention properties and good
drainage.
Chemical properties
The chemical properties of the topsoil are most important, as the plant has a large number of
roots for absorbing nutrients. Cocoa can grow in soils with a pH in the range of 5.07.5. It can
therefore cope with both acid and alkaline soil, but excessive acidity (pH 4.0 and below) or
alkalinity (pH 8.0 and above) must be avoided. Cocoa is tolerant of acid soils, provided the

14
nutrient content is high enough. The soil should also have a high content of organic matter:
3.5% in the top 15 centimetres of soil. Soils for cocoa must have certain anionic and cationic
balances. Exchangeable bases in the soil should amount to at least 35% of the total cation
exchange capacity (CEC), otherwise nutritional problems are likely. The ratio 1:5.is the
optimum total nitrogen / total phosphorus ratio recommended.
2.2.5 The plant
The cocoa plant is a dicotyledonous plant. It can attain a height of 1215 m in its wild state
but in domesticated conditions due to planting densities used, it attains a height of 57 m
(Mossu, 1990).
Roots
It shows a growth dimorphism at the root level with orthotropic growth (the tap root) and a
lateral growth (the lateral roots). The roots develop in the 3050 cm depth of soil and this
zone is called the rooting zone. (Mossu, 1990).
Trunk, Jorquette and secondary branches
The trunk is characterised by growing vertically (orthotropically), with a 3/8 phyllotaxy
arrangement of leaves with long petioles, the development of orthotropic axillary buds, a
welldefined growth pattern and a differentiation of normally five plagiotropic buds from
below the apex when the terminal bud degenerates. These buds develop into five branches
called the Jorquette.
The branches of a cocoa tree are characterised by: a subhorizontal (plagiotropic) or
horizontal habit, a 1/2 leaf arrangement i.e. the leaves are alternate on both sides of the stem
with leaves on short petioles, plagiotropic axillary buds ( with some few exceptions) and an
illdefined growth pattern with discontinuous flushes (Mossu, 1990).
Leaf
The leaves occur on tree trunks or during flushes on branches. The leaves are simple, oblong,
pointed and veined like a feather. On average the leaves are 20 cm long and 810 cm wide but
depending on the cultivar and exposure to light the leaf can reach 50cm long. Also those
exposed to light are thicker and stronger than shaded leaves.
Flowering and fruiting
Flowers appear at 2 years for precocious species and 34 years after germination. Flowers are
grouped in inflorescences which develop from axillary buds. Inflorescences appear each year
on the same site and produces pronounced swellings called flower cushions. The flowers are

15
small (0.51 cm in diameter) regular and pentamenous and generally white or tinged with
pink (Mossu, 1990). Only 15 per cent of the flowers are successfully pollinated to produce a
pod (Wood and Lass, 1985).
As of pollination, it has to be done in the 48 hours proceeding opening of the flowers. Cocoa
is insect pollinated. The most important group of pollinating insects are midges belonging to
several genera of the family Cera topogonidae. (Winder, 1977).
The fruit
This is the point of interest in the cocoa plant because it contains the commercial part of the
plant. The fruit starts developing three days after pollination when the flower is in the swollen
ovary stage. At the early stage, it is called a cherelle and grows to become a pod and attains
maturity after 56 months depending on the origin. The fruit is attached to the trunk or branch
by a woody stalk. The pericarp of the pod is made up of three parts which are; the hairy and
thick epicarp with an epidermis which is often pigmented, the mesocarp which is thin, hard
and more or less woody and the hairy endocarp which is of varying thickness.
Pods generally contain an average of thirty to forty seeds. This can be used in giving a rough
estimate of yield of the plantation. The pod contains a single cavity in which the seeds,
surrounded by a thick mucilaginous pulp, appear to overlap one another in five longitudinal
rows. But the numbers of seeds per pod varies enormously and according to the institute de
recherché du café et du cacao (IRCC), there are four main factors responsible for this
variations and they are:
the level of pollination (effective deposition of pollen on the styles of flowers).
the average number of ovules in the ovaries (depends on type of cocoa and it
represents the potential to produce seeds).
fertility (the number of fertilised ovules which develop into seeds.
the minimum number of seeds necessary for a cherelle to remain actively
growing (Mossu, 1990). These are thus some of the reasons that could be used
to explain abortion of fruits.
As concerns the seed morphology, the seeds when fresh have average dimensions of 2030
mm in length, 1216mm wide and 712mm thick. After the pulp and outer husk has been
removed, the seed generally weighs 1.32.3g and after drying, the same seed weighs between
0.91.5g. The weight of the dried cotyledon is generally 65% of the weight of the fresh
cotyledon but this figure may vary from 5085% (Mossu, 1990). The shape size and colour of
pods depend on the type of cocoa and this is described in the paragraph below.

16
2.2.6 Cocoa tree varieties (cocoa bean types) or cocoa groups
Generally, bean size, flavour, colour, and chemical composition of the fat, vary considerably
in beans of different origins. Traditionally, there have been two main types or groups of
cocoa described: Criollo and Forastero.
Criollo
Criollo (Theobroma cacao var cacao) means native. It is native to southern Mexico to South
America, north and west of the Andes. Fruits are oblong to ovoid in shape and have five to
ten longitudinal ridges. The seeds are yellowish white. Criollos dominated the market until
the middle of the eighteenth century, but today only a few, if any, pure Criollo trees remain
(ICCO, 2013). They are very sensitive to diseases and this could be the possible reason for
their abandon. The principal types are the Pentagona or Logarto cacao with a polygonal
shape, the Real cacao and the Porcelano cacao (Mossu, 1990). They are used in the chocolate
industry for the production of luxury products due to their low bitterness and powerful and
pleasant aroma.
Forastero
Forastero is a large group containing cultivated, semiwild and wild populations of which the
Amelonado populations are the most extensively planted. Large areas of Brazil and West
Africa are planted with Amelonado. Amelonado varieties include Comum in Brazil, West
African Amelonado in Africa, Cacao Nacional in Ecuador (ARIBA) and Matina or Ceylan in
Costa Rica and Mexico (ICCO, 2013), Maranhao, comum and Para cacao with the last two
resulting from mutation of white cotyledon cacaos Almeida and Catongo (Mossu, 1990).
Trinitario
They are descended from a cross between Criollo and Forastero. Trinitario planting started in
Trinidad, spread to Venezuela and then to Ecuador, Cameroon, Samoa, Sri Lanka, Java and
Papua New Guinea (ICCO, 2013). They have an intermediary quality between criollos and
forasteros as well as intermediary characteristics. The cultivated types mostly used today
where selected in Trinidad which explains the name trinitario. The trinitario cultivars often
carry the name of the institution where they were selected for example: ICS (Trinidad
Imperial College selection), UF (United Fruit selection in Costa Rica), SNK (Nkoemvone
selection in Cameroon) (Mossu, 1990).
2.2.7 Pests and diseases of cocoa
Mirids are the major insects that affect cocoa worldwide. The most common species in West
and central African countries are Distantiella theobroma and Sahlbergella singularis. In

17
SouthEast Asia the Helopeltis spp. is responsible for the damage related to mirids while
Monalonion species are present in South and Central America. Mirid damage alone, if left
unattended for three years, can reduce yields by as much as 75% (ICCO, 2014). Cocoa mirids
with their piercing and sucking mouthparts pierce the surface of cocoa stems, branches and
pods, killing the penetrated host cells and producing unsightly necrotic lesions by sucking
sap. Mirids feeding on shoots often result in the death of terminal branches and leaves,
causing dieback. Mated female mirids lay up to 60 eggs that are embedded in the bark of
stems forming cankers or inside the pod husk. Another important cocoa pest is the Cocoa Pod
Borer (CPB), also known as Cocoa Moth, it is the insect Conopomorpha cramerella and it
causes damage by perforating the pods.
As concerns diseases, the most common and most destructive are fungal and they include the;
black pod or phytophthora pod disease caused by the fungus phytophthora spp,
with the most common specie in Cameroon being P megacarya.
charcoal pod rot caused by the fungus Botryodiplodia theobromae.
mealy pod rot caused by the fungus trachysphaera fructigena.
There are many others which cause severe damages in different parts of the world but these
are the most dangerous in west and central Africa. They cause damages on the pods
decreasing the bean seed quality. Disease causes 21% of potential world production losses
and pests cause 25 % losses (Mossu, 1990). As for their control, there are a wide variety of
cultural methods of control and a wide range of chemicals to use in controlling pests and
diseases.
2.2.8 Planting material
Generally, the selection criteria used to collect the cocoa plant are the plant vigour,
precociousness, productivity, the size and quality of the bean and the resistance of the clone
to pests and diseases. Selection is carried out following progressive stages: the establishment
of a selection, the selection of clones from this collection, hybridisation, and evaluation of
interlineal descendants then distribution. Once the interlineal descendants accepted, they are
distributed and this can be done by the establishment of cocoa seed farms from where pods
will be gotten and can be used to create a nursery for putting in place a plantation. Also, they
can be distributed through vegetative multiplication of selected hybrids through
multiplication techniques like grafting (lateral and cleft grafting) or budding (chip budding).

18
2.2.9 Establishment of a cocoa farm
This involves several steps and operations which when clearly respected will lead to a farm
which will be less prone to production risks. The most important are the following:
Production of seedlings, choice of the planting site, land preparation, establishing temporary
shading, protecting the ground with cover crops or food crops like Flemingia macrophylla,
crotalaria spp or cetrosoma pubescens, establishing permanent shading if selected forest
species left did not suffice or if all were felled, dig planting holes, planting, maintenance
operations: (Mossu, 1990).
2.2.10 Uses of cocoa
The part of the cocoa plant that is used is the pod. After harvesting it, the seeds in the pods is
removed, fermented and dried and are thus called cocoa bean seeds. It constitutes the raw
material of important agroindustries which manufacture:
Semifinished products intended for other industries like cocoa mass used in making
chocolate, biscuits and confectionery; melted cocoa used in making sweet products in the
food industry and cocoa butter used in making sweets, chocolate, perfume, and in pharmacy.
Finished products intended directly for consumption like bars of chocolate, chocolate
confectionery and chocolate powder.
Byproducts from these industries like fats extracted from germs and husks are used in
manufacturing fertilizers, pharmaceutical products, and soaps and in making cattle feed.
2.2.11. Harvesting and post-harvest processing
Harvesting
This operation consists in detaching the ripe cocoa pods from the mother plant. After
formation of flowers and appearance of the cherelle, five to six months generally are required
for pod to reach maturity and it changes colour when ripe. The green pods turn yellow and
the red pods turn orange. Once ripe it should be harvested. The pods are harvested by sharply
and neatly cutting the stalk of the pod with a sharpened blade e.g a sharp knife or a machete.
If the trees are tall, a hook like tool attached to a handle is used in cutting the pod stalk.
Harvesting is advised to be done at a regular interval of ten to fifteen days. During harvesting,
care should be taken not to destroy the flower cushion which will carry future pods and the
tree trunk should also not be wounded so as not to create entry ports for opportunistic fungi.

19
Fermenting
The traditional process in West Africa, the world’s largest cocoa growing area, is simple:
Farmers place the pulpcovered beans on the ground, cover them with layers of leaves (often
banana), and allow the heap to remain for four to seven daysdepending on the variety of the
bean. The length of fermentation varies depending on the bean type, Forastero beans require
about 5 days and Criollo beans 23 days (ICCO, 2014). It is preferable to mix the heap every
two days so that the bean mix ferments evenly. The temperature is raised to 40ºC 45ºC
during the first 48 hours of fermentation (ICCO, 2014). As a general rule, the closer to 50 ºC,
that fermentations reach, the better the quality of the dried cocoa is (Anonymous, 2006).Other
fermentation methods include; basket and box fermentation. The fermentation is critical for
the future development of colour and flavour of the cocoa, although there are still many
unknowns as to the exact processes occurring. Development of aroma precursors is essential
to the eventual creation of flavours.
Drying of cocoa
Drying of cocoa is an important step in cocoa processing. Some of the reactions which
produce good flavoured cocoa are still proceeding during the drying process. Ideally, cocoa
should be dried over a five to seven day period or more depending on the type of drying. This
allows acids in the cocoa to evaporate off and produce a low acid, high cocoa flavoured
product. According to Mossu (1990), there are two main types of drying methods which are;
Natural drying which is drying of the bean seeds using the sun in regions where climates
permit and it can be by drying on matting, by the drying ‘autobus’ and by the movable roof
dryer.
Artificial drying which is drying done in regions with climatic conditions preventing sun
drying methods. This method uses different heat sources to dry cocoa and there are three
main types according to him which are; the simple dryer, the mechanical dryers and the
automated workshops all of which use hot air blown over the bean seeds in drying them.
It should be noted other drying methods are being developed today like the solar dryers using
specially made polythene bags for concentrating heat from the sun on the bean seeds. This is
well developed in Vietnam.

20
Chapter 3: MATERIALS AND METHODS
3.1 Study site and sampling
The study is carried out in the months of April to October 2014 in the centre region of
Cameroon precisely in Bokito. Central Cameroon is located between 2.1° to 5.8° N and 10.5°
to 16.2° E, at 600800 m elevation. The climate is hot and humid, with an average annual
temperature of 25°C. It is divided into two distinct wet and dry seasons that vary in duration
from north to south (bimodal rainfall regime).Bokito (Mbam and Inoubu Division) is located
between 4°35’N; 11°8’E. The average total annual rainfall is around 1,400 mm in Bokito and
the main dry season lasts 5 months (midNovember to midApril). It is located in the forest
savannah transition zone where there is low land pressure (29 inhab. Km2), characterized by a
patchwork of forest galleries and herbaceous and sedge savannahs on rejuvenated slightly
desaturated soils (Santoir and Bopda, 1995). In Bokito, the cultivation of cocoa is exclusively
carried out by the autochthones of the Yambassa ethnic group (Jagoret, 2011).
Figure 1: Localisation of study zone
Source: Jagoret et al, 2009. Modified by author
In the study site, this study takes place after the work of Durot (2013) which consisted in
characterisation and evaluation of carbon stocks in a network of farms she put in place. From
the network of farms 54 cocoa agroforests (each bearing an attributed number) belonging to
44 farmers (i.e. some individual farmers cropped several cocoa agroforests) are selected

21
randomly from lists of farmers belonging to local cocoa growers’ organizations. The farms
are chosen such that there is a representation of each growth stage in the evolution of a cocoa
based agro forest system. There is thus a chronosequence of five different age groups i.e. ≤
10 years (young cocoa just getting into production), 10<age≤20 (mature cocoa in full
production), 20<age≤40 (mature cocoa susceptible to yield declines), 40<age≤60 (senescent
cocoa susceptible to yield declines) and > 60 years (senescent cocoa) established on two
different precedent vegetation (forest and savannah).
Table 1: Number of fields sampled with respect to age of farms and precedent vegetation.
Age categories total
Plots/Age ≤ 10 10<age<20 20<age<40 40<age60 > 60
Forest 8 2 7 7 2 26
Savannah 2 6 5 5 10 28
Total 10 8 12 12 12 54
The study in these farms is done in rectangular sample plots of 800 m2 (20 m x 40 m). These
are homogeneous plots defined as being a portion of an area where cocoa tree stands have a
uniform age and structure. Rectangular because according to Hairiah et al (2011), rectangular
sample plots cover more heterogeneous zones and as such is more representative of the
sample population than sample plots of square or circular shape of the same surface area. He
used rectangular sample plots in his study of dimensions 20 m x 10 m. Since the larger the
sample the more precise the data from the sample, sample plots of higher dimensions than he
used are used in this study. Below is a schematic representation of a sample plot.
Figure 2: Schematic representation of sample plots

22
In any scientific work, data has to be collected for analyses in order to attempt answering the
questions posed. There are two main types of data to be collected and these are primary and
secondary data.
3.1.1 Secondary data
This is data collected from already carried out research work or from any literature relevant
to the actual research work being carried out. The secondary data collected for this study is
from the university library of the University of Dschang, from the CIRAD library, from
IRADNkolbisson library and from scientific publications from the internet.
3.1.2 Primary data
This is data collected on the field. Our primary data is collected in four phases within the
period ranging from April to October 2014. In collecting this data, the following equipment is
used:
a GPS (Garmin) for geographical localisation of farms and measuring of their
surface areas.
a bicoloured tape (white and red) for marking the limits of sample plots each
time data collection is done.
a 60 m (Mark: Stanley) and a 5 m long measuring tape for measurements on
the field.
data collection sheets for data recording.
a graduated ruler for measuring the height of cocoa tress.
a venial calliper for measurement of cocoa tree diameters.
paint (of different colours) for marking counted cocoa pods.
a bamboo stick with a piece of foam tied at its tip used for marking cocoa pods.
spray markers for marking trees in the sample plot.
plastic rings, indelible markers and hard white carbon paper for attaching labels
on the selected sample cocoa trees.
a sensitive and high precision measuring balance (Mark: Tristar) for taking the
weight of pods and bean seeds.
a digital camera to taking illustrative photos.

23
3.2 Methodology
3.2.1 Evaluation of yields
3.2.1.1 Potential yield evaluation
Potential yield is defined as the maximum attainable yield per unit land area that can be
achieved by a particular crop cultivar in an environment to which it is adapted when pests and
diseases are effectively controlled and nutrients are nonlimiting (Evans, 1993). Potential
yield is location specific because of the climate, but in theory not dependent on soil
properties assuming that the required water and nutrients can be added through management
(which, of course, is not practical or costeffective in cases where major soil constraints, such
as salinity or physical barriers to root proliferation, are difficult to overcome) Ittersum et al,
2013.
In order to evaluate this yield, a methodology that has already been partially used and
published is used in this study. The yields are evaluated in a sample surface area of 800 m2
(40 m x 20 m) already characterised in 2013 in selected farms. This methodology thus
consists in counting and marking cocoa pods which are 10 cm in length and above on all trees
in the sample plot. This is done at regular intervals (every six weeks) throughout the
production season. This method necessitates a high level of concentration and perseverance
on the field.
Once on a sample plot, the following operations are carried out:
the sample plot is delimited with the help of a white and red coloured tape.
the geographical coordinates of the plot are taken and recorded with the help of
a GPS. This done only once.
All cocoa trees in the plot are checked for a spray mark on them. If the mark is no longer very
visible, it is reinforced or if it has been wiped off, a new mark is put.
The potential yield (Yp) of cocoa is expressed in kg of commercial cocoa ha1 and it depends
on the average number of cocoa pods per tree and also on the planting density. From these
two yield components, it is possible to explain the differences in cocoa yields and to identify
the characteristics and cultural practices in the agroforest systems of Bokito which could be
at the origin of the yield differences observed if there are any. The total number of pods per
plot is determined by counting the number of fruits (with a length of more than 10 cm) per
tree in the plot. According to Lachenaud, 1991; and Bos et al, 2006, pods with a length of
more than 10 cm are no longer susceptible to be affected by physiological wilt. Because of

24
this, it is hypothesize that all pods of length superior to 10 cm will attain maturity. The total
number of pods of the cocoa population is calculated thus by summing the total of all the four
field trips during which the pods where counted in each plot.
The counting is done following the illustrative sketch below:
Figure 3: Schematic representation of the method of pod counting.
The weight of the beans in pods and the weight of a pod is gotten from 200 pods randomly
harvested throughout the 54 plots. The pods are harvested, weighed and broken. The number
of normal bean seeds is counted and weighed. The number of abnormal bean seeds is also
counted. All this information is recorded in a data sheet.
The commercial yield of cocoa ha1 is thus calculated from the formula:
Yp= (TNbpod x MFW x TC) x 10000/800
Where

25
Yp: potential commercial cocoa yield (kg/ha)
TNbpod: total number of pods per plot
MFW: mean fresh weight of beans in one pod (kg)
TC: transformation or drying coefficient
TNbpod x MFW x TC= potential yield of field (Yp (field)).
3.2.1.2 Actual yield evaluation.
This is done by systematically choosing 16 living cocoa trees as illustrated by the figure
below;
Figure 4: Method of systematic selection of 16 sample cocoa trees.
On the width (20m side), 5m is measured from one corner of the 800 m2 plot and a white and
red tape is attached at the point measuring 5m then the tape is extended along the length to
the other side of the plot as shown by the blue dashed arrow on the diagram. The closest trees
to the tape are tagged with a number written on a white hard carbon paper using a plastic

26
ring. Once 8 trees have been tagged, one stops and begins the same operation from the other
end moving in opposite direction to first tape and another series of 8 trees are selected and
tagged as well. If after doing this, not up to 16 trees which are close to the tapes are selected,
another 5m is measured again from the first tape moving to the centre of the 20m side. From
this point, the tape is stretched as before and cocoa trees are selected till 16 cocoa trees are
registered. This is done so as to cover at least 80% of the sample plot area.
Once the sixteen cocoa trees have been selected, the following operations are carried out:
a label carrying a number between 1 and 16 is put on the cocoa trees.
measure the breast height diameter of each tree (1.3m).
take down the number of stems the tree has
measure the height of the tree.
describe the architecture of the tree. (Figure 8)
These 16 trees are going to help in evaluating the number of pods produced which reached
maturity (actual yield). Since these 16 trees entered into the potential yield evaluation, the
total number of pods produced on them is already counted. Now back to those 16 trees the
number of ripe pods on them is counted and marked. The number of ripe pods is recorded in
the cocoa tree sheet (Annex 2) and the number of ripe healthy pods is recorded (Hpod), the
number of ripe but rotten pods is recorded (Rpod) as well as the number of pods eaten by
rodents (Epod). This will be used in determining the number of pods produced by the tree
which reach maturity and which biotic factor causes more loss of yield. The actual yield then
of each plot can thus be determined. The procedure for carrying out this operation is
described by figure 6.

27
Figure 5: Schematic representation for evaluation of damaged pods.
When a pod is marked in the 1st counting period and it ripens before the second counting
period, the colour used for the second counting is used to mark the pod so that it will not be
counted as a new ripe pod in the subsequent counting periods. This is illustrated below:

28
Figure 6: Picture of the method of avoiding double counting ripe pods.
Actual yield (Ya) is defined as the yield achieved by farmers in a given region under
dominant management practices (sowing date, cultivar maturity, and plant density) and soil
properties. The actual yield here will be gotten from the number of pods that reach maturity
and the same formula used in evaluating potential yield is applied here.
3.3 Possible sources of variation in yields.
3.3.1 The age of the farm
The age of the farm is an important characteristic of the farm which could have significant
influence on the productivity of the farm. To study the evolution of crops in a milieu in time,
a chronosequential study of the milieu is essential. Chronosequences are often used to study
the changes in plant communities and study the timedependent development of a forest, in
this case agroforests. To thus evaluate the evolution of yields of cocoa in the agroforests in
Bokito with time, the study uses farms of different ages (from date of creation to present
date). This led to the classification of the study plots in different age groups on the two main
types of preceding vegetation (Table 1).
3.3.2 The preceding land occupation or vegetation
This is the former utilisation of the land on which the cocoa agroforests was created. In this
case it is either a forest or savannah preceding vegetation since the study site is in a forest
New colour for current counting
added on ripe pod previously
counted and marked with red
Old colour used in previous counting.

29
savannah transition zone. The preceding land occupation can be a serious yield determinant
and so the farms where chosen such that all age groups are represented in the two preceding
vegetation.
3.3.3 The structure of the cocoa population
It is an important variable which could explain yield differences. This is described by
determining the architectural profile of the cocoa population. The architecture of a cocoa tree
depends on the type of management treatment the farmer gives the tree. In this study, the
architectural profile of the agroforests in Bokito is described individually from six
architectural types following the model proposed by Jagoret in 2011. The architectural profile
of a cocoa population is the proportion expressed in % of the different architectural types
which characterises it.
Figure 7: Cocoa architectural types
Source: Jagoret, 2011
Types 0 and 1 correspond to the 1st development stages of cocoa managed with only one stem
at the level of the first crown as recommended by agronomic research. Type 2 corresponds to
cocoa on which the farmer allows one orthotropic shoot to grow above the first crown

30
increasing the height of the plant and form the second crown. Types 3a and 3b correspond to
cocoa which originally starts growing orthotropically but its growth is interrupted by the
destruction of the terminal bud. This favours the growth of two lateral buds of the same age at
the base (3b) or at mid height (3a) with each growing orthotropically and forming its own
crown. Type 4 corresponds to senescent cocoa regenerated by the farmer or in the course of
being regenerated and on which the farmer allows the growth of several orthotropic shoots of
different ages at the base of the main stem before finally eliminating it. Lastly, type 5
corresponds to nonregenerated senescent cocoa or to cocoa which has been wounded in the
past and has lost part of its crown (Jagoret, 2011).
3.3.4. Botanical composition and vegetation structure of the sample
3.3.4.1 The density of cocoa trees/ha
The number of trees in each sample plot is counted and the cocoa density per hectare is
extrapolated from the number of individuals counted in each sample plot.
3.3.4.2 Associated trees management and conservation
In the agroforest systems in Bokito, there are numerous tree species associated with cocoa
either introduced into the farm or conserved during the creation of the farm. When land is
cleared, indigenous fruit, medicinal, and timber tree species (e.g. groundnut tree
(Ricinodendron heudelotii), cola (Cola nitida), Voacanga africana) are deliberately retained
both for their economic value and to provide shade for the cocoa plant (Duguma et al, 2001).
The species richness of each farm is obtained from data collected in 2013. The fruit trees in
the study farms are inventoried over all the total area of each cocoa forest. The
production/year and the destination of the production of the fruits are evaluated with the help
of the farmer and this done with the help of a questionnaire, (annex 5)
The frequency of each fruit species (F, %) is calculated by the following equation:
Fi= Ni/N
Where Ni is the number of trees of species i in the entire sample, while N is the total number
of trees in the sample. From the frequency of each fruit tree species it would be possible to
determine the preference choice of farmers and why the choice. A diversity index called the
ShannonWeaver Index is a commonly used diversity index that takes into accounts both
abundance and evenness of species present in the community. It is explained by the formula:
S
H = ∑ (Pi * ln Pi)

31
i=1 where,
H = the Shannon diversity index,
Pi = fraction of the entire population made up of species i (proportion of a species i (Ni)
relative to TOTAL number of species present( N), not encountered),
S = numbers of species encountered.
Here, a high value of H would be a representative of a diverse and equally distributed
community and lower values represent less diverse community. A value of 0 would represent
a community with just one species.
3.3.4.3 Basal area
There are two types of basal areas and these are the tree basal area (TBA) and the stand basal
area (SBA). According to Rondeux (1993), the basal area of a tree is the crosssectional area
of a tree's trunk at breast height (1.3 m). It is the surface occupied by a tree I in a hectare of
land. The basal area (TBA) is a simple function of diameter:
TBA=����
�
Where TBA=Basal area (m2 or cm2/ha) and Π=3.1
Di=diameter of tree i
The average basal area per cocoa tree is a major determining factor in cocoa yield. This
variable is linked to the average number of pods per cocoa tree. The positive relationship
between the average number of trunks per cocoa tree and the average basal area per tree, due
to the coppicing of senescent cocoa trees, appears to have an important role in the longterm
maintenance of cocoa yields (CIRAD, 2009). A related vegetation characteristic is stand
basal area. It is the sum of all individual tree basal areas of all the trees in the sample. It is
usually expressed on a per area basis, such as m2/ha. It is given by;
SBA =�����
�×
�
�
�
���
With: SBA= basal area of a stand of trees, Di= diameter of tree i, d= population density/ha,
n= number of individuals in sample plot.
The TBA and hence the SBA will help in the estimation of the surface area occupied by the
cocoa stands with respect to the trees associated with cocoa. This will give an idea on the
amount of shade present in the farm. The higher the SBA of associated species than that of
the cocoa stand, the more the shade which would reduce the amount of sunlight entering the
farm and as such cocoa trees will grow very tall due to completion for light where as a lower

32
SBA for associated trees will imply more sunlight into the farm thus the cocoa plants will be
shorter. This gives an indication of the vigour of cocoa plants in each case and there is a
strong relationship between productivity and vigour and this has been brought forth by many
authors (Glendinning, 1960; 1966; Lachenaud and Mossu, 1985).
3.3.4.4 Cocoa biomass and carbon stocks
Terrestrial carbon (C) stocks is the term used for the C stored in terrestrial ecosystems, as
living or dead plant biomass (aboveground and belowground) and in the soil, along with
usually negligible quantities as animal biomass. Aboveground plant biomass comprises all
woody stems, branches and leaves of living trees, creepers, climbers and epiphytes as well as
understory plants and herbaceous growth while the belowground biomass comprises living
and dead roots, soil fauna and the microbial community.
In calculating the above grown biomass (AGB) of the cocoa population in the cocoa agro
forests, the model proposed by Chave et al., (2006) and already used by Saj et al., (2013) in
Bokito’s AFS is used in this study. According to this model:
AGBi (kg) =exp[ 2.187 + 0.916 ln(Wi x(DBHi2) x Hi)]
=0.112 x (Wi x (DBHi2) x Hi) 0.916
Where in this equation AGBi represents aboveground biomass of an individual tree, Hi
individual tree height and Wi specific density of the tree. AGB is expressed in kilogram (kg),
DBH in centimetre (cm), H in meter (m) and W in g/cm3dry weight. Chave et al., (2005)
model is based on trees harvested from dry and moist tropical forest sites around the world
(rainfall less than 1500 mm) and requires data on DBH, height (H) and wood specific density
(W) for each tree. All these parameters where measured the specific wood density for cocoa
of 0.42 g cm3 was used so as to be coherent with the model used (Chave et al., 2006).
Below ground or tree root biomass (BGB).
In calculating BGB, the method proposed by COMIFAC in 2008 is used:
BGB (t/ha) =AGB x (R/S)
Where AGB is above ground biomass and R/S is the root/stem ratio.
The R/S ratio used here is 0.235 as recommended by Monkany et al., (2006).
Evaluation of carbon stocks
This is obtained by multiplying the sum of the above ground and below grown biomass by
the CF (carbon fraction), and according to the GIEC (2005) this CF is 0, 47 which
corresponds to the mean of the conventionally used value (Hairiah et al., 2011).
Carbon stocks= CF x (AGB + BGB)

33
3.3.4.5 Pest and disease pressure
The main pests are insects of the miridae family. The hazards they cause on cocoa is
evaluated following a notation scale from 0 to 3 with 0 corresponding to no destruction and 3
corresponding to maximum destruction (Brun et al., 1997 ; Sounigo et al., 2003). Three
different types of destructions are identified:
presence of dry leaves which correspond to recent mired attacks (a few
weeks);
the presence of nude branches which correspond to old mired attacks about a
few months and this is often accompanied by cryptogamic infections;
the presence of cankers, this shows the cicatrizing response of the plant to
mirid attacks and it accumulates on the stem and branches throughout its
evolution (Annex 3).
All plots where evaluated and noted for each type of the three destructions caused by mirids
and the notation for each plot corresponds to the mean of the four notations attributed (0, 1, 2,
3) (Jagoret, 2011).
3.4 Statistical analyses
Data were collected between April 2014 and November 2014. Potential yield is analysed by
twoway ANCOVA (age and preceding culture) in a factorial model including all possible
interactions to test the results as well as associating companion trees density and basal area of
big trees (DBH> 30 cm) as covariates. Other variables were analysed by twoway ANOVA
(age and preceding culture) in a factorial model including all possible interactions to test the
results. Where necessary, log transformations are carried out for variance homogenisation.
When significant differences are observed, the Tukey’s test at 95% was used to compare
between treatment means.
Further, the relationship between potential yield, companion trees, basal area and mean
height is investigated using an overlay in principal component analysis (PCA) graph with
preceding culture and age class as supplementary variables to see the relative position these
factors have in the PCA.
Data analysis is done with the help of two software’s SPSS 21.0 (IBM) and XLSTAT version
2014 5.02 (Addinsoft).

34
Chapter 4: RESULTS AND DISCUSSIONS
4.1 Yield evaluations and variables
The average number of pods per tree is 17.3 and the average weight of pods is 497.4 g (0.497
kg). But it is worth noting that on an individual level you can have > 5 pods/tree and up to
100 pods and more/tree showing a large variation. The number of beans seeds per pod is
39.46 while the average weight of normal beans seeds per pod is 118.2 g (0.118 kg). The
potential yield on average for all sampled cocoa plots in Bokito is 819.2 kg/ha. With respect
to the different potential yield classes, there is a large difference between the class with the
highest number of individuals (>1000 kg/ha) and that with the lowest number of individuals
(<200 kg/ha). In most of the farms the yields are situated around 1000 kg/ha.
Figure 8: Histogram showing the number of farms per yield class.
The potential yield in Bokito is highest in the age group > 60 (932.4 kg/ha) and lowest in age
group ≤ 10 (662.2 kg/ha) but the yields can be as high as 1881.1 kg/ha in some farms and as
low as 42.9 kg/ha showing that there are large differences when we consider individual
farms. There is no significant difference between potential yields in the different age groups
(F= 0.723, P= 0.581) as well as with the two preceding vegetation’s (F= 0.967, P= 0.331)
tested when a two way ANOVA is applied to the data. When an ANCOVA is applied, there is
a significant difference of potential yield with respect to the age categories (F= 2.681, P=
.049) but non with respect to the preceding culture (F= 0.442, P=0.511). ANCOVA is used so
as to get rid of the effects of associated trees because the density of associated trees and the
0
2
4
6
8
10
12
14
16
Nu
mb
er
of
farm
s
potential yield class kg/ha
number of farms

35
basal area of big trees affect the potential yield. There is thus a significant difference between
age group ≤ 10 and all the other group ages and this holds perfectly with the findings of
Jagoret in 2011. Yields thus increase significantly with age. On average irrespective of age,
potential yields where higher on plots created on savannah (866.9 kg/ha) than those created
on forest preceding vegetation (786.6 kg/ha) but these yields where not significantly
different.
Figure 9: Plot showing the evolution of potential yields with age.
The average number of pods and potential yield obtained is higher than those obtained by
Jagoret in 2011. This difference in the results can be explained by the fact that there is an
increase in the use of improved genetic material in Bokito cocoa agroforests as such yields
and number of pods per tree is also increasing thus higher than what he obtained. This is
supported by the large difference that exist between the highest number of pods on a tree and
the lowest suggesting that the higher number of pods corresponds to an improved genetic
material and the lower number of pods to the local genetic material. Another plausible reason
for the higher potential yield observed is the fact that this study used twice as many fields as
Jagoret in 2011. The large difference of yields observed at an individual farm level can be
attributed amongst other factors to the management strategies and treatments each farmer
applies to his farm.
a
b
b
b b
0
100
200
300
400
500
600
700
800
900
1000
≤ 10 10 < age ≤
20
20 < age ≤
40
40 < age ≤
60
> 60
po
ten
tial
yie
ld k
g/h
a
age class
Potential Yield (kg/ha)

36
4.1.1 Actual yield
The proportion of potential yield in Bokito that reaches maturity is 37.4 kg/ha and it
represents only 22.5 % of the potential yield. Diseases are responsible for 17 % losses
(rotten) while 2.02 % is lost to rodents (eaten by rodents). The values obtained for the actual
yields are much lower than what it is in reality. This is because the farmers harvest ripe pods
and do sanitation harvest successively. So before each period of data collection, these
operations have been done as such made faulty the results observed. Also, the time allocated
for this research work ended before most of the pods got ripe so the real quantity which
the farmer gets could not be evaluated. The only useful information which can be gotten
from this is that after mirids (highest damage causer on cocoa in Bokito as compared to other
productions zones in central Cameroon (Jagoret (2011)), the next factor which reduces the
proportion of the potential yield that reaches the farmer is disease incidence followed by
animal damage (rodents especially).
4.2 Effect of the structure of the cocoa population
4.2.1 Architectural profile
The architectural types (Figure 8) 5, 2 and 4 are the most represented in the cocoa population.
On average, type 5 represents 37.4 %, type 2 represents 19.8 % and type 4 represents 18.1 % of the
cocoa population while types 1, 3a and 3b are the least abundant representing respectively 8.7 %, 12.6
% and 3.4 % of the cocoa population. One notices an increase in abundance of type 5 as we increase
in age of the farm with a corresponding decrease in type 1. Also there is an increase in the proportion
of type 4 with an increase in age of the farms.

37
Figure 10: Histogram showing the evolution of architectural types with age.
The architectural profile trend corresponds perfectly to that observed by Jagoret 2011 in
Bokito. The increase in type 4 with age of the farm is proof of the activity of regeneration by
farmers in Bokito. As farms age, plants may die, or produce very little or are attained by a
disease or a fatal accident. This causes the farmer to replace them and this explains why there
are type 1 trees in all the age groups. The yield and type four trees increase with age. This
shows or proves that there is an effect of regeneration activities on yield. This should be
investigated in further research to ascertain the effect of regeneration on the yields of cocoa
in agroforests.
4.3 Botanical composition and vegetation structure
4.3.1 Density
The average density of cocoa population in Bokito is 1222 plants per hectare. According to
Jagoret (2011), the density recommended by agronomic research is between 1300 and 1600 plants per
hectare. Of all the plots sampled, only 6 have densities falling within the recommended planting
density, 8 have densities higher than this and 40 have densities lower than this recommended range.
The cocoa densities proved to be significantly different with respect to age (F=5.905, P=0.001). But
on the contrary no significant difference was observed between cocoa densities with respect to the
preceding vegetation. The age class 10 < age ≤ 20 shows the highest density (1809 ind/ha) while the
age class >60 shows the lowest density (901 ind/ha). This reveals a gradual decrease in cocoa density
per hectare with time.
0
5
10
15
20
25
30
35
40
45
50
type 1 type 2 type 3a type 3b type 4 type 5
typ
e p
rop
ort
ion
type
≤ 10
10 < age ≤ 20
20 < age ≤ 40
40 < age ≤ 60
> 60
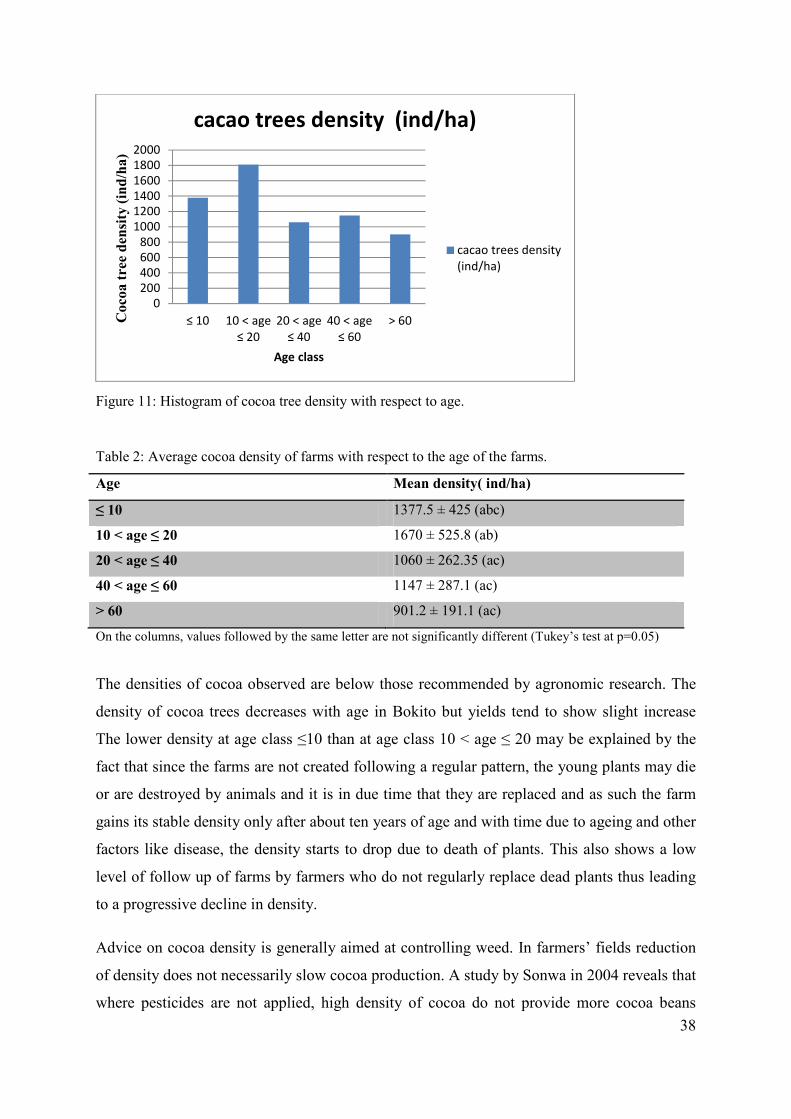
38
Figure 11: Histogram of cocoa tree density with respect to age.
Table 2: Average cocoa density of farms with respect to the age of the farms.
Age Mean density( ind/ha)
≤ 10 1377.5 ± 425 (abc)
10 < age ≤ 20 1670 ± 525.8 (ab)
20 < age ≤ 40 1060 ± 262.35 (ac)
40 < age ≤ 60 1147 ± 287.1 (ac)
> 60 901.2 ± 191.1 (ac)
On the columns, values followed by the same letter are not significantly different (Tukey’s test at p=0.05)
The densities of cocoa observed are below those recommended by agronomic research. The
density of cocoa trees decreases with age in Bokito but yields tend to show slight increase
The lower density at age class ≤10 than at age class 10 < age ≤ 20 may be explained by the
fact that since the farms are not created following a regular pattern, the young plants may die
or are destroyed by animals and it is in due time that they are replaced and as such the farm
gains its stable density only after about ten years of age and with time due to ageing and other
factors like disease, the density starts to drop due to death of plants. This also shows a low
level of follow up of farms by farmers who do not regularly replace dead plants thus leading
to a progressive decline in density.
Advice on cocoa density is generally aimed at controlling weed. In farmers’ fields reduction
of density does not necessarily slow cocoa production. A study by Sonwa in 2004 reveals that
where pesticides are not applied, high density of cocoa do not provide more cocoa beans
0200400600800
100012001400160018002000
≤ 10 10 < age ≤ 20
20 < age ≤ 40
40 < age ≤ 60
> 60Co
coa
tre
e d
ensi
ty (
ind
/ha
)
Age class
cacao trees density (ind/ha)
cacao trees density(ind/ha)

39
production. And this corresponds to what was observed from survey in Bokito. Farms with
very low density (600900 ind/ha) most at time farms of age >40 years had higher yields than
high densities farms <20 years. Upon further survey it was discovered that the owners of
these low density farms took greater care in terms of clearing their farms and suffered less
from diseases (for they believe that since their farms are old they would not produce if they
are not properly taken care of) but owners of high density farms had little weeds but they
confirmed that if they did not treat their farms against diseases, they had very little yields.
Because of this observation an age density interaction effect on yield was checked but no
interaction was found. But it is clear that density has an effect on yield which could not be
accurately proven by this study. This should be investigated in detail in further research
studies.
4.3.2 Basal area
The average basal area observed per tree is 61.3 cm2 with the highest being 388.6 cm2 and the
lowest being 3.1 cm2. This shows great variation in tree basal area. The stand basal area
observed which gives us an idea on the coverage of the farm with respect to other associate
trees is on average 25.5 m2/ha with the highest value observed in age group 40 < age ≤ 60
(33.1 m2ha) and the lowest in age group ≤ 10 (13.5 m2/ha). It is remarked that there is an
increase in the stand basal area with increase in age of the farm. There are significant
differences between the basal areas with respect to the different age groups (F=7.169,
P=0.000).
Table 3: Average basal area with respect to age of cocoa farms
Age Basal area (m2/ha)
≤ 10 13.5 ± 9.2 (ac)
10 < age ≤ 20 24.6 ± 8.6 (ac)
20 < age ≤ 40 23.4 ± 8.1 (ac)
40 < age ≤ 60 33.1 ± 10.6 (bc)
> 60 31.5 ± 10.3 (bc)
On the columns, values followed by the same letter are not significantly different (Tukey’s test at p=0.05)
This explains the increase in yield with age since the surface area occupied by cocoa plants
increases with age. This is linked to the fact that the diameter of the plants increase with age
and that the practices of regeneration practiced leads to increase in type four cocoa trees with

40
many stems and thus more diameter and coverage. The higher number of stems will bear a
higher number of fruits than the plant could bear before. It thus confirms the affirmations of
CIRAD, 2009 that the positive relationship between the average number of trunks per cocoa
tree and the average basal area per tree, due to the coppicing of senescent cocoa trees, appears
to have an important role in the longterm maintenance of cocoa yields.
4.3.3 Cocoa biomass and carbon stocks
In bokito the average cocoa dry biomass is 15902 kg/ha with the highest biomass being
recorded in farms of age >60 years (23567 kg/ha) and the lowest in younger farms of age ≤
10 years (6828. kg/ha).
The average carbon stocks in Bokito is 7.5 t/ha with the highest from age class >60 years
(11.1 t/ha) and the lowest from age class ≤ 10 (3.2 t/ha). The carbon stocks vary in the same
way as the biomass as shown on figure 13. There is a steady increase in biomass and carbon
stocks with increase in age. There is no significant difference between the forest and
savannah preceding culture but on the contrary, there are significant differences between the
age groups (F=13.841, P=0.000) or classes as shown on the table below:
Table 4: Average cocoa dry biomass and carbon stocks with respect to age of cocoa farms.
Biomass
Age class Mean (t/ha)
≤ 10 6.8 ± 3.2 (a)
10 < age ≤ 20 11.7 ± 2.9 (a)
20 < age ≤ 40 15.4 ± 6.4 (b)
40 < age ≤ 60 21.1 ± 7.95 (bc)
> 60 23.6 ± 6.0 (c)
Carbon stocks
Age class Mean (t/ha)
≤ 10 3.2± 1.5 (a)
10 < age ≤ 20 5.4 ± 1.35 (ac)
20 < age ≤ 40 7.2 ± 2.9 (bc)
40 < age ≤ 60 9.9 ± 3.7 (bc)
> 60 11.1 ± 10.3 (b)
On the columns, values followed by the same letter are not significantly different (Tukey’s test at p=0.05)

41
Figure 12: Histogram of tree dry biomass, carbon stocks and basal area with age.
Pertaining to biomass and carbon stocks, the biomass of a plant can be used to estimate the
amount of carbon stocked by the plant. The steady increase in biomass observed can be
explained by the fact that with time the plant is increasing in height and size of the trunk. Saj
et al., (2013) found on average in centre Cameroon total C content of live trees close to 70 t
ha1 but that it mostly relied on associated trees, with cocoa trees contribution being 2–12 %
of live trees total C. From this one can conclude that cocoa trees do not store much carbon.
This corresponds with the results obtained by this study for the observed cocoa carbon stock
(7.5 t/ha) falls within this range of 212 %. There is a clear pattern between cocoa production
and carbon stocks for potential yield shows significant increase with increase in carbon stock
proving thus the strong uphill relation observed at correlation tests. But, emphasis on using
cocoa agroforest for climate change mitigation should be based on associated tree which
store the greater part of carbon and not on cocoa.
0
5
10
15
20
25
30
35
≤ 10 10 < age ≤ 20
20 < age ≤ 40
40 < age ≤ 60
> 60
ton
s
Age category
cocoa tree dry biomass(t/ha)
carbon stocks (t/ha)
Basal area cacao (m2/ha)

42
Figure 13: Evolution of cocoa carbon stocks and potential yield with age.
4.3.4 Associated trees management and conservation
From the 54 sample plots, a survey of 49 plots was done to evaluate the number of fruit tree
species in each farm and determine why the farmers choose to introduce or conserve those
species in their farm. This is because these fruit trees have different destinations and uses
attributed to them by the farmer. It is observed that there are 14 different fruit species with
each farm having at least one of these and these fruits trees include: Citrus sinensis (orange),
Dacryodes edulis (plums), Citrus recticulata (mandarin), Elaseis guineensis (palm tree),
Persia Americana (Avocado), Cola nitida (cola), Mangifera indica (mango), Citrus paradisi
(grape fruit), Anacardium occidentale (cashew nut), Citrus aurantifolia (lime), Carica
papaya (pawpaw), Psidium guajava (Guava), Cocus nucifera (coconut), Citrus limon
(lemon). From the 49 farmers, it was observed that the farmers introduced or maintained
oranges, mandarins, grapes, plums, cashew nuts, lime and lemon for sales. 99% of them
preferred citrus fruits especially oranges, grapes and mandarins because their fruits have a
high price in the market and is an extra source of revenue while lime and lemon where sold
but also for medicinal purposes. Only very interesting avocado species fruits are destined for
the market. The remaining fruits are exclusively for consumption only in very rare cases
taken to the market. It is worth noting that all these fruits are not just a source of revenue but
also a source of food for the households. In Bokito, mature trees can produce in a year 120kg,
120kg, 90kg, 300kg, 185, and 175kg for Dacryodes edulis, Citrus sinensis, Citrus recticulata,
Mangifera indica, Citrus paradisi, and Persia Americana respectively.
0
2
4
6
8
10
12
14
≤ 10 10 < age ≤ 20
20 < age ≤ 40
40 < age ≤ 60
> 60
ton
s/h
a
Age class
Potential Yield (t/ha)
carbon stocks (t/ha)

43
Figure 14: Histogram of the frequency of fruit trees in Bokito.
The Shannon weaver index for cocoa agroforests in Bokito is on average 0.85 for a species
richness of 14.58. There is no significant difference of Shannon index with respect to age
(F=0.64, P=0.992) but it is significantly higher in forest than on savannah previous vegetation
(F=4.790, P=0.304). There are significant differences between age groups with respect to
species richness (F=2.199, P=0.040), and between the two preceding vegetation (F=4.183,
0.47). Species richness decreases with age of the cocoa agroforest.
Table 5: Species richness with respect to age
Species richness mean
≤ 10 11.3 ± 2.2 (a)
10 < age ≤ 20 8.9 ± 2.7(ab)
20 < age ≤ 40 8.6 ± 3.1(ab)
40 < age ≤ 60 7.7 ± 2.1(ab)
> 60 9.5 ± 3.2(b)
On the columns, values followed by the same letter are not significantly different (Tukey’s test at p=0.05).
The main functions played by the plant are important factors taken into consideration when
deciding to introduce or maintain the plant in cocoa agroforests. The utility of species, their
phenological pattern and their growth rate are the main criteria given by farmers when
selecting plants for cocoa agroforests (OduroAmeyow et al. 2003). Fruit trees are generally
0
5
10
15
20
25
30
35
Cit
rus
s
D e
du
lis
citr
us
r
Elae
is g
P a
me
rica
na
Co
la n
man
gife
ra i
Cit
rus
p
An
acar
diu
m
citr
us
a
cari
ca p
Psi
diu
m a
cocu
s n
citr
us
l
frw
qu
en
cy
Fruit tree
frequency%

44
prosperous where accessibility to the urban centers (where markets exist) is good. This for
example, is the case around the Lekie and Mbam divisions of Cameroon (Gockowski et al.,
2004). But those near the market (i.e. around Yaoundé) have the following: 6 consumables, 1
medicinal, 4 timber and 4 other plant species. A survey found that farmers of southern
Cameroon usually plant on average 7 plant species (4 fruits and 3 nonfruits) to diversify the
cocoa plantations (Sonwa 2004). This clearly shows that to make the system more market
oriented, efforts need to focus mainly on edible, medicinal and timber plants. From the
survey, the number of fruit trees per farm in Bokito is 14 which is higher than that reported
by Sonwa (2004) this clearly proves the fact that farmers in Bokito opt for preserving fruit
trees in their farms for extra source of revenue and just as mentioned earlier 99% of the
farmers did this because they sold the fruits in the market. This confirms Gockowski et al.,
(2004) statement on the 6 consumable fruit trees for those near the market and Bokito is near
urban centre like Bafia and Cameroons capital city Yaoundé.
As agroforestry is becoming a more important science and seems a tool for development in
central and West Africa, scientists such as Leakey (1998) advice the use of species such as
Baillonella toxisperma, Canarium schweinfurthii, Cola spp, Coula edulis, Dacryodes edulis,
Irvingia gabonensis for domestication programs inside multistrata agroforestry systems of the
Humid Forest Zone of West and Central Africa. This recommendation is not far from the
farmer’s priority which is using trees which can procure food and income. As such, emphasis
when giving such recommendations should be place on edible fruit trees.
4.3.5 Pest and disease pressure
The average notation attributed to plots for evaluating pest and disease pressure with respect
to mirid attacks is 0.69 as concerns the presence of old cankers, 0.66 as concerns the presence
of dry leaves, and 0.73 as concerns the presence of nude branches on a scale of 03. There are
no significant differences observed for the three types of notations with respect to the
preceding vegetation and the age groups as concerns the presence of old cankers(F=1.338,
P=0.271) and dry leaves (F=1.318, P=0.278) . But between age group > 60 and the other age
groups with respect to nude branches (F=3.149, P=0.23), there is a significant difference
observed. It is observed that the destruction caused by mirids increases with the age of the
farm. This is because the destructions caused accumulate on the stem and branches of the
plant with time especially with respect to the presence of old cankers.

45
Table 6: Average notation of destructions caused by Mirids
Age class Presence of old
cankers
Presence of dry
leaves
Presence of nude
branches
≤ 10 0.34 ± 0.28(a) 0.46 ± 0.32(a) 0.36 ± 0.37(ac)
10 < age ≤20 0.83± 0.37(a) 0.64 ± 0.22(a) 0.76 ± 0.28(ac)
20 < age ≤ 40 0.70 ± 0.53(a) 0.71 ± 0.39(a) 0.78 ± 0.43(bc)
40 < age ≤ 60 0.69 ± 0.41(a) 0.68 ± 0.29(a) 0.79 ± 0.26(bc)
> 60 1.87 ± 0.36(a) 0.76 ± 0.19(a) 0.93 ± 0.23(d)
On the columns, values followed by the same letter are not significantly different (Tukey’s test at p=0.05)
The most frequent destruction observed was the presence of nude branches. As of cankers,
they appear due to the cicatrising effect of the tree when pierced by the mirids or due to the
mirid laying eggs in the bark of the tree. This spot bearing the canker will never be able to
bear fruit thus impact the production potential of the tree thus yields. This proves that if
mirids are left unattended, yielding potential of cocoa trees can be greatly reduced.
4.4 Relationship between cocoa yields and yield factors
Correlations between the variables are examined with Pearson at 0.05 (Annex 4) and for a
better visualisation of the relationship that exists between the potential yield and all yield
factors investigated, a principal component analysis (PCA) graph is used to present the
results.

46
Figure 15: Principal component analysis graph.
On the PCA, the F1 and F2 axis represent 61.67% of the information. The F1 axis opposes
variables of associated trees (basal area DBH>30cm, density, mean height, total basal area)
and some cocoa population structure variables (basal area, mean height) to cocoa tree density
and associated tree variables (density and basal area DBH<30). The supplementary variables
show that preceding forest systems are better associated with big tree variables and lower
potential yield while preceding savannah systems are better associated with mean heights of
associated and cocoa trees as well as cocoa tree basal area and higher yields.
From the correlation table (annex 4) it is observed that:
potential yield increases significantly with cocoa tree basal area.
Potential Yield (kg/ha)
cacao trees density (ind/ha)
DBH < 30 cm associated trees density (ind/ha)
DBH > 30 cm associated
trees density (ind/ha)
Total associated trees density
(ind/ha)
Basal area cacao (m2/ha)
Basal area DBH < 30cm (m2/ha)
Basal area DBH >30cm (m2/ha)
Basal area ass. Trees (m2/ha)
Total basal area (m2/ha)
Mean height of cocoa trees (m)
Mean height of ass. trees (m)Age category
2013-very old
Age category 2013-old
Age category 2013-mature
Age category 2013-immature
Age category 2013-young
Previous system-savannah
Previous system-forest
-1
-0.75
-0.5
-0.25
0
0.25
0.5
0.75
1
-1 -0.75 -0.5 -0.25 0 0.25 0.5 0.75 1
F2 (
24
,47
%)
F1 (37,20 %)
Variables (axis F1 et F2 : 61,67 %)
Active variables supplementary variables

47
there is a weak linear relationship between potential yield and the mean height
of cocoa trees.
there is a strong positive relationship between potential yield and cocoa carbon
stocks
there is a strong positive relationship between basal area of cocoa and mean
height of cocoa trees and a very strong relationship with cocoa carbon stocks.
there is a strong positive relationship between mean height of cocoa trees and
mean height of associated trees and a very strong relationship with cocoa
carbon stocks but a negative linear relationship with total associated tree
density.
there is a weak linear relationship between total basal area and mean height of
cocoa trees.
a strong negative linear relationship exists between mean height of cocoa trees
and trees of diameter at breast height <30cm.
there is a moderate linear relationship between associated trees of diameter at
breast height <30cm and total associated tree density.
there is a weak positive linear relationship between cocoa carbon stocks and a
moderate linear relationship with mean height of associated trees.

48
Chapter 5: CONCLUSIONS AND RECOMMENDATIONS.
5.1 Conclusions
The methodology adopted and used in this study has already been used in several research
findings in cocoa agroforests and it has revealed new and confirmed existing information for
better understanding complex cocoa agroforest systems.
The evaluation of yields has permitted the situation of the level of the yields in Bokito cocoa
agroforests (819.2 kg/ha).
Analysis of the components of the cocoa agroforests in Bokito have confirmed that yields of
cocoa in these systems mostly relies on the structure of the cocoa population (here the stature,
biomass of the plant is looked at). The basal area cacao (m2/ha) has been shown to be one of
the most important factors on which cocoa yields in this system depend on. The relationship
between mean height of cocoa trees (m), cocoa carbon stock (t/ha) and potential yield has
been demonstrated by the results of this work. So in creating cocoa farms, it is recommended
to use all management strategies that will let the plant be very vigorous for example allowing
sufficient shade in the early years to make the plant grow tall thus more biomass and basal
area but this shade should be reduced with age of the farm to a considerable level. Also
revealed is the diverse management strategies adopted by farmers in managing their family
agroforests which is multi crop farms. The potential yield increases significantly with age
but is not different whether it is on savannah or forest. But at an individual level there are
large variations in potential yield depending on the care each farmer gives his farm.
Farmers prefer citrus fruit trees to other fruit trees due to the good price of their fruits on the
local markets. From this study practical recommendation as to cocoa density and associated
trees can be deduced for optimisation of cocoa yields and improvement of farmers living
conditions, conservation of biodiversity and improvement on the incomes thus standards of
living of the smallholder cocoa farmer.
In a nutshell, cocoa yields are mostly related positively to cocoa basal area, cocoa carbon
stocks and the mean height of cocoa trees but not forgetting that these variables also depend
on the associated trees present in the farms. This suggests lines of cocoa yield maximization
in cocoa agroforests.
5.2 Recommendations
In view of further optimisation of cocoa agroforestry systems, a series of recommendations
are addressed to the different parties involved in the food sector and these include research

49
institutions (for further research), the state (for better policy development and
implementation) and the local farmers for better farm management at the production zones.
5.2.1 Research institutions
Research institutions are advised to:
investigate more on the development of cocoa varieties which are more
productive and well adapted to the context of a complex cocoa agroforest.
investigate in detail on the effect of the interaction between age and density on
yields.
orient research towards higher biodiversity of fruit trees adapted to competition
that exists in complex cocoa agroforest systems so as to increase the amount
of noncocoa useful products to improve on the revenue of local farmers hence
their standards of living.
Investigate the effect of each of the main fruit trees in the agroforestry systems
in Bokito on the physicochemical characteristics of the soil, shade provision
and consequently on cocoa yields.
5.2.2 The state and non-governmental organisations
The state is advice to create a data base for the collection of all research results for regional
analysis in order to develop policies based on the realities exposed by research findings.
Added to this the state is advised to increase support towards the local farmers and encourage
young people to get into the farming activity. Last but not the least she should finance
research geared towards the optimisation of yields in all traditional farming systems since
they prove to be sustainable and environmentally friendly in the long run.
5.2.3 The local farmers.
The large disparity observed at an individual level with respect to yields in this study is
explained by the treatment each farmer gives his farm. So from this the farmers are advised
to:
increase the number of times their farms are cleared in a year.
respect their treatment calendars so as to reduce the incidence of pest and
diseases.
make themselves familiar with agricultural vulgarisation agents for the latest
useful information in improving of their farms.

50
REFERENCES
AHENKORAH Y., AKROFI G.S., ADRI A.K.., 1974. The end of the first cocoa shade and manurial
experiment at the Cocoa Research Institute of Ghana. Journal of Horticultural Science 40:
4351.
AHENKORAH Y., HALM B.J., APPIAH M.R., AKROFI G.S., YIRENKYI J.E.K., 1987.Twenty
years’ results from a shade and fertilizer trial on Amazon cocoa (Theobroma cacao) in
Ghana. Exp Agric 23: 31–39.
AITHNARD P.H., THE ECOBANK RESEARCH DIVISION 2011. Middle Africa Briefing Note |
Soft Commodities | Cocoa 3 October 2013. © EBI SA Groupe Ecobank 2011.
ANONYMOUS., 2006. Cocoa Processing Methods for the Production of High Quality Cocoa in
Vietnam.
ASARE R., 2005. Cocoa Agroforests in West Africa. A Look at Activities on Preferred Trees in the
Farming Systems. Forest and Landscape Working Papers no. 62005 Denmark.
BAUMER M., 1987. Agroforesterie et désertification. Centre technique de coopération agricole
CTA. 259 p.
BEER J., MUSCHLER R.G., KASS D., SOMARRIBA E., 1998. Shade management in coffee and
cacao plantations. Agrofor Syst38:139–164
BOATENG I., 2008. The impact of agroforestry on livelihoods: A case study of selected
communities of Offinso, Afigya Sekyere and Atwima Districts. Kwame Nkrumah
University of Science and Technology, Department of Agroforestryp p. 1517.
BOS M.M., STEFFANDEWENTER I., TSCHARNTKE T., 2006. Shade tree management affects
fruit abortion, insect, pests and pathogens of cacao. Agriculture, Ecosystems §
Environment120 : 201205.
BRAUDEAU J., 1969. Le cacaoyer. Collection Techniques agricoles et productions tropicales.
Paris, France, Maisonneuve et Larose, 304 p
BRUN L.A., SOUNIGO O., COULIBALY N., CILAS C., 1997. Methods of analysis for studying
cocoa (Theobroma cacaoL.) susceptibility to mirids. Euphytica94: 349359.
CIRAD, 2012. Evaluating cocoa agroforestry systems to design new cropping systems (research
results) Cirad.fr.
CHAVE J., MULLERLANDAU HC., BAKER TR., EASDALE TA., TER STEEGE H., WEBB
CO., (2006). Regional and phylogenetic variation of wood density across 2456 neotropical
tree species. Ecol Appl 16:2356–2367.
CHEESMAN E.E., 1944. Notes on the nomenclature, classification and possible relationships of
cocoa populations. Trop Agricult, 21: 144–159.
DAILY, G. C., 1997. Introduction: what are ecosystem services? In G. C. Daily (Ed.), Natures
services: societal dependence on natural ecosystems, pp. 110. Washington, D.C.: Island

51
Press.
COMMISSION DES FORET D’AFRIQUE CENTRALE (COMIFAC). 2008. Etats des forêts du
Bassin du Congo.406p.
DUGUMA B., GOCKOWSKI J., BAKALA J., 2001. Smallholder Cacao (Theobroma cacao Linn.)
cultivation in agroforestry systems of West and Central Africa: challenges and opportunities.
Agroforestry Systems 51 : 177188.
DUROT C., 2013. Evaluation et comparaison des stocks de carbone des systèmes agroforestiers à
base de cacaoyers du Centre Cameroun. Cas de l’arrondissement de Bokito. Mémoire de fin
d’étude, Lille, France.
EVANS, L.T., 1993. Crop Evolution, Adaptation, and Yield. Cambridge University
Press.Cambridge, UK
FAO, 2010. Statistical data. http://faostat.fao.org/default.aspx.
FAO, 2013. Statistical data. http://faostat.fao.org/default.aspx.
FORESTA H., & MICHON G., 1993. Creation and management of rural agroforests in Indonesia:
Potential applications in Africa. In: Tropical forest, people and food: biocultural interactions
and applications to development. Paris, MAB séries. 13 pp. 709724
GIEC (2005), Rapport spécial. Piégeage et stockage du dioxide de carbone. Rapport de publication
de la commission Européenne, garantir une utilisation en toute sécurité du captage et du
stockage de carbone en Europe.
GLENDINNING D.R., 1960. The relationship between growth and yield in cocoa varieties.
Euphytica9: 351355.
GLENDINNING D.R., 1966. Further observations on the relationship between growth and yield in
cocoa varieties. Euphytica15: 11127.
GOCKOWSKI J.J. AND DURY S., 1999.The economics of cocoafruit agroforests in southern
Cameroon. In Jiménez, F. and J. Beer (ed.) Multistrata Agroforestry Systems with
Perennial Crops. Pp239241. Costa Rica: CATIE.
GOCKOWSKI., WEISES.F., SONWA D.J., TCHTATM., NGOBO M.2004. Conservation because
It Pays: Shaded Cocoa Agroforests in West Africa. IITAHFC Yaounde. 29 pp.
HAIRIAH K., SONYA D., FAHMUDDIN A., SANDRA V., ANDREE E., SUBEKTI D., MEINE
V. N., 2011, measuring carbon stocks across land use systems: A Manual. Bogor,
Indonesia. World Agroforestry Centre (ICRAF), SEA Regional Office, 154 page
HARTEMINK A.E., 2005. Nutrient stocks, nutrient cycling and soil changes in cocoa ecosystems: a
review. Adv Agron 86:227–253
ICCO, 2013. Quarterly Bulletin of Cocoa Statistics, Vol. XXXIX, No. 4, Cocoa year 2012/13.
ICCO 2014 .Quarterly Bulletin of Cocoa Statistics, Vol. XL, No. 1, Cocoa year 2013/14.
ICCO, 2014. About cocoa Harvesting & Postharvest processing. www.icco.org

52
Published: 28022014
JADIN P., 1992. L’agronomie du cacaoyer a ` l’IRCC. Etudes et travaux de l’Ircc. CiradIrcc,
Montpellier, p 44
JAGORET P., TODEM H. N., BOUAMBI E., BATTINI J.L., NYASSE S., 2009(1). Diversification
des exploitations agricoles à base de cacaoyer au Centre Cameroun : mythe ou réalité?
Biotechnol. Agron. Soc. Environ.2009 13(2), 271280
JAGORET P, MICHELDOUNIAS I, MALEZIEUX E. (2009)(2). Transforming savannah into
cocoa agroforests: analysis of a local innovation by farmers in central Cameroon
JAGORET P., DOUNIAS I.M., MALE´ZIEUX E., 2011. Longterm dynamics of cocoa agroforests:
a case study in central Cameroon. Agroforest Systems, (2011) 81:267–278
JAGORET P., 2011.Analyse et évaluation de systèmes agroforestiers complexessur le long terme :
Application aux systèmes de culture à base de cacaoyer au Centre Cameroun. Thèse de
doctorat, Montpellier, France.
JAGORET, P., MICHELDOUNIAS, I., SNOECK, D., TODEM NGNOGUE, H., & MALEZIEUX,
E. 2012. Afforestation of savannah with cocoa agroforestry systems: a smallfarmer
innovation in Central Cameroon. Agroforestry Systems, 86 (3) : 493504.
LACHENAUD P., MOSSU G., 1985. Etude comparative de l’influence de deux modes de conduite
sur les facteurs du rendement d’une cacaoyère. Café Cacao Thé29 : 2130.
LACHENAUD P., 1991a. Facteurs de la fructification chez le cacaoyer (Theobroma cacao L.).
Influence sur le nombre de graines par fruit. Thèse de doctorat, Institut national
agronomique ParisGrignon, Paris, France, 188 p.
LEAKEY, R.R.B., 1998. Agroforestry in the humid lowlands of West Africa: some reflections on
future directions for research. Agroforestry Systems, 40, 253262
LOSCH, B., FUSILLIER J.L., DUPRAZ P.O., & NDJOYA, J.,1991 Stratégies des producteurs en
zone caféière et cacaoyère du Cameroun : Quelles adaptations à la crise ? Collection DSA
No 12. DSACIRAD, 252pp.
MARTIN K. VAN ITTERSUM, KENNETH G. CASSMAN, PATRICIO GRASSINIB, JOOST
WOLFA., PABLO TITTONELL., ZVI HOCHMAND., (2013). Yield gap analysis with
local to global relevance—A review. Field Crops Research 143 (2013) 4–17.
www.elsevier.com/locate/fcr.
MASSEIN G., 2000. Impact des variations de prix du cacao sur les stratégies de plantations des
producteurs de la Lékié, CentreCameroun.Etude de cas à Ntsan (arrondissement d'Obala).
Mémoire de diplôme d'ingénieur: Agro M, Montpellier, IITA, CIRAD, 93p
M. E. ISAAC., V. R. TIMMER AND S. J. QUASHIESAM 2007. Shade tree effects in an 8year
old cocoa agroforestry system: biomass and nutrient diagnosis of Theobroma cacao by
vector analysis. Nutrient Cycling in Agro ecosystems 2007. 78:155–165. © Springer

53
Science+Business Media B.V. 200710.1007/s107050069081.
MOKANY K, RAISON RJ, PROKUSHKIN AS (2006) Critical analysis of root: shoot ratios in
terrestrial biomes. Glob Change Biol 12:84–96.
MOSSU G, 1990 Le cacaoyer, Maisonneuve et Larose, 1990
NDOYE O., & RUIZPEREZ M., 1995. Commerce transfrontalier et intégration régionale en
Afrique centrale: Cas des produits forestiers nonligneux. Cahier des Sciences Humaines.
Yaoundé, Cameroun: ORSTOM. 21p.
ODUROAMEYAW C., OSEIBONSU K. AND TETTEH J.P. 2003. Traditional cocoa
agroforestry: 2. Indigenous selection criteria for shade trees on cocoa farms in a typical
Cocoa growing district in Ghana. (Poster) 14th International Cocoa Research Conference,
1318 October 2003 Accra, Ghana
PROJET CIRAD / IRD / AIRD, 2012. Document principal. Recherche de compromis entre
productions et services écosystémiques fournis par les systèmes agroforestiers
(SAFSÉ). Cirad.fr
REICH L, 2005 Linking litter calcium, earthworms and soil properties: a common garden test with
14 tree species. Ecology Letters, (2005) 8: 811–818.
REIJNTJES, C., HAVERKORT, B., WATERSBAYER, A, 1995. Une agriculture pour demain:
Introduction à une agriculture durable avec peu d’intrants externes. Wageningen, PaysBas:
CTA et KHARTHALA, 473p.
STÉPHANE SAJ., PATRICK JAGORET & HERVÉ TODEM NGOGUE., 2013. Carbon storage
and density dynamics of associated trees in three contrasting Theobroma cacao agroforests
of Central Cameroon. Agroforest Syst (2013) 87:13091320.
SANTOIR C., BOPDA A., 1995. Atlas régional SudCameroun. Paris, France, Orstom, 53 p.
SONWA D.J., OKAFOR J.C., MPUNGI B, P., WEISE S., TCHATAT M., ADESINA A.,
NKONGMENECK A.B., NDOYE O. & ENDAMANA D., 2002. Dacryodes edulis, a
neglected nontimber forest species for the agroforestry system of West and Central Africa.
Forest trees and livelihoods, 12: 4145
SONWA D., 2004. Biomass management and diversification within cocoa agroforests in the humid
forest zone of Southern Cameroon. 130 p.PhD Thesis, Kumba, Cameroon.
SOUNIGO O., COULIBALY N., BRUN L., N’GORAN J., CILAS C., ESKES A.B., 2003.
Evaluation of resistance of Theobroma cacao L to mirids in Côte d’Ivoire: results of
comparative progeny trials. Crop protection2: 615621.
WINDER, J. A., 1977. Recent research on insect pollination of cocoa. Cocoa Growers Bull. 26: 11
19.
WOOD G. A. R., AND LASS R. A., 1985. Cocoa. The Tropical Agriculture Series.
Gordon Wrigley Cadhury Schweppes plc (formerly Cadhury Limited/Cadhury Brothers

54
Limited). 1961 0 Longman Group Ltd, 1975. Blackwell Science Ltd
WORLD COCOA FOUNDATION. 2010. Learn about Cocoa" Retrieved Feb, 2011 from:
http://www.worldcocoafoundation.org/learnaboutcocoa/
ZAPFACK L., ENGWALD S., SONKE´ B., ACHOUNDONG G., MADONG B.A., 2002.
The impact of land use conversion on plant biodiversity in the forest zone of Cameroon.
Biodiversity Conservation 11(11):2047–2061

55
ANNEX
Annex 1 Data sheet for putting in data of counted pods in a farm
Field n° Farmers name GPS Coordinates N : 4.58346 E : 11.1567 N : E :
1 Biedi Barthelemy of angles N : E : N : E :
Square size according to GPS (m²)1 cell = number of pods counted on one cocoa tree 1 cell = number of pods counted on one cocoa tree 1 cell = number of pods counted on one cocoa tree
cocoa 1 0 cocoa 9 0 cocoa 1 0 cocoa 9 0 cocoa 1 0 cocoa 9 1cocoa 2 0 cocoa 10 0 cocoa 2 0 cocoa 10 0 cocoa 2 0 cocoa 10 0cocoa 3 0 cocoa 11 0 cocoa 3 0 cocoa 11 0 cocoa 3 0 cocoa 11 0cocoa 4 0 cocoa 12 0 cocoa 4 0 cocoa 12 0 cocoa 4 1 cocoa 12 0cocoa 5 0 cocoa 13 0 cocoa 5 0 cocoa 13 5 cocoa 5 0 cocoa 13 23cocoa 6 0 cocoa 14 0 cocoa 6 0 cocoa 14 1 cocoa 6 0 cocoa 14 0cocoa 7 0 cocoa 15 0 cocoa 7 5 cocoa 15 0 cocoa 7 11 cocoa 15 0cocoa 8 0 cocoa 16 0 cocoa 8 0 cocoa 16 0 cocoa 8 9 cocoa 16 0
0 0 0 2 2 00 0 0 0 0 550 0 0 0 0 00 0 0 0 0 20 0 7 0 0 560 0 0 0 0 00 0 2 0 0 00 0 0 0 2 00 0 0 0 21 00 0 2 0 82 00 0 5 0 0 00 0 0 0 0 30 0 0 0 8 00 0 0 0 0 00 0 0 0 0 00 0 0 0 0 00 0 0 0 0 00 0 3 0 0 00 0 0 0 2 60 0 0 0 0 00 0 0 0 0 00 0 0 0 0 00 0 0 0 15 00 0 00 0 00 0 00 0 00 0 0
total 1 = total 2 = total 3 =
Pa
ssa
ge
1
/
d
ate
: 1
8/0
4/2
01
4
/
pe
intu
re
:Blu
e
Pa
ssa
ge
2
/
d
ate
: 2
3/0
6/2
01
4
/
pe
intu
re :
Re
d
Pa
ssa
ge
3
/
d
ate
:0
1/0
9/2
01
4
/
pe
intu
re :
wh
ite
0 32 299

56
Annex 2 Data sheet for putting data on architectural type, number of ripe pods per tree and per plot
Field n° 55 Farmers name Moutono Francois
A = x+y+z x y z A = x+y+z x y z A = x+y+z x y z
Height (m) DBH (cm)1 DBH (cm)2 DBH (cm)3 DBH (cm)4Architectu
re
Nb total
de
cabosses
mûres
Nb
cabosses
mûres
saines
Nb
cabosses
mûres
pourries
Nb
cabosses
rongées
Nb total
de
cabosses
mûres
Nb
cabosses
mûres
saines
Nb
cabosses
mûres
pourries
Nb
cabosses
rongées
Nb total
de
cabosses
mûres
Nb
cabosses
mûres
saines
Nb
cabosses
mûres
pourries
Nb
cabosses
rongées
Cocoa tree 1 5.7 8.5 5 0 0 0 0 0 0 0 0 0 0 0 0
Cocoa tree 2 5.75 13.5 2 1 1 0 0 0 0 0 0 0 0 0 0
Cocoa tree 3 3.75 7.5 2 0 0 0 0 0 0 0 0 0 0 0 0
Cocoa tree 4 6.55 11 9.5 3a 2 1 0 1 0 0 0 0 0 0 0 0
Cocoa tree 5 6.25 11 2 0 0 0 0 0 0 0 0 0 0 0 0
Cocoa tree 6 4.95 6 4 3a 0 0 0 0 0 0 0 0 0 0 0 0
Cocoa tree 7 5.35 6 2 3 2 0 1 0 0 0 0 0 0 0 0
Cocoa tree 8 5.5 8.3 5 0 0 0 0 0 0 0 0 0 0 0 0
Cocoa tree 9 5.3 8 2.3 4 0 0 0 0 0 0 0 0 0 0 0 0
Cocoa tree 10 4.9 9 5 0 0 0 0 0 0 0 0 0 0 0 0
Cocoa tree 11 2.9 4.5 3.2 3a 0 0 0 0 0 0 0 0 0 0 0 0
Cocoa tree 12 3.9 3.5 5 0 0 0 0 0 0 0 0 0 0 0 0
Cocoa tree 13 5.7 10 6.5 4 0 0 0 0 0 0 0 0 0 0 0 0
Cocoa tree 14 5.3 7.5 5 0 0 0 0 0 0 0 0 0 0 0 0
Cocoa tree 15 6.1 7.3 11 4 0 0 0 0 0 0 0 0 0 0 0 0
Cocoa tree 16 5.85 6.2 8 4 1 1 0 0 0 0 0 0 0 0 0 0Pas
sage
1
dat
e:1
0/0
6/2
01
4
pe
intu
re :B
lue
Pas
sage
2
dat
e:1
0/0
6/2
01
4
pe
intu
re :R
ed
Pas
sage
3
dat
e: 2
5/0
8/2
01
4
pe
intu
re :w
hit
e

57
Annex 3 Canker accumulation on stem of cocoa due to mired attacks.
Canker on a cocoa stem

58
Annex 4 Pearson’s correlation matrix
Correlation matrix (Pearson) :
Variables Potential Yield (kg/ha)cacao trees density (ind/ha)DBH < 30 cm associated trees density (ind/ha)DBH > 30 cm associated trees density (ind/ha)Total associated trees density (ind/ha)Basal area cacao (m2/ha)Basal area DBH < 30cm (m2/ha)Basal area DBH >30cm (m2/ha)Basal area ass. Trees (m2/ha)Total basal area (m2/ha)Mean height of cocoa trees (m)Mean height of ass. trees (m)Cocoa C stock (t/ha)Ass tree < 30 diam C stock (t/ha)Ass tree > 30 diam C stock (t/ha)Associated trees total C stock (t/ha)Total C in trees (t/ha)
Potential Yield (kg/ha) 1 0.244 0.237 -0.268 0.193 0.469 0.031 -0.109 -0.104 0.040 0.282 -0.146 0.446 0.069 -0.123 -0.117 -0.077
cacao trees density (ind/ha) 0.244 1 0.592 -0.114 0.585 0.127 0.009 -0.143 -0.141 -0.099 -0.366 -0.527 0.009 -0.059 -0.194 -0.199 -0.196
DBH < 30 cm associated trees density (ind/ha) 0.237 0.592 1 -0.222 0.984 -0.197 0.420 -0.198 -0.139 -0.196 -0.467 -0.680 -0.307 0.271 -0.210 -0.187 -0.212
DBH > 30 cm associated trees density (ind/ha) -0.268 -0.114 -0.222 1 -0.043 -0.263 0.027 0.711 0.710 0.616 0.028 0.268 -0.208 0.053 0.636 0.640 0.617
Total associated trees density (ind/ha) 0.193 0.585 0.984 -0.043 1 -0.250 0.436 -0.072 -0.012 -0.088 -0.473 -0.648 -0.353 0.287 -0.098 -0.074 -0.104
Basal area cacao (m2/ha) 0.469 0.127 -0.197 -0.263 -0.250 1 -0.247 -0.054 -0.087 0.218 0.648 0.197 0.978 -0.149 -0.006 -0.018 0.067
Basal area DBH < 30cm (m2/ha) 0.031 0.009 0.420 0.027 0.436 -0.247 1 -0.022 0.114 0.037 -0.191 -0.349 -0.262 0.945 -0.069 0.011 -0.012
Basal area DBH >30cm (m2/ha) -0.109 -0.143 -0.198 0.711 -0.072 -0.054 -0.022 1 0.991 0.954 0.132 0.542 0.012 0.036 0.962 0.963 0.957
Basal area ass. Trees (m2/ha) -0.104 -0.141 -0.139 0.710 -0.012 -0.087 0.114 0.991 1 0.953 0.105 0.491 -0.024 0.163 0.946 0.958 0.949
Total basal area (m2/ha) 0.040 -0.099 -0.196 0.616 -0.088 0.218 0.037 0.954 0.953 1 0.299 0.541 0.273 0.115 0.925 0.933 0.950
Mean height of cocoa trees (m) 0.282 -0.366 -0.467 0.028 -0.473 0.648 -0.191 0.132 0.105 0.299 1 0.517 0.756 -0.019 0.157 0.156 0.220
Mean height of ass. trees (m) -0.146 -0.527 -0.680 0.268 -0.648 0.197 -0.349 0.542 0.491 0.541 0.517 1 0.303 -0.198 0.592 0.574 0.596
Cocoa C stock (t/ha) 0.446 0.009 -0.307 -0.208 -0.353 0.978 -0.262 0.012 -0.024 0.273 0.756 0.303 1 -0.144 0.055 0.043 0.130
Ass tree < 30 diam C stock (t/ha) 0.069 -0.059 0.271 0.053 0.287 -0.149 0.945 0.036 0.163 0.115 -0.019 -0.198 -0.144 1 -0.018 0.066 0.053
Ass tree > 30 diam C stock (t/ha) -0.123 -0.194 -0.210 0.636 -0.098 -0.006 -0.069 0.962 0.946 0.925 0.157 0.592 0.055 -0.018 1 0.996 0.994
Associated trees total C stock (t/ha) -0.117 -0.199 -0.187 0.640 -0.074 -0.018 0.011 0.963 0.958 0.933 0.156 0.574 0.043 0.066 0.996 1 0.996
Total C in trees (t/ha) -0.077 -0.196 -0.212 0.617 -0.104 0.067 -0.012 0.957 0.949 0.950 0.220 0.596 0.130 0.053 0.994 0.996 1
The values in bold are different from 0 at a level of significance of alpha=0.05

59
Annex 5: Data sheet for inventory of associated fruit tree species