cash flow forecasting by using simple and sophisticated models … · characteristics of cash flow...
TRANSCRIPT
Cash flow forecasting by using simple and sophisticated
models in Iranian companies
Fatemeh Sarraf*
*Corresponding author, Assistant Prof., Department Of Accounting, Islamic Azad
University, South Tehran Branch, Tehran, Iran. (Email: [email protected])
Abstract
Cash flow is one of the critical resources in the economic unit and the balance
between available cash and cash needs is the most important factor in
economic health. Since judgments of many stakeholders such as investors and
shareholders about the position of the economic unit are based on liquidity
situation, so predicting future cash flow is crucial. In this research, the impact
of cash and accrual items on cash flow forecasts has been studied. Providing a
proper model to predict operating cash flows and review some important
characteristics of cash flow forecasting regression models, using a multilayer
perceptron and determining the best model by using accrual regression model
variables for predicting cash flows. For this purpose, 287 firms listed in Tehran
Stock Exchange during 2008 to 2017 were studied; Linear and nonlinear
regression, correlation coefficient and artificial neural network statistical
methods have been used for data analysis and predictive power of powers was
compared by using the sum of squared prediction error and coefficient of
determination. Results showed that the accrual regression model can predict
future cash flows better than other tested models and among corporate
characteristics, the highest correlation belongs to sales volatility and firm size
with accrual regression models. On the other hand, results of fitting different
neural network models indicate that two structures with 8 and 11 hidden nodes
are the best models to predict cash flows.
Keywords: Predicting cash flows, Future cash flows prediction models,
Accruals, Artificial Neural Network.
DOI: 10.22034/ijf.2020.202650.1071 © Iran Finance Association
25
Cash flow forecasting by using simple and sophisticated models
Introduction
Continuity, survival, and existence of an economic unit largely depend on cash
flows. Cash flow forecasting is important in many economic decisions; because
it plays a prominent role in decision-making groups such as securities analysts,
creditors, and managers. These groups are interested in the company's future
cash flow assessment and reach an explicit future cash flow criterion. In other
words, the overall goal of fundamental analysis is forecasting the company's
future cash flows. Cash flows are the base of dividend payments, interest, and
debt repayments.
The importance of predicting cash flows has been supported by 1IASC
and 2IFRS and in this regard, researchers have consistently used cash and
accrual accounting data for this prediction (Mirfakhreddini et al, 2009).
Operating cash flow projections is not possible by using historical operating
cash flows, but it can be achieved by using historical returns. Simultaneous use
of operating cash flow and historical operating profit will improve the
prediction model (Modarres et Dianati, 2003). Therefore, the obligation
regression model can predict future operating cash flows better than other
models (Sarraf et others, 2013).
Future cash flow estimation is so important in any economic unit which
reflects management decisions in short and long term plans, investment and
finance projects. Without predicting cash flow, judgment and deliberate
decision making and choose the most appropriate solution won't be possible.
Therefore, we should look for a suitable model for the estimation of future cash
flows. Considering the growth of the research process for forecasting cash
flows in Iran, innovations in designing and modeling for prediction cash flow
seem necessary. Researches are basically about models based on profit and
accruals; however, in this study, in addition to linear regression models
(accrual and cash flow regression models), nonlinear regression model is also
used and looking for answer the question that whether accrual regression
models are more appropriate than cash flow regression models to predict cash
flows or not; and comparing these models and choose the most suitable model
for Iranian companies, the impact of firm's operating characteristics on cash
flow forecasting models such as profit and sales growth, firm size and end-of-
period inventory are considered in models; Additionally, data analysis by using
1the Inter-Agency Standing Committee
2 International Financial Reporting Standards

26
Iranian Journal of Finance, 2019, Vol. 3, No. 1
artificial neural network and variables influence strategy is used to select the
most effective variable in forecasting operating cash flows.
Literature Review and Prior Researches
Business continuity is one of the first considerations and cash is one of the
most critical factors in the company's survival. Only firms can survive which
are profitable and meet their cash needs (Lie, 2006). The so-called profitability
is the firm's no diseases, power of liquidity and business continuity
demonstration (Sarraf et al, 2013). Future cash flow forecasting is so important
for various purposes including securities valuation, evaluation and selection of
capital projects, capital budgeting, risk assessment, and liquidity. This
prediction is a basis of valuation methods (Barth et al, 2001). Financial analysts
and investors are often use accounting information as part of economic
decision making in order to estimate the company's ability to generate future
cash flows. Timeliness and relevance of accounting information and operating
cash flows to predict future operating cash flows will help investors make
better-informed decisions. This information can be provided on cash or accrual
basis accounting.
Accrual accounting is an accepted accounting method for financial
statements which is recommended by IASB (2001, paragraph 22) and its items
can be used to forecast cash flows. Accordingly, business transactions are
reported periodically irrespective of payments, the main reasons for the accrual
development accounting system are scheduling problem reduction and cash
flow compliance to evaluate the company's performance (Dechow, 1994;
Cheng, Lieu et Schaefer, 1997). Given the fact that there are criticisms in every
category, the nature of accruals is criticized for two reasons: (1) being
subjective; (2) through manipulating profits, distorts performance.
Based on criticisms, it is possible that accrued earnings would have less
ability to predict cash flows; therefore, accounting information users may
return to cash accounting (Sharma, 2003; Teoh et al, 1998).
On the other hand, cash accounting is a financial reporting system that
describes business unit performance in cash. It is a base for cash inflows and
outflows periodic compliance and also free from transactions and arbitrary
allocations. Inputs include cash receipting from trading operations and long-
term financial activities and outflows include replacement payments, capital
increase, tax, interest, dividends and........ (Lee, 1981).

27
Cash flow forecasting by using simple and sophisticated models
Cash accounting only recognizes cash transactions (Birt, Chalmers, Beal,
Brooks and Oliver, 2008). Profit in the accounting period is recorded only
when incomes and expenses turn into cash in the same period. This is precisely
in contrast to accrual accounting. Conservatism in cash accounting is more than
accrual accounting because it records only real cash flows and contrary to
accrual accounting, does not predict cash flow events in a reasonable and
reliable manner (Elliott and Elliott, 2007).
Concepts addressed in cash and accrual accounting are effective in
reporting information and cash inflows and outflows. As a result, some models
are based on cash accounting information and some others on accrual.
Variables in each model influenced by raised accounting concepts. The
following table summarizes cash and accrual accounting comparison.
Table1. Comparative Summary of Accrual and Cash Accounting (Sarraf, 2013)
Cash Accounting Accrual Accounting
Only transactions are reported that turns
intocash throughout the financial
period.
All economic transactions carried out
during the financial period are reported
regardless of cash flow timing.
Revenues are recorded at the time of
receipt and costs when payment is
made.
Costs with corresponding revenues are
adjusted regardless of cash flows.
If cash receipts and payments occur
between several periods, mismatches
occur and lead to deviations in
performance measurement.
Leads to better performance measurement
due to
profits correct reporting.
Preparation is comfortable, objective
and real.
It is difficult to prepare and needs to have a
mental understanding.
Introduced by accounting standards to
provide supplemental information.
It is recommended by accounting standards
as the base for preparing financial
statements.
Simple Sophisticate
It is less comprehensive because only
reports cash information.
It is Comprehensive and detailed because
includes cash and non-cash information,
provides other relevant information, such
as resources (assets) and obligations
(liabilities) and the ability to manage
resources and obligations.
Provides far less information than
accrual-based the approach regarding
productivity.
Provides information for efficiency and
effectiveness of assets.
It has more credibility but cannot be
relied upon in decision-making. It has a Relative trustability.
28
Iranian Journal of Finance, 2019, Vol. 3, No. 1
In order to increase model predictability, the company's operational
characteristics such as inventory to future sales ratio sustainability, sales
volatility, profitability, and firm size can be used (Yoder, 2006). The
company's specific inventory volatility ratio (IRVOL) is the change in
inventory to future sales which is expected to be related to accrual models
predictive power. Profits and sales volatility reflects the instability of the
business operating environment. Increasing cash flow volatility leads to a
higher prediction error in accrual models and cash flows. In addition, sales and
earnings volatility effects on accrual model parameters volatility and sales
estimation errors. Sales volatility has changed model predictive power;
direction determination of sales volatility effect on predictive power can be
investigated. On the other hand, large corporations are more stable in terms of
accrual model parametric (accrual specific coefficients) through more diversity
in sales and purchases but in smaller companies, model parameters are affected
by a relatively small number of contracts or customers (Yoder, 2006).
Empirical studies indicate that to predict operating future cash flows, the
model derived from operating cash flows and accruals combination is superior
to profit-based or operating cash flow models (Barth et al,2001; Al-Attar et
Hussain,2004; Ebaid,2011; Francis et al,2012). In addition, accrual
components separation and their combination with operating cash flows seem
to increase the aggregated profit predictive power. Empirical evidence suggests
that the model derived from combination of operating cash flows with
separated accrual components to predict future operating cash flows exceeds
models that are based solely on operating cash flows or profit as well as on
models derived from combination of operational cash flows and accrual
component (Barth et al, 2001; Al-Attar et Hussain, 2004; Ebaid, 2011; Francis
et al, 2012). Barth et al, Al-Attar etHussain, Ebaid, Francis et al concluded that
breakdown of profit into operating cash flows and accruals increases profits
ability to predict future operating cash flows and accruals separation from its
components will improve profit predictive power.
Other studies indicate that historical operating cash flows are more
predictable than historical profit (Arthur et al, 2007; Barth et al, 2001;
Chotkunakitti, 2005; Farshadfar, 2008; Habib, 2010; Penhamet Yehuda, 2009
and Seng, 2006). Few studies have argued that there is no significant difference
between these two types of information (Arnold et al, 1991; Lorek et Willinger,
2009; Mcbeth, 1993; Pfeiffer, 1998). Also, Francis and Eason (2012) studied
the relationship between accruals and operations cash flow forecasting. For this
purpose, two models were compared. The first model was a random walk cash
flow model and the second one was a reversal accrual model in which current
29
Cash flow forecasting by using simple and sophisticated models
cash flow is accompanied by changes in receivables, payables, and inventory.
Researchers' findings suggest that cash flow forecasting with accrual
components is more accurate than simple prediction based on the random walk
model.
Janjani (2015) concluded that operating cash flows using Iran 3GAAP
compared to US GAAP have no effect on projected future cash flow.
Kordestani (1995) in his research, which followed the Finger method,
examined entire accounting profitability to predict future earnings and cash
flows. Results showed that none of the models are able to forecast future cash
flows to be close to real items; however, accounting profit is a superior
predictor of cash flows.
Saghafi and Fadaie (2007) found that accrual-based models have the
ability to anticipate more than models only consist of cash flows.
Mahdavi and Saberi (2010) in their study showed that breakdown of
profit into cash and accrual components will increase the ability to forecast
cash flows. Projected cash flows based on disaggregated earning models can
predict future operating cash flows better than the other tested models.
Mahmoud Abadi and Mansouri (2011) examined the role of discretionary
and non-discretionary accruals in predicting future cash flows for the period
2001-2009 and comparing two independent sample means (t-test) was used.
The results of the research showed that discretionary and non-discretionary
accrual variables do not have the ability to predict future cash flows (Sarraf et
al, 2013).
Sarraf et al (2013) studied cash and accruals impact on operating cash
flow forecasting. They use correlation coefficient and linear and nonlinear
regression to analyze data. Findings suggest that the accrual regression model
can predict future operating cash flow better than other tested models.
Based on Saghafi and Sarraf's findings (2014), the random walk model in
comparison with a negative accrual model can predict operating cash flow
better. Meanwhile, corporations in which the government has influence,
accrual model is more proper for estimated future cash flows.
Saghafi et al (2015) used a multilayer perceptron neural network by
determining the superior model using accrual regression model variables in
3 Generally Accepted Accounting Principles

30
Iranian Journal of Finance, 2019, Vol. 3, No. 1
order to predict future cash flows. Results showed that a multilayer perceptron
neural network is an appropriate model to predict the firm's cash flows; in
addition, government-owned companies have no significant effect on cash flow
forecasting.
Kenneth S. Lorek (2019) reviewed extant work on quarterly cash-flow
prediction models. Due to the unavailability of long-term cash-flow forecasts,
he had placed greater importance upon the development of statistically based
cash-flow prediction models given their use in firm valuation.
Farshadfar and Monem (2013), provided further evidence that
disaggregating operating cash flow into its components enhances the predictive
ability of aggregate operating cash flow in forecasting future cash flows. They
also found that cash received from customers and cash paid to suppliers and
employees complement each other in enhancing the overall predictive ability of
cash flow components.
Yun Li, et al, (2015), applied models in the extant literature that have
been used to forecast operating cash flows to predict the cash flows of South
African firms listed on the Johannesburg Stock Exchange. The reported results
show that the inclusion of more explanatory variables does not necessarily
improve the models. They proposed the application of a moving average model
in panel data and vector regressive model for multi-period-ahead prediction of
cash flows.
Sebastian M.Blanc and ThomasSetzer (2015), proposed and empirically
tested statistical approaches to debiasing judgmental corporate cash flow
forecasts. They compared different forecast correction techniques such as
Theil's method and approaches employing robust regression, both with various
discount factors. The findings indicated that rectifiable mean, as well as
regression biases, exist for all business divisions of the company and that
statistical correction increases forecast accuracy significantly.
Linna Shi and et al, (2014), investigated how analyst cash flow forecasts
affect investors' valuation of accounting accruals. They found that the strength
of the accrual anomaly documented in Sloan (1996) is weaker for firms with
analyst cash flow forecasts, after controlling for idiosyncratic risk, transaction
costs and firm characteristics associated with the issuance of cash flow
forecasts. They further showed that this reduction in the mispricing of
accounting accruals is at least partially attributed to the improved ability of
investors to price-earnings manipulations embedded in accruals.
RattachutTangsucheeva and VittaldasPrabhu (2014), developed stochastic

31
Cash flow forecasting by using simple and sophisticated models
financial analytics for cash flow forecasting for firms by integrating two
models: (1) Markov chain model of the aggregate payment behavior across all
customers of the firm using accounts receivable aging and; (2) Bayesian model
of individual customer payment behavior at the individual invoice level. The
proposed model is back-tested using empirical data from a small manufacturing
firm and found to differ 3–6% from actual monthly cash flow, and differs
approximately 2–4% compared to actual annual cash flow. They underlined
that the forecast accuracy of the proposed stochastic financial analytics model
is found to be considerably superior to other techniques commonly used.
According to the above-mentioned researches which summarized, the
projected cash flow dilemma still remains unresolved and requires further
researches. Therefore, in view of expected future cash flows importance in
decision-makings and various roles of cash and accrual models in these
estimations, this paper considers Iran's specific circumstances and designs a
new model to predict cash flow which will increase the ability to estimate
future cash flows among cash flow prediction models.
Nasser A. and Spear Mark Leis (1997), developed three supervised
artificial neural networks (general regression, backpropagation, and
probabilistic) to predict the accounting method choice by oil and gas producing
companies. They compared the prediction accuracy generated by the artificial
neural networks with those generated using logit regressions and multiple
discriminant analysis. Their three-layer general regression network performed
much better with the overall prediction error ranging from 8% to 11%, while
this figure is ranging from 24% to 43% by using traditional models.
Research Hypothesis
With regard to theoretical foundations and the main purpose of this research,
the following hypotheses are presented:
H1: Forecasting cash flows based on accrual models are better than predictions
based on cash flow models.
H2: The ability to predict accrual models in comparison with cash flow models
will decrease with changes in ending inventory to future sales ratio.
H3: The ability to predict accrual models will change compared to cash flow
models, with sales and profit volatility.
H4: The ability to predict accrual models in comparison with cash flow models
will increase with firm size.
32
Iranian Journal of Finance, 2019, Vol. 3, No. 1
H5: Multi-layer neural network is an appropriate model for predicting the firm's
cash flow.
H6: State-owned Company has an effect on the arrangement of accrual
regression model variables for a predictable cash flow based on an artificial
neural network.
Statistical Population and Sampling
In order to collect homogeneous information from all members of the
population and no reliable sources of financial information for companies
outside Tehran Stock Exchange, the statistical population includes firms listed
in Tehran Stock Exchange with following conditions:
● According to the period 2008- 2017, the company should be listed on
Tehran Stock Exchange in 2008 and will not be removed from the list by
the end of 2017.
● For consistency, all Company's fiscal year should end on 31 March.
● Investment and financial companies will be removed because there is not a
clear boundary between operational and financing activities for them.
● For integration and expansion, companies should not cease activities and its
financial period not changed during this period.
Based on above criteria, 484 listed companies, 287 companies selected as
samples and 1663 year/company data were used which 73 years/companies
data related to companies that government came in and for this purpose,
sample data have been collected from Tehran stock Exchange Website and
RahavardNovin and TadbirPardaz applications.
Research Methodology
In order to investigate the hypotheses of this study, multiple linear and
nonlinear regression methods, Spearman correlation coefficient (hypotheses 2-
4) and artificial neural network are used. It should be noted that the ability to
predict models was compared by using their sum of squared prediction errors;
meanwhile, the mean forecast error and coefficient of determination were also
used. All operations related to data management and their analyses were done
in excel spreadsheets and SPSS software version 19. In the following,
variables, regression models and an artificial neural network that used in this
research have been explained.

33
Cash flow forecasting by using simple and sophisticated models
1.Variables Used in the Research
Table2. Variables used in the research
NO Abbreviations Definition
1 CFO Cash flow from operating activities
2 ΔAR Changes in accounts receivable
3 ΔInv Changes in inventory
4 ΔAP Changes in accounts payable
5 ΔACCEXP Changes in accrued expenses payable
6 ΔACCIT Change in Income tax payable
7 S Annual net sales
8 Inv Ending inventory
9 α Accounts receivable to sales ratio ARt/St
10 β Ending payables to purchased goods plus operating costs
APt⁄PURCH + OE
11 γ Ending inventory to projected cost of goods sold
INVt⁄COGSt+1
12 π Gross Profit to Sales percentage St − COGSt⁄St
13 λ operating costs to sales ratio OEt⁄St
14 COGS the projected cost of goods sold (1-π) E(St+1)
15 Gover Companies in which the government has significant influence
(as defined by Supreme Audit Court of Iran)
16 ΔS Changes in sales from one period to another
17 EΔSales2 changes in expected sales form period t+1 to t+2
18 AVgTA Average total assets (TAt + TAt-1/2)
19 IRVOL Inventory Turnover specific ratio (∆Invt⁄St+1)
20 SALESVOL Sales Volatility ratio (St+1-St⁄AVgTA)
21 EARNVOL Earning Volatility ratio (ΔEARN/AVgTA)
2.Cash Flow Based Forecasting Model
In cash flow based forecasting models, current cash flows are used as a
criterion for forecasting future cash flows that include cash flow random walk
and cash flow regression models, which will be reviewed further.
2.1. Cash Flow Random Walk Model (Cfrw)
The cash flow random walk model operates randomly and in this model,
expected future cash flow is equivalent to current operating cash flows. The
cash flow random walk model has been used as a criterion in Bowen et al
(1986) and Francis and Eason's (2012) researches.
(1)
34
Iranian Journal of Finance, 2019, Vol. 3, No. 1
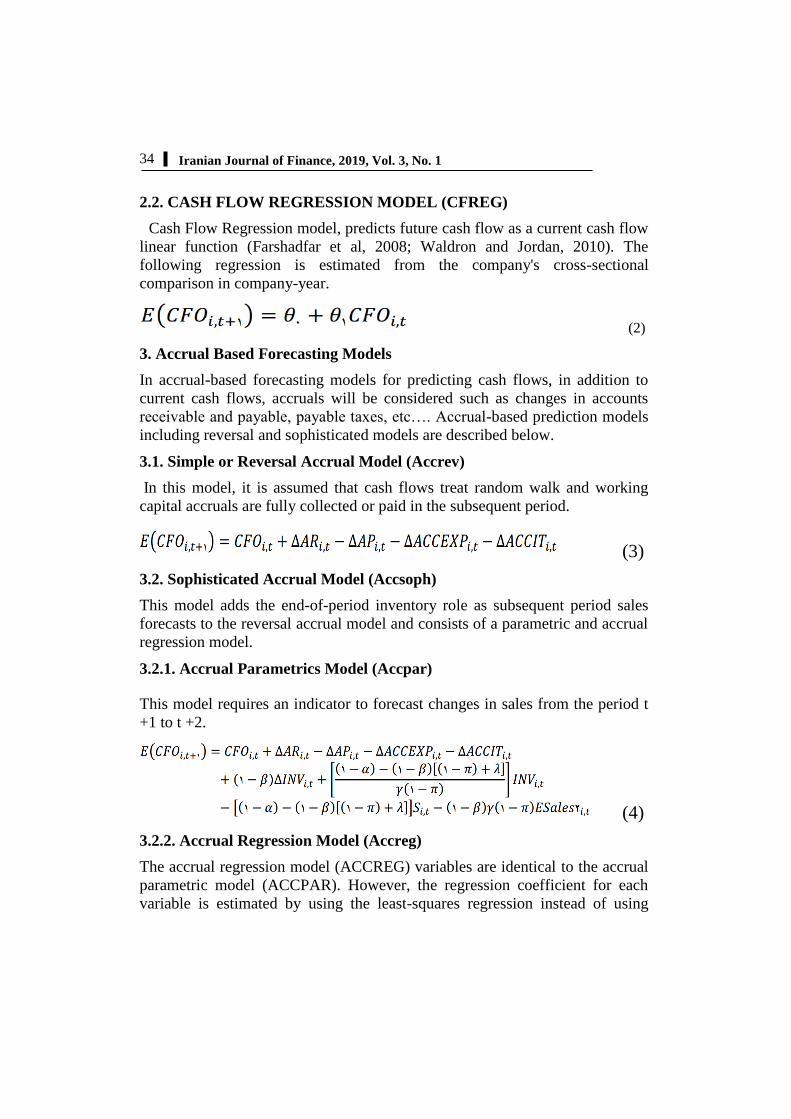
2.2. CASH FLOW REGRESSION MODEL (CFREG)
Cash Flow Regression model, predicts future cash flow as a current cash flow
linear function (Farshadfar et al, 2008; Waldron and Jordan, 2010). The
following regression is estimated from the company's cross-sectional
comparison in company-year.
(2)
3. Accrual Based Forecasting Models
In accrual-based forecasting models for predicting cash flows, in addition to
current cash flows, accruals will be considered such as changes in accounts
receivable and payable, payable taxes, etc…. Accrual-based prediction models
including reversal and sophisticated models are described below.
3.1. Simple or Reversal Accrual Model (Accrev)
In this model, it is assumed that cash flows treat random walk and working
capital accruals are fully collected or paid in the subsequent period.
(3)
3.2. Sophisticated Accrual Model (Accsoph)
This model adds the end-of-period inventory role as subsequent period sales
forecasts to the reversal accrual model and consists of a parametric and accrual
regression model.
3.2.1. Accrual Parametrics Model (Accpar)
This model requires an indicator to forecast changes in sales from the period t
+1 to t +2.
(4)
3.2.2. Accrual Regression Model (Accreg)
The accrual regression model (ACCREG) variables are identical to the accrual
parametric model (ACCPAR). However, the regression coefficient for each
variable is estimated by using the least-squares regression instead of using
35
Cash flow forecasting by using simple and sophisticated models
company-specific parameters (Barth et al, 2001; Yoder, 2006; Cheng etHollie,
2008; Ebaid, 2011). The ability to predict models is estimated by absolute
prediction error. In assessing the ability to predict the accrual models, the
prediction error is compared to the prediction error generated by the exact cash
flow model. Accrual regression model is as follows:
(5)
4. Analysis Method Using Artificial Neural Networ
A neural network includes simple processing layers called neurons that act in
parallel with each other. The first layer is the input layer, which can be
statistical parameters or components from the conversion of arithmetic
functions. The second layer is an intermediate layer or layers (hidden) that
make the network structure. The main task of this layer is to extract classified
information from existing data. The final layer or output layer determined
based on user expectations. This layer can be identified by one or more
processing elements in which its output represents the final formulation. The
input layer is connected to one or more of the middle layer and the output layer
connected to the intermediate layer, where the answer network plays an output
role. In addition, each layer has a weight that reflects the effect of neurons on
each other. Estimation parameters (weights) done in accordance with learning
laws. Rule learning by recurrence relations, generally expressed as differential
equations and the process by which weight matrix, weights connecting the
input units to hidden units and connection weights of hidden units to output
units and bias vector neural network sets; So that the index error is minimized.
In this case, after network learning and functional relationship between inputs
and outputs, the network can be used as a model or predict response in
accordance with a new input pattern. One of the learning algorithms is the
propagation algorithm (Smith, 1993). In this algorithm during the training
phase, the network input patterns are provided respectively that each input
pattern layer to move forward until an output pattern is calculated. The output
model is calculated then compared with the desired pattern and error is
determined in the following. The error returned back layer by layer and in each
layer necessary reforms carried out on weights (this change on the weights is
network learning). This process is repeated many times until the total output
error converges towards the minimum. There are two-steps in network
performance; learning and remembering and diverse types of artificial neural
networks in these two steps are different for the following reasons:

36
Iranian Journal of Finance, 2019, Vol. 3, No. 1
● Neuron model employed;
● Network topology;
● Rule (Learning law) Network;
4.1. Multi-Layer Neuron Model
Figure 1-1, shows the structure of a neuron with an input vector. X is input and
Y is the output vector in the model. The effect of X on Y is determined by the
scalar value (W). Another input that applied to the network, is fixed 1 in which
is multiplied to bias b sentence (and it is the direction of impact to the network
from the outside) and then sum with WP. This sum is the network net input
which will be available for activation function. Finally, the output neurons
would be possible in the form of y=f (WP+b). Trigger function f will be
selected by the user depending on the type of response variable (output).
Network parameters (W,b) are adjustable due to the choice of F and type of
learning algorithm.
4.2. Multi-Input Neuron Model With The Middle Layer (Mlp)
Multiple nodes connected in series and parallel, form a larger and more
complete single-layer perceptron network which an example of this is showed
in figure 1. In this case, each node of the input vector is related to middle layer
individual nodes and associated with the response variable. A single layer
perceptron network consists of an input and an output layer. Nude i is also
called a neuron, will be presentable as follows. This figure contains a collector
and a non-linear function f. Xk inputs (k=1,…,k) accumulate in neurons with
Wiki weights with bi fixed size collector. As a result, ni= neti will be net input
of function f. Finally, yi will be the output of nude i. At the same time, activity
function in proportion to output (here quantitative) is considered as (f (u) = (u))
(YousefiRadmandi, 2009).
Figure 1. single-layer perceptron with multiple nodes
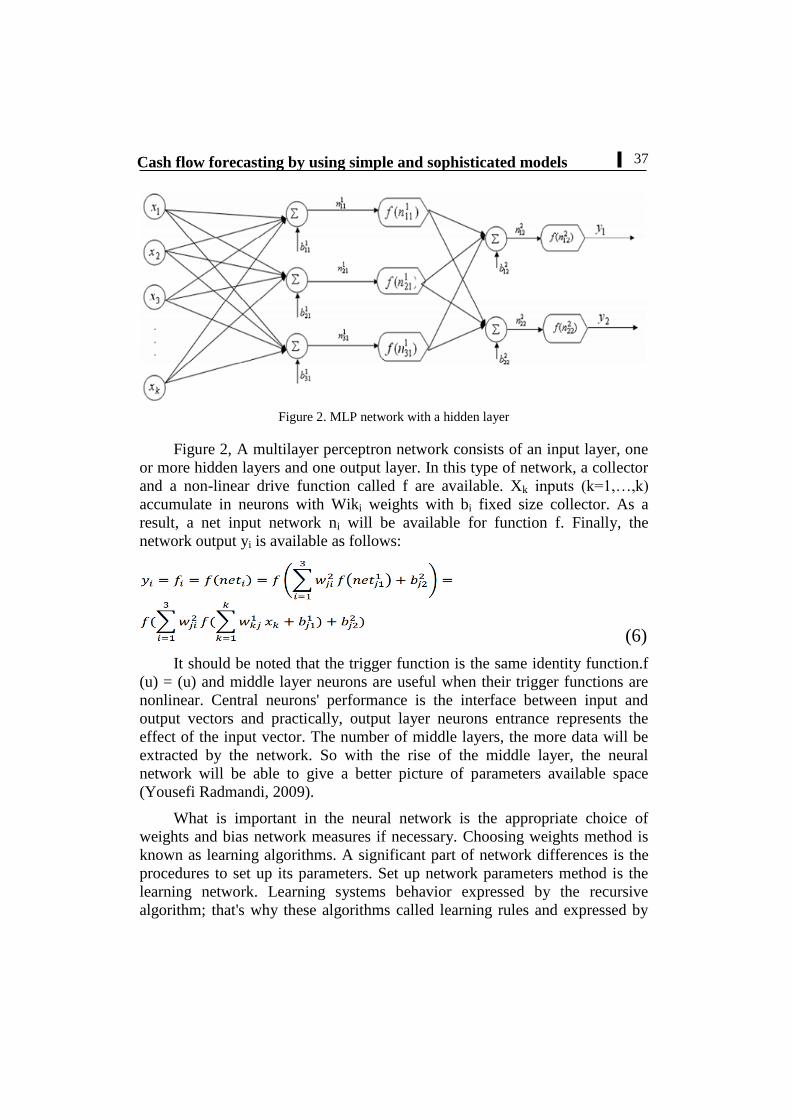
37
Cash flow forecasting by using simple and sophisticated models
Figure 2. MLP network with a hidden layer
Figure 2, A multilayer perceptron network consists of an input layer, one
or more hidden layers and one output layer. In this type of network, a collector
and a non-linear drive function called f are available. Xk inputs (k=1,…,k)
accumulate in neurons with Wiki weights with bi fixed size collector. As a
result, a net input network ni will be available for function f. Finally, the
network output yi is available as follows:
(6)
It should be noted that the trigger function is the same identity function.f
(u) = (u) and middle layer neurons are useful when their trigger functions are
nonlinear. Central neurons' performance is the interface between input and
output vectors and practically, output layer neurons entrance represents the
effect of the input vector. The number of middle layers, the more data will be
extracted by the network. So with the rise of the middle layer, the neural
network will be able to give a better picture of parameters available space
(Yousefi Radmandi, 2009).
What is important in the neural network is the appropriate choice of
weights and bias network measures if necessary. Choosing weights method is
known as learning algorithms. A significant part of network differences is the
procedures to set up its parameters. Set up network parameters method is the
learning network. Learning systems behavior expressed by the recursive
algorithm; that's why these algorithms called learning rules and expressed by

38
Iranian Journal of Finance, 2019, Vol. 3, No. 1
differential equations. The process of This algorithm available data so that
specified performance index which is usually estimated, optimizes according to
network response which is the learning process purpose.
Normally there are two types of learning, supervised and unsupervised
learning. In supervised learning assumed that in each learning stage, the
learning system desired and the actual answer is already available, but in
unsupervised learning desired and the actual answer is not available.
There are various learning algorithms. One of them is the
backpropagation error algorithm. In fact, the backpropagation error algorithm
is supervised learning. This means that when input applied to the network,
network answer compared to target answer, then learn error is calculated and
used to configure network parameters; so if next time the same input applied to
the network, the output is closer to the target answer. This algorithm is based
on delta law using the sum of squared error and suitable for output neurons.
There are two ways to implement this algorithm that include batch and
sampling methods (Yousefi Radmandi, 2009).
In the batch method, all outputs applied to the network before setting up
weights and in sampling method gradient and weights calculate and set each
time after each input applied to the network.
It should be noted that in setting parameters of middle and output layers,
various activation functions can be used. Depending on the response variable in
this study which is quantitative, activation function identification in the output
layer and hyperbolic tangent in the middle layer are used to set parameters.
Research Findings
As previously stated, the aim of this study is to select the appropriate model to
predict cash flow. The cash flow predicting model can be based on cash or
accrual prediction models. In the random walk cash flow forecast model, future
cash flows are equal to current cash flows and in the cash regression model,
next period's cash flows are predicted as a linear function of current cash flows
and then model coefficients are estimated. In simple or inversely accrual
models, it is assumed that cash flow is random and current receivables and
payables are reversible in subsequent period and can be used to predict cash
flows, however, in Sophisticated model, estimating parameters of prediction
model due to nonlinearity with response function is not easily feasible and
numerical methods are used. In this section, cash flow prediction models are
analyzed for achieving goals and responding to hypotheses based on data and

39
Cash flow forecasting by using simple and sophisticated models
also their predictive ability will be examined by the sum of squares error
criterion.
1. Testing Hypothesis 1
In order to test the first hypothesis, comparison models are done in two steps:
First, simple prediction models (random step and reversal accrual model) and
next, sophisticated prediction models (cash regression models, accrual
regression models and accrual parametric) will be compared and finally, by
general comparison of all simple and sophisticated models, the appropriate
model for predicting cash flow will be determined.
1.1. Comparison of Random Walk Prediction and Reversal Model
In order to compare the predictive power of random walk and reversal accrual
cash flows prediction models, regression analysis was used and results are
presented in Table 3. The mean forecast error was 1.065 and the sum of
squared errors was 2.48*1026
for random walk model while the mean forecast
error for reversal accrual cash flows prediction models was 1.195 and the sum
of squared prediction errors was 3.97*1026
for this model. Therefore, the
random walk cash flow model in comparison with the reversal accrual model
has a less predictive error.
Table 3. Comparison of Random Walk and Reversal Accrual Models
Proper Model Random walk Reversal
accrual Prediction Error
Random walk 1.065 1.195 Mean forecast error
Random walk 2.48*1026
3.97*1026
sum of squared
prediction error
1.2.Comparison of Cash Flow Regression and Sophisticated Accrual
Prediction Models
By fitting cash flow regression, sophisticated accrual parametric and accrual
regression models, Model predictions were evaluated. Sum of squared
The prediction error for the cash flow regression model was 2.25*1026
.
This criterion was equal to 2.22*1026
for sophisticated accrual parametric and
3.78*1026
for the accrual regression model.

40
Iranian Journal of Finance, 2019, Vol. 3, No. 1
Fitting Cash Flow Regression Model (Cfreg)
In order to fit a cash-flow regression model to predict cash flows for the year
2017 based on linear regression, companies were surveyed in total. Results
showed that the sum of squared prediction error in this model for the whole
year-companies is 2.25*1026
. Results of analysis variance and regression line
coefficients are shown in tables 4 and 5.
Table 4. Variance analysis of fitting 2017 cash flow regression line based on previous period
cash flow
Source of
change
sum of
squares
Degree of
freedom
Average of
squares
F-Test
criterion
P-
value
Regression 4.616*1026
1 4.616*1026
447.703 0.001>
Error 2.248*1026
218 1.031*1026
Total 6.863*1026
219
For this model, the coefficient of determination is 0.673. The sum of the
squared prediction error for this model is equal 2.25*1026
.
Table 5. Analysis of 2017 coefficients of cash flow regression line based on previous period
cash flow
Source of change sum of
squares standard error
T-Test
criterion P-Value VIF
Regression
Intercept 3.158*10
10 7.057*10
10 0.873 0.384
CFO 0.817 0.039 21.159 0 1
Since the CFO probability value is zero, it can be concluded that CFO is
an effective factor in predicting this model. On the other hand, when the sales
volatility variable is added to the above model, the numerical value of the
criterion factor is changed to 0.729. Also, if the firm size variable is added to
the above model, the coefficient of determination numerical value will be
increased to 0.772. Therefore, adding these models will improve the variable
predictive power.
Sophisticated Accrual Parametric Model Fitting (Accpar)
For fitting this model, due to parameters nonlinear relation with response
function, nonlinear regression was used. Results are presented in Tables 6 and
7.

41
Cash flow forecasting by using simple and sophisticated models
Table 6. Analysis fitting the variance of 2017 sophisticated accrual parametric model non-
linear regression
Source of
change
sum of
squares
Degree of
Freedom
Average of
squares
coefficient of
determination
criteria
Regression 3.773*1026
5 7.546*1026
0.614
Error 2.219*1026
159 1.396*1026
0
Total 5.992*1026
164
For this model, the coefficient of determination is 0.614 and the sum of
squared prediction error is 2.22*1026
.
Table 7. Parameter estimation of 2017 sophisticated accrual parametric model by non-linear
regression
Parameter Estimation Standard error
Alpha 4.413 37658535/621
Beta -1.303 0.639
Phi 1.135 661574.131
Landa 3.317 37515033.564
Gama 4.179 20455897.104
Accrual Regression Model Fitting (Accreg)
The analysis performed in this model is based on linear regression models for
companies and presented in Tables 8 and 9 as above.
Table 8. Analysis fitting the variance of 2017 accrual regression model
Source of
change
sum of
squares
Degree of
freedom
Average of
squares
F-Test
criterion
P-
value
Regression 5.376*1026
8 6.721*1025
275.326 0
Error 2.783*1025
155 2.441*1023
Total 5.755*1026
163
For this model, the coefficient of determination is 0.934 and the sum of
squared prediction error is 2.78*1025
.

42
Iranian Journal of Finance, 2019, Vol. 3, No. 1
Table 9. Accrual regression coefficient analysis for 2017
Source of
change
sum of
squares
standard
error
T-Test
criterion
P-
Value VIF
Regression
Intercept -1.152*10
11 4.354*10
10 -2.647 0.009
CFO 1.186 0.065 18.126 0 1.661
ΔAR 0.021 0.055 0.375 0.708 1.624
ΔINV 0.22 0.354 0.623 0.534 2.036
ΔAP -1.897 0.15 -12.659 0 2.553
ΔACCIT -1.818 1.367 -1.33 0.185 1.303
ΔSales -0.123 0.097 -1.266 0.207 2.08
S 0.084 0.022 3.763 0 3.015
Inv 0.351 0.101 3.48 0.001 2.696
When the firm size variable is added to the above model, the coefficient of
determination numerical value will be increased to 0.934. It means adding a
firm size variable will not change accrual models predictability.
1.3.Comparison of Simple and Sophisticated Models
Based on the results obtained from complex models including regression
models, both linear and nonlinear, the selected model can be specified for the
sample group of companies. According to Table 10, the accrual regression
model is an appropriate model for predicting cash flows in Iranian companies.
Table 10, Comparison of Linear and Nonlinear Regression Models to Predict Cash Flow
Criterion
Model
sum of squared
errors
of prediction
Coefficient of
Determination
Cash flow regression model (liner) 2.25*1026
0.673
Accrual parametric model (non-liner
regression) 2.22*10
26 0.614
Accrual regression model (liner) 3.78*1025
0.934
Proper model Accrual regression Accrual regression
By comparing Table 10 and Table 3 a suitable model for predicting cash flow
in Iranian companies can be recommended. Selecting a proper model based on
Sum of squared prediction error is presented in Table 11.

43
Cash flow forecasting by using simple and sophisticated models
Table 11. Choosing a proper model based on the sum of squared prediction errors
Hypothesis Model value
Criterion
Primer
Choice Final Choice
one
Simple
Random
walk 2.48*1026
Random walk
Accrual
Regression
Reversal
accrual 3.97*1026
Sophisticate
Cash Flow
Regression 2.25*1026
Accrual
Regression
Accrual
Parametric 2.22*1026
Accrual
Regression 3.78*1025
2.Investigating the Relationship Between Cash Flows Forecasting Models
and Corporate Characteristics
Spearman correlation coefficient test was used to investigate the relationship
between accruals and cash models prediction with the variability of ending
inventory ratio, sales, and profit volatility and firm size. The results are
presented in Table 12.
Table 12. Investigation of the Relationship between Cash Flow and Accrual Models in 2017 with the Companies characteristics
Model
Variables
Sales Firm
Size
variability
of
inventory
variability
of
profits
Sales
volatility
Random walk Model
Correlation Coefficient
P-Value
N
**0.651
0
220
**0.662
0
164
0.030
0.704
160
0.14
0.857
164
**0.234
0.001
196
Reversal accrual Model
Correlation Coefficient
P-Value
N
-0.053
0.504
164
**0.635
0
187
-0.070
0.380
160
-0.040
0.608
164
-0.013
0.867
164
Cash Flow Regression Model
Correlation Coefficient
P-Value
N
**0.65
0
245
**0.662
0
164
0.003
0.969
160
0.019
0.799
185
**0.519
0
221
Accrual regression model
Correlation Coefficient
P-Value
N
**0.768
0
187
**0.757
0
187
0.019
0.813
160
0.019
0.795
185
**0.823
0
187
Accrual parametric model
Correlation Coefficient
P-Value
N
*0.762
0
187
**0.762
0
187
0.005
0.945
160
0.023
0.759
185
**0.707
0
187
** significant at 0.01 level

44
Iranian Journal of Finance, 2019, Vol. 3, No. 1
Relationship between the whole company's characteristics and cash flow
forecasting models based on the above table with less than 0.05 probability
value, can be summarized as follows:
1) There is no significant relationship between inventory turnover ratio and
model prediction for future cash flow.
2) There is no positive relationship between Sales volatility and accrual reverse
model, but there is a positive relationship with other models.
For instance, the maximum relationship is related to the accrual
regression model, which means as sales volatility increases this model
prediction will increase compared to other models.
1) In earnings variability, there is no significant relationship between this
feature and the above models' prediction.
2) Infirm size, the most correlation is with predicting cash flows are based on
accrual parametric model (0.762).
3. Fifth and Sixth Hypotheses Examination
To predict by using an artificial neural network model, a three-layer Perceptron
Neural Network with the following specifications were used:
● input layer with 9 neurons, middle layer with 6 to 20and output layer with
one neuron
● Activation function used in the middle layer: the hyperbolic tangent
● Activation function used in output layer: identity function
● Learning rate 0.4, 0.35, 0.3, 0.25, 0.2, 0.15, 0.1, 0.05 and Momentum 0.9,
0.8 and 0.8 were considered.
● Training/Learning: random selection of approximately 70 percent of data
● Test set: other remaining data
● Decision criteria for learning: the sum of squared prediction error.
● Decision criteria to select the best network structure: the sum of squared
prediction error.
● Choose the most influential variables in forecasting: Penetration strategy
variables.
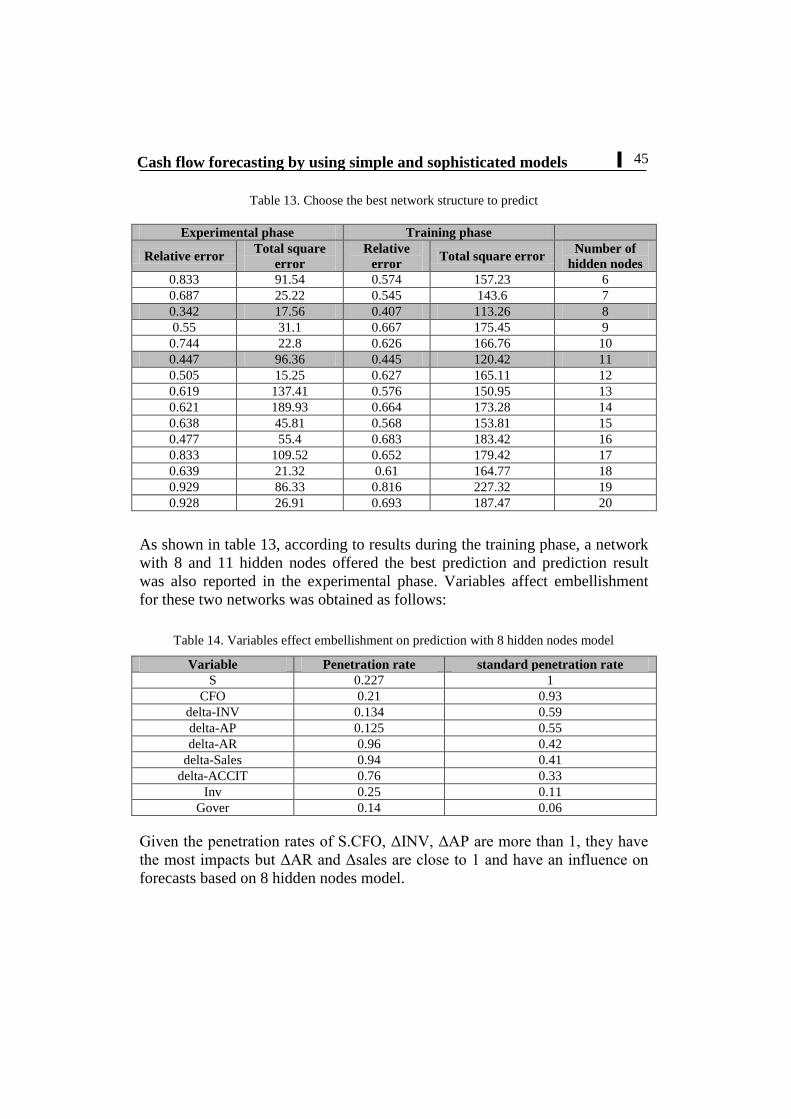
Neural network models based on the above specifications consist of 360
models within 15 structures (24 models for each structure) fitted and the best
model in each structure was reported in table 13. From these fifteen structures,
the best model to predict with 8 and 11 hidden nodes were concluded.
45
Cash flow forecasting by using simple and sophisticated models
Table 13. Choose the best network structure to predict
Training phase Experimental phase
Number of
hidden nodes Total square error
Relative
error
Total square
error Relative error
6 157.23 0.574 91.54 0.833
7 143.6 0.545 25.22 0.687
8 113.26 0.407 17.56 0.342
9 175.45 0.667 31.1 0.55
10 166.76 0.626 22.8 0.744
11 120.42 0.445 96.36 0.447
12 165.11 0.627 15.25 0.505
13 150.95 0.576 137.41 0.619
14 173.28 0.664 189.93 0.621
15 153.81 0.568 45.81 0.638
16 183.42 0.683 55.4 0.477
17 179.42 0.652 109.52 0.833
18 164.77 0.61 21.32 0.639
19 227.32 0.816 86.33 0.929
20 187.47 0.693 26.91 0.928
As shown in table 13, according to results during the training phase, a network
with 8 and 11 hidden nodes offered the best prediction and prediction result
was also reported in the experimental phase. Variables affect embellishment
for these two networks was obtained as follows:
Table 14. Variables effect embellishment on prediction with 8 hidden nodes model
Variable Penetration rate standard penetration rate
S 0.227 1
CFO 0.21 0.93
delta-INV 0.134 0.59
delta-AP 0.125 0.55
delta-AR 0.96 0.42
delta-Sales 0.94 0.41
delta-ACCIT 0.76 0.33
Inv 0.25 0.11
Gover 0.14 0.06
Given the penetration rates of S.CFO, ΔINV, ΔAP are more than 1, they have
the most impacts but ΔAR and Δsales are close to 1 and have an influence on
forecasts based on 8 hidden nodes model.

46
Iranian Journal of Finance, 2019, Vol. 3, No. 1
Table 15. Variables effect embellishment on prediction with 11 hidden nodes model
Variable Penetration rate standard penetration rate
S 0.327 1
CFO 0.153 0.47
delta-INV 0.143 0.44
delta-AP 0.101 0.31
delta-AR 0.091 0.28
delta-Sales 0.074 0.23
delta-ACCIT 0.054 0.17
Inv 0.046 0.14
Gover 0.01 0.03
As shown in table 15, forecasts based on the model with 11 hidden nodes, CFO
with a penetration rate of 0.327 has the most effect but S, ΔAP, ΔACCIT, and
ΔAR variables, respectively, have greater influence compared to other
variables.
Research Findings
This research, based on subject literature, focuses on the importance of
forecasting cash flows and accrual and cash items conditions. Afterward, in
order to compare different models and select the appropriate model, the sum of
squared prediction errors was used. Also, by fitting different artificial neural
network models, the best prediction model and variables affect embellishment
reported in two structures.
The first hypothesis was put forward in response to the first question
"whether cash flow prediction based on accrual models is better than cash
models?" and in order to prove this claim, three main themes including cash,
accrual and cash and accrual models comparison were used which is
compatible with past studies like Bareth et al, 2001; Al-Attar et Hussain, 2004;
Chotkunakitti, 2005; Habib, 2010; Ebaid, 2011; Francis et al, 2012; Saghafi
and Fadaie, 2007; Mahdavi and Saberi, 2010. cash models analysis results
indicate that cash flow regression model has less prediction error than random
walk model; In the analysis of accrual models consist of simple and
sophisticated models, multiple regression, linear and nonlinear regression were
used; Findings show that accrual regression model is more appropriate than
other accrual models with regard to coefficient of determination and sum of
squared prediction error. Finally, results from comparing accrual and cash
models showed that linear regression model with error 3.78*1025
has less
prediction error (cash flow regression model with error 2.25*1025
) and is more
suitable for forecasting cash flows compared to cash models in firms accepted
47
Cash flow forecasting by using simple and sophisticated models
in Tehran Stock Exchange; So, the first hypothesis is confirmed.
The second hypothesis testing results in order to answer the second
question "the ability to predict accrual models in comparison with cash flow
models will decrease with changes in ending inventory to future sales ratio"
showed that contrary to Yoder's research (2006), there is no significant
relationship between inventory turnover to futures sales and cash flow forecasts
based on various models in the hypothesis. The lack of economic stability can
be justified by this outcome. Lack of economic stability is one of the most
important components affect economic activities. Economic stability means
stable, reliable and predictable conditions for economic activities. Under
instability conditions, forecasting models will be basically problematic. Among
economic instability indicators, inflation fluctuations, which have been clearly
seen in recent years in Iran, have led to inefficiencies in models.
In the third hypothesis, the effect of sales and profit volatility on accrual
models in comparison with cash flow models was tested and results showed
that accrual models predictability does not change in comparison with cash
flow models in the variability of profits but while sales volatility increases
accrual models predictability compared to cash flow models. Results indicate
that the greatest relationship is between this feature and the accrual regression
model. It means the more sales variability is accrual regression model ability
will also increase (Yoder, 2006).
According to the fourth hypothesis, we conclude that in firm size, accrual
models ability is more consistent than cash flow models; results show that the
greatest relationship between this feature is with accrual parametric model
which is compatible with Lorek et Willinger (2008) research results. Therefore,
it can be said that in Iranian companies, accrual regression models are more
efficient and some features such as firm size are more functional on the
effectiveness of these models.
Results of the fifth hypothesis testing showed that multilayer perceptron
neural network is a suitable model for predicting cash flow and according to
previous research findings based on multi-variable linear regression model
superiority in the fifth and sixth hypotheses, nine fundamental accounting
variables were considered as network inputs and found on variables influence
strategy, result of various network models fitting indicated that two structures
with 8 and 11 hidden nodes are the best prediction models; and variables
arrangement to predict cash flow in different structures requires appropriate
software design which has been suggested in suggestions. In addition, in
relation to the fourth main hypothesis, results showed that being a government-
48
Iranian Journal of Finance, 2019, Vol. 3, No. 1
owned company with penetration coefficients of 0.6 and 0.3 did not have a
significant impact on cash flow projections. Therefore, it can be stated that the
sixth hypothesis is rejected.
Based on the results of this paper, creditors evaluations in customers'
ability to generate cash flows, investors to cash flow prediction in business
units and managers in various decision makings that require cash flow
estimations as well as analysts in interpreting and helping users, could benefit
from this research results. According to these findings, suggestions are
presented as follows:
1) Our criterion in this study was the average total assets in relation to the firm
size variable. It is suggested that in the next researches, the logarithm of
average total assets [ln (TA)] or the logarithm of current sales to future
sales ratio ln (st/st+1) be used as a measure of firm size.
2) A survey and estimation of the overall cash flow forecasting model by
using panel analysis that has not been used in this study due to lack of
information.
3) breakdown of sample companies according to industry type and studying
the appropriate model for each of them, which in this study was not
possible due to lack of information and the low number of companies.
4) It is recommended that in future investigations probable networks, whose
structure generally includes one input and three information-processing
layers (pattern layer, classification, and output layer) used and compared to
the results of this paper.
5) Since predicting cash flow is a multifaceted approach, it is convenient that
other approaches be investigated, too.
6) Regarding company characteristics impact on cash flow forecasting; just a
small number of company characteristics were reviewed. It is
recommended that future researches include other features like [ln (Stock
Pricet/Stock Pricet+1) SR, lns.

49
Cash flow forecasting by using simple and sophisticated models
References
AL-Attar. A. and Hussain. S. (2004). Corporate data and future cash flow.
Journal of Business Finance and Accounting, Vol. 31. Nos7-8. PP. 861-903.
Arnold. A., J., Clubb, C.D.B., Manson, S, and Wearing, R. T. (1991). The
relationship between earning, funds flows and cash flows: evidence for the UK,
Accounting and Business Research, Vol. 22, no. 85, PP. 13-19.
Arthur, N., Czernkowski. R. and Chen. M. (2007). The persistence of cash flow
components into future earnings. Working paper, University of Sydney.
Barth, M.E., Cram, D. p. and Nelson, K. K. (2001). 'Accruals and the prediction
of future cash flows. The Accounting Review, Vol. 76. No. 1, PP. 27-58.
Birt, J., Chalmers, K., Beal, D., Books, A., Byrne, S. and Oliver, J. (2008).
Accounting business reporting for decision making, 2ndedn, John Wiley and Sons,
Milton.
Bowen. R.M., Burgstahler, D. and Daley, L.A. 1986, 'Evidence on the
relationships between earnings and various measures of cash flow', The Accounting
Review, vol.61. no.4, pp. 713-25.
Cheng, A, Liu, C.S and Schaefer, T.F. (1997). Accounting accruals and
incremental information content of earnings and cash flows operations. Advances in
Accounting, Vol. 15, PP. 101-123.
Cheng,C.S.A. and Hollie, D. (2008). Do core and non-core cash flows from
operations persist differently in predicting future cash flows? .Review of Quantitative
finance and Accounting. Vol. 31, no1, PP. 29-53.
Chotkunakitti, p. (2005). Cash flows and accrual accounting in predicting future
cash flow of Thai listed companies, PhD thesis, Southern Cross University.
Dechow, P.M. (1994). Accounting earnings and cash flows as measures of firm
performance: the role of accounting accruals. Journal of Accounting and Economics,
Vol. 18, no1, PP. 3-42.
Defond, M. and Hung, M. (2003). An empirical analysts cash flow forecasts.
Journal of Accounting and Economics, Vol. 35, no1, PP. 73-100.
Ebaid, 1.E. (2011). Accruals and prediction of future cash flows: empirical
evidence from an emerging marker. Management Research Review, Vol. 34, no7, PP.
1-32.
Elliott, B. and Elliott, J. (2007). Financial Accounting and Reporting Education,
Essex.
Farshaadfar, S., Ng, C, and Brimble, M. (2008). The relative ability of earnings
and cash flow data in forecasting future cash flows. Pacific accounting review, Vol.
20, no3, PP. 251-268.

50
Iranian Journal of Finance, 2019, Vol. 3, No. 1
Francis, R., and Eason, P. (2012). Accruals and the naïve out-of- sample
prediction of operating cash flow. Advances in accounting, incorporating advances in
international accounting, PP. 1-9.
Habib, A. (2010). Prediction of operating cash flow: future evidence from
Australia. Australian accounting Review, Vol. 20, no2, P. 134.
IASB. (2001). Framework for the preparation and preparation of Financial
Standards Board (IASB), London.
Janjani, R. (2015). Comparing US-GAAP and Tran-GAAP Operating cash flows
to predict future cash flows. Journal of Financial Reporting and Accounting, 13(1),
http:// dx.doi.org/10,1108/JFRA-06-2013-0047.
Kordestani, Gholamreza. (1995)."Ability to predict future cash flows and
profits".Master's dissertation, TarbiatModarres University.
Kenneth S. Lorek, (2019), Trends in statistically based quarterly cash-flow
prediction models. Journal of Accounting Forum,Volume 38, P. 145-151.
Linna Shi, HuaiZhang and JunGuo, (June 2014), Analyst cash flow forecasts
and pricing of accruals, Advances in Accounting, Volume 30, Issue 1, Pages 95-105.
Lorek, K., &Willinger, G. (2008). Time-series properties and the predictive
ability of quarterly cash-flows. Advances in accounting, 24. pp 65-70.
Lie, Q. (2006). Cash distribution and return, university of Michigan, pp 1-320.
Lorek, K., &Willinger, G. (2008). Time-series properties and the predictive
ability of quarterly cash-flows. Advances in accounting, 24. pp 65-70.
Lorek, K., &Willinger, G. (2009). New evidence pertaining to the prediction of
operating cash-flows. Review of Quantitative Finance Accounting, 32(1), 1-15.
Mcbeth, K.H. (1993). Forecasting operating cash flow: Evidence on the
comparative predictive abilities of net income and operating cash flow from actual
cash flow data. The Mid-Atlantic Journal of Business. Vol. 29, no2, PP. 173-87.
Mahdavi, Gh and Saberi, M. (2010). "Determine the optimal model of projected
operating cash flows of companies listed in Tehran Stock Exchange" Journal of
Accounting Advances, 2 (1) Row (58/3), 119-225.
Magmoud Abadi and Mansouri (2011). "The role of discretionary and non-
discretionary accruals in predicting future cash, journal of research – Science financial
Accounting
Mirfakhraddini, SeyedHeidar,; Moienaddin, Mahmoud,; Ebrahimpour, Alireza.
(2009). "Compare the ability of cash flows and accruals to predict future cash flows".
The Iranian Accounting and Auditing Review, 55:99-116.
Modarres, A. SianatiDeilami,Z. (2004). "The usage of multivariate time series
51
Cash flow forecasting by using simple and sophisticated models
model to forecast operating cash flows". The Iranian Accounting and Auditing
Review, 10 (34): 77-110.
Nasser A. and Spear Mark Leis, (July–September 1997), Artificial neural
networks and the accounting method choice in the oil and gas industry, Accounting,
Management and Information Technologies, Volume 7, Issue 3, Pages 169-181.
Penham, S.H. and Yehuda, N. (2009). The Pricing of earnings and cash flow
and the affirmation of accrual accounting. Review of Accounting Studies, Vol. 14,
no4, PP. 453-479.
Pfeiffer, R.J., P.T. Elgers, M.H. Lo and L.L. Rees (1998). Additional evidence
on the incremental information content of cash flow and accrual: the impact of errors
in measuring market expectations. Accounting Review, Vol. 73, no3, PP. 373-385.
Rattachut Tangsucheeva and VittaldasPrabhu, (December 2014), Stochastic
financial analytics for cashflow forecasting, International Journal of Production
Economics, Volume 158, Pages 65-76.
Saghafi, A. Fadaie, H.R. (2007). "Choose an efficient model to forecast cash
flows based on comparable models of companies listed in the Tehran Stock
Exchange". The Iranian Accounting and Auditing Review, 14 (50): 3-24.
Saghafi, A. Sarraf, F. (2014). "A model to forecast cash flow in Iranian
companies". Accounting Research, 6 (21): 1-26.
Sarraf, F. Saghafi, Ali; HassasYeganeh, Yahya,; Amiri, Maghsoud.
(2013)."Linear and nonlinear regression models to estimate cash flows".Journal of
accounting knowledge and management auditing, 2(8): 141-155.
Sarraf, Fatemeh. (2013). "Designing a model for predicting cash flow in Iranian
companies". Ph.D. Thesis. AllamehTabataba'i University.
Saghafi, Ali.;Sarraf, Fatemeh.; AghabalaieBakhtiar, Hannaneh.
(2015)."Application of artificial neural network in predicting future cash
flow".Accounting Research, 3 (9): 63-80.
Shadi Farshadfar and RezaMonem, ( March 2013), Further Evidence on the
Usefulness of Direct Method Cash Flow Components for Forecasting Future Cash
Flows.The International Journal of Accounting, Volume 48, Issue 1, Pages 111-133.
Sebastian M.Blanc and ThomasSetzer, ( 16 June 2015), Analytical debiasing of
corporate cash flow forecasts, European Journal of Operational Research, Volume
243, Issue 3, Pages 1004-1015.
Seng, D. (2006). Earnings versus cash flow as predictors of future cash flow:
New Zealand evidence.Working paper, University of Otago.
Sharma, D.S. & Iselin, E.R. (2003). The relative relevance of cash flow and
accrual information for solvency assessments: A multi-method approach. Journal of

52
Iranian Journal of Finance, 2019, Vol. 3, No. 1
business Finance & Accounting, Vol.30, no7/8, PP 40-115.
Smith M. 1993, Neural. Net works for statistical Mode ling, New York.
Teoh, S.H., Welch, I. and Wong, T.J. (1998). Earnings management and the
underformance of seasoned equity offerings. Journal of Financial Economics, Vol. 50,
no1, PP 63-99.
Waldron, M.A. and Jordan, C.E. (2010), the comparative predictive abilities of
accrual earnings and cash flows in periods of economic turbulence: the case of the it
bubble',
Yousef iRadmandi, H. (2009). "Artificial Neural Networks", Faculty of
Engineering, Qazvin, Iran.
Yoder. T.R. 2006, 'The incremental cash flow predictive ability of accruals models',
PhD thesis, Pennsylvania State University.
Bibliographic information of this paper for citing:
Sarraf, Fatemeh (2019). Cash flow forecasting by using simple and sophisticated
models in Iranian companies. Iranian Journal of Finance, 3(1), 24-52.
Copyright © 2019, Fatemeh Sarraf