cash flow management & forecasting - california
TRANSCRIPT
ADVANCED CONCEPTS AND PRACTICES FOR INVESTING PUBLIC FUNDS
Cash Flow Management & Forecasting
The California Debt Investment Advisory Commission October 22, 2009
Kathleen Jackson Benjamin Finkelstein, CFA Principal Investment Officer Managing Director City of San Jose Cantor Fitzgerald
Cash Flow Management – Not Just Paying Bills?
1. What is good “cash flow” management?
2. What is the purpose of the investment portfolio?
3. What is our investment strategy?
4. What role does “cash flow” management play in managing a public fund portfolio?
5. What are some analytical techniques for integrating cash management and portfolio management?
What Is Good “Cash Flow” Management?
1. Does not rely on intuition but has developed metrics that provide for informed decision making
2. Insures principal preservation is #1 priority
3. Obligations are paid on time without the need to liquidate securities
4. Portfolio is constructed to earn the optimum income during the current budget cycle
What Is Purpose Of Investment Portfolio?
1. Addresses why Yield is policy objective
2. To earn optimal income which can be reinvested in the community to:
a. Increase public services
b. Help defray operating cost
a. Help mitigate tax burden on citizens
What Is Our Investment Strategy?
1. Choices:
a. Income or Growth
b. Investor or Trader
2. City of San Jose uses a income focused market rate of return or book yield investment strategy.
3. In implementing strategy price change or unrealized gains or losses are not considered.
What Role Does Cash Management Play?
1. Cash management is the foundation on which portfolio is constructed.
2. Cash management integrates past, present and future into the investment decision process
3. Cash management is a critical process for optimizing portfolio income.

Analytical Techniques For Reducing Uncertainty
1. Liquidity estimating
2. Using short term sensitivity analysis to insure tactical liquidity remains optimally invested
3. Concepts and Analysis ¾ Politics of Forecasting
¾ Why MRR (book yield) optimizes portfolio earnings within a budget cycle

Liquidity Estimating Concepts
1. A metric for quantifying the policy directive to place safety and liquidity before income.
2. Crucial in transitioning from intuition to informed decision making
3. Portfolio consist of two virtual portfolio’s; liquidity (strategic) and income (tactical)
4. Minimizes opportunity cost when implemented

Liquidity Estimating Concepts Cont’d
5. Total Portfolio = Strategic + Tactical + Bonds
6. Strategic Liquidity = Primary + Secondary
¾ Primary = Operating + Cushion
¾ Secondary = Additional Cushion
7. Total Liquidity = Strategic + Tactical (idle)
8. Tactical = Investable Funds
9. Tactical = Total Liquidity – Strategic Liquidity

Liquidity Estimator
1. Gather historical monthly cash flows (36 mo)
2. Using various scenarios define appropriate “liquidity multiple”
3. Scenarios consist of short term and long term evaluation periods (12 and 36mo)
4. Compare results and adjust existing liquidity


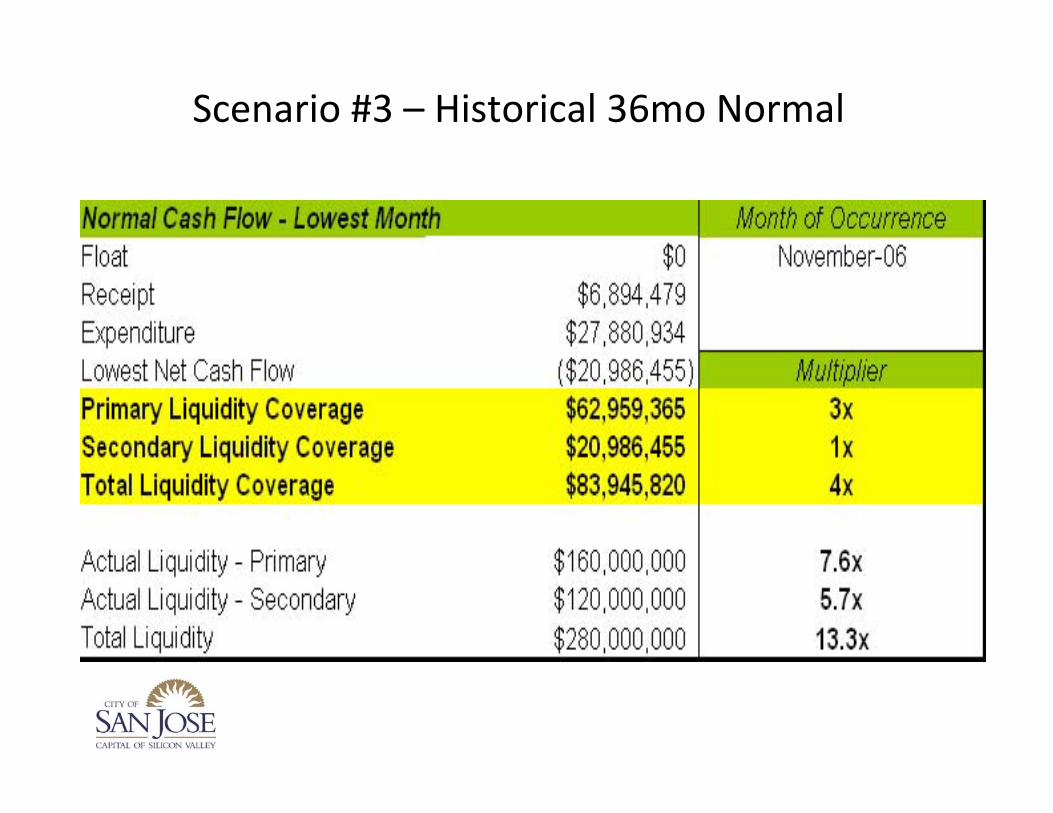
Scenario #3 – Historical 36mo Normal

Liquidity
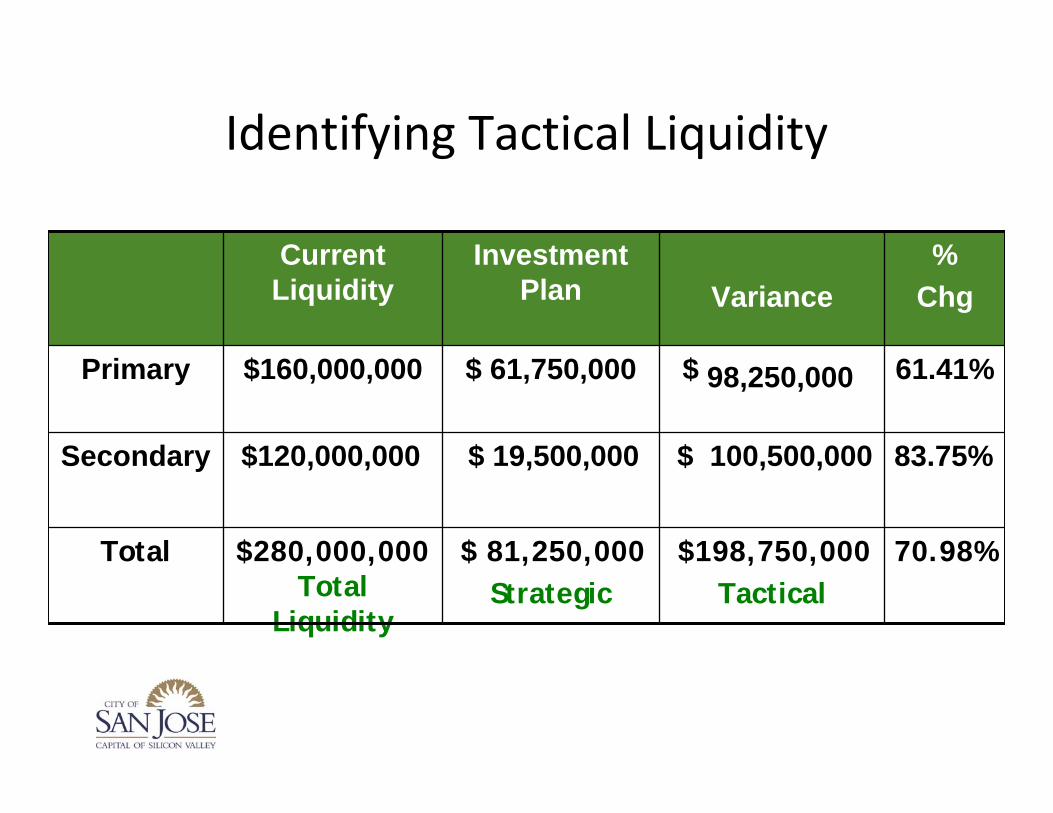
Identifying Tactical Liquidity
Current Liquidity
Investment Plan Variance
% Chg
Primary $160,000,000 $ 61,750,000 $ 98,250,000 61.41%
Secondary $120,000,000 $ 19,500,000 $ 100,500,000 83.75%
Total $280,000,000 Total
$ 81,250,000 Strategic
$198,750,000 Tactical
70.98%

Cash Flow Forecast – Sensitivity Analysis
• Rate sensitivity analysis is an important due diligence process for portfolio management
• Monitors market conditions that can adversely effect investment decisions and strategy – Liquidity estimation creates a plan for how much tactical liquidity is available for investment
– Evaluates strategic and tactical liquidity in light of various interest rate outcomes


Politics of Budget Forecasting

Budget Strategy – How Much To Forecast
• Questions needing answers – Is the amount a forecast or obligation
– Are unrealized gains / losses included in budget
– Are you indifferent to source of return
– Are you a investor or trader
– What is the portfolio income haircut
– What duration optimizes forecast/budget
• What’s the methodology – GASB 31 – 3mo T‐bill
– Market Rate of Return – 12 mo moving average
– Annualized Total Return

Income vs Price – Stability vs Volatility
Coupon = 4.41 / 93.8% Price = .29 / 6.2%

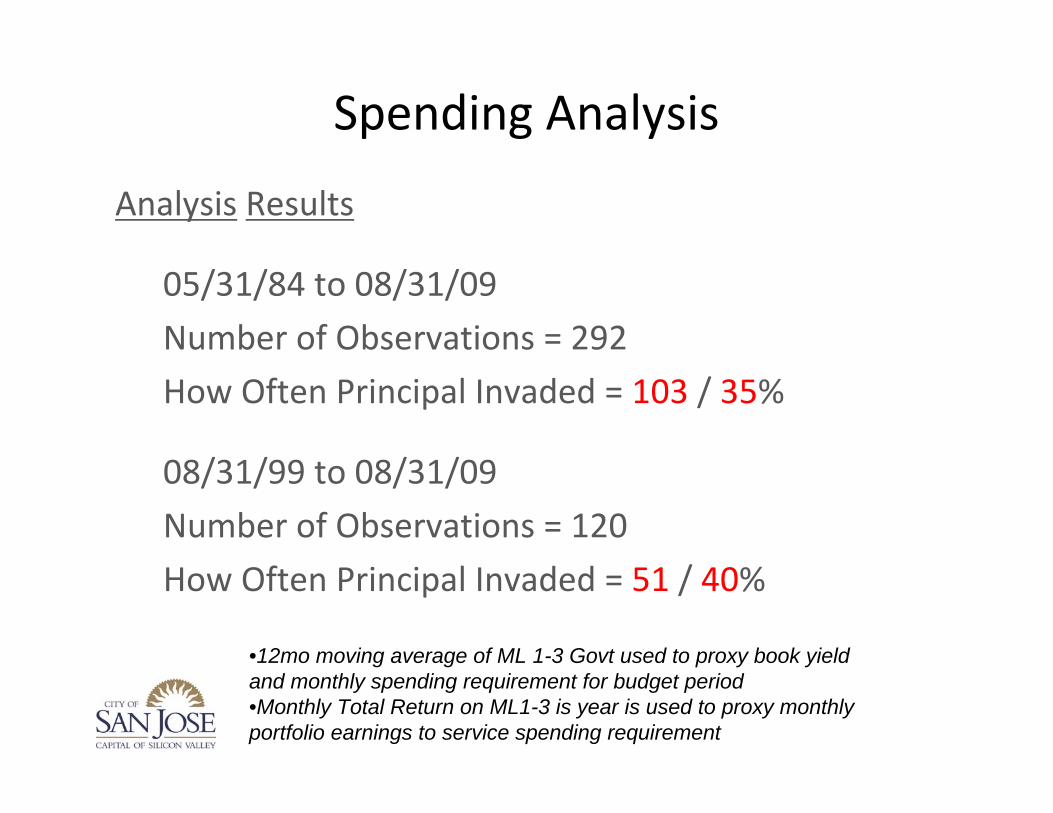
Spending Analysis
Analysis Results
05/31/84 to 08/31/09
Number of Observations = 292
How Often Principal Invaded = 103 / 35%
08/31/99 to 08/31/09
Number of Observations = 120
How Often Principal Invaded = 51 / 40%
•12mo moving average of ML 1-3 Govt used to proxy book yield and monthly spending requirement for budget period •Monthly Total Return on ML1-3 is year is used to proxy monthly portfolio earnings to service spending requirement
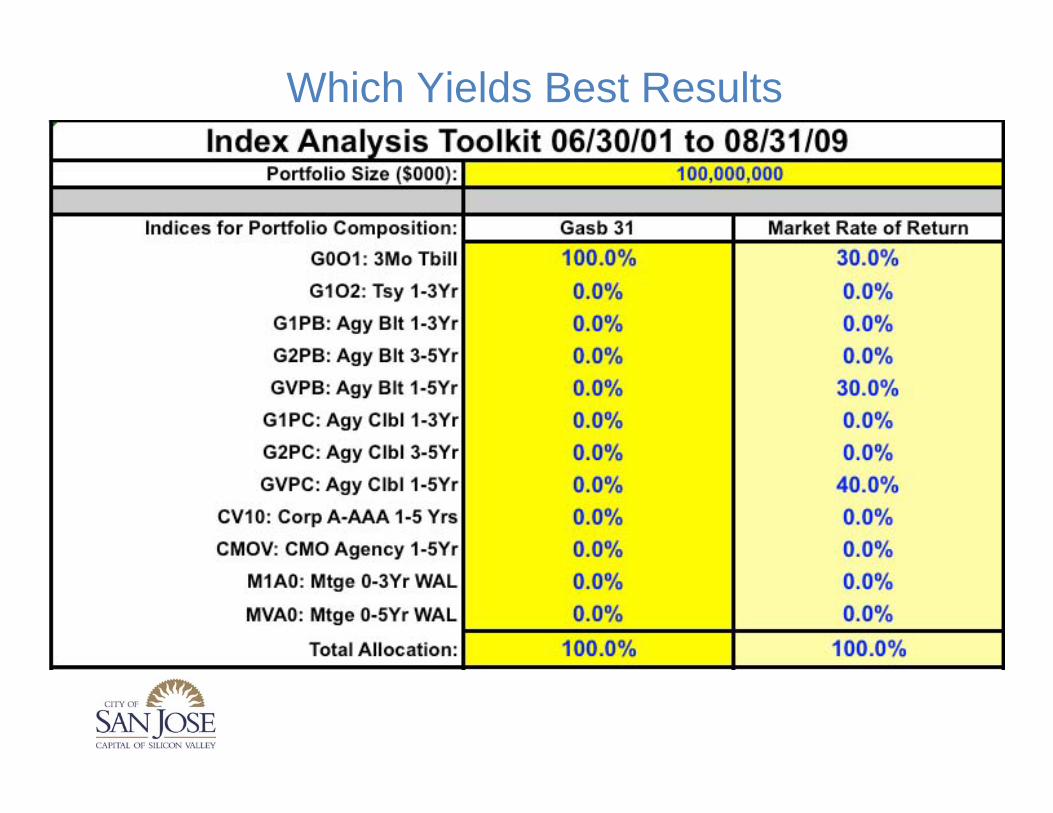
Which Yields Best Results

Reinvestment Risk or Interest Rate Risk
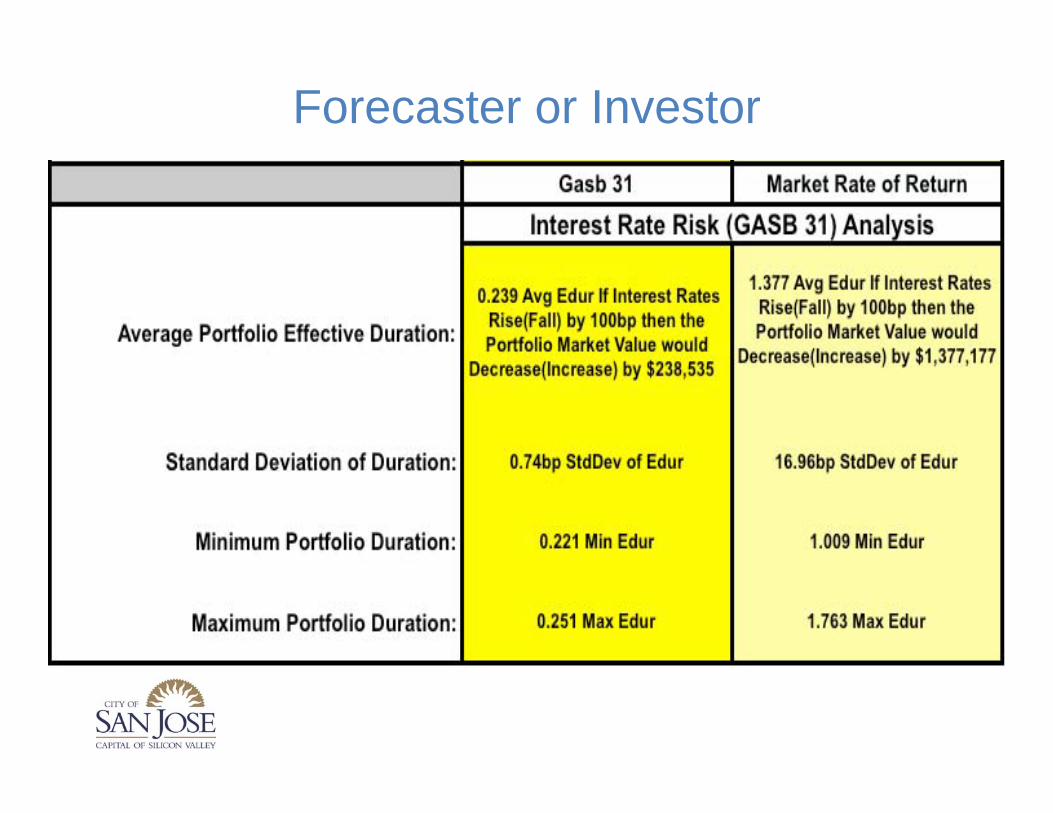
Forecaster or Investor

Opportunity Cost
Session Take Away’s
1. Know the purpose of your investment portfolio • Income: reinvest back into community
• Growth: grow the portfolio
1. Public funds are not indifferent to the source of return when budgeting • In practice unrealized gains/losses excluded from budget
• MRR (book yield) is more predictable / stable
• Income stability minimizes haircuts to budget
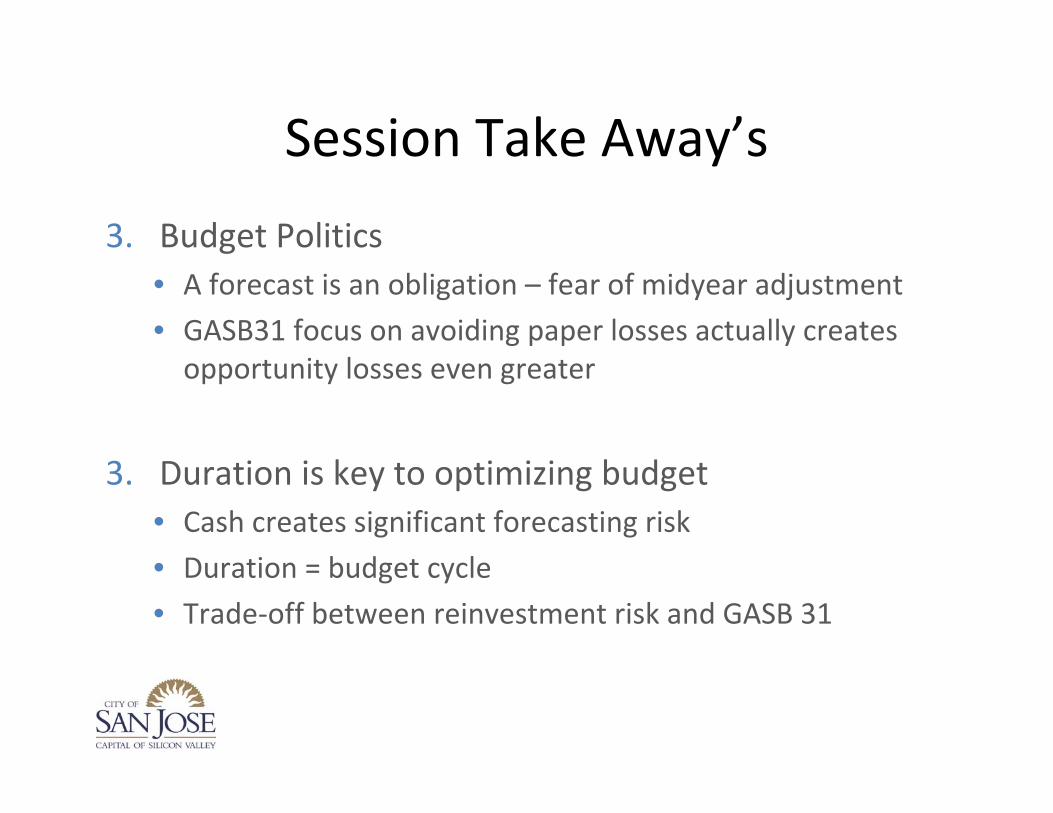
Session Take Away’s
3. Budget Politics • A forecast is an obligation – fear of midyear adjustment
• GASB31 focus on avoiding paper losses actually creates opportunity losses even greater
3. Duration is key to optimizing budget • Cash creates significant forecasting risk
• Duration = budget cycle
• Trade‐off between reinvestment risk and GASB 31
DISCLAIMER
Information herein has been obtained from sources believed to be reliable, but Cantor Fitzgerald and Co. and its affiliate companies (collectively “Cantor Fitzgerald”) do not warrant its completeness or accuracy. This document is not an offer or solicitation for the purchase or sale of any securities or financial instruments. The information herein has been prepared solely for informational purposes and is not an offer to buy or sell any security or instrument or to participate in any trade strategy. No representation or warranty can be given with respect to the accuracy or completeness of the information herein, or that any future offer on securities, instruments or transactions will conform to the terms hereof. Securities or financial instruments mentioned herein may not be suitable for some investors. Cantor Fitzgerald may have positions or act as a market maker in securities or financial instruments mentioned herein (or options with respect thereto). Any scenario results presented here in are based upon information which we believe to be reliable. The security prepayments, yields, valuations, and future returns may vary significantly in dynamic interest rate or otherwise volatile markets. Economic and regional factors, spread volatility, and interest rate or yield curve shifts can affect the payment patterns of MBS and bonds with embedded options, the horizon analytics, and potential reinvestment alternatives.