an overview to cash flow & liquidity...
TRANSCRIPT

AN OVERVIEW TO CASH FLOW & LIQUIDITY FORECASTING
2 AN OVERVIEW TO CASH FLOW & LIQUIDIT Y FORECASTING
Introduction
The ability for companies to accurately predict future cash and liquidity needs is certainly important. Effective cash forecasting results in more efficient use of capital, reduced financing costs and less risk. The skill of effective cash forecasting, however, is a challenge for treasuries to master. If proof is needed, just attend an annual meeting of the Association of Financial Professionals (AFP). The recent conference in Washington D.C. featured multiple cash flow forecasting sessions — all filled with a standing-room only crowd. Why? Although technology has made it easier to gather, communicate and analyze data, the challenges of globalization, increased financial complexity, extensive regulatory requirements and lack of systems integration contribute to the difficulty of producing an effective cash flow forecast.
What can be done to improve forecasting effectiveness? What are the proper elements of a forecast? What are good sources of data? How do you determine which time frames to use and what modeling techniques are appropriate? What are the “unknown unknowns” that reduce forecasts to rubble in the blink of an eye? And, what is the differ-ence between a cash flow forecast and a liquidity forecast?
This paper will answer these questions and discuss some of the available tools that can help treasury professionals achieve a high degree of visibility into future cash flows and liquidity positions. Finally, we will present Financial Sciences Corporation’s (FSC) vision for cash forecasting and liquidity management in ATOM, the treasury management system designed, developed and implemented by FSC.
AN OVERVIEW TO CASH FLOW & LIQUIDITY FORECASTING
3 AN OVERVIEW TO CASH FLOW & LIQUIDIT Y FORECASTING
Goals and Objectives
One of the first steps is to establish clear forecasting goals and objectives. Some treasury groups want to produce a forecast each month while others must track availability and liquidity each day. Some treasuries are satisfied with a rolling 7-day forecast, while others require a daily, 12-month forecast. Ultimately the time granularity and duration of the fore-cast is determined by the nature and requirements of a company’s underlying operations.
Some common forecasting goals include the ability to produce:
• A rolling daily seven-day forecast to ensure adequate funding of daily operations
• A rolling monthly forecast going out 12 months for visibility on longer term cash availability
• A cash forecast upon request
• A 12-month rolling liquidity forecast to ensure long-term funding
• Forecast scenarios based on changes in underlying assumptions
Regardless of the forecasting time frame, treasuries should seek to achieve visibility on two distinct levels:
1. Cash balances and cash excesses or shortfalls from daily operations.
2. Additional sources or uses of cash from credit agreements, investments, debt programs and other sources that may be used to remediate any identified cash excesses or shortfalls.
Leveraging Technology
There are various technologies available to help organizations organize, analyze, and process cash flow data. Spreadsheets and specialized forecasting software, such as those provided by a Treasury Management System (TMS), are the two most popular choices.
Spreadsheets, which have been around for decades, are still widely used by companies of all sizes. Their popularity is fueled by their low cost and high flexibility. Many of the forecasting tools available from TMS software vendors are unfortunately designed by programmers (not treasury professionals), so they tend to be complex, inflexible or not sufficiently robust. The challenge for treasury software providers is to create tools with the level of flexibility needed for effective cash flow forecasting — not just for one client or industry, but for clients of different sizes, industries and geographies.
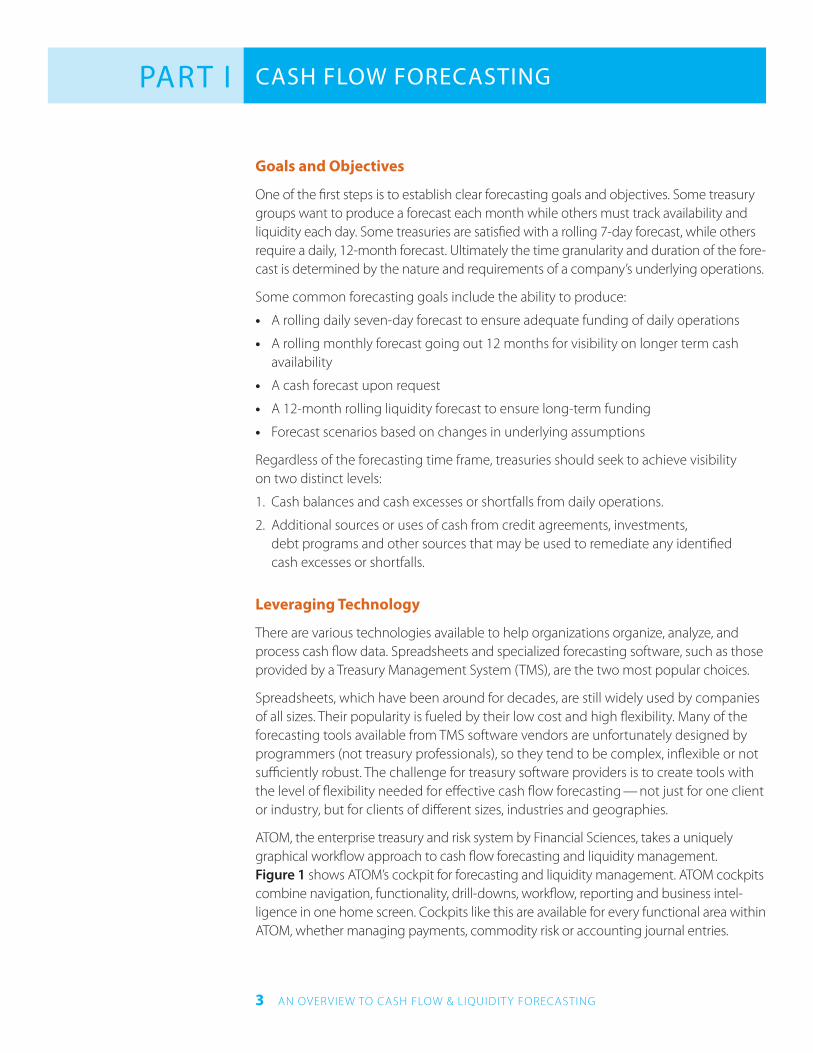
ATOM, the enterprise treasury and risk system by Financial Sciences, takes a uniquely graphical workflow approach to cash flow forecasting and liquidity management. Figure 1 shows ATOM’s cockpit for forecasting and liquidity management. ATOM cockpits combine navigation, functionality, drill-downs, workflow, reporting and business intel-ligence in one home screen. Cockpits like this are available for every functional area within ATOM, whether managing payments, commodity risk or accounting journal entries.
CASH FLOW FORECASTINGPART I
4 AN OVERVIEW TO CASH FLOW & LIQUIDIT Y FORECASTING
Automation, Data Integration and Modeling
Every business is different. Some businesses can forecast an entire year with relative ease because they have a small number of relatively predictable cash flows. Other busi-nesses that have many entities, thousands of bank accounts and millions of cash flows have challenges just to organize their data. Add the complexity of multiple Enterprise Resource Planning (ERP) systems, multiple banking platforms, and a plethora of stand-alone spreadsheets and it is no surprise that companies cannot produce effective fore-casts when needed. Treasury management system technology can help by addressing three key areas: automation, data integration and modeling.
Automation does several things. Most notably, it allows treasurers to become more efficient in running the company’s treasury operations. Automation can eliminate the need to manually download, parse, classify and reconcile bank statement activity. For smaller organizations with one bank and a few accounts, automation might not save much time. For more diverse and complex treasuries, however, automation can have a huge impact from a cost, time and resource savings perspective.
Automation enables the ability to integrate data. A goal for any TMS should be to have all data in one system and one database. Having one system with the right applica-tion tools will eliminate the need to rely on external spreadsheets. A fully integrated system will also help aggregate and incorporate data from ERP and General Ledger (GL) systems. With payments, deals/trades, balances, credit facilities, investments and other information in one place, there is no need to rekey information, so errors are reduced, quality increases and overall efficiency improves.
FIGURE 1. ATOM Forecasting and Liquidity Management
5 AN OVERVIEW TO CASH FLOW & LIQUIDIT Y FORECASTING
An integrated platform enables others within the organization — business units, region-al and/or country finance managers — to participate in the forecasting process result-ing in a more complete view of overall operations. Integration facilitates the gathering of data, which can then be organized, dissected and sliced and diced for a granular look at projections. Cash forecasts can be quickly compiled, saving time for more productive, value-added work.
Modeling is the third important component. Comprehensive treasury management systems provide analytics that include functionality to model and predict cash forecast-ing activity using historical and integrated data as model inputs.
Cash Position
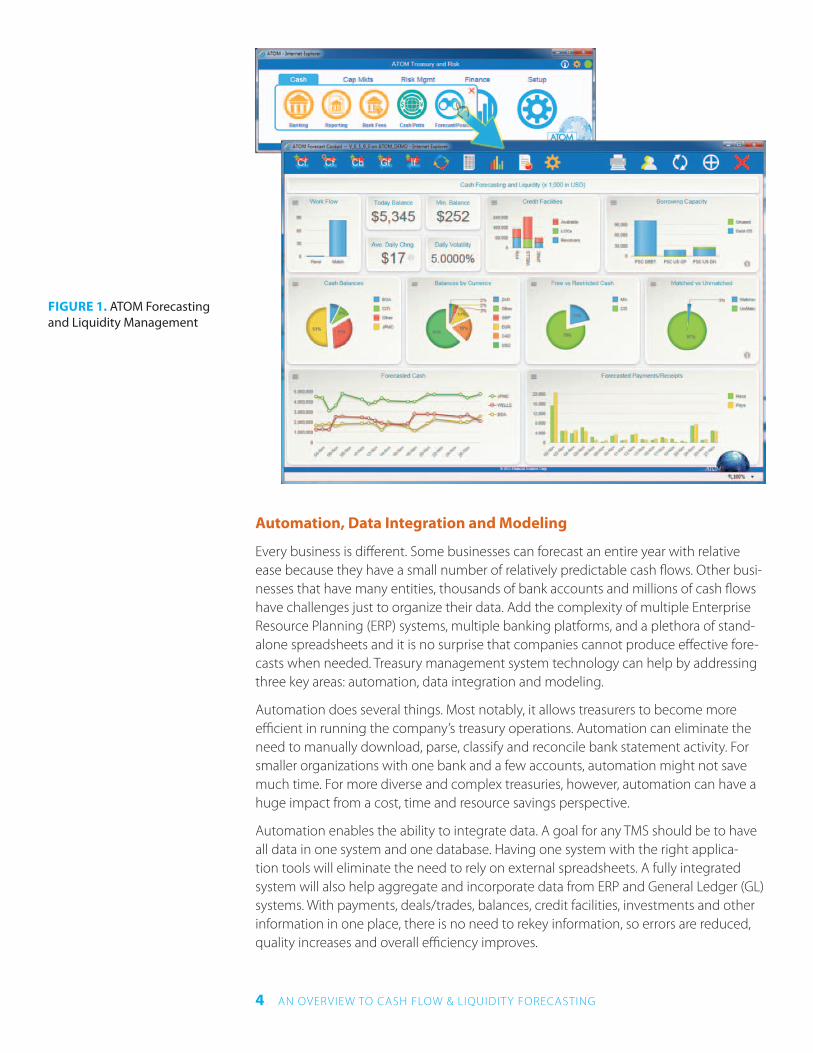
The first step in creating a cash forecast is to create a cash position. A cash position should provide a real-time view of today’s cash balances — at a minimum by bank, bank account, currency and entity. Balances should be summarized by inflow and outflow categories such as lockbox deposits, debt and investment maturities, payroll, controlled disbursements, leases, etc. Figure 2 shows a simple cash position in ATOM.
This view shows current and/or prior-day balances and activity. Without an automated system, it can take considerable time to retrieve bank-reported activity and compile a comprehensive cash position. Although most treasury management systems retrieve and record bank activity automatically, many systems do not have the ability to analyze transactions for automatic matching and categorization.
FIGURE 2. Monitoring Daily Cash Positions
6 AN OVERVIEW TO CASH FLOW & LIQUIDIT Y FORECASTING
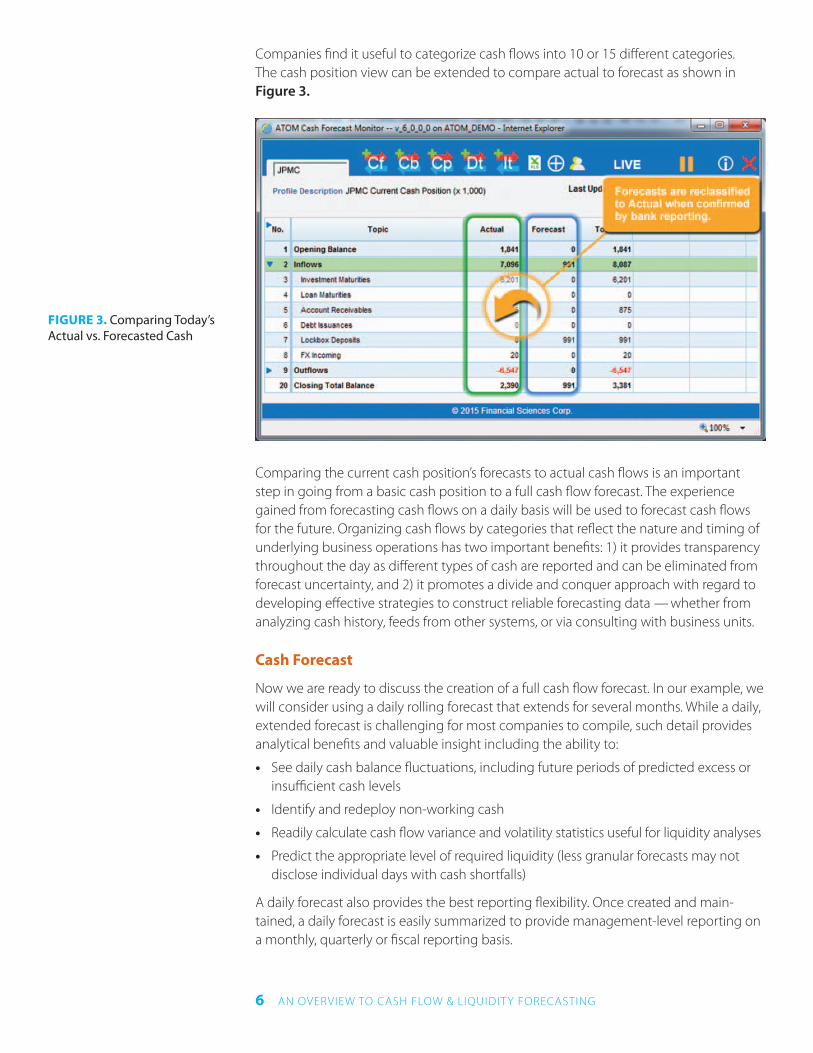
Companies find it useful to categorize cash flows into 10 or 15 different categories. The cash position view can be extended to compare actual to forecast as shown in Figure 3.
Comparing the current cash position’s forecasts to actual cash flows is an important step in going from a basic cash position to a full cash flow forecast. The experience gained from forecasting cash flows on a daily basis will be used to forecast cash flows for the future. Organizing cash flows by categories that reflect the nature and timing of underlying business operations has two important benefits: 1) it provides transparency throughout the day as different types of cash are reported and can be eliminated from forecast uncertainty, and 2) it promotes a divide and conquer approach with regard to developing effective strategies to construct reliable forecasting data — whether from analyzing cash history, feeds from other systems, or via consulting with business units.
Cash Forecast
Now we are ready to discuss the creation of a full cash flow forecast. In our example, we will consider using a daily rolling forecast that extends for several months. While a daily, extended forecast is challenging for most companies to compile, such detail provides analytical benefits and valuable insight including the ability to:
• See daily cash balance fluctuations, including future periods of predicted excess or insufficient cash levels
• Identify and redeploy non-working cash
• Readily calculate cash flow variance and volatility statistics useful for liquidity analyses
• Predict the appropriate level of required liquidity (less granular forecasts may not disclose individual days with cash shortfalls)
A daily forecast also provides the best reporting flexibility. Once created and main-tained, a daily forecast is easily summarized to provide management-level reporting on a monthly, quarterly or fiscal reporting basis.
FIGURE 3. Comparing Today’s Actual vs. Forecasted Cash
7 AN OVERVIEW TO CASH FLOW & LIQUIDIT Y FORECASTING
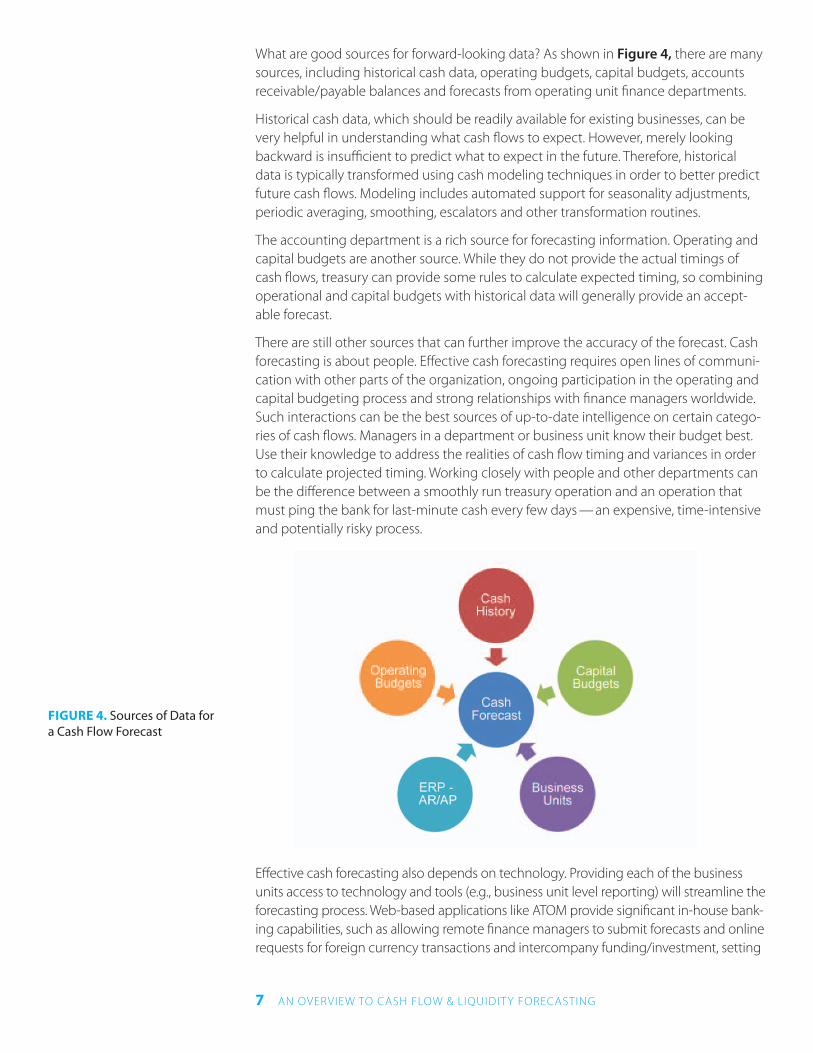
What are good sources for forward-looking data? As shown in Figure 4, there are many sources, including historical cash data, operating budgets, capital budgets, accounts receivable/payable balances and forecasts from operating unit finance departments.
Historical cash data, which should be readily available for existing businesses, can be very helpful in understanding what cash flows to expect. However, merely looking backward is insufficient to predict what to expect in the future. Therefore, historical data is typically transformed using cash modeling techniques in order to better predict future cash flows. Modeling includes automated support for seasonality adjustments, periodic averaging, smoothing, escalators and other transformation routines.
The accounting department is a rich source for forecasting information. Operating and capital budgets are another source. While they do not provide the actual timings of cash flows, treasury can provide some rules to calculate expected timing, so combining operational and capital budgets with historical data will generally provide an accept-able forecast.
There are still other sources that can further improve the accuracy of the forecast. Cash forecasting is about people. Effective cash forecasting requires open lines of communi-cation with other parts of the organization, ongoing participation in the operating and capital budgeting process and strong relationships with finance managers worldwide. Such interactions can be the best sources of up-to-date intelligence on certain catego-ries of cash flows. Managers in a department or business unit know their budget best. Use their knowledge to address the realities of cash flow timing and variances in order to calculate projected timing. Working closely with people and other departments can be the difference between a smoothly run treasury operation and an operation that must ping the bank for last-minute cash every few days — an expensive, time-intensive and potentially risky process.
Effective cash forecasting also depends on technology. Providing each of the business units access to technology and tools (e.g., business unit level reporting) will streamline the forecasting process. Web-based applications like ATOM provide significant in-house bank-ing capabilities, such as allowing remote finance managers to submit forecasts and online requests for foreign currency transactions and intercompany funding/investment, setting
FIGURE 4. Sources of Data for a Cash Flow Forecast
8 AN OVERVIEW TO CASH FLOW & LIQUIDIT Y FORECASTING
up payment instructions and performing bank account maintenance. These capabilities can reduce the cost to treasury by enabling remote personnel to see balance and transac-tion information within their TMS instead of logging into their bank and incurring charges for running reports on data that the organization already has. Some companies incent their business units to provide reliable forecasting information by establishing and apply-ing internal cost of fund rates which adjust to reflect reporting volatility.
Once source data is gathered, there are tools and techniques available that that can improve the accuracy and effectiveness of the forecast. Utilizing available statistical data such as the company’s cash conversion cycle, days sales outstanding (DSO) and credit terms can help predict when recognized revenue turns into cash flows at the bank. For example, combining the top 10 customers’ DSO, invoice dates and amounts, will pro-vide a good idea when that booked revenue will turn into cash. Similarly, for a full-year forecast, use the sales forecast and apply the company’s DSO to plot expected revenue timings. Moving averages, regression, seasonality adjustments and other statistical tools can also be used to transform historical data into useful cash flow forecasts.
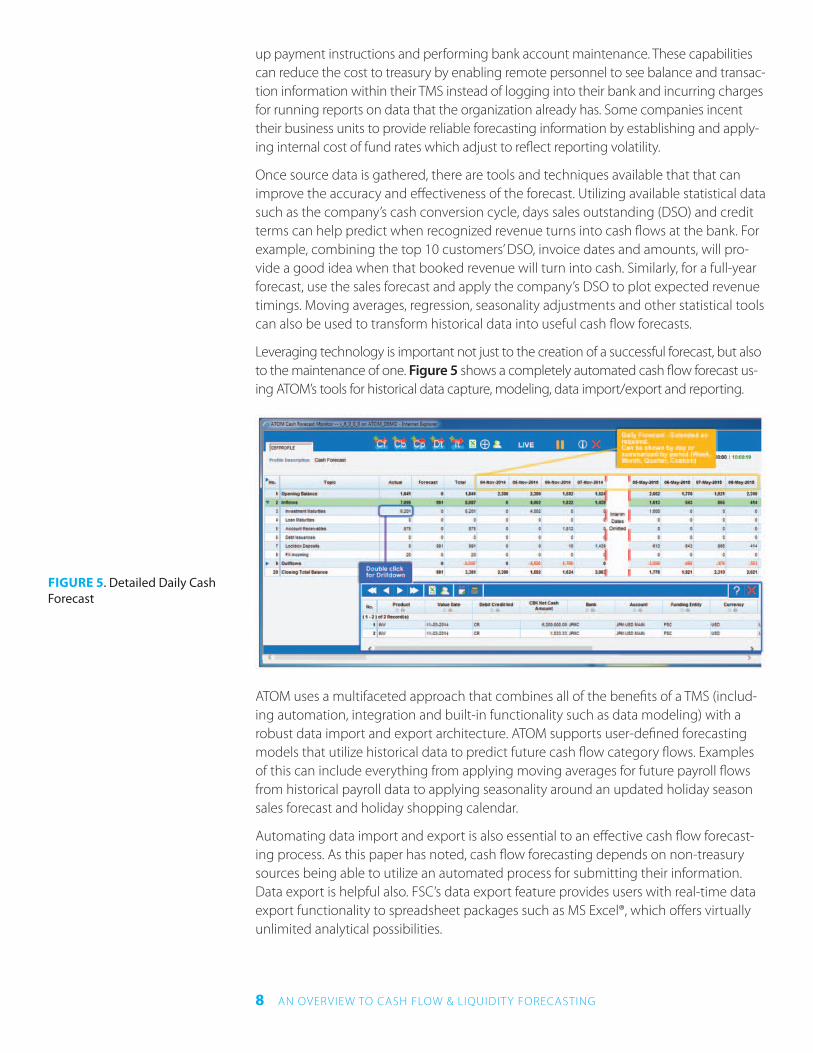
Leveraging technology is important not just to the creation of a successful forecast, but also to the maintenance of one. Figure 5 shows a completely automated cash flow forecast us-ing ATOM’s tools for historical data capture, modeling, data import/export and reporting.
ATOM uses a multifaceted approach that combines all of the benefits of a TMS (includ-ing automation, integration and built-in functionality such as data modeling) with a robust data import and export architecture. ATOM supports user-defined forecasting models that utilize historical data to predict future cash flow category flows. Examples of this can include everything from applying moving averages for future payroll flows from historical payroll data to applying seasonality around an updated holiday season sales forecast and holiday shopping calendar.
Automating data import and export is also essential to an effective cash flow forecast-ing process. As this paper has noted, cash flow forecasting depends on non-treasury sources being able to utilize an automated process for submitting their information. Data export is helpful also. FSC’s data export feature provides users with real-time data export functionality to spreadsheet packages such as MS Excel®, which offers virtually unlimited analytical possibilities.
FIGURE 5. Detailed Daily Cash Forecast
9 AN OVERVIEW TO CASH FLOW & LIQUIDIT Y FORECASTING
Liquidity Forecast
Liquidity forecasts take cash flow forecasting to the next level by providing the sec-ond level of visibility: forecasted additional sources or uses of cash in the event of cash shortfall/excess. These additional sources or uses of cash are calculated by incorporat-ing the liquidity tools treasury professionals can use to manage excess or insufficient projected cash positions identified by the cash forecast. These tools include:
• Unused availability in credit facilities and other credit agreements
• Previously unused cash balances that may be realized from pooling or netting programs
• Liquid investments that can be sold prior to maturity
• Unused availability in short-term borrowing programs (e.g., commercial paper)
• Sources of cash from asset securitization, supply chain optimization or factoring programs
Many companies use liquidity tools in combination to lessen liquidity risk and volatility. For example, an investment portfolio utilized in combination with a short-term borrow-ing program allows a company to build investment reserves from excess borrowings. Reserves can be used to smooth out daily cash needs, avoid market participation on dates with market volatility and build up contingency reserves.
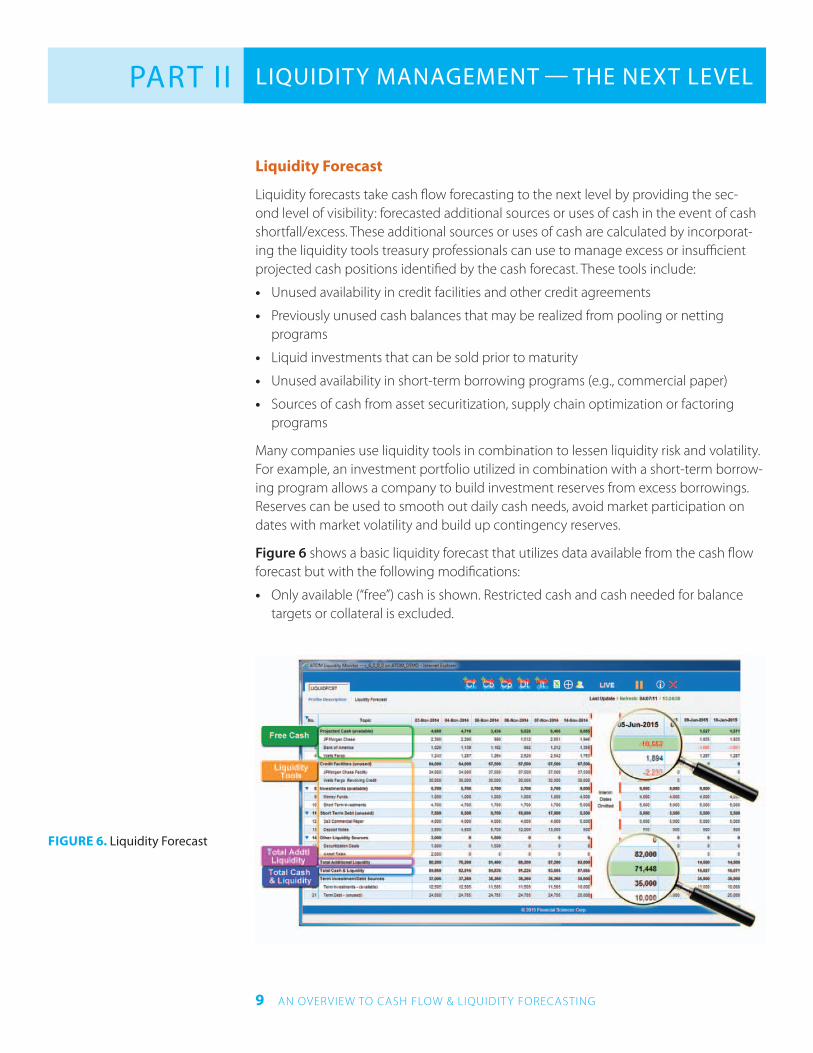
Figure 6 shows a basic liquidity forecast that utilizes data available from the cash flow forecast but with the following modifications:
• Only available (“free”) cash is shown. Restricted cash and cash needed for balance targets or collateral is excluded.
LIQUIDITY MANAGEMENT — THE NEXT LEVELPART II
FIGURE 6. Liquidity Forecast
10 AN OVERVIEW TO CASH FLOW & LIQUIDIT Y FORECASTING
• Additional borrowing capacity is shown including unused borrowing capacity from credit facilities and debt program availability.
• Additional sources of cash are shown, such as available investments for sale or proceeds from asset sales, factoring, etc.
Note that our example predicts a material cash shortfall on June 6th, giving treasury personnel plenty of time to investigate and remediate the underlying cause of the shortfall. Fortunately, the shortfall can be more than adequately covered by the com-pany’s projected total $82 million liquidity facilities.
Scenario Analysis
It is important to remember that available liquidity can be committed or uncommitted. In times of market volatility or in the event of a real or threatened credit downgrade, uncommitted available credit or borrowing capacity can diminish dramatically. Most treasury professionals remember how difficult it was to access cash during the 2008-2009 financial crisis. Any thorough calculation of liquidity should include the perfor-mance of scenario and shocking analyses to prepare for a wide range of circumstances. Such analyses include:
• Performing scenario analyses on available cash balances by applying percentage trend changes, shocks, simulations based on real-world scenarios, and random increases/decreases using a multiple of historical balances volatility.
• Performing scenario analyses on liquidity availability to see the overall impact from projected credit tightening, elimination of uncommitted borrowing sources, invest-ment market value changes, etc.
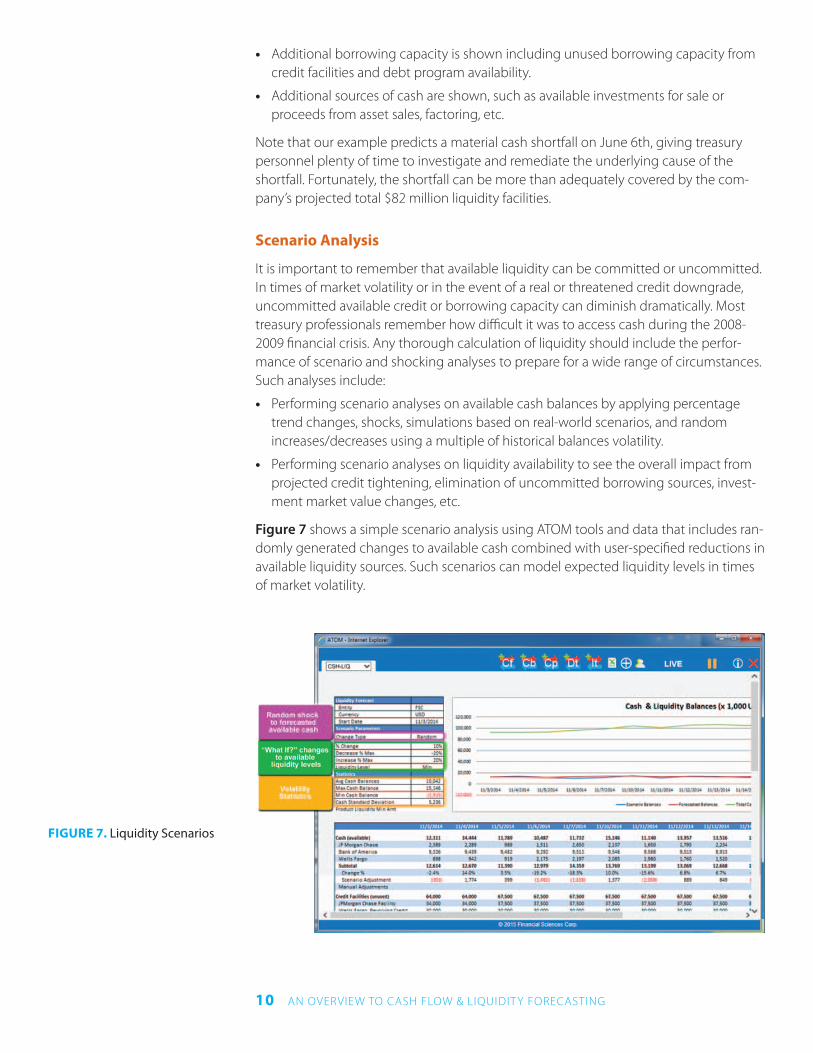
Figure 7 shows a simple scenario analysis using ATOM tools and data that includes ran-domly generated changes to available cash combined with user-specified reductions in available liquidity sources. Such scenarios can model expected liquidity levels in times of market volatility.
FIGURE 7. Liquidity Scenarios
11 AN OVERVIEW TO CASH FLOW & LIQUIDIT Y FORECASTING
CONCLUSION
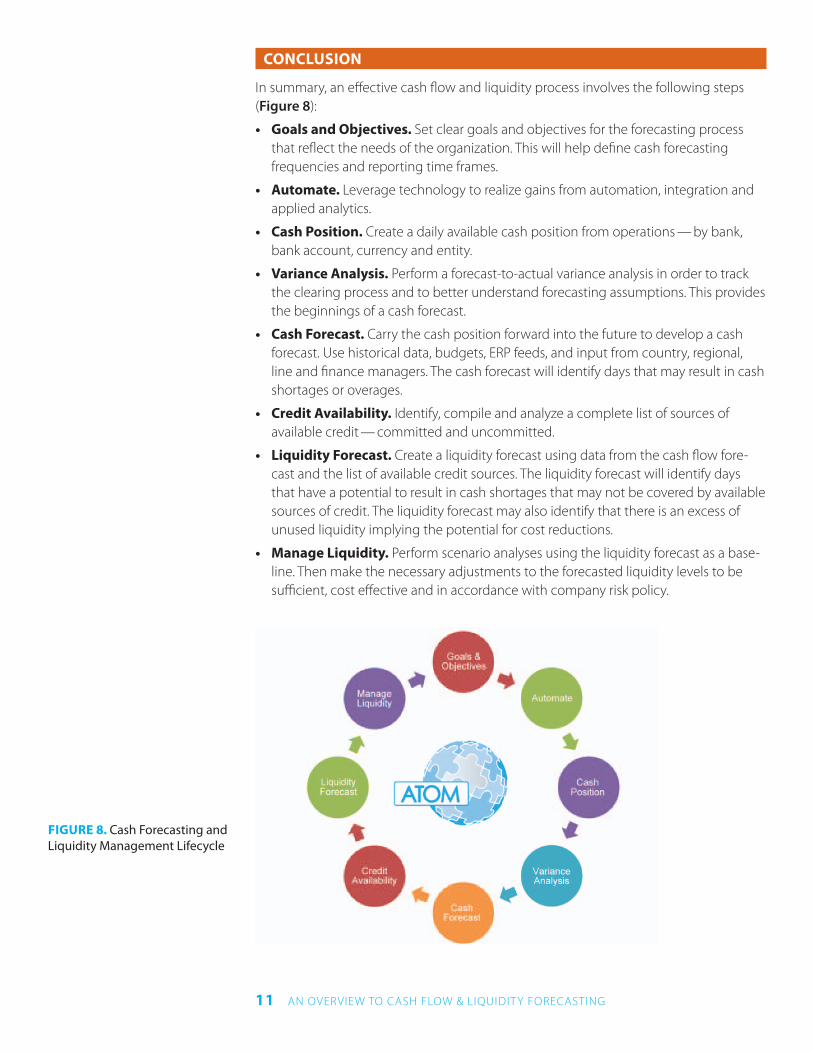
In summary, an effective cash flow and liquidity process involves the following steps (Figure 8):
• Goals and Objectives. Set clear goals and objectives for the forecasting process that reflect the needs of the organization. This will help define cash forecasting frequencies and reporting time frames.
• Automate. Leverage technology to realize gains from automation, integration and applied analytics.
• Cash Position. Create a daily available cash position from operations — by bank, bank account, currency and entity.
• Variance Analysis. Perform a forecast-to-actual variance analysis in order to track the clearing process and to better understand forecasting assumptions. This provides the beginnings of a cash forecast.
• Cash Forecast. Carry the cash position forward into the future to develop a cash forecast. Use historical data, budgets, ERP feeds, and input from country, regional, line and finance managers. The cash forecast will identify days that may result in cash shortages or overages.
• Credit Availability. Identify, compile and analyze a complete list of sources of available credit — committed and uncommitted.
• Liquidity Forecast. Create a liquidity forecast using data from the cash flow fore-cast and the list of available credit sources. The liquidity forecast will identify days that have a potential to result in cash shortages that may not be covered by available sources of credit. The liquidity forecast may also identify that there is an excess of unused liquidity implying the potential for cost reductions.
• Manage Liquidity. Perform scenario analyses using the liquidity forecast as a base-line. Then make the necessary adjustments to the forecasted liquidity levels to be sufficient, cost effective and in accordance with company risk policy.
FIGURE 8. Cash Forecasting and Liquidity Management Lifecycle
Financial Sciences Corporation 111 Town Square Place Jersey City, NJ 07310 Toll free: 800-490-4659 Main: (201) 451-2700 Ext. 641
15-05000
About Financial Sciences and ATOM
At Financial Sciences, we develop and deliver ATOM, our enterprise treasury and risk management software solution. ATOM automates core treasury processes helping our clients achieve control of cash and risk, reduce complexity and costs, ensure compliance and promote best practices throughout their treasury operations. We provide our clients a comprehensive solution to manage all of their treasury needs in a cost-effective, web-based platform that can be deployed however they desire. Our customers provide direction in every decision we make and we empower our employees to exceed our customers’ satisfaction in every way, every day.
To learn more about ATOM and what it can do for you and your treasury, contact Financial Sciences Corporation at [email protected] or visit www.fisci.com.