cash flow forecasting: dedication and discipline of
TRANSCRIPT

Cash Flow Forecasting: Dedication and Discipline of Metrics Yields Improvements
October 15, 2012
Moderator: Cindy Gerhard, Managing Director, Citi Panelists:
Kabir Bhatia, Assistant Treasurer, Mattel Jeffrey Clennon, Director – Cash Management &
Funding, Discover Financial Services Chad Kibler, Assistant Treasurer, Belden

Cindy Gerhard, Managing Director Citi Transaction Services Global Liquidity & Investments
Product Management
Chad Kibler Assistant Treasurer Belden
Kabir Bhatia Assistant Treasurer Mattel
Jeffrey Clennon Director – Cash
Management & Funding Discover Financial Services
Market Practices in Cash Flow Forecasting
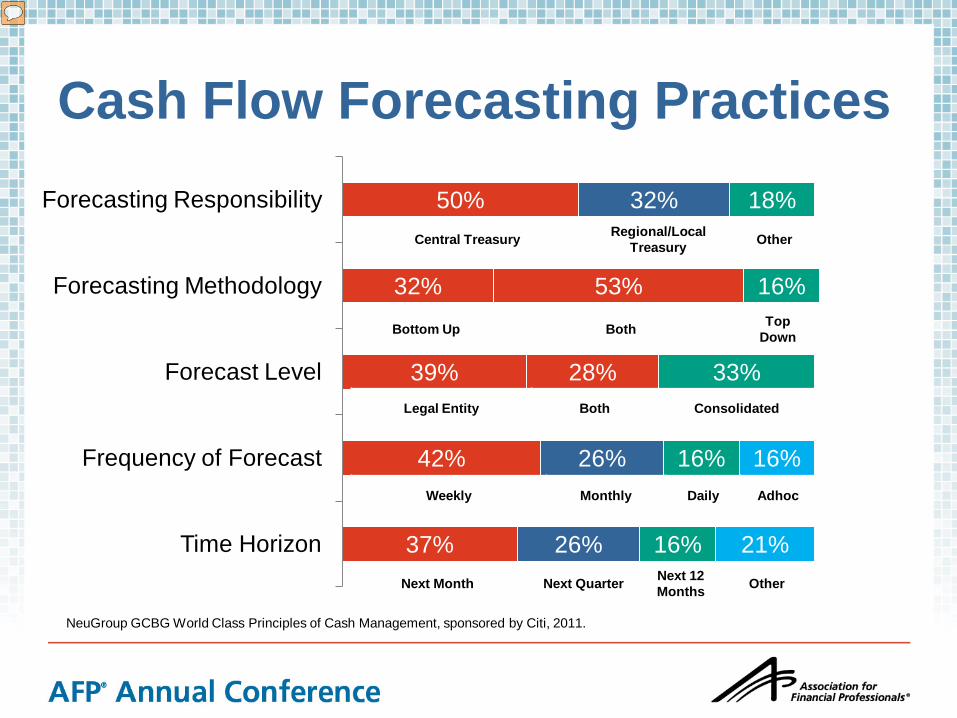
Cash Flow Forecasting Practices
37%
42%
39%
32%
50%
26%
26%
28%
53%
32%
16%
16%
33%
16%
18%
21%
16%
Time Horizon
Frequency of Forecast
Forecast Level
Forecasting Methodology
Forecasting Responsibility
NeuGroup GCBG World Class Principles of Cash Management, sponsored by Citi, 2011.
Central Treasury Regional/Local Treasury Other
Bottom Up Both Top Down
Legal Entity Both Consolidated
Weekly Monthly Daily Adhoc
Next Month Next Quarter Next 12 Months Other

Measuring Short Term Cash Flows % of Companies using the basis for estimating cash
flow
Basis of Estimating Cash Flow
Expected Terms or Patterns
Statistical Analysis of
Past Patterns
Internal Data
Collection Contractual Cash Flows
Other Historical
Bank Flows
Ope
ratin
g C
ash
Flow
s Receipts 47% 58% 53% 21% 16%
Payments 47% 47% 42% 26% 21%
Payroll 37% 42% 47% 5% 16%
Tax 11% 21% 84% 16% 5%
Trea
sury
Cas
h Fl
ows
Debt 26% 11% 5% 68% 0%
Intercompany 26% 16% 37% 26% 5%
CapEx & Acquisitions 32% 11% 89% 5% 0%
Equity 37% 16% 53% 32% 0%
61% - 100% 41% - 60% 16% - 40% 0% - 15% NeuGroup GCBG World Class Principles of Cash Management, sponsored by Citi, 2011.

What really works best?
Detail
Outlook Frequency
Process
CFF Process Design
Benefit of higher accuracy and frequency of
forecasts
Cost/benefit of time and resources to execute the CFF
process
VS.

Mattel

• One of the largest, global toy-manufacturers with market capitalization of ~$12B
• Highly seasonal business with large proportion of the revenues coming ahead of the traditional holiday season
• Global business – 48% of ‘11 revenue generated outside the U.S.
• Credit Ratings – BBB+/Baa1/A-; A2/P2 ratings for Commercial Paper
• Well-articulated capital deployment framework • Maintain $800MM - $1B in year-end cash to fund seasonal working capital • Invest $180MM - $200MM in capital expenditures annually • Return excess funds to shareholders through dividends and share repurchases
Background
TM
© 2012 Mattel, Inc. All Rights Reserved.

• Working capital intensive company with seasonal borrowing needs • Rely on commercial paper to bridge cash needs, which was problematic when the
CP market dried up in 2008 • Well-established shared service centers and centralized cash management further
alienates tangibility of cash for local finance teams • Emphasis on maintaining adequate liquidity but also returning excess cash to
shareholders
Challenges
Mattel’s Quarterly Cash Position
© 2012 Mattel, Inc. All Rights Reserved.

Results Initial Steps Taken to Improve Cash Forecasts
• Sensitized business units of the need for cash forecast accuracy, not “under promise/over deliver” approach
• Analyzed historical patterns in cash flows for receipts and payments, then solicited input from businesses to refine the outlook
• Isolated cash flow patterns that are largely consistent year over year and where prior year data can be used
Measurement of Results
• Cash forecast vs. actual variance conducted on a monthly and quarterly basis
• Introduced free cash flow as a part of the company-wide incentive structure
• Regular feedback and dialogue with subsidiaries to assist with accuracy of future forecasts
• Working with shared services center to create greater visibility to broad trends in cash flow
© 2012 Mattel, Inc. All Rights Reserved.

Discover Financial Services

Note: Balances as of May 31, 2012; volume based on the trailing four quarters ending 2Q12
• $47Bn in receivables • Leading cash rewards program • 1 in 4 U.S. households
• $28Bn direct-to-consumer deposits
• $10Bn personal loans and private student loans
Deposits and Other Lending
U.S. Card Issuing
• $149Bn volume • 4,300+ issuers
• $115Bn volume • 30+ issuers
• $29Bn volume
• 80+ licensees • 185+ countries /
territories
Direct Banking Payment Services

Challenges • In 2007 DFS was spun off from deep
pocketed parent changing funding dynamics dramatically
• During the financial crisis in 2008 & 2009 sources and uses of liquidity were scrutinized
• Certain funding markets, specifically ABS, became stressed which increased need for accurate forecasting
• Multiple forecasts were being generated, but difficult to discern “the truth” vs. other business estimates
• Changes in LOB and payment processing require forecast to be evolutionary, not static
Headquarters
90 Day Forecast
2 Week Forecast Centralized treasury aggregates forecast
input
Finance Business Unit
Business Unit
Business Unit
Product
Sub- Product
Sub-Product
Product
Sub- Product
Sub-Product
Product
Sub- Product
Sub-Product
Department level input provided to Treasury
Discover Cash Flow Forecasting Process

Results Initial Steps Taken to Improve Cash Forecasts • Process improvements to centralize cash management, control bank account opening and closing, have led to improved visibility and better optimization of cash • Created forecast narrative for regulators and internal constituents to describe details of process and benefits derived
Measurement of Results • Cash forecast is published weekly
and goes to the regulators • Metrics reinforce accuracy and
quantify business errors, a “look back” on what’s happened
• Ad hoc reviews conducted to understand errors and resolve them
• Continuous communication flow for results based feedback
• Back testing done for treasury only

Belden

Challenges Revised CFF Process
• Shift from a regional to a global forecast – centrally controlled and regionally executed
• Improved visibility and access to subsidiary’s excess cash for acquisition planning
• Tapped into internal liquidity, freed up cash and reduced external debt
• Improved the mobility of internal funding to subsidiaries
• Enabled dividend repatriation to occur on a more frequent and managed basis
Challenges Multiple regional processes
Inconsistent quality of forecast process and accuracy across the regions
Lack of visibility over excess cash to plan regular dividend repatriation process
Reduced ability to optimize strategic planning for acquisitions and estimate cost of funding

Results • Improvements in
quality of forecasts from all treasury centers
• Targets reduced from +/- 5% to $1mm per center
• Accuracy tracked in a weekly report for the coming 8 weeks, by geography, financial institution and currency CFF Entry – Hand-off to the next region
USA - HQ Excess funds dividend to HQ
EMEA Treasury Center Asia Treasury Center
GMT–6 GMT+8 GMT+1

Cindy Gerhard, Managing Director Citi Transaction Services Global Liquidity & Investments
Product Management
Chad Kibler Assistant Treasurer Belden
Kabir Bhatia Assistant Treasurer Mattel
Q & A
Jeffrey Clennon Director – Cash
Management & Funding Discover Financial Services

Citi believes that sustainability is good business practice. We work closely with our clients, peer financial institutions, NGOs and other partners to finance solutions to climate change, develop industry standards, reduce our own environmental footprint, and engage with stakeholders to advance shared learning and solutions. Highlights of Citi’s unique role in promoting sustainability include: (a) releasing in 2007 a Climate Change Position Statement, the first US financial institution to do so; (b) targeting $50 billion over 10 years to address global climate change: includes significant increases in investment and financing of renewable energy, clean technology, and other carbon-emission reduction activities; (c) committing to an absolute reduction in GHG emissions of all Citi owned and leased properties around the world by 10% by 2011; (d) purchasing more than 234,000 MWh of carbon neutral power for our operations over the last three years; (e) establishing in 2008 the Carbon Principles; a framework for banks and their U.S. power clients to evaluate and address carbon risks in the financing of electric power projects; (f) producing equity research related to climate issues that helps to inform investors on risks and opportunities associated with the issue; and (g) engaging with a broad range of stakeholders on the issue of climate change to help advance understanding and solutions.
Citi works with its clients in greenhouse gas intensive industries to evaluate emerging risks from climate change and, where appropriate, to mitigate those risks.
© 2012 Citibank, N.A. All rights reserved. Citi and Citi and Arc Design are trademarks and service marks of Citigroup Inc. or its affiliates and are used and registered throughout the world.
IRS Circular 230 Disclosure: Citigroup Inc. and its affiliates do not provide tax or legal advice. Any discussion of tax matters in these materials (i) is not intended or written to be used, and cannot be used or relied upon, by you for the purpose of avoiding any tax penalties and (ii) may have been written in connection with the "promotion or marketing" of any transaction contemplated hereby ("Transaction"). Accordingly, you should seek advice based on your particular circumstances from an independent tax advisor.Any terms set forth herein are intended for discussion purposes only and are subject to the final terms as set forth in separate definitive written agreements. This presentation is not a commitment to lend, syndicate a financing, underwrite or purchase securities, or commit capital nor does it obligate us to enter into such a commitment, nor are we acting as a fiduciary to you. By accepting this presentation, subject to applicable law or regulation, you agree to keep confidential the information contained herein and the existence of and proposed terms for any Transaction.Prior to entering into any Transaction, you should determine, without reliance upon us or our affiliates, the economic risks and merits (and independently determine that you are able to assume these risks) as well as the legal, tax and accounting characterizations and consequences of any such Transaction. In this regard, by accepting this presentation, you acknowledge that (a) we are not in the business of providing (and you are not relying on us for) legal, tax or accounting advice, (b) there may be legal, tax or accounting risks associated with any Transaction, (c) you should receive (and rely on) separate and qualified legal, tax and accounting advice and (d) you should apprise senior management in your organization as to such legal, tax and accounting advice (and any risks associated with any Transaction) and our disclaimer as to these matters. By acceptance of these materials, you and we hereby agree that from the commencement of discussions with respect to any Transaction, and notwithstanding any other provision in this presentation, we hereby confirm that no participant in any Transaction shall be limited from disclosing the U.S. tax treatment or U.S. tax structure of such Transaction. We are required to obtain, verify and record certain information that identifies each entity that enters into a formal business relationship with us. We will ask for your complete name, street address, and taxpayer ID number. We may also request corporate formation documents, or other forms of identification, to verify information provided.Any prices or levels contained herein are preliminary and indicative only and do not represent bids or offers. These indications are provided solely for your information and consideration, are subject to change at any time without notice and are not intended as a solicitation with respect to the purchase or sale of any instrument. The information contained in this presentation may include results of analyses from a quantitative model which represent potential future events that may or may not be realized, and is not a complete analysis of every material fact representing any product. Any estimates included herein constitute our judgment as of the date hereof and are subject to change without any notice. We and/or our affiliates may make a market in these instruments for our customers and for our own account. Accordingly, we may have a position in any such instrument at any time.Although this material may contain publicly available information about Citi corporate bond research, fixed income strategy or economic and market analysis, Citi policy (i) prohibits employees from offering, directly or indirectly, a favorable or negative research opinion or offering to change an opinion as consideration or inducement for the receipt of business or for compensation; and (ii) prohibits analysts from being compensated for specific recommendations or views contained in research reports. So as to reduce the potential for conflicts of interest, as well as to reduce any appearance of conflicts of interest, Citi has enacted policies and procedures designed to limit communications between its investment banking and research personnel to specifically prescribed circumstances.

Transaction Services
In fact, two thirds of respondents to the most recent AFP Liquidity Management Survey cited improving cash forecasting as one of their top priorities for cash and liquidity management.
There is no silver bullet to improving cash forecasts. However, certain actions can be taken, and others should be avoided, to get a clearer, more reliable picture of cash flow dynamics across the organization.
1. Do establish a defined process with clearly defined owners, and get buy-in.Get the right level of cooperation and make clear the organizational benefits of forecasting. Take the time to educate stakeholders and provide them with feedback on the results of their cash flow forecasts.
2. Don’t let everyone define their own source of information for the forecast. Know the sources of information and clarify how data is to be constructed so that you can further assess the quality of enterprise-wide, consolidated forecasts.
3. Don’t waste time perfecting templates.As silly as it sounds, putting together useful forecasting reports often gets mired down in aesthetics, such as which items to physically highlight or put in bold type. While reports must be easy to use and read, the real
focus must be on getting the content right, including line items, categories and time horizons, for example, and providing reliable information.
4. Do initiate projects that will simplify the cash flow forecasting process. Initiatives such as streamlining bank accounts and relationships yield economies of scale and also speed up data collection and cash forecasting processes.
5. Don’t ask the business units to prepare the full forecast for their entity. Break down your forecasts on a line item basis and identify the best source of content for each. For example, businesses will excel at providing revenue drivers, local trends and direct expenses. But procurement may be a better source for the timing of payments to be released under contractual obligations.
6. Don’t be satisfied with a top-down approach. Although it is more time-consuming, getting input on business trends and market activity at the local level to build bottom-up forecasts yields better results. Delve into activities at the business level to understand what is causing or will cause changes in them and combine top-down and bottom-up approaches to forecasting.
by Cindy GerhardGlobal Product Management Head of Liquidity & Investments, Citi
Best practices in liquidity management:Ten cash flow forecasting do’s and don’ts
As every treasurer knows, no discussion about liquidity management is complete without addressing cash flow forecasting. Today, as markets continue to gyrate, liquidity management and risk assessment remain both top of mind and part of business contingency planning, for treasurers and corporate boards alike.

7. Do automate. Technology is your friend. Put the right processes and systems in place to aggregate and report data enterprise-wide. Companies often have difficulty getting a real-time view of their cash positions and perform cash flow analytics without a global enterprise resource planning system or treasury management system. However, online treasury portals such as Citi’s TreasuryVision™ provide multibank data aggregation and reporting plus forecasting and analytic tools. TreasuryVision can be used as a standalone solution or as a complement to existing ERP and TMS platforms, making it easy to jump-start cash visibility initiatives while waiting for a large-scale single-backbone solution to come online.
8. Do benchmark. Learn from peers that have gone through similar experiences. Take advantage of benchmarking studies and tap information available through practitioner groups.
9. Do perform stress testing and scenario analyses. Move beyond developing a picture of cash access under normal conditions and develop “what if” challenges to analyze the impact of events and disruptions on your company’s cash position.
10. Never be entirely happy with your forecasts or processes. Build in continuous improvement. Constantly search for ways to improve the quality of data and to reduce variances.
Bottom line, treasurers equipped with reliable data, and sound insights, policies and technology, are in the best position to understand, manage and measure their company’s cash position and mitigate related risks.
Citi Treasury Diagnostics Research shows that CFF remains an area of focus, but companies still have room to improve — 80% still use manual inputs; more than 60% of participants have had to reverse or repair earlier cash positioning activity due to cash forecasting uncertainties.
Citi Transaction Servicestransactionservices.citi.com
© 2012 Citibank, N.A. All rights reserved. Citi and Arc Design is a registered service mark of Citigroup Inc.996711 8/12