bon secours health system, inc - dac
TRANSCRIPT

BON SECOURS HEALTH SYSTEM, INC.
Financial Disclosure As of and for the Fiscal Year Ended August 31, 2010
PLEASE NOTE THAT THIS DOCUMENT INCLUDES MANAGEMENT’S DISCUSSION AND ANALYSIS, AS WELL AS AUDITED FINANCIAL STATEMENTS
AUDITED FINANCIAL STATEMENTS ARE ALSO POSTED AS SEPARATE DOCUMENTS
For past quarterly and annual disclosures please visit www.dacbond.comDirect questions regarding disclosure information to [email protected]
1

This page intentionally left blank
2

Table of Contents
Tab 1 Overview ♦ The System ♦ Financial Highlights ♦ Recent System Developments ♦ Subsequent Events
Tab 2 Operating Results
♦ System Results by Market ♦ Sources of Net Patient Service Revenue ♦ Selected Summary Utilization Information ♦ Management’s Discussion of Results of Operations ♦ Factors Affecting Results of Operations
Tab 3 Balance Sheet and Capital Structure
♦ System Bonds ♦ Series 2010 Financing ♦ Letters of Credit and Liquidity Enhancements ♦ Covenants Regarding Long-Term Indebtedness ♦ Liquidity of BSHSI and Subsidiaries ♦ Interest Rate Risk Management ♦ Capital Market Uncertainties ♦ Investments
Tab 4 Insurance and Pension Plans
♦ Insurance ♦ Pension Plans
Tab 5 Organization
♦ Health Care Providers ♦ Shared Sponsorship Arrangements ♦ Joint Ventures ♦ Board of Directors ♦ Executive Officers
• Employees
Appendix ♦ Audited Financial Statements
3

Tab 1 Overview
♦ The System ♦ Financial Highlights ♦ Recent System Developments ♦ Subsequent Events
4

BON SECOURS HEALTH SYSTEM, INC. Financial Disclosure
Fiscal Year Ended August 31, 2010
The System
The information presented in this Financial Disclosure describes Bon Secours Health System, Inc., a Maryland nonprofit, nonstock membership corporation (referred to as BSHSI), and its affiliates, including Members of the Obligated Group. BSHSI and its affiliates are described collectively in this Financial Disclosure as the System.
Bon Secours, Inc., a Maryland nonprofit, nonstock membership corporation (referred to as BSI) is the sole
corporate member of BSHSI, but has no health care operations. The System was organized in June 1983 to fulfill the health care mission of the United States Province of the Congregation of Sisters of Bon Secours of Paris (referred to as the Sisters of Bon Secours), a congregation of religious women of the Roman Catholic Church founded in France in 1824.
The Sisters of Bon Secours have ministered to the health care needs of people in the United States since
1881. To ensure the sustainability of the ministry into the future as well as to broaden their collaboration with the laity in areas of influence, the Sisters of Bon Secours petitioned the Vatican to establish Bon Secours Ministries, an entity comprised of both lay persons and Sisters of Bon Secours to oversee the Catholic ministry of BSHSI. Bon Secours Ministries, which is referred to as a “public juridic person” in the Catholic Church’s Code of Canon Law, was established by the Vatican on May 31, 2006 with the specific responsibility to oversee (and, as appropriate, initiate) the health care ministries within the System and, in particular, BSHSI’s Catholic identity and mission. This formal relationship with the Catholic Church and the specific ministry is commonly referred to as “sponsorship.” The Sisters of Bon Secours formally transferred the responsibility of sponsorship of the System to Bon Secours Ministries on November 1, 2006. Since then, Bon Secours Ministries has provided an active presence of leadership and direction for BSHSI to ensure its operations and use of resources are aligned with the mission, values and fundamentals of Catholic social teaching. The ministry of BSHSI aids those in need, particularly those who are sick and dying, by offering a wide variety of services, including acute inpatient, outpatient, pastoral, palliative, home health, nursing home, rehabilitative, primary and secondary care and assisted living, in Florida, Kentucky, Maryland, New York, Pennsylvania, South Carolina and Virginia without regard to race, religion, color, gender, age, marital status, national origin, sexual orientation or disability.
The table included under the caption “Health Care Providers” under Tab 5 lists the entities within the System that own and operate acute, skilled, long-term or assisted living facilities, the names of their principal facilities (which appear in italics), a general description of the function of those facilities and their locations. These entities are referred to in this Financial Disclosure as the Health Care Providers. Except as identified in that table and as described under “Joint Ventures” under Tab 5, BSHSI, either directly or indirectly, is the sole member or shareholder of each System affiliate, and as a consequence of that membership or shareholder status, controls all System affiliates. BSHSI provides management and administrative services to all such controlled System affiliates, and in some cases provides discrete administrative services to joint ventures in which BSHSI or an affiliate participates.
Financial Highlights
Operating results for the fiscal year ended August 31, 2010 improved over the prior fiscal year ended August 31, 2009. Operating income of $101.7 million represented a 3.3% operating margin, compared to the $77.7 million of operating income and a 2.7% operating margin for the prior fiscal year. Overall, the System reported excess of revenues over expenses of $12.8 million during the fiscal year ended August 31, 2010 as compared to a deficit of revenues over expenses of $124.5 million for the prior fiscal year.
Operational improvements and volume growth achieved in fiscal year 2009 continued to contribute positively to financial performance during fiscal year 2010. Operating performance improved year to year in
5

Baltimore, Richmond, Hampton Roads, Greenville, Kentucky, St. Petersburg and at the joint ventures in Pennsylvania and South Carolina. In addition, for the fiscal year ended August 31, 2010, operating income included $1.8 million of investment gains from BSHSI’s 27% minority share in joint ventures, as compared to investment losses of $5.2 million for the prior fiscal year.
Investment markets also contributed positively to performance during the fiscal year ended August 31, 2010, with nonoperating realized and unrealized investment losses of $42.0 million compared to $104.2 million of nonoperating realized and unrealized investment losses during the fiscal year ended August 31, 2009. In addition, unrealized losses and payments related to the System’s derivatives were $83.2 million for 2010, as compared to unrealized losses of $57.9 million for 2009.
Days cash on hand at August 31, 2010 of 110.5 represented an increase from days cash on hand at August 31, 2009 of 102.8. Operations and investment gains and the impact of working capital changes generated approximately $225.4 million and $29.0 million, respectively, during the fiscal year ended August 31, 2010. However, capital expenditures and scheduled debt and swap payments reduced cash by approximately $97.7 million, and $49.4 million, respectively, during the year. The cumulative effective of these changes resulted in the increase of 7.7 days cash on hand period to period.
Recent System Developments
Clinical Transformation
As a prophetic Catholic health ministry, the System partners with its communities to create a more humane world, build health and social justice for all, and provide exceptional value for those it serves. This prophetic vision has been in place for many years and is consistent with, yet pre-dates, the more recent and public dialogue of health care reform. The System’s sponsors and boards of directors have embraced this vision and with management developed and for the past four years have implemented, and are continuing to implement, a strategic quality plan focusing on an extraordinary individual experience of care that includes improving quality and safety through Clinical Transformation. This term embraces the development of clinical leadership and workforce, alignment of the System with premier practitioners, implementation of an electronic heath records system and use of system-wide resources and talent to redesign how care is delivered to improve clinical outcomes and patient satisfaction and reduce costs. Management believes that Clinical Transformation has positioned the System to better adapt to changes resulting from health care reform and flourish in the current health care environment.
Clinical Transformation is intended to measurably improve the quality of patient care, create holistic,
patient-centered care experiences, and reduce healthcare costs by reducing waste and optimizing value. Management plans to achieve Clinical Transformation through the alignment of people, process and technology in a manner that enables rapid tests of innovation that lead to creative, effective patient care solutions. BSHSI is dedicated to improving patient outcomes by implementing evidence-based best practices and limiting unwanted variations in care while improving patient engagement and demonstrating financial improvement. Since June 2008, BSHSI’s Clinical Transformation collaborative team, which is comprised of Vice Presidents of Medical Affairs, Chief Nurse Executives and Chief Financial Officers within the System, has met regularly in an effort to identify, develop and implement improvements in patient care and engagement and financial performance. The collaborative team has developed “learning communities” and established clinical leadership roles and accountability.
Management believes that mortality and readmission rates, complications and average length of stay have
declined as a result of the System’s Clinical Transformation initiatives. In addition, over the past three years, the learning communities and local teams have achieved over $65 million in cumulative cost savings, including $38.4 million in savings during the fiscal year ended August 31, 2010, as a direct result of these initiatives. Much of these cost savings are the result of focused efforts to expedite care and reduce variable costs in many of its primary service lines, including cardiac surgery and cardiology, general surgery and orthopedics. In addition, System-wide initiatives stemming from the learning communities have reduced and continue to reduce costs associated with hospital-acquired infections and sepsis, blood utilization, antibiotic stewardship and pharmacy interventions, and have reduced the length of stay.
6
ConnectCare Electronic Health Records System
The System’s comprehensive electronic health records system, an EPIC product referred to as ConnectCare, is in various stages of implementation in both inpatient and ambulatory care settings in three BSHSI markets. In June 2009, St. Francis Hospital – Downtown and St. Francis – Eastside, each located in Greenville, South Carolina, fully implemented the acute care electronic health record and computerized order entry in all departments. The System is realizing the benefits of its implementation of the ConnectCare system in South Carolina. During the period in which ConnectCare has been operational in the System’s South Carolina hospitals, mortality rates and complications have decreased, the case mix index has increased and both the average length of stay of admitted patients and average treatment time for emergency room patients have declined.
In April 2010, Richmond Community Hospital, located in Richmond, Virginia, and Memorial Regional
Medical Center, located in Hanover County, Virginia, fully implemented the acute care electronic health record and computerized order entry in all departments, in addition to an integrated EPIC acute billing system. The System has also successfully implemented the ConnectCare system in approximately thirty-five ambulatory practices in Virginia.
The integration of finance, operations and clinical workflows resulting from the implementation of the
ConnectCare system is improving patient documentation, expediting patient treatment and enhancing revenue capture and is beginning to facilitate improvements in key clinical quality indicators and reductions in costs per case. In addition, since January 2010, over 5,100 patients have gained access to ConnectCare’s patient portal, which allows for better access to patient medical records and enhanced interaction with physicians.
Over the next three years, the System intends to roll out the ConnectCare system in its remaining markets.
The continued rollout is expected to benefit from the knowledge acquired in the Greenville and Richmond implementations. When complete, the System will operate patient, acute and ambulatory electronic health records, computerized order entry, integrated billing and patient accessible records in a consistent format and content structure at all locations. Operating results have and will continue to be impacted by the resources and commitment to this implementation, including through the incurrence of costs associated with staffing and purchased services as well as the associated capital commitment. The System has allocated and intends to continue to allocate a substantial portion of its budgeted capital expenditures to implement the ConnectCare system and expects to continue to utilize ongoing operational support to optimize the use of the system.
Physician Integration
A key element of the System’s Clinical Transformation initiative is the alignment of the interests of physicians with those of the System as a whole. The System considers physician integration with employed, contracted and independent physicians critical to advancing Clinical Transformation.
At August 31, 2010, in addition to independent, affiliate medical groups on staff, the System employed 441
physicians and mid-level full-time equivalents, of which approximately 213 were primary care physicians and 228 were specialty care physicians. This number represents an 18% increase from the number of physicians and mid-level full-time equivalents employed by the System at August 31, 2009. Management expects the number of the System’s employed physicians and mid-level full-time equivalents to continue to increase as the System seeks to grow and gain market share in the key markets in which it operates and advance its quality and Clinical Transformation initiatives.
The primary relationship between a hospital and physicians who practice in it is through the hospital’s
organized medical staff. The relationships vary from independent physician associations to contracted and employed physicians. The success of the System is partially dependent on its ability to attract physicians to participate in its networks as well as the ability of the physicians to perform their obligations and deliver high quality patient care in a cost-effective manner. The System seeks to align the interests of physicians with those of the System as a whole through employment, contractual relationships, joint ventures and other similar partnerships. Management believes this strategy will help position the System as a market leader and will allow it to better respond to future health care changes and that hospitals with a high degree of physician integration are better able to drive evidence-based improvements in quality of care, reduce costs and enhance an organization’s financial
7

viability. The System also embraces those physicians wanting to remain independent and affords them opportunities to collaborate in Clinical Transformation by leveraging technology, providing education, providing access to patient medical information and engaging them in defining and implementing evidence-based medical care to improve patient outcomes and satisfaction.
Enterprise Risk Management
As part of the System’s strategic quality plan, the BSHSI Board of Directors and management have adopted Enterprise Risk Management (referred to as ERM) methodologies to further refine the identification and management of critical risks to the System. These efforts have proven beneficial in aligning board and management attention to those critical risks that have the greatest effect on the mission and ministry of the System. Core to this effort is providing ongoing risk assessments to help assure key controls and activities are effective in properly mitigating these risks. This process includes an assessment of controls by the board, executive management and key staff functions including finance, legal, internal audit and compliance. The multitude of risks inherent within non-profit healthcare extends to all parts of the System. The System continues to implement and monitor ERM activities at both the board and management level to help manage and support the mission interests of the System.
Reconfiguration of Certain Health Care Facilities
Certain System affiliates have received or are seeking regulatory approval with respect to the expansion or reconfiguration of certain health care services provided by such affiliates. In addition to the proposed joint venture with Sentara Healthcare (referred to as Sentara) relating to the development of a 154-bed general acute care hospital to be located at Sentara’s Princess Anne campus in Virginia Beach, Virginia (as described under “Joint Ventures – Proposed Sentara Joint Venture” under Tab 5), the System has received regulatory approval to replace the existing DePaul Medical Center with a new 124-bed facility and to add 54 beds to St. Francis Medical Center. The System is also seeking approval to add a limited amount of new bed capacity to certain of its Virginia facilities. None of the foregoing additions or expansions has been approved by either the Board of Directors of BSHSI or the Board of Directors of BSI. There can be no assurance that any requested regulatory approval will be obtained or that any of the proposed projects will ultimately be approved by the Boards of Directors. In the event any of the projects proceed, the System expects to explore various alternatives for financing each project, which may include the issuance of new debt.
On October 20, 2010, BSHSI’s Board of Directors approved the execution by eight System affiliates
located in Richmond and Hampton Roads, Virginia of a definitive agreement to sell such affiliates’ outreach clinical reference laboratory services to a third party. These outreach clinical reference laboratory services contributed less than 1.0% of the System’s total revenue during the fiscal year ended August 31, 2010 and the assets to be sold constituted less than 0.1% of the System’s net assets at August 31, 2010.
Subsequent Events
In accordance with the provisions of ASC 855 “Subsequent Events,” management evaluated events and transactions that occurred after August 31, 2010 and through November 11, 2010, the date of issuance of the audited financial statements. The System did not have any material recognizable subsequent events during this period, other than the transactions previously disclosed in the accompanying footnotes or as described in this Financial Disclosure.
8

Tab 2 Operating Results ♦ System Results by Market ♦ Sources of Net Patient Service Revenue ♦ Selected Summary Utilization Information ♦ Management’s Discussion of Results of Operations ♦ Factors Affecting Results of Operations
9

System Results by Market
The following chart sets forth the consolidated total revenue and operating income for the System by market for the fiscal years ended August 31, 2010 and 2009:
MarketTotal revenues
(000s) %
Income (loss) from continuing operations (000s) %
Fiscal Year Ended August 31, 2010
Richmond, Virginia(a) $1,064,263 34.5 $68,812 67.7
Hampton Roads, Virginia(b) 641,504 20.8 25,193 24.8Greenville, South Carolina 532,552 17.3 19,715 19.4
Charity New York(c) 431,894 14.0 (11,371) (11.2)Russell, Kentucky 168,575 5.5 2,470 2.4 Baltimore, Maryland 138,788 4.5 412 0.4
Bronx, New York(d) 55,041 1.8 (1,150) (1.1)St. Petersburg, Florida 28,159 0.9 432 0.4
3,060,776 99.2 104,513 102.8
Other(e) 24,098 0.8 (2,828) (2.8)Total System $3,084,874 100% $101,686 100%
Fiscal Year Ended August 31, 2009
Richmond, Virginia(a) $1,004,959 34.7 $63,352 81.5Hampton Roads, Virginia(b) 575,308 19.9 22,661 29.2Greenville, South Carolina 484,735 16.7 17,623 22.7
Charity New York(c) 439,276 15.2 (443) (0.6)Russell, Kentucky 168,629 5.8 2,124 2.7 Baltimore, Maryland 129,608 4.5 (9,092) (11.7)
Bronx, New York(d) 59,414 2.1 1,402 1.8St. Petersburg, Florida 28,370 1.0 243 0.3
2,890,301 99.8 97,870 126.0
Other(e) 4,926 0.2 (20,177) (26.0)Total System $2,895,227 100% $77,693 100%
(e) Includes System-level earnings (losses) in affiliates for certain joint ventures, shared services costs managedfor the System by the health system office, as well as investment earnings (losses) on certain trust funds, such asmedical malpractice and health benefit trusts.
(a) Includes St. Mary’s Hospital, Richmond Community Hospital, Memorial Regional Medical Center and St.Francis Medical Center.(b) Includes Maryview Medical Center, Province Place of Maryview, Province Place of DePaul, MaryImmaculate Hospital, St. Francis Nursing Care Center, DePaul Medical Center and Maryview Nursing Care (c) Includes Good Samaritan Hospital, St. Anthony Community Hospital, Bon Secours Community Hospital,Schervier Pavilion and Mount Alverno Center.(d) Includes Schervier Nursing Care Center.
10
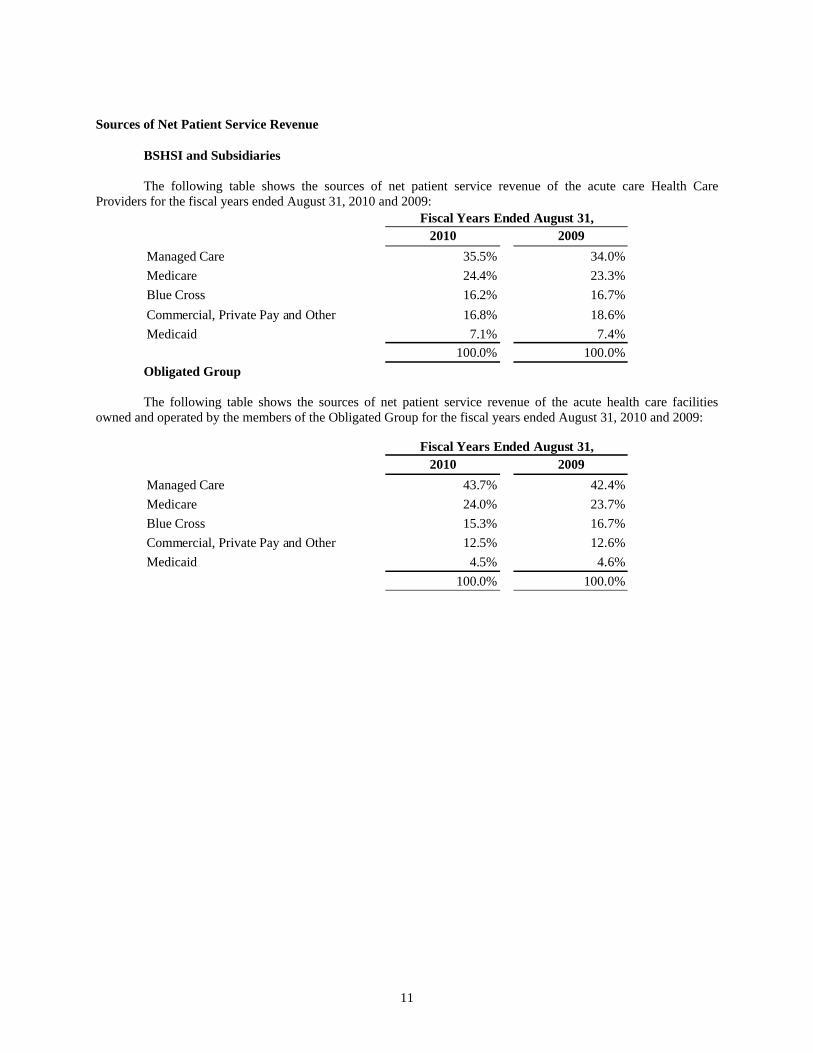
Sources of Net Patient Service Revenue
BSHSI and Subsidiaries The following table shows the sources of net patient service revenue of the acute care Health Care
Providers for the fiscal years ended August 31, 2010 and 2009:
2010 2009Managed Care 35.5% 34.0%Medicare 24.4% 23.3%Blue Cross 16.2% 16.7%Commercial, Private Pay and Other 16.8% 18.6%Medicaid 7.1% 7.4%
100.0% 100.0%
Fiscal Years Ended August 31,
Obligated Group The following table shows the sources of net patient service revenue of the acute health care facilities
owned and operated by the members of the Obligated Group for the fiscal years ended August 31, 2010 and 2009:
2010 2009Managed Care 43.7% 42.4%Medicare 24.0% 23.7%Blue Cross 15.3% 16.7%Commercial, Private Pay and Other 12.5% 12.6%Medicaid 4.5% 4.6%
100.0% 100.0%
Fiscal Years Ended August 31,
11

Selected Summary Utilization Information
BSHSI and Subsidiaries The following table presents selected combined utilization statistics for the health care facilities owned and
operated by the Health Care Providers for the fiscal years ended August 31, 2010 and 2009:
2010 2009Acute/Skilled Care Facilities:Beds in operation * 2,596 2,650 Discharges 132,246 132,033 Patient days 605,115 621,045 Average length of stay (days) 4.6 4.7 Staffed bed occupancy 63.9% 64.2%Outpatient visits 1,169,663 1,172,999 Emergency room visits 569,135 552,579
Long-Term Care Facilities:Beds in operation * 995 995Patient days 326,131 339,146 Occupancy 89.8% 93.4%
Fiscal Year Ended August 31,
* At end of period Obligated Group The following table presents selected combined utilization statistics for the healthcare facilities owned and
operated by the Members of the Obligated Group for the fiscal years ended August 31, 2010 and 2009:
2010 2009Acute/Skilled Care Facilities:Beds in operation * 2,054 2,089 Discharges 110,264 109,694 Patient days 480,281 486,012 Average length of stay (days) 4.4 4.4 Staffed bed occupancy 64.1% 63.7%Outpatient visits 944,392 940,910 Emergency room visits 497,009 479,476
Long-Term Care Facilities:Beds in operation * 394 394Patient days 124,154 134,240 Occupancy 86.3% 93.3%
* At end of period
Fiscal Year Ended August 31,
12

Management’s Discussion of Results of Operations
The following comparative charts provide information related to changes in certain line items for the System for the fiscal years ended August 31, 2010 and August 31, 2009. An analysis of the causes for significant variances with respect to certain of the line items between the periods follows these charts.
The discussion of the System’s results of operations that follows should be read in conjunction with the information contained in the Appendix.
(Dollars in thousands) August 31, 2010
August 31, 2009 Variance Variance % August 31,
2010
As a % of Total
System
Net patient service revenue 2,993,910$ 2,827,545$ $ 166,365 5.9% 2,326,350$ 77.7%Other revenue 90,964 67,682 23,282 34.4% 103,716 114.0%Salaries, wages and benefits 1,430,410 1,347,585 82,825 6.1% 993,008 69.4%Supplies 498,997 466,771 32,226 6.9% 415,056 83.2%Purchased services and other 683,072 631,934 51,138 8.1% 568,470 83.2%Provision for bad debts 212,478 200,141 12,337 6.2% 182,790 86.0%Depreciation and amortization 123,292 122,711 581 0.5% 100,356 81.4%Interest 34,939 48,392 (13,453) -27.8% 23,081 66.1%Operating income from continuing operations 101,686 77,693 23,993 30.9% 147,308 144.9%Nonoperating investment losses, net (41,210) (162,145) 120,935 74.6% (42,176) 102.3%Other nonoperating activities, net (30,644) (40,056) 9,412 23.5% (24,013) 78.4%
Excess (deficit) of continuing revenues over expenses before minority interest 29,832 (124,508) 154,340 124.0% 81,119 271.9%Minority interest of consolidated subsidiaries (20,445) (2,427) (18,018) -742.5% (14,154) 69.2%Gain on discontinued operations, net 3,421 2,441 980 40.1% 3,421 100.0%Excess (deficit) of revenues over expenses 12,808 (124,494) 137,302 110.3% 70,386 549.6%Other changes in unrestricted net assets, net (54,176) (167,369) 113,193 67.6% (58,604) 108.2%Increase (decrease) in unrestricted net assets (41,368)$ (291,863)$ $ 250,495 85.8% 11,782$ N/A
BSHSI and Subsidiaries Obligated Group
(Dollars in thousands) As of
August 31, 2010 As of
August 31, 2009 Variance Variance % As of
August 31, 2010 As a % of
Total System
Days in accounts receivable, net 42.46 42.47 (0.01) 0.0% 42.13 99.2%Property, plant and equipment, net 1,077,741$ 1,101,713$ $ (23,972) -2.2% 874,588$ 81.2%Current ratio 1.5 1.4 0.1 7.4% 2.1 141.7%Cash and cash equivalents 180,255$ 129,048$ $ 51,207 39.7% 332,045$ 184.2%Unrestricted board-designated funds 685,652$ 629,648$ $ 56,003 8.9% 653,250$ 95.3%Other investments limited as to use and restricted 167,223$ 160,080$ $ 7,143 4.5% 71,984$ 43.0%Total long term debt 1,059,614$ 1,086,351$ $ (26,737) -2.5% 1,012,273$ 95.5%
BSHSI and Subsidiaries Obligated Group
Net Patient Service Revenue for the fiscal year ended August 31, 2010 increased 5.9% from the prior fiscal year. Volumes as measured by acute and non-acute discharges increased by 0.3%, and patient acuity increased by 1.3% period to period. Physician affiliation strategies and volume strategies in the emergency departments contributed positively to maintaining volumes during the economic downturn. The System’s employed physician network grew to 441 physicians and mid-level full-time equivalents at August 31, 2010. Emergency room visits grew 3.0% during the fiscal year ended August 31, 2010 from the prior fiscal year as throughput was better managed. Inpatient growth was most prevalent in neurosurgery and orthopedic services. Rates, outpatient volumes and service mix increases, offset by an 11.5% increase in charity care, accounted for the remaining increase in net patient service revenue. The increase in charity care during the fiscal year ended August 31, 2010 was partly due to
13

the economic downturn and higher unemployment in the various markets in which the System operates but also due to better identification of charity patients, rather than bad debt. As a percentage of gross patient revenue, charity care, bad debt and customer service adjustments were 8.4% for the fiscal year ended August 31, 2010 compared to 8.0% for the prior fiscal year.
Other Revenue increased to $91.0 million for the fiscal year ended August 31, 2010 compared to $67.7 million for the prior fiscal year. Other revenue primarily consists of BSHSI’s minority share interest in joint venture earnings (discussed in more detail under “Joint Ventures” under Tab 5), and membership rebates from participation in group purchasing organizations and grant revenue. Other revenue also includes investment gains and losses from various trust funds restricted for specific purposes, including trust funds maintained for the payment of malpractice claims, health claims, and workers’ compensation claims. The increase in other revenue between the two periods was primarily attributable to a $12.9 million increase in the investment returns of the System’s self-funded insurance programs, a $5.8 million net increase in the earnings of Roper St. Francis Healthcare and a $5.0 million state grant received by Bon Secours Hospital Baltimore in fiscal year 2010.
Salaries, Wages and Benefits expense increased $82.8 million, or 6.1%, during the fiscal year ended August 31, 2010 from the prior fiscal year. A primary driver of the increase related to an expansion of the System’s employed physician network. To fully integrate the delivery of care across a continuum and to be well positioned for health care reform legislation, the System focused on acquiring physician practices. As of August 31, 2010, the System employed 213 primary care physicians and 228 specialty care physicians (including mid-levels), which resulted in a $47.3 million increase in salaries, wages and benefits expenses compared to the prior fiscal year period. Aside from the physician practice growth, the System managed personnel growth to be nearly flat between periods. Pension expense increased $11.9 million as a result of lower discount rates for 2010. Normal inflationary increases accounted for the remainder of the growth. Salaries, wages and benefits expense as a percentage of net patient service revenue increased to 47.8% for the fiscal year ended August, 2010 from 47.7% for the prior fiscal year.
Supplies expense increased $32.2 million, or 6.9%, to $499.0 million during the fiscal year ended August 31, 2010 from the prior fiscal year. Higher volumes in implant-dependent procedures such as cardiac, neurosurgery and orthopedic services accounted for $23.1 million of the increased expense but also corresponded to increased revenue and intensity. Minor equipment purchases increased $3.9 million as equipment and computer accessories were refreshed. The remaining increase occurred in various areas, including medical/surgery supplies and drugs. Supplies expense as a percentage of net patient service revenue increased to 16.7% for the fiscal year ended August 31, 2010 from 16.5% for the prior fiscal year.
Purchased Services and Other expense increased $51.1 million, or 8.1%, to $683.1 million for the fiscal year ended August 31, 2010 from the prior fiscal year. Purchased maintenance costs, including information technology maintenance contracts, increased $8.3 million and physician fees increased $6.6 million between the two periods. Rent increased $9.9 million as the physician network was expanded. Increases in professional and general liability insurance, utilities and various other purchased services accounted for the remaining variance. Purchased services and other expense as a percentage of net patient service revenue increased to 22.8% for the fiscal year ended August 31, 2010 from 22.3% for the prior fiscal year.
Provision for Bad Debts increased $12.3 million, or 6.2%, for the fiscal year ended August 31, 2010 from the prior fiscal year. Bad debt expense decreased as the System improved collections and early identification of charity care patients, as noted above under “Net Patient Service Revenue”.
Depreciation and Amortization expense increased $0.6 million, or 0.5%, for the fiscal year ended August 31, 2010 from the prior fiscal year due to normal property and equipment capitalizations and the ConnectCare projects becoming operational in Greenville, South Carolina being operational for the entire fiscal year.
Interest expense declined by $13.5 million, or 27.8%, for the fiscal year ended August 31, 2010 from the prior fiscal year due to lower variable interest rates.
Operating Income from Continuing Operations increased by $24.0 million to $101.7 million for the fiscal year ended August 31, 2010 from $77.7 million for the prior fiscal year. The 6.6% increase in net revenue from rates, volume and acuity was supported by the expanded physician network and focused volume strategies for the emergency room, neurosurgery and orthopedics. Expenses increased 5.9% period to period. While the System
14
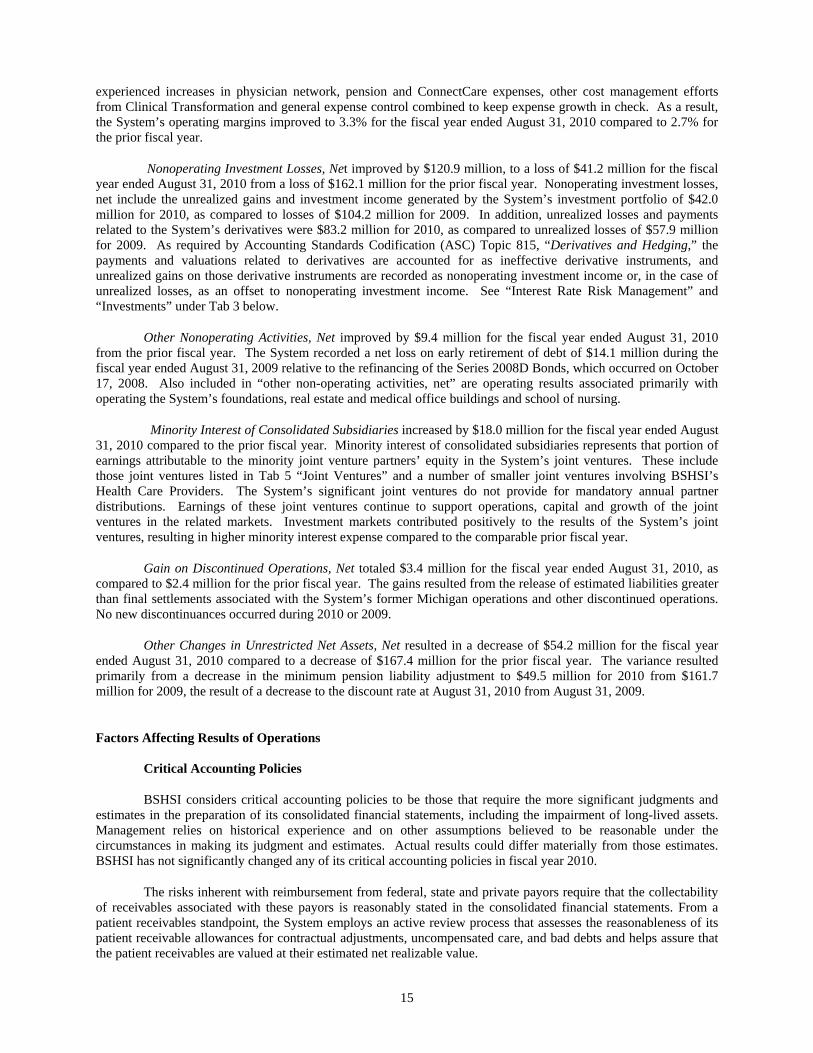
experienced increases in physician network, pension and ConnectCare expenses, other cost management efforts from Clinical Transformation and general expense control combined to keep expense growth in check. As a result, the System’s operating margins improved to 3.3% for the fiscal year ended August 31, 2010 compared to 2.7% for the prior fiscal year.
Nonoperating Investment Losses, Net improved by $120.9 million, to a loss of $41.2 million for the fiscal year ended August 31, 2010 from a loss of $162.1 million for the prior fiscal year. Nonoperating investment losses, net include the unrealized gains and investment income generated by the System’s investment portfolio of $42.0 million for 2010, as compared to losses of $104.2 million for 2009. In addition, unrealized losses and payments related to the System’s derivatives were $83.2 million for 2010, as compared to unrealized losses of $57.9 million for 2009. As required by Accounting Standards Codification (ASC) Topic 815, “Derivatives and Hedging,” the payments and valuations related to derivatives are accounted for as ineffective derivative instruments, and unrealized gains on those derivative instruments are recorded as nonoperating investment income or, in the case of unrealized losses, as an offset to nonoperating investment income. See “Interest Rate Risk Management” and “Investments” under Tab 3 below.
Other Nonoperating Activities, Net improved by $9.4 million for the fiscal year ended August 31, 2010 from the prior fiscal year. The System recorded a net loss on early retirement of debt of $14.1 million during the fiscal year ended August 31, 2009 relative to the refinancing of the Series 2008D Bonds, which occurred on October 17, 2008. Also included in “other non-operating activities, net” are operating results associated primarily with operating the System’s foundations, real estate and medical office buildings and school of nursing.
Minority Interest of Consolidated Subsidiaries increased by $18.0 million for the fiscal year ended August 31, 2010 compared to the prior fiscal year. Minority interest of consolidated subsidiaries represents that portion of earnings attributable to the minority joint venture partners’ equity in the System’s joint ventures. These include those joint ventures listed in Tab 5 “Joint Ventures” and a number of smaller joint ventures involving BSHSI’s Health Care Providers. The System’s significant joint ventures do not provide for mandatory annual partner distributions. Earnings of these joint ventures continue to support operations, capital and growth of the joint ventures in the related markets. Investment markets contributed positively to the results of the System’s joint ventures, resulting in higher minority interest expense compared to the comparable prior fiscal year.
Gain on Discontinued Operations, Net totaled $3.4 million for the fiscal year ended August 31, 2010, as compared to $2.4 million for the prior fiscal year. The gains resulted from the release of estimated liabilities greater than final settlements associated with the System’s former Michigan operations and other discontinued operations. No new discontinuances occurred during 2010 or 2009.
Other Changes in Unrestricted Net Assets, Net resulted in a decrease of $54.2 million for the fiscal year ended August 31, 2010 compared to a decrease of $167.4 million for the prior fiscal year. The variance resulted primarily from a decrease in the minimum pension liability adjustment to $49.5 million for 2010 from $161.7 million for 2009, the result of a decrease to the discount rate at August 31, 2010 from August 31, 2009.
Factors Affecting Results of Operations
Critical Accounting Policies
BSHSI considers critical accounting policies to be those that require the more significant judgments and estimates in the preparation of its consolidated financial statements, including the impairment of long-lived assets. Management relies on historical experience and on other assumptions believed to be reasonable under the circumstances in making its judgment and estimates. Actual results could differ materially from those estimates. BSHSI has not significantly changed any of its critical accounting policies in fiscal year 2010.
The risks inherent with reimbursement from federal, state and private payors require that the collectability of receivables associated with these payors is reasonably stated in the consolidated financial statements. From a patient receivables standpoint, the System employs an active review process that assesses the reasonableness of its patient receivable allowances for contractual adjustments, uncompensated care, and bad debts and helps assure that the patient receivables are valued at their estimated net realizable value.
15

In accounting for Medicare and Medicaid cost reports, BSHSI records all third-party receivables and liabilities at their estimated reasonable values. Additionally, BSHSI has a consulting arrangement with an accounting firm that is not affiliated with its independent auditors to review all cost reports submitted to third-party payors and to assess the reasonableness of the System’s recorded liabilities to these payors. Management believes that adequate provisions have been made for reasonable adjustments that may result from final cost report settlements.
The System participates in a self-funded insurance program for hospital professional and general liabilities configured under a System affiliate, Bon Secours Assurance Company, Ltd., in the Cayman Islands. Assets are maintained under the self-funded insurance program to provide specified levels of claims-made and occurrence-based coverage, depending on the year, for hospital professional liabilities and general liabilities. Excess claims-made coverage is obtained through commercial carriers.
The System’s workers’ compensation program primarily consists of self-funded insurance programs in various states with excess coverage obtained through commercial insurers. Mary Immaculate Hospital, which is also a participant of the System’s workers’ compensation program, is insured under a large deductible policy.
Employee health benefits of the System are principally provided through the System’s self-funded insurance program. BSHSI maintains reserves for incurred but unreported claims based on historical payment lag.
The provision for claims and related funding levels for the self-insurance, workers’ compensation and employee health benefit programs are established annually based upon the recommendations of consulting actuaries. Claims in any of these programs could fluctuate significantly due to larger than estimated claim settlements. Management believes that adequate provisions have been made to reflect historical claims experience of the respective programs.
Possible Effects of Legislative, Regulatory and Managed Care Uncertainties
One of BSHSI’s primary sources of liquidity is operating cash flow. This cash flow is at risk in the event of significant unfavorable changes in legislation and regulations affecting the funding for health care services, primarily in the Medicare and state Medicaid programs. Medicare and Medicaid funding changes have a significant impact on the cash flow of the System.
In 2005, the Centers for Medicare and Medicaid Services (referred to as CMS) implemented a new
demonstration project using recovery audit contractors (referred to as RACs) as part of CMS’s efforts to assure accurate patient payments. The project uses the RACs to search for potentially inaccurate Medicare payments that may have been made to healthcare providers and that were not detected through existing CMS program integrity efforts. Once a RAC identifies a claim it believes is inaccurate, it adjusts the provider’s Medicare reimbursement to reflect such estimated overpayment or underpayment. The five-state pilot program concluded in March 2008 with a nationwide rollout in phases that began in 2009. The experience during the pilot indicated that the RACs identified more overpayments than were ultimately verified and CMS expanded the pilot program into a permanent program. Following completion of the pilot program, certain System affiliates have been the subject of RAC audits. As of August 31, 2010, the System’s hospitals in Kentucky, South Carolina and New York have received such notices. To date, the System’s hospitals in South Carolina and New York have had no Medicare claims denied and the System’s hospital in Kentucky has had a nominal amount of claims denied. Additional RAC assessments against the System are anticipated; however, the outcome of such assessments is unknown and cannot be reasonably estimated.
In 2008 and 2009, State Medicaid Integrity Programs (referred to as MIPs) were initiated by CMS through
contractors. Virginia, Florida and New York are the only states in which BSHSI operates where MIP audits have been initiated. As of August 31, 2010, MIP audits have been initiated at five BSHSI hospitals in Virginia and one hospital in New York. One Virginia facility has received a clean audit report and the remaining four are static while CMS replaces the original contractor. The outcome of the four Virginia and one New York open audit reports is uncertain and cannot be reasonably estimated.
The System’s management strives to anticipate factors that affect payment changes and develop plans to
address them. Management attempts to address these issues proactively through its policies and practices that focus on areas such as charity and uninsured care as well as effective managed care contracting, accounts receivable and revenue cycle best practices and analysis of potential government payment changes. Nonetheless, future actions by
16

federal, state and private payors could have a significant adverse effect on the System’s operating results, cash flows and liquidity. At this time, the System has one audit underway. The outcome of this audit is uncertain and the impact cannot be reasonably estimated at this time.
As a result of recently enacted federal health care reform legislation, substantial changes are anticipated in
the United States health care system. Such legislation includes numerous provisions affecting the delivery of health care services, the financing of health care costs, reimbursement of health care providers and the legal obligations of health insurers, providers and employers. These provisions are currently slated to take effect at specified times over approximately the next decade.
Goodwill and Long-Lived Asset Valuations
The System regularly evaluates whether events or changes in circumstances have occurred that could indicate impairment in the value of long-lived assets. In accordance with the provisions of the ASC 360-10 “Impairment or Disposal of Long-Lived Assets,” if events or changes in circumstances indicate that the carrying value of an asset is not recoverable, the System’s management estimates the projected undiscounted cash flows, excluding interest and taxes, of the related individual facilities to determine if an impairment loss should be recognized. The amount of impairment loss is determined by comparing the historical carrying value of the asset to its estimated fair value. Estimated fair value is determined through an evaluation of recent and projected financial performance of facilities using standard industry valuation techniques.
In addition to consideration of impairment upon the events or changes in circumstances described above, management regularly evaluates the remaining lives of the System’s long-lived assets. If estimates are changed, the carrying value of affected assets is allocated over the remaining lives. If expected future cash flows used in measuring assets are impaired, the System groups its assets at the lowest level for which there are identifiable cash flows independent of other groups of assets. No impairment charges were recorded during the fiscal years ended August 31, 2010 and 2009, respectively.
17

Tab 3 Balance Sheet and Capital Structure
♦ System Bonds ♦ Series 2010 Financing ♦ Letters of Credit and Liquidity Enhancements ♦ Covenants Regarding Long-Term Indebtedness ♦ Liquidity of BSHSI and Subsidiaries ♦ Interest Rate Risk Management ♦ Capital Market Uncertainties ♦ Investments
18

System Bonds
At August 31, 2010 and 2009, long-term indebtedness was comprised of the following (in thousands):
Aug. 31, 2010 Aug. 31, 2009 Aug. 31, 2010 Aug 31, 2009
Variable rate bonds $532,880 $546,835 $532,880 $546,835Fixed rate bonds 475,753 483,338 441,403 447,783 Capital leases 16,060 18,936 10,984 13,641 Other debt 34,921 37,242 27,006 28,004 Total long term debt $1,059,614 $1,086,351 $1,012,273 $1,036,263
BSHSI Consolidated Obligated Group
Series 2010 Financing On September 29, 2010, BSHSI terminated six irrevocable direct pay letters of credit that secured bonds originally issued in October 2008 (referred to as the Series 2008D Bonds). On the same date, BSHSI entered into four new and two amended and restated irrevocable direct pay letters of credit to secure the Series 2008D Bonds with stated maturities ranging from September 2013 to September 2015. On October 19, 2010, the Obligated Group converted the interest rate mode of $173.4 million of bonds originally issued in January 2008 (referred to as the Converted Bonds) from variable interest rate to fixed interest rate. The original variable interest rate bonds were secured by bond insurance policies and four standby bond purchase agreements. The standby bond purchase agreements were terminated on October 19, 2010; however, the bond insurance policies remained in effect. Principal and interest are payable in installments through November 2042 at fixed interest rates ranging from 4.50 % to 5.25%. The conversion satisfied a one-time covenant for the benefit of certain credit enhancers to cause the percentage of the principal amount of long-term indebtedness which bears interest at other than a fixed rate to be reduced to not greater than 40% of the Obligated Group’s total long-term indebtedness. In addition, on October 19, 2010, the Obligated Group issued $40.7 million of new variable rate bonds (referred to as the Series 2010 Bonds). The Series 2010 Bonds are currently remarketed weekly and bear interest at a weekly rate established by the market. The proceeds of the sale of the Series 2010 Bonds were used to (i) pay a termination payment of $39.0 million relating to the termination of four fixed payor swaps with a notional value of $173.3 million relating to the Converted Bonds and (ii) pay related costs of issuance. The Series 2010 Bonds are secured by an irrevocable direct pay letter of credit with a stated maturity of September 2013.
19

Letters of Credit and Liquidity Enhancement
The following table sets forth certain information with respect to the outstanding long-term indebtedness of the Obligated Group at August 31, 2010, and gives effect to the substitution of letters of credit, the conversion of the Converted Bonds and the issuance of the Series 2010 Bonds as described above under “Series 2010 Financing” as if those transactions occurred on August 31, 2010:
Series Credit Provider Liquidity Provider
Par Amount Outstanding at
August 31, 2010 Expiration Date
Series 2002B (Venice, Florida) Assured Guaranty Dexia $4,250,000 January 2013 Series 2002B (Russell, Kentucky) Assured Guaranty Dexia 14,725,000 January 2013 Series 2008A (South Carolina) Assured Guaranty Dexia 69,925,000 January 2013 Series 2008D (South Carolina) Citibank* — 27,785,000 September 2013 Series 2008D-1 (Hanover) Citibank* — 28,805,000 September 2013
Series 2008D-2 (Hanover)
U.S. Bank National Association*
— 92,765,000 October 2013
Series 2008D (Henrico) JPMorgan Chase* — 42,415,000 September 2013 Series 2008D-1 (Norfolk) Citibank* — 36,805,000 September 2013
Series 2008D-2 (Norfolk) Bank of America, N.A.* — 42,050,000 September 2015
Series 2010 (Virginia Small Business Financing Authority) JPMorgan Chase* — 40,740,000 September 2013
* Also provides liquidity.
Covenants Regarding Long-Term Indebtedness
Pursuant to certain agreements between the Obligated Group and certain credit enhancers relating to the Obligated Group’s indebtedness, the Obligated Group has covenanted to maintain, among other things, the ratios of each of the System’s and Obligated Group’s long-term indebtedness to the sum of their respective long-term indebtedness and consolidated unrestricted net assets (referred to as the debt to capitalization covenant) at a level to not exceed .65 to 1. The debt to capitalization covenant is calculated and tested annually as of the end of the System’s fiscal year. The covenant was made for the benefit of certain credit enhancers.
Because the covenant measures net assets as of a specific date each year, factors or conditions in effect as
of each August 31st may significantly impact the covenant for that fiscal year. Prior to August 31, 2010, the Obligated Group anticipated a reduction in net assets as of August 31, 2010 primarily due to declining interest rates and the corresponding measurement of its pension liabilities and derivative instruments’ mark to market valuations. As a result, management requested and received waivers of compliance with the debt to capitalization covenant for the fiscal year ended August 31, 2010 from each of the credit enhancers. The Obligated Group would not have been in compliance with the debt to capitalization covenant at August 31, 2010 had compliance not been waived.
While management currently expects that the Obligated Group will be in compliance with the debt to
capitalization covenant as of August 31, 2011, no assurances can be made regarding compliance with the covenant at that date or on any future measurement dates. Factors other than operations, such as accounting changes and interest rate movements, may affect (both positively and negatively) the Obligated Group’s compliance with the debt to capitalization covenant.
20

Liquidity of BSHSI and Subsidiaries
As depicted in the following table, the total value of the System’s unrestricted cash and unrestricted board-
designated funds at August 31, 2010 was $865.9 million, $107.2 million greater than at August 31, 2009. Operations and investment gains, as well as the impact of working capital changes, generated approximately $225.4 million and $28.9 million, respectively, during the fiscal year ended August 31, 2010. Capital expenditures, and scheduled debt and swap payments reduced cash by approximately $97.7 million and $49.4 million, respectively during the year. The cumulative effect of these changes resulted in an increase in days cash on hand to 110.5 at August 31, 2010 from 102.8 at August 31, 2009.
August 31,
2010August 31,
2009
Unrestricted cash and cash equivalents (a) $180,255 $129,048Unrestricted board-designated funds (b) 685,652 629,648
Total unrestricted cash and board-designated funds $865,907 $758,696
Days cash on hand (c) 110.5 102.8
Total long-term indebtedness (excluding bond discount) $1,064,611 $1,091,664
Ratio of unrestricted cash and board-designated funds to total long-term indebtedness (d) 81.3% 69.5%
(in thousands)
(a) Includes debt securities with maturities less than three months. (b) Includes mutual funds, debt and equity securities, and alternative investments. (c) Total unrestricted cash and investments, divided by total operating expenses (excluding depreciation and
amortization expense), divided by the number of calendar days in the period. (d) Total unrestricted cash and board-designated funds, divided by total long-term debt (excluding bond discount).
The System’s aggregate capital expenditures for the fiscal years ended August 31, 2010 and August 31,
2009 were approximately $97.7 million and $117.8 million, respectively, including capital purchases funded by project funds and philanthropic dollars. To protect liquidity, the System began to limit capital spending in response to the decline in the investment market in fiscal year 2009 and has continued such practices during the fiscal year ended August 31, 2010. The System has currently budgeted aggregate capital expenditures of $127.0 million for fiscal year 2011, the costs of which are expected to be funded from operations.
Interest Rate Risk Management
The System uses fixed and variable rate debt to finance capital needs and develop an appropriate debt structure. Variable rate debt exposes the System to variability in interest expense due to changes in interest rates. Conversely, fixed rate debt obligations can be more expensive to the System in times of declining interest rates. The System manages and monitors its cost of capital on a regular basis and from time to time enters into derivative instruments with financial institutions to help manage interest rate risk.
21

At August 31, 2010, the System had fifteen derivative instruments, none of which qualified for hedge accounting treatment under ASC Topic 815, “Derivatives and Hedging.” Fair value changes with respect to the valuation adjustments and payments for these instruments were reported under nonoperating investment losses, net in accordance with U.S. GAAP. The following is a summary of the derivative instruments in place at August 31, 2010:
Description #
Outstanding Notional Amount Pay Rates
Maturity Dates
Collateral Posted @
8/31/10 CounterpartiesMark to Market
Collateral Thresholds
Fixed Payer 1 61,410$ 3.448% Nov-2025 - Goldman Sachs (7,656)$ 10,000$ Fixed Payer 1 92,115 3.491% Nov-2025 - Deutsche Bank (11,733) 20,000 Fixed Payer 2 133,075 3.420% /
4.460%Aug-2026 / Nov-2028
- Merrill Lynch (25,792) *
Fixed Payer 2 128,950 3.384% / 4.485%
Oct-2025 / Oct-2026
11,199$ JP Morgan (27,739) 15,000
Fixed Payer 1 69,925 3.454% Nov-2042 - Citigroup (16,555) *Fixed Payer 1 46,440 3.454% Nov-2042 - Citigroup (10,995) *Fixed Payer 3 126,915 3.454% Nov-2042 - Citigroup (30,048) *Total Fixed Payers 11 658,830$ 11,199$ (130,518)
Fixed Basis 1 200,000$ SIFMA Jan-2029 - Citigroup (2,762) 20,000
Variable Basis 3 512,500$ SIFMA Nov-2029 - Merrill Lynch (16,079) *
Total Derivatives 15 1,371,330$ 11,199$ (149,359)$ 65,000$
Valuation Adjustment 13,924 (135,435)$
* Derivative instrument does not provide for the posting of collateral. Derivative instrument terminated subsequent to fiscal year end as described under "Series 2010 Financing" above.
(Dollars in thousands)
The unrealized losses of $60.8 million and $39.2 million for the fiscal years ended August 31, 2010 and 2009, respectively, relating to these non-qualifying derivative activities are recorded within nonoperating investment losses, net in the accompanying consolidated statements of operations.
The System utilizes a diversified group of swap counterparties and has sought to limit its obligations to post
collateral in the agreements governing its derivative instruments. In addition, the System routinely evaluates its derivative portfolio and may decide at any time to terminate certain of the derivative instruments discussed above and/or enter into new derivative instruments. Should the System decide to terminate any of such instruments, it may be required to make termination or breakage payments under the terms of those instruments.
On September 28, 2010, the System terminated four fixed payor swaps with a notional value of $173.4
million relating to the converted Bonds. On October 19, 2010, the System paid $39.0 million to the counterparty to terminate these swaps. See “Series 2010 Financing” above.
Capital Market Uncertainties
Investment market fluctuations affect the self-funded insurance plans, long term investment reserves and pension plan funds, and impact the System’s net assets. The System’s management monitors these fluctuations closely, striving to anticipate the effect of changes and develop plans to address them. Management attempts to proactively address the impact of these fluctuations through the System’s funding and investment management policies as well as cash management. Management has also attempted to offset the impact of market fluctuations by taking steps intended to strengthen operations. Nonetheless, market fluctuations could have a significant adverse or positive effect on the System’s cash flows and managing capital spending.
22

Investments
BSHSI maintains a centralized investment program that is comprised primarily of operating funds and other unrestricted board-designated funds, all of which primarily originate from subsidiary organizations of BSHSI. These funds are combined into a centralized investment program that is administered by BSHSI’s Treasury Services Department.
The BSHSI Board of Directors approves the primary investment policy, while the Pension and Investment Committee of the BSHSI Board of Directors periodically reviews and approves the asset allocation and investment procedures. The Pension and Investment Committee is also responsible for the ongoing oversight of the centralized investment program and approval of most other investment-related decisions, including the selection of an investment consultant and investment managers. BSHSI uses an outside investment consultant to provide professional investment analysis and guidance. Professional investment management firms invest all of the long-term reserves in the centralized investment program. As of August 31, 2010, BSHSI’s target allocation of its investment portfolios was 55% equity investments, 15% alternative investments (including hedge fund and real estate investments) and 30% fixed income investments. At August 31, 2010, the System’s asset allocations approximated these targets.
The System’s ability to generate significant investment income is dependent in large measure on market conditions. The market value of the System’s investment portfolio, as well as the System’s investment income, have fluctuated significantly in the past and are likely to fluctuate significantly in the future. The System’s investment portfolio assets are designated as trading securities as established in ASC Topic 320, “Investments in Debt and Equity Securities.” The System’s entire portfolio is actively managed by third-party investment managers. Trading generally reflects active and frequent buying and selling, and trading securities are generally used with the objective of generating profits on short-term differences in price. As required by U.S. GAAP, realized and unrealized gains and losses on an investment portfolio designated as a trading portfolio are accounted for as nonoperating investment income and are included in excess of revenue over expenses. Because of this designation as a trading portfolio, management anticipates fluctuations in excess of revenue over expenses from period to period.
The following table provides analysis of nonoperating investment losses, net for the fiscal years ended August 31, 2010 and 2009:
2010 2009 Increase
(Decrease)
Realized investment gains (losses) 4,528$ (62,511)$ 67,039$ Unrealized investment gains (losses) 37,429 (41,678) 79,107 Unrealized derivative losses (60,732) (39,239) (21,493) Interest Rate Derivative payments (22,436) (18,717) (3,719) Nonoperating investment losses, net (41,210)$ (162,145)$ 120,935$
(In thousands)
Fiscal Year Ended August 31,
Improving market conditions for the fiscal year ended August 31, 2010 resulted in realized gains as
compared to significant realized losses in the prior fiscal year. Management believes that the losses for the fiscal year ended August 31, 2009 were consistent with the general investment market decline and that the realized and unrealized gains (losses) in both periods were consistent with the trading styles of the managers and the overall change in market values.
For a description of the System’s derivative instruments, see “Interest Rate Risk Management” above. For
a description of the System’s fair value accounting methodology relating to its financial instruments, see note (5) to the audited financial statements of BSHSI and subsidiaries under Appendix.
23

Tab 4 Insurance and Pension Plans ♦ Insurance ♦ Pension Plans
24

Insurance
The System’s affiliates, including the Members of the Obligated Group, maintain insurance coverages which are customary for health care providers of similar size and location.
The System maintains self-funded insurance programs (professional/general liability, workers’
compensation and employee health benefits) through Bon Secours Assurance Company, Ltd., a Cayman Islands company the sole shareholder of which is BSHSI. Under the System’s self-insurance programs (professional/general liability, workers’ compensation and employee health benefits), claims are reflected as based upon actuarial estimation, including both reported and incurred but not reported claims, taking into consideration the severity of incidents and the expected timing of claim payments.
Pension Plans
Most of the System’s employees are covered by one of the System’s several noncontributory defined benefit pension plans, while a portion are covered by defined contribution retirement plans. The System’s noncontributory defined benefit pension plans provide benefits based upon age at retirement, years of credited services, and average earnings. Twelve of the System’s thirteen defined benefit plans are deemed church plans under the Internal Revenue Code (referred to as the IRC). During the fiscal year ended August 31, 2010, for defined benefit pension plans deemed to be church plans under the IRC, the System’s funding policy was to make contributions to fund the annual service cost of the plans. Beginning in fiscal year 2011, for defined benefit plans deemed to be church plans under the IRC, the System’s funding policy will be to make contributions to fund the annual service cost of the plans plus one-seventh of the unfunded accumulated benefit obligation. The revised funding policy is consistent with funding options presented in the Pension Relief Act, passed in June 2010. Defined benefit pension plans that are subject to the Employee Retirement Income Security Act of 1974 guidelines are funded in accordance with those guidelines.
The investment policy and objectives for defined benefit plan assets are established by BSHSI and are
based on a long-term perspective. An investment advisory firm engaged by BSHSI reviews asset performance and allocation on a periodic basis throughout the fiscal year. The percentage allocation to each asset class may vary depending upon market conditions and is adjusted when it falls outside the established ranges set for each asset class.
For the fiscal years ended August 31, 2010 and 2009, the System contributed $20.7 million and $24.5
million, respectively, to its pension plans. Pension plan contributions are made on a monthly basis based upon the annual actuarial valuations of each plan.
The System expects to contribute approximately $37.8 million to its pension plans during the fiscal year
ending August 31, 2011.
25

Tab 5 Organization
♦ Health Care Providers ♦ Shared Sponsorship Arrangements ♦ Joint Ventures ♦ Board of Directors ♦ Executive Officers • Employees
26

Health Care Providers
BSHSI and the 12 Health Care Providers identified in bold in the table below are currently, and have been, Members of the Obligated Group throughout the fiscal years ended August 31, 2010 and 2009. These 12 Health Care Providers operate eleven acute care facilities and three long-term care facilities in Florida, Kentucky, Maryland, South Carolina and Virginia. None of the Health Care Providers in New York or Pennsylvania are Members of the Obligated Group.
State Entity Name and Facilities (in italics) Description of
Facility Location Florida Bon Secours-Maria Manor Nursing Care
Center, Inc.
Bon Secours-St. Petersburg Long-Term Care St. Petersburg Bon Secours Place at St. Petersburg, L.L.P. (a) Bon Secours Place at St. Petersburg Assisted Living St. Petersburg Kentucky Our Lady of Bellefonte Hospital, Inc. Our Lady of Bellefonte Hospital Acute Care Russell Maryland Bon Secours Hospital Baltimore, Inc. Bon Secours Hospital Baltimore Acute/Skilled
Care Baltimore
New York Frances Schervier Home and Hospital Schervier Nursing Care Center Long-Term Care Riverdale Bon Secours Charity Health System Inc. Good Samaritan Hospital of Suffern, N.Y. Good Samaritan Hospital Acute Care Suffern Bon Secours Community Hospital Bon Secours Community Hospital Acute Care/
Skilled Care Port Jervis
St. Anthony Community Hospital, Warwick, New York St. Anthony Community Hospital Acute Care Warwick Bon Secours New York Villa Frances at the Knolls, Inc.
Schervier Pavilion
Long-Term Care
Warwick St. Francis Center at the Knolls, Inc. Mount Alverno Center Assisted Living Warwick Pennsylvania Altoona Regional Health System (a) Altoona Hospital Acute Care Altoona Bon Secours Hospital Acute Care Altoona South Carolina St. Francis Hospital, Inc. St. Francis Hospital - Downtown Acute Care Greenville St. Francis - Eastside Acute Care Greenville Roper St. Francis Healthcare (a)
Bon Secours – St. Francis Xavier Hospital
Acute Care
Charleston Roper Hospital Acute Care Charleston
27

State Entity Name and Facilities (in italics) Description of
Facility Location Virginia Bon Secours-St. Mary’s Hospital of Richmond, Inc. (a) St. Mary’s Hospital Acute Care Richmond
Bon Secours-Richmond Community Hospital,
Incorporated (a)
Richmond Community Hospital Acute Care Richmond Bon Secours-Memorial Regional Medical Center, Inc. (a) Memorial Regional Medical Center
Acute Care Mechanicsville
(Hanover County) Bon Secours-St. Francis Medical Center, Inc. (a) St. Francis Medical Center
Acute Care Midlothian (Chesterfield
County) Maryview Hospital Maryview Medical Center Acute Care Portsmouth
Province Place of Maryview, L.L.C. (a) Province Place of Maryview Assisted Living Portsmouth Mary Immaculate Hospital, Incorporated (a) Mary Immaculate Hospital Acute Care Newport News St. Francis Nursing Care Center Long-Term Care Newport News Bon Secours-DePaul Medical Center, Inc. DePaul Medical Center Acute Care Norfolk
Province Place of DePaul, L.L.C. (a) Province Place of DePaul (a) Assisted Living Norfolk Bon Secours-Maryview Nursing Care
Center
Maryview Nursing Care Center Long-Term Care Suffolk ________________________________________ (a) Not solely owned, directly or indirectly, by BSHSI. For additional information on certain of the joint ventures
identified in this table, see “Joint Ventures” below.
Exemption from Federal Income Taxation
BSHSI and the Health Care Providers which provide acute or long-term care are exempt from federal income taxation under Section 501(a) of the IRC, as organizations described in Section 501(c)(3) of the IRC, but are not private foundations as defined in Section 509(a) of the IRC
28

Shared Sponsorship Arrangements
Bon Secours Charity Health System, Inc.
Bon Secours Charity Health System, Inc. is the sole member of five Health Care Providers that own and operate two acute care hospitals, an acute care/skilled care hospital, a long-term care facility and an assisted living facility in the cities of Warwick, Port Jervis and Suffern, New York. The Sisters of Charity, an otherwise unaffiliated entity, along with Bon Secours Ministries, are the religious co-sponsors of Bon Secours Charity Health System, Inc. The Sisters of Charity and BSHSI are the members of Bon Secours Charity Health System, Inc. BSHSI holds controlling membership rights in Bon Secours Charity Health System, Inc. Neither the Sisters of Charity, Bon Secours Charity Health System, Inc. nor any of the five Health Care Providers controlled by Bon Secours Charity Health System, Inc. is a Member of the Obligated Group.
Interest of Diocese of Richmond, Virginia in Certain Facilities
Prior to March 1984, the Catholic Bishop and certain parish priests of the Diocese of Richmond, Virginia were the sole members of Maryview Hospital, a Health Care Provider and Member of the Obligated Group, which owns and operates Maryview Medical Center in Portsmouth, Virginia. Pursuant to a membership transfer agreement between the Sisters of Bon Secours and the Diocese of Richmond, the Diocese of Richmond transferred all of the membership rights in Maryview Hospital to the Sisters of Bon Secours in 1984, giving it full and complete membership rights in Maryview Hospital. The transfer agreement also confirmed pre-existing membership rights of the Sisters of Bon Secours in Bon Secours – St. Mary’s Hospital of Richmond, Inc., also a Health Care Provider and Member of the Obligated Group, which owns and operates St. Mary’s Hospital, located in Richmond, Virginia. Under the transfer agreement, the membership rights in Maryview Hospital and Bon Secours – St. Mary’s Hospital of Richmond, Inc. may, independent of each other, revert to the Diocese of Richmond if the Sisters of Bon Secours attempt to transfer either of such membership rights to a third party, cease to operate either hospital or cease to operate either hospital in conformity with the philosophy and teachings of the Roman Catholic Church. Notwithstanding the foregoing, by agreement dated March 14, 2003, the Diocese of Richmond agreed that the transfer by the Sisters of Bon Secours of its rights, including membership rights, with respect to Maryview Hospital and Bon Secours – St. Mary’s Hospital of Richmond, Inc. to Bon Secours Ministries did not trigger the reversion of any membership rights in either of those hospitals to the Diocese of Richmond.
Joint Ventures
These System’s affiliates are party to several joint ventures, including those discussed below and a number of smaller joint ventures involving the System’s Health Care Providers.
Majority-Interest Joint Ventures
Bon Secours – Richmond Health System. BSHSI is the sole corporate member of Bon Secours – Richmond Health Corporation and Bon Secours – Richmond Health Corporation and Richmond Memorial Foundation, an otherwise unaffiliated entity, are the corporate members of Bon Secours – Richmond Health System. Bon Secours – Richmond Health System is the sole corporate member of Bon Secours – St. Mary’s Hospital of Richmond, Inc., Bon Secours – Richmond Community Hospital, Incorporated, Bon Secours – Memorial Regional Medical Center, Inc. and Bon Secours – St. Francis Medical Center, Inc., which are Members of the Obligated Group. Bon Secours – Richmond Health Corporation, Richmond Memorial Foundation or Bon Secours – Richmond Health System are not Members of the Obligated Group. Pursuant to a members agreement, Bon Secours – Richmond Health Corporation has the right to receive 83% of the surplus capital (defined as contributed capital and earnings less a working capital reserve equal to 30 days cash on hand) of Bon Secours – Richmond Health System and is obligated to provide 83% of any further capital contribution to Bon Secours – Richmond Health System. Richmond Memorial Foundation is entitled to 17% of the surplus capital and is obligated to provide 17% of any capital contribution. The members agreement provides that any distributions of surplus capital are to be made upon the consent of both members, at the request of either member or upon dissolution of Bon Secours – Richmond Health System. The results of operations, cash flows, assets and liabilities of Bon Secours – Richmond Health System are included in BSHSI’s consolidated financial statements. The interest of Richmond Memorial Foundation in Bon Secours – Richmond Health System is reflected as a minority interest in such consolidated financial statements.
29

Mary Immaculate Hospital, Incorporated. BSHSI and the Congregation of Bernardine Sisters, an
otherwise unaffiliated entity, are the corporate members of Mary Immaculate Hospital, Incorporated, a Health Care Provider and Member of the Obligated Group. The Congregation of Bernardine Sisters is not a Member of the Obligated Group. BSHSI is entitled to receive a distribution of 50% of an amount equal to the cash and cash equivalents generated from the operations of Mary Immaculate Hospital, Incorporated, less 30 days cash on hand. The Congregation of Bernardine Sisters has the right to receive a distribution of the remaining 50%. BSHSI is obligated to provide 100% of any capital contribution to Mary Immaculate Hospital, Incorporated. The results of operations, cash flows, assets and liabilities of Mary Immaculate Hospital, Incorporated are included in BSHSI’s consolidated financial statements. The interest of the Congregation of Bernardine Sisters therein is reflected as a minority interest in such consolidated financial statements.
Minority-Interest Joint Ventures
Care Alliance Health Services (d/b/a Roper St. Francis Healthcare). BSHSI, The Medical Society of South Carolina and the Carolinas Health System, Inc. are members of Care Alliance Health Services (d/b/a Roper St. Francis Healthcare). Roper St. Francis Healthcare is the sole member of and operates Bon Secours – St. Francis Xavier Hospital, Roper Hospital, a supporting foundation and physician practices located in Charleston, South Carolina. BSHSI is obligated to provide 27% of any capital contribution to Roper St. Francis Healthcare and is entitled to 27% of any surplus capital. BSHSI accounts for its interest in Roper St. Francis Healthcare under the equity method and includes its interest in Roper St. Francis Healthcare’s excess of revenue over expenses in its consolidated statements of operations as other revenue. Roper St. Francis Healthcare, The Medical Society of South Carolina and the Carolinas Health System, Inc. are not otherwise affiliated with BSHSI and are not Members of the Obligated Group.
In May 2008, Roper St. Francis Healthcare began construction of a third 85-bed general acute care hospital
and a medical office building, which opened on November 1, 2010. In addition, in June 2009, Roper St. Francis Healthcare received state approval for the construction of a new 50-bed full service hospital located in Berkeley County, South Carolina. The approval of this project is currently under appeal at the request of a local hospital that also received state approval for a 50-bed facility. These capital construction projects will be financed through Roper St. Francis Healthcare’s equity. Distributions are expected to be foregone during this construction period.
Altoona Regional Health System. On November 1, 2004, Bon Secours Holy Family Regional Health System, which owned and operated Bon Secours Holy Family Hospital (now known as Bon Secours Hospital), located in Altoona, Pennsylvania, merged with Altoona Hospital, Inc. to form Altoona Regional Health System (referred to as ARHS). ARHS owns and operates Altoona Hospital and Bon Secours Hospital. Central Pennsylvania Health Services Corporation holds a 90% membership interest in ARHS and BSHSI holds the remaining 10% membership interest. BSHSI records its membership interest in ARHS under the equity method due to the extent of its board powers, and includes its interest in ARHS’s change in net assets in its consolidated statements of operations as other revenue.
The ARHS bylaws provide that upon the occurrence of certain defined events and dates, ARHS may
exercise a “call” option to purchase BSHSI’s membership interest in ARHS at fair market value. The ARHS bylaws also provide that upon the occurrence of certain defined events and dates BSHSI may exercise a “put” option to require ARHS to purchase BSHSI’s membership interest in ARHS at fair market value. If a put or call option is exercised, the purchase price for BSHSI’s membership interest in ARHS would be based on an independent fair market valuation of ARHS as a whole, multiplied by BSHSI’s membership interest percentage in ARHS. If an option is exercised at any time prior to November 1, 2012, the payment made by ARHS to BSHSI will be offset by a portion of the fees previously paid to BSHSI for corporate services in an amount equal to the lesser of (i) $10.0 million or (ii) 55.5% of such payments. Effective November 1, 2010, ARHS has the right to “call” and BSHSI has the right to “put” BSHSI’s membership interest in ARHS at fair market value.
During June 2010, BSHSI and ARHS obtained an independent valuation of AHRS. At November 1, 2010,
BSHSI exercised its “put” option. Upon Vatican approval, BSHSI would withdraw as a member of ARHS and would receive a distribution for their share. This transaction is expected to have minimal effect upon BSHSI’s financial position, results of operations, or cash flows.
30

Bon Secours and Life Care Services, Inc. Various subsidiaries of BSHSI have entered into agreements
with Life Care Services, Inc. (referred to as LCSI) in connection with the operation of various assisted living facilities located in St. Petersburg, Florida, Norfolk, Virginia and Portsmouth, Virginia. None of the members or the entities that own and operate these assisted living facilities is a Member of the Obligated Group. Pursuant to members’ agreements, the BSHSI subsidiaries may receive a distribution of 80% of the excess cash and cash equivalents generated from the operations of the joint venture or ventures to which it is a party and may be obligated to provide 80% of any capital contribution to such joint venture or ventures. LCSI may receive a distribution equal to the remaining 20% of excess cash and cash equivalents of each joint venture, and may be obligated to provide 20% of any further capital contribution to each joint venture. The results of operations, cash flows, assets and liabilities of these assisted living facilities are included in BSHSI’s consolidated financial statements. The interest of LCSI in these assisted living facilities is reflected as a minority interest in such consolidated financial statements.
Proposed Sentara Joint Venture. In December 2008, Bon Secours Hampton Roads Health System
(referred to as Bon Secours Hampton Roads) entered into a non-binding letter of intent with Sentara with respect to the proposed development of a 154-bed general acute care hospital to be located in Virginia Beach, Virginia. Subject to receipt of applicable state regulatory approval, 42 licensed but unstaffed beds currently located at DePaul Medical Center in Norfolk, Virginia would be reallocated to the new hospital, with the remaining beds allocated from certificates of public need (referred to as CONs) obtained by Sentara or reallocated from existing Sentara facilities. BSHSI’s application for a CON relating to a proposed new 90-bed acute care facility to be located in Virginia Beach, Virginia, and the litigation related thereto, has been suspended while definitive documentation relating to the hospital joint venture is being negotiated.
The new hospital, which would be located at Sentara’s Princess Anne health campus, would be owned by a
newly formed Virginia not-for-profit, nonstock corporation, in which Sentara would initially hold a 70% membership interest and Bon Secours Hampton Roads or an affiliate would initially hold a 30% membership interest. The joint venture would be managed by Sentara, and Bon Secours Hampton Roads would not have representation on the board of directors of the joint venture. It is expected that any definitive agreements will provide the members with rights to “put” and “call” their membership interests if certain events occur, including a change of control of a member or a material breach of the definitive agreements.
Approximately 80% of the initial project costs are expected to be financed by the proceeds of tax-exempt
borrowings by Sentara, which borrowings would be repaid by the joint venture. The remaining initial project costs plus appropriate working capital would be funded 70% by Sentara and 30% by Bon Secours Hampton Roads. The System’s obligations with respect to the initial project costs for the hospital, which is expected to commence operations in July 2011, are expected to be approximately $20.0 million. Such amount is expected to be required to be funded at or around the time the hospital commences operations. The joint venture would fund from its operations an operating and capital reserve. Distributions to members would occur in accordance with the respective membership interests following the build up by the joint venture of days cash on hand above certain thresholds.
The parties are currently negotiating definitive agreements relating to this joint venture and management
anticipates that definitive agreements will be executed on or before December 31, 2010, subject to receipt of necessary corporate and regulatory approvals. There can be no assurances that definitive agreements will be reached with respect to this joint venture or that required corporate or regulatory approvals relating to the joint venture will be obtained.
Board of Directors
The Board of Directors of BSHSI, subject to BSI’s reserved powers, directly or indirectly exercises certain reserved powers over all of the System’s affiliates. The board functions generally in areas of policy development, quality improvement, goal setting, strategic planning and budgeting and general oversight. Any action by the Board of Directors of BSHSI with respect to which BSI holds a reserved power may be superseded by action of BSI.
The Board of Directors of BSHSI, subject to approval by BSI, appoints the Chief Executive
Officer/President of BSHSI and exercises the power delegated to it from BSI to appoint the members of the boards
31

of directors of many System entities, including members of the boards of the other Members of the Obligated Group. BSHSI controls the assignments of the Senior Vice Presidents of Sponsorship for the members of the System in accordance with applicable policies. BSI controls the assignments of the Presidents of all entities under its direct or indirect control, with the exception of Mary Immaculate Hospital, Incorporated, which is a Health Care Provider and a Member of the Obligated Group, and Good Samaritan Hospital, which is owned and operated by Bon Secours Charity Health System, Inc. The President of Mary Immaculate Hospital, Incorporated is appointed by the Congregation of Bernardine Sisters. The President of Good Samaritan Hospital is appointed jointly by the Sisters of Charity and BSI through its reserved powers over BSHSI. The Chief Executive Officers and/or Executive Vice Presidents of specified entities that control, directly or indirectly, Healthcare Providers and are controlled, directly or indirectly, by BSHSI, including Mary Immaculate Hospital, Incorporated, Good Samaritan Hospital and the other Health Care Providers, are appointed and employed by BSHSI.
The following table lists the names, offices and principal occupations of the individuals who presently
serve on the Board of Directors of BSHSI. BOARD OF DIRECTORS
Board Member/Office Principal Occupation
Donald G. Seitz, M.D., (Chairperson)
Board Chairperson, Bon Secours Health System, Inc.; retired orthopedic surgeon, Richmond, Virginia
Chris Allen Executive Director/CEO, Detroit Wayne County Health Authority, Detroit, Michigan
Richard Blair Retired Chief Financial Officer, Blaine, Minnesota
Michael Carey Retired Human Resources Executive, Warren, New Jersey
Sr. Elaine Davia, C.B.S. Director of Formation, Congregation of Bon Secours, Marriottsville, Maryland
Marcia Dush Retired Actuary, McLean, Virginia
Roger Huang Associate Dean and Professor of Finance, Department of Finance – University of Notre Dame, Notre Dame, Indiana
A. David Jimenez Chief Operating Officer, Catholic Healthcare Partners, Cincinnati, Ohio
Laurie Lafontaine Vice President, Finance & Treasury, Allina Health System, Minneapolis, Minnesota
Lucretia M. McClenney Director, Center for Minority Veterans, Department of Veteran Affairs, Washington, D.C.
Susan Sandlund Partner, Veritas Partners, New York, New York
Richard Serafini Partner, Deloitte and Touche, LLP, Jacksonville, Florida
Myles Sheehan, S.J., M.D. Provincial, Society of Jesus of New England, Watertown, Massachusetts
Sr. Mary Shimo, C.B.S. Director of Volunteers, Bon Secours Hospital Baltimore, Inc. Baltimore, Maryland
Richard Statuto Chief Executive Officer/President, Bon Secours Health System, Inc., Marriottsville, Maryland
Sr. Alice Talone, C.B.S. Sister of Bon Secours, Ellicott City, Maryland
Pursuant to BSHSI’s bylaws, the following standing board committees have been created: Governance
Committee, Audit and Compliance Committee, Human Resources Committee, Compensation Committee, Quality Improvement Committee, Finance Committee and Pension and Investment Committee. The responsibilities of each of these committees is discussed below:
• The Governance Committee assists the board in helping ensure sound corporate governance through
education, orientation, evaluation and board and committee succession planning, including
32

recommending to the board persons to be appointed and reappointed to, or removed from, the board and committees of BSHSI and the boards of other System affiliates.
• The Audit and Compliance Committee consists of all outside directors and Richard Statuto, who is an ex officio member. The Audit and Compliance Committee assists the board in its oversight responsibilities relating to the financial reporting process, the system of internal controls, the audit process (both internal and external), risk management and the process for monitoring compliance with laws, regulations and BSHSI’s Code of Conduct.
• The Human Resources Committee assists the board in ensuring that human resource programs model BSHSI’s values and operating principles and improve organizational performance through strategic objectives pertaining to talent management and development.
• The Compensation Committee approves and maintains processes for the regular review of the performance, development, compensation and benefits of the Chief Executive Officer and Chairperson of the Board of Directors, as well as other senior and executive leaders throughout the System.
• The Quality Improvement Committee assists the board with oversight of the System’s strategic quality plan, provides System-wide guidance and oversight of quality improvement initiatives and supports local system boards with local system-specific quality initiatives.
• The Finance Committee assists the board with consolidated System-level strategic financial planning and oversight in areas that include financial operations and performance, planning and budgeting and capital structuring.
• The Pension and Investment Committee assists the board in its efforts to optimize investment returns within established risk parameters for BSHSI’s short- and long-term investable assets. The Pension and Investment Committee also oversees the stewardship of assets set aside to provide long-term retirement benefits under defined benefit plans and provides a reasonable range of defined contribution investment options from which individual participants may select.
Executive Officers
Information with respect to the executive officers of BSHSI is set forth below. Richard Statuto, Chief Executive Officer/President, age 53. Mr. Statuto was appointed Chief Executive
Officer/President of BSHSI in February 2005. Prior to joining BSHSI, Mr. Statuto was President and Chief Executive Officer of St. Joseph Health System, Orange, California, since 1995. Previously, Mr. Statuto served as Chief Operating Officer of the St. Joseph Health System during 1994 and as Vice President of Marketing from 1990 to 1994. Mr. Statuto was Vice President for Business Development, Marketing and Planning of BSHSI from 1987 to 1990. Mr. Statuto also previously was a consultant with Touche Ross & Company. Mr. Statuto was previously the Chair of the Catholic Health Association and Vice Chairman of the Board of Christus Health, Dallas, Texas. Mr. Statuto received his Bachelor’s Degree in Engineering from Vanderbilt University in 1980 and his Master’s Degree in Business Administration from Xavier University in 1983.
Katherine Arbuckle, Executive Vice President, Chief Financial Officer and Senior Services, age 52.
Ms. Arbuckle was appointed Executive Vice President, Finance and Chief Financial Officer in February 2010 and prior to that was Senior Vice President, Finance and Chief Financial Officer of BSHSI since December 2006. Prior to joining BSHSI, Ms. Arbuckle served as Vice President of Finance at Ascension Health in St. Louis, Missouri. Prior to her system position with Ascension, she served at St. Vincent Hospital and Health Care Center in Indianapolis, Indiana where she was Assistant Vice President, Finance/Assistant Chief Financial Officer. Prior experience includes Vice President, Finance at Clarian Health Partners, Inc. and fifteen years of public accounting, primarily at Ernst & Young. Ms. Arbuckle received her CPA certification in 1983. She has served on several boards and national committees, is a member of several healthcare and public accounting associations, and is a presenter at national education seminars. Ms. Arbuckle received her Bachelor’s Degree of Science in Accounting from Ball State University in 1980.
33

Sr. Anne Lutz, Executive Vice President, Sponsorship, age 70. Sr. Anne currently serves as Executive
Vice President for Sponsorship. Sr. Anne has been a member of the Sisters of Bon Secours since 1960 and has 42 years of experience in both acute care and geriatric care at both staff and management levels. Sr. Anne is the senior officer currently responsible for Sponsorship activities of the System and is Treasurer of the Sisters of Bon Secours USA, and currently also serves on the Finance Committee and Investment Committee of the Sisters of Bon Secours USA. Sr. Anne is a graduate of the Bon Secours School of Nursing. She received her Bachelor’s Degree in Administration and Arts from the University of Detroit in 1976.
Martha C. Riva, Senior Vice President, Governance, age 55. Ms. Riva was appointed Senior Vice
President, Governance in September 2005. Previously responsible for oversight and management of legal affairs and legal policy within the System, Ms. Riva currently serves as chief governance officer and is corporate secretary for BSHSI. Prior to joining BSHSI in 1993, Ms. Riva was with the law firm of Baker & Hostetler in Washington, D.C. Prior to entering the practice of law, she was a speech/language pathologist. Ms. Riva received her Bachelor’s Degree from the University of Maryland in 1976, her Master’s Degree in Speech and Language Pathology from George Washington University in 1978 and her Law Degree from Georgetown University Law Center in 1987.
Matthew J. Toddy, Executive Vice President, General Counsel, age 51. Mr. Toddy was appointed
Executive Vice President, General Counsel in February 2010 and prior to that was Senior Vice President, General Counsel since June 2005. Mr. Toddy is responsible for oversight and management of the legal affairs of the System. Prior to joining BSHSI, Mr. Toddy was a partner at the law firm of Jones Day in Atlanta, Georgia. Mr. Toddy received his Bachelor’s Degree from the University Of Notre Dame in 1982 and his Law Degree from The Ohio State University in 1985.
Peter J. Bernard, Executive Vice President of Bon Secours Health System, Inc. and Chief Executive
Officer of Bon Secours Virginia, age 57. Mr. Bernard was appointed Executive Vice President of BSHSI in February 2010 and Chief Executive Officer for Bon Secours Virginia in July 2008. Mr. Bernard served as Chief Executive Officer of Bon Secours – Richmond Health System from 2000 until July 2008. Mr. Bernard brings more than 30 years of healthcare leadership experience to the System. He has held a number of hospital leadership roles including being President and Chief Executive Officer of CARITAS Health Services in Louisville, Kentucky. Mr. Bernard is a member of the board of directors for a number of community-based entities including the Greater Richmond Chapter of the American Red Cross, which he presently Chairs, the St. Joseph’s Villa, and Venture Richmond. He is also a member of the Management Roundtable and the Chair of The Forum Club and is credentialed as a Fellow in the American College of Healthcare Executives. Mr. Bernard received a Bachelor’s of Science Degree from Grand Valley State University in Allendale, Michigan and a Master’s Degree in Healthcare and Hospital Administration from the University of Minnesota.
Tim Davis, Executive Vice President, Chief Human Resources and Administrative Officer, age 57.
Mr. Davis was appointed Executive Vice President, Chief Human Resources and Administrative Officer in January 2010. Mr. Davis joined BSHSI in October 2007 as the Executive Vice President, Organization Effectiveness after a 31-year career with General Electric (GE) where he served in progressively more responsible human resource leadership positions within GE’s national and international divisions. For six years, Mr. Davis served on the Board of Directors of BSHSI and was a member and past Chair of the board’s Human Resources Committee and Compensation Committee. Mr. Davis has served on numerous boards and councils over the years including the United Way, Massachusetts Private Industry Council and the Chambers of Commerce of North Central Massachusetts, Albany, New York and Bethlehem, New York. Mr. Davis received his Bachelor’s Degree in Biology from Massachusetts College and his Master’s Degree in Administration from St. Michael’s College.
Dr. Marlon Priest, Executive Vice President and Chief Medical Officer, age 58. Dr. Priest was
appointed Executive Vice President and Chief Medical Officer in February 2010 and joined BSHSI as Chief Medical Officer in November 2006. He is responsible for leading Clinical Transformation as well as achieving the strategic goals related to physician integration and ambulatory care services. Prior to joining BSHSI he was Professor of Emergency Medicine and Surgery at the University of Alabama at Birmingham and Senior Associate Chief of Staff for the University Hospital. He is an honors graduate of the University of Alabama School of Medicine and has earned board certification in both emergency medicine and internal medicine.
34

Dr. Thomas Morris, Senior Vice President, Sponsorship & Theology, age 54. Dr. Morris was appointed Senior Vice President, Sponsorship and Theology and Executive Director of Bon Secours Ministries in December 2009. He also serves as Senior Vice President of Sponsorship for Bon Secours St. Francis Health System in Greenville. Dr. Morris has been with the System since 1998. He assists the Chair of Bon Secours Ministries and the Chief Executive Officer of BSHSI by planning, developing and coordinating the sponsorship infrastructure for Bon Secours Ministries and BSHSI. Dr. Morris received a Bachelor of Arts Degree from The Catholic University of America in Washington, D.C. and a Master’s Degree in Theology from the Washington Theological Union. He also has a Master’s Degree and Doctorate in religious studies from the School of Religious Studies of The Catholic University of America.
Sr. Anne Marie Mack, Senior Vice President, Sponsorship, age 63. Sr. Anne Marie graduated from the
University of Delaware and Wayne State University in Detroit with degrees in Nursing. She is currently the Senior Vice President of Sponsorship in Richmond. Sr. Anne Marie has also worked in BSHSI’s local systems in Baltimore and Michigan. She served as President of the Sisters of Bon Secours in the U.S. from 1996 until 2003. She has been a Sister of Bon Secours for 45 years.
Sr. Patricia Heath, SUCS, Senior Vice President, Sponsorship, age 69. Sr. Pat was selected as Senior
Vice President, Sponsorship in November 2007. Sr. Pat has been a Holy Union Sister for 50 years. She has experience as an educator, administrator in parish and diocesan ministries. She was the congregational leader from 1991 until 1996, is co-director of Associates for the Holy Union Sisters and a member of the Province’s Core Group. She has been Director of Mission for Bon Secours Baltimore from 1997 until 1999, Vice President for Mission for Bon Secours Michigan from 1999 until 2007 and has been Senior Vice President, Sponsorship for Bon Secours Hampton Roads from 2007 to the present. She received her Bachelor’s Degree in 1967 in Education in Fall River, Massachusetts and her Master’s Degree in Education/Theology in 1974 from Boston College in Massachusetts.
Br. Arthur Caliman, Senior Vice President, Sponsorship, age 62. Br. Arthur was appointed Senior Vice
President for Sponsorship in September 2008. Br. Arthur has been a member of the Xaverian Brothers since 1965 and has served as both General Superior (2001-2007) and Director of Sponsorship (1988-1994). He has 40 years of experience in health care and social services at both staff and management levels. Br. Arthur serves as the Sponsorship leader for local Bon Secours systems in Baltimore, New York and St. Petersburg, Florida. He is a graduate of the Catholic University of America, where he received both his Bachelor’s Degree in 1970 and Master’s Degree in 1971.
Employees
The System employed approximately 17,700 full-time equivalents at August 31, 2010. Certain nurses and
employees providing professional technical and support services at the New York Health Care Providers are represented by labor unions. No other employees are unionized. BSHSI believes its relations with employees throughout the System are good.
35

Appendix
♦ Audited Financial Statements o Consolidated Financial Statements and Consolidating
Schedules in Obligated Group Format August 31, 2010 and 2009
36

BON SECOURS HEALTH SYSTEM, INC. AND SUBSIDIARIES
Consolidated Financial Statements and Consolidating Schedules in Obligated Group Format
August 31, 2010 and 2009
(With Independent Auditors’ Report Thereon)

KPMG LLP 1 East Pratt Street Baltimore, MD 21202-1128
KPMG LLP is a Delaware limited liability partnership, the U.S. member firm of KPMG International Cooperative (“KPMG International”), a Swiss entity.
Independent Auditors’ Report
The Board of Directors Bon Secours Health System, Inc. and Subsidiaries:
We have audited the accompanying consolidated balance sheets of Bon Secours Health System, Inc. and Subsidiaries (the System) as of August 31, 2010 and 2009, and the related consolidated statements of operations, changes in net assets, and cash flows for the years then ended. These consolidated financial statements are the responsibility of the System’s management. Our responsibility is to express an opinion on these consolidated financial statements based on our audits.
We conducted our audits in accordance with auditing standards generally accepted in the United States of America. Those standards require that we plan and perform the audit to obtain reasonable assurance about whether the financial statements are free of material misstatement. An audit includes consideration of internal control over financial reporting as a basis for designing audit procedures that are appropriate in the circumstances, but not for the purpose of expressing an opinion on the effectiveness of the System’s internal control over financial reporting. Accordingly, we express no such opinion. An audit also includes examining, on a test basis, evidence supporting the amounts and disclosures in the financial statements, assessing the accounting principles used and significant estimates made by management, as well as evaluating the overall financial statement presentation. We believe that our audits provide a reasonable basis for our opinion.
In our opinion, the consolidated financial statements referred to above present fairly, in all material respects, the consolidated financial position of Bon Secours Health System, Inc. and Subsidiaries as of August 31, 2010 and 2009, and the consolidated results of their operations, changes in their net assets, and their cash flows for the years then ended, in conformity with U.S. generally accepted accounting principles.
November 11, 2010

2
BON SECOURS HEALTH SYSTEM, INC.AND SUBSIDIARIES
Consolidated Balance Sheets
August 31, 2010 and 2009
(In thousands)
Assets 2010 2009
Current assets:Cash and cash equivalents $ 180,255 129,048 Accounts receivable, net:
Patient and third-party payors 348,307 328,995 Other 15,238 15,509
Total accounts receivable, net 363,545 344,504
Assets limited or restricted as to use 62,187 44,090 Inventories 49,231 43,650 Prepaid expenses and other current assets 21,553 24,688
Total current assets 676,771 585,980
Assets limited or restricted as to use, less current portion 790,687 745,638 Property, plant, and equipment, net 1,077,741 1,101,713 Deferred financing costs, net 12,774 14,173 Goodwill and other assets, net 241,009 226,651
Total assets $ 2,798,982 2,674,155
Liabilities, Minority Interest, and Net Assets
Current liabilities:Current portion of long-term debt $ 26,573 26,968 Accounts payable 169,874 138,684 Accrued salaries, wages, and benefits 152,763 144,580 Other accrued expenses 99,442 107,016
Total current liabilities 448,652 417,248
Long-term debt, less current portion 1,033,041 1,059,383 Other long-term liabilities and deferred credits 632,034 494,112
Total liabilities 2,113,727 1,970,743
Minority interest 144,397 130,043
Net assets:Unrestricted 500,722 542,090 Temporarily restricted 33,381 24,638 Permanently restricted 6,755 6,641
Total net assets 540,858 573,369 $ 2,798,982 2,674,155
See accompanying notes to consolidated financial statements.

3
BON SECOURS HEALTH SYSTEM, INC.AND SUBSIDIARIES
Consolidated Statements of Operations
Years ended August 31, 2010 and 2009
(In thousands)
2010 2009
Revenues:Net patient service revenue $ 2,993,910 2,827,545 Other revenue 90,964 67,682
Total revenues 3,084,874 2,895,227
Expenses:Salaries, wages, and benefits 1,430,410 1,347,585 Supplies 498,997 466,771 Purchased services and other 683,072 631,934 Provision for bad debts 212,478 200,141 Depreciation and amortization 123,292 122,711 Interest 34,939 48,392
Total expenses 2,983,188 2,817,534
Operating income from continuing operations 101,686 77,693
Nonoperating gains (losses), net:Nonoperating investment losses, net (41,210) (162,145) Loss on early retirement of debt — (14,113) Gain on sale of assets, net 561 — Other nonoperating activities, net (31,205) (25,943)
Excess (deficit) of continuing revenues over expensesbefore minority interest 29,832 (124,508)
Minority interest of consolidated subsidiaries (20,445) (2,427)
Excess (deficit) of continuing revenues over expenses 9,387 (126,935)
Gain on discontinued operations, net 3,421 2,441
Excess (deficit) of revenues over expenses 12,808 (124,494)
Other changes in unrestricted net assets:Net change in unrealized gains on other-than-trading securities 1,729 1,250 Net assets released from restrictions used for purchase of
property, plant, and equipment 1,359 2,529 Transfers to affiliates and other changes, net (3,769) (8,583) Net change in equity of joint venture (3,982) (834) Pension and other postretirement adjustments (49,513) (161,731)
Decrease in unrestricted net assets (41,368) (291,863)
Unrestricted net assets, beginning of year 542,090 833,953 Unrestricted net assets, end of year $ 500,722 542,090
See accompanying notes to consolidated financial statements.

4
BON SECOURS HEALTH SYSTEM, INC.AND SUBSIDIARIES
Consolidated Statements of Changes in Net Assets
Years ended August 31, 2010 and 2009
(In thousands)
Temporarily PermanentlyUnrestricted restricted restricted
net assets net assets net assets Total
Balance at August 31, 2008 $ 833,953 23,295 6,736 863,984
Deficit of revenues over expenses (124,494) — — (124,494) Grants and restricted contributions — 6,832 192 7,024 Net change in unrealized gains (losses) on
other-than-trading securities 1,250 (706) — 544 Investment losses — (1,028) (107) (1,135) Net assets released from restrictions used for
purchase of property, plant, and equipment 2,529 (2,529) — — Net assets released from restrictions used
for operations — (1,680) — (1,680) Net change in equity of joint venture (834) — — (834) Pension and other postretirement adjustments (161,731) — — (161,731) Transfers (to) from affiliates and other changes,
net (8,583) 454 (180) (8,309)
(Decrease) increase in net assets (291,863) 1,343 (95) (290,615)
Balance at August 31, 2009 542,090 24,638 6,641 573,369
Excess of revenues over expenses 12,808 — — 12,808 Grants and restricted contributions — 11,823 85 11,908 Net change in unrealized gains on
other-than-trading securities 1,729 299 — 2,028 Investment income — 51 — 51 Net assets released from restrictions used for
purchase of property, plant, and equipment 1,359 (1,359) — — Net assets released from restrictions used
for operations — (1,720) — (1,720) Net change in equity of joint venture (3,982) — — (3,982) Pension and other postretirement adjustments (49,513) — — (49,513) Transfers (to) from affiliates and other changes,
net (3,769) (351) 29 (4,091)
(Decrease) increase in net assets (41,368) 8,743 114 (32,511) Balance at August 31, 2010 $ 500,722 33,381 6,755 540,858
See accompanying notes to consolidated financial statements.

5
BON SECOURS HEALTH SYSTEM, INC.AND SUBSIDIARIES
Consolidated Statements of Cash Flows
Years ended August 31, 2010 and 2009
(In thousands)
2010 2009
Cash flows from operating activities:Decrease in net assets $ (32,511) (290,615) Adjustments to reconcile decrease in net assets to net cash provided by operating
activities:Gain on discontinued operations, net (3,421) (2,441) Provision for bad debts 212,478 200,141 Depreciation and amortization, including $3,283 and $2,888 reported in
nonoperating activities, net in 2010 and 2009, respectively 126,575 125,599 Amortization of deferred financing costs and bond discount, net 1,677 3,027 Minority interest of consolidated subsidiaries 20,445 2,427 Equity in income of joint ventures (21,193) (37,166) Distributions received from investments in joint venture 29,359 20,293 Net realized/unrealized losses on certain investments and derivative instruments 47,560 186,353 Loss on early retirement of debt — 14,113 Gain on sale of assets (561) — Pension and other postretirement adjustments 49,513 161,731 Contributions restricted by donor (11,908) (7,024) Cash distribution to minority interest holders (6,091) (4,304) Cash (used in) provided by changes in assets and liabilities:
Increase in accounts receivable (231,519) (191,519) Increase in inventories, prepaid expenses and other current assets (2,446) (3,670) (Increase) decrease in goodwill and other assets, net (15,915) 31,855 Increase in accounts payable and other current liabilities 35,220 41,371 Increase (decrease) in other long-term liabilities and deferred credits 27,676 (11,279)
Net cash provided by operating activities 224,938 238,892
Cash flows from investing activities:Investment in joint venture (3,797) (4,555) Proceeds (purchases) of securities, net (27,537) 31,711 Property, plant, and equipment additions, net of disposals (97,654) (117,816) Cash flows from hedging activities (22,436) (18,717)
Net cash used in investing activities (151,424) (109,377)
Cash flows from financing activities:Proceeds from issuance of long-term debt — 293,580 Payments of long-term debt (27,015) (23,143) Retirements of long-term debt — (293,580) Proceeds from contributions restricted by donors 4,708 7,024
Net cash used in financing activities (22,307) (16,119)
Net increase in cash and cash equivalents 51,207 113,396
Cash and cash equivalents, beginning of year 129,048 15,652 Cash and cash equivalents, end of year $ 180,255 129,048
Supplemental disclosures:(a) Cash paid for taxes was $791 and $1,560 for 2010 and 2009, respectively.(b) System entered into capital lease of $4,822 in 2009 and Medical Office Building (MOB) liabilities of $17,059 in 2009.(c) System received a restricted capital contribution of $7,200 in 2010.
See accompanying notes to consolidated financial statements.

BON SECOURS HEALTH SYSTEM, INC. AND SUBSIDIARIES
Notes to Consolidated Financial Statements
August 31, 2010 and 2009
(In thousands)
6 (Continued)
(1) Organization and Mission
(a) Organizational Structure
Bon Secours Health System, Inc., a Maryland nonprofit, nonstock membership corporation (BSHSI), and all of the other entities that are controlled directly or indirectly by Bon Secours, Inc., a Maryland nonprofit, nonstock membership corporation (BSI) are described collectively as the System. BSI, which is the sole corporate member of BSHSI, has no healthcare operations. The System was organized in June 1983 to fulfill the healthcare mission of the United States Province of the Congregation of the Sisters of Bon Secours of Paris (Sisters of Bon Secours), a congregation of religious women of the Roman Catholic Church founded in France in 1824.
The Sisters of Bon Secours have ministered to the healthcare needs of people in the United States since 1881. To ensure the sustainability of the ministry into the future as well as to broaden their collaboration with the laity in areas of influence, the Sisters of Bon Secours petitioned the Vatican to establish Bon Secours Ministries, an entity comprised of both laypersons and Sisters of Bon Secours to oversee the Catholic ministry of BSHSI. Bon Secours Ministries, which is referred to as a “public juridic person” in the Catholic Church’s Code of Canon Law, was established by the Vatican on May 31, 2006 with the specific responsibility to oversee (and, as appropriate, initiate) the healthcare ministries within the System and, in particular, BSHSI’s Catholic identity and mission. This formal relationship with the Catholic Church and the specific ministry is commonly referred to as “sponsorship.” The Sisters of Bon Secours formally transferred the responsibility of sponsorship of the System to Bon Secours Ministries on November 1, 2006. Since then, Bon Secours Ministries has provided an active presence of leadership and direction for BSHSI to ensure its operations and use of resources are aligned with the mission, values and fundamentals of Catholic social teaching.
The System’s principal activities comprise health and nursing care services in the states of New York, Pennsylvania, Maryland, Virginia, Kentucky, South Carolina, and Florida.
(b) Mission
The Mission of the System is to bring compassion to healthcare and to be good help to those in need, especially those who are poor and dying. As a system of caregivers, the System is committed to helping to bring people and communities to health and wholeness as part of the healing ministry of Jesus Christ and the Catholic Church.
The ministry of BSHSI aids those in need, particularly those who are sick and dying, by offering a wide variety of services, including acute inpatient, outpatient, pastoral, palliative, home health, nursing home, rehabilitative, primary and secondary care and assisted living, in Florida, Kentucky, Maryland, New York, Pennsylvania, South Carolina, and Virginia without regard to race, religion, color, gender, age, marital status, national origin, sexual orientation, or disability. Activities directly associated with this purpose are considered operating activities. Operating activities also include other incidental services that are closely related to healthcare.
BON SECOURS HEALTH SYSTEM, INC. AND SUBSIDIARIES
Notes to Consolidated Financial Statements
August 31, 2010 and 2009
(In thousands)
7 (Continued)
(c) Community Benefits
The System exists to benefit the people in the communities we serve. In pursuing its mission, the System advocates for and provides services to help meet healthcare and related socioeconomic needs of poor and disadvantaged individuals and the broader community. The System provides services in the communities served by holistically ministering to the patients with respect and without regard to their ability to pay.
Programs and services for the uninsured and underinsured represent the financial commitment of the System to everyone in the community. The System’s financial assistance policy ensures that all members of the community receive this basic human right to access healthcare.
The categories included as programs and services for the poor and disadvantaged are as follows:
(i) Charitable Services – Financially Disadvantaged Persons
The System provides care to patients regardless of their ability pay all or a portion of the charges incurred. This care is classified as charity care based upon the System’s established policies. In accordance with the Catholic Health Association (CHA) guidelines, charity care represents the unpaid costs of free or discounted health services provided to persons who cannot afford to pay and who meet the organization’s criteria for financial assistance.
In assessing a patient’s ability to pay, the System utilizes generally recognized poverty income levels, financially supporting 100% of the healthcare services provided to patients with annual family income at or below 200% of the federal poverty guidelines. Additional assistance is provided by a reduction in charges for medically necessary services through a community service adjustment.
(ii) Charitable Services – State Programs
The System provides services to indigent patients under various state programs, including state Medicaid, that generally pay healthcare providers amounts that are less than the cost of the services provided to the recipients. Unreimbursed costs of the care provided to these disadvantaged patients are also reported as charitable services.
(iii) Other Community Benefits
Other community benefits include community services for the poor and disadvantaged as well as the broader community. The programs cover a broad spectrum of services and are financially supported by the System:
• Mobile Care-A-Vans – providing free community-based preventive and primary care services;
• Child programs – providing oral healthcare, asthma and childhood obesity interventions;
• Caregiver and senior programs – focused on support, health screenings, and a variety of others;

BON SECOURS HEALTH SYSTEM, INC. AND SUBSIDIARIES
Notes to Consolidated Financial Statements
August 31, 2010 and 2009
(In thousands)
8 (Continued)
• Education – providing medical and other health professional programs;
• Leadership activities – a full-time healthy community leader is provided in each community served who works to unite the people and to provide health and social issues.
The cost of charitable services and community benefits provided by the System is determined in accordance with the System’s accounting policies. These costs are computed by using the cost to charge ratio applied by Medicaid and other state programs as well as specific patient visits identified under the System’s charity care policies. The cost of these services is as follows for the years ended August 31, 2010 and 2009:
2010 2009
Charitable services and other community benefits:Cost of services to financially disadvantaged persons $ 121,445 119,973 Unpaid cost of state programs (e.g., Medicaid)
to financially disadvantaged persons 84,646 77,457 Cost of other community benefits 48,975 55,983
Total community benefits, at cost $ 255,066 253,413
(2) Significant Accounting Policies
(a) Principles of Consolidation
The consolidated financial statements include the accounts of all members of the corporate group controlled by BSHSI. Members of the corporate group include all entities that BSHSI directly or indirectly controls, even if the System has less than 50% of the ownership or membership interest in the entity. Investments in entities where the System holds 50% or less of an entity’s operations and does not have operational control are recorded under the equity or cost method of accounting. The System has included its equity share of income or losses and changes in net assets from investments in unconsolidated affiliates in other revenue and changes in unrestricted net assets, respectively, in the accompanying consolidated statements of operations. All material intercompany transactions and account balances have been eliminated in consolidation.
(b) Use of Estimates
The preparation of financial statements in conformity with U.S. generally accepted accounting principles (GAAP) requires management to make estimates and assumptions that affect the reported amounts of assets and liabilities and disclosure of contingent assets and liabilities at the date of the consolidated financial statements and the reported amounts of revenues and expenses during the reporting period. Actual results could differ from those estimates.
In the years ended August 31, 2010 and 2009, the System recorded income of $22,476 and $18,658, respectively, related to expense reductions and increases in net patient service revenue as a result of the reassessment of various third-party payor settlement issues and changes in estimates associated with other operating assets and liabilities.

BON SECOURS HEALTH SYSTEM, INC. AND SUBSIDIARIES
Notes to Consolidated Financial Statements
August 31, 2010 and 2009
(In thousands)
9 (Continued)
(c) Cash and Cash Equivalents
For purposes of the consolidated financial statements, cash and cash equivalents include investments in highly liquid debt instruments with original maturities of three months or less, excluding investments limited or restricted as to use.
(d) Accounts Receivable
Accounts receivable is presented net of allowances for uncollectible amounts of $147,714 and $132,150 at August 31, 2010 and 2009, respectively. The System grants credits to patients and generally does not require collateral or other security. However, it routinely obtains assignment of patients’ benefits under their health insurance policies. Most of the System’s net patient service revenue is derived from third-party payment programs. Medicare, Medicaid, and Blue Cross comprise approximately half of the System’s consolidated third-party payor revenue.
The respective percentages of amounts due from patients and third-party payors at August 31, 2010 and 2009 are as follows:
2010 2009
Medicare 25% 23%Medicaid 12 12Blue Cross 13 13Managed care 23 26Other, including self-pay 27 26
100% 100%
(e) Assets Limited or Restricted as to Use and Investment Income
Assets limited or restricted as to use include assets held by trustees under indentures, self-insurance trust arrangements, assets related to donor-restricted net assets, and assets designated by the board of directors over which it retains control and may, at its discretion, use for other purposes. The fair value of investments, with the exception of alternative investments, is based upon quoted market prices or other observable market inputs. Alternative investments are recorded under the equity method.
Unrealized gains or losses on trading securities are included in nonoperating investment losses, net. As of August 31, 2010 and 2009, all investments and assets limited or restricted as to use are designated as trading securities, except for certain Foundation investments.
Investment income on donor-restricted funds is recorded as an addition to donor-restricted net assets provided the income has been restricted by the donor. Investment income on trustee-held funds, professional/general liability, workers’ compensation, and health benefit self-insurance funds is reported in other revenue for the years ended August 31, 2010 and 2009, respectively. All other investment income is reported within nonoperating investment losses, net.

BON SECOURS HEALTH SYSTEM, INC. AND SUBSIDIARIES
Notes to Consolidated Financial Statements
August 31, 2010 and 2009
(In thousands)
10 (Continued)
(f) Inventories
Inventories, consisting primarily of pharmaceuticals and medical supplies, are stated at the lower of cost or market, principally on a first-in, first-out basis.
(g) Property, Plant, and Equipment
Property, plant, and equipment are recorded at cost or, if donated, at fair value on the date of receipt. Depreciation is provided over the estimated useful life of each class of depreciable asset and is computed using the straight-line method. Equipment under capital lease obligations is amortized on the straight-line method over the shorter period of the lease term or the estimated useful life of the equipment. Such amortization is included in depreciation and amortization in the accompanying consolidated financial statements. Estimated useful lives of the assets are as follows:
Buildings 20 to 50 yearsFixed equipment 10 to 20 yearsMajor movable equipment 3 to 5 years
Gifts of long-lived assets such as land, buildings, or equipment are reported as unrestricted support and are excluded from the excess (deficit) of revenues over expenses, unless explicit donor stipulations specify how the donated assets must be used. Gifts of long-lived assets with explicit donor restrictions that specify how the assets are to be used and gifts of cash or other assets that must be used to acquire long-lived assets are reported as restricted support. Absent explicit donor stipulations about how long those long-lived assets must be maintained, expirations of donor restrictions are reported when the donated or acquired long-lived assets are placed in service.
Interest cost is capitalized as part of the cost of constructing capital assets, net of any interest income earned on unexpended bond proceeds borrowed for a specific project, during the construction period. The System capitalizes the direct costs, including internal costs, associated with the implementation of new information systems for internal use. Capitalized amounts are amortized over the estimated lives of the software, which generally are five years.
(h) Asset Impairment
The System regularly evaluates whether events or changes in circumstances have occurred that could indicate an impairment in the value of long-lived assets. In accordance with the provisions of the Financial Accounting Standards Board (FASB) Accounting Standards Codification (ASC) Topic 360-10, Impairment or Disposal of Long-Lived Assets, if events or changes in circumstances indicate that the carrying value of an asset is not recoverable, the System’s management estimates the projected undiscounted cash flows, excluding interest and taxes, of the related individual facilities to determine if an impairment loss should be recognized. The amount of impairment loss is determined by comparing the historical carrying value of the asset to its estimated fair value. Estimated fair value is determined through an evaluation of recent and projected financial performance of facilities using standard industry valuation techniques.

BON SECOURS HEALTH SYSTEM, INC. AND SUBSIDIARIES
Notes to Consolidated Financial Statements
August 31, 2010 and 2009
(In thousands)
11 (Continued)
In addition to consideration of impairment upon the events or changes in circumstances described above, management regularly evaluates the remaining lives of its long-lived assets. If estimates are changed, the carrying value of affected assets is allocated over the remaining lives. In estimating the future cash flows for determining whether an asset is impaired and if expected future cash flows used in measuring assets are impaired, the System groups their assets at the lowest level for which there are identifiable cash flows independent of other groups of assets. No impairment charges were recorded during the years ended August 31, 2010 and 2009, respectively.
(i) Goodwill and Other Assets, Net
Goodwill and other assets, net, consist of the following at August 31, 2010 and 2009:
2010 2009
Goodwill, net of accumulated amortization $ 92,898 96,993 Investments in joint ventures (note 10) 94,907 98,049 Other assets 40,802 24,728 Pledges and notes receivable 12,402 6,881
Total goodwill and other assets, net $ 241,009 226,651
Goodwill recorded in connection with acquisitions is amortized on a straight-line basis over 15 to 40 years. Accumulated amortization of goodwill amounted to $50,890 and $46,540 at August 31, 2010 and 2009, respectively.
(j) Deferred Financing Costs, Net
Financing costs incurred in connection with the issuance of long-term debt have been capitalized and included in other assets. These costs are being amortized using the effective-interest method over the term of the related obligations. Accumulated amortization of long-term debt issuance costs amounted to $7,297 and $6,261 at August 31, 2010 and 2009, respectively. As a result of the October 2008 debt refinancing, write-offs of $10,490 of net deferred financing costs are included in the loss on early retirement of debt of $14,113 on the accompanying consolidated statement of operations for the year ended August 31, 2009.
(k) Leases
Lease arrangements, including assets under construction, are capitalized when such leases convey substantially all the risks and benefits incidental to ownership. Capital leases are amortized over either the lease term or the life of the related assets, depending upon available purchase options and lease renewal features. Amortization related to capital leases is included in the consolidated statements of operations within depreciation and amortization expense.

BON SECOURS HEALTH SYSTEM, INC. AND SUBSIDIARIES
Notes to Consolidated Financial Statements
August 31, 2010 and 2009
(In thousands)
12 (Continued)
(l) Other Long-Term Liabilities and Deferred Credits
Other long-term liabilities and deferred credits consist of the following at August 31, 2010 and 2009:
2010 2009
Accrued pension liability (note 8) $ 350,856 289,947 Self-insurance liabilities 78,997 65,065 Environmental liabilities 13,811 13,805 Derivative instrument valuations (note 7) 135,435 74,655 Medical office building liabilities (note 11(e)) 40,070 40,070 Other long-term liabilities 12,865 10,570
$ 632,034 494,112
(m) Donor-Restricted Gifts
Unconditional promises to give cash and other assets to the System are reported at fair value at the date the promise is received. Conditional promises to give and indications of intentions to give are reported at fair value at the date the gift is received. The gifts are reported as either temporarily or permanently restricted support if they are received with donor stipulations that limit the use of the donated assets. When a donor restriction is satisfied, temporarily restricted net assets are reclassified as unrestricted net assets and reported in the accompanying consolidated statements of operations as net assets released from restrictions. Such amounts are classified as other revenue or transfers for additions to property, plant, and equipment. Donor-restricted contributions whose restrictions are satisfied within the same year as received are reported as unrestricted contributions in the accompanying consolidated financial statements.
(n) Net Assets
The System classifies net assets based on the existence or absence of donor-imposed restrictions. Unrestricted net assets represent contributions, gifts, and grants that have no donor-imposed restrictions or that arise as a result of operations. Temporarily restricted net assets are subject to donor-imposed restrictions that must or will be met either by satisfying a specific purpose and/or passage of time. Temporarily restricted net assets of $33,381 and $24,638 at August 31, 2010 and 2009, respectively, primarily consisted of pledges and funds received for capital projects, various healthcare programs, and community outreach programs. Permanently restricted net assets are subject to donor-imposed restrictions that must be maintained in perpetuity. Generally, the donors of these assets permit the use of all or part of the income earned on related investments for specific purposes.
(o) Fair Values
The carrying values of financial instruments classified as current assets and current liabilities approximate fair values. The fair values of investments and assets limited or restricted as to use, with the exception of alternative investments, are based on quoted market prices or other observable inputs. Alternative investments are recorded under the equity method. See note 4 for additional

BON SECOURS HEALTH SYSTEM, INC. AND SUBSIDIARIES
Notes to Consolidated Financial Statements
August 31, 2010 and 2009
(In thousands)
13 (Continued)
disclosures of investments and assets limited or restricted as to use. The carrying values of other long-term liabilities approximate fair values. See note 6 for the fair value of long-term debt.
(p) Net Patient Service Revenue
The System has agreements with third-party payors that provide for payments to the System at amounts different from its established rates. Payment arrangements include prospectively determined rates per discharge, reimbursed costs, discounted charges, and per diem payments. Net patient service revenue is reported at estimated net realizable amounts from patients, third-party payors, and others for services rendered, including retroactive adjustments under reimbursement agreements with third-party payors. Retroactive reimbursement adjustments are estimated in the period in which the related services are rendered and adjusted in future periods as final settlements are determined.
(q) Nonoperating Activities, Net
Other activities, which are largely unrelated to the System’s primary mission, are recorded as other nonoperating gains (losses), include rental activities of medical office buildings, school of nursing, general donations, and fund-raising activities.
(r) Performance Indicator
The accompanying consolidated statements of operations include a performance indicator, excess (deficit) of continuing revenues over expenses. Changes in unrestricted net assets that are excluded from the performance indicator, consistent with industry practice, include discontinued operations, unrealized gains and losses on other-than-trading securities, permanent transfers of assets to and from unconsolidated affiliates for other than goods and services, pension and other post retirement adjustments, the System’s allocated share of joint ventures’ change in equity, and contributions of long-lived assets (including assets acquired using contributions, which by donor restriction were to be used for the purpose of acquiring such assets).
(s) Discontinued Operations
The System accounts for discontinued operations under relevant FASB accounting guidance, which requires that a component of an entity that has been disposed of or is classified as held-for-sale and has operations and cash flows that can be clearly distinguished from the rest of the entity be reported as discontinued operations. In the period that a component of an entity has been disposed of or classified as held-for-sale, the results of operations for current and prior periods are reclassified to discontinued operations in the accompanying consolidated statements of operations. The System recognized gains on discontinued operations of $3,421 and $2,441 for the years ended August 31, 2010 and 2009, respectively.
(t) Income Taxes
The System and most of its subsidiaries (including certain joint venture entities) are exempt from federal income taxes under Section 501(c)(3) of the Internal Revenue Code of 1986, as amended. The system accounts for uncertain tax positions in accordance with ASC Topic 740. Income taxes of the System’s for-profit subsidiaries are not material to the accompanying consolidated financial statements. The System’s taxable subsidiaries have approximately $98,300 and $117,200 of net

BON SECOURS HEALTH SYSTEM, INC. AND SUBSIDIARIES
Notes to Consolidated Financial Statements
August 31, 2010 and 2009
(In thousands)
14 (Continued)
operating loss carryforwards as of August 31, 2010 and 2009, respectively, which expire in varying periods through 2030 and are available to offset future taxable income. The System’s deferred tax assets are fully reserved at August 31, 2010 and 2009. Any changes to the valuation allowance on the deferred tax asset are reflected in the year of the change.
(u) Derivative Instruments
ASC Topic 815, Derivatives and Hedging, establishes accounting and reporting standards for derivative instruments, including certain derivative instruments embedded in other contracts (collectively referred to as derivatives) and for hedging activities. An entity is required to recognize all derivatives as either assets or liabilities in the consolidated balance sheets and measure those instruments at fair value. In addition, for those derivative instruments that meet the criteria of an effective hedge, the hedged item must also be recorded at its fair value, with the changes in fair value reflected in other changes in unrestricted net assets.
Derivative instruments, specifically interest rate swaps, are recorded on the balance sheets at their respective fair values. The System’s current derivative instruments do not qualify for hedge accounting, and the changes in fair value of such derivative instruments are reflected in nonoperating investment losses, net in the accompanying consolidated statements of operations in the period of change. Net settlement payments made or received on nonqualifying derivatives are recorded as nonoperating investment losses, net.
(v) Self-Insurance
Under the System’s self-insurance programs (professional/general liability, workers’ compensation, and employee health benefits), claims are reflected as based upon actuarial estimation, including both reported and incurred but not reported claims, taking into consideration the severity of incidents and the expected timing of claim payments.
(w) Reclassifications
Certain prior year amounts have been reclassified to conform to current period presentation, the effect of which is not material.
(x) Recently Issued Accounting Pronouncements
(i) In August 2008, the FASB issued FSP No. FAS 117-1, Endowment of Not-for-Profit Organizations: Net Asset Classification of Funds Subject to an Enacted Version of the Uniform Prudent Management of Institutional Funds Act and Enhanced Disclosures for All Endowment Funds, which was later codified as ASC Topic 958-205 and is effective for fiscal years ending after December 15, 2008. ASC Topic 958-205 provides guidance on the net asset classification of donor-restricted endowment funds for a not-for-profit organization that is subject to an enacted version of the Uniform Prudent Management of Institutional Funds Act of 2006 (UPMIFA). UPMIFA is a model act approved by the Uniform Law Commission that serves as guidance for states to use in enacting legislation. It also enhances disclosures about an organization’s donor-restricted endowment funds and board-designated endowment funds, whether or not the organization is subject to UPMIFA.
BON SECOURS HEALTH SYSTEM, INC. AND SUBSIDIARIES
Notes to Consolidated Financial Statements
August 31, 2010 and 2009
(In thousands)
15 (Continued)
BSHSI has interpreted UPMIFA as requiring the preservation of the fair value of the original gift as of the gift date of the donor-restricted endowment funds absent explicit donor stipulations to the contrary. As a result of this interpretation, BSHSI classifies as permanently restricted net assets (a) the original value of gifts donated to the permanent endowment, (b) the original value of subsequent gifts to the permanent endowment, and, if applicable (c) accumulations to the permanent endowment made in accordance with specific donor instructions. The remaining portion of the donor-restricted endowment fund that is not classified as permanently restricted net assets is classified as temporarily restricted net assets until those amounts are appropriated for expenditure by the System entity that received the donation.
At August 31, 2010, all System entities with the exception of those in Florida are subject to a state law based on UPMIFA. For System entities in Florida, prior law remains in effect until UPMIFA is enacted. They are subject to asset classification guidance in effect prior to ASC Topic 958-205. Under this guidance, earnings on donor-restricted endowment funds that are not either permanently restricted or temporarily restricted for a donor specified purpose are recorded as unrestricted net assets.
The adoption of this guidance did not have a material impact on BSHSI’s consolidated financial statements.
(ii) In December 2008, the FASB issued new guidance relating to employers’ disclosures about postretirement benefit plan assets. Entities are required to disclose investment policies and strategies, major categories of plan assets, inputs, and valuation techniques used to measure the fair value of plan assets, the effect of fair value measurements using significant unobservable inputs (Level 3) on change in plan assets for the period, and significant concentrations of risk within plan assets. The adoption of this new guidance in 2010 did not impact the System’s financial position, results of operations, or cash flows.
(iii) In April 2009, the FASB issued new guidance relating to not-for-profit mergers and acquisitions that will apply prospectively to mergers with merger dates on or after December 15, 2009, and to acquisitions with acquisition dates on or after the beginning of the first annual reporting period beginning on or after December 15, 2009. This new guidance prescribes how to determine whether a combination is a merger or acquisition, how to account for each, and the disclosures that should be made. This guidance does not apply to formations of joint ventures, acquisitions of assets or a group of assets that do not constitute either a business or a nonprofit activity, a combination between not-for-profit entities under common control or transaction or other events where a not-for-profit entity obtains control of another entity but does not consolidate that entity. In addition, under the new guidance, goodwill and indefinite-lived identifiable intangible assets recognized in a not-for-profit entity’s acquisition of a business or nonprofit activity are not amortized. Such assets are tested for impairment at least annually. At the date the statement is initially applied, an entity shall establish its reporting units based on its reporting structure at that date. After establishing its reporting units, goodwill in each reporting unit shall be tested for impairment as of September 1, 2010 upon adoption of the statement and at August 31 annually thereafter. The new guidance also
BON SECOURS HEALTH SYSTEM, INC. AND SUBSIDIARIES
Notes to Consolidated Financial Statements
August 31, 2010 and 2009
(In thousands)
16 (Continued)
requires a not-for-profit reporting entity to account for and present noncontrolling interests in a consolidated subsidiary as a separate component of the appropriate class of consolidated net assets (equity). The adoption of this new guidance will be effective in fiscal year 2011 for the System.
(iv) In May 2009, the FASB issued new guidance related to subsequent events that defines the period after the balance sheet date during which management shall evaluate events or transactions that may occur for potential recognition or disclosure, the circumstances under which an organization shall recognize events occurring after the balance sheet date and the disclosures that an organization shall make about those events or transactions. The guidance defines two types of subsequent events. The first type consists of events or transactions that provide additional evidence about conditions that existed at the date of the balance sheet, including the estimates inherent in the process of preparing financial statements (i.e., recognized subsequent events). The second type consists of events that provide evidence about conditions that did not exist at the date of the balance sheet but arose after that date (i.e., nonrecognized subsequent event). The System adopted this guidance on August 31, 2009, with no impact or change from prior reporting practices.
(v) In January 2010, the FASB issued guidance that clarifies and requires new disclosures about fair value measurements. The clarifications and requirement to disclose the amounts and reasons for significant transfers between Level 1 and Level 2, as well as significant transfers in and out of Level 3 of the fair value hierarchy, is effective for interim and annual reporting periods beginning after December 15, 2009. The new guidance also requires that purchases, sales, issuances, and settlements be presented gross in the Level 3 reconciliation and that requirement is effective for fiscal years beginning after December 15, 2010 and for interim periods within those years, with early adoption permitted. Since this new guidance only amends the disclosure requirements, it did not impact the System’s financial position, results of operations or cash flows.
(vi) In September 2009, the FASB issued Accounting Standards Update (ASU) No. 2009-12, Fair Value Measurements and Disclosures (Topic 820): Investments in Certain Entities That Calculate Net Asset Value Per Share (or Its Equivalent). The guidance amends ASC Topic 820, Fair Value Measurements and Disclosures, and permits, as a practical expedient, fair value of investments within its scope to be estimated using net asset value or its equivalent as of the reporting entity’s measurement date. Net asset value, in many instances, may not equal fair value that would be calculated pursuant to ASC Topic 820. The System adopted this guidance on September 1, 2009 (see note 8).
(vii) In August 2010, the FASB issued ASU No. 2010-23, Health Care Entities (Topic 954): Measuring Charity Care for Disclosure. ASU No. 2010-23 is intended to reduce the diversity in practice regarding the measurement basis used in the disclosure of charity care. ASU No. 2010-23 requires that cost be used as the measurement basis for charity care disclosure purposes and that cost be identified as the direct or indirect cost of providing the charity care, and requires disclosure of the method used to identify or determine such costs. The ASU is

BON SECOURS HEALTH SYSTEM, INC. AND SUBSIDIARIES
Notes to Consolidated Financial Statements
August 31, 2010 and 2009
(In thousands)
17 (Continued)
effective for the System on September 1, 2011. The System is currently evaluating the impact on its disclosures from the adoption of this pronouncement.
(3) Property, Plant, and Equipment, Net
Property, plant, and equipment, net consist of the following at August 31, 2010 and 2009:
2010 2009
Land $ 82,105 77,956 Land improvements 46,400 45,553 Buildings 902,794 899,733 Fixed equipment 66,582 72,241 Major movable equipment 858,379 782,431 Leasehold improvements 63,919 52,806 Construction in progress 124,190 137,552
2,144,369 2,068,272
Less accumulated depreciation 1,066,628 966,559
$ 1,077,741 1,101,713
Included in construction in progress at August 31, 2010 and 2009 are costs mainly associated with an electronic medical records project, facility renovations, and expansions. The System anticipates expending an additional $122,067 in future periods to complete strategic capital projects. Depreciation expense for the System was $122,187 and $121,193 for the years ended August 31, 2010 and 2009, respectively.
(4) Assets Limited or Restricted as to Use
The composition of assets limited or restricted as to use consists of the following at August 31, 2010 and 2009:
2010 2009
Board-designated funds:Cash and cash equivalents $ 81,398 128,894 Equity mutual funds 75,284 61,760 Common and preferred stocks 258,107 277,216 Fixed-income mutual funds 146,269 83,612 Government and agency bonds 803 4,038 Corporate obligations 52,329 45,407 Alternative investments 80,005 50,137 Land and other investments, at cost 901 891
695,096 651,955

BON SECOURS HEALTH SYSTEM, INC. AND SUBSIDIARIES
Notes to Consolidated Financial Statements
August 31, 2010 and 2009
(In thousands)
18 (Continued)
2010 2009
Donor-restricted funds:Cash and cash equivalents $ 11,141 8,998 Equity mutual funds 1,238 804 Common and preferred stocks 2,894 3,020 Fixed-income mutual funds 857 971 Government and agency bonds 437 629 Corporate obligations 1,325 1,172 Land and other investments, at cost 121 497
18,013 16,091
Funds held by indenture trustees:Cash and cash equivalents 26,808 43,444 Government and agency bonds 33,255 8,085 Corporate obligations 15,170 18,523
75,233 70,052
Self-insurance funds:Cash and cash equivalents 6,334 7,523 Equity mutual funds 11,611 11,188 Common and preferred stocks 8,626 7,816 Fixed income mutual funds 33,475 16,090 Corporate obligations 4,486 9,013
64,532 51,630
Assets limited or restricted as to use 852,874 789,728
Available for current liabilities (62,187) (44,090)
Long-term assets limited or restricted as to use $ 790,687 745,638
The portion of the System’s investments available for current liabilities consists of the following at August 31, 2010 and 2009:
2010 2009
Current portion of debt and interest rate swap collateral $ 14,528 7,887 Self-insurance programs 38,460 27,725 Foundation programs 4,758 4,176 General board-designated 4,441 4,302
$ 62,187 44,090

BON SECOURS HEALTH SYSTEM, INC. AND SUBSIDIARIES
Notes to Consolidated Financial Statements
August 31, 2010 and 2009
(In thousands)
19 (Continued)
The System’s consolidated total return on investments consists of the following for the years ended August 31, 2010 and 2009:
2010 2009
Dividends and interest $ 16,201 18,950 Net realized losses on securities (7,610) (87,263) Net unrealized gains (losses) on securities 43,218 (41,134)
51,809 (109,447)
Realized and unrealized losses on derivative instruments (83,168) (57,956)
$ (31,359) (167,403)
Total investment return is classified in the accompanying consolidated financial statements as follows for the years ended August 31, 2010 and 2009:
2010 2009
Nonoperating investment losses, net $ (41,210) (162,145) Investment income (losses), net on trustee-held funds
recorded as other revenue 7,772 (4,667) Investment income and net unrealized losses on
securities in restricted net assets 350 (1,841) Net unrealized gains on other-than-trading securities 1,729 1,250
Total investment return $ (31,359) (167,403)
The System’s ability to generate investment income is dependent in large measure on market conditions. The market value of the System’s investment portfolio, as well as the System’s investment income, have fluctuated significantly in the past and are likely to continue to fluctuate in the future. The System’s investment portfolio assets are designated as trading securities as discussed in ASC Topic 320, Investments – Debt and Equity Securities. The System’s entire portfolio is actively managed by third-party investment managers. Trading generally reflects active and frequent buying and selling, and trading securities are generally used with the objective of generating profits on short-term differences in price. As required by U.S. GAAP, realized and unrealized gains and losses on an investment portfolio designated as a trading portfolio are accounted for as nonoperating investment income and are included in excess (deficit) of revenues over expenses. Because of this designation as a trading portfolio, management anticipates fluctuations in excess (deficit) of revenues over expenses.
At August 31, 2010 and 2009, the System had invested approximately $80,005 and $50,137, or 9.4% and 6.3%, respectively, of the portfolio in alternative investments, which are allocated between hedge funds of funds and real estate investment funds.

BON SECOURS HEALTH SYSTEM, INC. AND SUBSIDIARIES
Notes to Consolidated Financial Statements
August 31, 2010 and 2009
(In thousands)
20 (Continued)
(5) Fair Value of Financial Instruments
The System determines the fair values of its financial instruments based on the fair value hierarchy established in ASC Topic 820, which requires an entity to maximize the use of observable inputs and minimize the use of unobservable inputs when measuring fair value. The standard describes three levels of inputs that may be used to measure fair value:
Level 1: Quoted prices in active markets for identical assets or liabilities. Level 1 assets and liabilities include cash and cash equivalents, debt and equity securities and mutual funds that are traded in an active exchange market, as well as government and agency securities.
Level 2: Observable inputs other than Level 1 prices such as quoted prices for similar assets or liabilities; quoted prices in markets that are not active; or other inputs that are observable or can be corroborated by observable market data for substantially the full term of the assets or liabilities. Level 2 assets and liabilities include debt securities with quoted market prices that are traded less frequently than exchange-traded instruments. This category generally includes certain equity mutual funds, corporate-debt securities, and interest rate swaps.
Level 3: Unobservable inputs that are supported by little or no market activity and that are significant to the fair value of the assets or liabilities. Level 3 assets and liabilities include financial instruments whose value is determined using pricing models, discounted cash flow methodologies, or similar techniques, as well as instruments for which the determination of fair value requires significant management judgment or estimation. This category generally includes certain private debt and equity instruments.
The following discussion describes the valuation methodologies used for financial assets and liabilities measured at fair value. The techniques utilized in estimating the fair values are affected by the assumptions used, including discount rates and estimates of the amount and timing of future cash flows. Care should be exercised in deriving conclusions about the System’s business, its value or consolidated financial position based on the fair value information of financial assets presented below.
Fair value estimates are made at a specific point in time, based on available market information and judgments about the financial asset, including estimates of timing, amount of expected future cash flows, and the credit standing of the issuer. In some cases, the fair value estimates cannot be substantiated by comparison to independent markets. In addition, the disclosed fair value may not be realized in the immediate settlement of the financial asset. In addition, the disclosed fair values do not reflect any premium or discount that could result from offering for sale at one time an entire holding of a particular financial asset. Potential taxes and other expenses that would be incurred in an actual sale or settlement are not reflected in amounts disclosed.
Fair values for the System’s fixed maturity securities are based on prices provided by its investment managers and its custodian bank. Both the investment managers and the custodian bank use a variety of pricing sources to determine market valuations. Each designate specific pricing services or indexes for each sector of the market based upon the provider’s expertise. The System’s fixed maturity securities portfolio is highly liquid, which allows for a high percentage of the portfolio to be priced through pricing services.

BON SECOURS HEALTH SYSTEM, INC. AND SUBSIDIARIES
Notes to Consolidated Financial Statements
August 31, 2010 and 2009
(In thousands)
21 (Continued)
Fair values of equity securities have been determined by the System from observable market quotations, when available. Private placement securities and other equity securities where a public quotation is not available are valued by using broker quotes.
Fair values for the System’s interest rate swaps have been determined using pricing models developed based on the LIBOR swap rate and other observable market data. The values were determined after considering the potential impact of collateralization and netting agreements, adjusted to reflect nonperformance risk of both the counterparty and the System.
The following table presents the System’s fair value hierarchy for those assets and liabilities measured at fair value on a recurring basis as of August 31, 2010:
Fair value measurementsFair at August 31, 2010 usingvalue Level 1 Level 2 Level 3
Financial instruments:Investments:
Cash and cash equivalents $ 125,681 125,681 — — Equity mutual funds 88,133 16,104 72,029 — Common and preferred stocks 269,627 269,627 — — Fixed-income mutual funds 180,601 180,601 — — Government and agency bonds 34,495 34,495 — — Corporate obligations 73,310 15,349 57,961 —
Total investments $ 771,847 641,857 129,990 —
Liabilities:Interest rate swaps $ 135,435 — 135,435 —
Total liabilities $ 135,435 — 135,435 —

BON SECOURS HEALTH SYSTEM, INC. AND SUBSIDIARIES
Notes to Consolidated Financial Statements
August 31, 2010 and 2009
(In thousands)
22 (Continued)
The following table presents the System’s fair value hierarchy for those assets and liabilities measured at fair value on a recurring basis as of August 31, 2009:
Fair value measurementsFair at August 31, 2009 usingvalue Level 1 Level 2 Level 3
Financial instruments:Investments:
Cash and cash equivalents $ 187,524 187,524 — — Equity mutual funds 71,967 — 71,967 — Common and preferred stocks 290,621 290,621 — — Fixed-income mutual funds 100,661 100,661 — — Government and agency bonds 20,527 20,527 — — Corporate obligations 66,903 1,020 65,883 —
Total investments $ 738,203 600,353 137,850 —
Liabilities:Interest rate swaps $ 74,655 — 74,655 —
Total liabilities $ 74,655 — 74,655 —
There were no significant transfers between Level 1 and Level 2 during the year ended August 31, 2010.
The System has incorporated an Investment Policy Statement (IPS) into its investment program. The IPS, which has been formally adopted by the Board of Directors, contains numerous standards designed to ensure adequate diversification by asset category and geography. The IPS also limits investments by manger and position size, and limits fixed-income positions based on credit ratings, which serves to further mitigate the risks associated with the investment program. At August 31, 2010, management believes that its investment positions are in accordance with the guidelines in the IPS.
(6) Long-Term Debt
Long-term debt consists of the following at August 31, 2010 and 2009:
2010 2009
Master Trust Notes and Hospital Revenue Bonds:Series 1992B and 1992C Virginia fixed rate term bonds
payable in installments through August 2027; interestat 5.93% $ 65,943 65,943
Series 1995 Virginia fixed rate serial bonds payable ininstallments through August 2010; interest at 6.00% — 1,640
Series 1995 Maryland fixed rate term bonds payable ininstallments through August 2024; interest at 5.50% 5,400 5,655

BON SECOURS HEALTH SYSTEM, INC. AND SUBSIDIARIES
Notes to Consolidated Financial Statements
August 31, 2010 and 2009
(In thousands)
23 (Continued)
2010 2009
Series 1995 Memorial Regional Medical Center fixed rateserial and term bonds payable in installments throughAugust 2018; interest at 6.375% to 6.500% $ 28,580 31,255
Series 1996 Virginia fixed rate serial and term bondspayable in installments through August 2020; interestat 5.40% to 6.25% 13,780 14,810
Series 1997 Virginia fixed rate serial and term bondspayable in installments through August 2023; interestat 4.70% to 5.25% 13,130 13,910
Series 1997 New York fixed rate serial and term bondspayable in installments through July 2027; interestat 5.00% to 5.50% 34,350 35,555
Series 2002A Kentucky fixed rate term bond payable ininstallments beginning November 2023 throughNovember 2030; interest at 5.625% 42,970 42,970
Series 2002A South Carolina fixed rate and serial termbonds payable in installments beginning November 2015through November 2030; interest at 5.50% to 6.00% 225,200 225,200
Series 2002A Henrico, Virginia fixed rate term bondpayable in installments beginning November 2023through November 2030; interest at 5.60% 46,400 46,400
Series 2002B Florida variable rate demand bond payable ininstallments beginning November 2017 throughNovember 2026 subject to a fifteen day put provision;interest at 0.33% and 0.75% at August 31, 2010 and2009, set at prevailing rates 4,250 4,250
Series 2002B Kentucky variable rate demand bond payablein installments through November 2026 subject to afifteen day put provision; interest at 0.33% and 0.75%at August 31, 2010 and 2009, set at prevailing rates 14,725 15,350
Series 2008B-C Virginia variable rate demand bondssubject to a seven day put provision payable ininstallments beginning November 2032 throughNovember 2042; interest at 0.33% and 0.65% to 0.85%at August 31, 2010 and 2009, set at prevailing rates 173,355 173,355
Series 2008A South Carolina variable rate demand bondssubject to a seven day put provision payable ininstallments beginning November 2032 throughNovember 2042; interest at 0.33% and 0.85% atAugust 31, 2010 and 2009, set at prevailing rates 69,925 69,925
Series 2008D Virginia variable rate demand bonds subjectto a seven day put provision payable in installmentsthrough November 2025; interest at 0.24% to 0.33% atAugust 31, 2010 and 0.20% to 0.80% at August 31,2009, set at prevailing rates 242,840 254,860
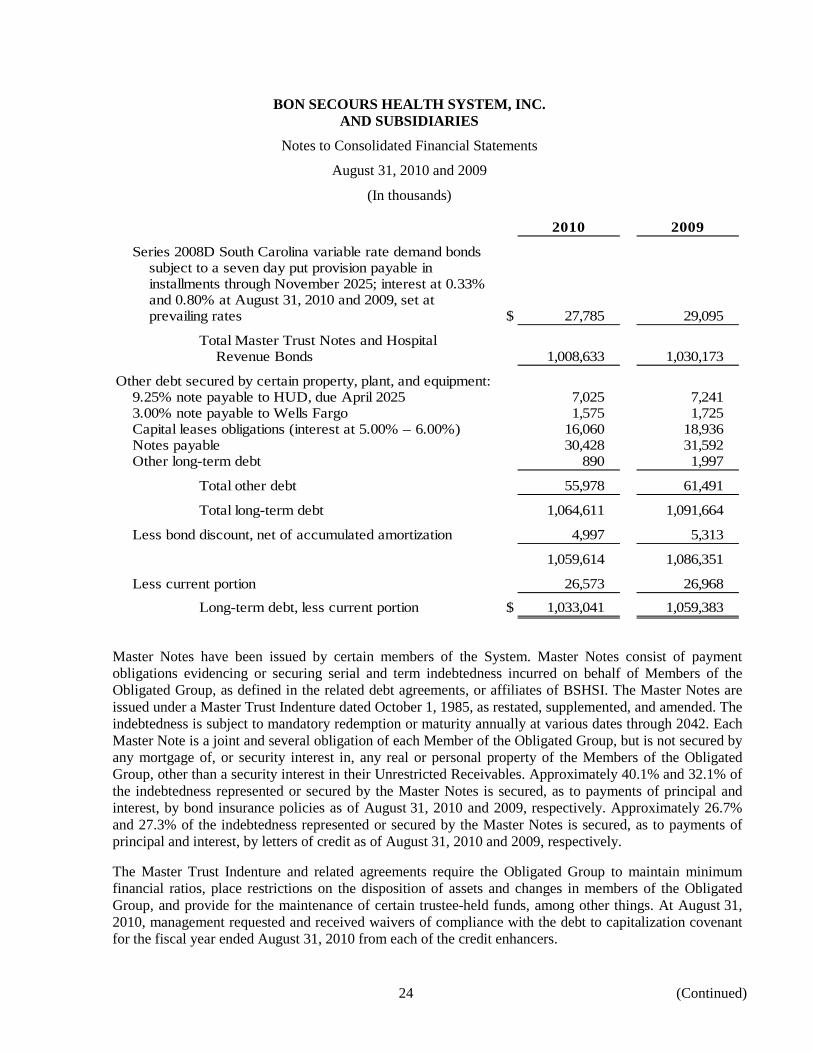
BON SECOURS HEALTH SYSTEM, INC. AND SUBSIDIARIES
Notes to Consolidated Financial Statements
August 31, 2010 and 2009
(In thousands)
24 (Continued)
2010 2009
Series 2008D South Carolina variable rate demand bondssubject to a seven day put provision payable ininstallments through November 2025; interest at 0.33%and 0.80% at August 31, 2010 and 2009, set atprevailing rates $ 27,785 29,095
Total Master Trust Notes and HospitalRevenue Bonds 1,008,633 1,030,173
Other debt secured by certain property, plant, and equipment:9.25% note payable to HUD, due April 2025 7,025 7,241 3.00% note payable to Wells Fargo 1,575 1,725 Capital leases obligations (interest at 5.00% – 6.00%) 16,060 18,936 Notes payable 30,428 31,592 Other long-term debt 890 1,997
Total other debt 55,978 61,491
Total long-term debt 1,064,611 1,091,664
Less bond discount, net of accumulated amortization 4,997 5,313
1,059,614 1,086,351
Less current portion 26,573 26,968
Long-term debt, less current portion $ 1,033,041 1,059,383
Master Notes have been issued by certain members of the System. Master Notes consist of payment obligations evidencing or securing serial and term indebtedness incurred on behalf of Members of the Obligated Group, as defined in the related debt agreements, or affiliates of BSHSI. The Master Notes are issued under a Master Trust Indenture dated October 1, 1985, as restated, supplemented, and amended. The indebtedness is subject to mandatory redemption or maturity annually at various dates through 2042. Each Master Note is a joint and several obligation of each Member of the Obligated Group, but is not secured by any mortgage of, or security interest in, any real or personal property of the Members of the Obligated Group, other than a security interest in their Unrestricted Receivables. Approximately 40.1% and 32.1% of the indebtedness represented or secured by the Master Notes is secured, as to payments of principal and interest, by bond insurance policies as of August 31, 2010 and 2009, respectively. Approximately 26.7% and 27.3% of the indebtedness represented or secured by the Master Notes is secured, as to payments of principal and interest, by letters of credit as of August 31, 2010 and 2009, respectively.
The Master Trust Indenture and related agreements require the Obligated Group to maintain minimum financial ratios, place restrictions on the disposition of assets and changes in members of the Obligated Group, and provide for the maintenance of certain trustee-held funds, among other things. At August 31, 2010, management requested and received waivers of compliance with the debt to capitalization covenant for the fiscal year ended August 31, 2010 from each of the credit enhancers.

BON SECOURS HEALTH SYSTEM, INC. AND SUBSIDIARIES
Notes to Consolidated Financial Statements
August 31, 2010 and 2009
(In thousands)
25 (Continued)
On January 15, 2008, the System completed a bond financing of approximately $243,300 (Series 2008A-C Bonds). The proceeds of the sale of the Series 2008A-C Bonds together with other funds, were used to (i) pay or reimburse, or refinance certain indebtedness, the proceeds of which were used for the payment of the costs of acquiring, constructing, equipping, expanding, enlarging and improving certain healthcare facilities, (ii) refund the outstanding portion of certain prior bonds, which were outstanding with an aggregate principal amount of $80,000, and (iii) pay certain costs incurred in connection with the issuance of the Series 2008A-C Bonds and the refunding of the prior bonds, including the costs of bond insurance policies and liquidity enhancement (in the form of standby bond purchase agreements) for the Series 2008A-C Bonds. The 2008A-C Bonds are bonds remarketed weekly that bear interest at a weekly interest rate established by the market.
The 2008A-C Bonds, while subject to long-term amortization periods, may be put at the option of the bondholders. At such point, the banks would advance funds on behalf of the System to the bondholders under the standby bond purchase agreements. The standby bond purchase agreements have notional amounts of $69,925, $80,695, $46,440, and $46,220; all four of the standby bond purchase agreements have a stated expiration date of January 14, 2013. If funds are advanced on the standby bond purchase agreements to purchase bonds, no payments are due from the System to the bank(s) until 367 days after the bank(s) purchases such bonds. Beginning on the first business day following the 367th day, the System must repay the advances semiannually in equal or near equal amounts over the subsequent four years, unless certain events occur.
On October 17, 2008, the Obligated Group completed a bond financing of approximately $293,600 (referred to as the Series 2008D Bonds). The proceeds of the sale of the Series 2008D Bonds, together with other funds, were used to (i) currently refund and/or purchase all of the outstanding principal amount of the South Carolina Jobs-Economic Development Authority Variable Rate Economic Development Revenue Bonds, Series 2002B (Bon Secours Health System, Inc.) outstanding in the aggregate principal amount of $30,400; (ii) currently refund and/or purchase all of the Economic Development Authority of Hanover County Variable Rate Revenue Bonds, Series 2002B (Bon Secours Health System, Inc.) outstanding in the aggregate principal amount of $31,500; (iii) currently refund and/or purchase all of the Economic Development Authority of Henrico County, Virginia Variable Rate Revenue Bonds, Series 2002B (Bon Secours Health System, Inc.) outstanding in the aggregate principal amount of $53,900; (iv) currently refund and/or purchase all of the Economic Development Authority of the City of Norfolk Variable Rate Revenue Refunding Bonds, Series 2005A (Bon Secours Health System, Inc.) outstanding in the aggregate principal amount of $40,300; (v) purchase and redeem all of the Economic Development Authority of Hanover County Variable Rate Revenue Bonds, Series 2005A outstanding in the aggregate amount of $93,200; (vi) purchase and redeem all of the Economic Development Authority of the City of Norfolk Variable Rate Revenue Bonds, Series 2002B (Bon Secours Health System, Inc.) outstanding in the aggregate amount of $44,300; and (vii) pay-related costs. The Series 2008D Bonds are bonds remarketed weekly that bear interest at a weekly interest rate established by the market.
The Series 2008D Bonds, while subject to long-term amortization periods, may be put at the option of the bondholders. At such point, the banks would advance funds on behalf of the System to the bondholders under the letters-of-credit agreements. The Series 2008D Bonds are secured by six irrevocable direct pay letters of credit issued by agreements between selected banks and the members of the Obligated Group. The irrevocable direct pay letters of credit have notional amounts of $31,500, $53,900, $40,400, $30,400,

BON SECOURS HEALTH SYSTEM, INC. AND SUBSIDIARIES
Notes to Consolidated Financial Statements
August 31, 2010 and 2009
(In thousands)
26 (Continued)
$93,200, and $44,300; all six of the letters of credit have a stated maturity date of October 14, 2011. If funds are advanced on the letters of credit to purchase bonds, no payments are due from the System to the bank(s) until 367 days after the bank(s) purchases such bonds. Beginning on the first business day following the 367th day, the System must repay these advances semiannually in equal or nearly equal amounts over the subsequent three to five years, unless certain events occur. To secure its obligations to reimburse these banks, BSHSI issued separate direct note obligations.
The System recorded a net loss on early retirement of debt of $14,113 as a result of these bond defeasances and refinancing transactions, for the year ended August 31, 2009.
Total interest expense was $34,939 and $48,392 for the years ended August 31, 2010 and 2009, respectively. Cash paid for interest was $28,212 and $45,582 for the years ended August 31, 2010 and 2009, respectively, and includes capitalized interest for construction projects of $1,899 and $2,999, net of investment income, for the years ended August 31, 2010 and 2009, respectively.
Subsequent to year-end, on September 29, 2010, BSHSI terminated six irrevocable direct pay letters of credit that secured Series 2008D variable rate debt bonds. On the same date, BSHSI entered into four new and two amended and restated irrevocable direct pay letters of credit to secure the Series 2008D bonds with stated maturities ranging from September 2013 to September 2015. The direct pay letters of credit have notional amounts of (i) $27,785 Series 2008D SCJEDA; (ii) $28,805 Series 2008D-1 Hanover, VA; (iii) $36,805 Series 2008 D-1 Norfolk, VA; (iv) $42,415 Series 2008D Henrico; (v) $42,050 Series 2008D-2 Norfolk, and (vi) $92,765 Series 2008D-2.
Subsequent to year-end, the Series 2008D Bonds, while subject to long-term amortization periods, may be put at the option of the bondholders. At such point, the banks would advance funds on behalf of the System to the bondholders under the letter-of-credit arrangements. If funds are advanced on the letters of credit to purchase bonds, no payments are due from the System to the bank(s) until 367 days after the bank(s) purchases such bonds. With respect to three of the bank agreements, (i), (ii), and (iii) as described above, the System must repay these advances on the first day of the 13th month succeeding the stated expiration date (currently September 2013). To secure its obligations to reimburse these banks, BSHSI issued separate direct note obligations. With respect to the other three letter-of-credit agreements, (iv), (v), and (vi) as described above, reimbursement to the bank begins on the first business day following the 367th day, and the system must repay these advances semiannually in equal or nearly equal amounts over the subsequent three to five years unless certain events occur. The bonds are remarketed weekly that bear interest at a weekly interest rate established by the market.
Subsequent to year-end, on October 19, 2010, the Obligated Group converted the interest rate mode of $173,355 of the Series 2008B-C bonds from variable interest rate to fixed interest rate. The bonds were converted to fixed rate serial and term bonds. The original variable interest rate bonds were secured by bond insurance policies and four standby bond purchase agreements. The standby bond purchase agreements were terminated on October 19, 2010; however, the bond insurance policies remained in effect. Principal and interest are payable in installments through November 2042 at fixed interest rates ranging from 4.50% to 5.25%.

BON SECOURS HEALTH SYSTEM, INC. AND SUBSIDIARIES
Notes to Consolidated Financial Statements
August 31, 2010 and 2009
(In thousands)
27 (Continued)
The conversion satisfies a one-time covenant for the benefit of certain credit enhancers to cause the percentage of the principal amount of its long-term indebtedness, which bears interest at other than a fixed rate to be reduced to not greater than 40% of the Obligated Group’s long-term indebtedness.
Additionally, on October 19, 2010 the Obligated Group completed a bond financing of $40,740 (referred to as the Series 2010 Bonds). The proceeds of the sale of the Series 2010 Bonds were used to (i) pay the swap termination payment of $38,972 and (ii) pay-related costs of issuance. The Series 2010 Bonds were issued through the Virginia Small Business Financing Authority. The bonds are secured by an irrevocable direct pay letter of credit with a stated maturity of September 2013. The Series 2010 Bonds are bonds remarketed weekly and bear interest at a weekly rate established by the market.
The Series 2010 Bonds, while subject to long-term amortization periods, may be put at the option of the bondholders. At such time, the bank would advance funds on behalf of the System to the bondholders under the letter-of-credit agreement. If funds are advanced on the letter of credit to purchase bonds, no payments are due from the System to the bank(s) until 367 days after the bank(s) purchases such bonds. Beginning on the first business day following the 367th day, the system must repay these advances semiannually in equal or nearly equal amounts over the subsequent three years unless certain events occur. To secure its obligations to reimburse the bank BSHSI issued a direct note obligation.
The fair value of the Master Notes and the underlying indebtedness is $1,020,718 and $1,024,622 as of August 31, 2010 and 2009, respectively. The fair value of the Master Notes was determined by comparing current market prices of similar debt.
Scheduled principal repayments on long-term debt are as follows:
2011 $ 26,573 2012 27,804 2013 26,058 2014 28,239 2015 48,129 Thereafter 907,808
Total $ 1,064,611
The System has entered into four leases maturing in 5 – 10 years that are classified as capital leases for building and equipment. In addition, the System has consolidated two limited liability corporations with amounts outstanding under notes totaling $30,428 as of August 31, 2010. Such notes have an interest rate of 7.75% and maturity dates in 2021.
(7) Interest Rate Risk Management
The System uses fixed and variable-rate debt to finance capital needs and develop an appropriate debt structure. Variable-rate debt exposes the System to variability in interest expense due to changes in interest rates. Conversely, fixed-rate debt obligations can be more expensive to the System in times of declining interest rates. The System manages and monitors its cost of capital on a regular basis and from time to time enters into derivative instruments with financial institutions to help manage interest rate risk.

BON SECOURS HEALTH SYSTEM, INC. AND SUBSIDIARIES
Notes to Consolidated Financial Statements
August 31, 2010 and 2009
(In thousands)
28 (Continued)
At August 31, 2010 and 2009, the System had fifteen and fourteen derivative instruments, respectively, which did not qualify for hedge accounting treatment under ASC Topic 815. Fair value changes of these instruments were reported under nonoperating investment losses, net. The following is a summary of the derivative instruments in place at August 31, 2010:
O utstanding Collateralnotional Maturity posted at Mark to Collateral
Description Number amount Pay rates dates 8/31/10 Counterparties market thresholds
Fixed payor 1 $ 61,410 3.448% Nov-2025 $ — Goldman $ (7,656) 10,000 Sachs
Fixed payor 1 92,115 3.491 Nov-2025 — Deutsche Bank (11,733) 20,000 Fixed payor 2 133,075 3.420/ Aug-2026/ — Merrill Lynch (25,792) *
4.460 Nov-2028Fixed payor 2 128,950 3.384/ Oct-2025/ 11,199 JP Morgan (27,739) 15,000
4.485 Oct-2026Fixed payor 1 69,925 3.454 Nov-2042 — Citigroup (16,555) *Fixed payor † 1 46,440 3.454 Nov-2042 — Citigroup (10,995) *Fixed payor † 3 126,915 3.454 Nov-2042 — Citigroup (30,048) *
11 658,830 11,199 (130,518)
Fixed basis 1 200,000 SIFMA Jan-2029 — Citigroup (2,762) 20,000 Variable basis 3 512,500 SIFMA Nov-2029 — Merrill Lynch (16,079) *
Total derivatives 15 $ 1,371,330 $ 11,199 (149,359) $ 65,000
Valuation adjustments 13,924
$ (135,435) * Derivative instrument does not provide for the posting of collateral.† Derivative instrument terminated subsequent to year-end as described below.
The following is a summary of the derivative instruments in place at August 31, 2009:
O utstanding Collateralnotional Maturity posted at Mark to Collateral
Description Number amount Pay rates dates 8/31/10 Counterparties market thresholds
Fixed payor 1 $ 165,850 3.250% Nov-2025 $ — Merrill Lynch $ (11,018) *Fixed payor 2 138,350 3.420/ Aug-2026/ — Merrill Lynch (17,975) *
4.460 Nov-2028Fixed payor 2 131,000 3.384/ Oct-2025/ 4,782 JP Morgan (19,628) 15,000
4.485 Oct-2026Fixed payor 1 69,925 3.454 Nov-2042 — Citigroup (8,020) *Fixed payor 1 46,440 3.454 Nov-2042 — Citigroup (5,326) *Fixed payor 3 126,915 3.454 Nov-2042 — Citigroup (14,556) *
10 678,480 4,782 (76,523)
Fixed basis 1 200,000 SIFMA Jan-2029 — Citigroup 190 20,000 Variable basis 3 213,100 SIFMA Nov-2029 — Merrill Lynch (9,086) 35,000
Total derivatives 14 $ 1,091,580 $ 4,782 (85,419) $ 70,000
Valuation adjustments 10,764
$ (74,655) * Derivative instrument does not provide for the posting of collateral.
BON SECOURS HEALTH SYSTEM, INC. AND SUBSIDIARIES
Notes to Consolidated Financial Statements
August 31, 2010 and 2009
(In thousands)
29 (Continued)
The unrealized losses of $60,732 and $39,239 for the years ended August 31, 2010 and 2009, respectively, relating to these nonqualifying derivative activities are recorded within nonoperating investment losses, net in the accompanying consolidated statements of operations.
The System utilizes a diversified group of swap counterparties and has sought to limit its obligations to post collateral in the agreements governing its derivative instruments. In addition, the System routinely evaluates its derivative portfolio and may decide at any time to terminate certain of the derivative instruments discussed above and/or enter into new derivative instruments. Should the System decide to terminate any of such instruments, it may be required to make termination or breakage payments under the terms of those instruments.
On September 28, 2010, the System terminated four fixed payor swaps with a notional value of $173,355 that were integrated with the Series 2008B-C bonds converted from variable rate to fixed interest rate bonds. On October 19, 2010, the System paid $38,972 to the counterparty to terminate these swaps.
(8) Pension Plan
Most of the System’s employees are covered by one of the System’s several noncontributory defined benefit pension plans, while a portion are covered by defined contribution retirement plans. The System’s noncontributory defined benefit pension plans provide benefits based upon age at retirement, years of credited services, and average earnings. Twelve of the System’s thirteen defined benefit plans are deemed church plans under the Internal Revenue Code. For defined benefit pension plans deemed to be church plans under the Internal Revenue Code, the System’s funding policy is to make contributions to fund the annual service cost of the plans. Defined benefit pension plans that are subject to the Employee Retirement Income Security Act of 1974 guidelines are funded in accordance with those guidelines. The service cost and projected benefit obligation are based upon the projected unit credit actuarial method.
The investment policy and objectives for defined benefit plan assets are established by BSHSI and are based on a long-term perspective. An investment advisory firm engaged by BSHSI reviews asset performance and allocation on a periodic basis throughout the fiscal year. The percentage allocation to each asset class may vary depending upon market conditions and is adjusted when it falls outside the established ranges set for each asset class.

BON SECOURS HEALTH SYSTEM, INC. AND SUBSIDIARIES
Notes to Consolidated Financial Statements
August 31, 2010 and 2009
(In thousands)
30 (Continued)
The following are deferred pension costs, which have not yet been recognized in periodic pension expense but are accrued in unrestricted net assets, as of August 31, 2010 and 2009. Unrecognized actuarial losses represent unexpected changes in the projected benefit obligation and plan assets over time, primarily due to changes in assumed discount rates and investment experience. Unrecognized prior service cost is the impact of changes in plan benefits applied retrospectively to employee service previously rendered. Deferred pension costs are amortized into annual pension expense over the expected average remaining assumed service period for active employees.
Amounts Amounts Amounts inin unrestricted in unrestricted unrestrictednet assets at net assets at net assets to beAugust 31, August 31, recognized in
2010 2009 fiscal year 2011
Net prior service cost $ 964 1,963 325 Net actuarial losses 281,900 231,293 16,518 Transition asset (29) (36) (7)
Total $ 282,835 233,220 16,836
The components of the funded status, net periodic benefit costs, and actuarial assumptions used in accounting for defined benefit pension plans for the years ended August 31, 2010 and 2009 are as follows:
2010 2009
Change in projected benefit obligation:Net projected benefit obligation at beginning of year $ 643,771 535,638 Service cost 20,256 16,297 Interest cost 37,489 35,988 Actuarial loss 50,632 80,150 Plan amendments (583) — Gross benefits paid (24,118) (24,302)
Projected benefit obligation at end of year 727,447 643,771
Change in plan assets:Fair value of plan assets at beginning of year 353,824 400,602 Actual return on plan assets 26,218 (47,020) Employer contributions 20,667 24,544 Gross benefits paid (24,118) (24,302)
Fair value of plan assets at end of year 376,591 353,824
Net amount recognized at end of year $ (350,856) (289,947)

BON SECOURS HEALTH SYSTEM, INC. AND SUBSIDIARIES
Notes to Consolidated Financial Statements
August 31, 2010 and 2009
(In thousands)
31 (Continued)
2010 2009
Accumulated benefit obligation at end of year $ 680,879 602,195
Amounts recognized in the consolidated balance sheetsconsist of:
Accrued benefit costs – long term $ (350,856) (289,947)
Components of net periodic benefit cost:Service cost $ 20,256 16,297 Interest cost 37,489 35,988 Expected return on plan assets (34,591) (35,474) Amortization of:
Actuarial loss 8,397 453 Prior service cost 416 416 Transition asset (7) (7)
Total net periodic benefit costs $ 31,960 17,673
2010 2009
Weighted average assumptions used to determine benefitobligations at August 31:
Discount rate 5.30% 5.80%Rate of compensation increase 3.50 3.50
Weighted average assumptions used to determine net periodicbenefit cost at August 31:
Discount rate 5.80% 6.70%Expected return on plan assets 7.80 7.80Rate of compensation increase 3.50 4.00
Net pension expense is included as a component of fringe benefits recorded as salaries, wages, and benefits in the accompanying consolidated statements of operations.
The expected long-term rate of return of the pension plan assets used for determining pension expense was 7.80% and was determined based upon a review of the System’s long-term rate of return experienced in the capital markets for the target asset allocation employed to invest pension assets.

BON SECOURS HEALTH SYSTEM, INC. AND SUBSIDIARIES
Notes to Consolidated Financial Statements
August 31, 2010 and 2009
(In thousands)
32 (Continued)
The System’s pension plan asset allocation is planned to include approximately 65% equities, 30% fixed income/cash, and 5% alternatives. Equity investments are balanced between type and size of investment and investment managers are monitored against benchmarks. Pension plan assets at August 31, 2010 and 2009 by asset category are as follows:
2010 2009
Equity mutual funds and securities 60% 67%Fixed-income mutual funds and securities 32 25Alternative investments 5 —Cash 3 8
Total 100% 100%
The following table presents the System’s fair value hierarchy for the pension plan assets measured at fair value on a recurring basis as of August 31, 2010:
Fair Fair value measurementsvalue Level 1 Level 2 Level 3
Investments:Cash and cash equivalents $ 11,511 11,511 — — Equity mutual funds 51,035 7,537 43,498 — Common and preferred stocks 174,029 174,029 — — Fixed-income mutual funds 87,132 87,132 — — Corporate obligations 33,129 — 33,129 — Alternative investments 19,755 — — 19,755
Total investments $ 376,591 280,209 76,627 19,755
There were no significant transfers between Level 1 and Level 2 during the year ended August 31, 2010.
The change in the fair value for the pension assets valued using significant unobservable inputs (Level 3) was due to the following:
Level 3 assetsfixed Alternative
maturities investments Total
Beginning balance September 1, 2009 $ — — — Total net gains realized 2 — 2 Total net gains unrealized — 255 255 Purchases, sales, issuances
and settlements (2) 19,500 19,498
Ending balance August 31, 2010 $ — 19,755 19,755

BON SECOURS HEALTH SYSTEM, INC. AND SUBSIDIARIES
Notes to Consolidated Financial Statements
August 31, 2010 and 2009
(In thousands)
33 (Continued)
Effective September 1, 2009 the System adopted ASU No. 2009-12, and applied its provisions to its pension plan asset portfolio. The guidance amends ASC Topic 820 and permits, as a practical expedient, fair value of investments within its scope to be estimated using net asset value or its equivalent. The alternative investments classified within Level 3 of the fair value hierarchy have been recorded using Net Asset Value (NAV).
The following summarizes redemption and commitment terms for the alternative investment vehicles held in the pension plan assets as of and for the year ended August 31, 2010:
Pension Plan Alternative Investment Terms as of August 31, 2010
Hedge fund Real estate
Redemption timing:Redemption frequency Monthly SemiannuallyRequired notice 70 days 60 days
Audit reserve:Percentage held back for audit reserve 10% —%
Gates:Potential gate holdback —% —%Potential gate release timeframe n/a n/aUnfunded commitments $ — —
The System expects to contribute $38,437 to its pension plans in fiscal year 2011.
Future pension benefit payments, which reflect expected future service, as appropriate, are expected as follows:
Fiscal year:2011 $ 39,971 2012 28,896 2013 31,589 2014 34,745 2015 35,930 2016 – 2020 217,222
The System also has various contributory, tax-deferred annuity, and savings plans with participation available to certain employees. The System matches employee contributions up to 7% of compensation under certain defined contribution plans. The System contributed approximately $14,202 and $12,885 towards these plans during the years ended August 31, 2010 and 2009, respectively. Total expense was $15,537 and $14,279 in 2010 and 2009, respectively.
In addition to the retirement plan described above, other postretirement healthcare benefits are provided to certain qualified retirees who meet certain eligibility requirements. The net obligation recognized in the accompanying consolidated balance sheets at August 31, 2010 and 2009 is $3,812 and $3,932, respectively.

BON SECOURS HEALTH SYSTEM, INC. AND SUBSIDIARIES
Notes to Consolidated Financial Statements
August 31, 2010 and 2009
(In thousands)
34 (Continued)
(9) Reimbursement Programs
The System participates in the Medicare and Medicaid programs. Payment rates for inpatient services provided to program beneficiaries are governed by the applicable regulations and implementation provisions thereunder, based generally on prospectively determined rates using clinical and diagnostic charges. Capital costs are also generally based upon prospectively determined rates. However, certain services are subject to cost-based reimbursement principles, subject to certain limitations. The System also participates in Blue Cross and other managed care programs. Generally, these programs provide for payments based on negotiated rates; however, certain plans utilize cost-based or charge-based payment principles.
Programs utilizing cost-based reimbursement principles are subject to review and final determination by appropriate program representatives. In the opinion of management, adequate provision has been made for any adjustments that may result from such reviews. Due to third-party payors, net, is included in other accrued expenses in the accompanying consolidated balance sheets.
In 2005, the Centers for Medicare and Medicaid Services (CMS) implemented a new demonstration project using recovery audit contractors (RACs) as part of the CMS’s further efforts to assure accurate patient payments. The project uses the RACs to search for potentially inaccurate Medicare payments that may have been made to healthcare providers and that were not detected through existing CMS program integrity efforts. Once a RAC identifies a claim it believes is inaccurate, it makes a deduction from or addition to the provider’s Medicare reimbursement in an amount estimated to equal the overpayment or underpayment. The five-state pilot program concluded in March 2008 with a nationwide rollout in phases beginning in 2009. The experience during the pilot indicated that the RACs identified more overpayments than were ultimately verified and CMS expanded the pilot program into a permanent program. Following completion of the pilot program, certain System affiliates have been the subject of RAC audits. As of August 31, 2010, the BSHSI hospitals in Kentucky, South Carolina, and New York had received notices. To date, the BSHSI hospitals in South Carolina and New York have had no Medicare claims denied and the BSHSI hospital in Kentucky has had a nominal amount of claims denied. Additional RAC assessments against the System are anticipated; however, the outcome of such assessments is unknown and cannot be reasonably estimated.
In 2008 and 2009, State Medicaid Integrity Programs (referred to as MIPs) were initiated by CMS through contractors. Virginia, Florida, and New York are the only states in which BSHSI operates where MIP audits have been initiated. As of August 31, 2010, MIP audits have been initiated at five BSHSI hospitals in Virginia and one hospital in New York. One Virginia facility has received a clean audit report and the remaining four are static while CMS replaces the original contractor. The outcome of the four Virginia and one New York open audit reports is uncertain and cannot be reasonably estimated.
The System’s management strives to anticipate factors that affect payment changes and develop plans to address them. Management attempts to address these issues proactively through its policies and practices that focus on areas such as charity and uninsured care as well as effective managed care contracting, accounts receivable and revenue cycle best practices and analysis of potential government payment changes. Nonetheless, future actions by federal, state, and private payors could have a significant adverse effect on the System’s operating results, cash flows, and liquidity. In addition, management pursues the highest level of compliance, but state and federal audits by the Offices of the Inspector General’s do create

BON SECOURS HEALTH SYSTEM, INC. AND SUBSIDIARIES
Notes to Consolidated Financial Statements
August 31, 2010 and 2009
(In thousands)
35 (Continued)
uncertainty. At this time, the System has one audit underway. The outcome of this audit is uncertain and the impact cannot be reasonably estimated at this time.
As a result of recently enacted federal healthcare reform legislation, substantial changes are anticipated in the U.S. healthcare system. Such legislation includes numerous provisions affecting the delivery of healthcare services, the financing of healthcare costs, reimbursement of healthcare providers, and the legal obligations of health insurers, providers, and employers. These provisions are currently slated to take effect at specified times over approximately the next decade.
(10) Investments in Joint Ventures and Nonpublic Entities
The System has invested in a number of joint ventures, limited liability corporations and other nonpublic entities to provide specialty healthcare services or engage in other activities. These investments range from minority investments with no control to majority investments or investments with control.
(a) Roper St. Francis Healthcare – South Carolina
BSHSI, The Medical Society of South Carolina, and the Carolinas Health System, Inc. are members of Care Alliance Health Services (d/b/a Roper St. Francis Healthcare). Roper St. Francis Healthcare is the sole member of and operates Bon Secours – St. Francis Xavier Hospital, Roper Hospital, a supporting foundation and physician practices located in Charleston, South Carolina. BSHSI is obligated to provide 27% of any capital contribution to Roper St. Francis Healthcare and is entitled to 27% of any surplus capital. BSHSI accounts for its interest in Roper St. Francis Healthcare under the equity method and includes its interest in Roper St. Francis Healthcare’s excess of revenue over expenses in its consolidated statements of operations as other revenue. Roper St. Francis Healthcare, The Medical Society of South Carolina, and the Carolinas Health System, Inc. are not otherwise affiliated with BSHSI and are not Members of the Obligated Group.
The System recorded income of $6,332 and $498 related to its equity interest for the years ended August 31, 2010 and 2009, respectively. Included in these amounts were the System’s allocated share of investment gains (losses) of $1,842 and $(5,234) for the years ended August 31, 2010 and 2009, respectively. In addition, adjustments of $1,091 and $(665) were recorded as net change in equity of joint ventures in 2010 and 2009, respectively, to reflect the System’s 27% interest in the net assets of this joint venture.

BON SECOURS HEALTH SYSTEM, INC. AND SUBSIDIARIES
Notes to Consolidated Financial Statements
August 31, 2010 and 2009
(In thousands)
36 (Continued)
The total assets, total liabilities, and net assets as of August 31, 2010 and 2009 and the total revenue, total expenses, investment gains (losses), net, and change in unrestricted net assets for the twelve months then ended for Roper St. Francis Healthcare are as follows:
2010 2009
Total assets $ 813,943 783,257 Total liabilities 508,414 486,156 Net assets 305,529 297,101 Total revenue 708,449 649,162 Total expenses 691,815 627,932 Investment gains (losses), net 6,822 (19,385) Change in unrestricted net assets 22,327 (11,132)
In May 2008, Roper St. Francis Healthcare began construction of a third 85-bed general acute care hospital and a medical office building, which opened on November 1, 2010. In addition, in June 2009, Roper St. Francis Healthcare received state approval for the construction of an additional 50-bed general acute care hospital located in Berkeley County, South Carolina. The approval of this project is currently under appeal at the request of a local hospital that also received state approval for a 50-bed facility. These capital construction projects will be financed through Roper St. Francis Healthcare’s equity. Distributions are expected to be foregone during this construction period.
(b) Bon Secours Holy Family Regional Health System – Pennsylvania
On November 1, 2004, Bon Secours Holy Family Regional Health System, which owned and operated Bon Secours Holy Family Hospital (now known as Bon Secours Hospital), located in Altoona, Pennsylvania, merged with Altoona Hospital, Inc. to form ARHS. ARHS owns and operates Altoona Hospital and Bon Secours Hospital. Central Pennsylvania Health Services Corporation holds a 90% membership interest in ARHS and BSHSI holds the remaining 10% membership interest. BSHSI records its membership interest in ARHS under the equity method due to the extent of its board powers, and includes its interest in ARHS’s change in net assets in its consolidated statements of operations as other revenue. Considering the System’s ability to influence ARHS, the System records its investment on the equity method.
The System recorded a net gain of $279 and $189 related to its equity interest in ARHS for the years ended August 31, 2010 and 2009, respectively.
The ARHS bylaws provide that upon the occurrence of certain defined events and dates, ARHS may exercise a “call” option to purchase BSHSI’s membership interest in ARHS at fair value. The ARHS bylaws also provide that upon the occurrence of certain defined events and dates BSHSI may exercise a “put” option to require ARHS to purchase BSHSI’s membership interest in ARHS at fair value. If a put or call option is exercised, the purchase price for BSHSI’s membership interest in ARHS would be based on an independent fair market valuation of ARHS as a whole, multiplied by BSHSI’s membership interest percentage in ARHS. If an option is exercised at any time prior to November 1, 2012, the payment made by ARHS to BSHSI will be offset by a portion of the fees previously paid to BSHSI for corporate services in an amount equal to the lesser of (i) $10,000 or (ii) fifty-five and one-half percent (55.5%) of such payments.

BON SECOURS HEALTH SYSTEM, INC. AND SUBSIDIARIES
Notes to Consolidated Financial Statements
August 31, 2010 and 2009
(In thousands)
37 (Continued)
During June 2010, BSHSI and ARHS obtained an independent valuation of AHRS. At November 1, 2010, BSHSI exercised its “put” option. Upon Vatican approval, BSHSI would withdraw as a member of AHRS and would receive a distribution for their share. This transaction is expected to have minimal effect upon BSHSI’s financial position, results of operations, or cash flows.
(11) Other Commitments and Contingent Liabilities
(a) General and Professional Liability Insurance
The System participates in a self-insurance program for health professional/general liability (HPL/GL Program) by policies issued under a member of the System, Bon Secours Assurance Company, LTD (BSAC). BSAC is incorporated in the Cayman Islands. BSHSI is the sole shareholder of BSAC. Assets are available under the HPL/GL Program to provide specified levels of claims-made coverage for health professional liabilities and occurrence-based coverage for general liabilities, with excess layers obtained through commercial carriers under policies written on a claims-made basis.
The provision for claims and related funding levels for the HPL/GL Program is established annually based upon the recommendations of consulting actuaries. BSAC has accrued claims including liabilities for incidents incurred but not reported of approximately $69,958 and $58,527 at August 31, 2010 and 2009, respectively. The current portion of such accruals is included in other accrued expenses, and the remainder is reported within other long-term liabilities in the accompanying consolidated balance sheets. Amounts recorded for unpaid claims are based upon the estimated present value of future claim payments and such amounts are undiscounted and based upon an actuarial estimate.
(b) Workers’ Compensation Insurance
The System’s workers’ compensation program primarily consists of self-insurance programs in various states with excess coverage through a commercial insurer. Mary Immaculate Hospital, which is also a participant of the System’s workers’ compensation program, is insured under a large deductible policy. Accrued workers’ compensation claims of $29,521 and $26,221, of which the current portion is reported as other accrued expenses and the remainder is reported within other long-term liabilities in the accompanying consolidated balance sheets, include estimates for incidents incurred but not reported at August 31, 2010 and 2009, respectively. Amounts recorded for unpaid claims are based upon the estimated present value of future claim payments using a discount rate of 3.50%, as of August 31, 2010 and 2009, respectively.
(c) Employee Health Insurance
Employee health benefits of the System are principally provided through the System’s self-insurance program. Accrued claims associated with this program, reported as other accrued expenses in the accompanying consolidated balance sheets, of approximately $14,739 and $12,048 include estimates for claims incurred but not reported at August 31, 2010 and 2009, respectively.

BON SECOURS HEALTH SYSTEM, INC. AND SUBSIDIARIES
Notes to Consolidated Financial Statements
August 31, 2010 and 2009
(In thousands)
38 (Continued)
(d) Litigation
The healthcare industry is subject to numerous laws and regulations from federal, state, and local governments. The System’s compliance with these laws and regulations can be subject to periodic governmental review and interpretation, which can result in regulatory action unknown or unasserted at this time. Management is aware of certain asserted and unasserted legal claims and regulatory matters arising in the ordinary course of business. It is management’s opinion that the ultimate resolution of these pending claims and regulatory matters will not have a material adverse effect on the System’s consolidated results of operations or financial position.
(e) Operating Leases
Leases that do not meet the criteria for capitalization are classified as operating leases with related rentals charged to operations as incurred. Total rental expense was $82,830 and $69,488 in 2010 and 2009, respectively. Future rental payments under noncancelable operating leases with durations in excess of one year are as follows:
2011 $ 59,847 2012 49,575 2013 37,085 2014 31,017 2015 24,633 Thereafter 67,493
Certain local systems entered into agreements to lease space in medical office buildings (MOBs) under construction by external development companies. Based on the provisions of ASC Topic 840-40-05-5, Lessee Involvement with Construction, local systems were considered the owner of the MOBs during construction. These transactions do not qualify for sale-leaseback accounting and as such are treated as financing transactions. Accordingly, the associated financing obligations, along with their related construction in progress or building assets of $40,070 at August 31, 2010 and 2009, are included in other long-term liabilities and construction in progress or buildings and equipment in the accompanying consolidated balance sheets. The financing obligations associated with these transactions will not result in cash payments in excess of amounts paid under the related operating lease payments. All future cash obligations related to leased space within these MOBs are included as future minimum lease payments in the amounts reported above.
Subsequent to August 31, 2010, the System has entered into additional operating leases and developments as a matter of ongoing business.
(f) Guaranty Agreements
Affiliates of the System entered into several limited partnership agreements during the period from 1997 through 2010. The limited partnerships are involved in housing projects in the System’s Baltimore market. System affiliates have entered into guaranty agreements with the limited partnerships during 1997 through 2010, whereby they have agreed to advance funds to the partnerships under specified conditions. The termination of each guaranty agreement is predicated on the occurrence of certain events. All such guaranty agreements are still in effect as of August 31,

BON SECOURS HEALTH SYSTEM, INC. AND SUBSIDIARIES
Notes to Consolidated Financial Statements
August 31, 2010 and 2009
(In thousands)
39 (Continued)
2010. System affiliates have not been obligated to make any guarantee payments under the guaranty agreements to date through August 31, 2010. The maximum potential amount of future payments the System affiliates are obligated to make was $5,583 and $4,776 as of August 31, 2010 and 2009, respectively.
(12) Net Assets
BSHSI’s endowments consist of approximately 75 individual funds established for a variety of purposes. Net assets associated with endowment funds, including board-designated funds, are classified and reported based on the existence or absence of donor or board-imposed restrictions and the nature of the restrictions, if any.
The System’s endowment net assets are comprised of permanently restricted funds, which were $6,755 and $6,641 at August 31, 2010 and 2009, respectively. The System does not hold any board-designated endowment funds within unrestricted net assets or temporarily restricted net assets.
From time to time, the fair value of assets associated with individual donor-restricted endowment funds may fall below the level that the donor or UPMIFA requires the System to retain as a fund of perpetual duration. Deficiencies of this nature are reported in unrestricted net assets. There were no significant deficiencies at August 31, 2010 and 2009.
The System has investment and spending policies for endowment assets that attempt to provide a predictable stream of funding to programs supported by its endowment while seeking to maintain the purchasing power of the endowment assets. Endowment assets include those assets of donor-restricted funds that the System must hold in perpetuity or for a donor-specified period as well as board-designated funds. The practice allows the endowment assets to be invested in a manner that is intended to produce investment returns that exceed the price and yield the results of the allocation index while assuming a moderate level of investment risk. The System expects its endowment funds to provide a rate of return that preserves the gift and generates earnings to achieve the endowment purpose.
To satisfy its long-term rate-of-return objectives, the System relies on a total return strategy in which investment returns are achieved through both capital appreciation (realized and unrealized) and interest and dividend income. The System uses diversified asset allocation to achieve its long-term return objectives within prudent risk constraints to preserve capital.
BSHSI has a practice of distributing the major portion of current year earnings on the endowment funds, if the restrictions have been met. This is consistent with the System’s objective to maintain the purchasing power of the endowment assets held in perpetuity as well as to provide additional real growth through new gifts and investment return.

BON SECOURS HEALTH SYSTEM, INC. AND SUBSIDIARIES
Notes to Consolidated Financial Statements
August 31, 2010 and 2009
(In thousands)
40
(13) Functional Expenses
The functional breakdown of expenses incurred by the System in fulfilling its mission for the years ended August 31, 2010 and 2009 is as follows:
2010 2009
Healthcare services $ 2,700,692 2,535,781 General and administrative 282,496 281,753
Total expenses $ 2,983,188 2,817,534
(14) Subsequent Events
Management evaluated all events and transactions that occurred after August 31, 2010 and through November 11, 2010. The System did not have any material recognizable subsequent events during this period, other than the transactions previously disclosed in the accompanying notes or as described below.
On October 20, 2010, BSHSI’s board of directors approved 8 entities in Richmond and Hampton Roads to enter into a definitive agreement to sell certain operating assets related to the entities’ outreach clinical reference laboratory services. These outreach lab services contribute less than 1.0% of the System’s total revenue during the fiscal year ended August 31, 2010 and the assets to be sold are less than 0.1% of the System’s net assets at August 31, 2010.

41
BON SECOURS HEALTH SYSTEM, INC. AND SUBSIDIARIES
Index to Consolidating Obligated Group and Non-Obligated Group Information
Independent Auditors’ Report on Supplementary Information
Schedule 1 – Consolidating Schedule of Balance Sheet Information at August 31, 2010
Schedule 2 – Consolidating Schedule of Operations for the year ended August 31, 2010
Note: The “Obligated Group’ is defined in Section 1.01 of the Master Trust Indenture, as amended dated as of October 1, 1985 by the among Bon Secours Health System, Inc., certain affiliated corporations and Mellon Bank. N.A., as Master Trustee.

KPMG LLP 1 East Pratt Street Baltimore, MD 21202-1128
KPMG LLP is a Delaware limited liability partnership, the U.S. member firm of KPMG International Cooperative (“KPMG International”), a Swiss entity.
42
Independent Auditors’ Report on Supplementary Information
Board of Directors Bon Secours Health System, Inc. and Subsidiaries:
We have audited and reported separately herein on the consolidated financial statements of Bon Secours Health System, Inc. and subsidiaries as of and for the years ended August 31, 2010 and 2009.
Our audits were made for the purpose of forming an opinion on the consolidated financial statements of Bon Secours Health System, Inc. and subsidiaries taken as a whole. The consolidating information in Schedules 1.1 through 2.3 is presented for purposes of additional analysis of the consolidated financial statements rather than to present the financial position and results of operations of the individual reporting entities. The schedules have been subjected to the auditing procedures applied in the basic audits of the consolidated financial statements, and, in our opinion, are fairly stated in all material respects in relation to the consolidated financial statements taken as a whole.
November 11, 2010

BON SECOURS HEALTH SYSTEM, INC. AND SUBSIDIARIES
Consolidating Schedule - Balance Sheet InformationObligated and Non-Obligated Group Members
(in thousands)
August 31, 2010
Schedule 1.1
See accompanying independent auditors' report
Combined
Obligated
Group
Combined
Non-Obligated
Group
Consolidating
Eliminations
Consolidated
Bon Secours
Health
System, Inc.
ASSETS
Current assets:
Cash and cash equivalents $ 332,045 45,414 (197,204) 180,255
Accounts receivable, net 278,317 85,365 (137) 363,545
Assets limited or restricted as to use 37,193 24,995 (1) 62,187
Inventories 41,188 8,043 0 49,231
Prepaid expenses and other current assets 17,733 8,421 (4,601) 21,553
Total current assets 706,476 172,238 (201,943) 676,771
Assets limited or restricted as to use, less current portion 688,041 102,646 0 790,687
Property, plant, and equipment, net 874,588 203,153 0 1,077,741
Deferred financing costs, net 12,734 40 0 12,774
Goodwill and other assets, net 214,188 26,821 0 241,009
$ 2,496,027 504,898 (201,943) 2,798,982
LIABILITIES, MINORITY INTEREST, AND NET ASSETS
Current liabilities:
Current portion of long-term debt $ 24,053 2,520 0 26,573
Accounts payable 142,314 27,737 (177) 169,874
Accrued salaries, wages, and benefits 115,238 37,525 0 152,763
Other accrued expenses 70,044 34,137 (4,739) 99,442
Due to (from) affiliate (21,199) 21,022 177 0
Total current liabilities 330,450 122,941 (4,739) 448,652
Long-term debt, less current portion 988,220 44,820 1 1,033,041
Due to (from) affiliate, less current portion (15,889) 213,348 (197,459) -
Other long-term liabilities and deferred credits 528,439 103,341 254 632,034
Total liabilities 1,831,220 484,450 (201,943) 2,113,727
Minority interest 134,348 10,049 0 144,397
Net assets:
Unrestricted 522,405 (21,683) 0 500,722
Temporarily restricted 7,870 25,511 0 33,381
Permanently restricted 184 6,571 0 6,755
Total net assets 530,459 10,399 - 540,858
$ 2,496,027 504,898 (201,943) 2,798,982
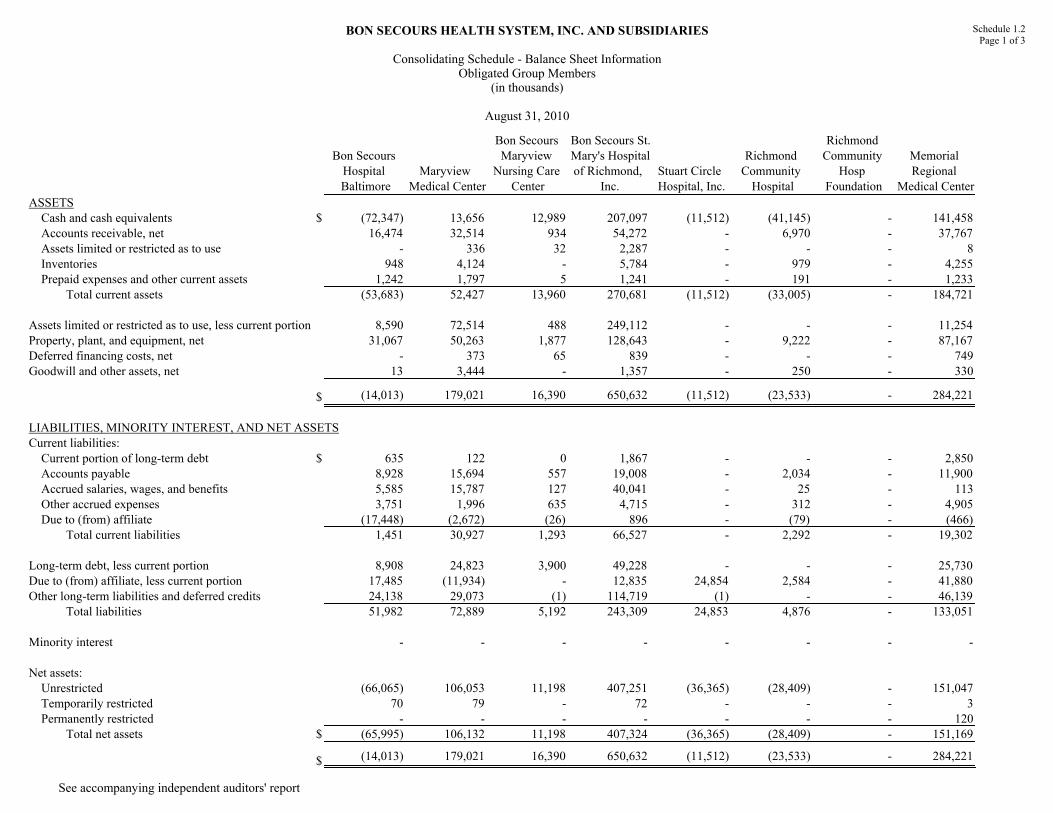
BON SECOURS HEALTH SYSTEM, INC. AND SUBSIDIARIES
Consolidating Schedule - Balance Sheet InformationObligated Group Members
(in thousands)
August 31, 2010
Schedule 1.2Page 1 of 3
See accompanying independent auditors' report
Bon Secours
Hospital
Baltimore
Maryview
Medical Center
Bon Secours
Maryview
Nursing Care
Center
Bon Secours St.
Mary's Hospital
of Richmond,
Inc.
Stuart Circle
Hospital, Inc.
Richmond
Community
Hospital
Richmond
Community
Hosp
Foundation
Memorial
Regional
Medical Center
ASSETS
Cash and cash equivalents $ (72,347) 13,656 12,989 207,097 (11,512) (41,145) - 141,458
Accounts receivable, net 16,474 32,514 934 54,272 - 6,970 - 37,767
Assets limited or restricted as to use - 336 32 2,287 - - - 8
Inventories 948 4,124 - 5,784 - 979 - 4,255
Prepaid expenses and other current assets 1,242 1,797 5 1,241 - 191 - 1,233
Total current assets (53,683) 52,427 13,960 270,681 (11,512) (33,005) - 184,721
Assets limited or restricted as to use, less current portion 8,590 72,514 488 249,112 - - - 11,254
Property, plant, and equipment, net 31,067 50,263 1,877 128,643 - 9,222 - 87,167
Deferred financing costs, net - 373 65 839 - - - 749
Goodwill and other assets, net 13 3,444 - 1,357 - 250 - 330
$ (14,013) 179,021 16,390 650,632 (11,512) (23,533) - 284,221
LIABILITIES, MINORITY INTEREST, AND NET ASSETS
Current liabilities:
Current portion of long-term debt $ 635 122 0 1,867 - - - 2,850
Accounts payable 8,928 15,694 557 19,008 - 2,034 - 11,900
Accrued salaries, wages, and benefits 5,585 15,787 127 40,041 - 25 - 113
Other accrued expenses 3,751 1,996 635 4,715 - 312 - 4,905
Due to (from) affiliate (17,448) (2,672) (26) 896 - (79) - (466)
Total current liabilities 1,451 30,927 1,293 66,527 - 2,292 - 19,302
Long-term debt, less current portion 8,908 24,823 3,900 49,228 - - - 25,730
Due to (from) affiliate, less current portion 17,485 (11,934) - 12,835 24,854 2,584 - 41,880
Other long-term liabilities and deferred credits 24,138 29,073 (1) 114,719 (1) - - 46,139
Total liabilities 51,982 72,889 5,192 243,309 24,853 4,876 - 133,051
Minority interest - - - - - - - -
Net assets:
Unrestricted (66,065) 106,053 11,198 407,251 (36,365) (28,409) - 151,047
Temporarily restricted 70 79 - 72 - - - 3
Permanently restricted - - - - - - - 120
Total net assets $ (65,995) 106,132 11,198 407,324 (36,365) (28,409) - 151,169
$ (14,013) 179,021 16,390 650,632 (11,512) (23,533) - 284,221

BON SECOURS HEALTH SYSTEM, INC. AND SUBSIDIARIES
Consolidating Schedule - Balance Sheet InformationObligated Group Members
(in thousands)
August 31, 2010
Schedule 1.2Page 2 of 3
See accompanying independent auditors' report
BS Richmond
Health System
St. Francis
Medical Center
RHS Shared
Services
Our Lady of
Bellefonte
Hospital, Inc.
Mary
Immaculate
Hospital, Inc.
Bon Secours
DePaul
Medical
Center, Inc.
St. Francis -
Downtown
ASSETS
Cash and cash equivalents $ - (46,962) (6,980) 4,894 59,110 (44,810) 84,267
Accounts receivable, net - 24,767 10 16,764 17,481 20,131 26,338
Assets limited or restricted as to use - - - - 832 11 -
Inventories - 3,529 1,573 3,536 3,209 2,539 8,745
Prepaid expenses and other current assets - 924 1,769 967 292 287 1,343
Total current assets - (17,742) (3,628) 26,161 80,924 (21,842) 120,693
Assets limited or restricted as to use, less current portion - - - 6,238 22,721 9,487 14,490
Property, plant, and equipment, net - 108,124 - 57,748 28,383 37,686 101,263
Deferred financing costs, net - 1,363 - - 312 76 -
Goodwill and other assets, net 1,705 2,416 - 1,518 522 9,218 83,641
$ 1,705 94,161 (3,628) 91,665 132,862 34,625 320,087
LIABILITIES, MINORITY INTEREST, AND NET ASSETS
Current liabilities:
Current portion of long-term debt $ - - - - 815 - -
Accounts payable - 9,156 9,202 6,880 8,901 10,080 16,669
Accrued salaries, wages, and benefits - - - 5,262 1,041 1,652 16,933
Other accrued expenses - 4,605 434 3,373 247 1,808 1,384
Due to (from) affiliate - (43) - 0 (112) 369 -
Total current liabilities - 13,718 9,636 15,515 10,892 13,909 34,986
Long-term debt, less current portion - - - - 12,205 - 32
Due to (from) affiliate, less current portion (150) 80,000 - - (2,691) 46,739 259,300
Other long-term liabilities and deferred credits - 106 185 39,970 8,232 8,128 (10,714)
Total liabilities (150) 93,824 9,821 55,485 28,638 68,776 283,604
Minority interest 79,163 - - - - - -
Net assets:
Unrestricted (77,308) 337 (13,449) 36,180 103,768 (34,131) 36,483
Temporarily restricted - 0 - - 406 (20) -
Permanently restricted - - - - 50 - -
Total net assets $ (77,308) 337 (13,449) 36,180 104,225 (34,151) 36,483
$ 1,705 94,161 (3,628) 91,665 132,862 34,625 320,087
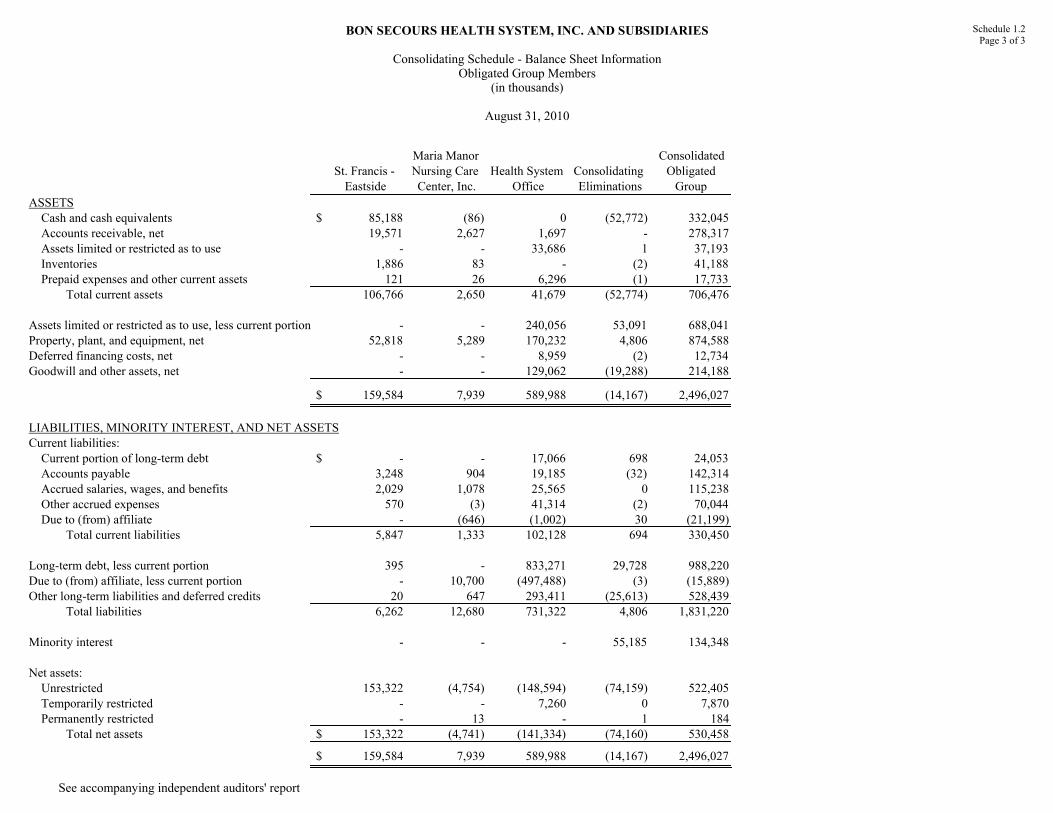
BON SECOURS HEALTH SYSTEM, INC. AND SUBSIDIARIES
Consolidating Schedule - Balance Sheet InformationObligated Group Members
(in thousands)
August 31, 2010
Schedule 1.2Page 3 of 3
See accompanying independent auditors' report
St. Francis -
Eastside
Maria Manor
Nursing Care
Center, Inc.
Health System
Office
Consolidating
Eliminations
Consolidated
Obligated
Group
ASSETS
Cash and cash equivalents $ 85,188 (86) 0 (52,772) 332,045
Accounts receivable, net 19,571 2,627 1,697 - 278,317
Assets limited or restricted as to use - - 33,686 1 37,193
Inventories 1,886 83 - (2) 41,188
Prepaid expenses and other current assets 121 26 6,296 (1) 17,733
Total current assets 106,766 2,650 41,679 (52,774) 706,476
Assets limited or restricted as to use, less current portion - - 240,056 53,091 688,041
Property, plant, and equipment, net 52,818 5,289 170,232 4,806 874,588
Deferred financing costs, net - - 8,959 (2) 12,734
Goodwill and other assets, net - - 129,062 (19,288) 214,188
$ 159,584 7,939 589,988 (14,167) 2,496,027
LIABILITIES, MINORITY INTEREST, AND NET ASSETS
Current liabilities:
Current portion of long-term debt $ - - 17,066 698 24,053
Accounts payable 3,248 904 19,185 (32) 142,314
Accrued salaries, wages, and benefits 2,029 1,078 25,565 0 115,238
Other accrued expenses 570 (3) 41,314 (2) 70,044
Due to (from) affiliate - (646) (1,002) 30 (21,199)
Total current liabilities 5,847 1,333 102,128 694 330,450
Long-term debt, less current portion 395 - 833,271 29,728 988,220
Due to (from) affiliate, less current portion - 10,700 (497,488) (3) (15,889)
Other long-term liabilities and deferred credits 20 647 293,411 (25,613) 528,439
Total liabilities 6,262 12,680 731,322 4,806 1,831,220
Minority interest - - - 55,185 134,348
Net assets:
Unrestricted 153,322 (4,754) (148,594) (74,159) 522,405
Temporarily restricted - - 7,260 0 7,870
Permanently restricted - 13 - 1 184
Total net assets $ 153,322 (4,741) (141,334) (74,160) 530,458
$ 159,584 7,939 589,988 (14,167) 2,496,027

BON SECOURS HEALTH SYSTEM, INC. AND SUBSIDIARIES
Consolidating Schedule - Balance Sheet InformationNon-Obligated Group Members
(in thousands)
August 31, 2010
Schedule 1.3Page 1 of 7
See accompanying independent auditors' report
BS Community
Health Services
Bon Secours of
Maryland
Foundation
Urban Medical
Institute
Bon Secours
Maryview
Health
Corporation
Professional
Health Care
Mgmt Services
Bon Secours
Maryview
Foundation
Hampton Roads
Shared Services
ASSETS
Cash and cash equivalents $ (231) 375 (449) - 2,140 227 5,552
Accounts receivable, net 239 570 23 - (6) 70 -
Assets limited or restricted as to use - 6 - - - 1,014 -
Inventories - - - - - - 779
Prepaid expenses and other current assets - 2,994 - - 13 9 94
Total current assets 8 3,945 (426) - 2,147 1,320 6,425
Assets limited or restricted as to use, less current portion - 5,277 - - - 1,203 -
Property, plant, and equipment, net 97 35,711 3,543 - 10,582 - -
Deferred financing costs, net - 70 - - - - -
Goodwill and other assets, net 300 189 - 850 - 147 -
$ 405 45,192 3,117 850 12,729 2,670 6,425
LIABILITIES, MINORITY INTEREST, AND NET ASSETS
Current liabilities:
Current portion of long-term debt $ - 425 - - (4) - -
Accounts payable 4 1,723 86 - 171 (1) 3,413
Accrued salaries, wages, and benefits - 19 - - 139 - 1,746
Other accrued expenses - 3,260 - - 74 12 92
Due to (from) affiliate 13,016 1,354 3,075 (484) 3,653 (34) 916
Total current liabilities 13,020 6,781 3,161 (484) 4,033 (23) 6,167
Long-term debt, less current portion - 12,924 - - - - -
Due to (from) affiliate, less current portion - 3,717 - - 4,250 - -
Other long-term liabilities and deferred credits (1) 1 1 - 4,076 - 379
Total liabilities 13,019 23,423 3,162 (484) 12,359 (23) 6,546
Minority interest - 19,385 - - 933 - -
Net assets:
Unrestricted (12,614) 2,326 (45) 1,334 (563) 789 (121)
Temporarily restricted - 58 - - - 1,753 -
Permanently restricted - - - - - 151 -
Total net assets (12,614) 2,384 (45) 1,334 (563) 2,693 (121)
$ 405 45,192 3,117 850 12,729 2,670 6,425

BON SECOURS HEALTH SYSTEM, INC. AND SUBSIDIARIES
Consolidating Schedule - Balance Sheet InformationNon-Obligated Group Members
(in thousands)
August 31, 2010
Schedule 1.3Page 2 of 7
See accompanying independent auditors' report
Bon Secours
Richmond
Health Corp.
BS Richmond
Healthcare
Foundation
Bon Secours
Healthsource
Laburnum
Properties, Inc.
Chesterfield
Community
Health Center
RHS
Enterprises, Inc.
Tidewater
Diversified, Inc.
ASSETS
Cash and cash equivalents $ 7,303 4,723 (21,385) (2,396) (15,833) (1,292) 1,552
Accounts receivable, net - 2,002 5,730 1 286 7 229
Assets limited or restricted as to use - 2,505 - - - - -
Inventories - - 281 - - - 384
Prepaid expenses and other current assets - 28 4,701 - - 1 (1)
Total current assets 7,303 9,258 (10,673) (2,395) (15,547) (1,284) 2,164
Assets limited or restricted as to use, less current portion - 8,852 - 2,755 - 63 -
Property, plant, and equipment, net - - 22,117 2,356 13 109 0
Deferred financing costs, net - - - - - - -
Goodwill and other assets, net 63 3,262 1,080 - 65 - 354
$ 7,366 21,372 12,524 2,716 (15,469) (1,112) 2,518
LIABILITIES, MINORITY INTEREST, AND NET ASSETS
Current liabilities:
Current portion of long-term debt $ - - 711 - - - -
Accounts payable - 178 2,041 0 0 18 624
Accrued salaries, wages, and benefits - - 244 - - - 55
Other accrued expenses - 36 2,859 49 89 28 0
Due to (from) affiliate - - (308) - - - 2
Total current liabilities - 214 5,547 49 89 46 681
Long-term debt, less current portion - - 81 - - - -
Due to (from) affiliate, less current portion - - 0 - 150 - -
Other long-term liabilities and deferred credits - (1) 332 1,722 1 - 1
Total liabilities - 213 5,960 1,771 240 46 682
Minority interest - - 7,274 - - - -
Net assets:
Unrestricted 7,366 4,838 (710) 945 (15,709) (1,158) 1,836
Temporarily restricted - 12,826 - - - - -
Permanently restricted - 3,495 - - - - -
Total net assets 7,366 21,159 (710) 945 (15,709) (1,158) 1,836
$ 7,366 21,372 12,524 2,716 (15,469) (1,112) 2,518

BON SECOURS HEALTH SYSTEM, INC. AND SUBSIDIARIES
Consolidating Schedule - Balance Sheet InformationNon-Obligated Group Members
(in thousands)
August 31, 2010
Schedule 1.3Page 3 of 7
See accompanying independent auditors' report
Bayley
Properties, Inc.
DePaul
Foundation
St. Francis
Nursing Care
Center, Inc.
Mary
Immaculate
Medical Pavilion
St. Anthony
Community
Foundation
BS Community
Hospital
Foundation
GSH Medical
Care PC
ASSETS
Cash and cash equivalents $ 7 91 6,669 10 1,999 693 (1,082)
Accounts receivable, net - 14 783 - - - 423
Assets limited or restricted as to use - 457 - - - - -
Inventories - - - - - - -
Prepaid expenses and other current assets - 1 2 - - - 259
Total current assets 7 563 7,454 10 1,999 693 (400)
Assets limited or restricted as to use, less current portion - 1,043 - - 292 725 -
Property, plant, and equipment, net 0 - 1,714 1,078 - - 106
Deferred financing costs, net - - 40 - - - -
Goodwill and other assets, net - 345 - 308 3 11 -
$ 7 1,951 9,208 1,396 2,294 1,429 (294)
LIABILITIES, MINORITY INTEREST, AND NET ASSETS
Current liabilities:
Current portion of long-term debt $ - - - - - - 12
Accounts payable 6 3 474 - - - 85
Accrued salaries, wages, and benefits - - 99 - - - 756
Other accrued expenses 6 0 80 2 - - 201
Due to (from) affiliate (865) 23 (8) (41) (59) (19) 0
Total current liabilities (853) 26 645 (39) (59) (19) 1,054
Long-term debt, less current portion - - - - - - 42
Due to (from) affiliate, less current portion (497) - 3,498 2,691 - - -
Other long-term liabilities and deferred credits 480 - 2 3,376 - - (2)
Total liabilities (870) 26 4,145 6,028 (59) (19) 1,094
Minority interest - - - - - - -
Net assets:
Unrestricted 877 426 5,044 (4,632) 2,058 712 (1,388)
Temporarily restricted - 842 19 - 295 119 -
Permanently restricted - 657 - - - 617 -
Total net assets 877 1,925 5,063 (4,632) 2,353 1,448 (1,388)
$ 7 1,951 9,208 1,396 2,294 1,429 (294)

BON SECOURS HEALTH SYSTEM, INC. AND SUBSIDIARIES
Consolidating Schedule - Balance Sheet InformationNon-Obligated Group Members
(in thousands)
August 31, 2010
Schedule 1.3Page 4 of 7
See accompanying independent auditors' report
Mt. Alverno
Assisted Living
Facility
Good Samaritan
Hospital
Good Samaritan
Hospital Home
Care
Good Samaritan
Hospital
Foundation
St. Anthony
Community
Hospital
Bon Secours
Community
Hospital
Schervier
Pavilion
ASSETS
Cash and cash equivalents $ 28 (63,925) 34 674 11,280 (5,638) 914
Accounts receivable, net 199 34,603 1,783 - 5,667 9,598 1,392
Assets limited or restricted as to use - - - - - - -
Inventories 9 4,296 - - 937 1,057 -
Prepaid expenses and other current assets 4 1,717 1 - 120 86 7
Total current assets 240 (23,309) 1,818 674 18,004 5,103 2,313
Assets limited or restricted as to use, less current portion - 18,285 249 3,062 1,161 25 -
Property, plant, and equipment, net 3,986 69,955 223 - 17,271 13,057 6,084
Deferred financing costs, net - - - - - - -
Goodwill and other assets, net 16 6,488 - 559 839 2,976 16
$ 4,242 71,419 2,290 4,295 37,275 21,161 8,413
LIABILITIES, MINORITY INTEREST, AND NET ASSETS
Current liabilities:
Current portion of long-term debt $ - 290 - - - - -
Accounts payable 41 9,490 395 2 2,103 1,911 91
Accrued salaries, wages, and benefits 203 20,475 - - 1,919 3,347 622
Other accrued expenses 145 7,449 1,205 - 1,150 2,242 337
Due to (from) affiliate 0 1,374 (1,356) 147 0 0 -
Total current liabilities 389 39,078 244 149 5,172 7,500 1,050
Long-term debt, less current portion - 53,753 - - - 13,790 13,700
Due to (from) affiliate, less current portion - - - - - - -
Other long-term liabilities and deferred credits 334 10,457 1,297 - 247 4,193 57
Total liabilities 723 103,288 1,541 149 5,419 25,483 14,807
Minority interest - - - - - - -
Net assets:
Unrestricted 3,519 (32,362) 500 525 31,295 (4,322) (6,394)
Temporarily restricted - 493 249 3,609 561 - -
Permanently restricted - - - 12 - - -
Total net assets 3,519 (31,869) 749 4,146 31,856 (4,322) (6,394)
$ 4,242 71,419 2,290 4,295 37,275 21,161 8,413

BON SECOURS HEALTH SYSTEM, INC. AND SUBSIDIARIES
Consolidating Schedule - Balance Sheet InformationNon-Obligated Group Members
(in thousands)
August 31, 2010
Schedule 1.3Page 5 of 7
See accompanying independent auditors' report
Health Care
Enterprises, Inc.
Optimum Health
Network
Upstate Surgery
Center
St. Francis
Foundation
St. Francis
Physician
Services
St Francis -
Millennium
Frances
Schervier Home
and Hospital
ASSETS
Cash and cash equivalents $ - 8 1,328 1,913 (77,706) (3,294) 10,289
Accounts receivable, net - - 421 313 8,494 309 6,403
Assets limited or restricted as to use - - - 736 - - 4,305
Inventories - - 59 - 8 - 122
Prepaid expenses and other current assets - - - 40 872 207 121
Total current assets - 8 1,808 3,002 (68,332) (2,778) 21,240
Assets limited or restricted as to use, less current portion - - - 4,045 - - 3,701
Property, plant, and equipment, net - - 430 - - 17,060 19,257
Deferred financing costs, net - - - - - - -
Goodwill and other assets, net - - 297 - - - 285
$ - 8 2,535 7,047 (68,332) 14,282 44,483
LIABILITIES, MINORITY INTEREST, AND NET ASSETS
Current liabilities:
Current portion of long-term debt $ - - - - - - 1,275
Accounts payable - 8 130 - 1,261 152 1,803
Accrued salaries, wages, and benefits - - 41 - 3,537 72 2,887
Other accrued expenses - - 143 - 726 7 779
Due to (from) affiliate - - - - - - -
Total current liabilities - 8 314 - 5,524 231 6,744
Long-term debt, less current portion - - - - - - 33,075
Due to (from) affiliate, less current portion - - - - - - 7,185
Other long-term liabilities and deferred credits - - - - 7 17,060 3,423
Total liabilities - 8 314 - 5,531 17,291 50,427
Minority interest - - 1,115 - - - -
Net assets:
Unrestricted - - 1,106 4,646 (73,863) (3,009) (7,508)
Temporarily restricted - - - 1,968 - - 1,564
Permanently restricted - - - 433 - - -
Total net assets - - 1,106 7,047 (73,863) (3,009) (5,944)
$ - 8 2,535 7,047 (68,332) 14,282 44,483

BON SECOURS HEALTH SYSTEM, INC. AND SUBSIDIARIES
Consolidating Schedule - Balance Sheet InformationNon-Obligated Group Members
(in thousands)
August 31, 2010
Schedule 1.3Page 6 of 7
See accompanying independent auditors' report
Frances
Schervier
Housing
Development
Bon Secours
New York
Parent Corp.
Schervier Long
Term Home
Health Care
OLBH
Foundation
Bon Secours
Associates, LLC
Bon Secours
Assurance
Company, Ltd.
Bon Secours
Place at St.
Petersburg
ASSETS
Cash and cash equivalents $ 346 - 1 347 - - 1,659
Accounts receivable, net 5 - 3,828 48 - - 29
Assets limited or restricted as to use - - - - - 15,972 -
Inventories - - - - - - -
Prepaid expenses and other current assets 2 9 3 1 - - 3
Total current assets 353 9 3,832 396 - 15,972 1,691
Assets limited or restricted as to use, less current portion 658 - - 2,248 442 48,560 -
Property, plant, and equipment, net 4,827 - 268 - - - 7,127
Deferred financing costs, net - - - - - - -
Goodwill and other assets, net 44 - - 72 1,267 6,261 -
$ 5,882 9 4,100 2,716 1,709 70,793 8,818
LIABILITIES, MINORITY INTEREST, AND NET ASSETS
Current liabilities:
Current portion of long-term debt $ 237 - - - - - -
Accounts payable 460 21 2,192 - - - 4
Accrued salaries, wages, and benefits 13 95 91 - - - 144
Other accrued expenses - - 2 - - 15,972 316
Due to (from) affiliate - - - - - - 19
Total current liabilities 710 116 2,285 - - 15,972 483
Long-term debt, less current portion 6,788 - - - - - -
Due to (from) affiliate, less current portion 663 641 (8,489) - - - 6,091
Other long-term liabilities and deferred credits 44 (1) 984 (1) 1 54,821 47
Total liabilities 8,205 756 (5,220) (1) 1 70,793 6,621
Minority interest - - - - - - 300
Net assets:
Unrestricted (2,323) (747) 9,320 357 1,708 - 1,897
Temporarily restricted - - - 1,153 - - -
Permanently restricted - - - 1,207 - - -
Total net assets (2,323) (747) 9,320 2,717 1,708 - 1,897
$ 5,882 9 4,100 2,716 1,709 70,793 8,818

BON SECOURS HEALTH SYSTEM, INC. AND SUBSIDIARIES
Consolidating Schedule - Balance Sheet InformationNon-Obligated Group Members
(in thousands)
August 31, 2010
Schedule 1.3Page 7 of 7
See accompanying independent auditors' report
Bellefonte
Physician
Services
St. Petersburg
Home Care
Services, Inc.
Maria Manor
Health
Resources
Consolidating
Eliminations
Combined
Non-Obligated
Group
ASSETS
Cash and cash equivalents $ (14,589) (30) - 193,102 45,414
Accounts receivable, net 1,543 364 - (5) 85,365
Assets limited or restricted as to use - - - 0 24,995
Inventories 113 - - (2) 8,043
Prepaid expenses and other current assets 120 - - (2,993) 8,421
Total current assets (12,813) 334 - 190,102 172,238
Assets limited or restricted as to use, less current portion - - - 0 102,646
Property, plant, and equipment, net - 83 - (33,901) 203,153
Deferred financing costs, net - - - (70) 40
Goodwill and other assets, net 104 - 1,000 (380) 26,821
$ (12,709) 417 1,000 155,751 504,898
LIABILITIES, MINORITY INTEREST, AND NET ASSETS
Current liabilities:
Current portion of long-term debt $ - - - (426) 2,520
Accounts payable 374 39 - (1,565) 27,737
Accrued salaries, wages, and benefits 852 187 - (18) 37,525
Other accrued expenses (2) 13 - (3,135) 34,137
Due to (from) affiliate - 616 - 1 21,022
Total current liabilities 1,224 855 - (5,143) 122,941
Long-term debt, less current portion - - - (89,333) 44,820
Due to (from) affiliate, less current portion - - - 193,448 213,348
Other long-term liabilities and deferred credits - 8 - (4) 103,341
Total liabilities 1,224 863 - 98,968 484,450
Minority interest - - - (18,958) 10,049
Net assets:
Unrestricted (13,933) (446) 1,000 75,740 (21,683)
Temporarily restricted - - - 2 25,511
Permanently restricted - - - (1) 6,571
Total net assets (13,933) (446) 1,000 75,741 10,399
$ (12,709) 417 1,000 155,751 504,898
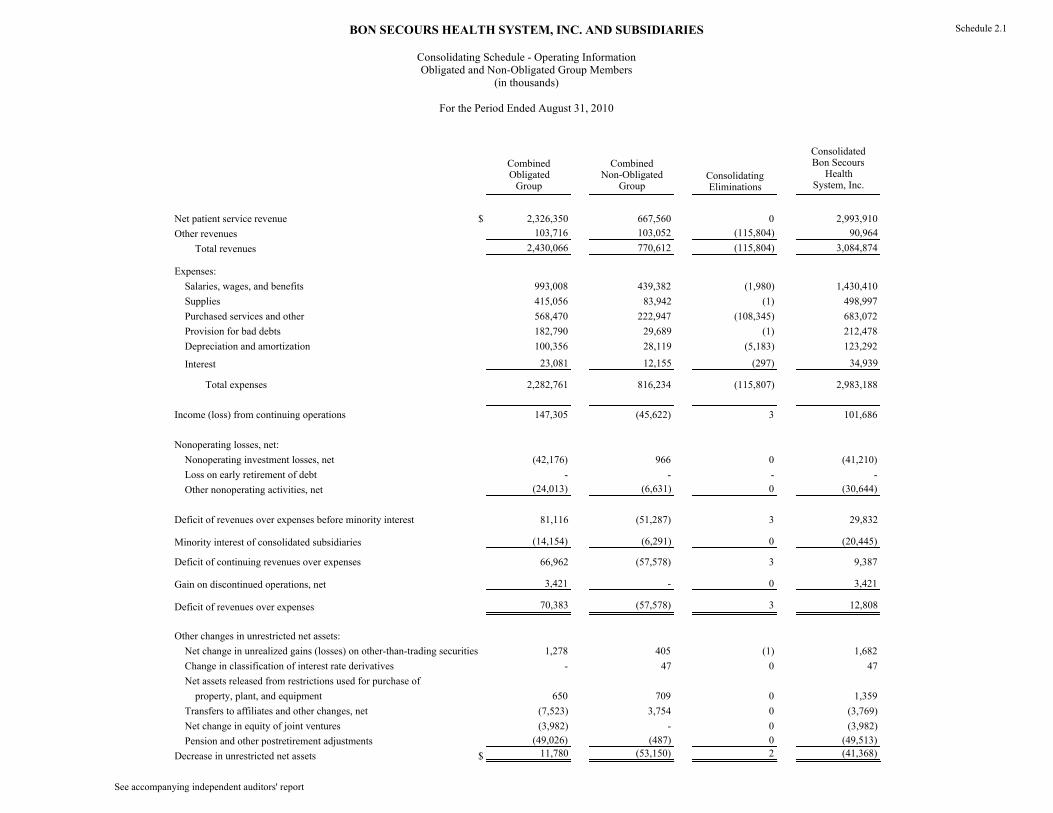
BON SECOURS HEALTH SYSTEM, INC. AND SUBSIDIARIES
Consolidating Schedule - Operating InformationObligated and Non-Obligated Group Members
(in thousands)
For the Period Ended August 31, 2010
Schedule 2.1
See accompanying independent auditors' report
CombinedObligatedGroup
CombinedNon-Obligated
GroupConsolidatingEliminations
ConsolidatedBon Secours
HealthSystem, Inc.
Net patient service revenue $ 2,326,350 667,560 0 2,993,910
Other revenues 103,716 103,052 (115,804) 90,964
Total revenues 2,430,066 770,612 (115,804) 3,084,874
Expenses:
Salaries, wages, and benefits 993,008 439,382 (1,980) 1,430,410
Supplies 415,056 83,942 (1) 498,997
Purchased services and other 568,470 222,947 (108,345) 683,072
Provision for bad debts 182,790 29,689 (1) 212,478
Depreciation and amortization 100,356 28,119 (5,183) 123,292
Interest 23,081 12,155 (297) 34,939
Total expenses 2,282,761 816,234 (115,807) 2,983,188
Income (loss) from continuing operations 147,305 (45,622) 3 101,686
Nonoperating losses, net:
Nonoperating investment losses, net (42,176) 966 0 (41,210)
Loss on early retirement of debt - - - -
Other nonoperating activities, net (24,013) (6,631) 0 (30,644)
Deficit of revenues over expenses before minority interest 81,116 (51,287) 3 29,832
Minority interest of consolidated subsidiaries (14,154) (6,291) 0 (20,445)
Deficit of continuing revenues over expenses 66,962 (57,578) 3 9,387
Gain on discontinued operations, net 3,421 - 0 3,421
Deficit of revenues over expenses 70,383 (57,578) 3 12,808
Other changes in unrestricted net assets:
Net change in unrealized gains (losses) on other-than-trading securities 1,278 405 (1) 1,682
Change in classification of interest rate derivatives - 47 0 47
Net assets released from restrictions used for purchase of
property, plant, and equipment 650 709 0 1,359
Transfers to affiliates and other changes, net (7,523) 3,754 0 (3,769)
Net change in equity of joint ventures (3,982) - 0 (3,982)
Pension and other postretirement adjustments (49,026) (487) 0 (49,513)
Decrease in unrestricted net assets $ 11,780 (53,150) 2 (41,368)

BON SECOURS HEALTH SYSTEM, INC. AND SUBSIDIARIES
Consolidating Schedule - Operating InformationObligated Group Members
(in thousands)
For the Period Ended August 31, 2010
Schedule 2.21 of 3
See accompanying independent auditors' report
Bon Secours Hospital Baltimore
Maryview Medical Center
Bon Secours Maryview Nursing Care
Center
Bon Secours St. Mary's Hospital of Richmond, Inc.
Stuart Circle Hospital, Inc.
Richmond Community Hospital
Richmond Community Hosp
Foundation
Memorial Regional
Medical Center
Revenues:
Net patient service revenue $ 126,814 279,500 9,797 445,973 - 53,187 - 292,712
Other revenues 10,537 6,441 38 1,963 - 235 - 1,979
Total revenues 137,351 285,941 9,835 447,936 - 53,422 - 294,691
Expenses:
Salaries, wages, and benefits 58,730 101,068 4,797 161,109 - 18,645 - 105,298
Supplies 12,593 39,438 949 78,178 - 9,146 - 44,611
Purchased services and other 42,292 100,816 2,043 130,589 - 18,516 - 100,624
Provision for bad debts 16,080 22,901 112 17,711 - 5,493 - 15,654
Depreciation and amortization 4,580 9,297 241 12,839 - 1,519 - 8,721
Interest 1,576 3,837 241 7,660 - 19 - 6,361
Total expenses 135,851 277,357 8,383 408,086 - 53,338 - 281,269
Income (loss) from continuing operations 1,500 8,584 1,452 39,850 - 84 - 13,422
Nonoperating gains (losses), net:
Nonoperating investment income, net 408 4,817 33 17,231 - (159) 10 764
Loss on early retirement of debt - - - - - - - -
Other nonoperating activities, net (42) (498) - (6,499) - (191) 18 (4,964)
Excess (deficit) of revenues over expenses before minority interest 1,866 12,903 1,485 50,582 - (266) 28 9,222
Minority interest of consolidated subsidiaries - - - - - - - -
Excess (deficit) of continuing revenues over expenses 1,866 12,903 1,485 50,582 - (266) 28 9,222
Gain on discontinued operations, net - - - - - - - -
Excess (deficit) of revenues over expenses 1,866 12,903 1,485 50,582 - (266) 28 9,222
Other changes in unrestricted net assets:
Net change in unrealized gains (losses) on other-than-trading securities 0 - - (15) - - - 14
Change in classification of interest rate derivatives - - - - - - - -
Net assets released from restrictions use for purchase of
property, plant, and equipment - 1 - 213 - 27 - -
Transfers to affiliates and other changes, net (483) (803) - (3,450) - 169 (5,256) (1,428)
Net change in equity of joint ventures - - - - - - - -
Pension and other postretirement adjustments (3,089) (1,980) - (12,943) - - - (7,701)
Increase (decrease) in unrestricted net assets $ (1,706) 10,121 1,485 34,387 - (70) (5,228) 107

BON SECOURS HEALTH SYSTEM, INC. AND SUBSIDIARIES
Consolidating Schedule - Operating InformationObligated Group Members
(in thousands)
For the Period Ended August 31, 2010
Schedule 2.22 of 3
See accompanying independent auditors' report
BS Richmond Health System
St. Francis Medical Center
RHS Shared Services
Our Lady of Bellefonte Hospital, Inc.
Mary Immaculate Hospital, Inc.
Bon Secours DePaul Medical Center, Inc.
St. Francis - Downtown
Revenues:
Net patient service revenue $ - 193,350 - 150,081 156,084 168,065 289,180
Other revenues - 3,315 157,661 3,987 1,917 1,996 6,683
Total revenues - 196,665 157,661 154,068 158,001 170,061 295,863
Expenses:
Salaries, wages, and benefits - 60,533 73,140 56,158 41,647 58,394 95,899
Supplies - 37,240 14,447 20,279 42,082 29,215 64,727
Purchased services and other - 61,570 64,278 40,956 39,891 58,255 49,243
Provision for bad debts - 10,607 - 12,694 12,729 18,190 34,325
Depreciation and amortization - 9,241 5,797 8,534 2,828 6,380 19,726
Interest - 4,089 - 4,870 2,125 2,044 5,172
Total expenses - 183,280 157,662 143,491 141,302 172,478 269,092
Income (loss) from continuing operations - 13,385 (1) 10,577 16,699 (2,417) 26,771
Nonoperating gains (losses), net:
Nonoperating investment income, net - (184) (26) 453 1,597 451 1,081
Loss on early retirement of debt - - - - - - -
Other nonoperating activities, net 87 (400) (3,290) (3,210) (841) (446) (400)
Excess (deficit) of revenues over expenses before minority interest 87 12,801 (3,317) 7,820 17,455 (2,412) 27,452
Minority interest of consolidated subsidiaries (5,426) - - - - - -
Excess (deficit) of continuing revenues over expenses (5,339) 12,801 (3,317) 7,820 17,455 (2,412) 27,452
Gain on discontinued operations, net - - - - - - -
Excess (deficit) of revenues over expenses (5,339) 12,801 (3,317) 7,820 17,455 (2,412) 27,452
Other changes in unrestricted net assets:
Net change in unrealized gains (losses) on other-than-trading securities - - - - 207 - -
Change in classification of interest rate derivatives - - - - - - -
Net assets released from restrictions use for purchase of
property, plant, and equipment - 213 - 138 - 58 -
Transfers to affiliates and other changes, net - (1,317) - 8 (472) (690) (1,825)
Net change in equity of joint ventures - - - - - - -
Pension and other postretirement adjustments - - - (4,556) (424) (424) -
Increase (decrease) in unrestricted net assets $ (5,339) 11,697 (3,317) 3,410 16,766 (3,468) 25,627

BON SECOURS HEALTH SYSTEM, INC. AND SUBSIDIARIES
Consolidating Schedule - Operating InformationObligated Group Members
(in thousands)
For the Period Ended August 31, 2010
Schedule 2.23 of 3
See accompanying independent auditors' report
St. Francis - Eastside
Maria Manor Nursing Care Center, Inc.
Health System Office
ConsolidatingEliminations
ConsolidatedObligatedGroup
Revenues:
Net patient service revenue $ 140,185 21,422 - 0 2,326,350
Other revenues 447 589 133,371 (227,443) 103,716
Total revenues 140,632 22,011 133,371 (227,443) 2,430,066
Expenses:
Salaries, wages, and benefits 56,395 12,964 88,230 1 993,008
Supplies 19,606 1,646 898 1 415,056
Purchased services and other 21,524 5,708 45,120 (212,955) 568,470
Provision for bad debts 15,683 610 - 1 182,790
Depreciation and amortization 3,703 488 20,923 (14,461) 100,356
Interest 3,474 610 (18,996) (1) 23,081
Total expenses 120,385 22,026 136,175 (227,414) 2,282,761
Income (loss) from continuing operations 20,247 (15) (2,804) (29) 147,305
Nonoperating gains (losses), net:
Nonoperating investment income, net - 0 (68,652) 0 (42,176)
Loss on early retirement of debt - - - - -
Other nonoperating activities, net 1 (42) (3,296) 0 (24,013)
Excess (deficit) of revenues over expenses before minority interest 20,248 (57) (74,752) (29) 81,116
Minority interest of consolidated subsidiaries - - - (8,728) (14,154)
Excess (deficit) of continuing revenues over expenses 20,248 (57) (74,752) (8,757) 66,962
Gain on discontinued operations, net - - 3,421 0 3,421
Excess (deficit) of revenues over expenses 20,248 (57) (71,331) (8,757) 70,383
Other changes in unrestricted net assets:
Net change in unrealized gains (losses) on other-than-trading securities - - 1,072 0 1,278
Change in classification of interest rate derivatives - - - - -
Net assets released from restrictions use for purchase of
property, plant, and equipment - - - 0 650
Transfers to affiliates and other changes, net (1,167) (223) 9,414 0 (7,523)
Net change in equity of joint ventures - - (3,982) 0 (3,982)
Pension and other postretirement adjustments - - (17,907) (2) (49,026)
Increase (decrease) in unrestricted net assets $ 19,081 (280) (82,734) (8,759) 11,780
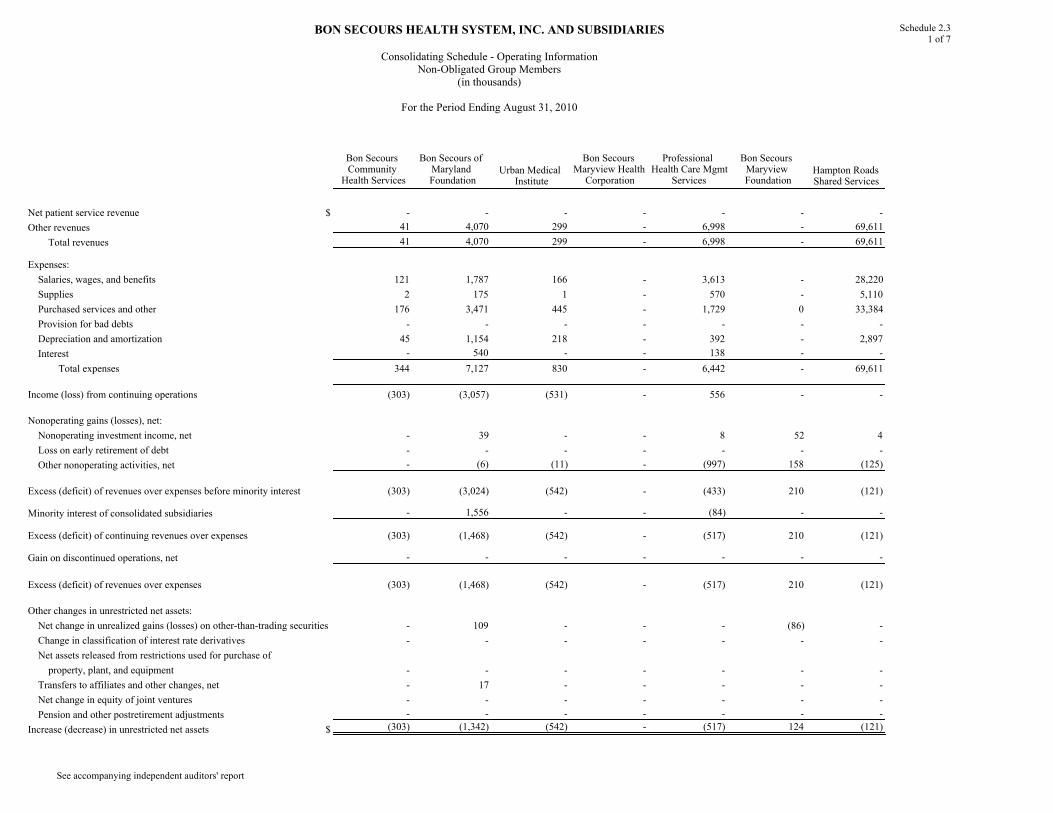
BON SECOURS HEALTH SYSTEM, INC. AND SUBSIDIARIES
Consolidating Schedule - Operating InformationNon-Obligated Group Members
(in thousands)
For the Period Ending August 31, 2010
Schedule 2.31 of 7
See accompanying independent auditors' report
Bon Secours Community
Health Services
Bon Secours of Maryland Foundation
Urban Medical Institute
Bon Secours Maryview Health Corporation
Professional Health Care Mgmt
Services
Bon Secours Maryview Foundation
Hampton Roads Shared Services
Net patient service revenue $ - - - - - - -
Other revenues 41 4,070 299 - 6,998 - 69,611
Total revenues 41 4,070 299 - 6,998 - 69,611
Expenses:
Salaries, wages, and benefits 121 1,787 166 - 3,613 - 28,220
Supplies 2 175 1 - 570 - 5,110
Purchased services and other 176 3,471 445 - 1,729 0 33,384
Provision for bad debts - - - - - - -
Depreciation and amortization 45 1,154 218 - 392 - 2,897
Interest - 540 - - 138 - -
Total expenses 344 7,127 830 - 6,442 - 69,611
Income (loss) from continuing operations (303) (3,057) (531) - 556 - -
Nonoperating gains (losses), net:
Nonoperating investment income, net - 39 - - 8 52 4
Loss on early retirement of debt - - - - - - -
Other nonoperating activities, net - (6) (11) - (997) 158 (125)
Excess (deficit) of revenues over expenses before minority interest (303) (3,024) (542) - (433) 210 (121)
Minority interest of consolidated subsidiaries - 1,556 - - (84) - -
Excess (deficit) of continuing revenues over expenses (303) (1,468) (542) - (517) 210 (121)
Gain on discontinued operations, net - - - - - - -
Excess (deficit) of revenues over expenses (303) (1,468) (542) - (517) 210 (121)
Other changes in unrestricted net assets:
Net change in unrealized gains (losses) on other-than-trading securities - 109 - - - (86) -
Change in classification of interest rate derivatives - - - - - - -
Net assets released from restrictions used for purchase of
property, plant, and equipment - - - - - - -
Transfers to affiliates and other changes, net - 17 - - - - -
Net change in equity of joint ventures - - - - - - -
Pension and other postretirement adjustments - - - - - - -
Increase (decrease) in unrestricted net assets $ (303) (1,342) (542) - (517) 124 (121)
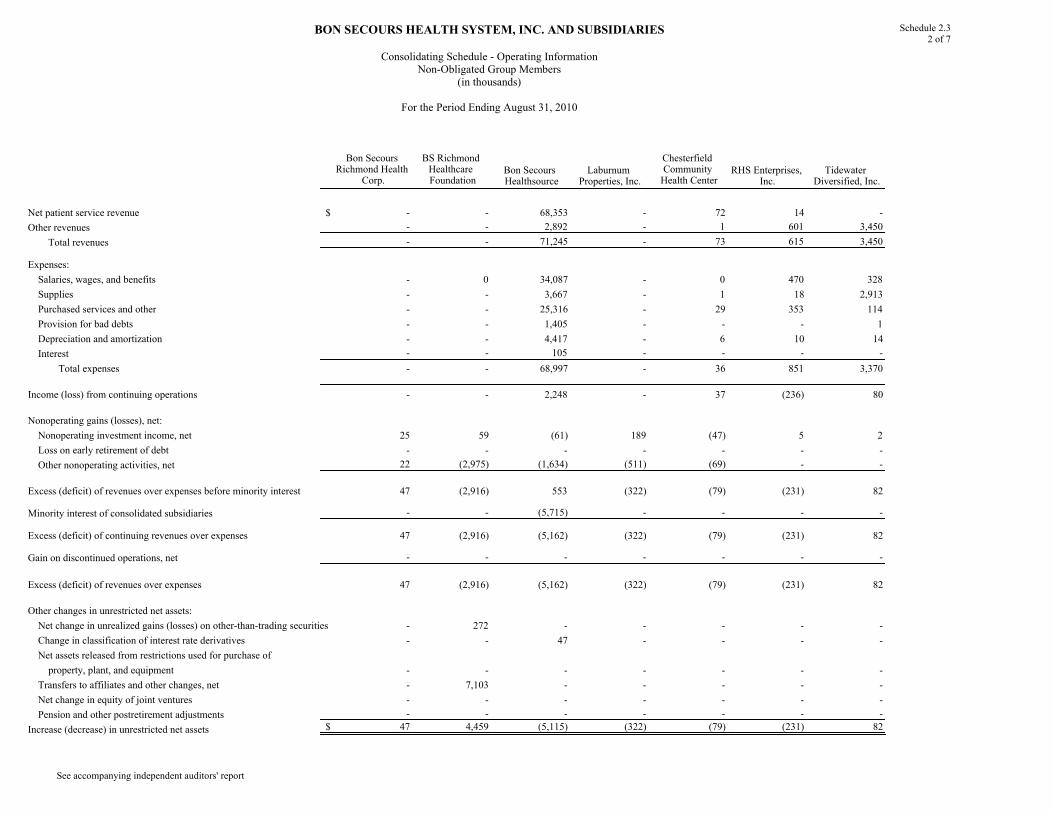
BON SECOURS HEALTH SYSTEM, INC. AND SUBSIDIARIES
Consolidating Schedule - Operating InformationNon-Obligated Group Members
(in thousands)
For the Period Ending August 31, 2010
Schedule 2.32 of 7
See accompanying independent auditors' report
Bon Secours Richmond Health
Corp.
BS Richmond Healthcare Foundation
Bon Secours Healthsource
Laburnum Properties, Inc.
Chesterfield Community Health Center
RHS Enterprises, Inc.
Tidewater Diversified, Inc.
Net patient service revenue $ - - 68,353 - 72 14 -
Other revenues - - 2,892 - 1 601 3,450
Total revenues - - 71,245 - 73 615 3,450
Expenses:
Salaries, wages, and benefits - 0 34,087 - 0 470 328
Supplies - - 3,667 - 1 18 2,913
Purchased services and other - - 25,316 - 29 353 114
Provision for bad debts - - 1,405 - - - 1
Depreciation and amortization - - 4,417 - 6 10 14
Interest - - 105 - - - -
Total expenses - - 68,997 - 36 851 3,370
Income (loss) from continuing operations - - 2,248 - 37 (236) 80
Nonoperating gains (losses), net:
Nonoperating investment income, net 25 59 (61) 189 (47) 5 2
Loss on early retirement of debt - - - - - - -
Other nonoperating activities, net 22 (2,975) (1,634) (511) (69) - -
Excess (deficit) of revenues over expenses before minority interest 47 (2,916) 553 (322) (79) (231) 82
Minority interest of consolidated subsidiaries - - (5,715) - - - -
Excess (deficit) of continuing revenues over expenses 47 (2,916) (5,162) (322) (79) (231) 82
Gain on discontinued operations, net - - - - - - -
Excess (deficit) of revenues over expenses 47 (2,916) (5,162) (322) (79) (231) 82
Other changes in unrestricted net assets:
Net change in unrealized gains (losses) on other-than-trading securities - 272 - - - - -
Change in classification of interest rate derivatives - - 47 - - - -
Net assets released from restrictions used for purchase of
property, plant, and equipment - - - - - - -
Transfers to affiliates and other changes, net - 7,103 - - - - -
Net change in equity of joint ventures - - - - - - -
Pension and other postretirement adjustments - - - - - - -
Increase (decrease) in unrestricted net assets $ 47 4,459 (5,115) (322) (79) (231) 82

BON SECOURS HEALTH SYSTEM, INC. AND SUBSIDIARIES
Consolidating Schedule - Operating InformationNon-Obligated Group Members
(in thousands)
For the Period Ending August 31, 2010
Schedule 2.33 of 7
See accompanying independent auditors' report
Bayley Properties, Inc.
DePaul Foundation
St. Francis Nursing Care Center, Inc.
Mary Immaculte
Medical Pavilion
St. Anthony Community Foundation
BS Community Hospital Foundation
GSH Medical Care PC
Net patient service revenue $ - - 7,181 - (87) (7) 5,098
Other revenues - - 39 - (7) 147 164
Total revenues - - 7,220 - (94) 140 5,262
Expenses:
Salaries, wages, and benefits - - 3,563 - 0 82 8,720
Supplies - - 874 - - - 361
Purchased services and other - 0 1,981 - 18 45 4,024
Provision for bad debts - - 98 - - - 437
Depreciation and amortization - - 245 0 - - 52
Interest - - 218 - - - 619
Total expenses - - 6,979 - 18 127 14,213
Income (loss) from continuing operations - - 241 - (112) 13 (8,951)
Nonoperating gains (losses), net:
Nonoperating investment income, net 0 39 17 0 34 26 (4)
Loss on early retirement of debt - - - - - - -
Other nonoperating activities, net 14 (59) - (84) - - (57)
Excess (deficit) of revenues over expenses before minority interest 14 (20) 258 (84) (78) 39 (9,012)
Minority interest of consolidated subsidiaries - - - - - - -
Excess (deficit) of continuing revenues over expenses 14 (20) 258 (84) (78) 39 (9,012)
Gain on discontinued operations, net - - - - - - -
Excess (deficit) of revenues over expenses 14 (20) 258 (84) (78) 39 (9,012)
Other changes in unrestricted net assets:
Net change in unrealized gains (losses) on other-than-trading securities - - - - 13 27 -
Change in classification of interest rate derivatives - - - - - - -
Net assets released from restrictions used for purchase of
property, plant, and equipment - - 50 - - - -
Transfers to affiliates and other changes, net - (64) (73) - 18 (390) 22,608
Net change in equity of joint ventures - - - - - - -
Pension and other postretirement adjustments - - - - - - -
Increase (decrease) in unrestricted net assets $ 14 (84) 235 (84) (47) (324) 13,596

BON SECOURS HEALTH SYSTEM, INC. AND SUBSIDIARIES
Consolidating Schedule - Operating InformationNon-Obligated Group Members
(in thousands)
For the Period Ending August 31, 2010
Schedule 2.34 of 7
See accompanying independent auditors' report
Mt. Alverno Assisted Living
FacilityGood Samaritan
Hospital
Good Samaritan Hospital Home
Care
Good Samaritan Hospital Foundation
St. Anthony Community Hospital
Bon Secours Community Hospital
Schervier Pavilion
Net patient service revenue $ 2,982 256,818 18,064 (71) 51,062 82,641 12,165
Other revenues 183 1,372 338 1,066 390 611 6
Total revenues 3,165 258,190 18,402 995 51,452 83,252 12,171
Expenses:
Salaries, wages, and benefits 2,468 130,009 11,088 329 25,334 39,577 8,009
Supplies 366 40,373 583 31 6,309 8,869 978
Purchased services and other 1,069 64,471 4,438 355 15,357 24,915 2,761
Provision for bad debts 24 13,769 179 - 2,385 6,809 216
Depreciation and amortization 232 11,083 123 - 2,605 2,906 267
Interest - 7,126 - - - 923 866
Total expenses 4,159 266,831 16,411 715 51,990 83,999 13,097
Income (loss) from continuing operations (994) (8,641) 1,991 280 (538) (747) (926)
Nonoperating gains (losses), net:
Nonoperating investment income, net 2 40 - 41 95 (1) 4
Loss on early retirement of debt - - - - - - -
Other nonoperating activities, net 0 39 - - 417 545 -
Excess (deficit) of revenues over expenses before minority interest (992) (8,562) 1,991 321 (26) (203) (922)
Minority interest of consolidated subsidiaries - - - - - - -
Excess (deficit) of continuing revenues over expenses (992) (8,562) 1,991 321 (26) (203) (922)
Gain on discontinued operations, net - - - - - - -
Excess (deficit) of revenues over expenses (992) (8,562) 1,991 321 (26) (203) (922)
Other changes in unrestricted net assets:
Net change in unrealized gains (losses) on other-than-trading securities - - - 11 67 - -
Change in classification of interest rate derivatives - - - - - - -
Net assets released from restrictions used for purchase of
property, plant, and equipment 40 324 - - 267 29 -
Transfers to affiliates and other changes, net - (278) - (2,202) (238) 28 (293)
Net change in equity of joint ventures - - - - - - -
Pension and other postretirement adjustments - 100 - - - - -
Increase (decrease) in unrestricted net assets $ (952) (8,416) 1,991 (1,870) 70 (146) (1,215)

BON SECOURS HEALTH SYSTEM, INC. AND SUBSIDIARIES
Consolidating Schedule - Operating InformationNon-Obligated Group Members
(in thousands)
For the Period Ending August 31, 2010
Schedule 2.35 of 7
See accompanying independent auditors' report
Health Care Enterprises, Inc.
Optimum Health Network
Upstate Surgery Center
St. Francis Foundation
St. Francis Physician Services
St Francis - Millennium
Frances Schervier Home and Hospital
Net patient service revenue $ - - 4,016 - 87,022 2,179 43,599
Other revenues - - 44 - 2,699 96 603
Total revenues - - 4,060 - 89,721 2,275 44,202
Expenses:
Salaries, wages, and benefits - 225 1,132 - 86,870 1,493 26,519
Supplies - 3 1,003 - 7,292 195 2,775
Purchased services and other - 77 618 - 17,950 2,863 12,930
Provision for bad debts - - 520 - 2,770 208 58
Depreciation and amortization - - 139 - - - 1,865
Interest - - - - - - 2,023
Total expenses - 305 3,412 - 114,882 4,759 46,170
Income (loss) from continuing operations - (305) 648 - (25,161) (2,484) (1,968)
Nonoperating gains (losses), net:
Nonoperating investment income, net - - (6) 258 - - 147
Loss on early retirement of debt - - - - - - -
Other nonoperating activities, net (67) - - 599 - (253) (115)
Excess (deficit) of revenues over expenses before minority interest (67) (305) 642 857 (25,161) (2,737) (1,936)
Minority interest of consolidated subsidiaries - - (273) - - - -
Excess (deficit) of continuing revenues over expenses (67) (305) 369 857 (25,161) (2,737) (1,936)
Gain on discontinued operations, net - - - - - - -
Excess (deficit) of revenues over expenses (67) (305) 369 857 (25,161) (2,737) (1,936)
Other changes in unrestricted net assets:
Net change in unrealized gains (losses) on other-than-trading securities - - - (48) - - -
Change in classification of interest rate derivatives - - - - - - -
Net assets released from restrictions used for purchase of
property, plant, and equipment - - - - - - -
Transfers to affiliates and other changes, net 23 513 (312) (150) - - -
Net change in equity of joint ventures - - - - - - -
Pension and other postretirement adjustments - - - - - - (587)
Increase (decrease) in unrestricted net assets $ (44) 208 57 659 (25,161) (2,737) (2,523)

BON SECOURS HEALTH SYSTEM, INC. AND SUBSIDIARIES
Consolidating Schedule - Operating InformationNon-Obligated Group Members
(in thousands)
For the Period Ending August 31, 2010
Schedule 2.36 of 7
See accompanying independent auditors' report
Frances Schervier Housing
Development
Bon Secours New York Parent
Corp.
Schervier Long Term Home Health Care OLBH Foundation
Bon Secours Associates, LLC
Bon Secours Assurance
Company, Ltd.Bon Secours Place at St. Petersburg
Net patient service revenue $ - - 10,838 - - - -
Other revenues 1,783 3,024 0 - - 28,398 4,751
Total revenues 1,783 3,024 10,838 - - 28,398 4,751
Expenses:
Salaries, wages, and benefits 303 1,407 2,755 - - - 2,325
Supplies 36 43 59 - - - 360
Purchased services and other 910 1,575 6,934 - - 28,398 1,223
Provision for bad debts - - 208 - - - 21
Depreciation and amortization 376 - 65 - - - 285
Interest 661 - - - - - 159
Total expenses 2,286 3,025 10,021 - - 28,398 4,373
Income (loss) from continuing operations (503) (1) 817 - - - 378
Nonoperating gains (losses), net:
Nonoperating investment income, net 1 - - 23 - - 5
Loss on early retirement of debt - - - - - - -
Other nonoperating activities, net - - - (139) 267 - -
Excess (deficit) of revenues over expenses before minority interest (502) (1) 817 (116) 267 - 383
Minority interest of consolidated subsidiaries - - - - - - (132)
Excess (deficit) of continuing revenues over expenses (502) (1) 817 (116) 267 - 251
Gain on discontinued operations, net - - - - - - -
Excess (deficit) of revenues over expenses (502) (1) 817 (116) 267 - 251
Other changes in unrestricted net assets:
Net change in unrealized gains (losses) on other-than-trading securities - - - 39 - - -
Change in classification of interest rate derivatives - - - - - - -
Net assets released from restrictions used for purchase of
property, plant, and equipment - - - - - - -
Transfers to affiliates and other changes, net - - - - - - 4
Net change in equity of joint ventures - - - - - - -
Pension and other postretirement adjustments - - - - - - -
Increase (decrease) in unrestricted net assets $ (502) (1) 817 (77) 267 - 255

BON SECOURS HEALTH SYSTEM, INC. AND SUBSIDIARIES
Consolidating Schedule - Operating InformationNon-Obligated Group Members
(in thousands)
For the Period Ending August 31, 2010
Schedule 2.37 of 7
See accompanying independent auditors' report
Bellefonte Physician Services
St. Petersburg Home Care Services, Inc.
Maria Manor Health Resources
ConsolidatingEliminations
ConsolidatedNon-Obligated
Group
Net patient service revenue $ 14,224 1,398 - (1) 667,560
Other revenues 284 0 - (30,902) 103,052
Total revenues 14,508 1,398 - (30,903) 770,612
Expenses:
Salaries, wages, and benefits 17,044 908 - 430 439,382
Supplies 1,106 28 - (159) 83,942
Purchased services and other 3,641 383 - (39,006) 222,947
Provision for bad debts 599 (19) - 1 29,689
Depreciation and amortization 223 27 - (1,527) 28,119
Interest 0 - - (1,223) 12,155
Total expenses 22,613 1,327 - (41,484) 816,234
Income (loss) from continuing operations (8,105) 71 - 10,581 (45,622)
Nonoperating gains (losses), net:
Nonoperating investment income, net (31) 0 - 1 966
Loss on early retirement of debt - - - - -
Other nonoperating activities, net - - - (1,590) (6,631)
Excess (deficit) of revenues over expenses before minority interest (8,136) 71 - 8,992 (51,287)
Minority interest of consolidated subsidiaries - - - (1,643) (6,291)
Excess (deficit) of continuing revenues over expenses (8,136) 71 - 7,349 (57,578)
Gain on discontinued operations, net - - - - -
Excess (deficit) of revenues over expenses (8,136) 71 - 7,349 (57,578)
Other changes in unrestricted net assets:
Net change in unrealized gains (losses) on other-than-trading securities - - - 1 405
Change in classification of interest rate derivatives - - - 0 47
Net assets released from restrictions used for purchase of
property, plant, and equipment - - - (1) 709
Transfers to affiliates and other changes, net - 0 - (22,560) 3,754
Net change in equity of joint ventures - - - - -
Pension and other postretirement adjustments - - - 0 (487)
Increase (decrease) in unrestricted net assets $ (8,136) 71 - (15,211) (53,150)