basic facts of growth. solow growth model – a quick...
TRANSCRIPT

Basic facts of growth. Solow growth model – a quick reminder
Advanced Macroeconomics
Joanna Siwińska-Gorzelak

• Most graphs in these slides are from Acemoglu: „Introduction do Modern Economic Growth”
• See: http://press.princeton.edu/chapters/s8764.pdf

The distribution of countries according to GDP per capita

Small differences in growth rates have great implications
Source: T.Picketty; http://piketty.pse.ens.fr/files/capital21c/en/Piketty2014FiguresTablesLinks.pdf

Population weighted distribution of countries
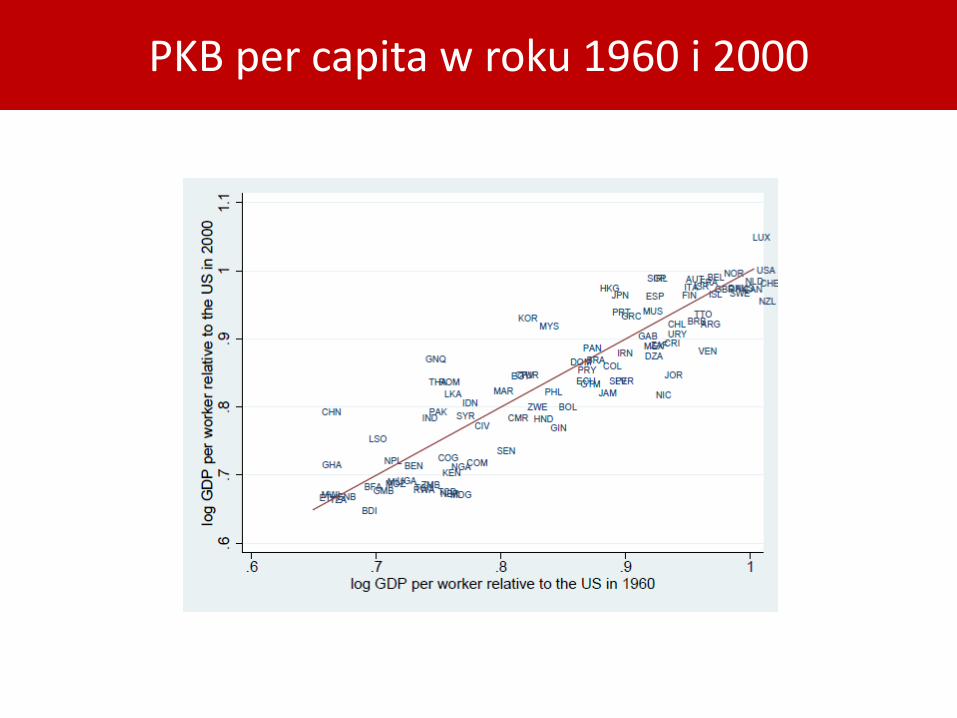
PKB per capita w roku 1960 i 2000

GDP per capita, in 1990 prices
Maddison A. ; http://www.ggdc.net/maddison/
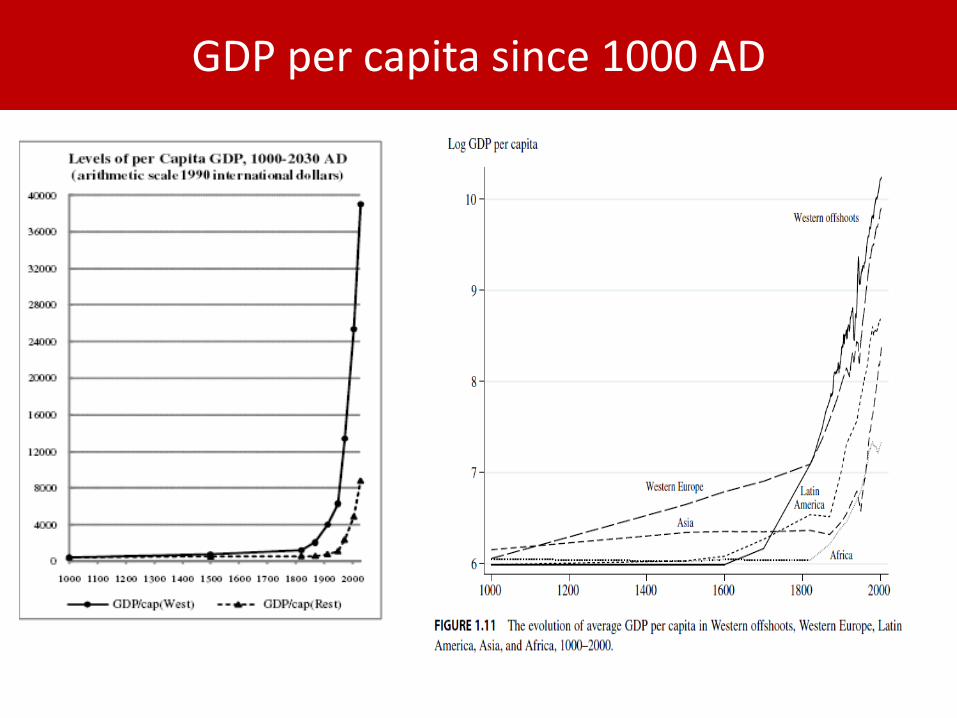
GDP per capita since 1000 AD

GDP per capita

GDP per capita and quality of life

Distribution of world GDP, 2012
Source: T.Picketty; http://piketty.pse.ens.fr/files/capital21c/en/pdf/T1.1.pdf

Poverty in the world

Poverty
• While poverty rates have declined in all regions, progress has been uneven:
• The reduction in extreme poverty was mainly driven by East Asia and Pacific: China & India.
• Half of the extreme poor live in Sub-Saharan Africa.
• A vast majority of the global poor live in rural areas and are poorly educated, mostly employed in the agricultural sector.

Source: T.Picketty; http://piketty.pse.ens.fr/files/capital21c/en/Piketty2014FiguresTablesLinks.pdf

The Solow model
• The Solow model is remarkable for its simplicity
• The Solow model is a good starting point and a springboard for further models
• At the centre of the model is the neoclassical production function
• We will analyze it in continuous time (i.e. we make the time units - the difference between t and t+1 - as small as possible
• From now on, a dot over a variable means the change of this variable over time:
tt x
dt
dx

Neoclassical production function
Yt =F(Kt, AtNt)
• Where K denotes capital, A – technology; N – labour force (population)
• Neoclassical production function is characterised by
1. Constant returns to scale
2. Positive and diminishing marginal products of capital and labour
3. Inada conditions

Neoclassical production function
• 1. Constant returns to scale
• 2. Marginal product of K & N – positive and diminishing
• 3. Inada conditions (what happens at „extremes”)
MPNMPN
MPKMPK
dNdMPNMPN
dLdY
dKdMPKMPK
dKdY
ccNAcKFcY
NN
KK
0
0
lim0lim
lim0lim
.3
00
00
.2
0);(
.1

Further assumptions of the Solow model
• Y=C+I, so that G=0 and NX=0
• The produced good is homogenous and it can change from consumption into investment good at no cost
• The rate of saving is constant and is equal to s, so that S=sY.
• Since Y=C+I, hence sY=I
• The depreciation rate of capital is constant and is equal to d
• The rate of population growth is „n” and the rate of technological progress is „g”
gA
An
N
N

The Solow model
• If we define:
• Then we can express the production function as:
)ˆ(ˆtt
kfy
y
nN
Ng
A
A
AN
Kk
AN
Yy
ˆˆ

Capital accumulation
tt
ttttt
dKsYK
KdKsYKdKIK
1
111
•The increase in capital stock depends on (among others) investment •Note, however that we are more interested in the bahaviour of capital per „effective worker”

Capital accumulation
kgndysk
kgnAN
dKsY
AN
NANAK
AN
KANdt
AN
Kdk
t
t
ˆ)(ˆˆ
ˆ)()(
)(
)(/)(ˆ
22
ky ˆˆ y
k
ksys ˆˆ
kgn
** kgnsk
*k
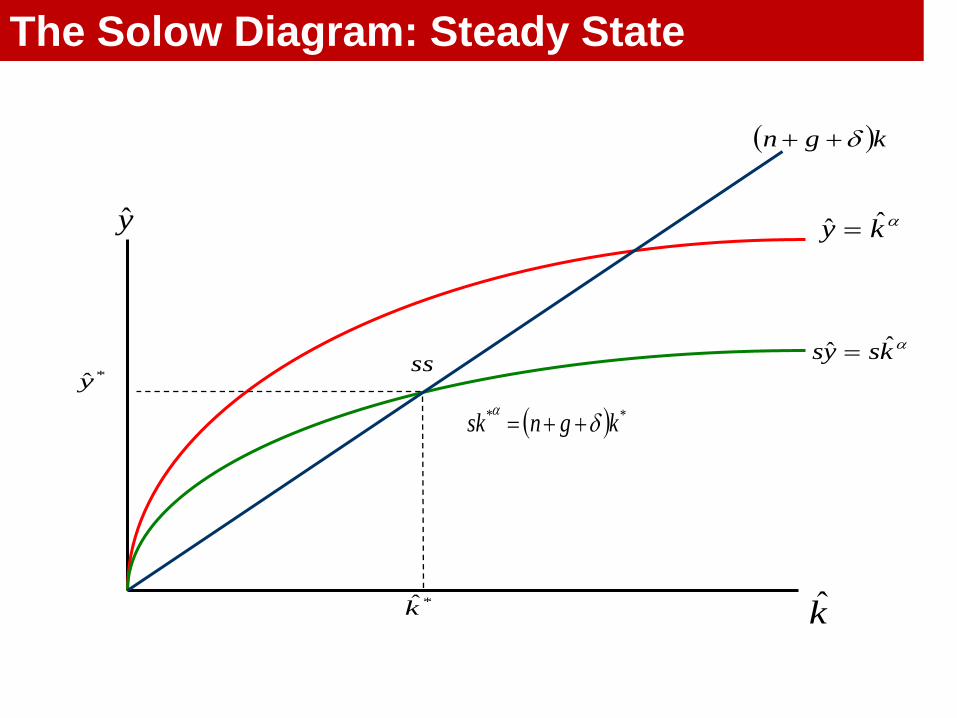
The Solow Diagram: Steady State
ss*y

The steady-state
• In the steady-state:
gA
A
y
y
Ay
Ay
y
y
N
Kk
N
Yy
Define
yk
0ˆ
ˆ
ˆ
)*ˆ(
0ˆ0ˆ

Cobb-Douglas production function – an example
11
`1
ˆ
ˆ
0ˆ
ˆ)(ˆˆ
ˆ)(ˆˆ
gnd
sk
s
gndk
k
kgndksk
kgndysk
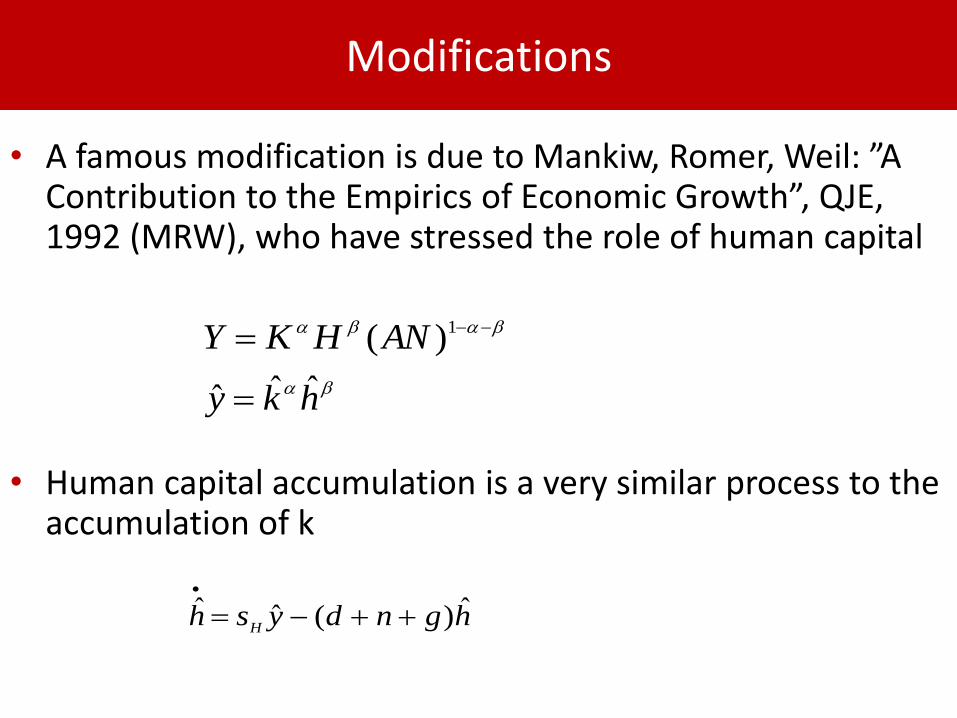
Modifications
• A famous modification is due to Mankiw, Romer, Weil: ”A Contribution to the Empirics of Economic Growth”, QJE, 1992 (MRW), who have stressed the role of human capital
• Human capital accumulation is a very similar process to the accumulation of k
hky
ANHKY
ˆˆˆ
)( 1
hgndyshH
ˆ)(ˆˆ

Empirics
)(1
)ln(1
)ln(1
)ln(ln
)(1
)ln(1
)ln(ln
)(1
)ln(1
)ln(ln
*1
1
gndssAy
gndsAy
gndsAy
gnd
sAy
HK
t
•This approach has been followed by MRW

Empirics - convergence
• Note that Solow model predicts convergence – a very important phenomenon, which we will discuss later

MRW

What have we learnt from the Solow model?
• We have a simple framework that allows us to study implications of capital accumulation and technological progress
• This framework is already quite useful in thinking about the world
• But on the other hand, we have not learn that much
• Technological progress is a black box; so is the saving rate
• Solow model is good at laying out the questions
• We need to dig deeper in order to answer them
• That’s our job for the next 4 weeks.

What are the fundamentals of growth
• Culture
• Climate
• Institutions
• Luck
• Acemolgu: institutions!
• Institutions: „are the rules of the game in a society or are the humanly devised constraints that shape human interactions
Institutions
• Acemoglu argues: • North and South Korea • The colonization of many countries by Europeans after 1492
(large scale natural experiment) • Europeans transformed the institutions of all the conquered
nations • Historical evidence „shows that there has been a remarkable
reversal of fortune in economic prosperity within former European colonies”
• Aztecs, Incas, societies of India were among the richest in the world; now the nations that exist in these boundaries are among the poorest

Institutions and GDP per capita

Acemoglu, Johnson & Robinson (2001)

Acemoglu, Johnson & Robinson (2001)

Conclusions
• Countries are richer if the save more
• Sustained GDP per capita growth rate is due to technological progress
• What factors make people save more? What factors make people invent? Acemoglu says: institutions.