b2-1 - bcuc.com · bc hydro/alcan 2007 electricity purchase agreement alcan report in support of bc...
TRANSCRIPT

B2-1

BC Hydro/Alcan 2007 Electricity Purchase Agreement
Alcan Report
in support of BC Hydro’s Filing under
Section 71 of the Utilities Commission Act
21 September 2007
TABLE OF CONTENTS
1. Overview ................................................................................................................ 1 1.1 Introduction........................................................................................................... 1 1.2 Relief Sought ........................................................................................................ 1 1.3 Circumstances Leading to the 2007 EPA ............................................................. 1 1.4 Reasons for Accepting 2007 EPA ........................................................................ 2 1.5 Outline of Alcan’s Report ...................................................................................... 3 1.6 Contact Information .............................................................................................. 4
2. Alcan Company Profile......................................................................................... 5 3. Alcan’s Operations ............................................................................................... 5
3.1 Worldwide............................................................................................................. 5 3.2 British Columbia ................................................................................................... 7
(a) Kitimat Smelter................................................................................................ 8 (b) Kemano System.............................................................................................. 9 (c) Scale of Alcan’s Operations in British Columbia ........................................... 18
4. Alcan’s Kemano System .................................................................................... 19 4.1 Nature and Quality of the Kemano System ........................................................ 19 4.2 Kemano System Basic Parameters .................................................................... 20 4.3 Reservoir Hydrology ........................................................................................... 24 4.4 Alcan Water Management System and Operating Regime ................................ 24 4.5 Analysis of the Kemano System Generating Capacity ....................................... 25 4.6 Safety of People and Facilities ........................................................................... 27 4.7 Protection of Fish and Fish Habitat..................................................................... 27 4.8 Water Rental Rates ............................................................................................ 28 4.9 Kemano Powerhouse Generating Efficiency ...................................................... 29 4.10 Kemano System Operating Record .................................................................... 29
5. The Modernization Project ................................................................................. 30 5.1 Overview of the Modernization Project ............................................................... 30 5.2 Improved Operating Efficiencies and Performance ............................................ 32
(a) Power Consumption...................................................................................... 32 (b) Environmental Performance.......................................................................... 32 (c) Operational Infrastructure.............................................................................. 33 (d) Labour Requirements.................................................................................... 33
6. 2007 EPA Relationship to the Modernization Project ...................................... 34 7. Availability of Kemano Power for the 2007 EPA............................................... 35
7.1 Power Requirements for the Current Kitimat Smelter......................................... 35 (a) Aluminum smelting process .......................................................................... 35 (b) Smelter power requirements and smelter design .......................................... 37
7.2 Power Requirements during Construction of the Modernization Project............. 39 7.3 Power Requirements after completion of the Modernization Project .................. 41 7.4 Kitimat Smelter Operation after Modernization ................................................... 41
8. Alcan Power Sales .............................................................................................. 42 8.1 Development of the North Coast Grid................................................................. 42 8.2 Interconnection with BC Hydro’s System............................................................ 43 8.3 Power Sales to BC Hydro and to Powerex ......................................................... 44

LIST OF FIGURES
Figure 1 - Map showing location of Alcan facilities in B.C. .............................................. 7 Figure 2 - Aerial view of the Kitimat Smelter ................................................................... 8 Figure 3 - Kemano System.............................................................................................. 9 Figure 4 - Kenney Dam ................................................................................................. 10 Figure 5 - Skins Lake Spillway ...................................................................................... 11 Figure 6 - Tahtsa Intake ................................................................................................ 12 Figure 7 - Kemano Powerhouse.................................................................................... 14 Figure 8 - Aluminum manufacturing process................................................................. 36 Figure 9 - Power available for sale during construction................................................. 40
LIST OF APPENDICES
Appendix A - Alcan’s Final Water Licence Appendix B - Inflows information from 1931 to 2006, with supporting data Appendix C - Power deliveries to Kitimat Smelter and to BC Hydro Appendix D - Total planned outage hours during the period January 1994 to April 2007 Appendix E - Annual aluminium production at Kitimat Smelter from 1954 – 2006 Appendix F - Capacity of transmission lines from Kemano to Prince George Appendix G - Alcan Powerpoint Presentation at Sept. 12th 2007 Workshop

1. OVERVIEW 1.1 Introduction Alcan Inc. (“Alcan”) and BC Hydro have entered into a long-term energy purchase
agreement (“2007 EPA”), a copy of which is being filed by BC Hydro pursuant to section
71 of the Utilities Commission Act. As a counterparty to the 2007 EPA, Alcan is filing
this report in support of BC Hydro’s filing.
Alcan has co-ordinated its report with BC Hydro to complement the information provided
by BC Hydro so the Commission has a comprehensive record from the perspective of
the purchaser and the seller for its review of the 2007 EPA. Alcan’s report focuses on
information about Alcan’s Kemano System and Kitimat Smelter operations because
Alcan is in the best position to provide this information to assist the Commission in its
review of the 2007 EPA. This overview outlines the structure of Alcan's report.
1.2 Relief Sought
Alcan supports BC Hydro’s request that the Commission accept the 2007 EPA for filing
under s. 71 of the Utilities Commission Act (“Act”).
1.3 Circumstances Leading to the 2007 EPA
In 2006, Alcan and BC Hydro negotiated a long-term energy purchase agreement
(“LTEPA+”). LTEPA+ was negotiated in the context of Alcan’s plans to modernize the
Kitimat Smelter (“Modernization Project”). BC Hydro filed LTEPA+ with the Commission
under section 71 of the Act in August 2006, and the Commission convened a review
during the later part of 2006. Ultimately, the Commission disallowed LTEPA+.
BC Hydro and Alcan considered the Commission's reasons for decision and concluded
that a restructured and expanded energy supply contract could be negotiated that met
the needs of both BC Hydro and Alcan while responding to the concerns expressed by
the Commission. The 2007 EPA is the result of those negotiations.
2
1.4 Reasons for Accepting 2007 EPA
Alcan submits that the 2007 EPA is in the public interest and should be accepted under
section 71 of the Act because it satisfies the requirements of section 71 in terms of the
quantity, quality, availability, reliability and cost of the Kemano System power. The
reports from BC Hydro and Alcan elaborate on these points. In summary, the key
points are:
• The quality of the Kemano System power is very high. The Kemano System is
an extremely efficient and reliable generation system.
• The Kemano System is an existing renewable resource in British Columbia with
no development or timing risk.
• The Alcan and BC Hydro system are already interconnected and capable of
delivering the 2007 EPA services.
• Alcan has over 50 years of operating history with the Kemano System so the
characteristics and generating capacity of the system are well understood.
• Alcan and BC Hydro have a long history of cooperation on the operation of the
Kemano System to provide energy and support to BC Hydro’s system. Given
that the Kemano System is located at the end of the BC Hydro’s transmission
line from Prince George, it provides a critical source of local reliability and
reactive support to the BC Hydro system. As a result, BC Hydro customers
receive better and more reliable service than they would otherwise. The 2007
EPA will formalize and enhance services that Alcan has provided on an informal
basis.
• The 2007 EPA is a package of high value products, including scheduling,
capacity, equichange and co-ordination rights that few other resources can offer.
Increasing the coordination between the systems of Alcan and BC Hydro will
enhance the efficiency and benefits of both systems.

3
• Alcan’s Kemano System fits well with the objectives in the Provincial
Government’s Energy Plan II. Energy Policy #25 explicitly refers to the value of
large hydro with storage:
Wind and run of river small-hydro generators also provide a less valuable product individually than do large hydro facilities with storage, since these large hydro facilities combine flexibility benefits with the “firmness” attributes of thermal generation resources.
Alcan has sold electricity to BC Hydro or its predecessor since 1961. Alcan's long-
standing relationship as a supplier to BC Hydro has served both BC Hydro and Alcan
well. Alcan's Kemano System is an efficient and reliable generation source for BC
Hydro, and it is the only significant supply of electricity in the North Coast region.
From Alcan’s perspective, on-going power sales will continue to contribute to the
economic viability of Alcan’s Kitimat Smelter operations. The 2007 EPA has particular
importance to the economic viability of the Modernization Project. Monetizing the power
sales by way of a long-term contract will provide a predictable revenue stream to assist
with the large investment necessary to convert the existing smelting capacity to modern
technology.
1.5 Outline of Alcan’s Report
The balance of this report provides greater details on the following areas to explain
Alcan’s perspective as the seller under the 2007 EPA:
• Alcan’s corporate profile;
• Alcan’s operations worldwide and the Alcan facilities in British Columbia,
including a description of the Kitimat Smelter and the Kemano System;
• The physical characteristics and operation of Alcan’s Kemano System;
4
• The Modernization Project and the relationship of the 2007 EPA to the
Modernization Project;
• The availability of Kemano Power for the 2007 EPA; and
• The history of the Kemano System and Alcan power sales.
1.6 Contact Information Please direct all correspondence to:
Mathieu Bergeron Alcan Inc. #850 – 999 West Hastings Street P.O. Box 16 Vancouver, B.C. V6C 2W2
E-mail: [email protected] Phone: (604) 257-1418
Fax: (604) 257- 1421
And to:
David Bursey Bull, Housser and Tupper 3000 - 1055 West Georgia Street Vancouver, B.C. V6E 3R3
E-mail: [email protected] Phone: (604) 641-4969
Fax: (604) 646-2563

5
2. ALCAN COMPANY PROFILE Alcan Inc. (“Alcan”) is the parent company of an international group involved in many
aspects of the aluminum, engineered products and packaging industries. Through
subsidiaries, joint ventures and related companies, Alcan operates in 61 countries
around the world. The activities of Alcan include bauxite mining, alumina refining,
production of specialty alumina, aluminum smelting, manufacturing and recycling,
engineered products, flexible and specialty packaging, as well as related research and
development. Alcan has approximately 68,000 employees and its 2006 revenues were
approximately $23.6 billion.
Alcan is a public company with its shares traded on the Toronto, New York, London,
Paris and Swiss stock exchanges. Alcan’s head office is in Montreal, Canada.
3. ALCAN’S OPERATIONS 3.1 Worldwide Alcan operates through four Business Groups, each responsible for the different
business units that they comprise:
• Bauxite and Alumina: Headquartered in Montreal, Canada, this Business
Group comprises Alcan’s worldwide activities related to bauxite mining and
refining into smelter-grade and specialty aluminas, owning, operating or having
interests in six bauxite mines and deposits in five countries, five smelter-grade
alumina plants in four countries and six specialty alumina plants in three
countries and providing engineering and technology services.
• Primary Metal: Headquartered in Montreal, Canada this Business Group
comprises smelting operations, power generation, production of primary value-
added ingot, manufacturing of smelter anodes, cathodes, and aluminum fluoride,
smelter technology and equipment sales, engineering services and trading
operations for aluminum, operating or having interests in 22 smelters in 11

6
countries, power facilities in four countries and 11 technology and equipment
sales centres and engineering operations in nine countries.
• Engineered Products: Headquartered in Paris, France this Business Group
produces engineered and fabricated aluminum products including rolled,
extruded and cast aluminum products, engineered shaped products and
structures, including cable, wire, rod, as well as composite materials such as
aluminum-plastic, fibre reinforced plastic and foam-plastic in 52 plants located in
11 countries. Also part of this Business Group are 33 service centres in 11
countries and 33 sales offices in 29 countries.
• Packaging: Headquartered in Paris, France, this Business Group consists of
Alcan’s worldwide food, pharmaceutical and medical, beauty and personal care,
and tobacco packaging businesses operating 150 plants in 30 countries. This
Business Group produces packaging from a number of different materials,
including plastics, aluminum, paper, paperboard, glass and steel.
Favourable aluminium prices in recent years have contributed to growth in Alcan’s
operations. The Kitimat Smelter Modernization Project is one of several major
smelter projects that Alcan is pursuing worldwide:
• Kitimat, B.C., Canada: 400,000 tonne smelter modernization project.
• Saguenay, Quebec, Canada: power plant upgrade and 450,000 tonne
smelter modernization project.
• Isal, Iceland: 460,000 tonne smelter modernization project.
• Coega, South Africa: 720,000 tonne aluminum smelter project.
• Sohar, Oman: 350,000 tonne aluminum smelter joint venture project.

7
• Ma'aden, Saudi Arabia: integrated power plant, bauxite mine, alumina
refinery, and 720,000 tonne aluminum smelter project.
3.2 British Columbia Alcan owns and operates an aluminum smelter, power generation system and related
infrastructure facilities in Kitimat British Columbia. Alcan’s facilities are distributed
throughout a large area of northwest British Columbia, extending from Kitimat to
Kemano on the coast and then to the Kenney Dam on the Nechako River southwest of
Vanderhoof. A brief description of Alcan’s major facilities in British Columbia follows.
Most of these facilities were constructed in the 1950’s.
Figure 1 - Map showing location of Alcan facilities in B.C.
8
(a) Kitimat Smelter
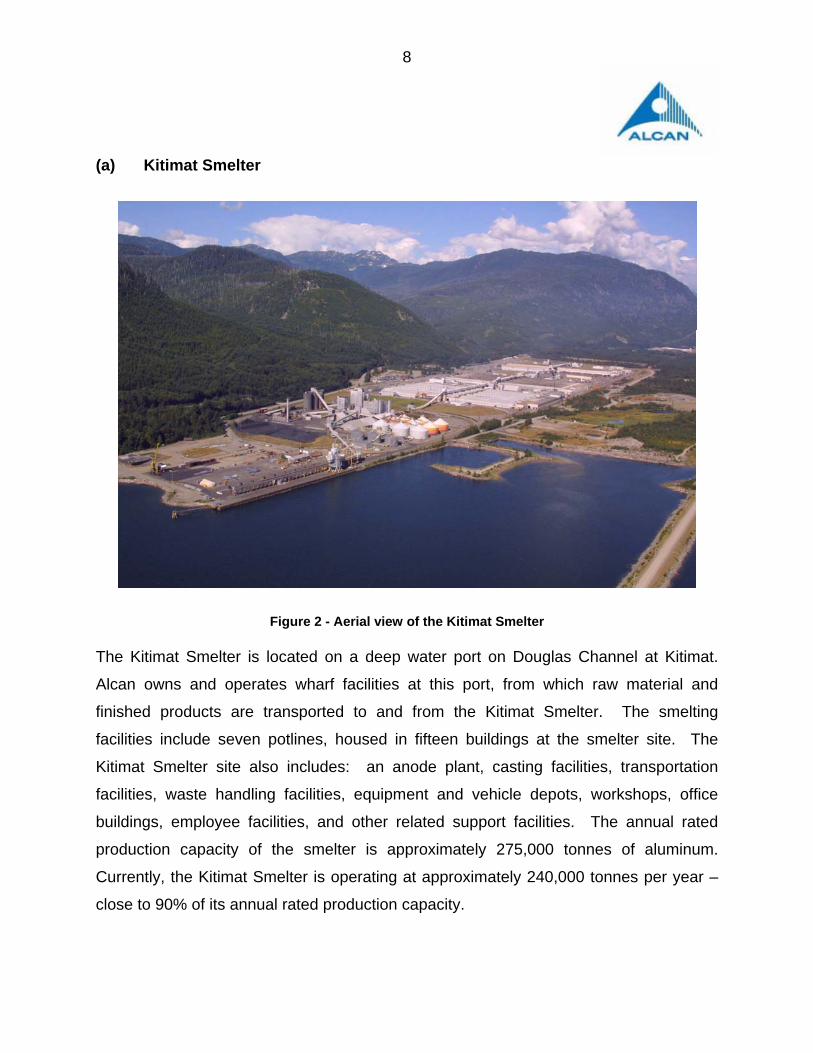
Figure 2 - Aerial view of the Kitimat Smelter The Kitimat Smelter is located on a deep water port on Douglas Channel at Kitimat.
Alcan owns and operates wharf facilities at this port, from which raw material and
finished products are transported to and from the Kitimat Smelter. The smelting
facilities include seven potlines, housed in fifteen buildings at the smelter site. The
Kitimat Smelter site also includes: an anode plant, casting facilities, transportation
facilities, waste handling facilities, equipment and vehicle depots, workshops, office
buildings, employee facilities, and other related support facilities. The annual rated
production capacity of the smelter is approximately 275,000 tonnes of aluminum.
Currently, the Kitimat Smelter is operating at approximately 240,000 tonnes per year –
close to 90% of its annual rated production capacity.

9
Alcan supplies power to its Kitimat Smelter from an extensive hydro-electric generation
system that Alcan owns and operates at Kemano. (“Kemano System”). Kitimat is
about 75 km northwest from Kemano.
(b) Kemano System
Figure 3 - Kemano System
The Kemano System refers to Alcan’s power generation and transmission system. It
has the following basic components:
(i) Nechako Reservoir
The Nechako Reservoir (“Reservoir”) is located on the interior plateau east of the
Coastal Mountains and southeast of Kitimat. The Reservoir was created from a

10
chain of lakes and rivers in the Eutsuk/Tahtsa drainage basin whose natural flow
was impounded by the Kenney Dam. The Reservoir is 233 km (148 mi) long,
stretching to approximately 87 km (54 mi.) southwest of the town of Vanderhoof.
The water surface of the Reservoir when full is 910 km2 (351 mi2). The Reservoir
catchment area (the portion of the watershed that directs water into the
Reservoir) is 13,955 km2 (5,388 mi2). The Reservoir has two water outlets: the
Skins Lake Spillway near the north-centre area; and the Tahtsa Intake at the
western end.
(ii) Kenney Dam
Figure 4 - Kenney Dam
The Kenney Dam is a rock-filled and clay-core dam at the eastern end of the
Nechako Reservoir. It was constructed in the early 1950’s. It is approximately
474 m (1500 ft) in length and 93 m (305 ft) in height, located at the entrance of

11
the Grand Canyon of the Nechako River. The Kenney Dam, together with nine
saddle dams, created the Nechako Reservoir.
(iii) Skins Lake Spillway
Figure 5 - Skins Lake Spillway
The Skins Lake Spillway is a gated concrete water release structure located
about 80 km (50 mi) west of the Kenney Dam on Ootsa Lake. The spillway has
two radial gates. The radial gates are each 10.67 meters square, and each gate
is operated by its own twin wire-rope hoist powered by an electric motor. A
concrete chute 25 meters wide and 25 meters long with side walls conveys water
from the gate structure to the plunge pool.
Water is released from the Nechako Reservoir through the Skins Lake Spillway
to Skins Lake. Downstream of Skins Lake is the Cheslatta River system which in
12
turn flows into the Nechako River at Cheslatta Falls. The Skins Lake Spillway is
used to release Nechako Fisheries Conservation Program (NFCP) regulated
flows as well as flood routing flows into the Nechako River.
(iv) Tahtsa Intake
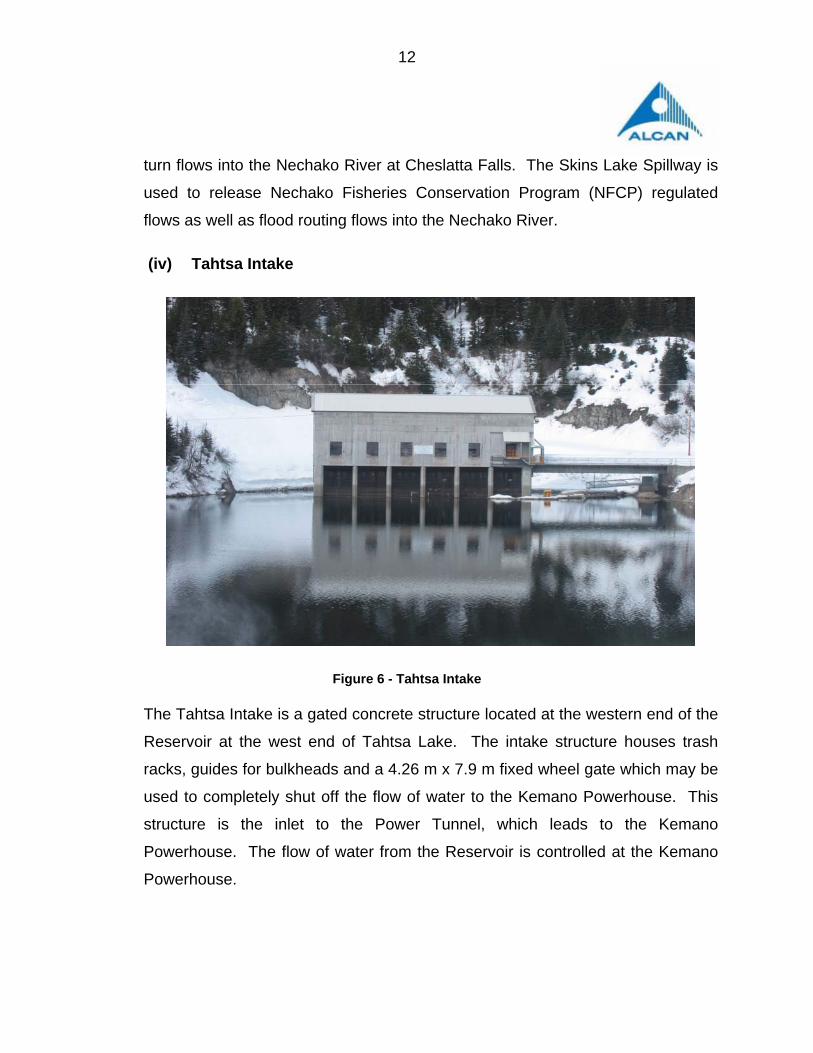
Figure 6 - Tahtsa Intake
The Tahtsa Intake is a gated concrete structure located at the western end of the
Reservoir at the west end of Tahtsa Lake. The intake structure houses trash
racks, guides for bulkheads and a 4.26 m x 7.9 m fixed wheel gate which may be
used to completely shut off the flow of water to the Kemano Powerhouse. This
structure is the inlet to the Power Tunnel, which leads to the Kemano
Powerhouse. The flow of water from the Reservoir is controlled at the Kemano
Powerhouse.

13
(v) Power Tunnel
The Power Tunnel is an arched tunnel, 7.6 m (25 ft) wide and approximately 16
km (10 mi) long, from Tahtsa Lake through Mt. DuBose to the Kemano
Powerhouse. Two sloping, steel-lined penstocks (inlet pipes into the
powerhouse) lead from the western end of the tunnel to the Kemano
powerhouse.
The slope of the tunnel is relatively low dropping only 40.8 meters until it reaches
the entrance to the penstocks inside Mt. Dubose above the powerhouse.
At the point where the power tunnel joins the penstocks, a surge shaft rises at a
46o angle to the surface. The shaft opens to the surface at an elevation of
868.68 meters. The surge shaft provides the plant with a hydraulic cushion to
absorb rapid load changes. Since the generator nozzle needles can open or
close faster than the water in the tunnel can accelerate or decelerate, the surge
shaft absorbs the initial hydraulic change until the water in the tunnel can
compensate.
The power tunnel branches into two 3.35 meter diameter penstocks. The
penstocks descend at an angle of 48o to the powerhouse. They are lined with
steel 51 mm thick. Each penstock branch contains an oil-pressure activated and
remotely controlled butterfly valve located about 91 meters below the “Y”
branching.
Near the powerhouse, each penstock branches into four sections, each of which
supplies water to a single generator. A spherical valve in the penstock of each
unit is used to control the water supply to a single generator.

14
(vi) Kemano Powerhouse
Figure 7 - Kemano Powerhouse
The Kemano Powerhouse is located inside Mt. Dubose at Kemano. The
generating equipment is housed in a chamber excavated from solid rock and
located approximately 426 m in from the face of the mountain. The chamber's
approximate dimensions are 230 m long, 25 m wide and 41 m high.
The elevation difference from the Reservoir surface to the Kemano Powerhouse
is approximately 792 m (2,600 ft). The outflow from the Kemano Powerhouse
(the “tailrace”) discharges into the Kemano River which flows into Kemano Bay
on the Gardner Canal. The Kemano Powerhouse does not have a bypass for

15
water releases. All water released from the Reservoir through the Tahtsa Intake
passes through the Kemano Powerhouse and generates electricity.
The Kemano Powerhouse contains eight 125 MW turbine generator units with a
total installed capacity of 1,000 MW. The eight generating units at Kemano
Powerhouse were installed as follows:
a. Units 1, 2 and 3 were commissioned in July 1954, bringing the installed
capacity to approximately 336 MW (450,400 hp);
b. Unit 4 was commissioned in February 1956, bringing the installed capacity to
approximately 448 MW (600,536 hp);
c. Unit 6 was commissioned in October 1956, bringing the installed capacity to
approximately 560 MW (750,670 hp);
d. Unit 5 was commissioned in July 1957, bringing the installed capacity to
approximately 672 MW (900,804 hp);
e. Unit 7 was commissioned in March 1958, bringing the installed capacity to
approximately 784 MW (1,051,938 hp);
f. Unit 8 was commissioned in 1967, bringing the installed “name-plate”
capacity to approximately 896 MW (1,201,072 hp); and
g. During the 1980’s and 1990’s, Alcan modified the eight generating units to
enhance their generating efficiency (see the description that follows for more
detail) which increased the combined installed capacity to approximately 1000
MW (1,340,483 hp).
The generators were manufactured by three different companies: General
Electric, Westinghouse and English Electric. During the 1980's and 1990's,
Alcan replaced the original mica/asphalt type stator windings with upgraded
16
thermosetting mica/resin windings with a rating of 132 MVA each, which
increased the generating capacity of each unit to 125 MW.
The generator turbines are a 4-nozzle vertical impulse type manufactured by Allis
Chalmers, Pelton and Dominion Engineering. Alcan has replaced the original
turbine runners and needle housings with single, higher efficiency designed units
from VATech in all units except for generator unit number 6. In generator unit
number 6, Alcan has replaced the turbine runner with the new runner, but has not
yet upgraded the needle housing. Alcan expects to replace that needle housing
within the next year.
The power from the generators is stepped up from 13.8 kV to 300 kV by the
generator transformers. A total of 12 transformers are arranged in four banks of
3 single-phase transformers each. Each transformer bank normally takes the
output of 2 generators but the powerhouse bus system allows switching to permit
3 generators to be connected to a single transformer bank for maintenance
purposes. One spare single-phase transformer is located in its own vault in the
powerhouse.
The generator step-up transformers are high efficiency ABB transformers with a
capacity of 132 MVA to match the full capacity throughput of three generators.
The 300 kV transformer output is conducted to the external switchyard via cross-
linked polyethylene (XLPE) insulated cables manufactured by ABB. The cables
run through a 610 m underground cable tunnel to the switchyard, which is
located outside the mountain.
The generating station is controlled from the Kitimat Control Centre using an ABB
Distributed Control System (DCS). The station can also be controlled locally
from the Kemano Control Centre. Maintenance and Operation crews rotate into
the station from Kitimat on a weekly schedule.

17
(vii) Kemano Switchyard
The Kemano Switchyard is laid out in two sections. The first section is on the
south side of the tailrace and consists of two parallel high-voltage (HV) bus bars.
The output from each transformer bank is controlled with an SF6 circuit breaker.
A pair of disconnects permits the HV breaker associated with each transformer
bank to be connected to either HV bus. The two HV busses can be connected
together with a pair of HV disconnects and a Tie circuit breaker. A pair of HV
disconnects associated with the two transmission lines permits their connection
to either of the two HV busses.
A set of high-voltage disconnect switches and overhead cables link the parallel
busses to the second switchyard, located on the north side of the tailrace. The
second yard is the transmission line terminal at the Kemano end. It consists of
line-breakers on each of the two transmission lines along with associated
disconnects allowing the transmission lines to be de-energized or tied together,
as required. All the HV circuit breakers are of the SF6 type and are
manufactured by Alstom. All disconnects are manufactured by Southern States.
The terminal yard also houses the wave traps for a high-speed digital Power Line
Carrier (PLC) that communicates control, relay and alarm data for the DCS
control system using a signal superimposed on the transmission line conductors
(viii) Kemano-to-Kitimat Transmission System
The Kemano-to-Kitimat Transmission System consists of 82 km (51 mi) of double
300-kV circuits, from Kemano to the Kitimat Smelter.
For the first 16 km of the transmission system from the Kemano Powerhouse,
both transmission lines are carried on double circuit towers, gradually climbing
about 300 m in altitude. From this point, the two lines are carried on individual

18
single circuit towers which traverse a mountain pass (Power Line Pass) with a
maximum altitude of approximately 1,625 m for a distance of 16.25 km. One of
the single circuits is carried on steel towers while the other is on a braced H
frame type tower constructed with thin walled aluminum tubes and a box girder
cross-arm. This section of the transmission line was originally built to transmit
the planned ultimate capacity of the Kemano powerhouse of 1,600 MW.
The lines then descend to the Kildala valley where they resume on double circuit
steel towers down the valley, around Kildala Arm and over Green Mountain to the
terminal station at Kitimat.
(ix) Kitimat Switchyard
The Kitimat Switchyard is located adjacent to the Kitimat Smelter site. The
Kitimat Busbar referred to in power sales contracts is located at the Kitimat
Switchyard. The Kitimat Busbar is the point of interconnection between the
transmission systems of Alcan and British Columbia Hydro and Power Authority
(“BC Hydro”).
(c) Scale of Alcan’s Operations in British Columbia Currently, Alcan has approximately 1,500 active full-time employees in its British
Columbia operations. Alcan also hires additional workers on a part-time or contract
basis, from time to time, as needed. Alcan's direct contribution to the BC economy in
2006 totalled approximately $275 million, including money spent by Alcan on: goods
and services purchased from BC Suppliers; employee payroll and benefits; pension
payments; and property taxes.
19
4. ALCAN’S KEMANO SYSTEM 4.1 Nature and Quality of the Kemano System
The Kemano System is a large hydro-electric system with unique features that
distinguish it as an efficient and reliable source of generation, capacity, and storage for
BC Hydro:
• The large elevation difference from the Reservoir surface to the Kemano
Powerhouse, approximately 792 m (2,600 ft), makes the Kemano System an
efficient generator of electricity from the water used.
• The Kemano System has been designed, built and maintained to high standards
because Alcan requires a high degree of reliability to serve the Kitimat Smelter’s
requirements.1
• The Kemano System has a large measure of redundancy designed into the
system to assure a reliable base of generation for the smelter.
• Alcan has over 50 years of operating history with the Kemano System so the
characteristics and generating capacity of the system are well understood.
• Alcan and BC Hydro have a long history of cooperation on the operation of the
Kemano System to provide energy and support to BC Hydro’s system. As a
result, BC Hydro customers receive better and more reliable service than they
would otherwise.
• The Alcan and BC Hydro system are already interconnected and capable of
delivering the 2007 EPA services.
1 In addition, Alcan’s management practices for its operations in British Columbia comply with internationally-recognized management standards, including: ISO 9001:2000 for its Quality Management System; ISO 14001:2004 for its Environmental Management System; and OHSAS 18001:1999 for its Occupational Health and Safety Management System.

20
4.2 Kemano System Basic Parameters The basic parameters of Alcan’s Reservoir, Kemano Powerhouse, and Kemano-to-
Kitimat transmission system (“Kemano System”) are set out in the following table.
KEMANO SYSTEM BASIC PARAMETERS
Kemano Powerhouse generation capacity (following recent upgrades)
1000 MW
Kemano Powerhouse nameplate generation capacity (original equipment capacity)
896 MW
Maximum dependable generation capacity 860 MW
Expected long-term average generation 793 MW
Expected long-term generation (92% reliability2) 730 MW
Expected long-term generation (100% reliability) 700 MW
Reservoir – licensed live storage 7,100 cubic hectometres
Reservoir – useable live storage (due to Tahtsa Narrows restriction)
3,400 cubic hectometres
Reservoir – Water License maximum rate for the diversion and use of water for power generation
170 m3/s
Transmission line losses from Kemano to Kitimat Smelter
up to 20 MW
Annual historical long term average inflows (1955- 2006)
194.0 m3/s
Annual Skins Lake releases required for fisheries
• Nechako Fisheries Conservation Program: 36.8 m3/s
• Cooling Water Average Requirements: 15.7 m3/s
52.5 m3/s
Kemano discharge required to generate 860 MW
136.0 m3/s
Kemano discharge required to generate 730 MW
112.4 m3/s
2 Reliability data is expressed in terms of the Kemano System as a stand-alone project, rather than in coordination with BC Hydro’s system.

21
Further explanation of the parameters follows:
(a) Kemano Powerhouse current generation capacity
The combined generation capacity of the eight generating units in the
Kemano Powerhouse is 1000 MW. This capacity was achieved by the
efficiency upgrades to the generating units in the 1980’s and 1990’s.
(b) Kemano Powerhouse nameplate generation capacity
The combined original design (referred to as "nameplate") capacity of the
eight generating units in the Kemano Powerhouse is 896 MW.
(c) Maximum dependable generation capacity
The Power Tunnel has a hydraulic restriction that limits the amount of water
that can safely be passed through to the Kemano Powerhouse. Because of
this restriction, the peak generation capacity of the Kemano Powerhouse is
approximately 880 MW to 900 MW, which can only be sustained for short
periods of time. The maximum that the Kemano Powerhouse can
dependably generate on a sustained basis is 860 MW, so long as sufficient
water is available.
(d) Expected long-term average generation
Based on the historic inflows and expected performance of the
Kemano System, Alcan estimates the long-term generation from the Kemano
System to be approximately 793 MW on average. The generation simulation
model is described further in sections 4.4 and 4.5.
22
(e) Expected long-term generation (92% reliability)
Based on the historic inflows and expected performance of the Kemano
System, Alcan estimates that the Kemano System can reliably produce 730
MW of power on a long-term basis 92% of the time. Given that the
transmission losses would decrease to approximately 15 MW at low
generation, Alcan estimates that the Kemano System can deliver the
electricity requirements of the Kitimat Smelter and the Tier 1 Electricity
Quantities under the 2007 EPA with a reliability of at least 95%, or even
higher considering the synergy with the BC Hydro system provided by the
equichange and coordination services.
(f) Expected long-term generation (100% reliability)
Based on the historic inflows and expected performance of the Kemano
System, Alcan estimates that the Kemano System can reliably produce 700
MW on a long-term basis 100% of the time. This is the estimated level of
reliable generation upon which the Modernization Project is designed, which
is more stringent than required to support the 2007 EPA Tier 1 Electricity
Quantities.
(g) Reservoir – licensed live storage
Alcan’s Final Water Licence No. 102324 states that “[t]he maximum quantity
of water which may be stored is 23,850 cubic-hectometres, of which 7,100
cubic-hectometres is live storage”. Attached as Appendix A is a copy of
Alcan’s Final Water Licence.
“Live storage” is that portion of total maximum licensed storage that Alcan
may actually use for power production. The maximum operating level is
largely determined by the characteristics of various facilities in the Reservoir

23
such as the height of the Skins Lake Spillway and the nine saddle dams. The
Reservoir’s licensed maximum operating level is El. 853.44 m above sea level
(2,800 ft) and the minimum operating level is approximately El. 844.30 m
above sea level (2,770 ft), providing a licensed operating drawdown range of
9.14 m (30.0 ft).
(h) Reservoir – useable live storage (due to Tahtsa Narrows restriction)
Alcan can only access 3,400 cubic-hectometres, approximately 48% of the
licensed 7,100 cubic-hectometres of live storage, for power generation
because of the hydraulic restriction created by Tahtsa Narrows, located at the
entrance to Tahtsa Lake at the western end of the Reservoir. Tahsta
Narrows is a natural restriction in the Reservoir bathymetry. Once the
Reservoir level drops below approximately El. 849.5 m (2,787 ft) above sea
level, Tahtsa Narrows restricts the water that can pass from the eastern
portion of the Reservoir to Tahtsa Lake to the west and then to the Tahtsa
Intake. Tahtsa Narrows limits the usable drawdown in the Reservoir to the
top 3.96 m (13.0 ft). Alcan normally operates the Reservoir with a range of
3.04 m (10 ft).
(i) Reservoir – Water License maximum rate for the diversion and use of water for power generation
Alcan’s Final Water Licence No. 102324 authorizes the diversion and use for
power generation of up to 170 m3/s.
(j) Transmission line losses from Kemano to Kitimat Smelter
The transmission line loss from Kemano to the Kitimat Smelter is up to 20
MW, depending on the transmission load.
24
4.3 Reservoir Hydrology The “water year” is measured from November 1st to October 31st. Inflow to the
Reservoir comes mainly from melting of the winter snowpack, referred to as the “spring
freshet”. Rainfall also contributes a significant amount of inflow to the Reservoir, mostly
during the fall, although the fall contribution is usually less than the spring freshet.
Typically, the largest monthly inflows occur in June and July and the smallest inflows
occur in January and February. Typically, the Reservoir level reaches its lowest level
for the year by the end of April and its highest level for the year by the end of July or
August.
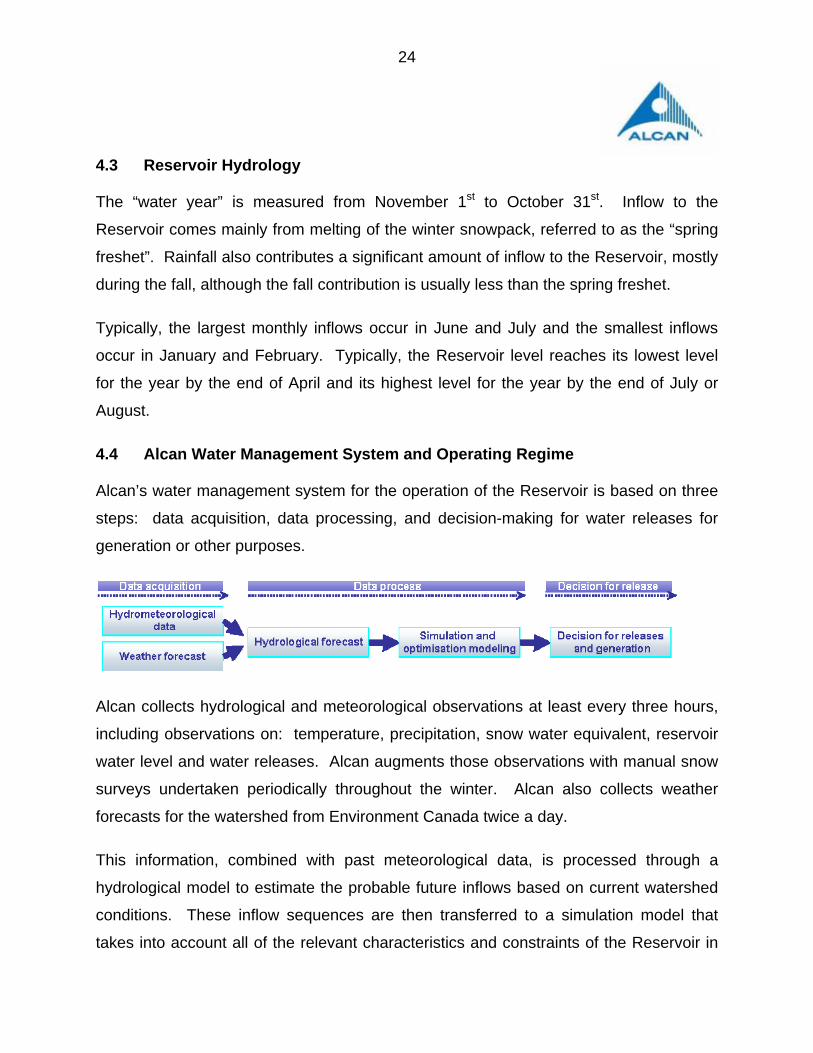
4.4 Alcan Water Management System and Operating Regime Alcan’s water management system for the operation of the Reservoir is based on three
steps: data acquisition, data processing, and decision-making for water releases for
generation or other purposes.
Alcan collects hydrological and meteorological observations at least every three hours,
including observations on: temperature, precipitation, snow water equivalent, reservoir
water level and water releases. Alcan augments those observations with manual snow
surveys undertaken periodically throughout the winter. Alcan also collects weather
forecasts for the watershed from Environment Canada twice a day.
This information, combined with past meteorological data, is processed through a
hydrological model to estimate the probable future inflows based on current watershed
conditions. These inflow sequences are then transferred to a simulation model that
takes into account all of the relevant characteristics and constraints of the Reservoir in

25
its calculations. The simulation model is used to estimate the outcome of a range of
hypothetical generation and spillway release scenarios. Alcan then undertakes a
sensitivity analysis to assess the implications of the power generation and spillway
release scenarios to determine the optimum operating scenario.
Alcan’s plans and manages the operation of the Reservoir based on the results of this
analysis. The goal is to make best use of the available water. Alcan incorporates the
most current information into the analysis on an ongoing basis to update the results as
necessary, and then adjusts the Kemano System operation accordingly. Alcan co-
ordinates the generation of power taking into account the terms of its water licence,
directives from the British Columbia Comptroller of Water Rights (“Water Comptroller”),
Kitimat Smelter requirements, and Alcan’s other commitments.
Under normal conditions, the generation will be set at approximately 790 MW. The
actual generation from day-to-day will be adjusted as the operating model results are
updated for reservoir conditions and inflows. If the risk of spilling becomes significant,
the generation will be increased. If the reservoir elevation drop and inflows are low, the
generation will be reduced until the reservoir conditions improve.
4.5 Analysis of the Kemano System Generating Capacity Alcan assesses the generating capacity of the Kemano System using its Reservoir
Operating Model (ROM). The ROM is a simulation model that calculates the generation
that would be available if the future reservoir inflows were equivalent to the inflow
sequences observed in the past. The ROM differs from the operational model because
it is used to study the capacity of the Kemano System rather than to operate it. Alcan
uses the historical daily inflows to the Reservoir from 1955 to 2006 as the data set to
study the capacity of the Kemano System.
26
Alcan believes the 50-year period it uses in the model is sufficiently representative to
project the future probabilities for generation. Attached as Appendix B is a graph
showing the inflows information from 1931 to 2006, with the supporting data.
The inflow data for the period 1931 to 1950 is synthesized based on measurements
taken in other watersheds near the Nechako watershed. The information was
developed for Alcan by the B.C. International Engineering Company in 1951 for Alcan's
planning of the original Kemano project.
Conditions related to the Reservoir and Kemano Powerhouse operation have changed
over time as certain legal requirements have been established, interconnection capacity
has increased, and equipment improvements have increased generation efficiency.
Alcan undertook an extensive upgrades to its generator units and other parts of the
Kemano System starting in the 1980’s.3 During the upgrade program, Alcan removed
generating units from service at opportune times to accomplish the upgrade work. For
example, during the period of 1994 to 1997, Potline 7 was shut down which created an
opportunity to schedule Kemano System upgrade work. These sort of events affect the
generation statistics during the historical time period and must be considered in
estimated the future generating capability of the Kemano System. Attached as
Appendix C is a graph showing the power deliveries to Kitimat Smelter and to BC Hydro
which indicates some of the notable events that have altered the power requirements at
the Kitimat Smelter and affected its power requirements.
Rather than using historical generation data, therefore, Alcan simulates future
generation based on the current Reservoir and Kemano Powerhouse operating
conditions, including the current physical characteristics and capabilities, operating
constraints, and anticipated smelter loads.
3 See the description in section 3.2 (b) (vi).

27
4.6 Safety of People and Facilities Alcan must operate the Reservoir in a manner that ensures public safety and is within
the safe operational margins of its facilities. Historically, the largest Nechako Reservoir
inflow volume has resulted mostly from snowmelt in the spring and early summer.
Winter inflows are less than required for generation and have to be supplemented with
stored water, resulting in the reservoir being drawn down. Additional releases are
scheduled when the volume of inflow forecast is greater than the combined volume of
storage available in the Reservoir and the amount scheduled to be released for fisheries
and generation purposes. If Alcan anticipates excess inflows, it will increase the
available storage by releasing water in advance of the freshet to create space in the
Reservoir. This reduces the amount of water that would otherwise be released in late
May and June, during peak flows in the Fraser River.
Alcan meets with the Water Comptroller at least twice a year to review the operational
status of the Reservoir. The Water Comptroller has jurisdiction over dam safety and
water management generally and may issue directives to Alcan regarding the
management of the Reservoir. The Reservoir is also the principal means of flood
control for the Nechako River and the Fraser River.
4.7 Protection of Fish and Fish Habitat Pursuant to the 1987 Settlement Agreement among the Province of British Columbia,
Canada and Alcan and the 1997 Settlement Agreement between the Province of British
Columbia and Alcan, Alcan committed to maintain certain water releases from the
Reservoir to the Nechako River for fisheries purposes. The water releases are made
under the direction of the Nechako Fisheries Conservation Program (“NFCP”), which
was established under the 1987 Settlement Agreement and comprises representatives
from Alcan, Canada, and the Province.
The quantity of water released for fisheries purposes is equivalent to a mean annual
flow of 36.8 m³/s (1,300 cfs) measured at Skins Lake Spillway, plus additional flows in

28
July and August for cooling purposes. This water allocation is managed by the NFCP
Technical Committee, with Alcan making releases as directed by the Committee. The
releases range, on a mean monthly basis, from about 31 m³/s (1,100 cfs) in the winter
to about 49 m³/s (1,730 cfs) in the summer, excluding cooling water releases.
From mid-July until mid-August, additional cooling water is released from the spillway to
manage water temperatures downstream for migrating sockeye salmon. Releases are
made depending upon meteorological conditions so that the total flow into the Nechako
River below Cheslatta Falls ranges between about 170 m³/s (6,000 cfs) and 283 m³/s
(10,000 cfs). The maximum release of 283 m³/s (10,000 cfs) into the Nechako River
has been set by the Provincial Water Management Branch, in consultation with Alcan
and DFO, to minimize flooding downstream on the Nechako River.
Excess water from flood inflows are released as necessary. Such releases are
scheduled in consultation with the Water Comptroller and the NFCP Technical
Committee.
Pursuant to a protocol worked out with the Haisla First Nation, Alcan also regulates the
release of water from the Kemano Powerhouse into the Kemano River during the spring
to provide a stable water flow for eulachon spawning and to protect against dewatering
of incubating eulachon eggs. Alcan calculates the appropriate water flows annually and
reviews the annual release regime with the Water Comptroller.
4.8 Water Rental Rates Pursuant to the terms of the 1950 Agreement, the water rental rate that Alcan pays
varies according to the use made of the power generated from the water. For the
energy Alcan uses in processes that contribute to the production of aluminum or sells as
secondary power (i.e. energy for the production of steam or otherwise in direct
competition with fuel), Alcan pays a water rental rate that is tied to the price of
aluminum. For all other energy generated, Alcan pays the water rental rate that other

29
similarly-situated hydroelectric generators would pay, including BC Hydro. The water
rate Alcan that pays for power sold to third parties is the standard General Power
Generation rate that is applicable to hydropower production.
4.9 Kemano Powerhouse Generating Efficiency The 792 m (2,600 ft.) elevation drop from the Reservoir to the Kemano Powerhouse
creates an exceptionally high hydraulic head. The water diverted from the Reservoir
enters each turbine at the Kemano Powerhouse at approximately 1,100 psi. As a
result, the Kemano System generates a high ratio of electricity from the water it uses –
approximately 6.3 to 6.5 MW per cubic meter per second of water on average,
depending on reservoir elevation and other conditions.
The maximum flow through the power tunnel is dependent on the reservoir elevation at
the tunnel intake. Higher flows are possible at higher reservoir elevations. The
maximum flow through the power tunnel is approximately 142 m3/sec. At higher flows,
air may be entrained in the water column by drawing it down the surge shaft.
With the hydraulic limit of the tunnel, the generating station cannot run at its theoretical
maximum output of approximately 1,000 MW and is instead limited to a peak capacity in
the range of 880 to 900 MW and maximum dependable capacity of approximately 860
MW. (see the description in section 4.2 (c) for more details.)
4.10 Kemano System Operating Record The operating data since 1994 provides the best representation of the future
performance of Kemano because Alcan invested a considerable amount on a complete
rewind of all eight generators in the 1980’s and early 1990’s and has since invested
approximately C$45 million on further enhancements to Kemano generation. Generator
availability, including maintenance outages averages 94% to 95% annually.
Maintenance outages decreased after 1997 because Alcan had completed significant

30
upgrade work by that time. Alcan expects the maintenance outages to remain at the
post-1997 level in the future.
Attached in Appendix D is a table that lists the total planned outage hours, maintenance
outage hours, forced outage hours, the number of forced outages, and generation shed
hours for each month during the period January 1994 to April 2007. “Planned outages”
are preventative maintenance and inspections. “Maintenance outages” are corrective
actions that must be taken on relatively short notice and are unplanned. “Generation
shed” are a generator trips requested by BCTC.
The total possible number of machine hours each year is 70,080 (8 generators
multiplied by 8,760 hours). In most years between 1994 to 2005, forced outages
represent less than 1% of total possible machine hours. The noticeable anomaly is
1996 and 1997. Between April 1996 and February 1997, one of the eight generating
units failed and required significant work.
5. THE MODERNIZATION PROJECT 5.1 Overview of the Modernization Project On 14 August 2006, Alcan announced Alcan's plan to modernize and expand its Kitimat
Smelter (“Modernization Project”). The implementation of the modernization project
was subject to several conditions, including:
• the receipt of any required environmental permits,
• a successful conclusion of the power sale agreement with BC Hydro, and
• an agreement with the Canadian AutoWorkers (CAW), Local 2301 to extend the
term of the collective labour agreement to 2012.
31
Once these conditions are met, the application for final approval will be submitted to
Alcan’s Board of Directors. In May 2007, Alcan reached an agreement with the CAW
and is currently working to satisfy the other two conditions.
The Kitimat Smelter currently uses Vertical Stud Söderberg (“Söderberg”) technology
which is less efficient and more labour-intensive than the modern generation of
technology that is typically used in new or updated smelters. Söderberg technology is
the original technology installed at the Kitimat Smelter when the potlines were
constructed in the 1950’s and 1960’s. Söderberg technology has been surpassed by
other technologies, notably AP technology which has been the preferred choice for new
smelter installations in recent years because of its superior smelting efficiency,
operating efficiency, and environmental performance.
Alcan is proposing to modernize the Kitimat Smelter by replacing the existing Söderberg
technology with proprietary state-of-the-art AP3X “pre-bake” anode technology. The AP
technology is known to be the most advanced, efficient and environmentally sound
technology available. AP technology was developed by Pechiney SA. Alcan acquired
Pechiney SA in December 2003 and now owns the AP technology.
AP technology has progressed through several generations of smelting pot designs,
each generation using a higher level of amperage than the last to improve the smelting
efficiency. The generation of AP technology is identified by a number that denotes the
amperage used – for example, AP18 denotes 180,000 amps, AP30 denotes 300,000
amps, and AP 35 denotes 350,000 amps. Alcan plans to modernize the Kitimat Smelter
by replacing the existing Söderberg technology potlines with AP3X series technology.
AP 3X denotes that the amperage may be greater than 350,000 amps. Related
facilities at the Kitimat Smelter would also be upgraded or constructed to support the
smelting technology modifications.

32
AP technology pots differ substantially from the Söderberg technology pots currently
employed at the Kitimat Smelter. AP technology pots are much larger and operate at
higher amperages. They also use an anode that is “pre-baked”.
Converting to AP technology will extend beyond the design of the pots. It will extend to
the building configuration, the cranes that service the pots, the design of the anode
baking and anode assembly areas, and specialized vehicles that operate in the
potrooms. The technology is an integrated package covering all aspects of the smelter.
Alcan estimates its overall investment in the Modernization Project would be
approximately US $1.8 billion. After completion of the Modernization Project, the
Kitimat Smelter would be a large smelter by world standards, and among the largest of
the smelters that Alcan owns. Alcan expects the Modernization Project would extend
the life of the Kitimat Smelter by more than 35 years.
5.2 Improved Operating Efficiencies and Performance Installing modern smelter technology at the Kitimat Smelter would improve operating
efficiency and increase its environmental and economic performance. AP technology is
more efficient than Söderberg technology in several important respects:
(a) Power Consumption AP technology uses approximately 30% less power to produce an equal amount of
aluminum than Söderberg technology.
(b) Environmental Performance AP technology consumes fewer resources and creates less environmental impact than
Söderberg technology in the smelting process. In a prebake pot, alumina additions and
anode effect treatments will take place within the totally enclosed pot. Removable
doors will provide access for anode replacement. Emissions generated by the process
will be contained within the enclosed pot and drawn off by an emission collection

33
system. Emissions treatment will be carried out in dry scrubbers. Certain components
of the emissions captured by the scrubbing process will be returned to the production
process for re-use.
The total waste discharge from the modernized Kitimat Smelter would decrease by
approximately 44%, even though aluminum production capacity would increase by
approximately 40%. Importantly, polycyclic aromatic hydrocarbon (PAH) releases to the
environment would decrease by approximately 97%, greenhouse gases would decrease
by approximately 55% and fluorides would decrease by approximately 75%. Further,
the work environment at the modernized Kitimat Smelter would be cleaner, quieter and
safer.
(c) Operational Infrastructure Since the AP pots are larger and more efficient, they will produce metal at
approximately three times the rate of a Söderberg pot. The modernized potline would
include up to 372 pots housed in six buildings with a total rated capacity of about
400,000 tonnes per year. By comparison, the existing Kitimat Smelter has a total of 900
smaller pots in 15 buildings with a total rated capacity of about 275,000 tonnes per year.
The modernized pots cost less to operate and maintain. They also require less support
equipment. For example, potroom cranes would be reduced from 29 to 10 and potroom
vehicles that support the Söderberg process would be replaced by equipment that is
integrated into the pot structure. Overall, the entire infrastructure (pots, buildings,
support equipment, lighting, heating) would be reduced.
(d) Labour Requirements With fewer pots, less infrastructure, and greater automation, less labour would be
required. Alcan expects the Modernization Project would have the following
implications:

34
• The Modernization Project would secure approximately 1,000 stable, technically-
enriched jobs in Alcan’s British Columbia operations in the long-term that might
otherwise have been lost at the end of the current Söderberg-based Kitimat
Smelter life cycle.
• During construction, Alcan expects the additional jobs associated with the
Modernization Project work would exceed 1,000 over the full construction period.
• Because of the high level of automation associated with AP technology, the work
force would require a correspondingly high level training and expertise. Alcan
plans to retrain its work force to acquire the necessary skills. Alcan plans to
achieve the transition from current work force level to the post-Modernization
Project level through normal attrition, including retirements and annual staff
turnover.
6. 2007 EPA RELATIONSHIP TO THE MODERNIZATION PROJECT
The Kemano System produces more power than the Kitimat Smelter requires. Alcan
has sold power to others, mostly BC Hydro and Powerex, for many years.
The revenue from these power sales contributes to the economic performance of
Alcan’s Kitimat operations. The 2007 EPA will therefore be important for Alcan even if
the Modernization Project does not proceed.
Securing a satisfactory long-term power sales agreement has particular significance in
the context of the Modernization Project because of the large investment required to
replace the existing Söderberg technology with the AP technology. When evaluating
the Modernization Project as an investment opportunity relative to other opportunities, it
is important for Alcan to have confidence in the revenue stream associated with the
power sales. Without the certainty of the 2007 EPA revenue stream, other Alcan
projects rank higher as investment opportunities. For these reasons, the 2007 EPA is a
necessary condition to support a decision to proceed with the Modernization Project.

35
The Modernization Project is not, however, a necessary condition for the 2007 EPA to
proceed. The 2007 EPA is an independent and mutually-beneficial power sales
arrangement between Alcan and BC Hydro. If Alcan does not undertake the
Modernization Project, the 2007 EPA would remain in place until the end of its term in
2034.
7. AVAILABILITY OF KEMANO POWER FOR THE 2007 EPA
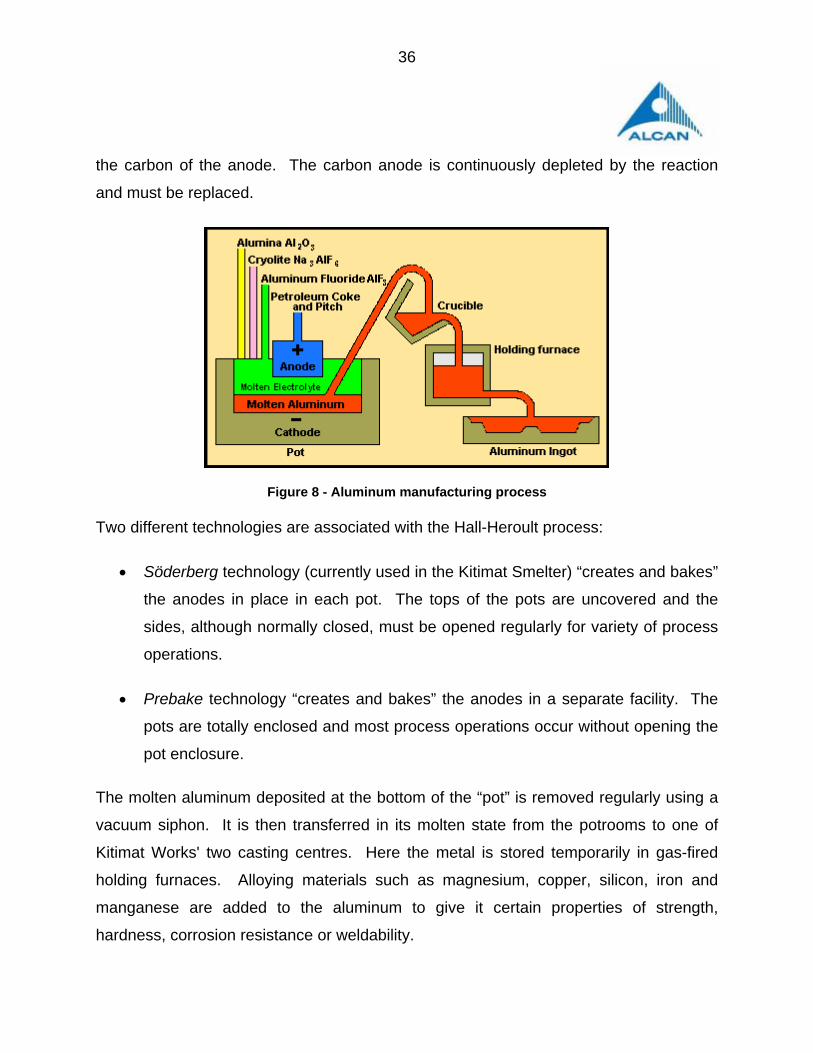
7.1 Power Requirements for the Current Kitimat Smelter (a) Aluminum smelting process Aluminum is an abundant metallic element. In its natural state, aluminum is always
found in combination with other elements, never in its free state. It is commonly found
in the form of oxides. The process of making metallic aluminum is carried out in two
successive stages: a chemical process to extract anhydrous aluminum oxide from the
bauxite, and an electrolytic process to reduce the alumina to aluminum.
Aluminum is produced by the electrolytic reduction of alumina through a process known
as the Hall-Heroult process. In this process, an electric current breaks down the
alumina, causing the aluminum and oxygen atoms to separate. This reaction takes
place in large cells or “pots”, through which an electrical current is passed. The current
Kitimat Smelter design has more than 900 pots configured into 7 potlines that are
housed inside buildings called "potrooms."
The bottom and sides of each pot act as the cathode or negative electrode and contain
the molten electrolyte composed mostly of cryolite and aluminum fluoride. The alumina
ore is dissolved into this molten electrolyte in the pots. Carbon blocks suspended just
above the cathode, serve as the anode or positive electrode. When the electrical
current passes through the mixture, flowing from the anode to the cathode, the molten
aluminum molecules settle to the bottom of the “pot” while the oxygen combines with
36
the carbon of the anode. The carbon anode is continuously depleted by the reaction
and must be replaced.
Figure 8 - Aluminum manufacturing process Two different technologies are associated with the Hall-Heroult process:
• Söderberg technology (currently used in the Kitimat Smelter) “creates and bakes”
the anodes in place in each pot. The tops of the pots are uncovered and the
sides, although normally closed, must be opened regularly for variety of process
operations.
• Prebake technology “creates and bakes” the anodes in a separate facility. The
pots are totally enclosed and most process operations occur without opening the
pot enclosure.
The molten aluminum deposited at the bottom of the “pot” is removed regularly using a
vacuum siphon. It is then transferred in its molten state from the potrooms to one of
Kitimat Works' two casting centres. Here the metal is stored temporarily in gas-fired
holding furnaces. Alloying materials such as magnesium, copper, silicon, iron and
manganese are added to the aluminum to give it certain properties of strength,
hardness, corrosion resistance or weldability.
37
Once the aluminum is ready to be cast, it is poured into moulds in a machine known as
a direct chill casting machine. This machine uses water to cool the molten aluminum
once it has passed through the mould. The mould gives the aluminum its final shape.
(b) Smelter power requirements and smelter design Smelters operate continuously – 24 hours per day, 365 days per year. The power
supply must be available at all times. Smelters are therefore sized within the limits of
the reliably firm power supply.
Smelters require reliable power supply to avoid costly potline shutdowns caused by
power interruptions. Once power is lost, metal production ceases. After two hours,
restarting the process will result in increased manual intervention, increased health
exposure for workers, and increased environmental emissions loading. If the process
can be restarted, it will take many hours to stabilize the process and begin metal
production. If the power interruption is greater than four hours, the molten electrolyte in
the pots will begin to solidify. Once the electrolyte starts to solidify, the ability to restart
the smelting process is limited. If the supply of power is not restored within that critical
timeframe, the pot will become inoperable. Smelter equipment can also be damaged in
the shutdown and subsequent restart operations since these events push the
equipment to its limits.
The process required to restart a potline depends on the circumstances in which the line
was shutdown. If there was time to siphon metal from the pots and lower the anodes
into the metal, to prevent the electrolyte from freezing as a layer between the metal and
the anode, restarting the line would be much easier. For this to occur there would have
to be auxiliary power available. If the shutdown was the result of total loss of power,
restarting the process would be much more difficult since metal tapping and anode
lowering would not be possible. In this situation the anodes would have to be removed
and the cathode prepared before a restart could be initiated. This would require months
to complete and is labour intensive.

38
During the start-up of the modernized Kitimat Smelter, under ideal conditions with
anodes and cathodes fully prepared, 10 pots per week can be started. The restarting of
a potline would take much longer than the original start-up. While the pots are out of
service aluminum production is also lost. A restart would typically cost more than $35
million.
To ensure the level of reliability in power supply that is essential to an aluminum
smelting operation, Alcan designed redundant features into the Kemano System. The
Kemano Powerhouse has two additional turbine and generator systems above the
required capacity for the Smelter to provide for maintenance outages as well as
unexpected failures. As a result, the Kemano Powerhouse has generation capacity in
excess of Kitimat Smelter requirements. When more than six of the power generation
units are operating and the Reservoir has sufficient water available, more power can be
produced than is consumed in the Kitimat Smelter.
The annual rated production capacity of the Kitimat Smelter has been approximately
275,000 tonnes since 1967 when the last potline was completed. As noted previously,
the Kitimat Smelter is currently producing at a rate of approximately 240,000 tonnes per
year – close to 90% of its annual rated production capacity. Attached as Appendix E is
a graph and supporting data that shows the annual aluminum production at the Kitimat
Smelter from 1954 to 2006.
When Alcan completed construction of potlines 7 and 8 in 1967, the Kitimat Smelter
power requirements, at full production, increased to its current maximum requirements
of approximately 610 MW plus 20 MW for transmission line losses, for a total 630 MW.
Transmission line losses are an incidental effect of electricity transmission and will vary
with the load being transmitted. At the current 90% production rate, the Kitimat Smelter
requires approximately 568 MW, including transmission line losses.
Aluminum production consumes the largest portion of the power supplied to the Kitimat
Smelter. The Kitimat Smelter also requires considerable power for heating and the

39
operation of the other facilities at the site. The use of power for heating and other
auxiliary purposes will also affect the smelter power consumption. Approximately 20
MW on average is currently required to support the other facilities (casting, carbon
anode production, shops, offices, etc.). Auxiliary power consumption is typically highest
in the winter.
As part of the 1997 Agreement with the Province that settled the dispute over the
cancellation by the Province of the Kemano Completion Project (“1997 Agreement”),
Alcan and the Province entered into the Replacement Electricity Supply Agreement
(“RESA”). Under RESA, Alcan was granted an option to call on the Province to deliver
up to 175 MW of electricity for the purposes of aluminum production, subject to various
conditions. Alcan’s right to exercise this option expired at the end of 2006.
7.2 Power Requirements during Construction of the Modernization Project The conversion to AP technology at the Kitimat Smelter would occur in stages. Some of
the existing potlines would remain in operation while others are being converted to AP
technology and the related facilities are constructed. The first AP technology potlines
are expected to be in service in 2010. The full conversion to AP technology is expected
to be completed and in full operation at the end of 2012. Opportunities to extend
capacity beyond the initial design, in conjunction with the AP research and development
program, are expected by 2017. The infrastructure to allow this capacity increase is
being designed into the Modernization Project now.
The project duration is expected to be approximately five years. The construction will be
phased to allow the existing smelter to continue to operate while the new smelter is
being built. As new production is started, old production will be reduced accordingly.
The additional capacity of approximately 150,000 tonnes will be realized at the end of
the project when existing smelter has been shutdown completely.

40
The current plan is for the project to be built in three principle areas on the existing site:
the anode paste plant; the area around potline 7 and 8 operation; and in the field
directly north of existing smelter. Buildings and equipment that interfere with the new
site will be demolished or relocated.
The basic phases of the construction plan and the associated surplus power available
are shown in the graph in Figure 9. The graph shows the expected availability of power
for sale to BC Hydro based on the current construction plans.
Planned Average MW available (based on surplus @ 790 MW generation)
0
50
100
150
200
250
Jan-
06
Jan-
07
Jan-
08
Jan-
09
Jan-
10
Jan-
11
Jan-
12
Jan-
13
Jan-
14
Jan-
15
Jan-
16
Jan-
17
Jan-
18
Jan-
19
Jan-
20
MW
Pow er available today
Pow er available in the future
transition period
Figure 9 - Power available for sale during construction The amount of power available during the transition from Söderberg technology to the
AP 3X technology may change as the design, construction schedule, and ramp up plans
are refined. Section 5.13 of the 2007 EPA, allows Alcan and BC Hydro to adjust the
Tier 1 Electricity Quantities to accommodate such refinements. BC Hydro may withhold
its consent to the proposed adjustment if BC Hydro believes that the adjustment will
harm its rate payers. The adjustment contemplated in section 5.13 does not apply if the

41
modernization project does not proceed. If Alcan and BC Hydro agree to alter the Tier 1
Electricity Quantities under circumstances other than those contemplated in section
5.13, then an amendment to the 2007 EPA would be necessary. Alcan expects that BC
Hydro would file any such amendment with the Commission under Section 71 of the
Utilities Commission Act.
7.3 Power Requirements after completion of the Modernization Project Once the Modernization Project is complete, the annual rated production capacity of the
Kitimat Smelter would be approximately 400,000 tonnes per year. Alcan expects the
modernized Kitimat Smelter would require approximately 700 MW of power from Alcan’s
Kemano System (inclusive of transmission line losses) when operating at a production
rate of 400,000 tonnes.
Full production of 400,000 will take several years to achieve, since an operational “ramp
up” phase will follow completion of the construction.
The expected life of a cathode is six years. To avoid all pots failing simultaneously six
years after start up, Alcan will “pre-fail” selected pots during the first few operational
cycles to stagger the future life cycles of the pots.
7.4 Kitimat Smelter Operation after Modernization The greater efficiencies associated with the modernized smelter will make the Kitimat
Smelter one of the lowest cost smelters in the world. This will be an important
advantage over our competitors that operate older technology.
As high cost smelters are shut down around the world or if aluminum prices fall, there
would be strong incentive to shift production to lower cost smelters such as the
modernized Kitimat Smelter. Moreover, Alcan would want to maximize aluminum
production at Kitimat because the incremental cost of additional production (essentially,
raw material costs since the labour and capital would be largely fixed costs) should be
42
lower than the cost of new production elsewhere in the world. Further, Kitimat is
situated on the Pacific Rim which an area of strategic importance in the aluminum
industry.
Production at the Kitimat Smelter will vary over time based on market conditions.
However, a low-cost modernized Kitimat Smelter would be much better able to weather
market conditions relative to the existing Kitimat Smelter and most smelters in the world.
After modernization, the Kitimat Smelter will be rank in the lowest quartile of production
cost for smelters world-wide and would be one of the most productive in Alcan’s system.
Given the high cost of shutting down the smelter and the high profitability of operating
the new smelter, Alcan expects to run the modernized smelter at maximum production
as much as possible.
8. ALCAN POWER SALES 8.1 Development of the North Coast Grid Alcan’s Kemano System has been the only significant source of power supply for BC
Hydro’s North Coast region since the 1950’s. The next largest BC Hydro-owned
generation facility is a diesel power generator in Prince Rupert that is used as back up
source.
In the early 1950’s, the Kitimat area was undeveloped and not connected to the existing
provincial power supply infrastructure. Once Alcan’s operations began in 1954, Alcan
began supplying power to the residents of Kitimat in addition to the aluminum smelter.
Alcan built an electricity distribution system in Kitimat in the 1950’s. In the early 1960’s,
British Columbia Power Commission (“BCPC”), BC Hydro’s predecessor, built a 138 kV
transmission line from Kitimat to Terrace to serve the growing needs of Terrace. Alcan
began supplying power in 1961 to BCPC. Later during the 1960’s, BC Hydro extended
the transmission connections from Terrace to Prince Rupert and the Kitsault region. BC
43
Hydro purchased Alcan’s local distribution system in 1967, and assumed exclusive
control of the distribution of power in this region.
Alcan has sold Kemano power to third parties since the commissioning of its power
generation facilities in 1954.4 Alcan has sold power to BC Hydro and its
predecessors since the early 1960’s. All of Alcan’s power sales have been delivered
at the Kitimat Busbar since BC Hydro’s purchase of the Kitimat distribution system in
1967.
In 1978, BC Hydro completed the extension of its transmission line from Prince George
to Terrace, thereby connecting the isolated regional coastal grid to BC Hydro’s
provincial power grid. The region served by BC Hydro's transmission line west of Prince
George to Kitimat is referred to as the “North Coast” region of BC Hydro’s transmission
system. Attached as Appendix F is a schematic based on information received from
BC Hydro that shows the capacity of the transmission lines from Kemano to Prince
George and the power requirements of the community load centres served by BC Hydro
along its transmission line to Prince George.
Given that the Kemano System is located at the end of the BC Hydro’s transmission line
from Prince George, it provides a critical source of local reliability and reactive support
to the BC Hydro system. BC Hydro customers receive better and more reliable service
than they would otherwise. With support from the Kemano System, the North Coast
can continue to run as an “island” if the transmission line from Prince George is
interrupted. As a result, BC Hydro and BCTC have been able to avoid significant
additional capital expenditure to upgrade the reliability of their transmission line.
8.2 Interconnection with BC Hydro’s System In 1978, Alcan and BC Hydro entered into the 1978 Exchange Agreement which was a
comprehensive “inter-tie” agreement that governed the exchange of power between the
4 See Appendix C for a graph showing the historic power sales.

44
Alcan and BC Hydro power systems, including emergency power, power during
maintenance outages, storage, equichange, inadvertent transfer, and the exchange or
sale of excess power. Pursuant to the 1978 Exchange Agreement, Alcan and BC Hydro
established an operating committee to implement and administer the agreement. BC
Hydro and Alcan have worked cooperatively for many years under through this
arrangement.
Alcan’s ability to deliver power to BC Hydro’s system exceeds BC Hydro’s ability to
deliver to Alcan’s system. This difference is related to the configuration and capacity of
the transmission line to Terrace and the remote location of the Kitimat Smelter – at the
far end of the transmission line from Prince George with many customers in between.
The Alcan tie-line between the Kitimat substation and BC Hydro’s Minette Bay
Substation is a 287 kV circuit (2L103). According to BCTC System Operating Order 7T-
30, Alcan’s transmission delivery capability to BC Hydro ranges from 295 MW to 380
MW (depending on smelter load) under a standard configuration with no equipment
outages.
BC Hydro’s transmission delivery capability to Alcan is up to 150 MW under a standard
configuration with no equipment outages. Because of the variability of BC Hydro’s
customer load on its transmission line from Prince George, BC Hydro’s transmission
delivery capability can be constricted, particularly during high load hours in the winter.
8.3 Power Sales to BC Hydro and to Powerex Alcan currently supplies power to BC Hydro under a Long Term Electricity Purchase
Agreement (“LTEPA”) which is a power supply contract that was originally signed in
1990. Under the original LTEPA, Alcan agreed to sell 285 annual aMW at a 95% load
factor to BC Hydro during the term January 1, 1995, to December 31, 2014. That
delivery commitment was subsequently amended in 1997 following the 1997 Agreement
45
to become 140 annual aMW at a 95% load factor. The delivery point is the Kitimat
Busbar.
In September 2001, Alcan and Powerex entered into a Framework Agreement that
includes the standard terms and conditions applicable to energy transactions between
the companies. Since then, Alcan has transacted a series of short-term power sales
with Powerex through the exchange of “transaction letters”.
On 22 December 2004, Alcan gave notice to BC Hydro pursuant to LTEPA that Alcan
was recalling all of the LTEPA power effective on 1 January 2010 for its own industrial
purposes.
The 2007 EPA replaces LTEPA. The 2007 EPA expands the services that Alcan will
provide and extends the term of the arrangement to 2034. Further, it consolidates
Alcan’s power sales to BC Hydro and Powerex into one contract.
Alcan has sold electricity to BC Hydro or its predecessor since 1961. Alcan's long-
standing relationship as a supplier to BC Hydro has served both BC Hydro and Alcan
well. The 2007 EPA will continue this relationship with an expanded package of high
value products, including scheduling, capacity, equichange and co-ordination rights that
few other resources can offer. The 2007 EPA increases the integration and
coordination between the systems of BC Hydro and Alcan which will optimize use of the
resource and enhance the efficiency and benefits of both systems.


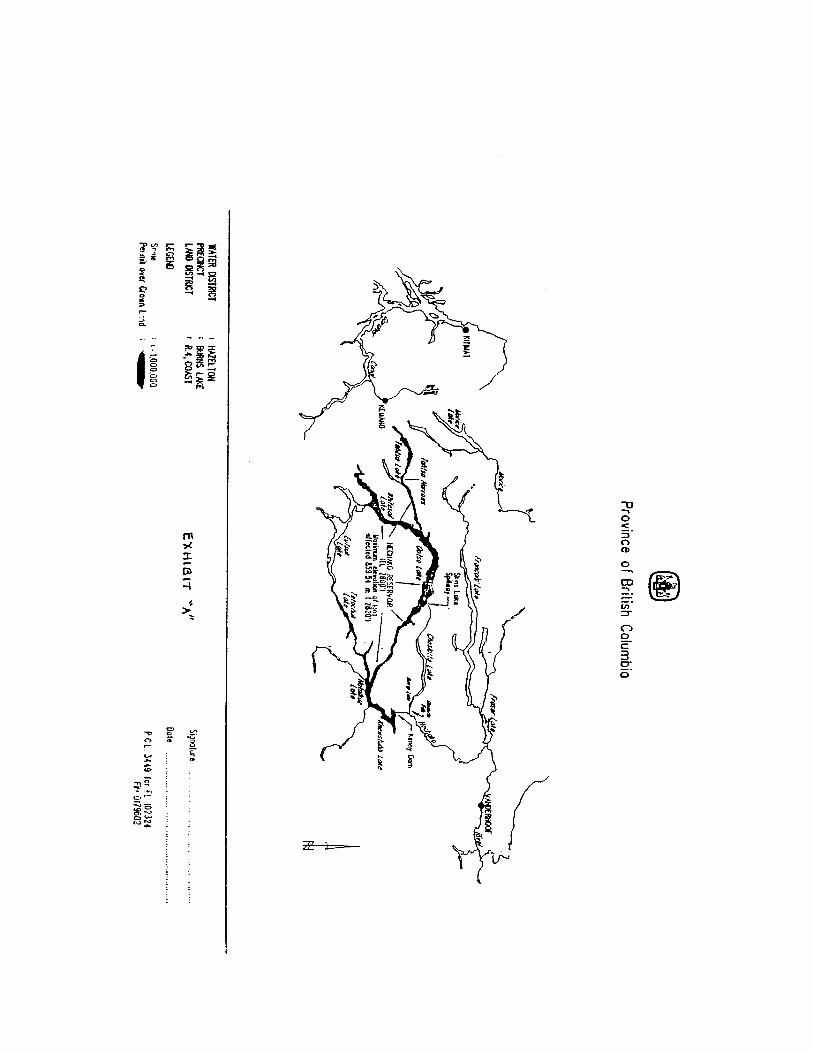

Nechako reservoir inflows (m3/s)Days per month 31 28 31 30 31 30 31 31 30 31 30 31
JAN FEB MAR APR MAY JUN JUL AUG SEP OCT NOV DECAverage from
Jan to Dec%LTA (1955-
2006)Difference
(%)Difference
(m3/s)Water year
Nov-Oct%LTA (1955-
2006)Difference
(%)Difference
(m3/s)Statistics 1931-2006
Minimum 41.9 31.1 30.0 42.2 163.1 276.7 197.8 88.6 40.5 59.0 18.0 37.9 128.8 66% -34% -65.3 131.3 68% -32% -63.1Average 91.2 76.5 65.2 114.9 373.1 493.6 335.6 189.6 135.4 148.5 154.0 123.4 192.3 99% -1% -1.2 192.5 99% -1% -1.9
Maximum 173.5 205.2 188.6 299.4 686.6 835.1 713.7 479.6 322.0 343.3 319.1 354.3 345.6 178% 78% 151.5 337.9 174% 74% 143.5Statistics 1955-2006
Minimum 46.0 35.7 38.4 48.7 201.0 276.7 197.8 88.6 40.5 59.0 18.0 37.9 128.8 66% -34% -65.3 133.1 68% -32% -61.3Average 96.3 81.8 69.0 126.9 409.3 496.5 322.9 174.0 126.6 153.8 150.2 114.7 194.1 100% 0% 0.0 194.4 100% 0% 0.0
Maximum 173.5 205.2 188.6 299.4 686.6 835.1 713.7 479.6 283.7 343.3 319.1 354.3 345.6 178% 78% 151.5 337.9 174% 74% 143.51931 100.2 114.1 87.2 82.7 214.4 395.3 359.9 206.1 136.5 95.4 105.9 88.9 165.8 85.4% -14.6% -27 100%1932 57.5 50.4 64.8 91.7 286.8 382.6 316.0 242.1 194.8 171.9 173.0 282.6 193.8 99.9% -0.1% 2 171.9 88.4% -11.6% -23 100%1933 107.6 65.7 43.3 69.9 255.1 380.9 360.8 246.6 157.4 119.5 254.3 317.7 199.1 102.6% 2.6% 7 189.5 97.5% -2.5% -5 100%1934 122.9 131.7 94.6 185.8 486.5 431.5 318.8 247.8 180.7 273.3 229.9 169.1 240.1 123.7% 23.7% 48 254.7 131.0% 31.0% 60 100%1935 71.4 102.8 98.3 79.6 347.7 498.4 386.8 226.5 138.8 114.7 191.1 117.2 198.2 102.1% 2.1% 6 205.8 105.9% 5.9% 11 100%1936 86.1 51.0 37.4 56.6 273.0 434.7 282.9 175.8 134.8 175.8 257.7 286.0 188.4 97.1% -2.9% -4 168.6 86.7% -13.3% -26 100%1937 115.8 75.0 60.9 97.1 298.7 548.8 416.3 222.0 165.9 140.7 173.0 98.3 201.6 103.9% 3.9% 9 224.5 115.5% 15.5% 30 100%1938 79.3 62.9 50.7 105.6 254.6 421.4 373.5 213.2 144.7 114.4 105.9 95.1 169.0 87.1% -12.9% -23 174.8 89.9% -10.1% -20 100%1939 74.8 57.2 47.0 103.6 321.4 528.4 454.2 282.3 165.7 120.6 168.5 301.6 219.8 113.3% 13.3% 28 197.2 101.4% 1.4% 3 100%1940 123.5 74.2 67.7 170.5 419.7 493.3 390.8 271.8 178.1 145.8 169.9 104.8 218.3 112.5% 12.5% 26 234.9 120.8% 20.8% 40 100%1941 68.2 63.7 58.6 156.9 297.3 399.6 284.9 171.3 134.8 152.3 211.8 164.0 180.7 93.1% -6.9% -12 172.3 88.6% -11.4% -22 100%1942 80.1 71.6 49.6 67.7 246.6 475.4 311.2 180.7 118.9 100.8 105.6 75.9 157.3 81.1% -18.9% -35 173.5 89.3% -10.7% -21 100%1943 51.0 43.0 54.9 113.3 204.7 416.0 365.9 216.9 132.5 102.2 78.7 78.4 155.4 80.1% -19.9% -37 157.4 80.9% -19.1% -37 100%1944 58.0 55.2 41.3 62.9 163.1 326.2 261.6 174.1 123.7 146.7 117.5 99.1 136.2 70.2% -29.8% -56 131.3 67.5% -32.5% -63 100%1945 60.3 48.1 39.6 63.4 272.7 512.3 295.6 179.8 109.0 83.8 118.1 90.6 156.5 80.6% -19.4% -36 157.2 80.9% -19.1% -37 100%1946 51.0 41.3 37.4 42.2 297.6 554.7 472.6 231.9 123.2 118.1 88.1 67.1 177.9 91.7% -8.3% -14 182.4 93.8% -6.2% -12 100%1947 41.9 31.1 30.0 87.8 327.9 468.4 318.8 207.6 126.0 126.3 202.7 121.5 174.8 90.1% -9.9% -18 160.8 82.7% -17.3% -34 100%1948 96.0 75.3 47.9 64.6 298.5 726.3 417.1 257.4 193.7 149.8 122.3 73.3 210.6 108.5% 8.5% 18 221.3 113.8% 13.8% 27 100%1949 61.4 55.8 42.5 78.2 308.7 489.9 329.3 229.4 152.9 107.6 146.1 120.9 177.4 91.4% -8.6% -15 171.4 88.2% -11.8% -23 100%1950 67.4 45.6 44.5 51.5 166.8 430.7 438.3 228.2 146.7 125.7 143.3 122.0 168.3 86.7% -13.3% -24 168.4 86.6% -13.4% -26 100%1951 99.4 74.8 57.2 65.7 342.6 489.9 396.4 204.4 113.3 81.3 113.3 83.0 177.4 91.4% -8.6% -15 183.2 94.2% -5.8% -11 100%1952 54.9 53.2 49.0 69.4 242.4 453.1 402.1 233.9 141.6 213.5 142.2 92.3 179.7 92.6% -7.4% -13 176.6 90.8% -9.2% -18 100%1953 73.9 58.3 58.0 54.7 364.4 710.5 316.9 163.7 169.3 121.5 169.3 132.0 199.7 102.9% 2.9% 7 194.1 99.8% -0.2% 0 100%1954 121.5 58.6 105.6 109.3 380.3 721.5 443.7 351.7 322.0 181.2 307.0 235.6 279.0 143.8% 43.8% 87 258.9 133.2% 33.2% 64 100%1955 120.42 76.73 61.38 65.18 200.99 370.92 294.62 170.48 109.10 143.32 116.99 80.93 151.4 78.0% -22.0% -43 180.1 92.6% -7.4% -14 100%1956 53.01 35.65 39.63 86.47 296.25 291.06 234.03 147.11 68.47 139.45 261.48 158.32 151.6 78.1% -21.9% -43 133.1 68.5% -31.5% -61 100%1957 102.15 75.22 66.77 72.65 550.80 450.08 242.81 310.61 150.39 84.32 192.84 354.35 222.3 114.6% 14.6% 28 211.3 108.7% 8.7% 17 100%1958 169.08 106.32 81.25 177.81 624.07 539.59 231.43 116.74 161.49 186.84 135.73 125.10 221.9 114.3% 14.3% 28 246.0 126.5% 26.5% 52 100%1959 116.56 82.87 71.21 127.40 465.99 634.26 446.78 220.66 258.55 177.63 214.43 203.25 252.4 130.0% 30.0% 58 239.3 123.1% 23.1% 45 100%1960 100.53 73.20 76.94 153.93 445.19 521.47 401.01 211.52 128.98 205.00 133.43 99.94 213.5 110.0% 10.0% 19 228.9 117.7% 17.7% 35 100%1961 89.08 124.81 79.85 138.42 553.20 503.62 304.64 144.67 149.83 187.87 167.33 92.25 211.7 109.1% 9.1% 18 209.6 107.8% 7.8% 15 100%1962 135.36 144.15 67.16 119.66 369.39 605.84 440.72 243.87 111.12 247.16 249.27 181.91 243.5 125.4% 25.4% 49 229.1 117.8% 17.8% 35 100%1963 107.75 113.13 78.50 114.60 371.25 382.16 358.44 179.84 141.11 203.53 137.29 118.47 192.8 99.3% -0.7% -1 207.4 106.7% 6.7% 13 100%1964 128.20 100.71 71.83 84.58 285.31 815.92 582.30 280.62 193.94 241.40 127.51 75.90 249.6 128.6% 28.6% 56 254.0 130.7% 30.7% 60 100%1965 90.16 89.06 66.27 125.49 349.29 412.53 323.02 164.36 89.53 343.28 202.64 124.20 199.1 102.6% 2.6% 5 188.8 97.1% -2.9% -6 100%1966 102.27 69.79 78.21 191.94 422.24 538.05 392.30 201.77 164.21 227.46 197.81 118.70 226.2 116.5% 16.5% 32 227.0 116.8% 16.8% 33 100%1967 83.77 96.25 61.32 69.55 467.30 718.04 329.28 179.56 149.65 254.95 144.16 98.42 221.5 114.1% 14.1% 27 227.6 117.1% 17.1% 33 100%1968 166.66 155.87 102.91 102.00 638.74 554.43 422.96 249.44 183.60 266.68 247.18 130.80 269.3 138.8% 38.8% 75 258.1 132.8% 32.8% 64 100%1969 82.74 47.63 62.84 119.82 433.86 644.03 238.99 163.79 163.01 123.22 196.37 138.08 201.6 103.9% 3.9% 8 205.1 105.5% 5.5% 11 100%1970 64.45 54.02 54.35 64.16 259.21 400.64 239.98 149.10 90.76 59.02 47.48 57.99 128.8 66.4% -33.6% -65 147.8 76.0% -24.0% -47 100%1971 92.51 73.75 60.96 67.25 386.01 624.16 449.41 223.56 159.05 174.49 132.79 100.47 212.8 109.6% 9.6% 19 202.2 104.0% 4.0% 8 100%1972 83.37 90.82 92.52 101.01 533.15 794.24 555.48 232.55 125.43 125.06 127.13 92.86 247.0 127.3% 27.3% 53 248.1 127.6% 27.6% 54 100%1973 116.56 72.48 58.19 91.20 379.91 471.86 377.68 187.59 161.90 145.75 77.56 87.11 186.4 96.1% -3.9% -8 191.0 98.2% -1.8% -3 100%1974 92.16 68.14 60.18 109.66 406.26 557.48 422.92 217.46 120.81 252.03 83.18 120.70 210.3 108.4% 8.4% 16 207.0 106.5% 6.5% 13 100%1975 94.56 81.47 70.23 70.71 319.74 516.10 347.02 199.67 102.30 103.36 235.70 139.40 190.5 98.1% -1.9% -4 176.3 90.7% -9.3% -18 100%1976 127.82 96.59 86.01 140.79 676.35 835.08 713.72 479.61 283.73 221.80 263.09 202.55 345.6 178.1% 78.1% 151 337.9 173.8% 73.8% 144 100%1977 173.45 147.07 108.69 279.07 413.99 387.94 289.32 180.35 115.01 170.17 123.84 85.60 206.5 106.4% 6.4% 12 227.9 117.2% 17.2% 33 100%1978 63.04 49.63 47.81 103.54 358.29 482.27 237.00 176.59 92.56 129.89 237.78 113.54 174.8 90.0% -10.0% -19 163.0 83.8% -16.2% -31 100%1979 46.01 64.74 50.76 92.34 508.62 439.93 268.02 132.17 79.20 64.25 17.98 58.89 152.6 78.6% -21.4% -42 175.3 90.2% -9.8% -19 100%1980 61.17 51.03 38.40 76.82 331.83 332.06 197.81 117.33 180.33 175.97 195.84 277.03 170.3 87.8% -12.2% -24 137.2 70.6% -29.4% -57 100%1981 155.53 95.57 69.10 102.89 474.88 390.12 279.60 133.71 81.45 90.47 129.23 53.95 171.9 88.6% -11.4% -22 196.4 101.0% 1.0% 2 100%1982 75.93 64.09 45.24 48.69 276.13 580.08 279.01 123.53 133.68 120.71 76.37 55.71 156.8 80.8% -19.2% -37 161.0 82.8% -17.2% -33 100%1983 70.38 53.46 40.43 138.64 324.18 373.12 276.25 132.90 94.33 79.24 91.29 37.88 143.1 73.7% -26.3% -51 143.3 73.7% -26.3% -51 100%1984 103.13 95.03 84.74 116.86 263.03 381.69 292.59 193.33 127.04 166.00 105.79 92.07 168.9 87.0% -13.0% -25 163.1 83.9% -16.1% -31 100%1985 62.91 80.95 55.12 97.37 413.93 440.69 293.40 123.83 67.93 77.93 41.78 42.47 150.3 77.4% -22.6% -44 159.8 82.2% -17.8% -35 100%1986 77.11 60.59 67.60 101.46 297.58 612.95 355.77 180.11 96.40 83.94 104.01 61.43 175.3 90.3% -9.7% -19 168.5 86.7% -13.3% -26 100%1987 83.25 76.46 68.70 132.36 436.63 514.13 333.70 133.86 118.74 134.70 193.75 77.84 192.4 99.2% -0.8% -2 183.7 94.5% -5.5% -11 100%1988 69.37 66.01 58.19 85.91 312.28 397.61 228.34 151.17 127.47 142.32 111.00 114.09 155.8 80.3% -19.7% -38 159.5 82.0% -18.0% -35 100%1989 97.74 57.58 54.16 103.27 428.81 397.79 220.95 154.21 63.31 67.53 182.23 213.14 170.8 88.0% -12.0% -23 156.5 80.5% -19.5% -38 100%1990 138.04 90.87 59.01 157.28 406.02 426.24 283.27 122.92 40.45 98.34 113.35 135.01 173.1 89.2% -10.8% -21 185.4 95.4% -4.6% -9 100%1991 86.36 103.00 70.59 157.38 476.45 505.34 305.06 152.99 76.63 109.66 143.18 113.60 192.1 99.0% -1.0% -2 191.5 98.5% -1.5% -3 100%1992 96.30 123.49 137.88 240.68 357.39 467.72 250.33 88.60 156.18 233.27 139.76 83.23 197.9 102.0% 2.0% 4 200.8 103.3% 3.3% 6 100%1993 49.10 58.91 57.95 122.16 533.23 438.50 236.20 128.63 45.95 61.71 167.27 84.25 165.9 85.5% -14.5% -28 163.5 84.1% -15.9% -31 100%1994 88.82 78.81 83.11 254.06 432.20 394.24 266.61 114.36 113.83 111.50 100.95 87.44 177.5 91.5% -8.5% -17 182.7 94.0% -6.0% -12 100%1995 61.74 65.15 55.23 111.46 531.12 444.19 255.26 128.06 63.96 71.35 71.81 75.02 161.9 83.4% -16.6% -32 165.3 85.0% -15.0% -29 100%1996 142.64 83.66 72.13 298.76 422.04 588.09 395.75 193.50 187.05 149.39 132.57 90.60 230.1 118.6% 18.6% 36 223.8 115.1% 15.1% 29 100%1997 92.07 87.51 92.21 213.85 686.60 660.33 329.72 157.19 103.75 190.68 129.00 108.47 238.4 122.8% 22.8% 44 237.2 122.0% 22.0% 43 100%1998 78.08 57.93 52.22 87.37 530.59 366.73 219.77 103.62 78.22 154.69 84.55 91.70 159.7 82.3% -17.7% -34 164.7 84.7% -15.3% -30 100%1999 74.92 69.00 55.48 114.99 321.42 572.06 414.76 238.46 120.49 106.82 86.92 78.16 188.4 97.1% -2.9% -6 189.3 97.4% -2.6% -5 100%2000 53.65 40.85 49.56 79.34 214.96 400.31 273.52 129.15 106.03 136.75 150.74 82.53 143.5 73.9% -26.1% -51 137.9 70.9% -29.1% -57 100%2001 76.78 49.42 45.79 77.25 207.51 399.22 302.19 167.21 129.47 99.84 150.89 93.91 150.4 77.5% -22.5% -44 149.4 76.8% -23.2% -45 100%2002 81.93 76.70 52.16 95.42 422.16 796.53 437.21 197.90 224.27 108.33 181.93 104.03 231.8 119.4% 19.4% 38 228.4 117.5% 17.5% 34 100%2003 107.90 58.84 57.79 146.78 319.06 376.33 212.32 114.03 114.82 169.11 121.49 64.54 155.7 80.2% -19.8% -38 164.0 84.3% -15.7% -30 100%2004 68.76 49.33 65.08 166.96 340.99 276.65 239.44 138.31 198.63 216.52 319.05 209.83 191.4 98.6% -1.4% -3 162.8 83.8% -16.2% -32 100%2005 155.31 205.21 188.63 299.40 513.64 382.16 243.93 150.01 123.13 269.61 232.32 128.66 241.1 124.2% 24.2% 47 255.1 131.2% 31.2% 61 100%2006 97.85 63.61 56.62 102.33 292.96 413.83 225.24 113.89 58.41 94.98 181.42 145.67 154.3 79.5% -20.5% -40 157.0 80.8% -19.2% -37 100%
Average 1931 to 2006 192.33
Average 1955 to 2006 194.08
Average 1951 to 2006 195.14

Nechako ReservoirHistorical inflow (1955 - 2006)
for Water Year from Nov 1st to Oct 31st
20%
30%
40%
50%
60%
70%
80%
90%
100%
110%
120%
130%
140%
150%
160%
170%
180%19
55
1957
1959
1961
1963
1965
1967
1969
1971
1973
1975
1977
1979
1981
1983
1985
1987
1989
1991
1993
1995
1997
1999
2001
2003
2005
% L
TA
-160
-140
-120
-100
-80
-60
-40
-20
0
20
40
60
80
100
120
140
160
Diff
eren
ce c
ompa
red
with
the
aver
age
(mcs
)
Average Inflow = 194.1 cms

Nechako ReservoirHistorical inflow (1931 - 2006)
for Water Year from Nov 1st to Oct 31st
20%
30%
40%
50%
60%
70%
80%
90%
100%
110%
120%
130%
140%
150%
160%
170%
180%19
3119
3319
3519
3719
3919
4119
4319
4519
4719
4919
5119
5319
5519
5719
5919
6119
6319
6519
6719
6919
7119
7319
7519
7719
7919
8119
8319
8519
8719
8919
9119
9319
9519
9719
9920
0120
0320
05
% L
TA
-160
-140
-120
-100
-80
-60
-40
-20
0
20
40
60
80
100
120
140
160
Diff
eren
ce c
ompa
red
with
the
aver
age
(m3/
s)
Average Inflow (Nov55-Oct06) = 194.1 cms
Prior to the reservoir: Estimation based on river flows

Alcan Monthly Power Delivery to Smelter and BC Hydro1954 to July 2007
0
100
200
300
400
500
600
700
800
900
1954
1968
1969
1970
1971
1972
1973
1974
1975
1976
1977
1978
1979
1980
1981
1982
1983
1984
1985
1986
1987
1988
1989
1990
1991
1992
1993
1994
1995
1996
1997
1998
1999
2000
2001
2002
2003
2004
2005
2006
2007
Mo
nth
ly P
ow
er D
eliv
ery
(MW
)
Smelter Export / Import Net
Yea
rly S
umm
ary
Dat
a19
54 to
196
7
3-month Strike in 1970
Production cutback
BC Hydro Grid Intertie connected November, 1978
Potline 7 shutdown1994 to 1997
Energy import duringextreme low water 1986
PL 2 off 22 days due to Transformer failure
Production idled during low water cycle
Tun
nel C
olla
pse
Rep
air
1961
1954 - 1978 Alcan supplied area load demand 1979 to present: Alcan supplied contract, emergency and maintenance energy.
Transmission line tower lost in avalanche

Month _of Planned Outage Hrs.
Mtce Outage Hrs.
Forced Outage Hrs.
Forced Outages Count Gen Shed Hrs.
01/01/1994 72.99 13.77 93.21 8 0.0002/01/1994 0.00 0.00 0.00 0 0.0003/01/1994 0.00 92.37 2.66 3 0.0004/01/1994 0.00 26.22 0.35 3 0.0005/01/1994 1.32 586.02 8.31 2 0.0006/01/1994 33.02 0.79 172.49 3 0.0007/01/1994 7.76 1.96 483.76 11 0.0008/01/1994 70.37 472.16 35.01 30 0.0009/01/1994 301.44 8.59 161.68 15 0.0010/01/1994 16.28 5.37 153.70 12 0.0011/01/1994 75.13 70.70 236.75 6 0.0012/01/1994 52.16 3.33 207.27 1 0.0001/01/1995 41.81 0.77 0.62 2 0.4502/01/1995 1.37 67.07 12.33 1 0.0303/01/1995 1.20 560.27 6.01 8 0.4004/01/1995 498.43 5.94 40.84 14 0.2805/01/1995 475.14 1.26 256.46 2 0.0006/01/1995 181.37 2.14 57.53 9 0.1707/01/1995 70.37 81.02 5.02 8 0.7108/01/1995 4.79 62.22 44.98 19 0.3209/01/1995 7.53 231.91 6.48 3 0.0010/01/1995 8.39 150.08 1.47 1 1.1911/01/1995 0.10 365.85 18.11 7 0.5112/01/1995 3.81 72.12 12.08 9 0.1901/01/1996 69.27 58.35 14.50 2 0.2502/01/1996 1.90 289.20 4.28 3 0.1503/01/1996 487.61 0.00 0.00 0 0.0004/01/1996 119.89 78.15 552.37 2 0.0005/01/1996 15.15 20.80 755.53 2 0.6606/01/1996 0.00 0.00 737.27 4 0.1207/01/1996 0.00 0.00 765.88 2 0.1308/01/1996 0.00 0.00 841.90 2 0.9609/01/1996 0.00 0.00 720.00 1 0.1510/01/1996 0.00 0.00 745.00 1 0.4111/01/1996 0.00 0.00 740.00 1 0.2512/01/1996 0.00 12.73 744.00 1 0.3801/01/1997 11.83 0.00 744.27 2 0.4502/01/1997 0.00 289.05 204.88 2 0.1803/01/1997 419.45 185.75 0.00 0 0.0004/01/1997 400.10 4.77 11.57 3 0.0005/01/1997 46.55 10.32 15.95 3 0.0006/01/1997 34.90 14.35 16.80 5 0.0007/01/1997 27.80 20.32 729.70 3 0.0008/01/1997 27.80 20.32 193.88 2 0.0009/01/1997 76.13 5.88 0.00 0 0.0010/01/1997 121.08 1.05 18.73 1 0.0011/01/1997 84.12 0.20 5.37 1 0.0012/01/1997 10.93 0.00 0.00 0 0.0001/01/1998 161.77 0.15 0.27 1 0.0002/01/1998 22.22 451.25 0.00 0 0.00
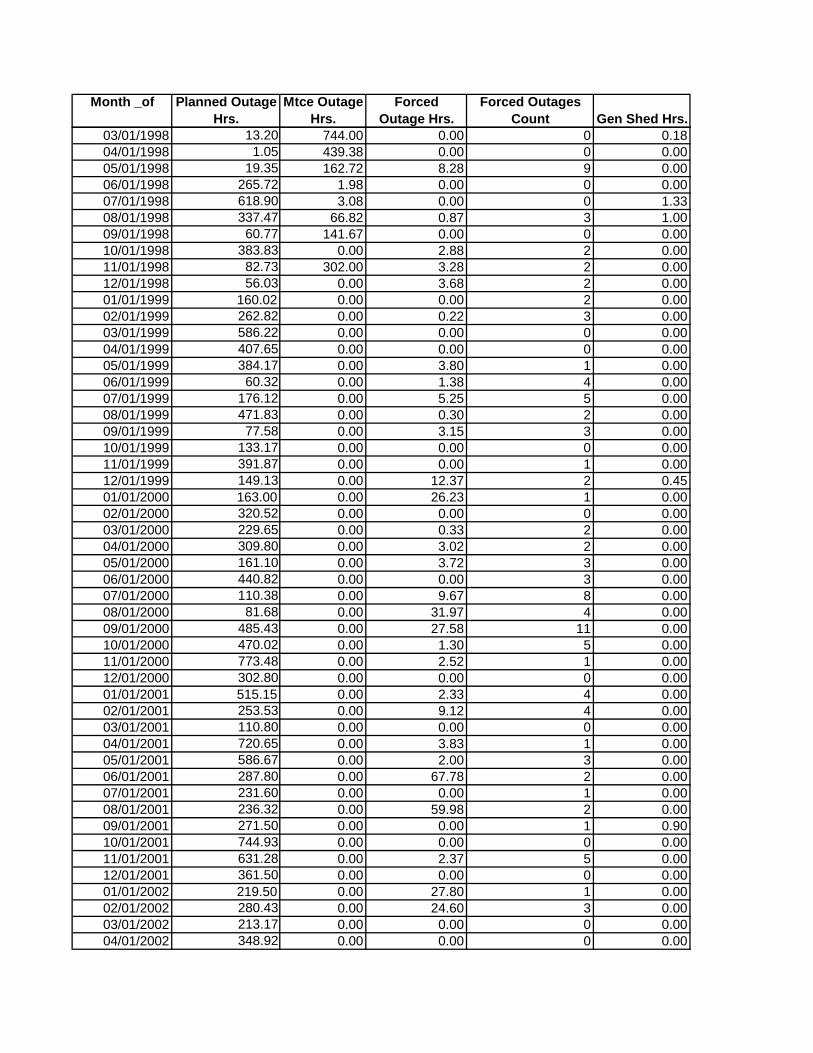
Month _of Planned Outage Hrs.
Mtce Outage Hrs.
Forced Outage Hrs.
Forced Outages Count Gen Shed Hrs.
03/01/1998 13.20 744.00 0.00 0 0.1804/01/1998 1.05 439.38 0.00 0 0.0005/01/1998 19.35 162.72 8.28 9 0.0006/01/1998 265.72 1.98 0.00 0 0.0007/01/1998 618.90 3.08 0.00 0 1.3308/01/1998 337.47 66.82 0.87 3 1.0009/01/1998 60.77 141.67 0.00 0 0.0010/01/1998 383.83 0.00 2.88 2 0.0011/01/1998 82.73 302.00 3.28 2 0.0012/01/1998 56.03 0.00 3.68 2 0.0001/01/1999 160.02 0.00 0.00 2 0.0002/01/1999 262.82 0.00 0.22 3 0.0003/01/1999 586.22 0.00 0.00 0 0.0004/01/1999 407.65 0.00 0.00 0 0.0005/01/1999 384.17 0.00 3.80 1 0.0006/01/1999 60.32 0.00 1.38 4 0.0007/01/1999 176.12 0.00 5.25 5 0.0008/01/1999 471.83 0.00 0.30 2 0.0009/01/1999 77.58 0.00 3.15 3 0.0010/01/1999 133.17 0.00 0.00 0 0.0011/01/1999 391.87 0.00 0.00 1 0.0012/01/1999 149.13 0.00 12.37 2 0.4501/01/2000 163.00 0.00 26.23 1 0.0002/01/2000 320.52 0.00 0.00 0 0.0003/01/2000 229.65 0.00 0.33 2 0.0004/01/2000 309.80 0.00 3.02 2 0.0005/01/2000 161.10 0.00 3.72 3 0.0006/01/2000 440.82 0.00 0.00 3 0.0007/01/2000 110.38 0.00 9.67 8 0.0008/01/2000 81.68 0.00 31.97 4 0.0009/01/2000 485.43 0.00 27.58 11 0.0010/01/2000 470.02 0.00 1.30 5 0.0011/01/2000 773.48 0.00 2.52 1 0.0012/01/2000 302.80 0.00 0.00 0 0.0001/01/2001 515.15 0.00 2.33 4 0.0002/01/2001 253.53 0.00 9.12 4 0.0003/01/2001 110.80 0.00 0.00 0 0.0004/01/2001 720.65 0.00 3.83 1 0.0005/01/2001 586.67 0.00 2.00 3 0.0006/01/2001 287.80 0.00 67.78 2 0.0007/01/2001 231.60 0.00 0.00 1 0.0008/01/2001 236.32 0.00 59.98 2 0.0009/01/2001 271.50 0.00 0.00 1 0.9010/01/2001 744.93 0.00 0.00 0 0.0011/01/2001 631.28 0.00 2.37 5 0.0012/01/2001 361.50 0.00 0.00 0 0.0001/01/2002 219.50 0.00 27.80 1 0.0002/01/2002 280.43 0.00 24.60 3 0.0003/01/2002 213.17 0.00 0.00 0 0.0004/01/2002 348.92 0.00 0.00 0 0.00

Month _of Planned Outage Hrs.
Mtce Outage Hrs.
Forced Outage Hrs.
Forced Outages Count Gen Shed Hrs.
05/01/2002 562.67 0.00 199.98 5 0.0006/01/2002 127.13 0.00 24.07 3 0.0007/01/2002 29.77 0.00 0.07 1 0.0008/01/2002 50.90 0.00 26.72 6 0.0009/01/2002 532.57 0.00 0.00 0 0.0010/01/2002 744.77 0.00 0.00 0 0.0011/01/2002 544.72 0.00 0.00 0 0.0012/01/2002 0.33 0.00 9.33 3 0.0001/01/2003 240.00 0.00 0.50 2 0.0002/01/2003 31.17 0.00 1.00 1 0.0003/01/2003 150.83 0.00 0.00 0 0.0004/01/2003 415.83 0.00 1.07 1 0.0005/01/2003 770.62 0.00 22.83 2 0.0006/01/2003 609.17 0.00 1.10 1 0.0007/01/2003 264.55 0.00 72.88 3 0.0008/01/2003 100.02 0.00 8.80 11 0.0009/01/2003 346.55 0.00 23.50 1 0.0010/01/2003 105.75 0.00 28.58 15 0.0011/01/2003 717.10 0.00 0.00 0 0.0012/01/2003 22.63 0.00 1.53 1 0.0001/01/2004 89.22 0.00 0.17 1 0.0002/01/2004 417.15 0.00 0.00 0 0.0003/01/2004 405.57 0.00 1.71 3 0.0004/01/2004 47.98 0.00 2.73 6 0.0005/01/2004 154.23 0.00 0.00 0 0.0006/01/2004 21.73 0.00 145.88 1 0.0007/01/2004 44.87 0.00 95.02 4 0.0008/01/2004 220.10 0.00 18.77 2 0.0009/01/2004 678.83 0.00 48.25 1 0.0010/01/2004 634.32 0.00 0.00 2 0.0011/01/2004 761.20 0.00 0.00 1 0.0012/01/2004 406.00 0.00 26.58 2 0.0001/01/2005 71.77 0.00 13.83 8 0.7501/02/2005 365.47 0.00 0.00 0 0.0001/03/2005 326.82 0.00 13.98 8 0.0001/04/2005 79.90 0.00 0.00 0 0.0001/05/2005 126.63 0.00 0.60 4 0.6001/06/2005 81.57 0.00 4.68 22 2.6801/07/2005 53.15 0.00 11.35 12 1.0801/08/2005 153.28 0.00 1.88 4 0.6201/09/2005 75.47 0.00 1.20 10 1.2001/10/2005 105.07 0.00 0.53 3 0.5301/11/2005 131.02 0.00 0.00 0 0.0001/12/2005 30.47 0.00 2.17 2 0.0001/01/2006 38.73 0.00 55.53 3 0.0001/02/2006 104.55 0.00 0.53 3 0.1501/03/2006 93.48 0.00 2.20 1 0.0001/04/2006 350.17 0.00 0.00 0 0.0001/05/2006 654.08 0.00 79.23 3 0.0701/06/2006 550.93 0.00 0.00 0 0.00

Month _of Planned Outage Hrs.
Mtce Outage Hrs.
Forced Outage Hrs.
Forced Outages Count Gen Shed Hrs.
01/07/2006 91.88 0.00 180.78 21 0.8701/08/2006 115.90 0.00 0.00 0 0.0001/09/2006 136.93 0.00 0.02 1 0.0201/10/2006 247.35 0.00 0.20 2 0.2001/11/2006 163.97 0.00 0.00 0 0.0001/12/2006 254.77 0.00 0.00 0 0.0001/01/2007 180.75 0.00 0.38 2 0.3801/02/2007 686.00 0.00 0.32 1 0.0001/03/2007 211.45 0.00 6.43 6 5.6501/04/2007 218.28 0.00 16.88 1 0.00

Year Mt tons Period Avg Percent of Rated Capacity1954 18898 27500019551956 1968-2006 254181 92.431957 145144.041958 1477481959 1401161960 1738201961 1278031962 1619291963 1678601964 1941791965 2022301966 2137261967 2350981968 2427371969 2658791970 1705521971 2445141972 2557051973 2649831974 2652721975 2159331976 2247231977 2653981978 2700351979 2707861980 2727001981 2705371982 2497051983 2614221984 2754081985 2724931986 2730121987 2739501988 2747071989 2723311990 2715611991 2717291992 2728041993 2713251994 2510131995 2498371996 2538761997 2505901998 2623991999 2690602000 2717702001 2109772002 1910082003 2371872004 2441602005 2425082006 238470
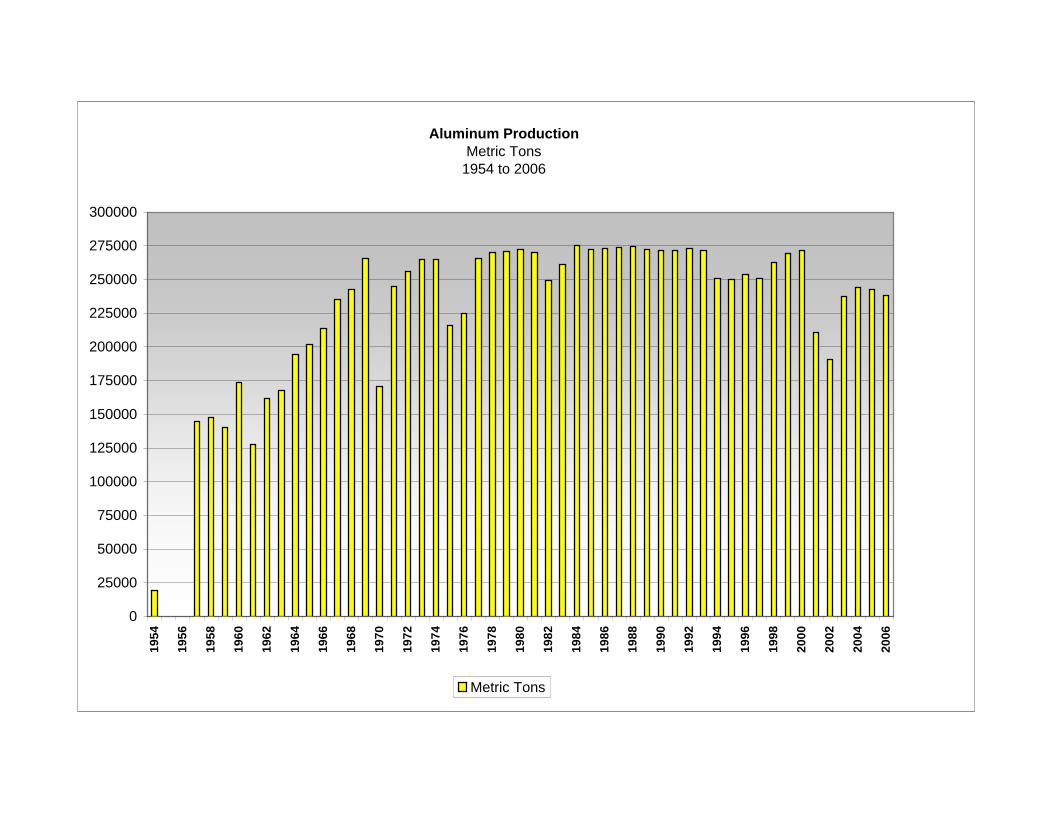
Aluminum ProductionMetric Tons
1954 to 2006
0
25000
50000
75000
100000
125000
150000
175000
200000
225000
250000
275000
300000
1954
1956
1958
1960
1962
1964
1966
1968
1970
1972
1974
1976
1978
1980
1982
1984
1986
1988
1990
1992
1994
1996
1998
2000
2002
2004
2006
Metric Tons


Business group or unit Slide 1 © 2 0 0 6 A L C A N I N C.
Alcan in British Columbia
BC OperationsSept 12th 2007
Paul HenningManaging Director BC Operations and Modernization Project
Business group or unit Slide 2 © 2 0 0 6 A L C A N I N C.
Outline
Alcan Inc. Global presence
Alcan Primary Metal Group
Alcan BC Operations
Kitimat Modernization Project
Conclusion

Business group or unit Slide 3 © 2 0 0 6 A L C A N I N C.
Alcan Inc.’s 4 Business Groups
BAUXITE AND ALUMINA PRIMARY METAL
ENGINEERED PRODUCTS PACKAGING

Business group or unit Slide 4 © 2 0 0 6 A L C A N I N C.
APM-BC provincial footprint
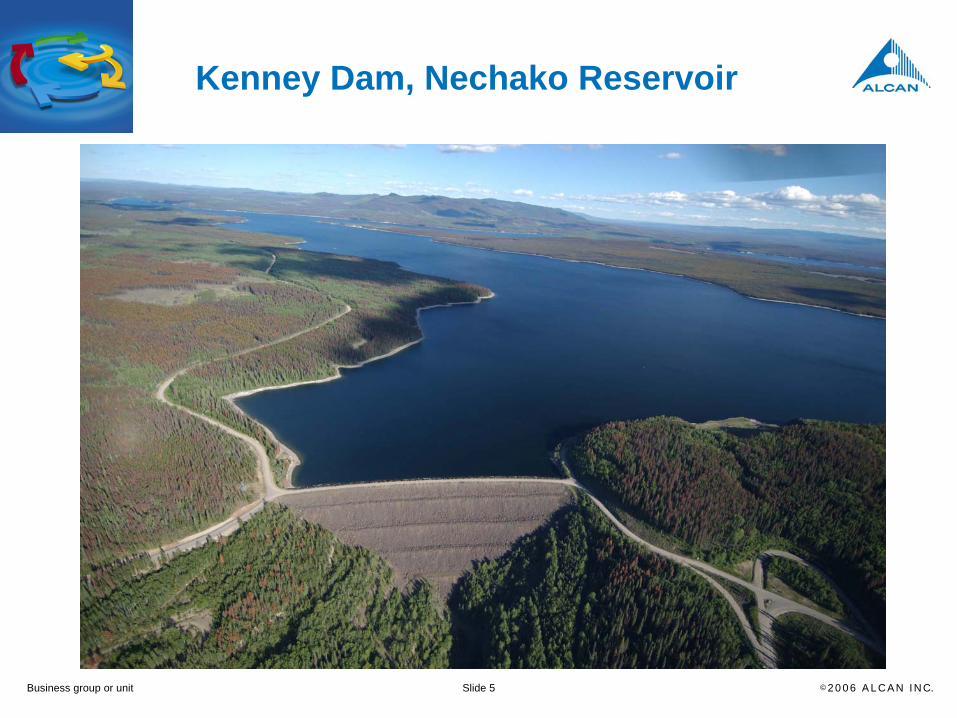
Business group or unit Slide 5 © 2 0 0 6 A L C A N I N C.
Kenney Dam, Nechako Reservoir
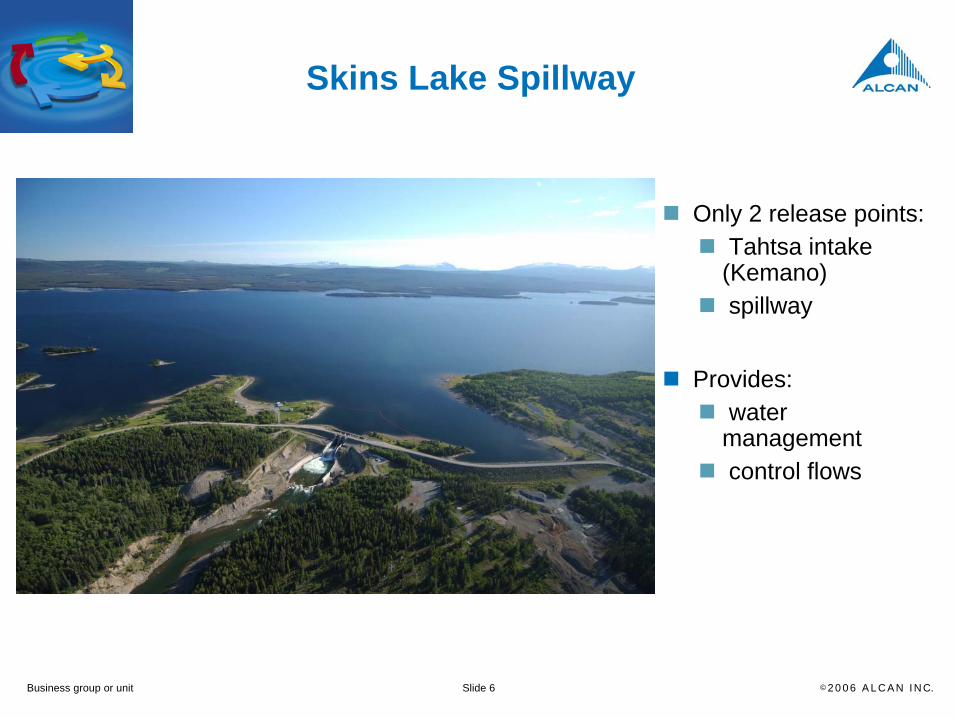
Business group or unit Slide 6 © 2 0 0 6 A L C A N I N C.
Skins Lake Spillway
Only 2 release points:Tahtsa intake (Kemano)spillway
Provides: water managementcontrol flows

Business group or unit Slide 7 © 2 0 0 6 A L C A N I N C.
Kemano System
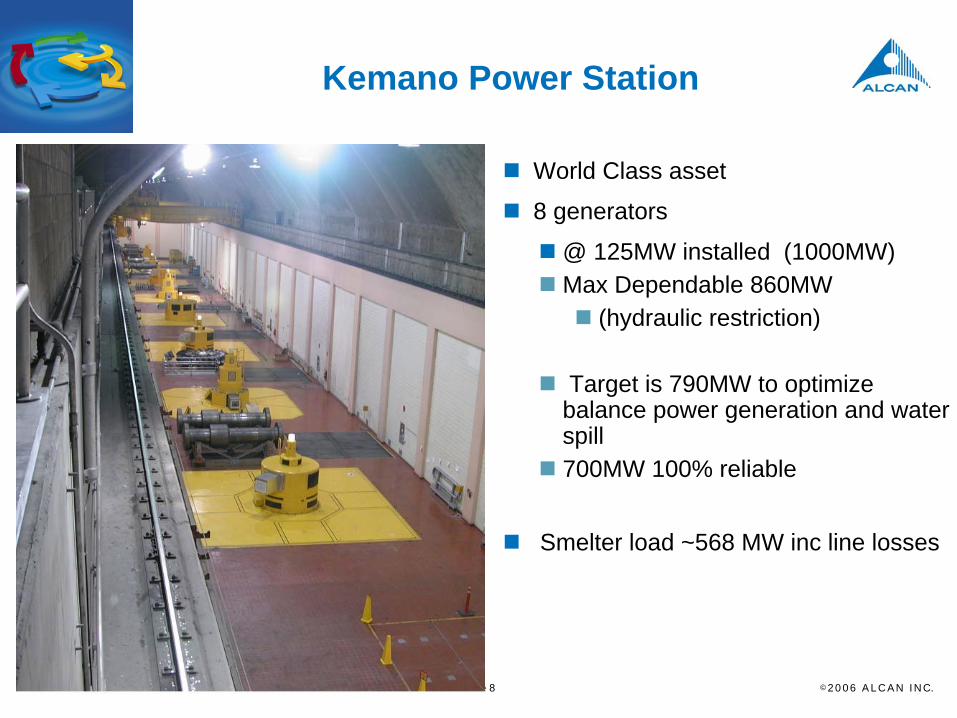
Business group or unit Slide 8 © 2 0 0 6 A L C A N I N C.
Kemano Power Station
World Class asset
8 generators
@ 125MW installed (1000MW)Max Dependable 860MW
(hydraulic restriction)
Target is 790MW to optimize balance power generation and water spill700MW 100% reliable
Smelter load ~568 MW inc line losses
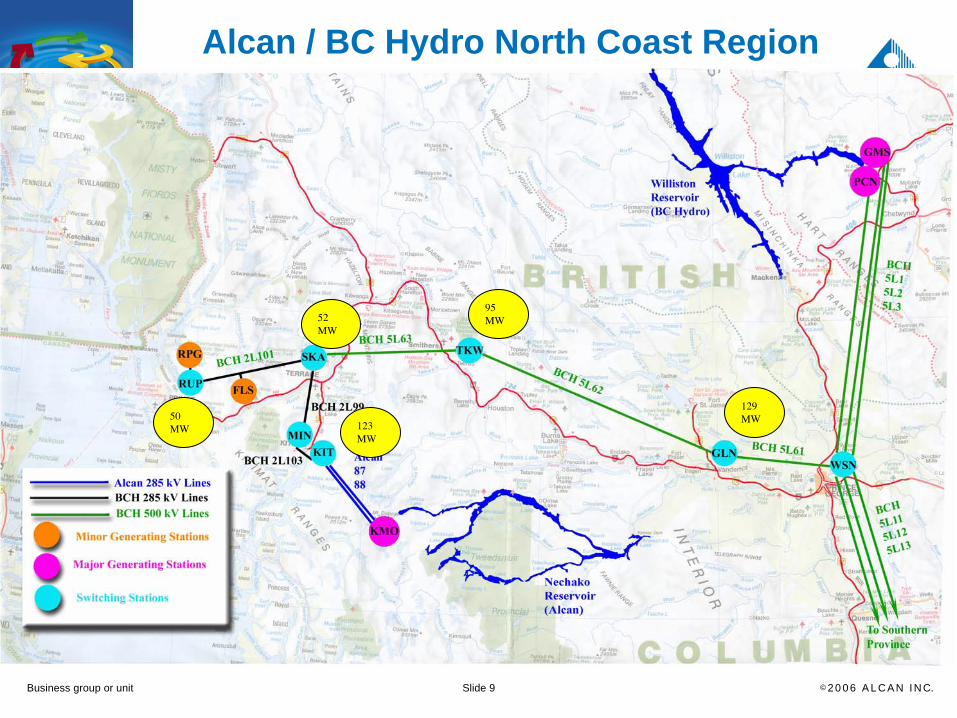
Business group or unit Slide 9 © 2 0 0 6 A L C A N I N C.
123MW
52MW
95MW
129MW50
MW
Alcan / BC Hydro North Coast Region

Business group or unit Slide 10 © 2 0 0 6 A L C A N I N C.
Nechako Historical Elevation 1955 to 2005
2765276627672768276927702771277227732774277527762777277827792780278127822783278427852786278727882789279027912792279327942795279627972798279928002801
1/Jan 31/Jan 2/Mar 2/Apr 2/May 2/Jun 2/Jul 1/Aug 1/Sep 1/Oct 1/Nov 1/Dec 31/Dec
Elev
atio
n [ft
]
1955 1956 1957 19581959 1960 1961 19621963 1964 1965 19661967 1968 1969 19701971 1972 1973 19741975 1976 1977 19781979 1980 1981 19821983 1984 1985 19861987 1988 1989 19901991 1992 1993 19941995 1996 1997 19981999 2000 2001 20022003 2004 2005

Business group or unit Slide 11 © 2 0 0 6 A L C A N I N C.
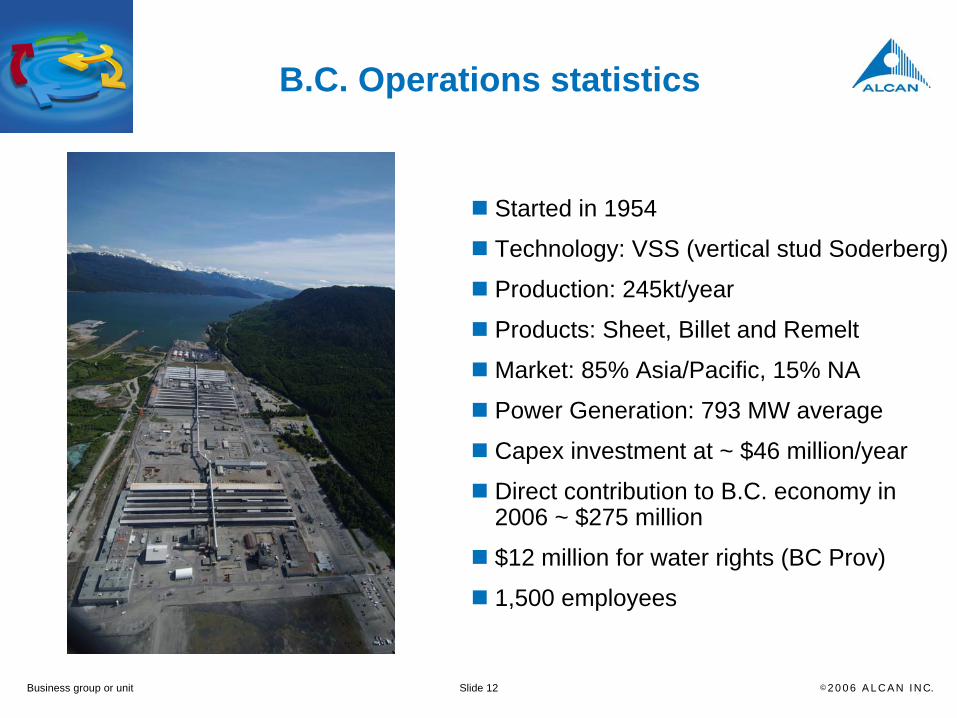
Business group or unit Slide 12 © 2 0 0 6 A L C A N I N C.
B.C. Operations statistics
Started in 1954
Technology: VSS (vertical stud Soderberg)
Production: 245kt/year
Products: Sheet, Billet and Remelt
Market: 85% Asia/Pacific, 15% NA
Power Generation: 793 MW average
Capex investment at ~ $46 million/year
Direct contribution to B.C. economy in 2006 ~ $275 million
$12 million for water rights (BC Prov)
1,500 employees
Smelter Site

Business group or unit Slide 13 © 2 0 0 6 A L C A N I N C.
Modernization Project highlights
Announced to Market on Aug 14th 20063 conditions to be met before final board approval.
AP3x technology will take Kitimat/Kemano operations to World Class standards
Up to 400,000 tonnes/year of low cost aluminum production
Significantly reduces environmental impact
PAH, Fluorides, GHG
Optimizes Kemano power availability
Agreement with BC Hydro “Smelter First” provision
Uses more power for smelter than ever before.
Wave of retirements over next 5-6 years - natural attrition to land at about 1000 jobs at the end of 2011 to last for another 35-50 years.
Investment of US$1.8 billion to modernize and expand Kitimat Works
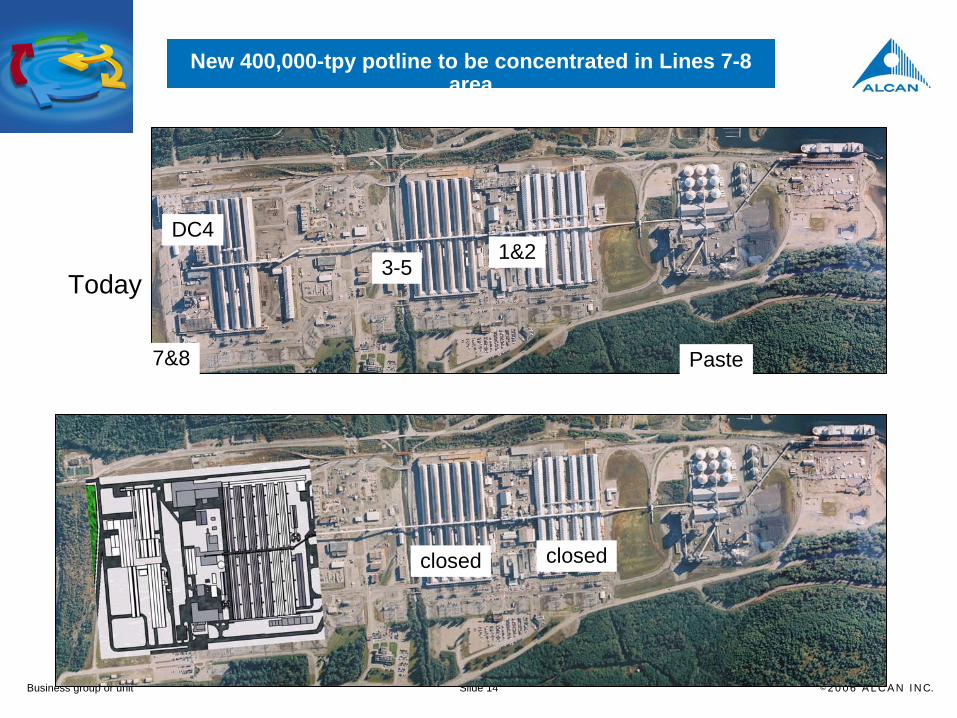
Business group or unit Slide 14 © 2 0 0 6 A L C A N I N C.
Today
closed closed
1&23-5
7&8
DC4
Paste
New 400,000-tpy potline to be concentrated in Lines 7-8 area
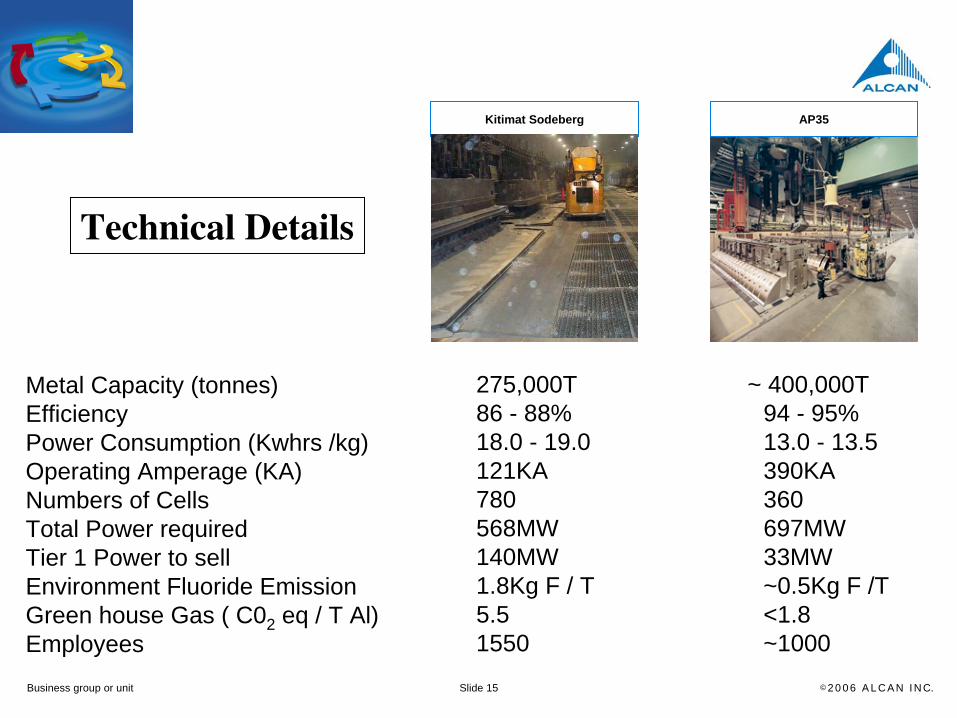
Business group or unit Slide 15 © 2 0 0 6 A L C A N I N C.
Kitimat Sodeberg AP35
Metal Capacity (tonnes)EfficiencyPower Consumption (Kwhrs /kg)Operating Amperage (KA)Numbers of CellsTotal Power requiredTier 1 Power to sellEnvironment Fluoride EmissionGreen house Gas ( C02 eq / T Al)Employees
275,000T ~ 400,000T86 - 88% 94 - 95%18.0 - 19.0 13.0 - 13.5121KA 390KA780 360568MW 697MW140MW 33MW1.8Kg F / T ~0.5Kg F /T5.5 <1.81550 ~1000
Technical Details

Business group or unit Slide 16 © 2 0 0 6 A L C A N I N C.
Conclusion
Respects existing obligationsProtection of fish and fish habitatSafety of people and facilities
Smelter First
One customer
Coordination of BCH and Alcan’s system adds valueRight to Purchase stored energy
Extended TermCertainty of revenue stream
Good contract for Alcan

Business group or unit Slide 17 © 2 0 0 6 A L C A N I N C.
Apendix

Business group or unit Slide 18 © 2 0 0 6 A L C A N I N C.
Health
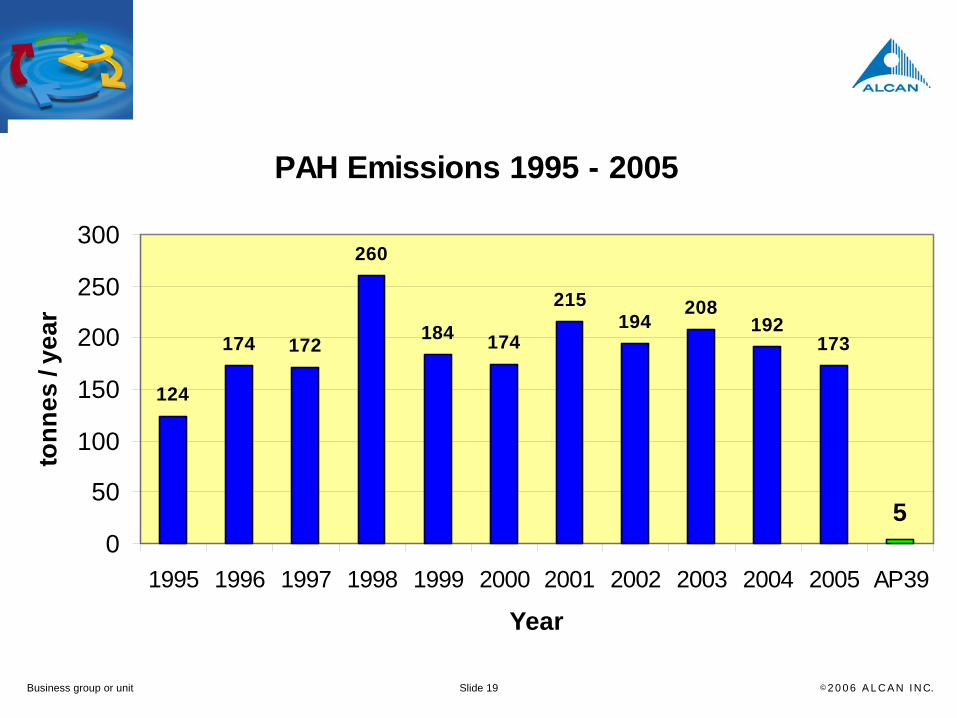
Business group or unit Slide 19 © 2 0 0 6 A L C A N I N C.
PAH Emissions 1995 - 2005
124
174 172
260
184 174
215194
208192
173
50
50
100
150
200
250
300
1995 1996 1997 1998 1999 2000 2001 2002 2003 2004 2005 AP39
Year
tonn
es /
year

Business group or unit Slide 20 © 2 0 0 6 A L C A N I N C.
Environment
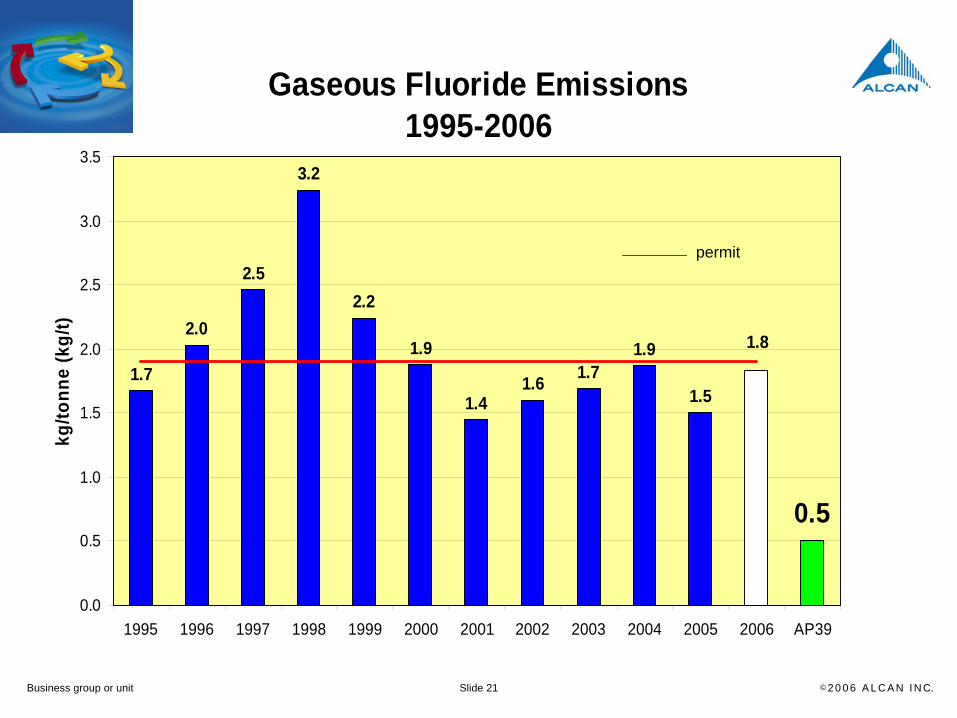
Business group or unit Slide 21 © 2 0 0 6 A L C A N I N C.
Gaseous Fluoride Emissions1995-2006
1.7
2.0
2.5
3.2
2.2
1.9
1.41.6 1.7
1.9
1.5
0.5
1.8
0.0
0.5
1.0
1.5
2.0
2.5
3.0
3.5
1995 1996 1997 1998 1999 2000 2001 2002 2003 2004 2005 2006 AP39
kg/to
nne
(kg/
t)
permit

Business group or unit Slide 22 © 2 0 0 6 A L C A N I N C.
GHG Emissions Kitimat Works 1998 - 2006
8.87.9 7.6
6.6 6.1 6.55.3
4.7
7.0
1.8
0.01.02.03.04.05.06.07.08.09.0
10.0
1998 1999 2000 2001 2002 2003 2004 2005 2006 AP39
Tonn
es C
O2
per t
onne
Alu
min
umGHG reduced by ½ million tonnes per year