amr 2013 background tables - caerphilly
TRANSCRIPT

Caerphilly County BoroughLocal Development Plan up to 2021
AMR Background Tables 2012Monitoring Period 1st April 2011 to 31st March 2012 Approved 8th October, 2013
Pauline Elliott - MA(Hons), MA, DEML, MIED, MRTPIHead of Regeneration and Planning
2013
ii
ContentsMandatory LDP Indicators � � � � � � � � � � � � � � � � � � � � � � � � � � � � � � � � � � � � � � � � � � � 1
LDP Monitoring Indicators � � � � � � � � � � � � � � � � � � � � � � � � � � � � � � � � � � � � � � � � � � � 3
LDP Monitoring Factors � � � � � � � � � � � � � � � � � � � � � � � � � � � � � � � � � � � � � � � � � � � � � 4
LDP Monitoring Measures � � � � � � � � � � � � � � � � � � � � � � � � � � � � � � � � � � � � � � � � � � � 8
SEA/ SA Monitoring � � � � � � � � � � � � � � � � � � � � � � � � � � � � � � � � � � � � � � � � � � � � � � � 17
1
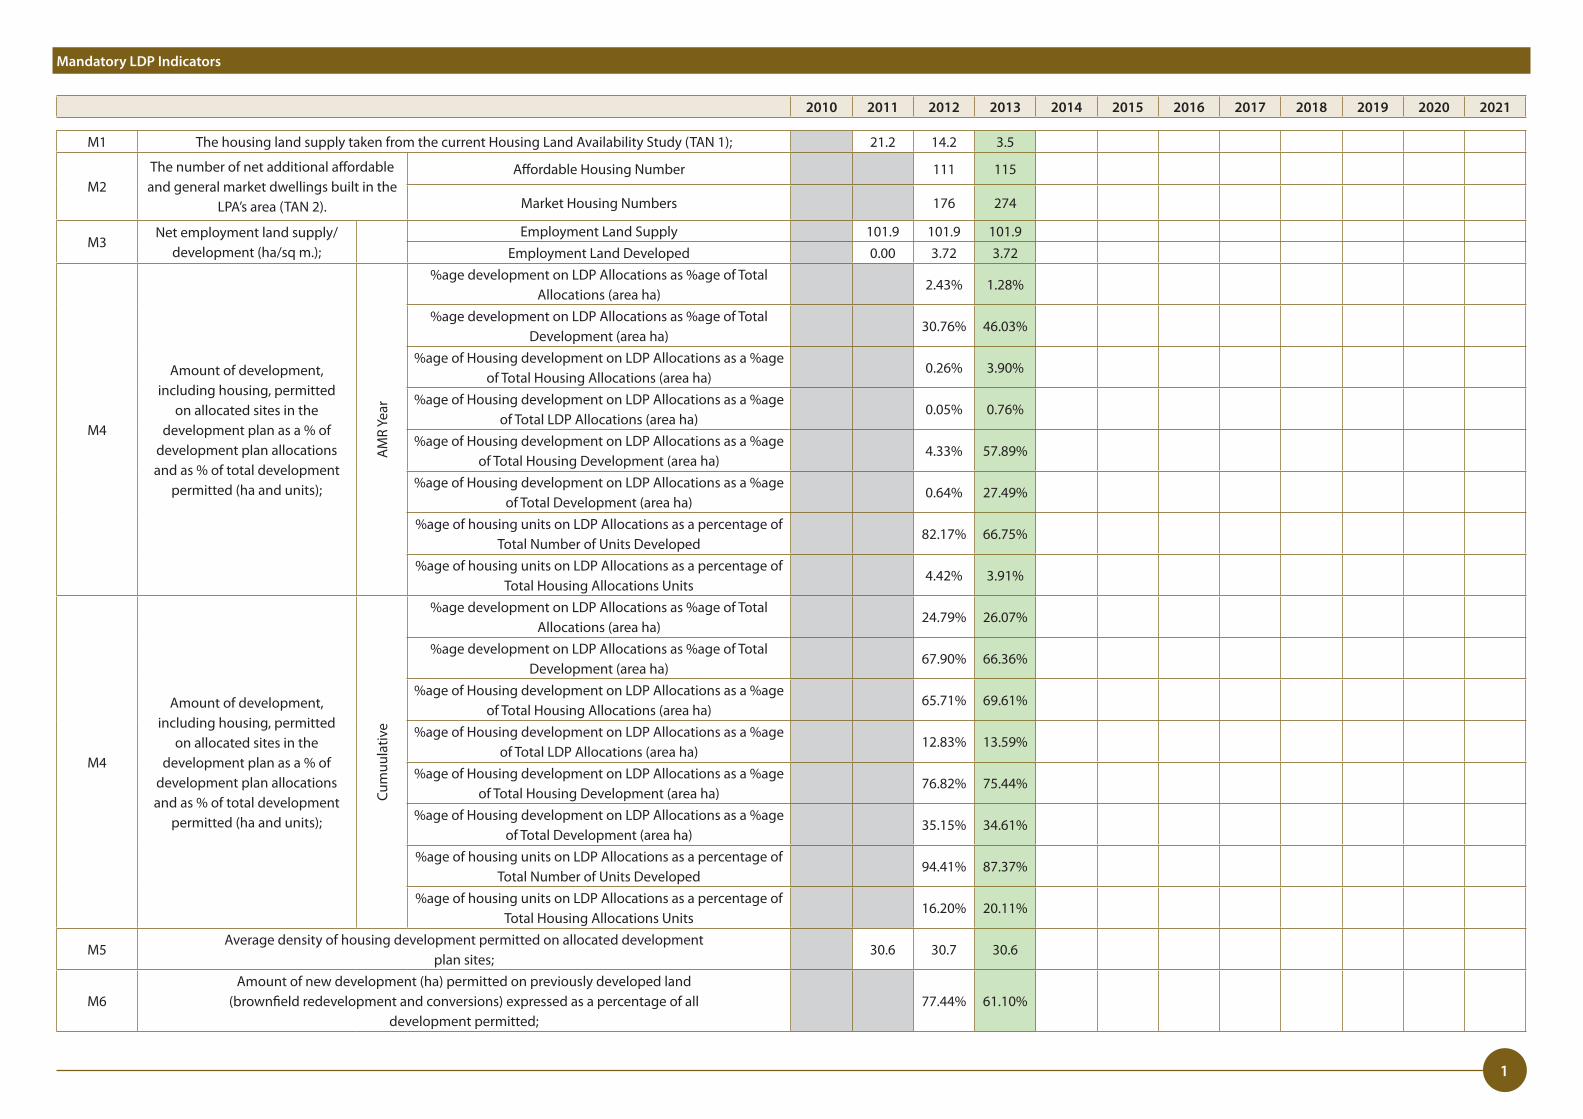
Mandatory LDP Indicators
M1 The housing land supply taken from the current Housing Land Availability Study (TAN 1); 21�2 14�2 3�5
M2The number of net additional affordable and general market dwellings built in the
LPA’s area (TAN 2)�
Affordable Housing Number 111 115
Market Housing Numbers 176 274
M3Net employment land supply/
development (ha/sq m�);Employment Land Supply 101�9 101�9 101�9
Employment Land Developed 0�00 3�72 3�72
M4
Amount of development, including housing, permitted
on allocated sites in the development plan as a % of
development plan allocations and as % of total development
permitted (ha and units);
AM
R Ye
ar
%age development on LDP Allocations as %age of Total Allocations (area ha)
2�43% 1�28%
%age development on LDP Allocations as %age of Total Development (area ha)
30�76% 46�03%
%age of Housing development on LDP Allocations as a %age of Total Housing Allocations (area ha)
0�26% 3�90%
%age of Housing development on LDP Allocations as a %age of Total LDP Allocations (area ha)
0�05% 0�76%
%age of Housing development on LDP Allocations as a %age of Total Housing Development (area ha)
4�33% 57�89%
%age of Housing development on LDP Allocations as a %age of Total Development (area ha)
0�64% 27�49%
%age of housing units on LDP Allocations as a percentage of Total Number of Units Developed
82�17% 66�75%
%age of housing units on LDP Allocations as a percentage of Total Housing Allocations Units
4�42% 3�91%
M4
Amount of development, including housing, permitted
on allocated sites in the development plan as a % of
development plan allocations and as % of total development
permitted (ha and units);
Cum
uula
tive
%age development on LDP Allocations as %age of Total Allocations (area ha)
24�79% 26�07%
%age development on LDP Allocations as %age of Total Development (area ha)
67�90% 66�36%
%age of Housing development on LDP Allocations as a %age of Total Housing Allocations (area ha)
65�71% 69�61%
%age of Housing development on LDP Allocations as a %age of Total LDP Allocations (area ha)
12�83% 13�59%
%age of Housing development on LDP Allocations as a %age of Total Housing Development (area ha)
76�82% 75�44%
%age of Housing development on LDP Allocations as a %age of Total Development (area ha)
35�15% 34�61%
%age of housing units on LDP Allocations as a percentage of Total Number of Units Developed
94�41% 87�37%
%age of housing units on LDP Allocations as a percentage of Total Housing Allocations Units
16�20% 20�11%
M5Average density of housing development permitted on allocated development
plan sites;30�6 30�7 30�6
M6Amount of new development (ha) permitted on previously developed land
(brownfield redevelopment and conversions) expressed as a percentage of alldevelopment permitted;
77�44% 61�10%
2010 2011 2012 2013 2014 2015 2016 2017 2018 2019 2020 2021
2
M7Amount of major retail, office and leisure development (sq m) permitted in towncentres expressed as a percentage of all major development permitted (TAN 4);
0�00% 38�81% 0�00%
M8
Amount of development (by TAN 15 paragraph 5�1 development
category) permitted in C1 and C2 floodplain areas not meeting all TAN 15
tests (paragraph 6�2 iv);
Emergency Services 0 0 0
Highly Vulnerable Development 2 6 10
Less Vulnerable Development 4 5 9
M9Amount of greenfield and open space lost to development (ha) which is not
allocated in the development plan;
Greenfield Land Lost to Development(Hectares)
12�46 2�29
Open Space lost to development (Hectares) 13�37 10�55
M10Amount of waste management capacity permitted expressed as a percentage of the total capacity
required, as identified within the Regional Waste Plan (TAN 21);
M11The extent of primary land-won aggregates permitted in accordance with the Regional Technical
Statement for Aggregates expressed as a percentage of the total capacity required as identified in the Regional Technical Statement (MTAN);
151�8% 186�1% 129�9%
M12The capacity of Renewable Energy developments (MW) installed inside
Strategic Search Areas by type (TAN 8).
2010 2011 2012 2013 2014 2015 2016 2017 2018 2019 2020 2021
3
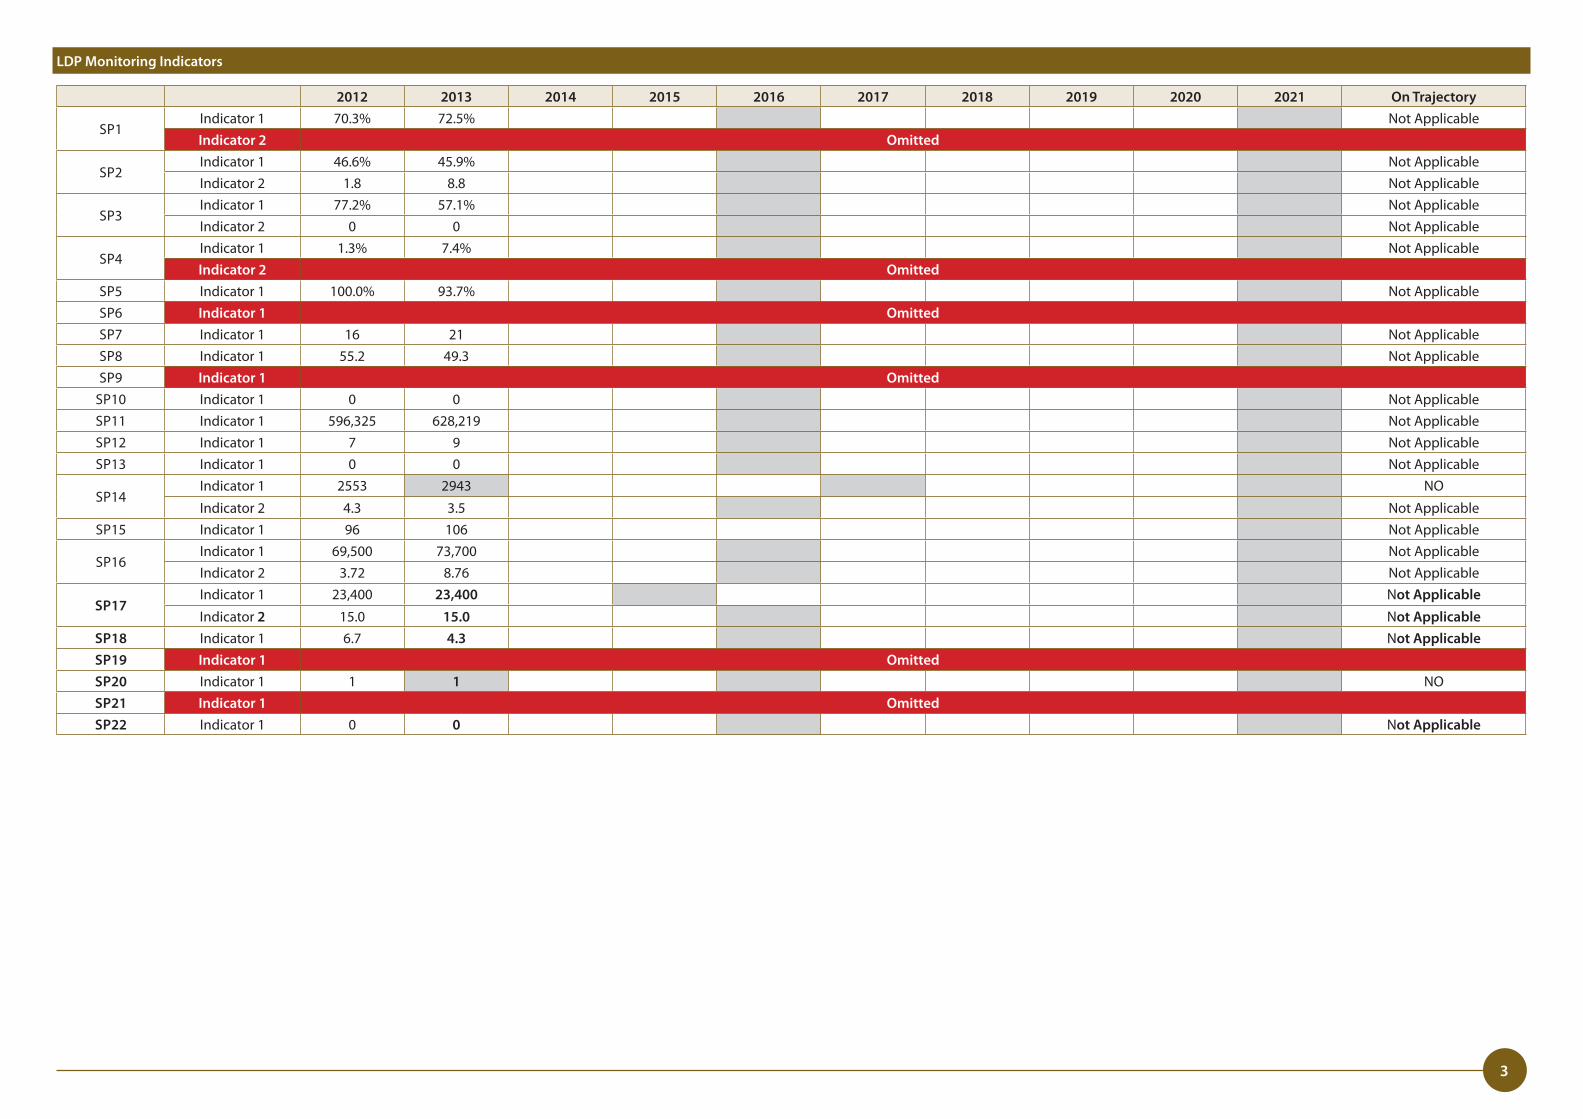
LDP Monitoring Indicators
2012 2013 2014 2015 2016 2017 2018 2019 2020 2021 On Trajectory
SP1Indicator 1 70�3% 72�5% Not ApplicableIndicator 2 Omitted
SP2Indicator 1 46�6% 45�9% Not ApplicableIndicator 2 1�8 8�8 Not Applicable
SP3Indicator 1 77�2% 57�1% Not ApplicableIndicator 2 0 0 Not Applicable
SP4Indicator 1 1�3% 7�4% Not ApplicableIndicator 2 Omitted
SP5 Indicator 1 100�0% 93�7% Not ApplicableSP6 Indicator 1 OmittedSP7 Indicator 1 16 21 Not ApplicableSP8 Indicator 1 55�2 49�3 Not ApplicableSP9 Indicator 1 Omitted
SP10 Indicator 1 0 0 Not ApplicableSP11 Indicator 1 596,325 628,219 Not ApplicableSP12 Indicator 1 7 9 Not ApplicableSP13 Indicator 1 0 0 Not Applicable
SP14Indicator 1 2553 2943 NO
Indicator 2 4�3 3�5 Not ApplicableSP15 Indicator 1 96 106 Not Applicable
SP16Indicator 1 69,500 73,700 Not ApplicableIndicator 2 3�72 8�76 Not Applicable
SP17Indicator 1 23,400 23,400 Not ApplicableIndicator 2 15�0 15.0 Not Applicable
SP18 Indicator 1 6�7 4.3 Not ApplicableSP19 Indicator 1 OmittedSP20 Indicator 1 1 1 NOSP21 Indicator 1 OmittedSP22 Indicator 1 0 0 Not Applicable
4
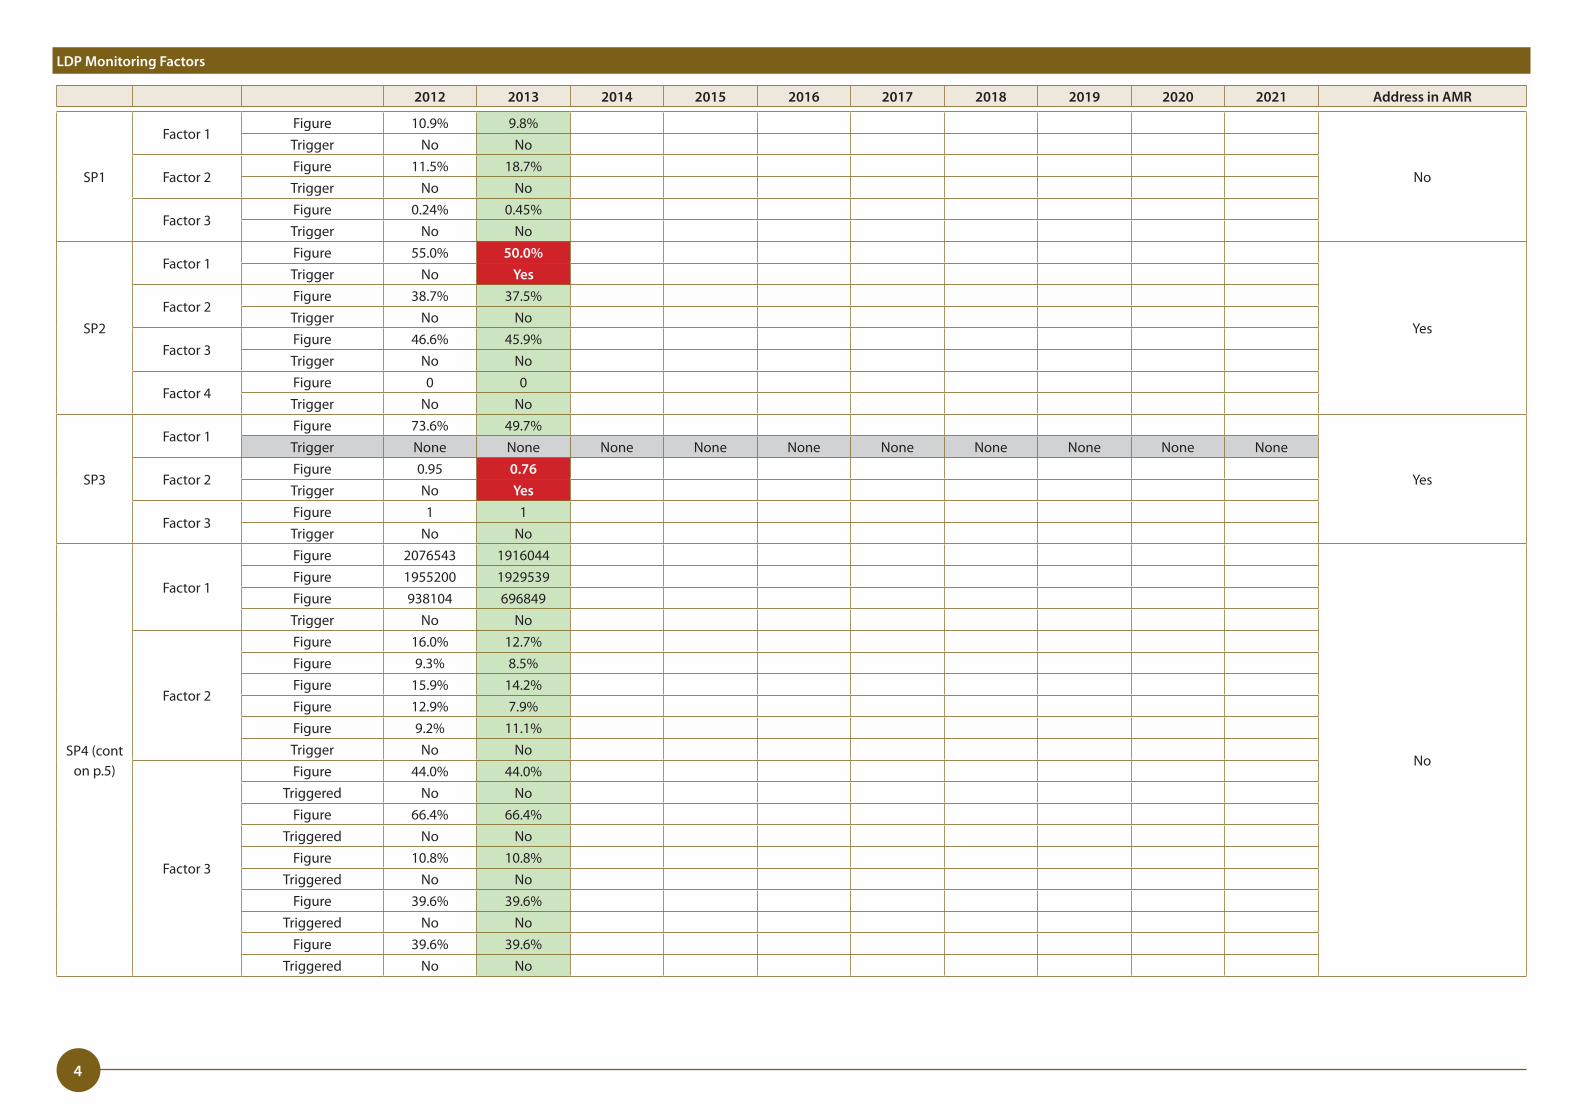
SP1
Factor 1Figure 10�9% 9�8%
No
Trigger No No
Factor 2Figure 11�5% 18�7%Trigger No No
Factor 3Figure 0�24% 0�45%Trigger No No
SP2
Factor 1Figure 55�0% 50.0%
Yes
Trigger No Yes
Factor 2Figure 38�7% 37�5%Trigger No No
Factor 3Figure 46�6% 45�9%Trigger No No
Factor 4Figure 0 0Trigger No No
SP3
Factor 1Figure 73�6% 49�7%
Yes
Trigger None None None None None None None None None None
Factor 2Figure 0�95 0.76Trigger No Yes
Factor 3Figure 1 1Trigger No No
SP4 (cont on p�5)
Factor 1
Figure 2076543 1916044
No
Figure 1955200 1929539Figure 938104 696849Trigger No No
Factor 2
Figure 16�0% 12�7%Figure 9�3% 8�5%Figure 15�9% 14�2%Figure 12�9% 7�9%Figure 9�2% 11�1%Trigger No No
Factor 3
Figure 44�0% 44�0%Triggered No No
Figure 66�4% 66�4%Triggered No No
Figure 10�8% 10�8%Triggered No No
Figure 39�6% 39�6%Triggered No No
Figure 39�6% 39�6%Triggered No No
LDP Monitoring Factors
2012 2013 2014 2015 2016 2017 2018 2019 2020 2021 Address in AMR
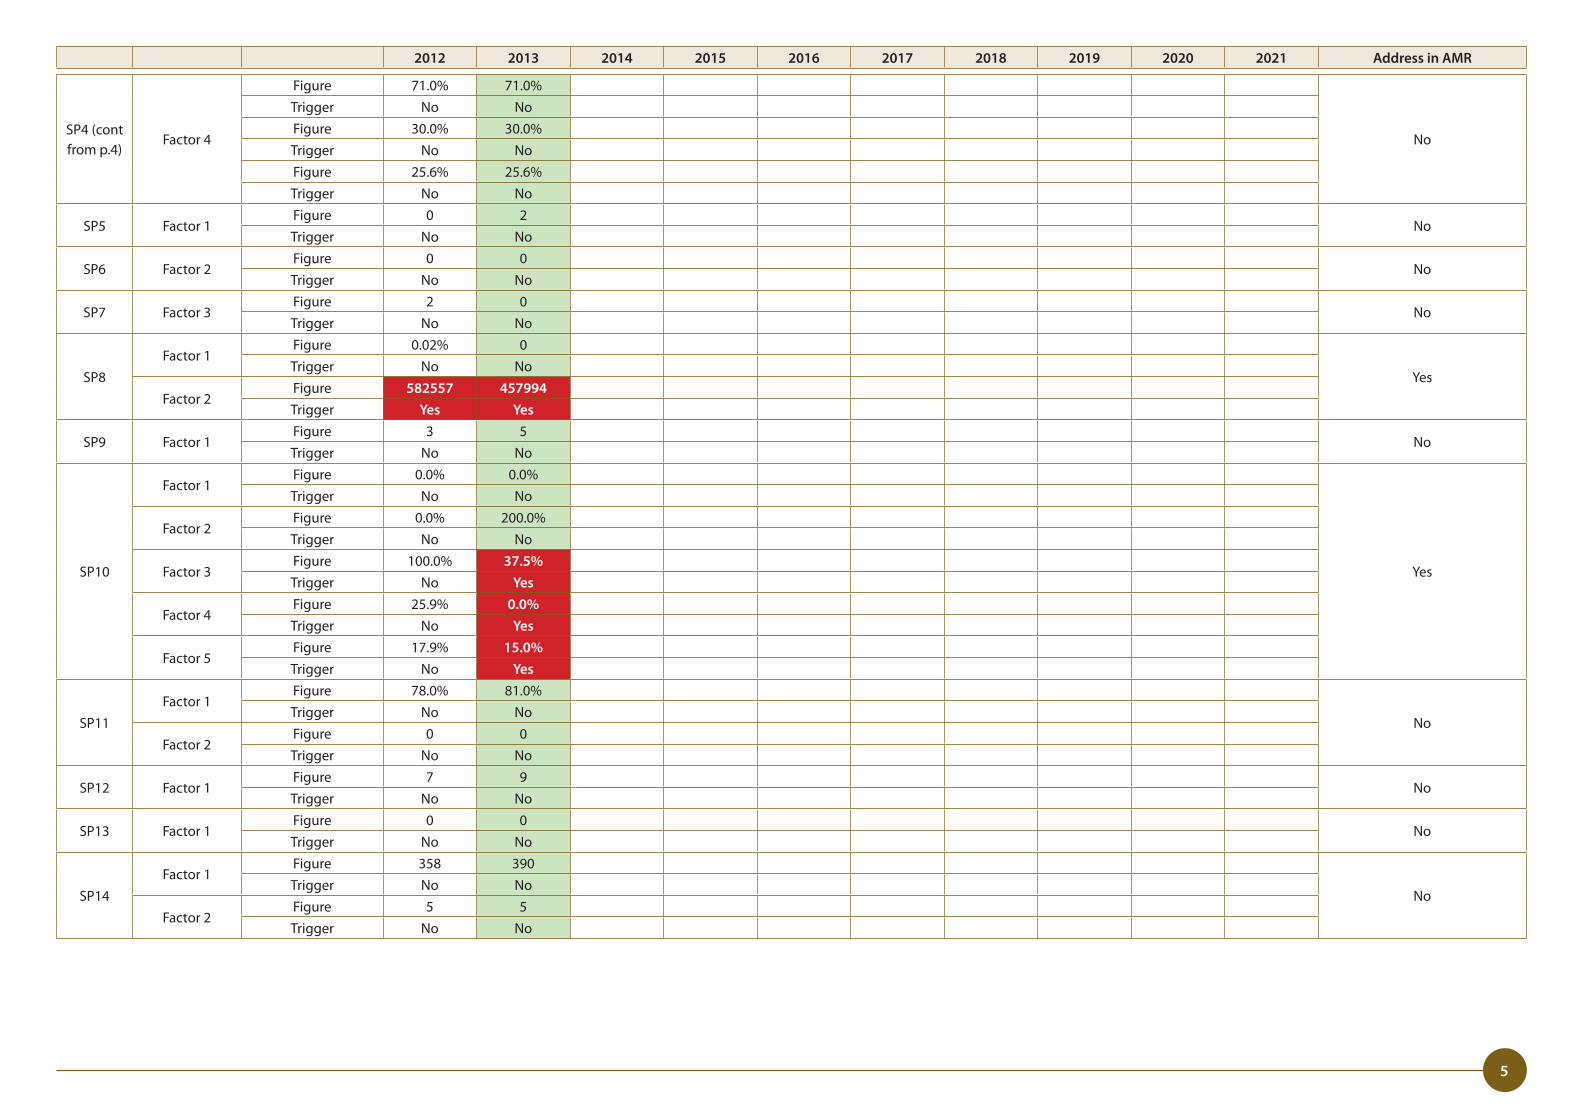
5
SP4 (cont from p�4)
Factor 4
Figure 71�0% 71�0%
No
Trigger No NoFigure 30�0% 30�0%Trigger No NoFigure 25�6% 25�6%Trigger No No
SP5 Factor 1Figure 0 2
NoTrigger No No
SP6 Factor 2Figure 0 0
NoTrigger No No
SP7 Factor 3Figure 2 0
NoTrigger No No
SP8Factor 1
Figure 0�02% 0
YesTrigger No No
Factor 2Figure 582557 457994Trigger Yes Yes
SP9 Factor 1Figure 3 5
NoTrigger No No
SP10
Factor 1Figure 0�0% 0�0%
Yes
Trigger No No
Factor 2Figure 0�0% 200�0%Trigger No No
Factor 3Figure 100�0% 37.5%Trigger No Yes
Factor 4Figure 25�9% 0.0%Trigger No Yes
Factor 5Figure 17�9% 15.0%Trigger No Yes
SP11Factor 1
Figure 78�0% 81�0%
NoTrigger No No
Factor 2Figure 0 0Trigger No No
SP12 Factor 1Figure 7 9
NoTrigger No No
SP13 Factor 1Figure 0 0
NoTrigger No No
SP14Factor 1
Figure 358 390
NoTrigger No No
Factor 2Figure 5 5Trigger No No
2012 2013 2014 2015 2016 2017 2018 2019 2020 2021 Address in AMR
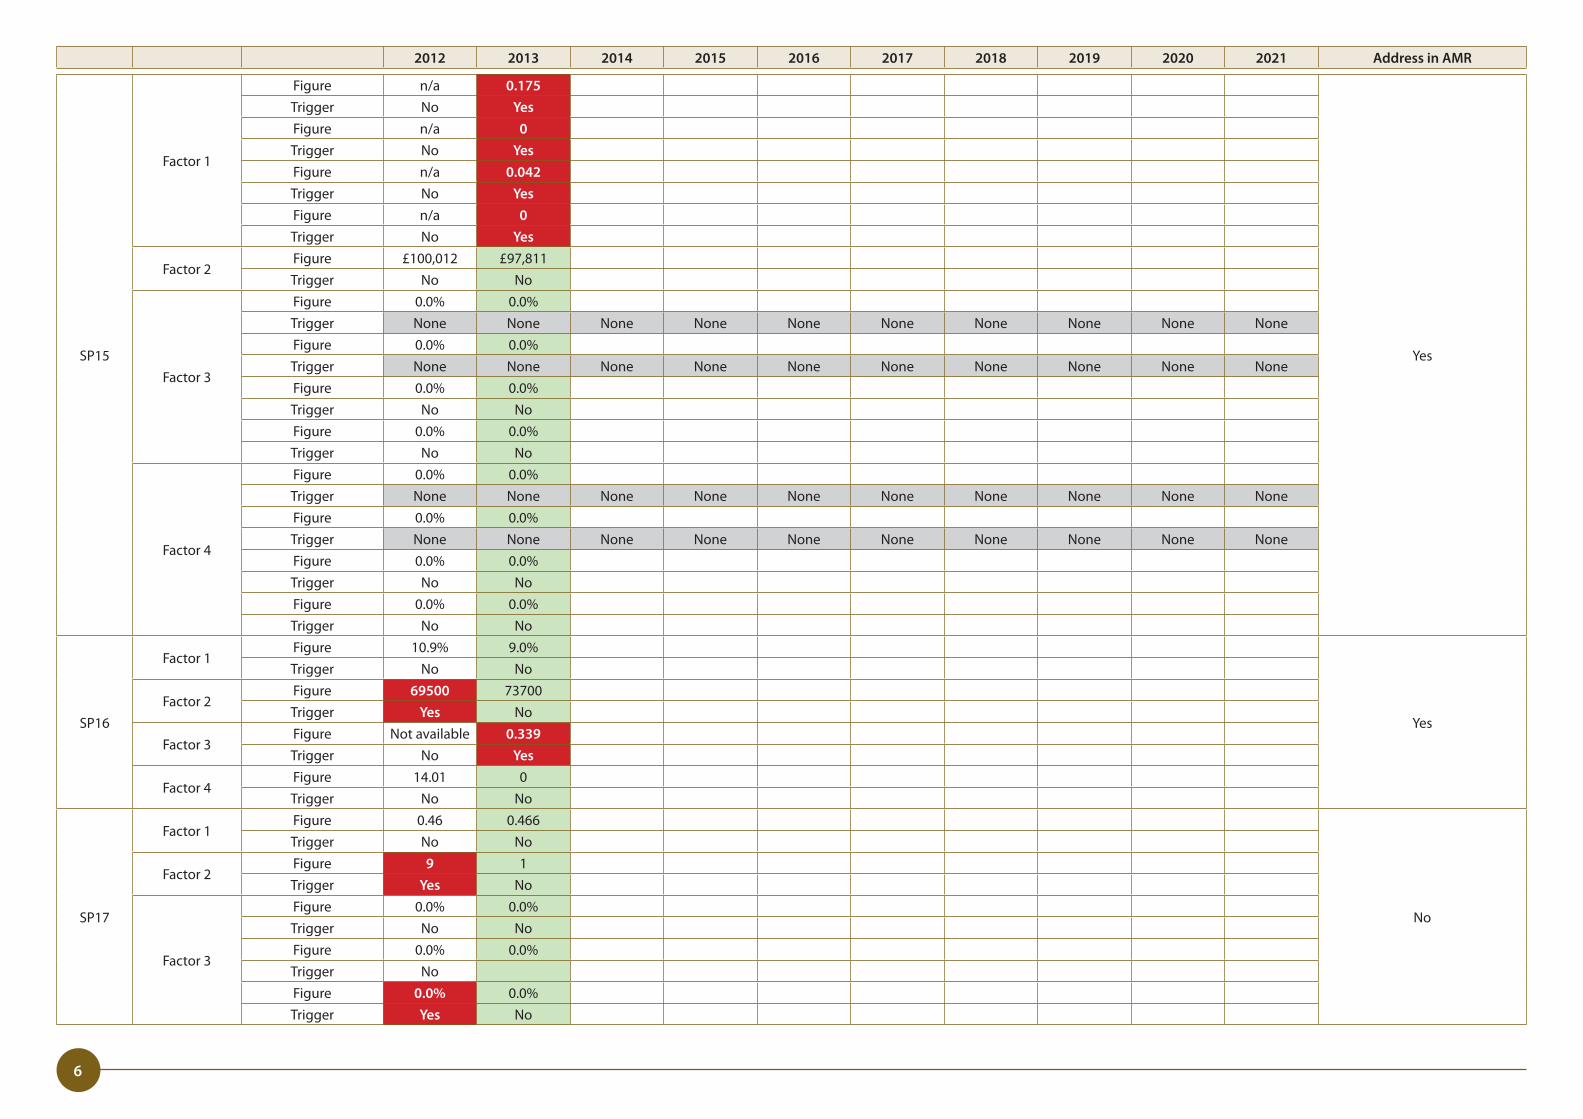
6
SP15
Factor 1
Figure n/a 0.175
Yes
Trigger No YesFigure n/a 0Trigger No YesFigure n/a 0.042Trigger No YesFigure n/a 0Trigger No Yes
Factor 2Figure £100,012 £97,811Trigger No No
Factor 3
Figure 0�0% 0�0%Trigger None None None None None None None None None NoneFigure 0�0% 0�0%Trigger None None None None None None None None None NoneFigure 0�0% 0�0%Trigger No NoFigure 0�0% 0�0%Trigger No No
Factor 4
Figure 0�0% 0�0%Trigger None None None None None None None None None NoneFigure 0�0% 0�0%Trigger None None None None None None None None None NoneFigure 0�0% 0�0%Trigger No NoFigure 0�0% 0�0%Trigger No No
SP16
Factor 1Figure 10�9% 9�0%
Yes
Trigger No No
Factor 2Figure 69500 73700Trigger Yes No
Factor 3Figure Not available 0.339Trigger No Yes
Factor 4Figure 14�01 0Trigger No No
SP17
Factor 1Figure 0�46 0�466
No
Trigger No No
Factor 2Figure 9 1Trigger Yes No
Factor 3
Figure 0�0% 0�0%Trigger No NoFigure 0�0% 0�0%Trigger NoFigure 0.0% 0�0%Trigger Yes No
2012 2013 2014 2015 2016 2017 2018 2019 2020 2021 Address in AMR
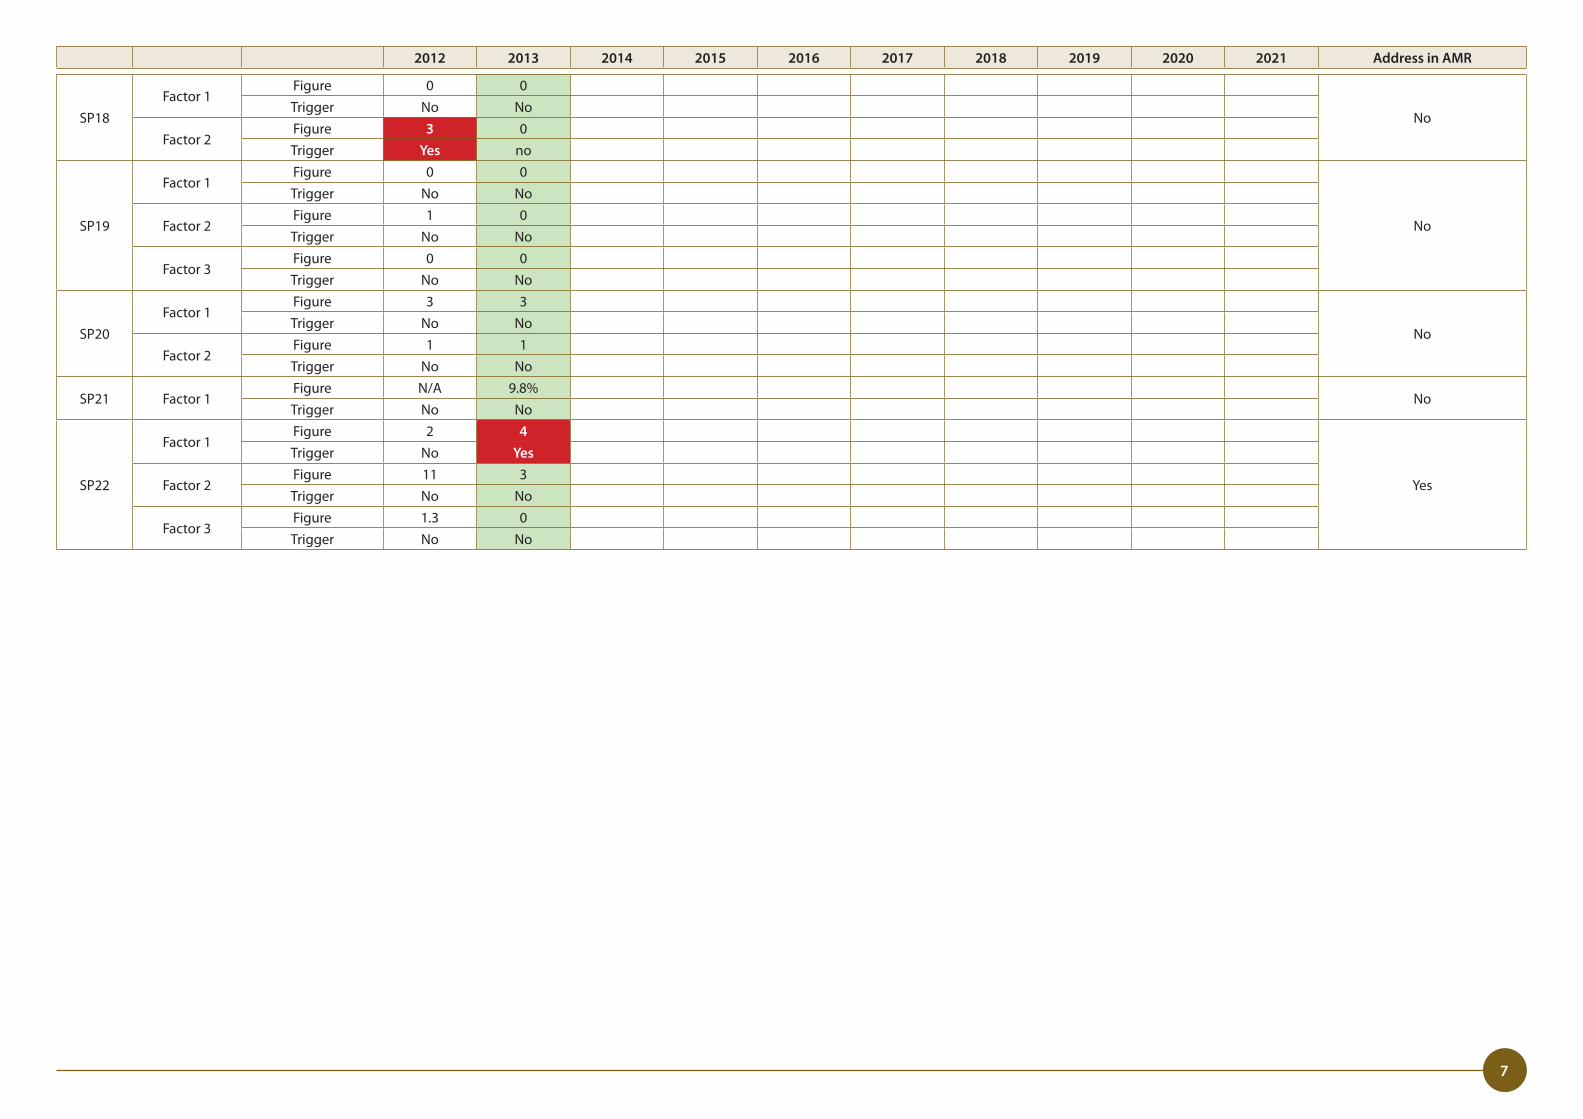
7
SP18Factor 1
Figure 0 0
NoTrigger No No
Factor 2Figure 3 0Trigger Yes no
SP19
Factor 1Figure 0 0
No
Trigger No No
Factor 2Figure 1 0Trigger No No
Factor 3Figure 0 0Trigger No No
SP20Factor 1
Figure 3 3
NoTrigger No No
Factor 2Figure 1 1Trigger No No
SP21 Factor 1Figure N/A 9�8%
NoTrigger No No
SP22
Factor 1Figure 2 4
Yes
Trigger No Yes
Factor 2Figure 11 3Trigger No No
Factor 3Figure 1�3 0Trigger No No
2012 2013 2014 2015 2016 2017 2018 2019 2020 2021 Address in AMR
8
Measures Monitor2012 AMR
2013 AMR
2014 AMR
2015 AMR
2016 AMR
2017 AMR
2018 AMR
2019 AMR
2020 AMR
2021 AMR
SP1 - Development Strategy HoVRA 74% 75%L1 Indicator 1: Percentage of population economically active 70�3% 72�5%
L2 Factor 1 Unemployment Rate Trigger 15%Figure 10�9% 9�8%
Triggered No No
L3 Factor 2 Total employment floorspace vacantTrigger Figure 11�5% 18�7%
30% 5%
Triggered No No
L4 Indicator 2: Percentage of population in the 100 most deprived wards in Wales
L5 Factor 3New housing developed as a percentage of total
housing stock (HoVRA)Trigger 0%
Figure 24% 0�45%2 yr total 0 0�69%Triggered No No
Measures Monitor 2012 AMR
2013 AMR
2014 AMR
2015 AMR
2016 AMR
2017 AMR
2018 AMR
2019 AMR
2020 AMR
2021 AMR
SP2 - Development Strategy NCC 42% 39%L6 Indicator 1: Changes in commuting levels 46�6% 45�9%
L7 Factor 1 Job Density Trigger 0�50Figure 0�55 0�50
Triggered No No
L8 Factor 2Out-Commuting as a percentage of total travel
to work in and out of the county borough�Trigger 50%
Figure 38�7% 37�5%Triggered No No
L9 Factor 3Out commuting as a percentage of total
commuting of residents of the county borough�Trigger 50%
Figure 46�6% 45�9%Triggered No No
5% 20%L10 Indicator 2: Take-up of employment land 1�81 8�76
L11 Factor 4Development of land allocated for employment
use under policy EM1Trigger 5
Figure 0�0 0�05 yr total 1 2Triggered No No
Measures Monitor 2012 AMR
2013 AMR
2014 AMR
2015 AMR
2016 AMR
2017 AMR
2018 AMR
2019 AMR
2020 AMR
2021 AMR
SP3 - Development Strategy SCC 75% 75%L12 Indicator 1: Percentage of developments on brownfield land within settlement limits 77�2% 57�1%
L13 Factor 1Percentage of total new development on
brownfield landTrigger N/A
Figure 73�6% 49�7%Triggered
L14 Factor 2Percentage of total new housing development
on Brownfield landTrigger 88%
Figure 95�0% 76�0%Triggered No Yes
100%L15 Indicator 2: Number of new developments with Travel Plans 0 0
L16 Factor 3
Number of large traffic generating developments (defined in accordance with Annex D of TAN18) with agreed Travel Plans containing sustainable transport measures�
100% 100%
No No
LDP Monitoring Measures
The highlighted figures are Monitoring Targets. These provide “stepping stone” targets for each Indicator against which the progress of the policy can be monitored. It should be noted that some policies will not have “stepping stone” targets and will only have one for the end of the period. That is because there aren’t appropriate intermediate levels that could be used or the policy will be realised in one hit, e.g. a site allocation.
74%
9
Measures Monitor2012 AMR
2013 AMR
2014 AMR
2015 AMR
2016 AMR
2017 AMR
2018 AMR
2019 AMR
2020 AMR
2021 AMR
SP4 - settlement strategy 4541836L17 Indicator 1: Percentage increase in footfall in retail centres 1�33% -7�38%
L18 Factor 1Percentage of total new development on
brownfield land
Trigger1,407,4341,268,837668,171
Caerphilly 2,076,543 1,916,044Blackwood 1,955,200 1,929,539
Bargoed 938,104 696,849Triggered No No
L19 Factor 2Vacancy Rates in the 5 principal town
centres
Trigger
20% 5%
Caerphilly 16�0% 12�7%Blackwood 9�3% 8�5%
Bargoed 15�9% 14�2%YM 12�9% 7�9%
Risca/ Pontymister 9�2% 11�1%Triggered No No
L20 Indicator 2: Percentage residents satisfied with their centre
L21 Factor 3Percentage of residents satisfied with
their town centres (only Bargoed, Blackwood & Caerphilly)
Caerphilly %age Figure 44�0% 44�0%34�0% Triggered No No
Blackwood %age Figure 66�4% 66�4%56�4% Triggered No No
Bargoed %age Figure 10�8% 10�8%8�0% Triggered No NoYM %age Figure 39�6% 39�6%
29�6% Triggered No NoRisca %age Figure 39�6% 39�6%
29�6% Triggered No No
L22 Factor 4Percentage of money spent in County
Borough retail centres as a total of total spend
Trigger65%
Convenience 71�0% 71�0%Triggered No No
Trigger25%
Non-Bulky 30�0% 30�0%Triggered No No
Trigger25%
Bulky 25�6% 25�6%Triggered No No
Measures Monitor2012 AMR
2013 AMR
2014 AMR
2015 AMR
2016 AMR
2017 AMR
2018 AMR
2019 AMR
2020 AMR
2021 AMR
SP5 - Settlement Boundaries 100%L23 Indicator 1: Percentage of developments within settlement boundaries 100�0% 93�7%
L24 Factor 1
Number of applications for urban forms of development as definedby criterion
D, Policy CW17) located outside of settlement boundaries either approved
by CCBC or allowed on appeal
Trigger5
3
Figures 0 23 Year Total 0 2
Triggered No No
The highlighted figures are Monitoring Targets. These provide “stepping stone” targets for each Indicator against which the progress of the policy can be monitored. It should be noted that some policies will not have “stepping stone” targets and will only have one for the end of the period. That is because there aren’t appropriate intermediate levels that could be used or the policy will be realised in one hit, e.g. a site allocation.
74%
10
Measures Monitor2012 AMR
2013 AMR
2014 AMR
2015 AMR
2016 AMR
2017 AMR
2018 AMR
2019 AMR
2020 AMR
2021 AMR
SP6 - Place MakingL25 Indicator 1: Percentage of development with Design Statements 100%
L26 Factor 1
Number of planning applications approved not in accordance with relevant
Supplementary Planning Guidance (i�e� Development Design Guides relating to the proposed use or a site development
brief )�
Figures 0 0
3 3 Year Positive0 00 0
0 Triggered No No
Measures Monitor2012 AMR
2013 AMR
2014 AMR
2015 AMR
2016 AMR
2017 AMR
2018 AMR
2019 AMR
2020 AMR
2021 AMR
SP7 - Planning Obligations 15 20L27 Indicator 1: Total obligations negotiated with developers 16 21
L28 Factor 1Number of Policy CF1 Schemes delivered
through Planning obligations�
Trigger Figures 2 0
None in 5 years5 Year Period 0 1
Triggered No No
Measures Monitor2012 AMR
2013 AMR
2014 AMR
2015 AMR
2016 AMR
2017 AMR
2018 AMR
2019 AMR
2020 AMR
2021 AMR
SP8 – Minerals Safeguarding 10 10
L29 Indicator 1: Contribution of county borough to regional demand (Landbank) 55�2 49�3
L30 Factor 1
Area of permitted development approved in identified safeguarding areas, as a
percentage of total safeguarding area for that mineral�
Trigger Figures 0�02% 0�01%
1% Triggered No No
L31 Factor 2Average yearly usage of aggregates by
the construction industry (averaged across the preceding 3 years)
Trigger Figures 582557 457994
890,0003 Year Ave
0 0
800,000 1 1
Triggered Yes Yes
Measures Monitor2012 AMR
2013 AMR
2014 AMR
2015 AMR
2016 AMR
2017 AMR
2018 AMR
2019 AMR
2020 AMR
2021 AMR
SP9 – Waste Management 50%L32 Indicator 1: Total obligations negotiated with developers
L33 Factor 1Number of permitted applications for, or incorporating, waste management facilities on existing industrial estates�
Trigger Figures 3 5
02 Year Period 0 0
Triggered No No
The highlighted figures are Monitoring Targets. These provide “stepping stone” targets for each Indicator against which the progress of the policy can be monitored. It should be noted that some policies will not have “stepping stone” targets and will only have one for the end of the period. That is because there aren’t appropriate intermediate levels that could be used or the policy will be realised in one hit, e.g. a site allocation.
74%
11
Measures Monitor2012 AMR
2013 AMR
2014 AMR
2015 AMR
2016 AMR
2017 AMR
2018 AMR
2019 AMR
2020 AMR
2021 AMR
SP10 – Conservation of Natural Heritage 0L34 Indicator 1: Loss of features of the natural heritage 0 0
L35 Factor 1Area of SSSI Lost to development on a site
(SEA/SA Indicator)Trigger
5%Figures 0�0% 0�0%
Triggered No No
L36 Factor 2Number of approved applications that
result in loss of Area of SINC/LNR to development
Trigger3
Figures 0 2
3 Yr Period 0 1Triggered No No
L37 Factor 3
Number of approved applications that provide compensatory provision (equal
or greater in area than that lost) as a percentage of the number of approved
allocations that result in loss of SINC/LNR�
Trigger75%
Figures 100�0% 37�5%
Triggered No Yes
L38 Factor 4Number of applications within SLAs
that are refused, as a percentage of all applications within SLAs
Trigger17�5%
Figures 25�9% 0�0%
Triggered No Yes
L39 Factor 5Number of applications within VILLs
that are refused, as a percentage of all applications within VILLs
Trigger17�5%
Figures 17�94% 15�00%
Triggered No Yes
Measures Monitor 2012 AMR
2013 AMR
2014 AMR
2015 AMR
2016 AMR
2017 AMR
2018 AMR
2019 AMR
2020 AMR
2021 AMR
SP12 – Development of the Valleys Regional Park 4 12L43 Indicator 1: Number of developments that contribute to the Valleys Regional Park 7 9
L44 Factor 1 Delivery of Valley Regional Park SchemesTrigger
4
Figures 7 2
Triggered No No
Measures Monitor 2012 AMR
2013 AMR
2014 AMR
2015 AMR
2016 AMR
2017 AMR
2018 AMR
2019 AMR
2020 AMR
2021 AMR
SP11 – Countryside Recreation 341000 37200L40 Indicator 1: Numbers of visitors to countryside recreation facilities 596325 628219L41 Factor 1 Increase Customer Satisfaction Trigger
54�7%Figures 78�0% 81�0%
Triggered No No
L42 Factor 2 Number of monitored facilities with satisfaction levels below 60%
Trigger35
Figures 0 0
5 Yr Period 0 0
Triggered No No
The highlighted figures are Monitoring Targets. These provide “stepping stone” targets for each Indicator against which the progress of the policy can be monitored. It should be noted that some policies will not have “stepping stone” targets and will only have one for the end of the period. That is because there aren’t appropriate intermediate levels that could be used or the policy will be realised in one hit, e.g. a site allocation.
74%
12
Measures Monitor2012 AMR
2013 AMR
2014 AMR
2015 AMR
2016 AMR
2017 AMR
2018 AMR
2019 AMR
2020 AMR
2021 AMR
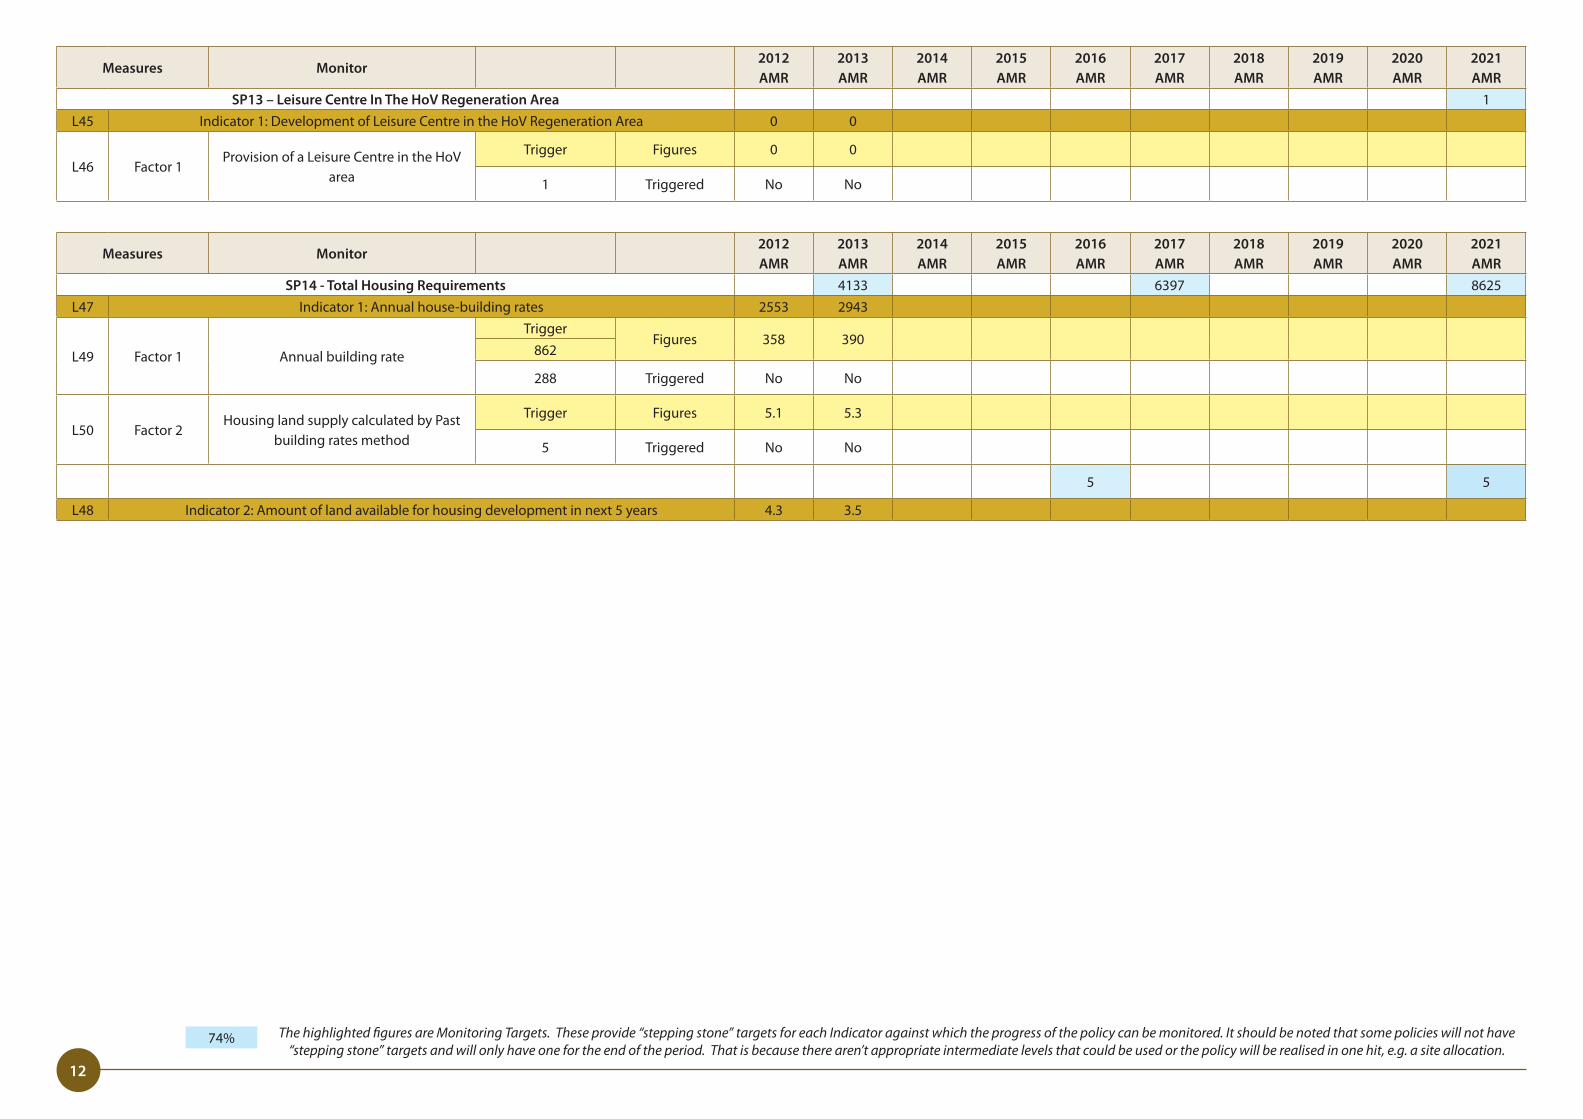
SP13 – Leisure Centre In The HoV Regeneration Area 1L45 Indicator 1: Development of Leisure Centre in the HoV Regeneration Area 0 0
L46 Factor 1Provision of a Leisure Centre in the HoV
area
Trigger Figures 0 0
1 Triggered No No
Measures Monitor2012 AMR
2013 AMR
2014 AMR
2015 AMR
2016 AMR
2017 AMR
2018 AMR
2019 AMR
2020 AMR
2021 AMR
SP14 - Total Housing Requirements 4133 6397 8625L47 Indicator 1: Annual house-building rates 2553 2943
L49 Factor 1 Annual building rate
TriggerFigures 358 390
862
288 Triggered No No
L50 Factor 2Housing land supply calculated by Past
building rates method
Trigger Figures 5�1 5�3
5 Triggered No No
5 5
L48 Indicator 2: Amount of land available for housing development in next 5 years 4�3 3�5
The highlighted figures are Monitoring Targets. These provide “stepping stone” targets for each Indicator against which the progress of the policy can be monitored. It should be noted that some policies will not have “stepping stone” targets and will only have one for the end of the period. That is because there aren’t appropriate intermediate levels that could be used or the policy will be realised in one hit, e.g. a site allocation.
74%
13
Measures Monitor2012 AMR
2013 AMR
2014 AMR
2015 AMR
2016 AMR
2017 AMR
2018 AMR
2019 AMR
2020 AMR
2021 AMR
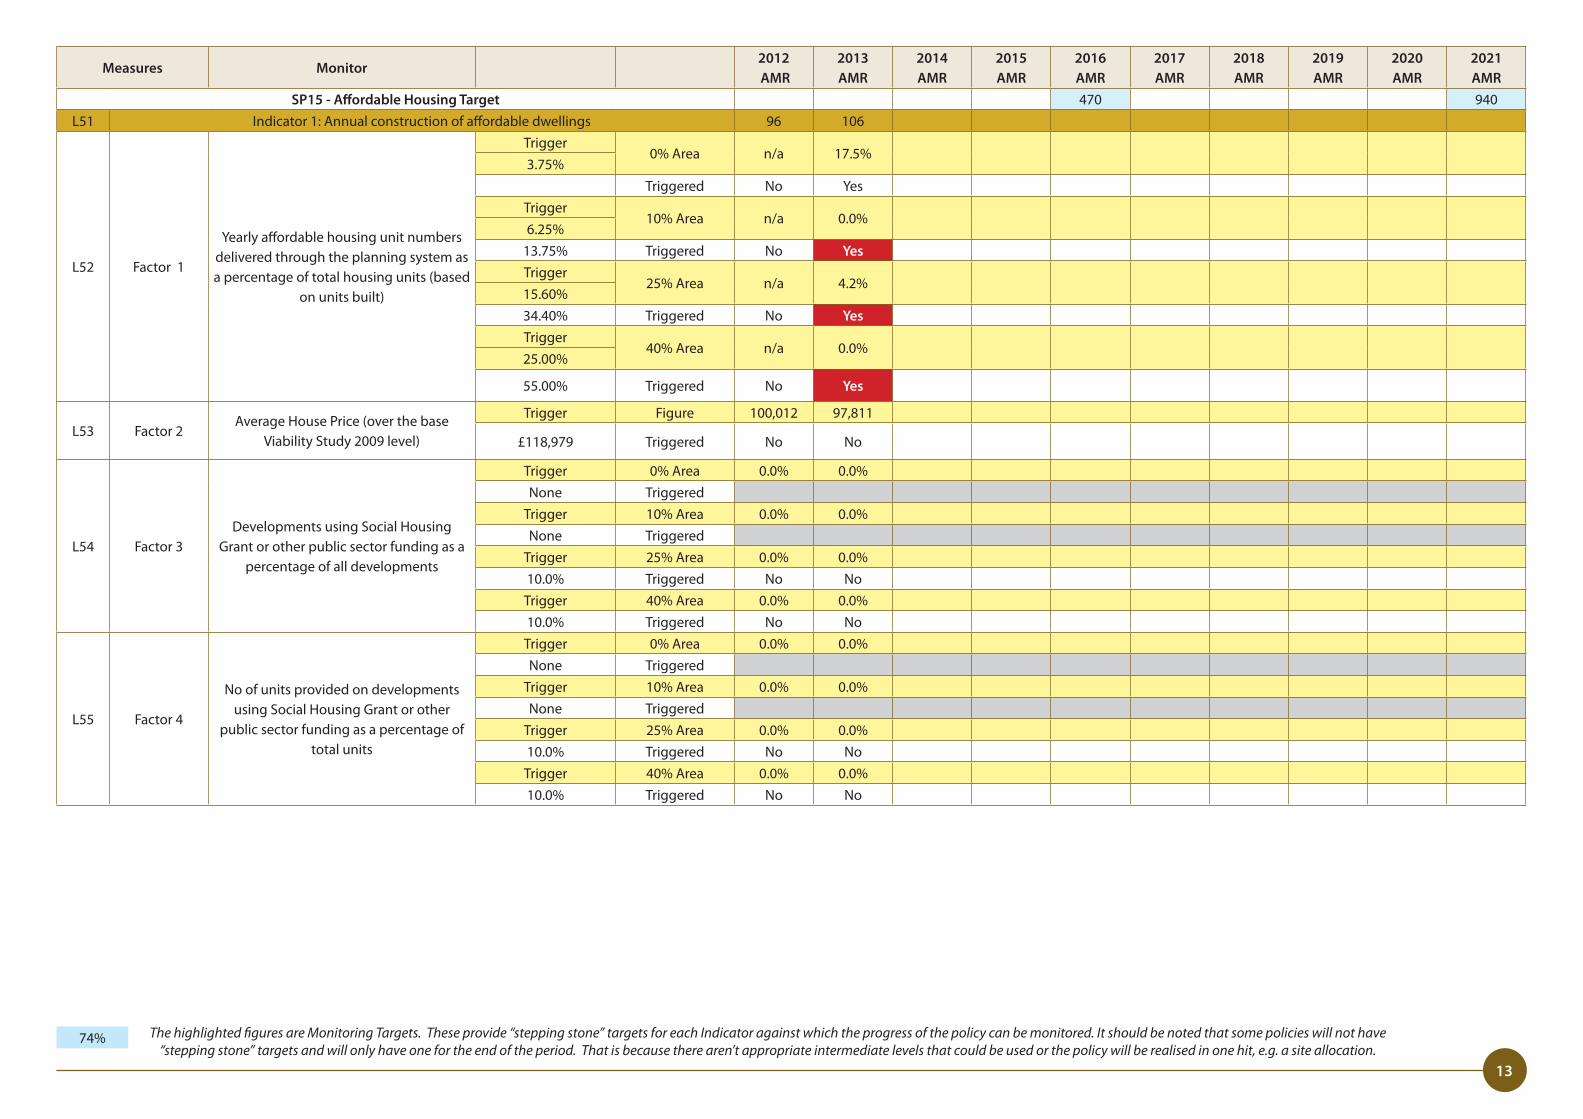
SP15 - Affordable Housing Target 470 940L51 Indicator 1: Annual construction of affordable dwellings 96 106
L52 Factor 1
Yearly affordable housing unit numbers delivered through the planning system as a percentage of total housing units (based
on units built)
Trigger0% Area n/a 17�5%
3�75%Triggered No Yes
Trigger10% Area n/a 0�0%
6�25%13�75% Triggered No YesTrigger
25% Area n/a 4�2%15�60%34�40% Triggered No YesTrigger
40% Area n/a 0�0%25�00%
55�00% Triggered No Yes
L53 Factor 2Average House Price (over the base
Viability Study 2009 level)
Trigger Figure 100,012 97,811
£118,979 Triggered No No
L54 Factor 3Developments using Social Housing
Grant or other public sector funding as a percentage of all developments
Trigger 0% Area 0�0% 0�0%None Triggered
Trigger 10% Area 0�0% 0�0%None Triggered
Trigger 25% Area 0�0% 0�0%10�0% Triggered No No
Trigger 40% Area 0�0% 0�0%10�0% Triggered No No
L55 Factor 4
No of units provided on developments using Social Housing Grant or other
public sector funding as a percentage of total units
Trigger 0% Area 0�0% 0�0%None Triggered
Trigger 10% Area 0�0% 0�0%None Triggered
Trigger 25% Area 0�0% 0�0%10�0% Triggered No No
Trigger 40% Area 0�0% 0�0%10�0% Triggered No No
The highlighted figures are Monitoring Targets. These provide “stepping stone” targets for each Indicator against which the progress of the policy can be monitored. It should be noted that some policies will not have “stepping stone” targets and will only have one for the end of the period. That is because there aren’t appropriate intermediate levels that could be used or the policy will be realised in one hit, e.g. a site allocation.
74%
14
Measures Monitor2012 AMR
2013 AMR
2014 AMR
2015 AMR
2016 AMR
2017 AMR
2018 AMR
2019 AMR
2020 AMR
2021 AMR
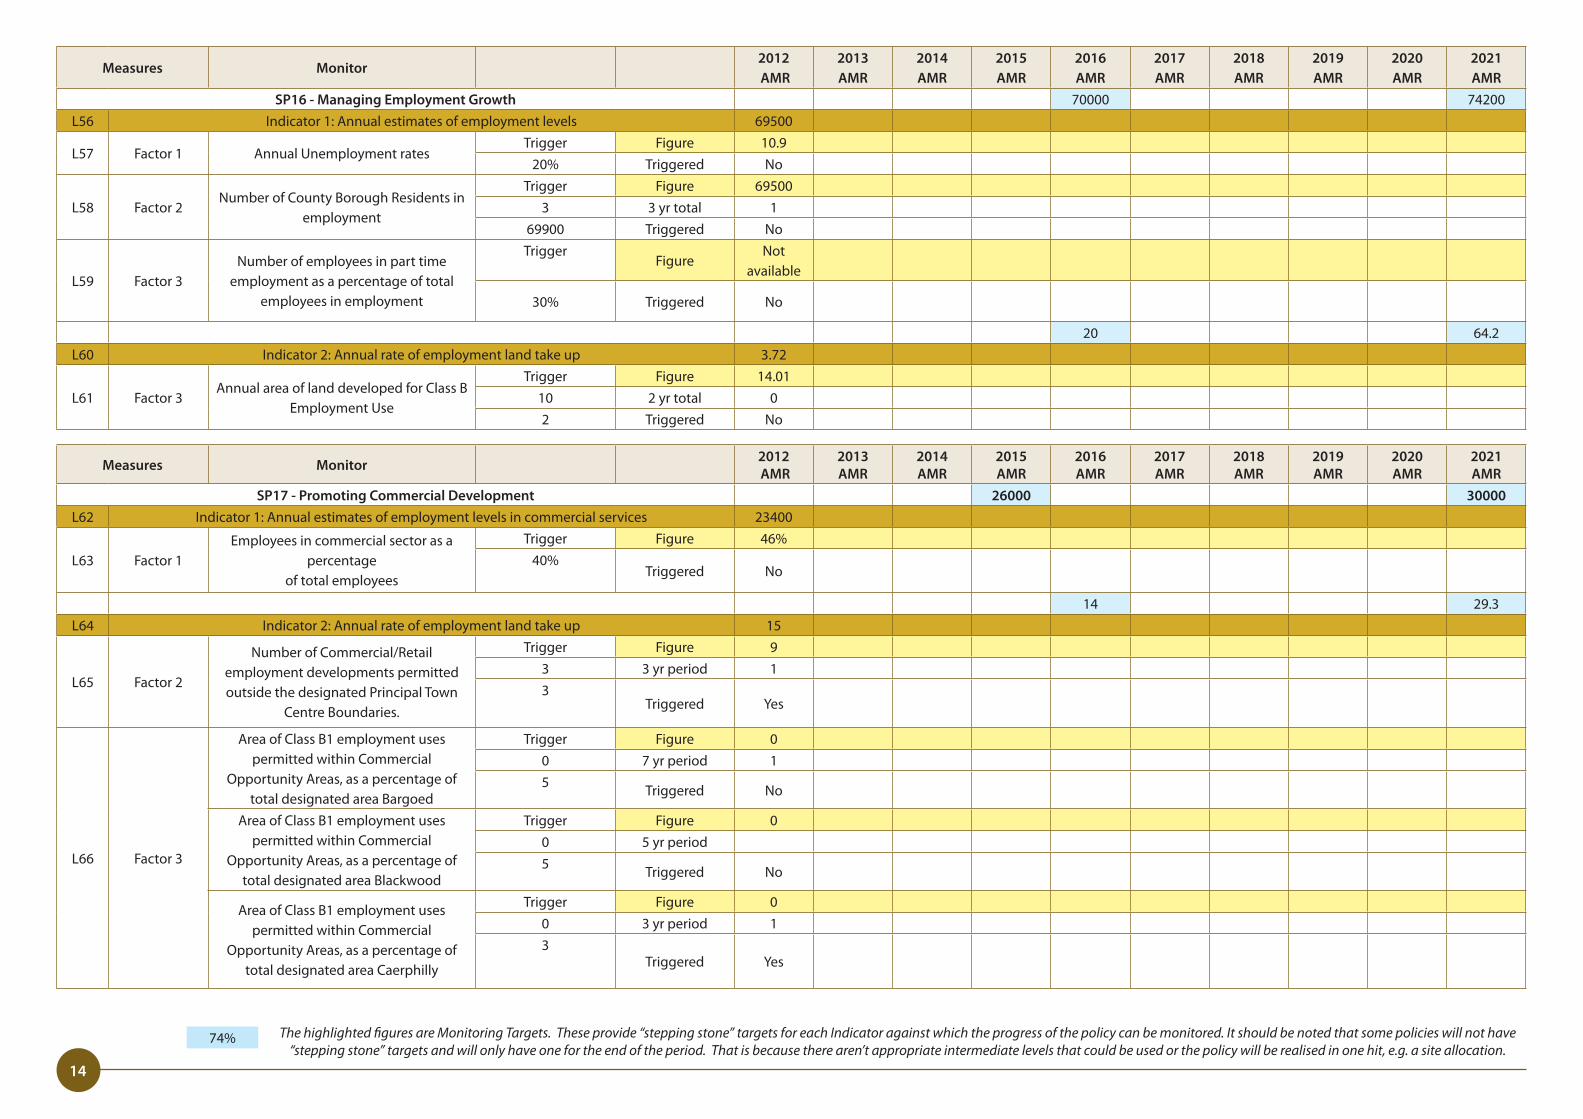
SP16 - Managing Employment Growth 70000 74200L56 Indicator 1: Annual estimates of employment levels 69500
L57 Factor 1 Annual Unemployment ratesTrigger Figure 10�9
20% Triggered No
L58 Factor 2Number of County Borough Residents in
employment
Trigger Figure 695003 3 yr total 1
69900 Triggered No
L59 Factor 3Number of employees in part time
employment as a percentage of total employees in employment
TriggerFigure
Not available
30% Triggered No
20 64�2L60 Indicator 2: Annual rate of employment land take up 3�72
L61 Factor 3Annual area of land developed for Class B
Employment Use
Trigger Figure 14�0110 2 yr total 02 Triggered No
Measures Monitor 2012 AMR
2013 AMR
2014 AMR
2015 AMR
2016 AMR
2017 AMR
2018 AMR
2019 AMR
2020 AMR
2021 AMR
SP17 - Promoting Commercial Development 26000 30000L62 Indicator 1: Annual estimates of employment levels in commercial services 23400
L63 Factor 1Employees in commercial sector as a
percentageof total employees
Trigger Figure 46%40%
Triggered No
14 29�3L64 Indicator 2: Annual rate of employment land take up 15
L65 Factor 2
Number of Commercial/Retail employment developments permitted outside the designated Principal Town
Centre Boundaries�
Trigger Figure 93 3 yr period 13
Triggered Yes
L66 Factor 3
Area of Class B1 employment uses permitted within Commercial
Opportunity Areas, as a percentage of total designated area Bargoed
Trigger Figure 00 7 yr period 15 Triggered No
Area of Class B1 employment uses permitted within Commercial
Opportunity Areas, as a percentage of total designated area Blackwood
Trigger Figure 00 5 yr period5 Triggered No
Area of Class B1 employment uses permitted within Commercial
Opportunity Areas, as a percentage of total designated area Caerphilly
Trigger Figure 00 3 yr period 13
Triggered Yes
The highlighted figures are Monitoring Targets. These provide “stepping stone” targets for each Indicator against which the progress of the policy can be monitored. It should be noted that some policies will not have “stepping stone” targets and will only have one for the end of the period. That is because there aren’t appropriate intermediate levels that could be used or the policy will be realised in one hit, e.g. a site allocation.
74%
15
Measures Monitor2012 AMR
2013 AMR
2014 AMR
2015 AMR
2016 AMR
2017 AMR
2018 AMR
2019 AMR
2020 AMR
2021 AMR
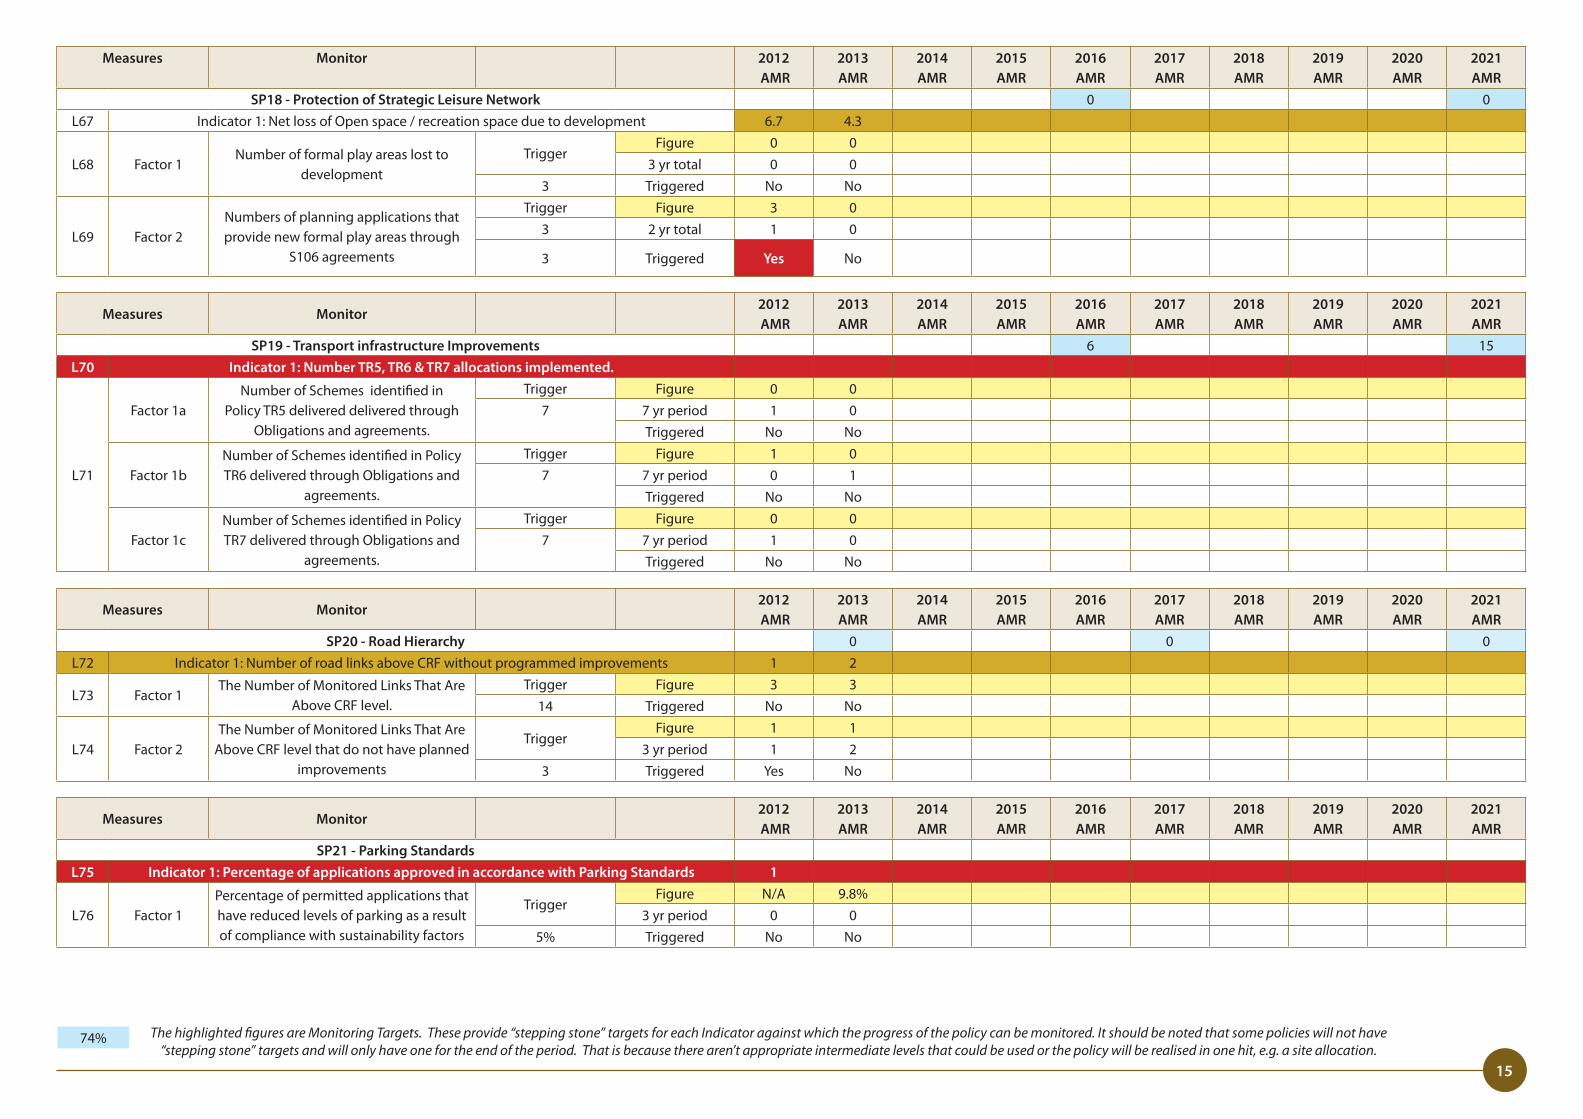
SP19 - Transport infrastructure Improvements 6 15L70 Indicator 1: Number TR5, TR6 & TR7 allocations implemented.
L71
Factor 1aNumber of Schemes identified in
Policy TR5 delivered delivered through Obligations and agreements�
Trigger Figure 0 07 7 yr period 1 0
Triggered No No
Factor 1bNumber of Schemes identified in Policy TR6 delivered through Obligations and
agreements�
Trigger Figure 1 07 7 yr period 0 1
Triggered No No
Factor 1cNumber of Schemes identified in Policy TR7 delivered through Obligations and
agreements�
Trigger Figure 0 07 7 yr period 1 0
Triggered No No
Measures Monitor2012 AMR
2013 AMR
2014 AMR
2015 AMR
2016 AMR
2017 AMR
2018 AMR
2019 AMR
2020 AMR
2021 AMR
SP20 - Road Hierarchy 0 0 0L72 Indicator 1: Number of road links above CRF without programmed improvements 1 2
L73 Factor 1The Number of Monitored Links That Are
Above CRF level�Trigger Figure 3 3
14 Triggered No No
L74 Factor 2The Number of Monitored Links That Are
Above CRF level that do not have planned improvements
TriggerFigure 1 1
3 yr period 1 23 Triggered Yes No
Measures Monitor2012 AMR
2013 AMR
2014 AMR
2015 AMR
2016 AMR
2017 AMR
2018 AMR
2019 AMR
2020 AMR
2021 AMR
SP21 - Parking StandardsL75 Indicator 1: Percentage of applications approved in accordance with Parking Standards 1
L76 Factor 1Percentage of permitted applications that have reduced levels of parking as a result of compliance with sustainability factors
TriggerFigure N/A 9�8%
3 yr period 0 05% Triggered No No
Measures Monitor 2012 AMR
2013 AMR
2014 AMR
2015 AMR
2016 AMR
2017 AMR
2018 AMR
2019 AMR
2020 AMR
2021 AMR
SP18 - Protection of Strategic Leisure Network 0 0L67 Indicator 1: Net loss of Open space / recreation space due to development 6�7 4�3
L68 Factor 1Number of formal play areas lost to
developmentTrigger
Figure 0 03 yr total 0 0
3 Triggered No No
L69 Factor 2Numbers of planning applications that provide new formal play areas through
S106 agreements
Trigger Figure 3 03 2 yr total 1 0
3 Triggered Yes No
The highlighted figures are Monitoring Targets. These provide “stepping stone” targets for each Indicator against which the progress of the policy can be monitored. It should be noted that some policies will not have “stepping stone” targets and will only have one for the end of the period. That is because there aren’t appropriate intermediate levels that could be used or the policy will be realised in one hit, e.g. a site allocation.
74%
16
Measures Monitor2012 AMR
2013 AMR
2014 AMR
2015 AMR
2016 AMR
2017 AMR
2018 AMR
2019 AMR
2020 AMR
2021 AMR
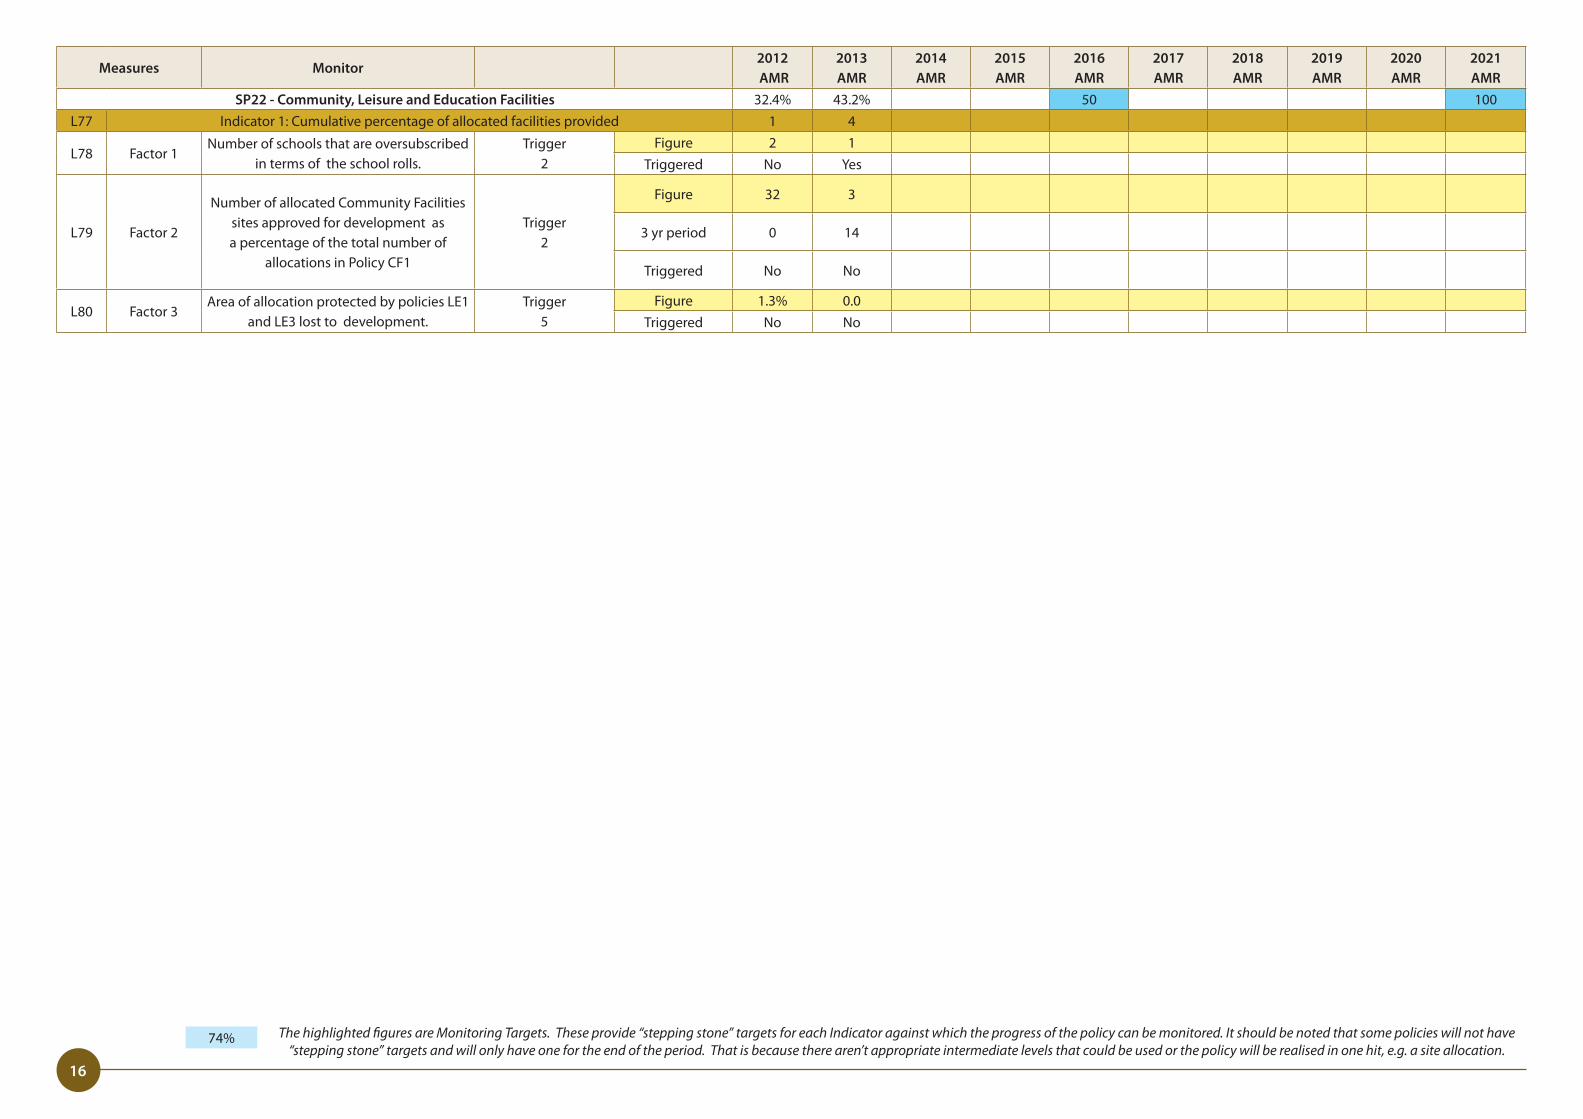
SP22 - Community, Leisure and Education Facilities 32�4% 43�2% 50 100L77 Indicator 1: Cumulative percentage of allocated facilities provided 1 4
L78 Factor 1Number of schools that are oversubscribed
in terms of the school rolls�Trigger
2Figure 2 1
Triggered No Yes
L79 Factor 2
Number of allocated Community Facilities sites approved for development as a percentage of the total number of
allocations in Policy CF1
Trigger2
Figure 32 3
3 yr period 0 14
Triggered No No
L80 Factor 3Area of allocation protected by policies LE1
and LE3 lost to development�Trigger
5Figure 1�3% 0�0
Triggered No No
The highlighted figures are Monitoring Targets. These provide “stepping stone” targets for each Indicator against which the progress of the policy can be monitored. It should be noted that some policies will not have “stepping stone” targets and will only have one for the end of the period. That is because there aren’t appropriate intermediate levels that could be used or the policy will be realised in one hit, e.g. a site allocation.
74%

17
Objective Indicator Target2012 AMR
2013 AMR
2014 AMR
2015 AMR
2016 AMR
2017 AMR
2018 AMR
2019 AMR
2020 AMR
2021 AMR
Indicator on Target
To reduce the average resource
consumptionof each resident
S1Ecological footprint of each
resident (GHa/person)Reduce the 2006 ecological
footprint of residents4�2 Gha/ Person
Not Available
NM
S2Number of properties
benefiting from energy saving grants
Maintain or increase the yearly rate of the number of properties gaining benefit
from energy saving grants, in comparison to the 2005 level�
NM
To improve the condition of housing and
ensure the range of housing types are accessible to
meet the needs of residents�
S3 Percentage of unfit dwellings
Eliminate the total number of unfit/non- decent homes by
the end of the Plan period by reducing numbers each year
NM
S4Average house price compared
to average earningsReduce house price/earnings
ratio1:4�4 1:4�18 1:4�3 Yes
To reduce the incidence of crime
S5
Burglary from a dwelling per 1,000 of population
Levels of Burglary to remain at least 10% below Welsh Average
4 7Yes
Welsh Average 11 11
S6
Percentage of residents by gender expressing fear of crime whilst walking in
neighbourhood
To reduce the perceived fear of crime whilst walking within the
neighbourhoodNM
S6A
The percentage of Residents, whose perceptions of crime
and disorder within the county borough, has worsened
Year on year improvement in the perception of crime and
disorder40% 40�0% No
S6B
The percentage of Residents, whose perceptions of crime
and disorder within their neighbourhood, has worsened
Year on year improvement in the perception of crime and
disorder35% 35�0% No
S6C
The percentage of Residents, whose perceptions of crime
and disorder within their local town centre, has worsened
Year on year improvement in the perception of crime nd
disorder44% 44�0% No
To improve educational
achievement
S7
Percentage of children at 15/16 with 5 or more Grades A-C
passes at GCSE
Maintain a higher percentage rate of children of 15/16 years
of age achieving5 or more Grades A-C passes at GCSE
than the Welsh Average
Not Available
62%Data
unavailableWelsh Average
S8
Percentage of working-age adults qualified to NQF Level 2
or higher
Increase the percentage of adults with literacy and
numeracy skills at a rate higher than the Welsh average
57�9% 62�9%Yes
Welsh Average 66�4% 65�8%
SEA/ SA Monitoring
18
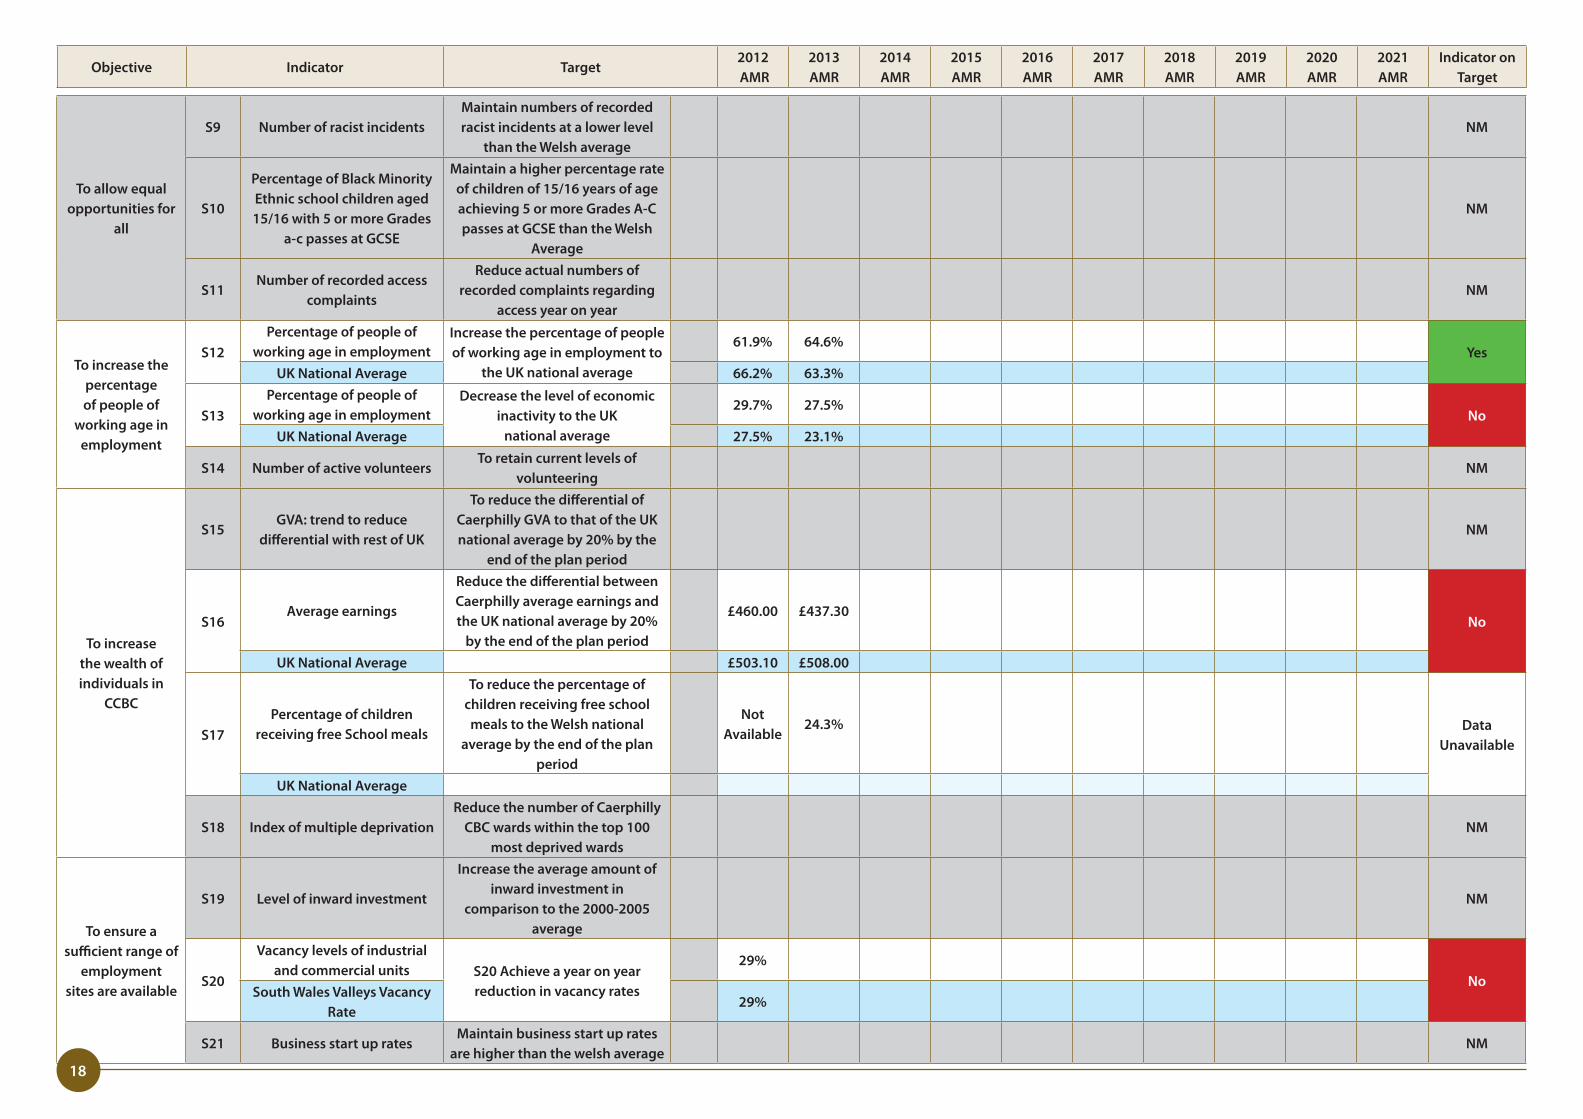
To allow equal opportunities for
all
S9 Number of racist incidentsMaintain numbers of recorded racist incidents at a lower level
than the Welsh averageNM
S10
Percentage of Black Minority Ethnic school children aged 15/16 with 5 or more Grades
a-c passes at GCSE
Maintain a higher percentage rate of children of 15/16 years of age achieving 5 or more Grades A-C passes at GCSE than the Welsh
Average
NM
S11Number of recorded access
complaints
Reduce actual numbers of recorded complaints regarding
access year on yearNM
To increase the percentage of people of
working age in employment
S12Percentage of people of
working age in employmentIncrease the percentage of people of working age in employment to
the UK national average
61.9% 64.6%Yes
UK National Average 66.2% 63.3%
S13Percentage of people of
working age in employmentDecrease the level of economic
inactivity to the UKnational average
29.7% 27.5%No
UK National Average 27.5% 23.1%
S14 Number of active volunteersTo retain current levels of
volunteeringNM
To increase the wealth of individuals in
CCBC
S15GVA: trend to reduce
differential with rest of UK
To reduce the differential of Caerphilly GVA to that of the UK national average by 20% by the
end of the plan period
NM
S16Average earnings
Reduce the differential between Caerphilly average earnings and the UK national average by 20%
by the end of the plan period
£460.00 £437.30No
UK National Average £503.10 £508.00
S17Percentage of children
receiving free School meals
To reduce the percentage of children receiving free school meals to the Welsh national
average by the end of the plan period
Not Available
24.3% Data Unavailable
UK National Average
S18 Index of multiple deprivationReduce the number of Caerphilly
CBC wards within the top 100 most deprived wards
NM
To ensure a sufficient range of
employmentsites are available
S19 Level of inward investment
Increase the average amount of inward investment in
comparison to the 2000-2005 average
NM
S20
Vacancy levels of industrial and commercial units S20 Achieve a year on year
reduction in vacancy rates
29%No
South Wales Valleys Vacancy Rate
29%
S21 Business start up ratesMaintain business start up rates
are higher than the welsh averageNM
Objective Indicator Target2012 AMR
2013 AMR
2014 AMR
2015 AMR
2016 AMR
2017 AMR
2018 AMR
2019 AMR
2020 AMR
2021 AMR
Indicator on Target
19
Objective Indicator Target2012 AMR
2013 AMR
2014 AMR
2015 AMR
2016 AMR
2017 AMR
2018 AMR
2019 AMR
2020 AMR
2021 AMR
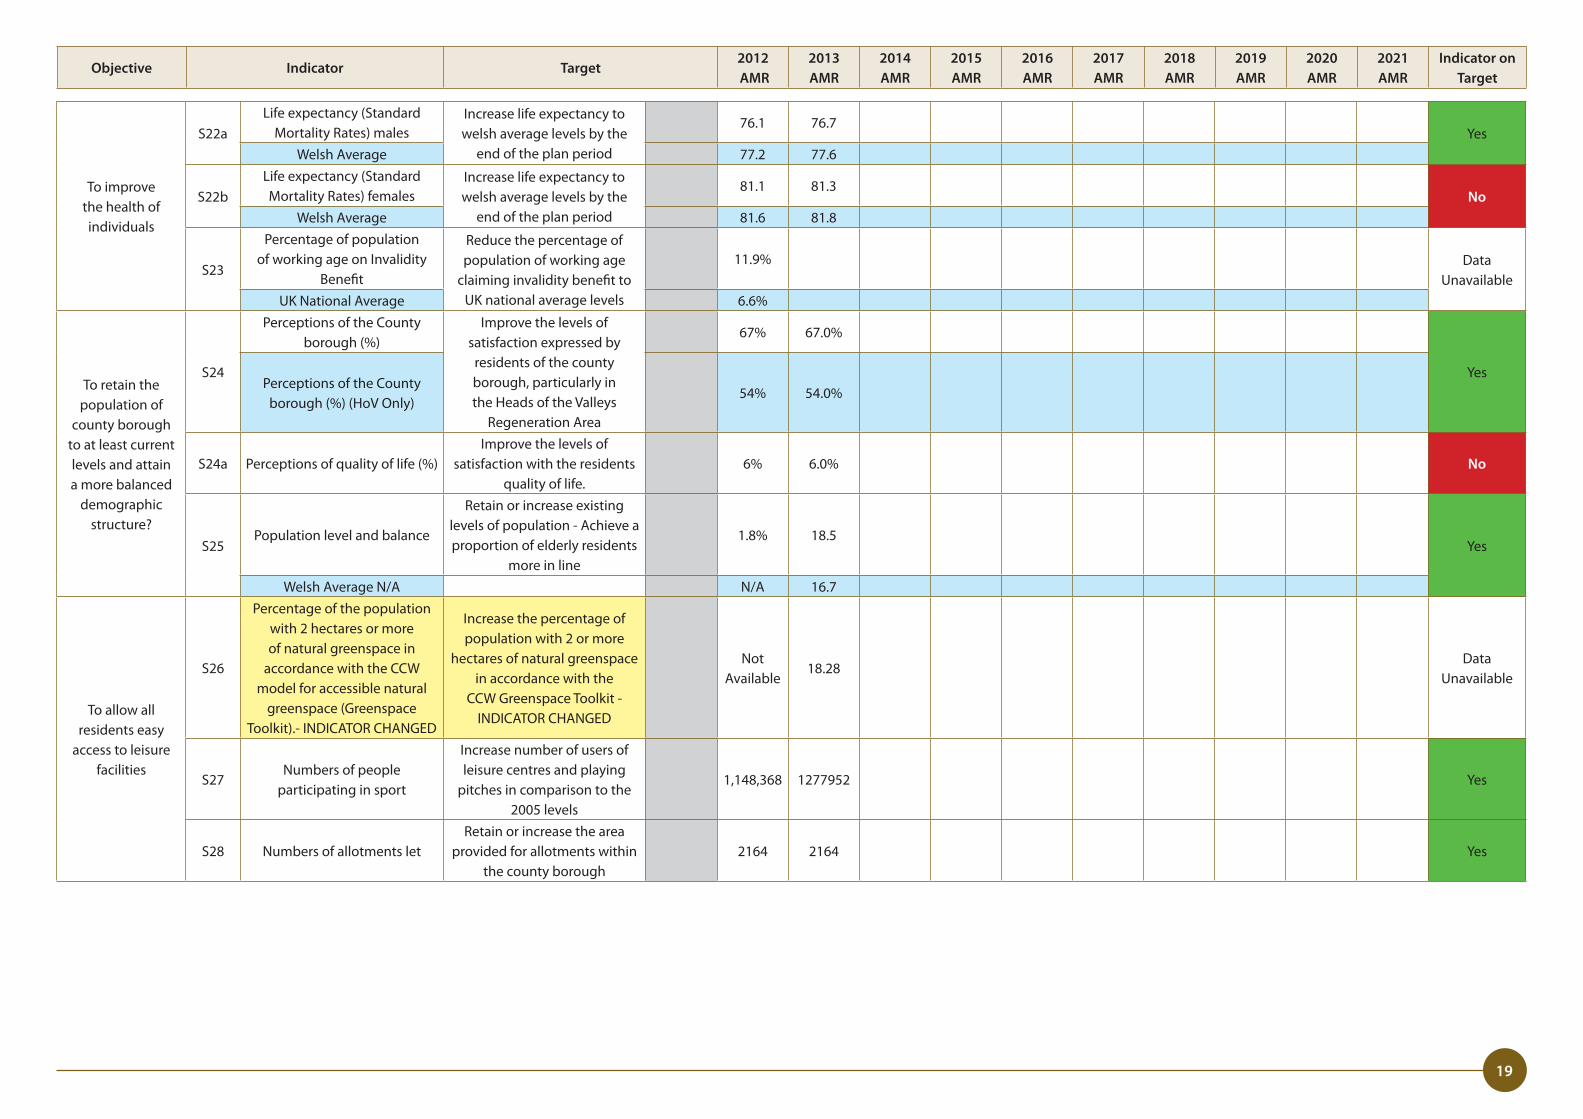
Indicator on Target
To improve the health of individuals
S22aLife expectancy (Standard
Mortality Rates) malesIncrease life expectancy to welsh average levels by the
end of the plan period
76�1 76�7Yes
Welsh Average 77�2 77�6
S22bLife expectancy (Standard Mortality Rates) females
Increase life expectancy to welsh average levels by the
end of the plan period
81�1 81�3No
Welsh Average 81�6 81�8
S23
Percentage of population of working age on Invalidity
Benefit
Reduce the percentage of population of working age
claiming invalidity benefit to UK national average levels
11�9% Data Unavailable
UK National Average 6�6%
To retain the population of
county borough to at least current levels and attain a more balanced
demographic structure?
S24
Perceptions of the County borough (%)
Improve the levels of satisfaction expressed by residents of the county borough, particularly in the Heads of the Valleys
Regeneration Area
67% 67�0%
YesPerceptions of the County
borough (%) (HoV Only)54% 54�0%
S24a Perceptions of quality of life (%)Improve the levels of
satisfaction with the residents quality of life�
6% 6�0% No
S25Population level and balance
Retain or increase existing levels of population - Achieve a proportion of elderly residents
more in line
1�8% 18�5Yes
Welsh Average N/A N/A 16�7
To allow all residents easy
access to leisure facilities
S26
Percentage of the population with 2 hectares or more of natural greenspace in
accordance with the CCW model for accessible natural
greenspace (Greenspace Toolkit)�- INDICATOR CHANGED
Increase the percentage of population with 2 or more
hectares of natural greenspace in accordance with the
CCW Greenspace Toolkit - INDICATOR CHANGED
Not Available
18�28Data
Unavailable
S27Numbers of people
participating in sport
Increase number of users of leisure centres and playing
pitches in comparison to the 2005 levels
1,148,368 1277952 Yes
S28 Numbers of allotments letRetain or increase the area
provided for allotments within the county borough
2164 2164 Yes
20
Objective Indicator Target2012 AMR
2013 AMR
2014 AMR
2015 AMR
2016 AMR
2017 AMR
2018 AMR
2019 AMR
2020 AMR
2021 AMR
Indicator on Target
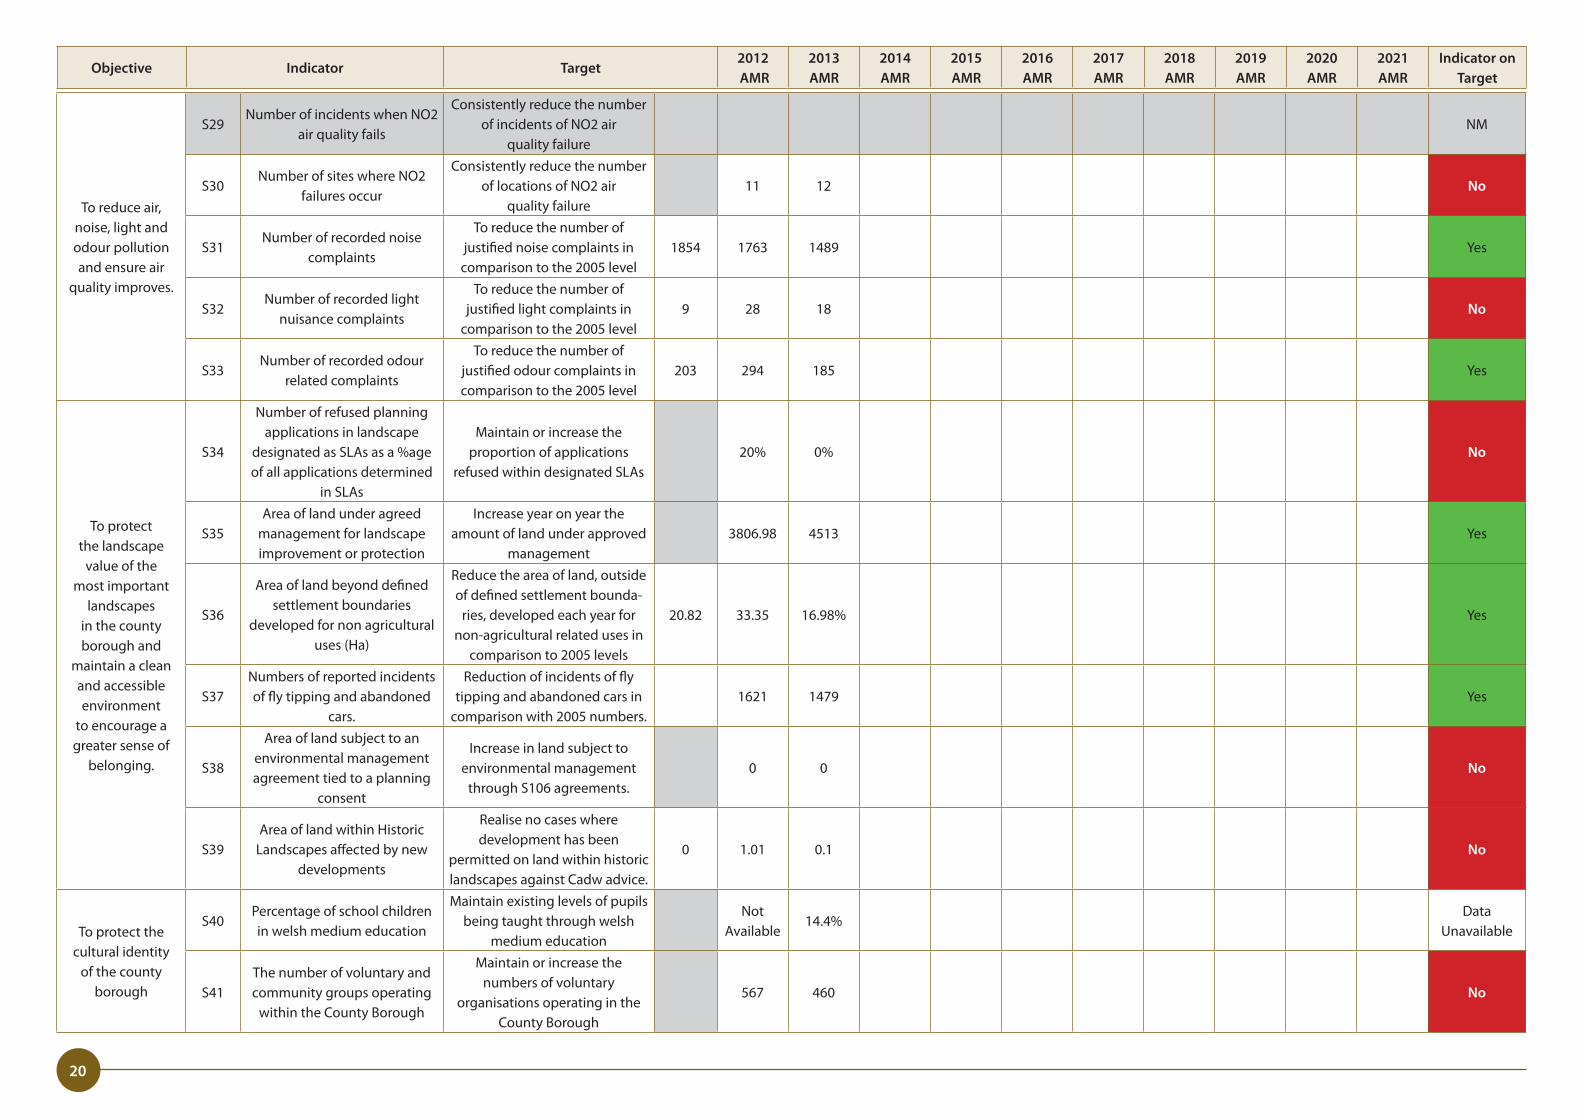
To reduce air, noise, light and odour pollution and ensure air
quality improves�
S29Number of incidents when NO2
air quality fails
Consistently reduce the number of incidents of NO2 air
quality failureNM
S30Number of sites where NO2
failures occur
Consistently reduce the number of locations of NO2 air
quality failure11 12 No
S31Number of recorded noise
complaints
To reduce the number of justified noise complaints incomparison to the 2005 level
1854 1763 1489 Yes
S32Number of recorded light
nuisance complaints
To reduce the number of justified light complaints in
comparison to the 2005 level9 28 18 No
S33Number of recorded odour
related complaints
To reduce the number of justified odour complaints incomparison to the 2005 level
203 294 185 Yes
To protect the landscape
value of the most important
landscapes in the county borough and
maintain a clean and accessible environment
to encourage a greater sense of
belonging�
S34
Number of refused planning applications in landscape
designated as SLAs as a %age of all applications determined
in SLAs
Maintain or increase the proportion of applications
refused within designated SLAs20% 0% No
S35Area of land under agreed
management for landscape improvement or protection
Increase year on year the amount of land under approved
management3806�98 4513 Yes
S36
Area of land beyond defined settlement boundaries
developed for non agricultural uses (Ha)
Reduce the area of land, outside of defined settlement bounda-
ries, developed each year for non-agricultural related uses in
comparison to 2005 levels
20�82 33�35 16�98% Yes
S37Numbers of reported incidents of fly tipping and abandoned
cars�
Reduction of incidents of fly tipping and abandoned cars in
comparison with 2005 numbers�1621 1479 Yes
S38
Area of land subject to an environmental management agreement tied to a planning
consent
Increase in land subject to environmental management
through S106 agreements�0 0 No
S39Area of land within Historic
Landscapes affected by new developments
Realise no cases where development has been
permitted on land within historic landscapes against Cadw advice�
0 1�01 0�1 No
To protect the cultural identity
of the county borough
S40Percentage of school children in welsh medium education
Maintain existing levels of pupils being taught through welsh
medium education
Not Available
14�4%Data
Unavailable
S41The number of voluntary and community groups operating
within the County Borough
Maintain or increase the numbers of voluntary
organisations operating in the County Borough
567 460 No
21
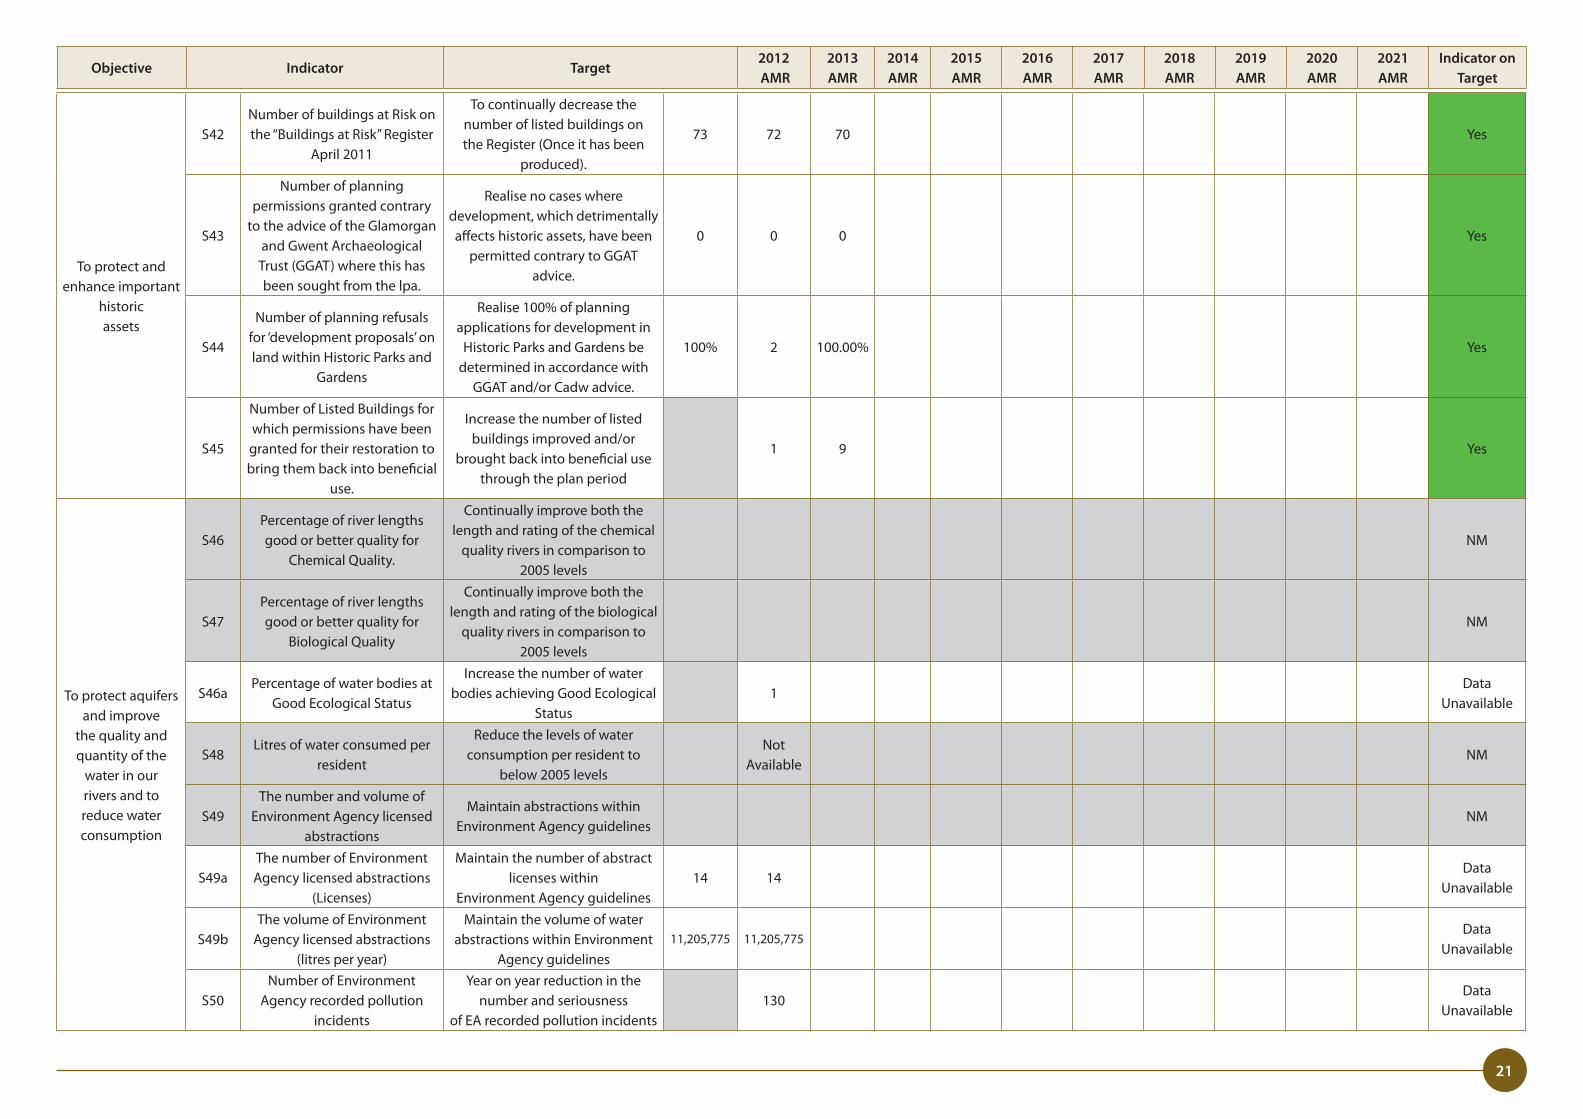
To protect and enhance important
historicassets
S42Number of buildings at Risk on the “Buildings at Risk” Register
April 2011
To continually decrease the number of listed buildings on the Register (Once it has been
produced)�
73 72 70 Yes
S43
Number of planning permissions granted contrary
to the advice of the Glamorgan and Gwent Archaeological
Trust (GGAT) where this has been sought from the lpa�
Realise no cases where development, which detrimentally affects historic assets, have been
permitted contrary to GGAT advice�
0 0 0 Yes
S44
Number of planning refusals for ‘development proposals’ on land within Historic Parks and
Gardens
Realise 100% of planning applications for development in
Historic Parks and Gardens be determined in accordance with
GGAT and/or Cadw advice�
100% 2 100�00% Yes
S45
Number of Listed Buildings for which permissions have been granted for their restoration to bring them back into beneficial
use�
Increase the number of listed buildings improved and/or
brought back into beneficial use through the plan period
1 9 Yes
To protect aquifers and improve
the quality and quantity of the
water in our rivers and to reduce water consumption
S46Percentage of river lengths good or better quality for
Chemical Quality�
Continually improve both the length and rating of the chemical
quality rivers in comparison to 2005 levels
NM
S47Percentage of river lengths good or better quality for
Biological Quality
Continually improve both the length and rating of the biological
quality rivers in comparison to 2005 levels
NM
S46aPercentage of water bodies at
Good Ecological Status
Increase the number of water bodies achieving Good Ecological
Status1
Data Unavailable
S48Litres of water consumed per
resident
Reduce the levels of water consumption per resident to
below 2005 levels
Not Available
NM
S49The number and volume of
Environment Agency licensed abstractions
Maintain abstractions within Environment Agency guidelines
NM
S49aThe number of Environment Agency licensed abstractions
(Licenses)
Maintain the number of abstract licenses within
Environment Agency guidelines14 14
Data Unavailable
S49bThe volume of Environment
Agency licensed abstractions (litres per year)
Maintain the volume of water abstractions within Environment
Agency guidelines11,205,775 11,205,775
Data Unavailable
S50Number of Environment
Agency recorded pollution incidents
Year on year reduction in the number and seriousness
of EA recorded pollution incidents130
Data Unavailable
Objective Indicator Target2012 AMR
2013 AMR
2014 AMR
2015 AMR
2016 AMR
2017 AMR
2018 AMR
2019 AMR
2020 AMR
2021 AMR
Indicator on Target
22
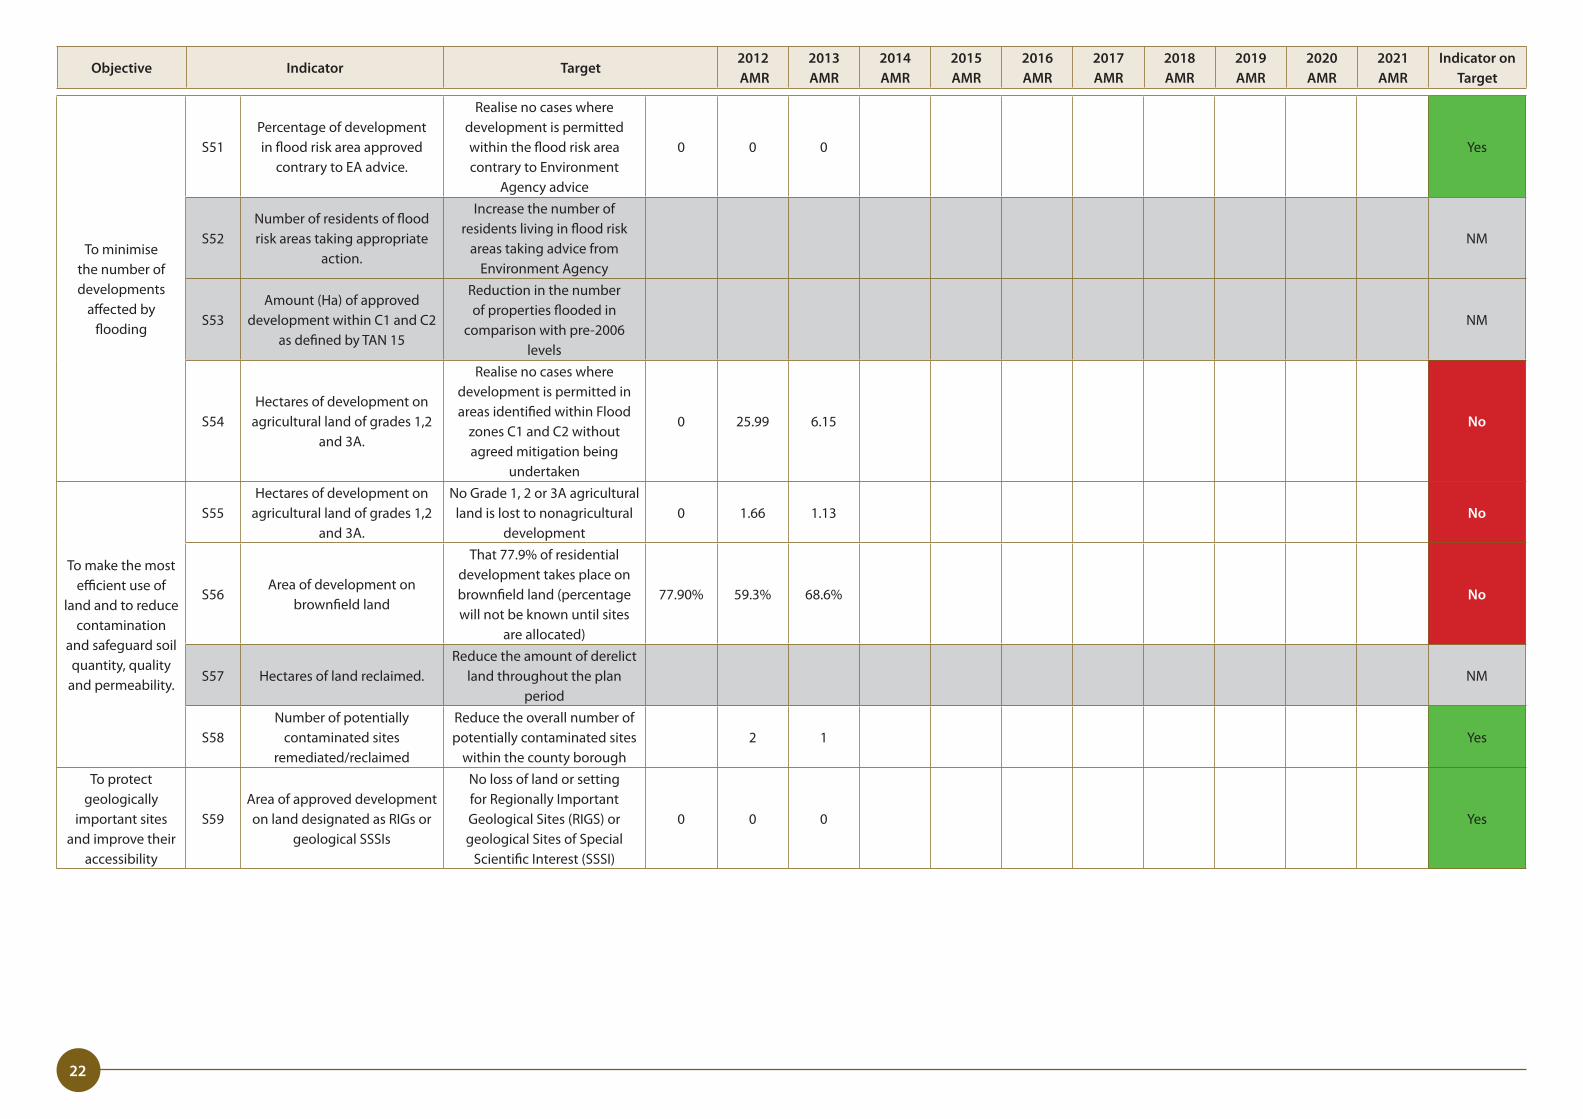
To minimise the number of developments
affected by flooding
S51Percentage of development in flood risk area approved
contrary to EA advice�
Realise no cases where development is permitted within the flood risk area contrary to Environment
Agency advice
0 0 0 Yes
S52Number of residents of flood risk areas taking appropriate
action�
Increase the number of residents living in flood risk
areas taking advice from Environment Agency
NM
S53Amount (Ha) of approved
development within C1 and C2 as defined by TAN 15
Reduction in the number of properties flooded in
comparison with pre-2006 levels
NM
S54Hectares of development on
agricultural land of grades 1,2 and 3A�
Realise no cases where development is permitted in areas identified within Flood
zones C1 and C2 without agreed mitigation being
undertaken
0 25�99 6�15 No
To make the most efficient use of
land and to reduce contamination
and safeguard soil quantity, quality
and permeability�
S55Hectares of development on
agricultural land of grades 1,2 and 3A�
No Grade 1, 2 or 3A agricultural land is lost to nonagricultural
development0 1�66 1�13 No
S56Area of development on
brownfield land
That 77�9% of residential development takes place on brownfield land (percentage will not be known until sites
are allocated)
77�90% 59�3% 68�6% No
S57 Hectares of land reclaimed�Reduce the amount of derelict
land throughout the plan period
NM
S58Number of potentially
contaminated sites remediated/reclaimed
Reduce the overall number of potentially contaminated sites
within the county borough2 1 Yes
To protect geologically
important sites and improve their
accessibility
S59Area of approved development on land designated as RIGs or
geological SSSIs
No loss of land or setting for Regionally Important Geological Sites (RIGS) or geological Sites of Special
Scientific Interest (SSSI)
0 0 0 Yes
Objective Indicator Target2012 AMR
2013 AMR
2014 AMR
2015 AMR
2016 AMR
2017 AMR
2018 AMR
2019 AMR
2020 AMR
2021 AMR
Indicator on Target
23
Objective Indicator Target2012 AMR
2013 AMR
2014 AMR
2015 AMR
2016 AMR
2017 AMR
2018 AMR
2019 AMR
2020 AMR
2021 AMR
Indicator on Target
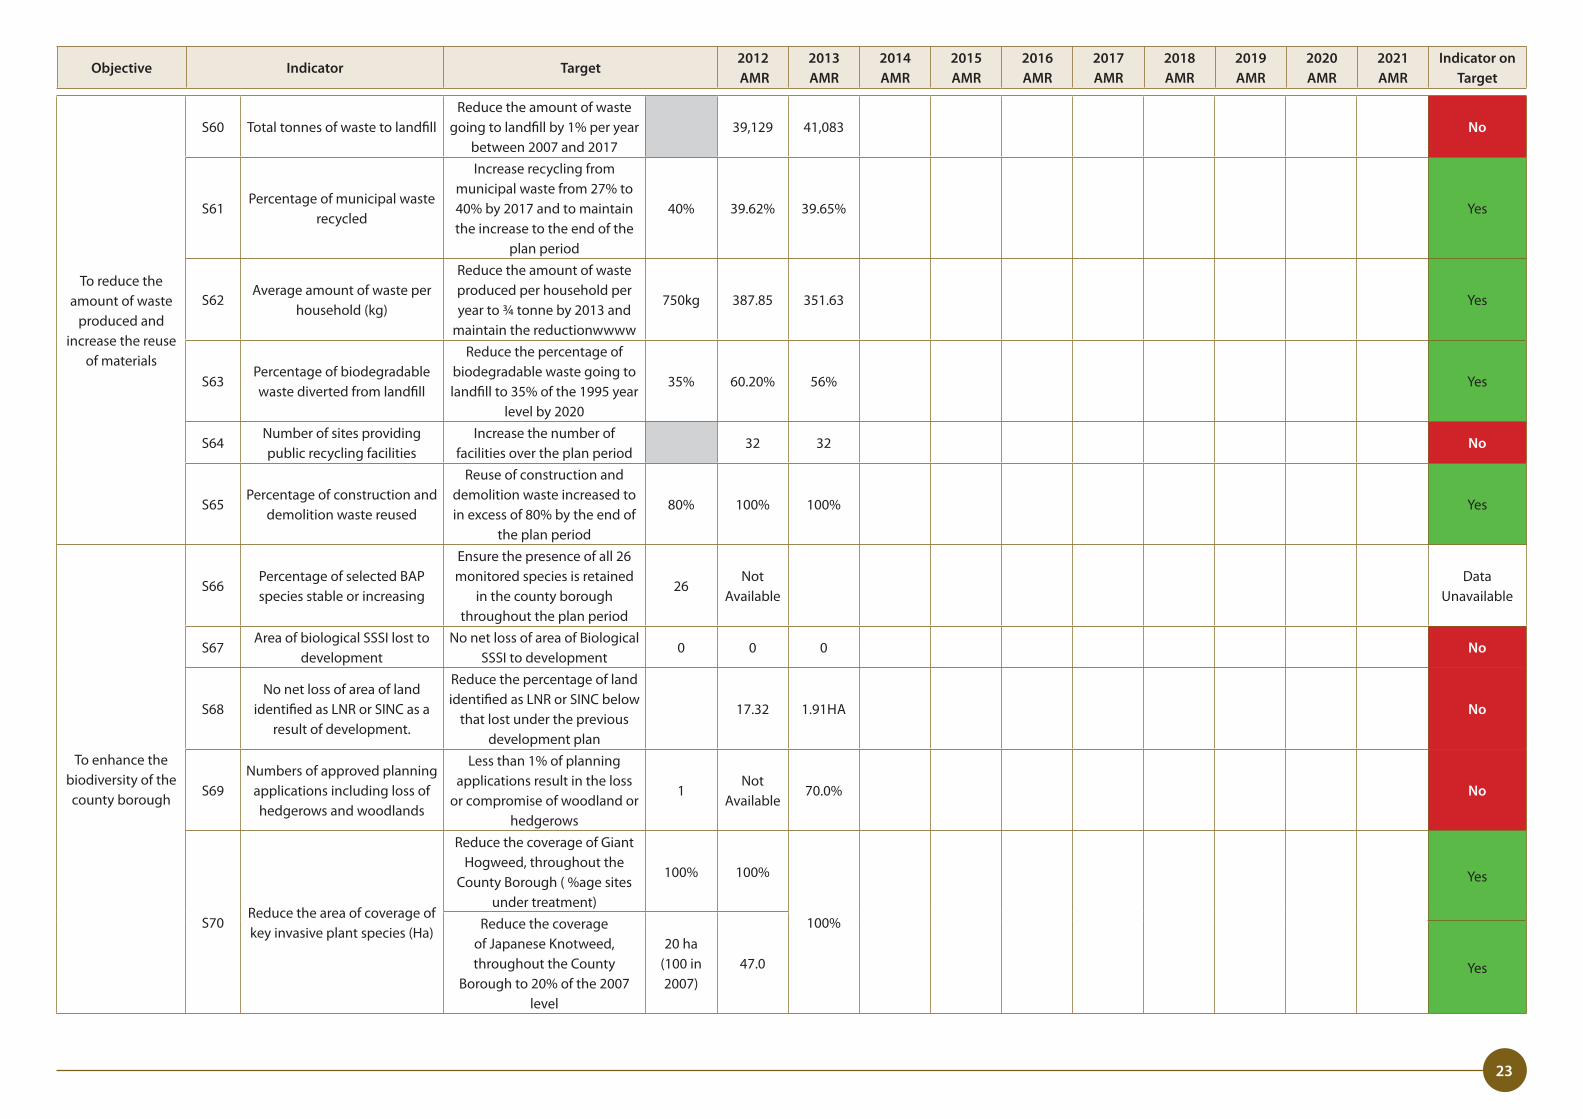
To reduce the amount of waste
produced and increase the reuse
of materials
S60 Total tonnes of waste to landfillReduce the amount of waste
going to landfill by 1% per year between 2007 and 2017
39,129 41,083 No
S61Percentage of municipal waste
recycled
Increase recycling from municipal waste from 27% to 40% by 2017 and to maintain the increase to the end of the
plan period
40% 39�62% 39�65% Yes
S62Average amount of waste per
household (kg)
Reduce the amount of waste produced per household per year to ¾ tonne by 2013 and
maintain the reductionwwww
750kg 387�85 351�63 Yes
S63Percentage of biodegradable waste diverted from landfill
Reduce the percentage of biodegradable waste going to landfill to 35% of the 1995 year
level by 2020
35% 60�20% 56% Yes
S64Number of sites providing public recycling facilities
Increase the number of facilities over the plan period
32 32 No
S65Percentage of construction and
demolition waste reused
Reuse of construction and demolition waste increased to in excess of 80% by the end of
the plan period
80% 100% 100% Yes
To enhance the biodiversity of the county borough
S66Percentage of selected BAP species stable or increasing
Ensure the presence of all 26 monitored species is retained
in the county borough throughout the plan period
26Not
AvailableData
Unavailable
S67Area of biological SSSI lost to
developmentNo net loss of area of Biological
SSSI to development0 0 0 No
S68No net loss of area of land
identified as LNR or SINC as a result of development�
Reduce the percentage of land identified as LNR or SINC below
that lost under the previous development plan
17�32 1�91HA No
S69Numbers of approved planning
applications including loss of hedgerows and woodlands
Less than 1% of planning applications result in the loss
or compromise of woodland or hedgerows
1Not
Available70�0% No
S70Reduce the area of coverage of key invasive plant species (Ha)
Reduce the coverage of Giant Hogweed, throughout the
County Borough ( %age sites under treatment)
100% 100%
100%
Yes
Reduce the coverage of Japanese Knotweed, throughout the County
Borough to 20% of the 2007 level
20 ha(100 in 2007)
47�0 Yes
24
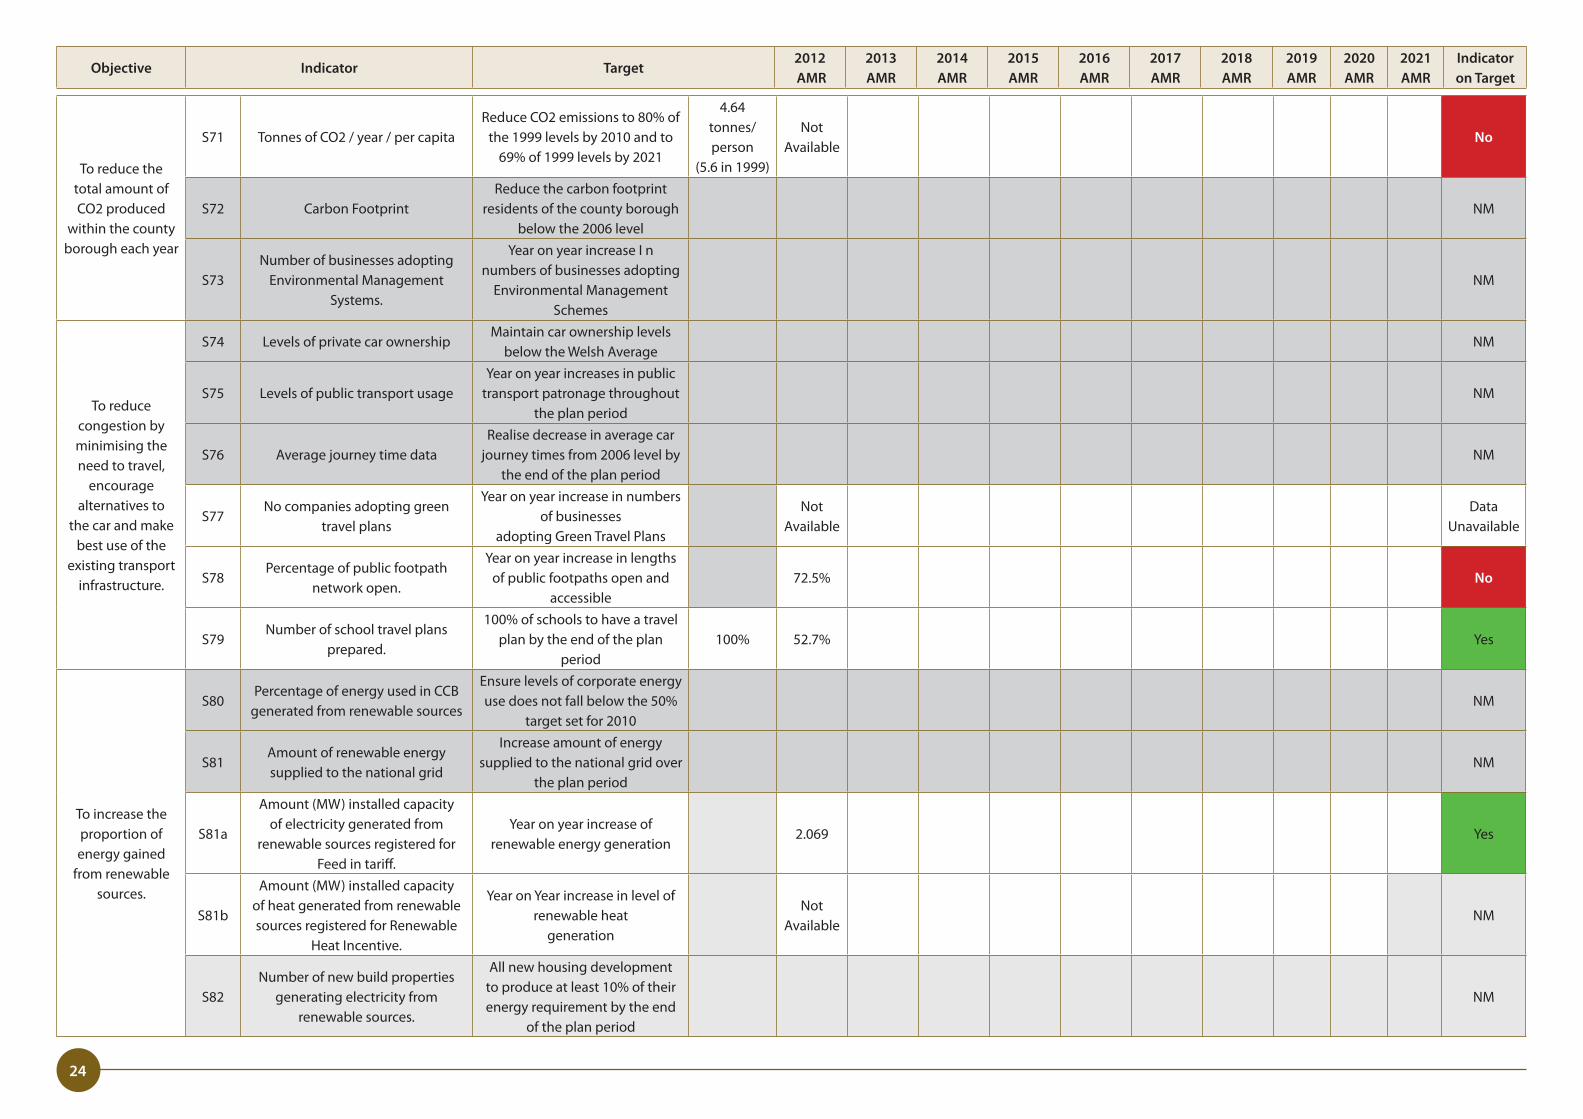
To reduce the total amount of CO2 produced
within the county borough each year
S71 Tonnes of CO2 / year / per capitaReduce CO2 emissions to 80% of
the 1999 levels by 2010 and to 69% of 1999 levels by 2021
4�64tonnes/person
(5�6 in 1999)
Not Available
No
S72 Carbon FootprintReduce the carbon footprint
residents of the county borough below the 2006 level
NM
S73Number of businesses adopting
Environmental Management Systems�
Year on year increase I n numbers of businesses adopting
Environmental Management Schemes
NM
To reduce congestion by minimising the need to travel,
encourage alternatives to
the car and make best use of the
existing transport infrastructure�
S74 Levels of private car ownershipMaintain car ownership levels
below the Welsh AverageNM
S75 Levels of public transport usageYear on year increases in public
transport patronage throughout the plan period
NM
S76 Average journey time dataRealise decrease in average car
journey times from 2006 level by the end of the plan period
NM
S77No companies adopting green
travel plans
Year on year increase in numbers of businesses
adopting Green Travel Plans
Not Available
Data Unavailable
S78Percentage of public footpath
network open�
Year on year increase in lengths of public footpaths open and
accessible72�5% No
S79Number of school travel plans
prepared�
100% of schools to have a travel plan by the end of the plan
period100% 52�7% Yes
To increase the proportion of energy gained
from renewable sources�
S80Percentage of energy used in CCB
generated from renewable sources
Ensure levels of corporate energy use does not fall below the 50%
target set for 2010NM
S81Amount of renewable energy supplied to the national grid
Increase amount of energy supplied to the national grid over
the plan periodNM
S81a
Amount (MW) installed capacity of electricity generated from
renewable sources registered for Feed in tariff�
Year on year increase of renewable energy generation
2�069 Yes
S81b
Amount (MW) installed capacity of heat generated from renewable sources registered for Renewable
Heat Incentive�
Year on Year increase in level of renewable heat
generation
Not Available
NM
S82Number of new build properties
generating electricity from renewable sources�
All new housing development to produce at least 10% of their energy requirement by the end
of the plan period
NM
Objective Indicator Target2012 AMR
2013 AMR
2014 AMR
2015 AMR
2016 AMR
2017 AMR
2018 AMR
2019 AMR
2020 AMR
2021 AMR
Indicator on Target
25
Objective Indicator Target2012 AMR
2013 AMR
2014 AMR
2015 AMR
2016 AMR
2017 AMR
2018 AMR
2019 AMR
2020 AMR
2021 AMR
Indicator on Target
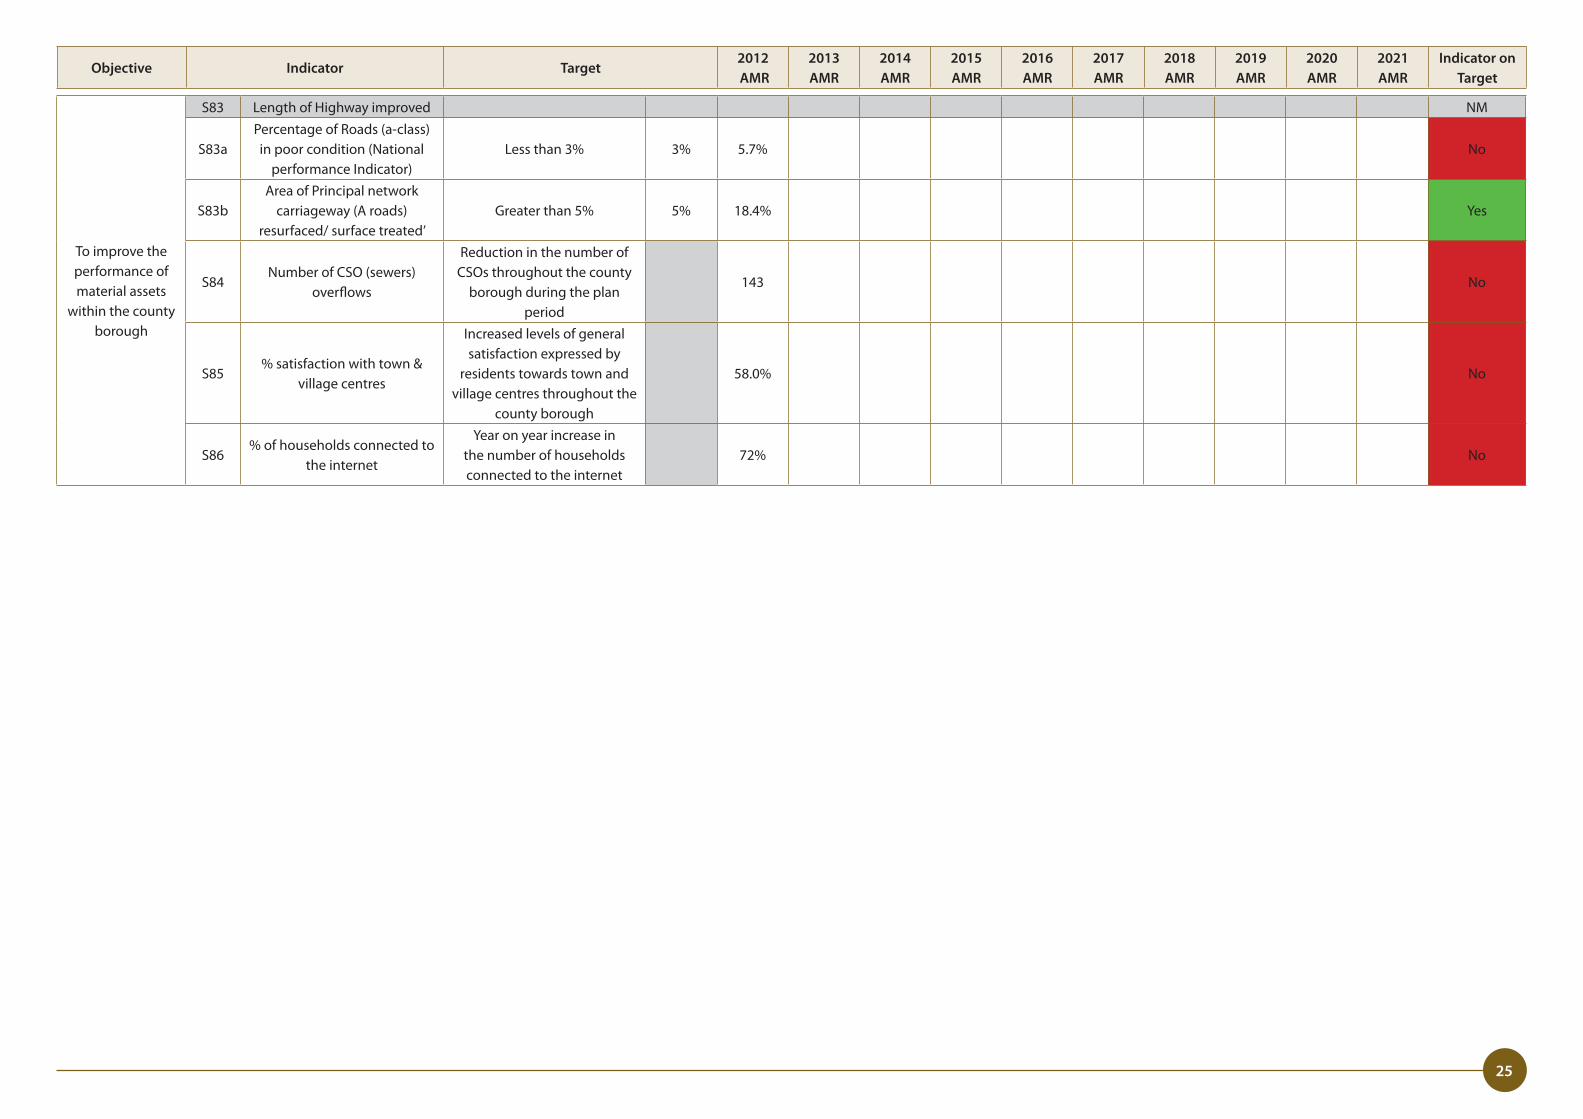
To improve the performance of material assets
within the county borough
S83 Length of Highway improved NM
S83aPercentage of Roads (a-class) in poor condition (National
performance Indicator)Less than 3% 3% 5�7% No
S83bArea of Principal network
carriageway (A roads) resurfaced/ surface treated’
Greater than 5% 5% 18�4% Yes
S84Number of CSO (sewers)
overflows
Reduction in the number of CSOs throughout the county
borough during the plan period
143 No
S85% satisfaction with town &
village centres
Increased levels of general satisfaction expressed by
residents towards town and village centres throughout the
county borough
58�0% No
S86% of households connected to
the internet
Year on year increase in the number of households connected to the internet
72% No

26