altered tyrosine phosphorylation of cardiac proteins
TRANSCRIPT
Altered Tyrosine Phosphorylation of CardiacProteins Prompts Contractile Dysfunction inHypertrophic CardiomyopathyMingguo Xu
Shen Zhen Children's HospitalKevin Bermea
Johns Hopkins School of MedicineMarzieh Ayati
The University of Texas Rio Grande ValleyXiaomei Yang
Qilu Hospital of Shandong UniversityZongming Fu
Johns Hopkins UniversityAmir Heravi
Johns Hopkins School of MedicineXinyou Zhang
Qilu Hospital of Shandong UniversityChan-Hyun Na
Johns Hopkins University School of Medicine, United StatesAllen Everett
Johns Hopkins School of Medicinekathleen Gabrielson
The Johns Hopkins University School of MedicineD Brian Foster
Johns Hopkins University School of Medicine https://orcid.org/0000-0002-9290-9590Nazareno Paolocci
Johns Hopkins School of MedicineAnne Margaret Murphy
Johns Hopkins UniversityGenaro Ramirez-Correa ( [email protected] )
UT Health Rio Grande Valley
Article

Keywords: tyrosine phosphorylation, cardiac proteins, hypertrophic cardiomyopathy
Posted Date: November 12th, 2020
DOI: https://doi.org/10.21203/rs.3.rs-100810/v1
License: This work is licensed under a Creative Commons Attribution 4.0 International License. Read Full License
1
Altered Tyrosine Phosphorylation of Cardiac Proteins Prompts Contractile
Dysfunction in Hypertrophic Cardiomyopathy
Mingguo Xu1,2,#, Kevin C. Bermea1,#, Marzieh Ayati3, Xiaomei Yang4, Zongming Fu5,
Amir Heravi1, Xinyu Zhang6, Chan Hyun Na7,8, Allen Everett1, Kathleen Gabrielson9, D.
Brian Foster10, Nazareno Paolocci10,11, Anne M. Murphy1 and Genaro A. Ramirez-
Correa12,1*
1Department of Pediatrics/Division of Cardiology, 2Department of Pediatric Cardiology, Shen Zhen
Children's Hospital, Shen Zhen, China.3Deparment of Computer Science/College of Engineering and
Computer Science, University of Texas Rio Grande Valley School of Medicine, Edinburgh,
Texas.4Department of Anesthesiology, Qilu Hospital, Cheeloo College of Medicine, Shandong University,
Ji'nan, 250012. China, 5Department of Pediatrics/Division of Hematology, Johns Hopkins University
School of Medicine, Baltimore, Maryland, USA. 6Department of Cardiology, Qilu Hospital, Cheeloo
College of Medicine, Shandong University, Ji'nan, 250012. China, 7Department of Biological
Chemistry/McKusick-Nathans Institute of Genetic Medicine, 8Department of Neurology/Institute for Cell
Engineering, 9Department of Molecular and Comparative Pathobiology, 10Department of
Medicine/Division of Cardiology, Johns Hopkins University School of Medicine, Baltimore, Maryland, USA.
11Department of Biomedical Sciences, University of Padova, Padova, Italy.12Department of Molecular
Science/UT Health Rio Grande Valley, USA.
Running Title: Enhanced Cardiac Protein's pTyr Influence Hypertrophy
# These authors contributed equally. *Corresponding Author: Genaro A. Ramirez-Correa, MD/PhD Department of Molecular Science UT Health Rio Grande Valley Research Building 5300 N L Street/ Office 1.408 McAllen, Texas 78502. USA Phone: 956-665-2188 E-mail: [email protected]
2
Abbreviations
HCM; Hypertrophic cardiomyopathy
DCM; Dilated cardiomyopathy
FHC; Familial Hypertrophic cardiomyopathy
cTnI; cardiac Troponin I
HF; Heart Failure
MHC; Myosin heavy chain
TnT; cardiac Troponin T
PKA; Protein kinase A
ErbB2; Erb-B2 Receptor Tyrosine Kinase 2 or Tyrosine Kinase-Type Cell Surface
Receptor HER2
c-Src; SRC Proto-Oncogene, Non-Receptor Tyrosine Kinase
PTM; Post-translational modification
TMT; Tandem Mass tagging
AG-825;(E)-3-[3-[2-Benzothiazolythio)methyl]-4-hydroxy-5-methoxyphenyl]-2-cyano-2-
propenamide or Tyrphostin AG 825, a selective ErbB2 inhibitor
EF; Ejection Fraction
FS; Fraction Shortening
MyBP-C; cardiac Myosin Binding Protein C
MLC3; Myosin Light Chain 3
3
Abstract
Altered Serine/Threonine phosphorylation of the cardiac proteome is an established
hallmark of heart failure (HF). However, the contribution of tyrosine phosphorylation to
the pathogenesis of these diseases remains unclear. The cardiac proteome was explored
by global mapping to discover and quantify site-specific tyrosine phosphorylation in two
cardiac hypertrophic models; cardiac overexpression of ErbB2 (TgErbB2) and cardiac
expression of a-Myosin heavy chain R403Q (R403Q-aMyHCTg) compared to control
hearts. Phosphoproteomic changes found in R403Q-aMyHC Tg mice indicated EGFR1,
Focal Adhesion, VEGF, ErbB signaling, and Chemokine signaling pathways activity were
likely to be activated. On the other hand, TgErbB2 mice findings displayed significant
overrepresentation of Right Ventricular Cardiomyopathy, Hypertrophic Cardiomyopathy
(HCM), and dilated cardiomyopathy (DCM) KEGG Pathways. In silico kinase-substrate
enrichment analysis (KSEA) highlighted a marked downregulation of canonical MAPK
Pathway Activity downstream of k-Ras in TgErbB2 mice and activation of EGFR, PP2
inhibition of c-Src, and Hepatocyte growth factor stimulation. In vivo ErbB2 inhibition by
AG-825 decreased cardiac fibrosis, cardiomyocyte disarray, and rescued contractile
function on TgErbB2 mice. These results suggest that altered tyrosine phosphorylation
may play a regulatory role in cardiac hypertrophic models, suggesting that tyrosine kinase
inhibitors could be used therapeutically in Hypertrophic Cardiomyopathy.
4
INTRODUCTION
Familial hypertrophic cardiomyopathy (HCM) increases the left ventricle (LV) wall
thickness and cannot be explained by abnormal loading conditions. Mutations in genes
encoding for sarcomeric proteins are common in HCM patients (40-60%)1. Studying post-
translational modifications (PTMs) of sarcomeric (or Ca2+ handling proteins) can offer a
unique opportunity to understand better how genetic disorders lead to cardiac dysfunction
and discover potential targets for therapy 2-4. For instance, PTMs of cardiac Troponin I
(cTnI), a sarcomere protein that is centrally involved in myocardial contractility regulation,
have been extensively studied, particularly for the functional role of PKA-dependent
phosphorylation5. Notably, phosphorylation of cTnI-S22/23 - one of the most relevant
regulatory sites of cTnI – is known to be down-regulated in human heart failure (HF)6 and
leads to contractile dysfunction 7.
Tyrosine phosphorylation is essential for cardiac structural development and
myofibril organization during embryogenesis8,9. For example, several tyrosine
phosphatases have been linked to heart disease and even proposed as a therapeutic
target for some conditions. Moreover, mutations at the level of tyrosine-protein
phosphatase non-receptor type 11 (PTPN11) can lead to HCM or dilated cardiomyopathy
(DCM)10,11. In the heart, PTPN11 likely plays a role in systolic dysfunction produced by
pressure-overload12. Another tyrosine phosphatase is associated with cardiac
pathophysiology, specifically acid phosphatase 1 (ACP1):—the deletion of ACP1 results
in a protection against stress-induced cardiomyopathy 13. Our group first showed that
5
cTnI-Y26 phosphorylation is readily detected in healthy human hearts and down-
regulated in human HF and DCM 14. However, how these alterations contribute to the
onset and progression of cardiac disease remains poorly understood. A better grasp of
additional site-specific changes of individual pTyr sites would help in this direction,
substantially.
In the present study, a label-free and tandem mass tagging (TMT) quantitative
global phosphotyrosine proteomics approach was applied to determine which sarcomeric
sites have altered amounts of Tyr phosphorylation at specific sites in two unrelated
models of HCM. The first model is secondary to the overexpression of the tyrosine kinase
receptor ErbB215,16; the second recapitulates features of the human disease, more
specifically, an R403Q mutation of the myofilament protein myosin heavy chain,
distinctive of familial hypertrophic cardiomyopathy17. The rationale for this choice was to
determine whether triggering HCM through different mechanisms elicits similar, pTyr-
related pathways/regulatory sites within the heart. In doing so, the manipulation of these
Tyrosine phosphorylation sites can offer new opportunities for therapeutic targeting in
different forms of human HCM
RESULTS
Choice of the Models
The approach combined examination of the global proteome and myofilament targeted
tyrosine phosphorylation proteomics approach in two HCM mice models to identify the
potential impact of altered Tyr phosphorylation on underlying disease mechanisms. One
model has HCM caused by cardiac-specific overexpression of a tyrosine kinase receptor
6
(ErbB2); the second is a classic model of a point mutation in a significant sarcomeric
protein (R403Q-aMyHC mice). TgErbB2 mice initially develop a striking, concentric
cardiac hypertrophy, which evolves to diffuse fibrosis and myocyte disarray 16 with HCM.
This line of mice also has abnormal calcium handling, and are prone to arrhythmias and
develop Hypertrophic Obstructive Cardiomyopathy 2. Similarly, R403Q-aMyHC mice
reproduce human familial HCM by progressing from mild hypertrophy, mild fibrosis to
frank myocyte disarray, HF, and arrhythmias 17.
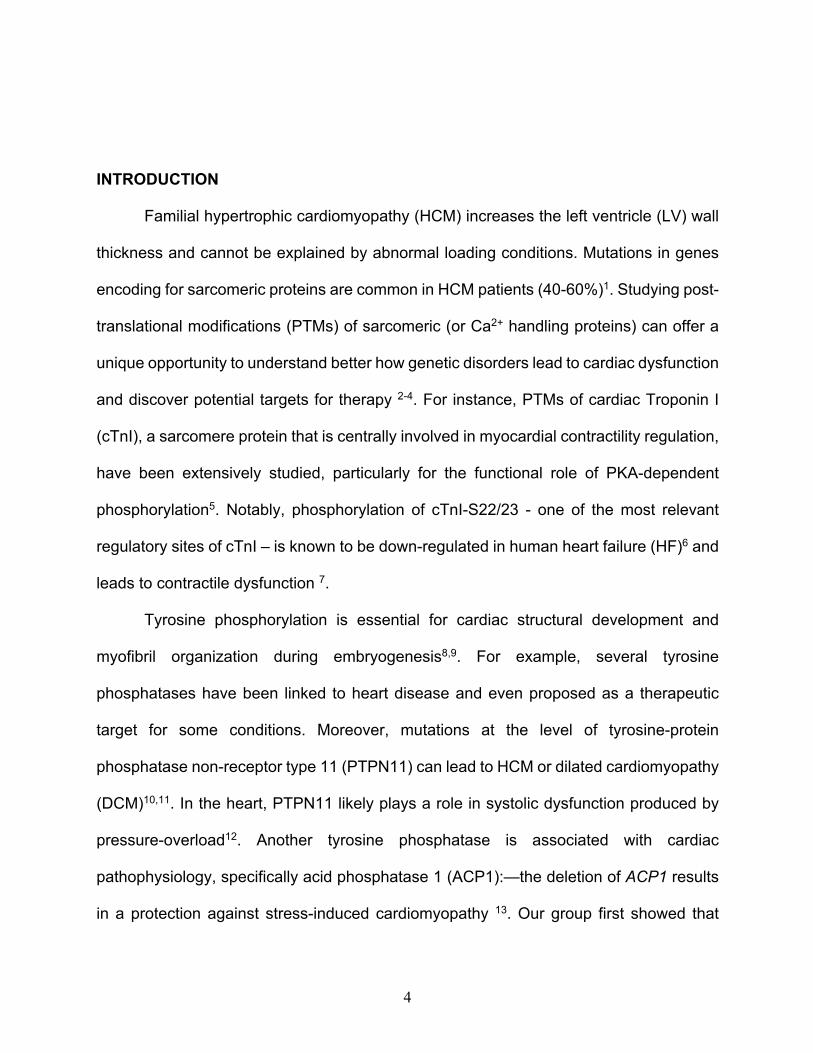
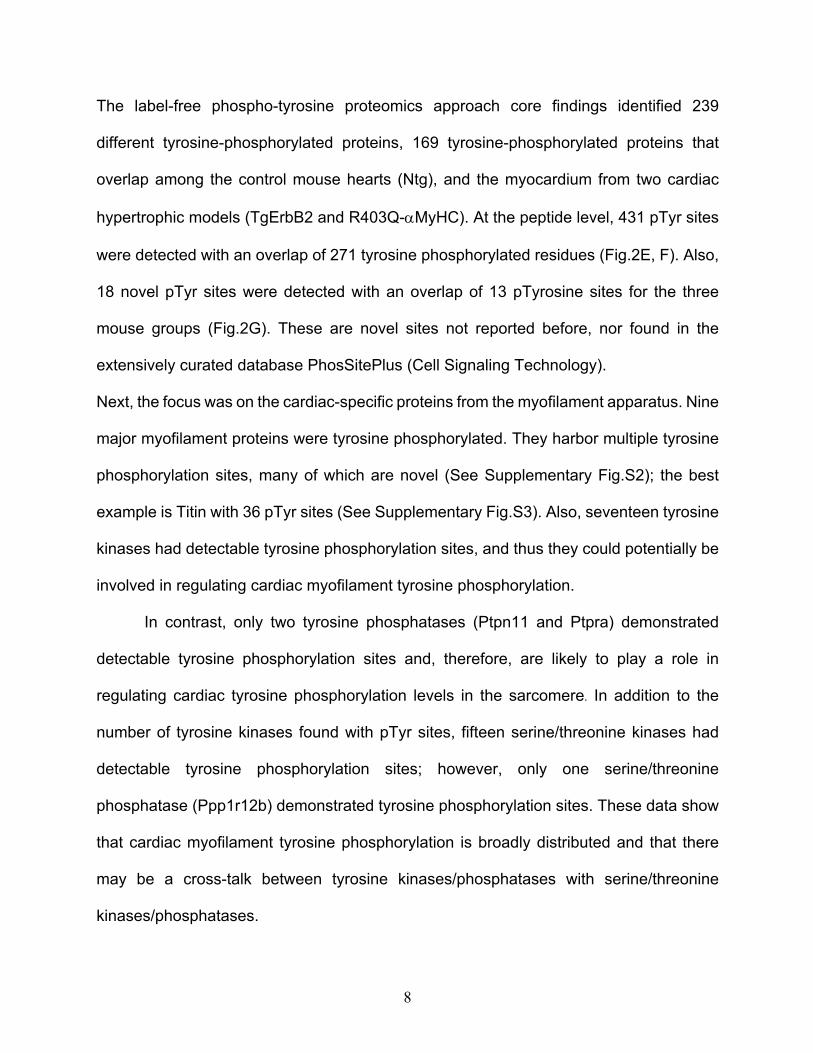
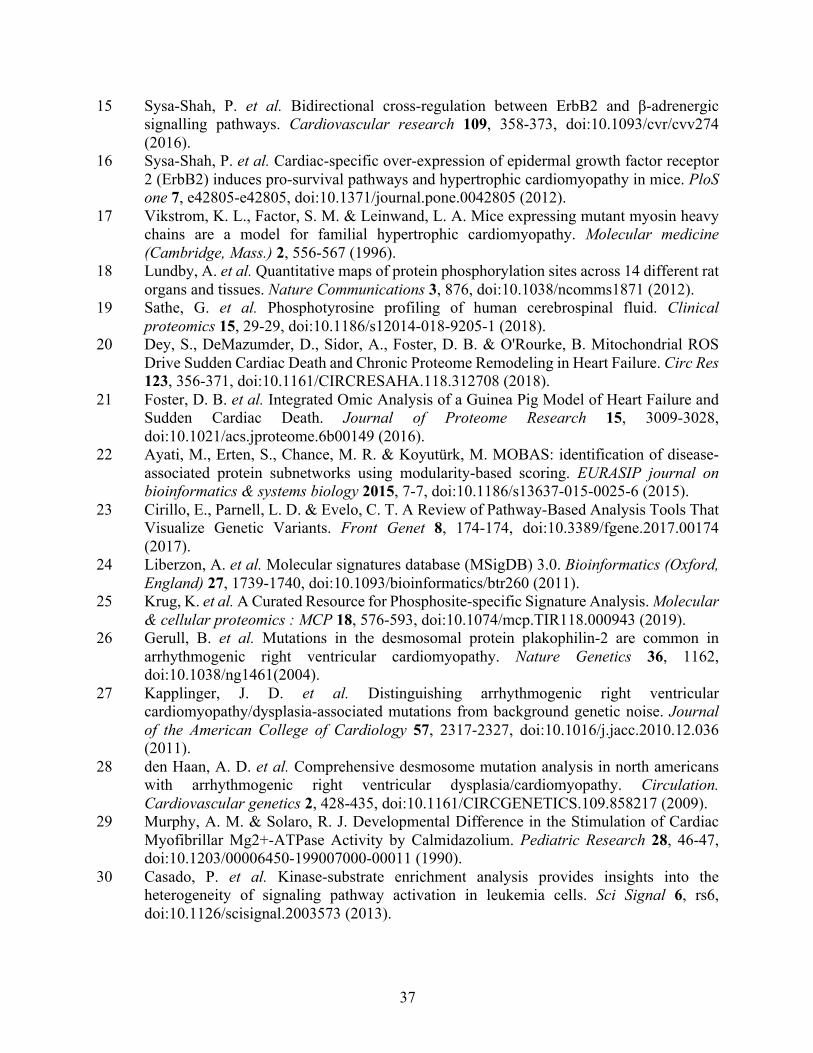
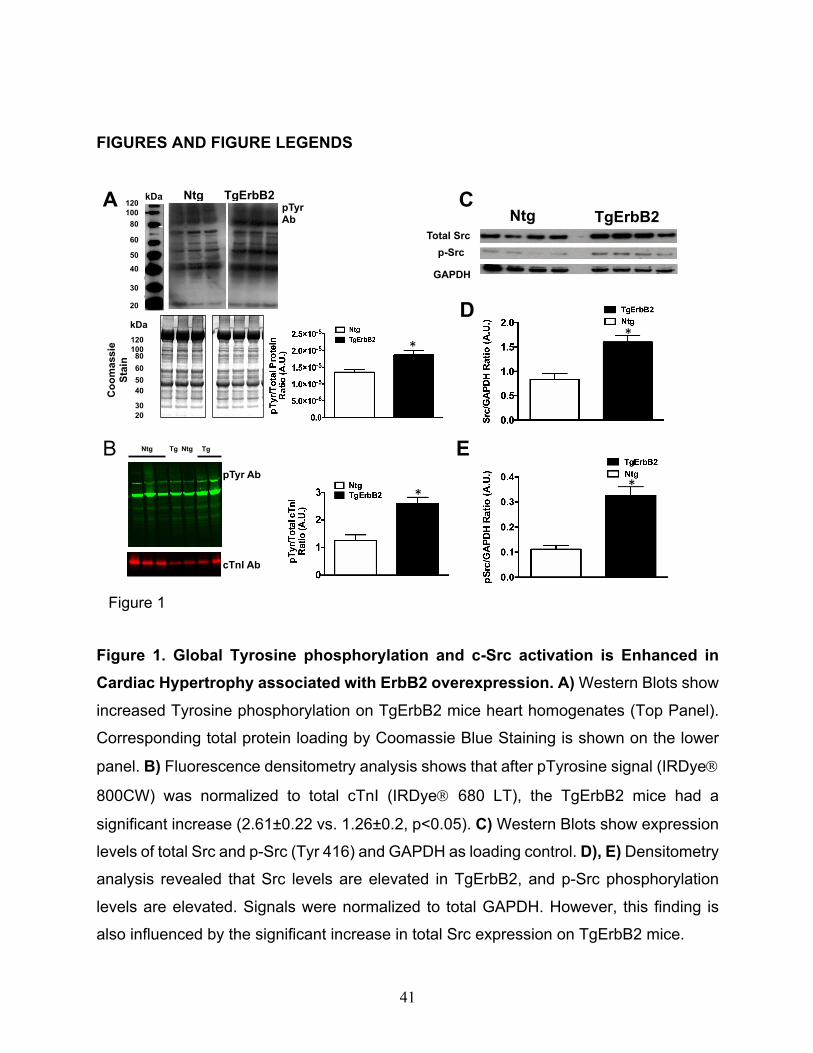
Immunoblotting Reveals Increased Cardiac Tyrosine Phosphorylation in HCM
models
First, immunoblot analysis of the myocardium of TgErbB2 and Ntg mice for tyrosine
phosphorylation was applied. In the whole heart homogenates of ErbB2 overexpressing
mice, there was a global increase of Tyrosine phosphorylation compared to non-
transgenic (Ntg) littermates (Fig.1A). These findings were corroborated with an immuno-
blot using pan-tyrosine phosphorylated antibodies detected by a fluorescent secondary
and normalizing the tyrosine phosphorylation signal to Troponin I levels (Fig.1B).
Although c-Src (proto-oncogene tyrosine-protein kinase Src) is downstream of ErbB2
signaling, we did not anticipate its increased expression in TgErbB2 mice (Fig1.C, D)
when normalized to GAPDH signals. The c-Src activity was enhanced in TgErbB2 mice
compared to Ntg, as revealed by enhanced Tyr416 phosphorylation (Fig.1E). Altogether
these data suggest that tyrosine phosphorylation is a broadly distributed post-translational
modification (PTM) in the myocardium. Therefore, alterations in cardiac tyrosine
phosphorylation may play a regulatory role in the disease progression of non-ischemic
7
cardiomyopathies, such as familial cardiomyopathy (HCM) and dilated cardiomyopathy
(DCM), as part of the pathophysiologic response to the underlying disease.
Tyrosine phosphorylation in myofilaments and cross-talk with serine/threonine
kinases/phosphatases
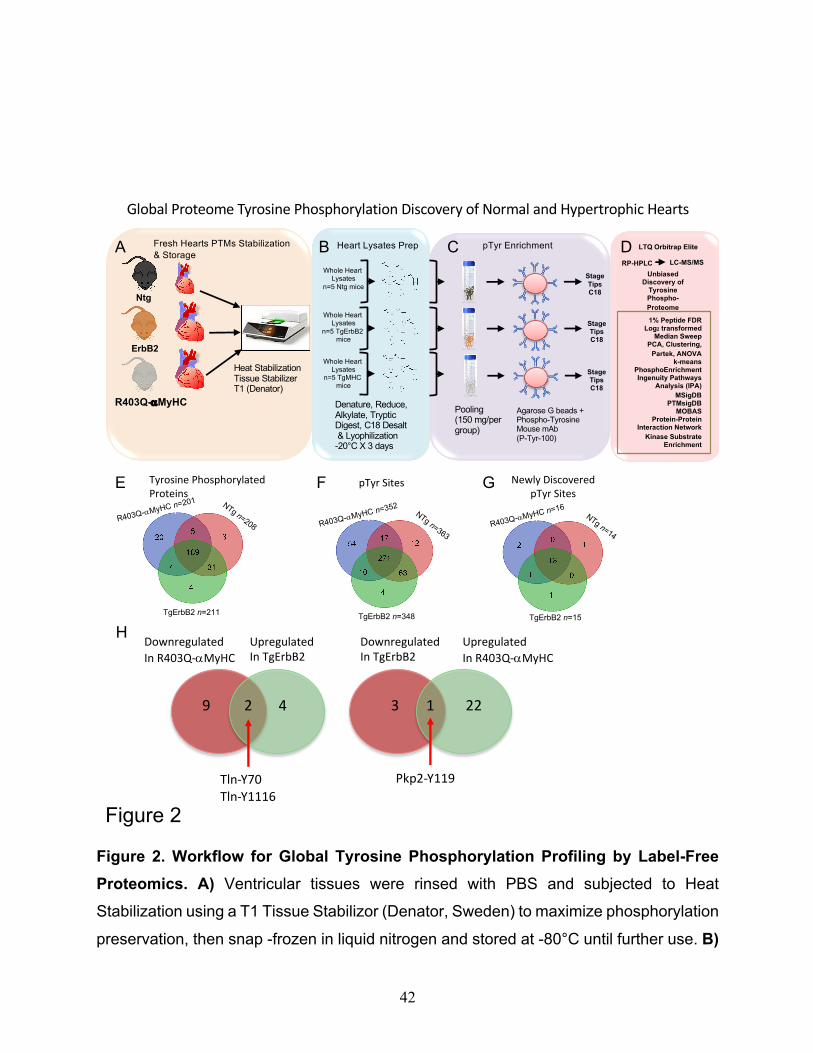
A label-free phospho-tyrosine proteomics approach was undertaken to compare the
cardiac tyrosine phosphorylation profile of Non-transgenic controls (Ntg), TgErbB2, and
R403Q-aMyHC mice (Fig.2). It was hypothesized that unbiased global pTyr profiling
would yield salient information about which specific tyrosine sites are phosphorylated in
well-known essential cardiac-specific proteins and tyrosine kinases, thus providing clues
about which tyrosine kinases could be mediating cardiac tyrosine phosphorylation. A total
of 1,800 peptide spectra matched (PSM) were collected from the heart ventricle whole
proteome, and 50% were identified with high confidence resulting in 431 unique tyrosine-
phosphorylated peptides corresponding to 239 proteins. Tables with all identified
phosphoproteins and phosphopeptides are provided in Supplementary Table 1-7. An
evaluation of the MS data quality, intensity, and distribution post-median sweep
normalization are shown in Supplementary Fig.S1. Confidence of Phosphorylated site
localization was evaluated for annotation, and a score of more than 49% was required.
This data set indicates that a comparable yield of peptide identification was achieved,
reproducibility on the enrichment of pTyr peptides, and high-quality MS/MS data using
similar approaches to others 18-20.
8
The label-free phospho-tyrosine proteomics approach core findings identified 239
different tyrosine-phosphorylated proteins, 169 tyrosine-phosphorylated proteins that
overlap among the control mouse hearts (Ntg), and the myocardium from two cardiac
hypertrophic models (TgErbB2 and R403Q-aMyHC). At the peptide level, 431 pTyr sites
were detected with an overlap of 271 tyrosine phosphorylated residues (Fig.2E, F). Also,
18 novel pTyr sites were detected with an overlap of 13 pTyrosine sites for the three
mouse groups (Fig.2G). These are novel sites not reported before, nor found in the
extensively curated database PhosSitePlus (Cell Signaling Technology).
Next, the focus was on the cardiac-specific proteins from the myofilament apparatus. Nine
major myofilament proteins were tyrosine phosphorylated. They harbor multiple tyrosine
phosphorylation sites, many of which are novel (See Supplementary Fig.S2); the best
example is Titin with 36 pTyr sites (See Supplementary Fig.S3). Also, seventeen tyrosine
kinases had detectable tyrosine phosphorylation sites, and thus they could potentially be
involved in regulating cardiac myofilament tyrosine phosphorylation.
In contrast, only two tyrosine phosphatases (Ptpn11 and Ptpra) demonstrated
detectable tyrosine phosphorylation sites and, therefore, are likely to play a role in
regulating cardiac tyrosine phosphorylation levels in the sarcomere. In addition to the
number of tyrosine kinases found with pTyr sites, fifteen serine/threonine kinases had
detectable tyrosine phosphorylation sites; however, only one serine/threonine
phosphatase (Ppp1r12b) demonstrated tyrosine phosphorylation sites. These data show
that cardiac myofilament tyrosine phosphorylation is broadly distributed and that there
may be a cross-talk between tyrosine kinases/phosphatases with serine/threonine
kinases/phosphatases.
9
ErbB2 Cardiac Overexpression and R403Q-aMyHC Point Mutation Remodeled the
Cardiac Tyrosine Phosphorylation Proteome
Next, studies were undertaken to define the impact of ErbB2 cardiac overexpression and
R403Q mutation of the cardiac myosin heavy chain on the specific tyrosine
phosphorylation changes. Data were then analyzed to determine the signaling
transduction pathways associated with two unrelated types of HCM. Spectral
normalization and statistical methods were performed, as previously described 21,22.
Then, principal component analysis (PCA), k-means and hierarchical clustering were
applied to determine if the pTyr profiles were similar within the groups. This approach
determined that, indeed, the three groups segregate distinctively by the principal
component 1 (PC1= 36.6%), whereas no group-wise distinction was evident in the second
component (PC2=16.4%), see Fig.3A. Of note, one technical/biological replicate of
R403Q-aMyHC was removed because it had more than 50% of absent pTyr peptides
compared to the other two replicates. Hence, it was considered a technical failure.
Heatmaps of hierarchically clustered up- or down-regulated pTyr peptides helped
visualize the technical reproducibility and the specificity of how the genotype of cardiac
hypertrophy largely influenced the phospho-tyrosine proteome remodeling (Fig.3B,
p<0.05 by ANOVA). Tyrosine phosphorylated peptides are color-coded according to their
extracted chromatogram MS1 signal intensities; yellow is upregulated, and blue is
downregulated. This approach is a relative measure for peptide abundance. Additionally,
k-means, which is an unsupervised machine learning algorithm, discovered the
10
underlying pattern, which is distinct to every group, see the clusters in Fig.3C (p < 0.05),
as opposed to having a flat upregulated (green) or downregulated (red) line among the
three groups. These results demonstrate that Ntg, TgErbB2, and R403Q-aMyHC mice
each have a pTyr proteome with a distinct signature, evidenced by PCA, heatmaps
clustering, and k-means analysis; all of which are unsupervised unbiased statistical
methods.
Statistically significant changes (Log2 fold change > 1, p-value<0.05) were detected in 28
phosphosites corresponding to 24 proteins in TgErbB2 mice (Fig.3D) and 77
phosphosites in 57 proteins in the R403Q-aMyHC Tg mice (Fig.3F) using ANOVA (p <
0.05). It is noteworthy that cardiac sarcomeric actin Y-200 was hyperphosphorylated
(Log2 FC 1.11, p < 0.05) while cardiac Troponin I Y-113 was hypophosphorylated (Log2
FC -2.73, p < 0.05) on R403Q-αMyHC mice hearts. The statistically significant pTyr
changes observed in both animal models were subjected to pathway analysis (Ingenuity
Pathway Analysis, Qiagen®). However, IPA has well-known disadvantages since the
results have to be subjectively interpreted by the user 23. Statistical changes in proteins
that match the phospho-tyrosine peptides do not account for the up-regulation or down-
regulation of a peptide and how that impacts activation or inhibition of their activity within
their respective pathway. The analysis yielded significant results about over-represented
canonical pathways and their upstream master regulators (B-H corrected p < 0.05). Such
as Tec Kinase Signaling, VEGF, integrin-linked kinase (ILK), Rho family GTPase, PAK,
CXCR4, actin cytoskeleton, and cardiac hypertrophy signaling pathway for R403Q-
aMyHC Tg mice, whereas that for TgErbB2 mice also actin cytoskeleton, ILK and
11
Synaptogenesis signaling pathway (Supplementary Fig.S4). However, since there are
many pathways and potential master regulators, it is difficult to infer the precise biological
significance. The complete list of upstream regulators is displayed in Supplementary
tables 8 and 9 of Online Supplementary Data.
To circumvent IPA limitations, PhoshoEnrichment Software was used, which utilizes the
Molecular Signatures Database (MsigDB) 24. This database was created by the Broad
Institute that comprehends a well-curated collection of annotated gene data sets. Also, a
novel database of PTM site-specific phosphorylation signatures of kinases, perturbations,
and signaling pathways (PTMsigDB) was employed. PTMSigDB was recently developed
by the Broad Institute 25. This tool accounts for phospho site-specific changes and their
impact on activation or inhibition of a given pathway, together with the most common
experimental Systems Biology Perturbations. The advantage of these bioinformatics tools
is to assess the statistical significance of each pathway and Perturbation (gene-level and
site-level) using a hypergeometric test. Here, the number of identified phosphosites and
genes is used as the population for the hypergeometric model parameter instead of using
all known genes as the population, as in IPA.
A pathway enrichment analysis was performed on significant genes/sites (Log2 FC>1 and
p-value < 0.05) using a gene-protein level with MSigDB. It was found that TgErbB2 mice's
most significant pathways by KEGG are right ventricular cardiomyopathy (ARVC), see
Fig.3D, E in pink color highlights, followed by hypertrophic cardiomyopathy (HCM) and
dilated cardiomyopathy (DCM). Both Tg animal models showed a remarkable alteration
12
in Plakophilin-2 (PKP2) phosphorylation at the site Y119, although in TgErbB2 hearts, it
was downregulated, and in R403Q-aMyHC Tg hearts, it was upregulated. Plakophilin-2
(PKP2) is a critical component of the myocardium's desmosomes, and mutations in the
gene encoding for this protein are associated with arrhythmogenic cardiomyopathy 26-28,
suggesting that disturbed phosphorylation could have a functional impact.
In comparison, the PTMsigDB revealed that pathway analysis at the phosphorylated site-
specific level did not reach statistical significance for the EGFR1 pathway. In the case of
TgErbB2 mice, only three site-specific phosphosites matched the EGFR1 pathway; they
are highlighted in cyan color at the Volcano plot (Fig.3D) and PTMsigDB table (Fig.3E).
Intriguingly, however, in R403Q-aMyHC mice, the same pathway was statistically
significant; see the 16 site-specific changes that matched the EGFR1 pathway (p=0.001)
represented in the volcano plot as cyan data points (Fig.3F) and PTMsigDB table (Fig.
3G). EGFR1 is a receptor tyrosine kinase, and the following most significant change is a
signature secondary to Erythropoietin (PSP_EPO) stimulation (p= 5.6-4); see three purple
and one blue data points on the volcano plot (Fig.3F), the blue dot is to show an
overlapping site, Stat5a Y694p, of EGFR1 pathway and PSP_EPO (Erythropoietin
stimulation). These data show the utility of phosphorylation site-specific databases to
narrow the search of a biologically relevant pathway on phospho-proteomics data sets,
particularly in understudied phosphorylation events such as pTyr that have small data
sets to date.
TMT Labeled Quantitative Proteomics of TgErbB2 Confirms Cardiac Sarcomere
Tyrosine Phosphoproteome Dysregulation
13
A tandem mass tagging (TMT) quantitative labeling proteomics was used to gain more
specific insight into the myofilament tyrosine phosphorylation changes. The hypothesis is
that myofilament enrichment would enhance site-identification in myofilament proteins,
specifically those with low abundance phospho-Tyrosine modifications, that may have
been missed using the global approach. To that end, Ntg and TgErbB2 mice were
evaluated using freshly isolated myofilaments, as described previously29 with minor
modifications, from three hearts per genotype and evaluated the tyrosine
phosphoproteome (Fig.4A, B), as described previously for the Heart Failure
phosphoproteome20. Briefly, in this 6-plex TMT experiment, the peptides identified with
single spectra were removed, which lead to 24,727 peptide spectra matched (PSM). After
median sweep normalization, there were 1,116 peptides that corresponded to 1,092
proteins. For spectral intensity distribution, before and after normalization, see
Supplementary Fig.S5. For pTyr Proteome 4,391 PSM were collected and followed the
same quality control curation of the full proteome to remove missing data and unique
spectra, which led to 3,064 PSM. Raw data of pTyr proteome spectral intensity distribution
and PCA are shown in Supplementary Fig. S6A. After median sweep normalization, 832
peptides corresponded to 184 different proteins. Specific tyrosine phosphorylation for 146
peptides was quantified because they had corresponding peptides from the full
proteome's expression data. For further statistical data analysis, a workflow similar to that
used for Label-Free proteomics was adopted. The only difference was that specific
phosphorylation levels were calculated matching pTyr peptides intensity levels to their
respective protein intensity levels on the flow-through fraction of peptides used for full
14
proteome determination and unsupervised statistical analysis obviated k-means because
it is designed for experimental groups of three or more.
The first step of the analysis uses unsupervised principal component analysis
(PCA) and hierarchical clustering. PCA analysis showed the correlation between
members in the same group and the ellipse represent the confidence interval of 95% (See
Fig.5A, B, C), full proteome, pTyr proteome, and normalized pTyr proteome segregate
well along PC1, showing a correlation of expression of 53.9%, 47.2%, and 57%,
respectively. Heatmaps of hierarchically clustered expression helped to easily visualize
how TgErbB2 cardiac overexpression largely influenced the genotype clustering. Both
patterns, proteins from the full proteome (Fig.5D), and the normalized intensity of pTyr
Proteome (Fig.5E) suggested a mirrored remodeling (377 proteins for full proteome and
51 pTyr peptides had a p < 0.05 by LIMMA moderated 2-sample t-test comparison).
From the full proteome, 1116 peptides were detected, which corresponded to 1092
proteins. A comparison of the Log2 fold-change (FC) of TgErbB2/Ntg showed 377 proteins
with statistically significant differences (Log2 FC >1 and p-value <0.05). Similar to label-
free proteome data, the statistically significant protein expression changes were
subjected to MSigDB for pathway analysis, and their results are shown in Supplementary
Table 10.
To analyze specific pTyr Proteome specific phosphorylation, or normalized pTyr
proteome, 146 phospho-sites that corresponded to 50 proteins were used, and the
TgErbB2 mice showed significant changes in 21 pTyr sites (Fig.5G) that corresponded to
15 proteins. Of note, a significant increase of pTyr was detected on MLC1-Y82,139,
Myh6-Y1310, a-Tm-Y261, Actin-Y168, MyBP-C-Y544, and Actinin2-Y200, among other
15
proteins. Once again, a pathway enrichment analysis was performed using MsigDB on
the 15 proteins representing the 21 pTyr sites, and as in the case of the label-free
approach, TgErbB2 mice most significant pathways by KEGG included DCM and HCM,
see Fig.5G, H with magenta color highlights on volcano plot and table. Interestingly, when
normalized to total ErbB2, the ErbB2-Y1006 phosphorylation levels are decreased. On
the other hand, PTMsigDB pathways analysis did not match any pathways because many
of those sites are new and not reported in the PTMsigDB database.
Kinase-Substrate Enrichment Analysis (KSEA) Implicated Downregulation of
MAPK in TgErbB2 and Upregulation of EGFR in R403Q-aMyHCTg
Kinase-Substrate Enrichment Analysis (KSEA) was used to characterize genotype-
induced signaling changes by estimating the kinase's relative activity in TgErbB2 and
R403Q-aMyHC mice using the global pTyr label-free and TMT quantitative sarcomere
pTyrosine proteomics data, using their respective Ntg groups as a reference. KSEA 30 is
a method that infers the kinases' differential activity based on the differential
phosphorylation of its substrates and computes scores that reflect the directional change
in each kinase's signaling. This method assumes that the differential activity of kinases is
correlated with phosphorylation changes in its substrates. A positive score corresponds
to a kinase with phosphorylated substrates in Tg mice relative to Ntg control. Likewise, a
negative score is a hypophosphorylation in Tg relative to their Ntg control. The kinase-
substrate interaction data was downloaded from the PhosphoSitePlus (PSP) 31 website.
Next, the KSEA method was applied to all the pTyr sites identified in these experiments.
16
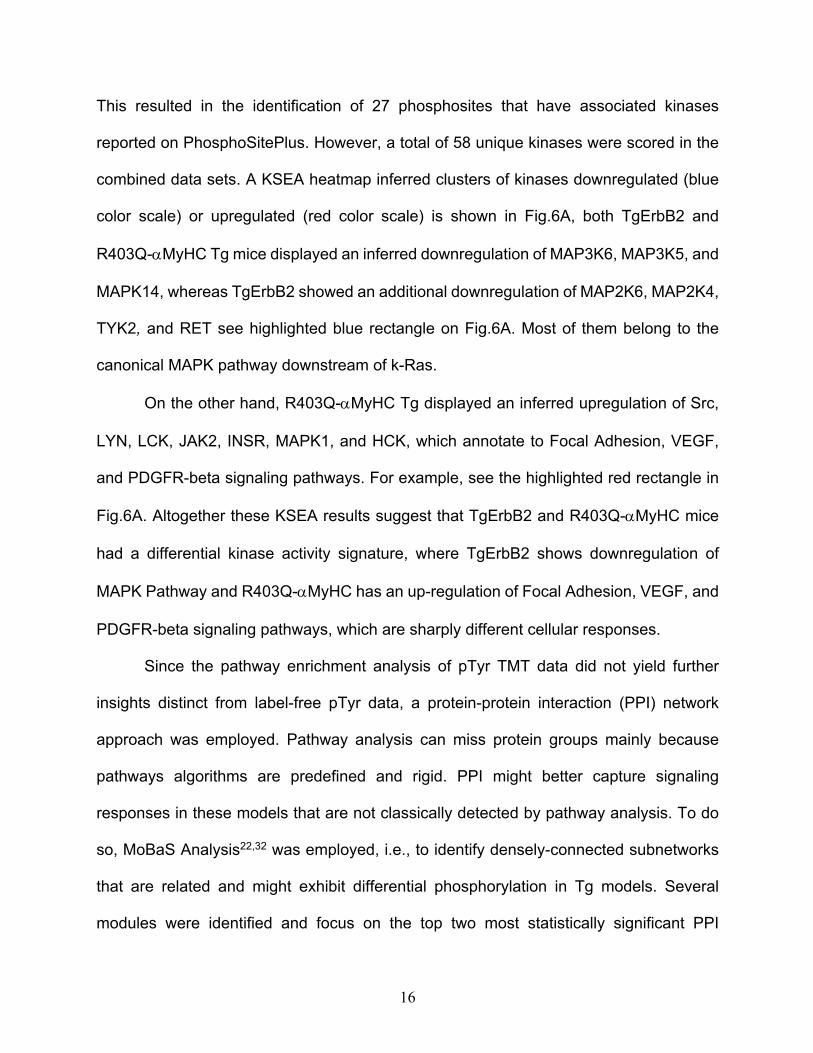
This resulted in the identification of 27 phosphosites that have associated kinases
reported on PhosphoSitePlus. However, a total of 58 unique kinases were scored in the
combined data sets. A KSEA heatmap inferred clusters of kinases downregulated (blue
color scale) or upregulated (red color scale) is shown in Fig.6A, both TgErbB2 and
R403Q-aMyHC Tg mice displayed an inferred downregulation of MAP3K6, MAP3K5, and
MAPK14, whereas TgErbB2 showed an additional downregulation of MAP2K6, MAP2K4,
TYK2, and RET see highlighted blue rectangle on Fig.6A. Most of them belong to the
canonical MAPK pathway downstream of k-Ras.
On the other hand, R403Q-aMyHC Tg displayed an inferred upregulation of Src,
LYN, LCK, JAK2, INSR, MAPK1, and HCK, which annotate to Focal Adhesion, VEGF,
and PDGFR-beta signaling pathways. For example, see the highlighted red rectangle in
Fig.6A. Altogether these KSEA results suggest that TgErbB2 and R403Q-aMyHC mice
had a differential kinase activity signature, where TgErbB2 shows downregulation of
MAPK Pathway and R403Q-aMyHC has an up-regulation of Focal Adhesion, VEGF, and
PDGFR-beta signaling pathways, which are sharply different cellular responses.
Since the pathway enrichment analysis of pTyr TMT data did not yield further
insights distinct from label-free pTyr data, a protein-protein interaction (PPI) network
approach was employed. Pathway analysis can miss protein groups mainly because
pathways algorithms are predefined and rigid. PPI might better capture signaling
responses in these models that are not classically detected by pathway analysis. To do
so, MoBaS Analysis22,32 was employed, i.e., to identify densely-connected subnetworks
that are related and might exhibit differential phosphorylation in Tg models. Several
modules were identified and focus on the top two most statistically significant PPI
17
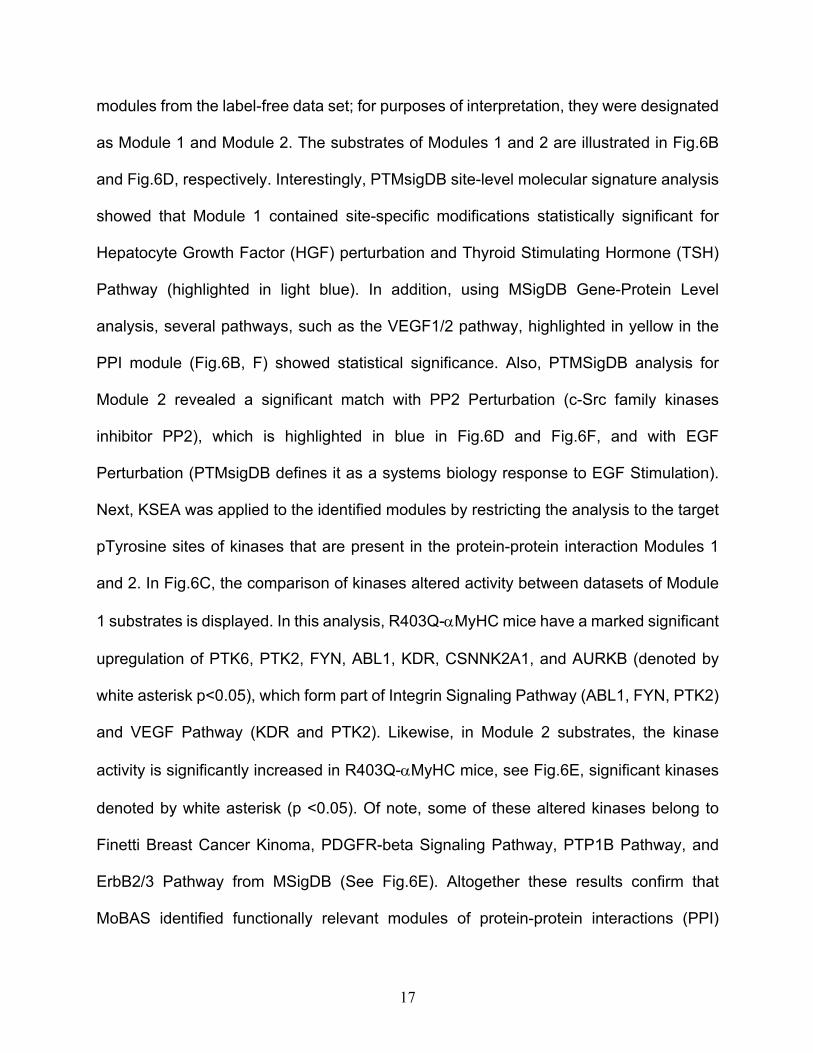
modules from the label-free data set; for purposes of interpretation, they were designated
as Module 1 and Module 2. The substrates of Modules 1 and 2 are illustrated in Fig.6B
and Fig.6D, respectively. Interestingly, PTMsigDB site-level molecular signature analysis
showed that Module 1 contained site-specific modifications statistically significant for
Hepatocyte Growth Factor (HGF) perturbation and Thyroid Stimulating Hormone (TSH)
Pathway (highlighted in light blue). In addition, using MSigDB Gene-Protein Level
analysis, several pathways, such as the VEGF1/2 pathway, highlighted in yellow in the
PPI module (Fig.6B, F) showed statistical significance. Also, PTMSigDB analysis for
Module 2 revealed a significant match with PP2 Perturbation (c-Src family kinases
inhibitor PP2), which is highlighted in blue in Fig.6D and Fig.6F, and with EGF
Perturbation (PTMsigDB defines it as a systems biology response to EGF Stimulation).
Next, KSEA was applied to the identified modules by restricting the analysis to the target
pTyrosine sites of kinases that are present in the protein-protein interaction Modules 1
and 2. In Fig.6C, the comparison of kinases altered activity between datasets of Module
1 substrates is displayed. In this analysis, R403Q-aMyHC mice have a marked significant
upregulation of PTK6, PTK2, FYN, ABL1, KDR, CSNNK2A1, and AURKB (denoted by
white asterisk p<0.05), which form part of Integrin Signaling Pathway (ABL1, FYN, PTK2)
and VEGF Pathway (KDR and PTK2). Likewise, in Module 2 substrates, the kinase
activity is significantly increased in R403Q-aMyHC mice, see Fig.6E, significant kinases
denoted by white asterisk (p <0.05). Of note, some of these altered kinases belong to
Finetti Breast Cancer Kinoma, PDGFR-beta Signaling Pathway, PTP1B Pathway, and
ErbB2/3 Pathway from MSigDB (See Fig.6E). Altogether these results confirm that
MoBAS identified functionally relevant modules of protein-protein interactions (PPI)
18
among identified pTyr peptides and pointed insights into system biology processes from
PTMsigDB that were not detected on global analysis.
Tyrphostin AG-825 administration decreased cardiac fibrosis, cardiomyocyte
disarray and preserved contractile function in the TgErbB2 mouse model
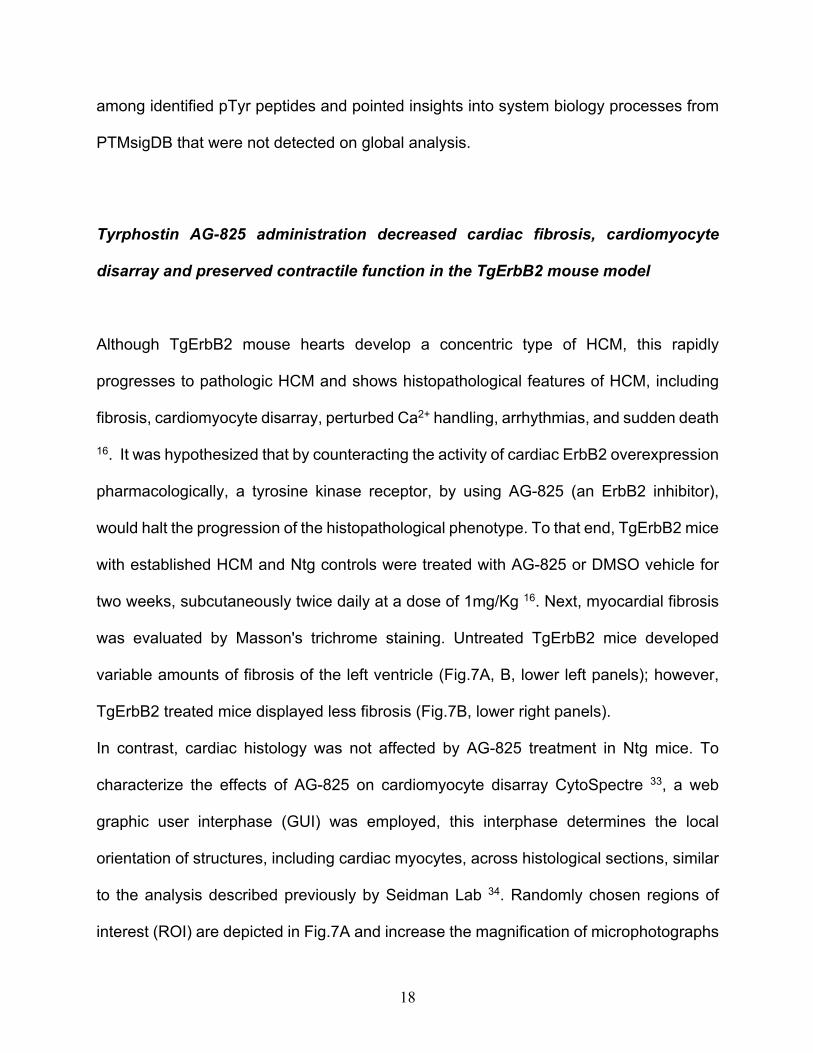
Although TgErbB2 mouse hearts develop a concentric type of HCM, this rapidly
progresses to pathologic HCM and shows histopathological features of HCM, including
fibrosis, cardiomyocyte disarray, perturbed Ca2+ handling, arrhythmias, and sudden death
16. It was hypothesized that by counteracting the activity of cardiac ErbB2 overexpression
pharmacologically, a tyrosine kinase receptor, by using AG-825 (an ErbB2 inhibitor),
would halt the progression of the histopathological phenotype. To that end, TgErbB2 mice
with established HCM and Ntg controls were treated with AG-825 or DMSO vehicle for
two weeks, subcutaneously twice daily at a dose of 1mg/Kg 16. Next, myocardial fibrosis
was evaluated by Masson's trichrome staining. Untreated TgErbB2 mice developed
variable amounts of fibrosis of the left ventricle (Fig.7A, B, lower left panels); however,
TgErbB2 treated mice displayed less fibrosis (Fig.7B, lower right panels).
In contrast, cardiac histology was not affected by AG-825 treatment in Ntg mice. To
characterize the effects of AG-825 on cardiomyocyte disarray CytoSpectre 33, a web
graphic user interphase (GUI) was employed, this interphase determines the local
orientation of structures, including cardiac myocytes, across histological sections, similar
to the analysis described previously by Seidman Lab 34. Randomly chosen regions of
interest (ROI) are depicted in Fig.7A and increase the magnification of microphotographs
19
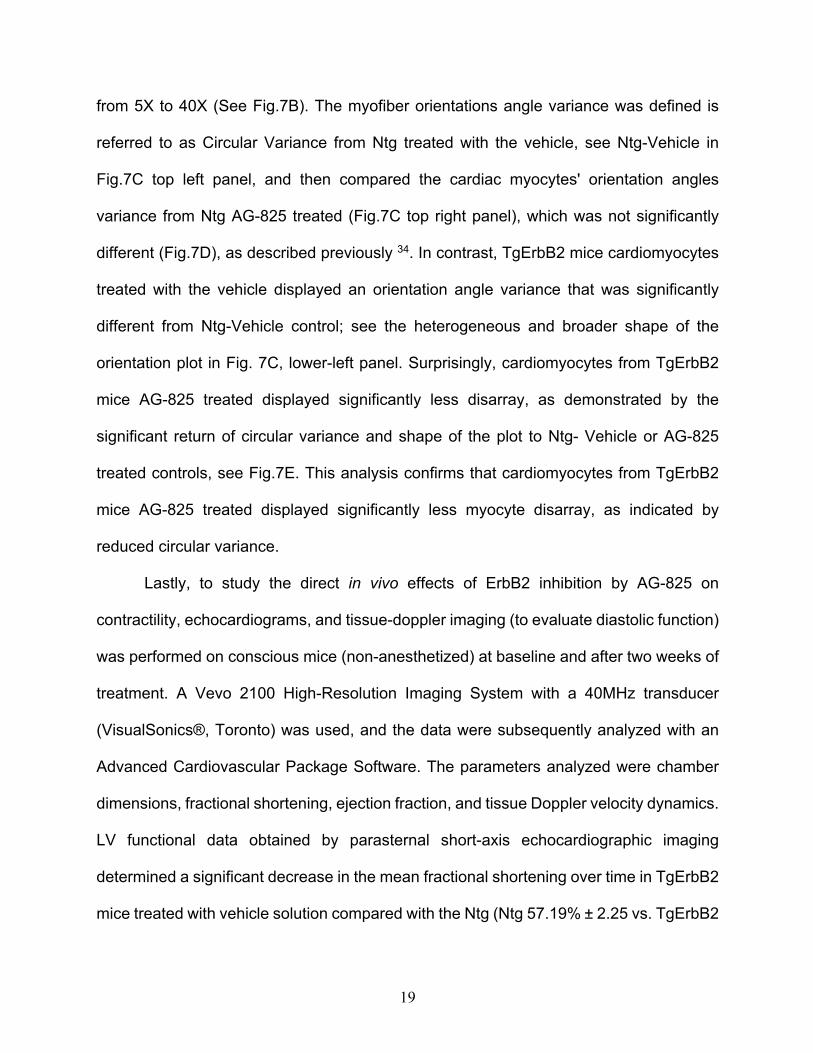
from 5X to 40X (See Fig.7B). The myofiber orientations angle variance was defined is
referred to as Circular Variance from Ntg treated with the vehicle, see Ntg-Vehicle in
Fig.7C top left panel, and then compared the cardiac myocytes' orientation angles
variance from Ntg AG-825 treated (Fig.7C top right panel), which was not significantly
different (Fig.7D), as described previously 34. In contrast, TgErbB2 mice cardiomyocytes
treated with the vehicle displayed an orientation angle variance that was significantly
different from Ntg-Vehicle control; see the heterogeneous and broader shape of the
orientation plot in Fig. 7C, lower-left panel. Surprisingly, cardiomyocytes from TgErbB2
mice AG-825 treated displayed significantly less disarray, as demonstrated by the
significant return of circular variance and shape of the plot to Ntg- Vehicle or AG-825
treated controls, see Fig.7E. This analysis confirms that cardiomyocytes from TgErbB2
mice AG-825 treated displayed significantly less myocyte disarray, as indicated by
reduced circular variance.
Lastly, to study the direct in vivo effects of ErbB2 inhibition by AG-825 on
contractility, echocardiograms, and tissue-doppler imaging (to evaluate diastolic function)
was performed on conscious mice (non-anesthetized) at baseline and after two weeks of
treatment. A Vevo 2100 High-Resolution Imaging System with a 40MHz transducer
(VisualSonics®, Toronto) was used, and the data were subsequently analyzed with an
Advanced Cardiovascular Package Software. The parameters analyzed were chamber
dimensions, fractional shortening, ejection fraction, and tissue Doppler velocity dynamics.
LV functional data obtained by parasternal short-axis echocardiographic imaging
determined a significant decrease in the mean fractional shortening over time in TgErbB2
mice treated with vehicle solution compared with the Ntg (Ntg 57.19% ± 2.25 vs. TgErbB2
20
43.72% ±5.05, p-value < 0.05). In contrast, TgErbB2 mice treated with AG-825 did not
display a significant decline in contractile function over time when compared to Ntg AG-
825 treated (TgErbB2 50.3% ±5.94 vs. Ntg 58.95% ± 2.35, p-value > 0.05). Also, the
ejection fraction (data not shown) of the TgErbB2 mice treated with the vehicle was
significantly lower than Ntg (TgErbB2 68.07%±5.64 vs. Ntg 81.60% ± .95); this decline in
contractility was abolished by AG-825 treatment of ErbB2 Tg mice (TgErbB2 74.86%
±5.76 vs. Ntg 83.09% ± 1.93). TDI detected no additional beneficial effects on diastolic
function; see complete Echocardiography data on Supplementary Table 11. Altogether,
these data suggest that ErbB2 pharmacological inhibition halted or reversed pathological
remodeling by reducing the fibrotic response and restoring cardiomyocyte alignment,
further reflected by an in vivo preservation of LV contractile function without effect on LVH
from TgErbB2 mice.
DISCUSSION
This study demonstrates that cardiac-specific overexpression of ErbB2 and allelic
expression of R403Q-αMyHC alters the tyrosine phosphoproteome of the cardiac
sarcomere and signaling pathways related to hypertrophic cardiomyopathy (HCM). In the
TgErbB2 mouse model, a total of 51 tyrosine-phosphorylated sites were significantly
altered, with 28 up-regulated peptides and 23 down-regulated peptides (Log2 FC > 1.0, p
< 0.05). Among those 51 sites, 7 (Myh6-Y1261, Myh6-Y1349, Ttn-Y2118, Ttn-Y21190,
Ttn-Y31324, Sgcb-Y46, and ATP2a2-Y497) belong to proteins involved in both the
hypertrophic cardiomyopathy (HCM) and dilated cardiomyopathy (DCM) KEGG
21
pathways. Significant alterations were observed in the elements of the right ventricular
cardiomyopathy (ARVC) KEGG pathway. Interestingly, a greater number of tyrosine-
phosphorylated sites were significantly altered in R403Q-αMyHC mice compared to
TgErbB2 mice (78 vs. 51, respectively; Log2 FC >1.0, p<0.05), including 48 upregulated
phosphosites and 30 downregulated phosphosites. Conversely, the total number of
tyrosine-phosphorylated sites identified in both mouse models was similar (TgErbB2
n=348 vs. R403Q-αMyHC n=352, Fig.2F). This evidence suggests that the differences
observed can be attributed to genotype or phenotype differences between these two
mouse models. Interestingly, we unearthed the same HCM/DCM tyrosine-phosphorylated
peptides in TgErbB2 mice and R403Q-αMyHC mice. However, only on R403Q-αMyHC
mice, the changes reached statistical significance for HCM/DCM KEGG pathways'
involvement. Some of the pathways highlighted by the KSEA in R403Q-αMyHC Tg mice
include the Focal Adhesion, VEGF, ErbB signaling, Chemokine Signaling, and
Angiopoietin receptor pathways.
Initially, it was reasoned that overexpression of a receptor tyrosine kinase in
TgErbB2 mice hearts would result in a more significant alteration of tyrosine
phosphoproteome. However, the data suggest that a single sarcomere point mutation, as
in the case of R403Q-αMyHC mice, is enough to alter the cardiac tyrosine
phosphoproteome significantly. Another surprising finding was that the ErbB signaling
pathway elements were not significantly altered in TgErbB2 mice, but rather in R403Q-
αMyHC mice. Indeed, MSigDB analysis in the TgErbB2 mice yielded only two targets
(CRK and SHC1) associated with the ERBB Signaling KEGG pathway. The TgErbB2
mouse model is important because it shows pronounced cardiac hypertrophy at an early
22
age, sarcomere dysfunction, and abnormal calcium handling 16, thus connecting the
tyrosine kinase pathway and tyrosine phosphorylation to cardiac hypertrophy. While
ErbB2 was previously reported to be overexpressed ~40-fold in TgErbB2 hearts 12, the
tandem mass tagging quantitative proteomics data, which allowed normalization of the
peptide phosphorylation signal to total protein levels of ErbB2, revealed that the
phosphorylation level of ErbB2-Y1006 peptide is reduced in this model (Fig.5G). The low
stoichiometry of phosphorylated:non-phosphorylated ErbB2 may account for the
apparent lack of alteration of the ErbB signaling pathway.
In contrast, R403Q-αMyHC exhibited alterations in eight members (CRK, GSK3B,
MAPK1, MAPK3, NCK1, PTK2, STAT5A, and STAT5B) of the same pathway (Fig.3G).
The mechanisms by which a pathogenic mutation in the myosin heavy chain may affect
tyrosine phosphorylation regulation is unknown and warrants further investigation.
On the other hand, pharmacological inhibition of ErbB2 (HER2/neu) with the
inhibitor lapatinib in breast cancer patients treated with doxorubicin increases the risk of
developing heart failure compared to patients treated with doxorubicin alone 35. This
finding suggests that maintaining homeostasis of tyrosine phosphorylation may be
important for regulating cardiomyocyte function and homeostasis.
EGFR1 pathway is central to HCM
The EGFR1 (ErbB1) Pathway seems to play a central role in cardiac hypertrophy in both
Tg models. However, at the site-specific level, the molecular signature (PTMsigDB) of
R403Q-αMyHC had 16 specific peptides altered consistent with the activation of the
EGFR1 pathway. The TgErbB2 mice tyrosine-phosphorylated peptides did not reach
23
statistical significance, with only three specific peptides for PTMsigDB (Fig.3E, G). EGFR
pharmacological inhibition, using AG-1478, protects against Angiotensin II-induced
cardiac hypertrophy in vitro and in vivo 36. The concentric hypertrophy associated with
ErbB2 cardiac-specific overexpression can be reversed by early administration of
Lapatinib, which inhibits EGFR receptor Tyrosine kinase 12 in addition to ErbB2. In this
study, the ErbB2 receptor's pharmacological blockage by the small molecule inhibitor AG-
825 in TgErbB2 adult mice preserved cardiac function without affecting cardiac
hypertrophy. In addition, the specific blockage of ErbB2 by AG-825 reduced myocyte
disarray and cardiac fibrosis. These findings indicate some overlap in cardiac hypertrophy
signaling mediators downstream of EGFR1 and ErbB2, and the sarcomeric mutation
R403Q-αMyHC appears to amplify the EGFR Signaling Pathway preferentially.
Tyrosine phosphorylation is present in multiple proteins associated with the
regulation of cardiac function and disease
A wide variety of other functionally relevant targets were identified in this study as tyrosine
phosphorylated, from sarcomere proteins to Z-disk and desmosome components, focal
adhesion, and adherence junction proteins, membrane receptors, kinases, and
phosphatases. For instance, tyrosine phosphorylation in several Z-disk associated
proteins was noted (For a full list, see Supplementary tables 2-7). Z-disk proteins are
crucial for muscle contraction and mechanical stress, growth, and metabolic signaling 37.
Also, the alteration in the phosphorylation levels of the desmosome key component
Plakophilin-2 protein (Pkp2) peptide Pkp2-Y119 was noted in both mouse models, up-
regulation in R403Q-aMyHC Tg and down-regulation in TgErbB2. The functional effect of
24
up- or down-regulation of Pkp2-Y119 phosphorylation is not known. However, Pkp2
homozygous deletion disrupts heart architecture and is lethal in the embryo 38. In the
heart, Pkp2 is required for the assembly of the desmosome and the PKC activity 39.
Autosomal dominant mutations in this gene are responsible for 25% to 50% of
arrhythmogenic cardiomyopathy (ARVC). Interestingly, TgErbB2 mice have increased
susceptibility to arrhythmias and myofibrillar disarray 16, similar to patients with myosin
mutations and HCM. Pkp-Y119 phosphorylation changes could impact the phenotype.
Bioinformatic Identification of Potentially Activated Kinases that are Drug Targets
The in silico kinase-substrate enrichment analysis (KSEA) implicated a marked
downregulation of members of canonical MAPK Pathway downstream of k-Ras in
TgErbB2 mice, whereas, in R403Q-αMyHC mice, an up-regulation of Focal Adhesion,
VEGF, and PDGFR-beta signaling pathways (SRC, LYN, LCK, JAK2, INSR, MAPK1, and
HCK) was observed. More importantly, modularity-base scoring (MoBas) analysis
demonstrated protein-protein interaction networks that by PTMsigDB identified
Hepatocyte Growth Factor perturbation (or stimulation), PP2 Perturbation (effect of a c-
Src inhibitor), and EGF perturbation (or stimulation). These data demonstrate that many
targets overlap in both transgenic models of cardiac hypertrophy and although there are
marked differences in the upstream regulators of ErbB2 and myosin heavy chain, many
of the downstream effector molecules are common and can be targeted by small-
molecule inhibitors (designed initially to treat several types of cancer) to block cardiac
hypertrophy.
25
The MAPK pathway is involved in the adaptive and maladaptive response that could lead
to heart hypertrophy (for review 40). The RAS-RAF-MEK-ERK signaling pathway is an
attractive target for therapeutic intervention in oncology, and several selective RAF and
MEK small molecule inhibitors have been tested in clinical trials 41. The present study
found increased phosphorylation at MAPK1-Y185, which activates the kinase, in R403Q-
αMyHC, and MAPK1 activity directly relates to heart hypertrophy 42. c-Src figures as one
of the potential regulators for the phosphotyrosine proteome changes observed in
R403Q-αMyHC because it phosphorylates the EGFR receptor upstream and
phosphorylates Stat, among other targets, downstream. c-Src affects the response to
mechanical cardiomyocyte stretching by triggering a cascade of intracellular signaling in
cardiomyocytes towards a hypertrophic response 43,44. Also, c-Src phosphorylates PXN-
Y118 45, and this site had a 25-fold increase in phosphorylation in R403Q-αMyHC mice.
Interestingly, c-Src mediates the activation of MAPK1 and MAPK3 in response to
pressure overload 43. Notably, a previous study has shown that pressure overload-
induced cardiac hypertrophy is exacerbated in R403-αMyHC Tg mice 46, suggesting that
the mechanism by which R403-αMyHC mutation produces heart hypertrophy might be by
sensitizing cells to pressure-overload induced signaling via c-Src.
R403Q-αMyHC mice displayed enhanced JAK2, STAT5A, and STAT5B phosphorylation
in the activation sites (Y570, Y694, and Y699, respectively), which indicates not only
activation of MAPK signaling but also activation of JAK-STAT signaling. Jak-Stat
Signaling: IL-6 pathway is activated in response to the IL-6 family of cytokines (IL-6,
cardiotrophin 1, and leukemia inhibitor factor), cross-talks with the EGFR pathway, and is

26
involved in cardiac hypertrophy. This pathway has cardioprotective effects, but chronic
activation may lead to heart hypertrophy (for review 40). Vakrou et al. performed a pathway
analysis on miRNA profiles of R403Q-αMyHC. They found similarities with the findings
described in this work (For IPA data, see Supplementary Fig.S4, Supplementary Table
9), such as overactivation of integrin-linked kinase (ILK), IL-8, Rho family GTPase, PAK,
CXCR4, actin cytoskeleton, and cardiac hypertrophy signaling pathways 47. It is known
that the integrin-linked kinase signaling pathway is over-activated in heart hypertrophy 48.
Altogether, these results suggest an essential involvement of Tyrosine phosphorylation
regulation in myofilaments and other cardiac proteins. The insight gained from these
studies could inform new therapeutic approaches in sarcomere mutation related HCM as
well as potentially other conditions associated with HCM.
Limitations & Studies in Perspective
The studies were limited to two transgenic mouse models that develop cardiac
hypertrophy; other models of sarcomere mutations or pressure overload such as aortic
banding could be explored and compared. Some relevant tyrosine-phosphorylated sites
might be missed due to their low stoichiometry and technical challenges. This problem
is particularly true for membrane-bound proteins, which are difficult to evaluate in
phosphoproteomic studies.
Conclusions
This study reveals that altered patterns of Tyrosine phosphorylation are striking in two
separate models of hypertrophic cardiomyopathy. Moreover, despite some shared sites,
27
etiologically different forms of HCM may harbor specific tyrosine phosphorylation
signatures. This evidence, combined with inhibition of a specific receptor tyrosine kinase
using tyrphostin AG-825, can reverse cardiomyocyte disarray, thus preserving function in
a TgErB2 mouse HCM model, could rationalize approaches to manipulate the Tyr
phosphoproteome as a therapeutic approach for HCM in general. Furthermore, these
studies indicate that tyrosine kinase inhibitors, now used broadly in cancer therapies, may
change cardiac function by directly modifying the heart's tyrosine kinase profile.
METHODS
Western blot
Whole heart lysates from Heat Stabilized Tissue were resuspended in 1% SDS buffer,
10-15 µg were separated by SDS-PAGE, and transferred to nitrocellulose membranes.
Membranes were blocked with 5% BSA in TBS-T buffer (20 mmol/L Tris pH 7.4, 150
mmol/L NaCl and 0.05% Tween 20) for 1h at room temperature, then were incubated with
primary antibody (Anti-pTyr mouse monoclonal 1:2000, Anti-SRC, Anti-pSRC Y416, Anti-
GAPDH 1:1000 dilution, Cell Signaling, Anti-cTnI 1:5000) at 4°C overnight. After washing
them five times, the secondary antibody (goat anti-mouse-HRP, goat Anti-mouse IRDyeÒ
800CW or goat Anti-rabbit IRDyeÒ 680 LT 1:10,000) was added and incubated for 45
min. Then, the membranes were developed with super signal West Pico
Chemiluminescent Substrate (Thermo), and the immunoreactive bands were detected by
chemiluminescence system (Bio-Rad) or by Odyssey (Li-Cor). The images were obtained
with Odyssey Software, and the quantifications were performed with Image J software.
28
Label-Free Proteomics
Sample Preparation Label-Free: All protocols were performed following the "Guide for
the Use and Care of Laboratory Animals" published by the National Institutes of Health
and the Institutional Animal Care and Use Committee's approval. To establish breeding
colonies, the TgErbB2 and R403Q-αMyHC mice were obtained from Dr. K. Gabrielson
and Dr. L. A. Leinwand, respectively 16,17. Mice were anesthetized with sodium
pentobarbital IP (75 mg/kg) or isoflurane (5%) overdose; the hearts were quickly
dissected, followed by thermal stabilization (Denator T1 Heat Stabilizor, Sweden) and
stored at -80°C until analyzed. TgErbB2 and R403Q-αMyHC mice hearts (n=5 per group)
were processed in parallel. To obtain whole heart lysates, cardiac ventricles (~200 mg)
were homogenized on ice-cold buffer: 20 mM HEPES, pH 7.6, 1mM, 1.5 mM sodium
pyrophosphate, PhosStop, and 9M urea at 10 μl/mg (wet weight of tissue). The
homogenate was cooled on ice, followed by brief micro-tip sonication on ice,
centrifugation at 10,000 × g for 15 min at 4 °C. The supernatant was retrieved, and protein
concentration was determined by the method of Lowry (Bio-Rad).
Trypsin Digestion: Protein from heart lysates was reduced in 5 mM of dithiothreitol
(DTT), 60 °C for 20 minutes, and alkylated in 10 mM iodoacetamide (IDA) at room
temperature for 15 minutes in the dark. Each sample (30mg per mouse, n=5 mice per
genotype) was digested with Proteomics grade Trypsin (Promega) at a ratio of 1:200 in
2M urea, 20mM HEPES buffer, pH 8.0 at room temperature overnight. The digestion was
terminated with trifluoroacetic acid (1% TFA). Samples were centrifuged (5 min at 1800g),
and supernatants were desalted by solid-phase extraction (SepPak C18 10cc cartridge,
Waters). Elutes were lyophilized for three days at -20°C.
29
Enrichment of Tyrosine Phosphopeptides: A total of 150 mg of trypsinized peptides
per genotype were pooled and enriched for pTyrosine, as previously described 49.
Lyophilized peptides were mixed in 1.4 ml immunoprecipitation buffer (IAP buffer 50mM
MOPS, pH 7.2, 10mM sodium phosphate, 50mM NaCl, pH 7.0. A stock solution of protein
agarose G beads (Santa Cruz Biotechnology) 80μL of slurry were conjugated with 300μg
of Phospho-Tyrosine Mouse monoclonal antibody (p-Tyr-100, Cell Signaling
Technology). The beads-Anti-p-Tyr antibody conjugate was transferred to the peptide's
tube and incubated with gentle rotation for 2h at 4°C. The beads were washed and eluted
with 55 μl and 45 μl of 0.15% trifluoroacetic acid (TFA), respectively. The two elution
yields were pooled. The resulting peptide mixtures were purified by solid-phase extraction
(stage tips C18, Thermo Scientific). The samples were dried by vacuum centrifugation.
This approach was repeated three times with samples from all three groups run in parallel,
15 hearts per genotype in three technical replicates.
LC-MS/MS Analysis: Phosphopeptides were dissolved in 10μl of 0.1% TFA, 2%ACN
(v/v) followed by RF-HPLC-ESI-MS/MS analysis. Phosphopeptides were separated on a
C18 reversed-phase column with a linear gradient of acetonitrile (4−40%) for 120 min and
then analyzed on an LTQ-Orbitrap Elite MS (ThermoFisher Scientific) with neutro loss
triggered HCD.
Peptide Identification, Quantification, and Statistics: Raw MS data were searched
with Mascot 2.3, and label-free quantification with MS1 extracted ion chromatograms
were performed using MaxQuant software. For statistical analysis, we followed the
workflow of Foster et al. 21, with few modifications. First, Partek software was used to
calculate the p-values, q-values, fold change, and ratio for each peptide intensity.
30
Phosphosites with less than 50% of missing density values were subjected to statistical
analysis and the reminding missing values were filled with the K-nearest neighbors. Then,
a normalization of the Log2 densities by median subtraction and determined the fold-
change, ratio, and statistical significance (q and p values), from each of the selected
phosphosites of the data set. The volcano plots were made with GraphPad Prism 7®.
Unsupervised principal component analysis (PCA) was used in both data sets separately
with Partek® software. Data set segregated along with each component concerning the
pTyr abundance (normalized, mean=0, variance=1). For K-mean clustering and
unsupervised hierarchical clustering, Spotfire® software was used.
Tandem Mass Tagging Phospho Tyrosine Proteomics
Sample Preparation and TMT pTyr Enrichment: Myofilament proteins (~7 mg) from
mouse heart were resuspended in 8 M urea and 50 mM triethylammonium bicarbonate
(TEAB) (Sigma) followed by reduction with 10 mM dithiothreitol (Sigma) at room
temperature for 1 h and alkylation with 30 mM iodoacetamide (Sigma) for 20 minutes
in the dark. The protein samples were then digested overnight at 37 °C using
sequencing grade trypsin (1:50) (Promega). Tryptic peptides were desalted and labeled
with 6-plex isobaric tandem mass tags (TMT) (Thermo Scientific) according to
manufacturer's instructions. The labeling reaction was carried out for 1 hour at room
temperature, followed by quenching with 100 mM Tris.HCl (pH 8.0). The digested and
labeled peptides were pooled and desalted with C18 SEP-PAK (Waters), followed by
pTyrsoine enrichment using PTMScan® Phospho-Tyrosine Rabbit mAb (P-Tyr-1000) kit
(Cell Signaling Technology). Briefly, the desalted peptides were reconstituted in 1.4 ml
31
of immuno-affinity purification (IP) buffer containing 50 mM MOPS pH 7.2, 10 mM
sodium phosphate, 50 mM NaCl. Anti-phosphotyrosine antibody (P-Tyr-1000, Cell
Signaling Technology) was mixed with peptide solution and incubated on a rotator at
4°C for 2 h. After incubation, the beads were washed with IP buffer and water for two
and three times, respectively. The phosphotyrosine peptides were eluted using 0.1%
TFA. The eluted peptide samples were desalted using C18 STAGE tips, vacuum dried,
and kept at −80°C before LC-MS analysis. From flow-through, a quantification of the full
proteome was made to serve as a reference for pTyr proteome findings.
LC-MS/MS Analysis: The phosphotyrosine peptides were analyzed on Orbitrap Fusion
Lumos Tribrid (Thermo Scientific, San Jose, CA, USA) coupled with Easy-nanoLC 1200
nanoflow liquid chromatography system (Thermo Scientific). The peptides from each
fraction were reconstituted in 10% formic acid and loaded on Acclaim PepMap100
Nano Trap Column (100 μm × 2 cm) (Thermo Scientific) packed with 5 μm C18 particles
at a flow rate of 5 μl per minute. Peptides were resolved at 250 nl/min flow rate using a
linear gradient of 10 to 35% solvent B (0.1% formic acid in 95% acetonitrile) over
95 minutes on the EASY-Spray column (50cm x 75µm ID, PepMap RSLC C18, and 2µm
C18 particles) (Thermo Scientific) and it was fitted on EASY-Spray ion source that was
operated at 2.0 kV voltage. Mass spectrometry analysis was carried out in a data-
dependent manner with full scans in the range of m/z 350 to 1500. Both MS and MS/MS
were acquired and measured using Orbitrap mass analyzer. Full MS scans were
measured at a resolution of 120,000 at m/z 200. Precursor ions were fragmented using
a higher-energy collisional dissociation method and detected at a mass resolution of
30,000 at m/z 200.
32
Peptide search, Identification, and Statistics: MaxQuant 1.5, or the most current
version, was used for quantitation and identification against a mouse RefSeq database
(version 78) supplemented with frequently observed contaminants. The search
parameters used are as follows: a) trypsin as a proteolytic enzyme (with up to two
missed cleavages) b) peptide mass error tolerance of 10 ppm; c) fragment mass error
tolerance of 0.02 Da; d) Carbamidomethylation of cysteine (+57.02Da) and TMT tags
(+229.16 Da) on lysine residue and peptide N-termini as fixed modification and
oxidation of methionine (+15.99 Da) and phosphorylation of serine/threonine/tyrosine
(+ 79.96 Da) as variable modifications. Two missed cleavages were allowed and 'match
between runs' was enabled. Peptides and proteins were filtered at a 1% false discovery
rate. Proteins with a q-value lower than 0.05 will be considered as differentially
expressed with statistical significance. In a complementary way, R software was used.
A two-sided t-test and the moderated p-values and q-values calculation was performed
using an algorithm developed by Herbrich et al 50.
Systems Biology Analysis
Statistical analysis of the label-free data set was performed using Perseus software 51.
Peptides with less than 50% of detection were filtered and the missing values of the
intensities of the reminding peptides were filled with k-nearest neighbors. Then, the
log2 intensities were normalized by mean subtraction subsequently ANOVA and false
discovery rate calculations. The K-mean clustering with Spotfire, 4 clusters were made
using correlation as similarity measurement and data centroid based search. A
heatmap was used to visualize the unsupervised hierarchical clustering of proteins with
p-value <0.05 by ANOVA test.
33
The web-based software Ingenuity Pathway Analysis (IPA) was used for both data sets
for pathway analysis. The results obtained were uploaded to IPA software. The Uniprot
Accession ID was selected as an identifier for each site, and the cut of values for each
intensity was a p-value < 0.05 and an absolute fold change of 2. Interaction networks
were generated, including endogenous chemicals with 70 molecules per network and
25 networks per analysis. All node types and data sources were selected, considering
all experimentally observed and predicted (high and moderate confidence) in all
species.
Pathway Enrichment Analysis: The hypergeometric p-value was used to identify the
processes that are significantly enriched in the proteins and phosphosites that are
differentially phosphorylated between case and control samples. For this purpose,
MsigDB 24 was used to analyze the protein level pathways and PTMsigDB 25 to analyze
the processes at the site level. The population/background for which the enrichment is
calculated against is restricted to all the proteins in which their sites are quantified in the
phosphoproteomics experiment, rather than all universally known proteins/phosphosites.
Kinase-Substrate Enrichment Analysis (KSEA): Kinase Substrate Enrichment
Analysis seeks to identify kinases whose targets exhibit significantly altered
phosphorylation levels in a given condition. KSEA scores each kinase k with a set of
substrates S as follows:
𝑠𝑐𝑜𝑟𝑒(𝑘) = (𝑃,! − 𝑃,) ∗ /|𝑆|
𝜎
34
Where, 𝑃,!Denotes the average log" 𝑓of fold change of all the substrates of kinase k, and
𝑃, and 𝜎 represent the average and standard deviation of log" 𝑓of fold change of all the
identified phosphosites in the dataset, respectively. KSEA was performed on the identified
modules by restricting S to the substrates in the module instead of all substrates in the
dataset. The data provided by PhosphoSitePLUS 31 was used as the reference for kinase-
substrate associations. This tool is also available to download from
compbio.case.edu/phosphoxplorer.
Module Identification: First, networks were created in which nodes represent proteins
and edges represent the protein-protein interaction (PPI) obtained from BioGRID 22,52.
The proteins were assigned a score in the networks by computing the average fold
change of phosphosites residing on each protein obtained from experiments individually
(i.e., Ntg, TgErbB2, and R403Q-aMyHC Tg). Then MoBaS 22 was applied to identify sub-
networks of proteins that are highly connected and differentially phosphorylated. For
visualization of subnetworks, if a protein in one dataset is not identified in another dataset,
the node is represented in grey color.
Echocardiogram: Cardiac morphology and function were assessed by transthoracic
echocardiography using a high-resolution high-frequency system (Vevo 2100,
VisualSonics, Canada) equipped with 40 MHz ultrasound probe in conscious mice as
described previously 22,53. Mechanical and chemical chest hair removal was performed
by shaving and using a commercially available depilatory agent. Core temperature,
monitored via a rectal probe, was maintained at 36.5-37ºC using a heating lamp.
Parasternal long and short-axis views of the heart were captured in both B-and M-modes
35
at optimized frame rates. LV end-diastolic (LVIDd, mm) and end-systolic (LVIDs, mm)
internal diameters, the end-diastolic wall thickness of both interventricular septum (IVS,
mm) and LV posterior wall (LVPW, mm), LV ejection fractions (EF, %) and fractional
shortening (FS, %) were measured using M-Mode in long-axis view. Relative wall
thickness (RWT), a measure of hypertrophy, was calculated as IVSd+LVPWd/LVID.
Pulsed-Doppler recordings at the mitral inflow, left ventricular outflow, and basal septum
was recorded. Digital images were stored and analyzed off-line using commercially
available Vevo LAB software (VisualSonics, Canada). An experienced echocardiography
technician blinded to experimental groups performed all the measurements.
36
References
1 Hershberger, R. E. et al. Genetic evaluation of cardiomyopathy: a clinical practiceresource
of the American College of Medical Genetics and Genomics (ACMG). Genetics in
Medicine 20, 899-909, doi:10.1038/s41436-018-0039-z (2018).
2 Sørensen, L. L. et al. Echocardiographic Characterization of a Murine Model of
Hypertrophic Obstructive Cardiomyopathy Induced by Cardiac-specific Overexpression of
Epidermal Growth Factor Receptor 2. Comparative medicine 66, 268-277 (2016).
3 Wende, A. R. Post-translational modifications of the cardiac proteome in diabetes and heart
failure. Proteomics. Clinical applications 10, 25-38, doi:10.1002/prca.201500052 (2016).
4 Marrocco, V. et al. PKC and PKN in heart disease. Journal of molecular and cellular
cardiology 128, 212-226, doi:10.1016/j.yjmcc.2019.01.029 (2019).
5 Hanft, L. M. et al. Molecule specific effects of PKA-mediated phosphorylation on rat
isolated heart and cardiac myofibrillar function. Archives of biochemistry and biophysics
601, 22-31, doi:10.1016/j.abb.2016.01.019 (2016).
6 Bilchick, K. C. et al. Heart failure-associated alterations in troponin I phosphorylation
impair ventricular relaxation-afterload and force-frequency responses and systolic
function. American Journal of Physiology-Heart and Circulatory Physiology 292, H318-
H325, doi:10.1152/ajpheart.00283.2006 (2007).
7 Ramirez-Correa, G. A., Cortassa, S., Stanley, B., Gao, W. D. & Murphy, A. M. Calcium
sensitivity, force frequency relationship and cardiac troponin I: Critical role of PKA and
PKC phosphorylation sites. Journal of Molecular and Cellular Cardiology 48, 943-953,
doi:https://doi.org/10.1016/j.yjmcc.2010.01.004 (2010).
8 Meng, F. et al. Relationship between cardiac protein tyrosine phosphorylation and
myofibrillogenesis during axolotl heart development. Tissue and Cell 35, 133-142,
doi:https://doi.org/10.1016/S0040-8166(03)00012-0 (2003).
9 Wade, F., Belhaj, K. & Poizat, C. Protein tyrosine phosphatases in cardiac physiology and
pathophysiology. Heart failure reviews 23, 261-272, doi:10.1007/s10741-018-9676-1
(2018).
10 Tartaglia, M. et al. Mutations in PTPN11, encoding the protein tyrosine phosphatase SHP-
2, cause Noonan syndrome. Nature Genetics 29, 465-468, doi:10.1038/ng772 (2001).
11 Princen, F. et al. Deletion of Shp2 tyrosine phosphatase in muscle leads to dilated
cardiomyopathy, insulin resistance, and premature death. Mol Cell Biol 29, 378-388,
doi:10.1128/mcb.01661-08 (2009).
12 Nguyen, T. D. et al. Increased Protein Tyrosine Phosphatase 1B (PTP1B) Activity and
Cardiac Insulin Resistance Precede Mitochondrial and Contractile Dysfunction in
Pressure-Overloaded Hearts. Journal of the American Heart Association 7, e008865,
doi:10.1161/JAHA.118.008865 (2018).
13 Wade, F. et al. Deletion of low molecular weight protein tyrosine phosphatase (Acp1)
protects against stress-induced cardiomyopathy. J Pathol 237, 482-494,
doi:10.1002/path.4594 (2015).
14 Zhang, P. et al. Multiple reaction monitoring to identify site-specific troponin I
phosphorylated residues in the failing human heart. Circulation 126, 1828-1837,
doi:10.1161/CIRCULATIONAHA.112.096388 (2012).
37
15 Sysa-Shah, P. et al. Bidirectional cross-regulation between ErbB2 and β-adrenergic
signalling pathways. Cardiovascular research 109, 358-373, doi:10.1093/cvr/cvv274
(2016).
16 Sysa-Shah, P. et al. Cardiac-specific over-expression of epidermal growth factor receptor
2 (ErbB2) induces pro-survival pathways and hypertrophic cardiomyopathy in mice. PloS
one 7, e42805-e42805, doi:10.1371/journal.pone.0042805 (2012).
17 Vikstrom, K. L., Factor, S. M. & Leinwand, L. A. Mice expressing mutant myosin heavy
chains are a model for familial hypertrophic cardiomyopathy. Molecular medicine
(Cambridge, Mass.) 2, 556-567 (1996).
18 Lundby, A. et al. Quantitative maps of protein phosphorylation sites across 14 different rat
organs and tissues. Nature Communications 3, 876, doi:10.1038/ncomms1871 (2012).
19 Sathe, G. et al. Phosphotyrosine profiling of human cerebrospinal fluid. Clinical
proteomics 15, 29-29, doi:10.1186/s12014-018-9205-1 (2018).
20 Dey, S., DeMazumder, D., Sidor, A., Foster, D. B. & O'Rourke, B. Mitochondrial ROS
Drive Sudden Cardiac Death and Chronic Proteome Remodeling in Heart Failure. Circ Res
123, 356-371, doi:10.1161/CIRCRESAHA.118.312708 (2018).
21 Foster, D. B. et al. Integrated Omic Analysis of a Guinea Pig Model of Heart Failure and
Sudden Cardiac Death. Journal of Proteome Research 15, 3009-3028,
doi:10.1021/acs.jproteome.6b00149 (2016).
22 Ayati, M., Erten, S., Chance, M. R. & Koyutürk, M. MOBAS: identification of disease-
associated protein subnetworks using modularity-based scoring. EURASIP journal on
bioinformatics & systems biology 2015, 7-7, doi:10.1186/s13637-015-0025-6 (2015).
23 Cirillo, E., Parnell, L. D. & Evelo, C. T. A Review of Pathway-Based Analysis Tools That
Visualize Genetic Variants. Front Genet 8, 174-174, doi:10.3389/fgene.2017.00174
(2017).
24 Liberzon, A. et al. Molecular signatures database (MSigDB) 3.0. Bioinformatics (Oxford,
England) 27, 1739-1740, doi:10.1093/bioinformatics/btr260 (2011).
25 Krug, K. et al. A Curated Resource for Phosphosite-specific Signature Analysis. Molecular
& cellular proteomics : MCP 18, 576-593, doi:10.1074/mcp.TIR118.000943 (2019).
26 Gerull, B. et al. Mutations in the desmosomal protein plakophilin-2 are common in
arrhythmogenic right ventricular cardiomyopathy. Nature Genetics 36, 1162,
doi:10.1038/ng1461(2004).
27 Kapplinger, J. D. et al. Distinguishing arrhythmogenic right ventricular
cardiomyopathy/dysplasia-associated mutations from background genetic noise. Journal
of the American College of Cardiology 57, 2317-2327, doi:10.1016/j.jacc.2010.12.036
(2011).
28 den Haan, A. D. et al. Comprehensive desmosome mutation analysis in north americans
with arrhythmogenic right ventricular dysplasia/cardiomyopathy. Circulation.
Cardiovascular genetics 2, 428-435, doi:10.1161/CIRCGENETICS.109.858217 (2009).
29 Murphy, A. M. & Solaro, R. J. Developmental Difference in the Stimulation of Cardiac
Myofibrillar Mg2+-ATPase Activity by Calmidazolium. Pediatric Research 28, 46-47,
doi:10.1203/00006450-199007000-00011 (1990).
30 Casado, P. et al. Kinase-substrate enrichment analysis provides insights into the
heterogeneity of signaling pathway activation in leukemia cells. Sci Signal 6, rs6,
doi:10.1126/scisignal.2003573 (2013).
38
31 Hornbeck, P. V. et al. PhosphoSitePlus, 2014: mutations, PTMs and recalibrations. Nucleic
acids research 43, D512-D520, doi:10.1093/nar/gku1267 (2015).
32 Wiredja, D. D. et al. Phosphoproteomics Profiling of Nonsmall Cell Lung Cancer Cells
Treated with a Novel Phosphatase Activator. Proteomics 17, doi:10.1002/pmic.201700214
(2017).
33 Kartasalo, K. et al. CytoSpectre: a tool for spectral analysis of oriented structures on
cellular and subcellular levels. BMC Bioinformatics 16, 344, doi:10.1186/s12859-015-
0782-y (2015).
34 Green, E. M. et al. A small-molecule inhibitor of sarcomere contractility suppresses
hypertrophic cardiomyopathy in mice. Science (New York, N.Y.) 351, 617-621,
doi:10.1126/science.aad3456 (2016).
35 Valachis, A., Nearchou, A., Polyzos, N. P. & Lind, P. Cardiac toxicity in breast cancer
patients treated with dual HER2 blockade. International Journal of Cancer 133, 2245-
2252, doi:10.1002/ijc.28234 (2013).
36 Peng, K. et al. Novel EGFR inhibitors attenuate cardiac hypertrophy induced by
angiotensin II. Journal of cellular and molecular medicine 20, 482-494,
doi:10.1111/jcmm.12763 (2016).
37 Knöll, R. et al. The Cardiac Mechanical Stretch Sensor Machinery Involves a Z Disc
Complex that Is Defective in a Subset of Human Dilated Cardiomyopathy. Cell 111, 943-
955, doi:https://doi.org/10.1016/S0092-8674(02)01226-6 (2002).
38 Grossmann, K. S. et al. Requirement of plakophilin 2 for heart morphogenesis and cardiac
junction formation. The Journal of cell biology 167, 149-160, doi:10.1083/jcb.200402096
(2004).
39 Bass-Zubek, A. E. et al. Plakophilin 2: a critical scaffold for PKC alpha that regulates
intercellular junction assembly. The Journal of cell biology 181, 605-613,
doi:10.1083/jcb.200712133 (2008).
40 Tham, Y. K., Bernardo, B. C., Ooi, J. Y., Weeks, K. L. & McMullen, J. R. Pathophysiology
of cardiac hypertrophy and heart failure: signaling pathways and novel therapeutic targets.
Archives of toxicology 89, 1401-1438, doi:10.1007/s00204-015-1477-x (2015).
41 Hatzivassiliou, G. et al. RAF inhibitors prime wild-type RAF to activate the MAPK
pathway and enhance growth. Nature 464, 431-435, doi:10.1038/nature08833 (2010).
42 Lorenz, K., Schmitt, J. P., Schmitteckert, E. M. & Lohse, M. J. A new type of ERK1/2
autophosphorylation causes cardiac hypertrophy. Nat Med 15, 75-83,
doi:10.1038/nm.1893 (2009).
43 Wang, S. et al. Src is required for mechanical stretch-induced cardiomyocyte hypertrophy
through angiotensin II type 1 receptor-dependent β-arrestin2 pathways. PloS one 9,
e92926-e92926, doi:10.1371/journal.pone.0092926 (2014).
44 Shradhanjali, A., Riehl, B. D., Kwon, I. K. & Lim, J. Y. Cardiomyocyte stretching for
regenerative medicine and hypertrophy study. Tissue Engineering and Regenerative
Medicine 12, 398-409, doi:10.1007/s13770-015-0010-x (2015).
45 Sachdev, S., Bu, Y. & Gelman, I. H. Paxillin-Y118 phosphorylation contributes to the
control of Src-induced anchorage-independent growth by FAK and adhesion. BMC Cancer
9, 12, doi:10.1186/1471-2407-9-12 (2009).
46 Chen, H. et al. Temporal and morphological impact of pressure overload in transgenic FHC
mice. Frontiers in Physiology 4, doi:10.3389/fphys.2013.00205 (2013).
39
47 Vakrou, S. et al. Allele-specific differences in transcriptome, miRNome, and
mitochondrial function in two hypertrophic cardiomyopathy mouse models. JCI Insight 3,
doi:10.1172/jci.insight.94493 (2018).
48 Lu, H. et al. Integrin-Linked Kinase Expression Is Elevated in Human Cardiac
Hypertrophy and Induces Hypertrophy in Transgenic Mice. Circulation 114, 2271-2279,
doi:10.1161/CIRCULATIONAHA.106.642330 (2006).
49 Martinez-Ferrando, I. et al. Identification of targets of c-Src tyrosine kinase by chemical
complementation and phosphoproteomics. Molecular &amp; Cellular Proteomics,
mcp.M111.015750, doi:10.1074/mcp.M111.015750 (2012).
50 Herbrich, S. M. et al. Statistical inference from multiple iTRAQ experiments without using
common reference standards. Journal of proteome research 12, 594-604,
doi:10.1021/pr300624g (2013).
51 Cox, J. & Mann, M. 1D and 2D annotation enrichment: a statistical method integrating
quantitative proteomics with complementary high-throughput data. BMC Bioinformatics
13 Suppl 16, S12, doi:10.1186/1471-2105-13-S16-S12 (2012).
52 Chatr-Aryamontri, A. et al. The BioGRID interaction database: 2017 update. Nucleic Acids
Res 45, D369-d379, doi:10.1093/nar/gkw1102 (2017).
53 Agrimi, J. et al. Obese mice exposed to psychosocial stress display cardiac and
hippocampal dysfunction associated with local brain-derived neurotrophic factor
depletion. EBioMedicine 47, 384-401, doi:10.1016/j.ebiom.2019.08.042 (2019).
40
ACKNOWLEDGEMENTS
The project described was supported by Grant Number 5 T32 HL 7227-43 from NIH, R01 HL63038 to AMM, K01-HL13368-01 to GARC, R01 HL13691 to NP and R01 HL088649 to KG. Its contents are solely the responsibility of the authors and do not necessarily represent the official views of the NIH. We thank Dr. Leslie Leinwand for facilitating the
Transgenic Mice R403Q-aMyHCTg). This study was partially supported by National Science Foundation of China (81870364) and Shenzhen Sanming Project (SZSM20162057) and Shenzhen Scientific Plan (JCYJ20190809164004023) to MX.
AUTHOR'S CONTRIBUTIONS
MX, XY, XF, AH, XZ, CHN performed experiments, and data analysis, AE, KG, DBF, NP provided statistical support and critical review, KCB, MA provided bioinformatics and statistics support, MX, KCB, NP, AMM and GARC wrote the manuscript, AMM and GARC design the study and supervised the work.
41
FIGURES AND FIGURE LEGENDS
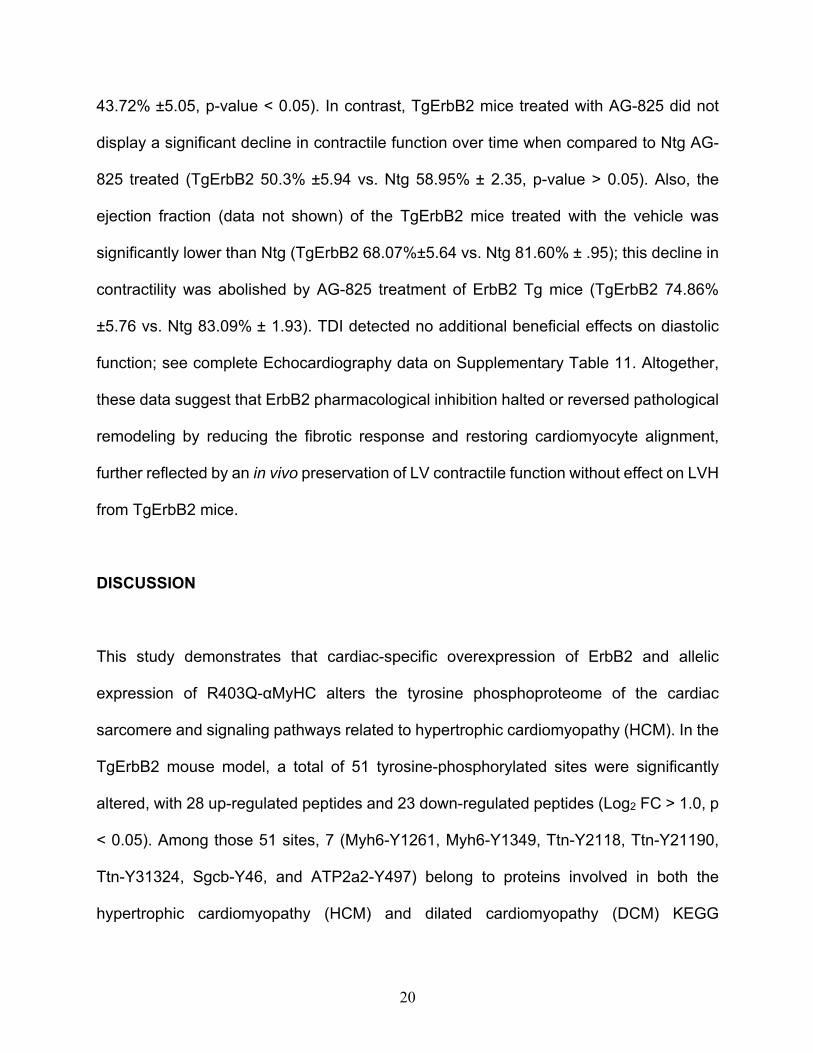
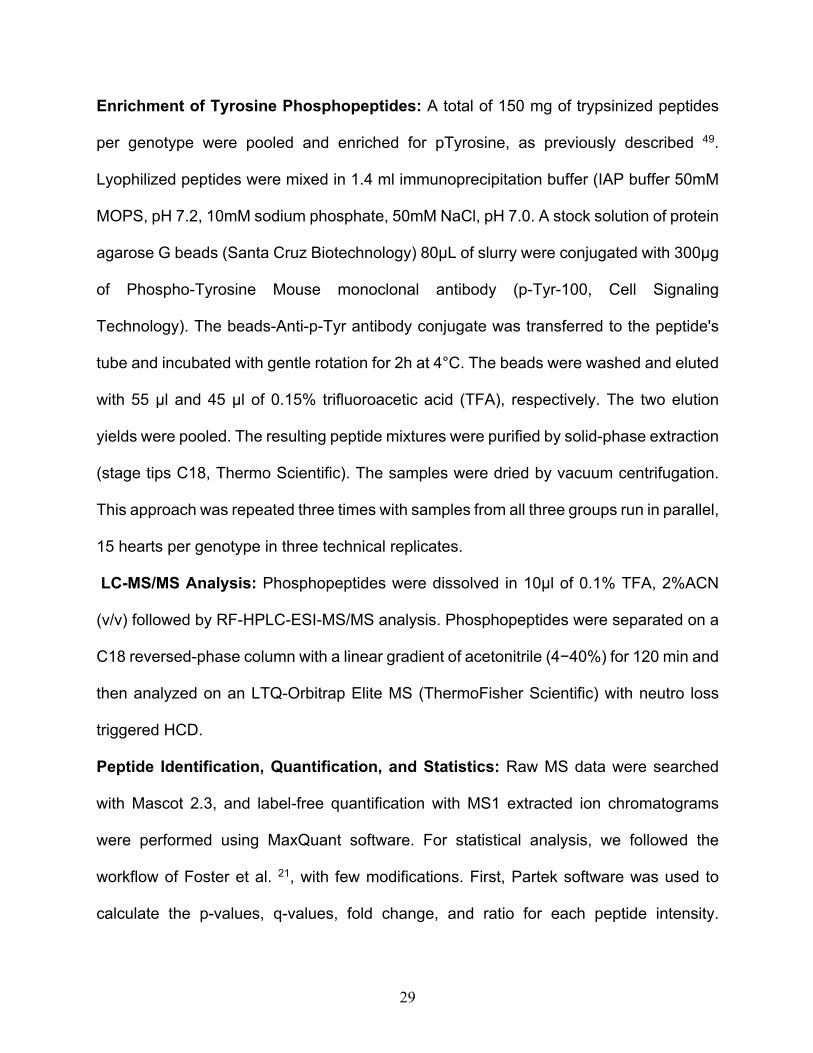
Figure 1. Global Tyrosine phosphorylation and c-Src activation is Enhanced in
Cardiac Hypertrophy associated with ErbB2 overexpression. A) Western Blots show
increased Tyrosine phosphorylation on TgErbB2 mice heart homogenates (Top Panel).
Corresponding total protein loading by Coomassie Blue Staining is shown on the lower
panel. B) Fluorescence densitometry analysis shows that after pTyrosine signal (IRDyeÒ
800CW) was normalized to total cTnI (IRDyeÒ 680 LT), the TgErbB2 mice had a
significant increase (2.61±0.22 vs. 1.26±0.2, p<0.05). C) Western Blots show expression
levels of total Src and p-Src (Tyr 416) and GAPDH as loading control. D), E) Densitometry
analysis revealed that Src levels are elevated in TgErbB2, and p-Src phosphorylation
levels are elevated. Signals were normalized to total GAPDH. However, this finding is
also influenced by the significant increase in total Src expression on TgErbB2 mice.
A C
B
Total Src
p-Src
GAPDH
Ntg TgErbB2
E
Ntg TgErbB2kDa
80
60
50
40
30
20
120
100
80
60
50
40
30
20
120
100
kDa
pTyrAb
Co
om
assie
Sta
in
pTyr Ab
cTnI Ab
Ntg Tg Ntg Tg
*
*
*
D
*
Figure 1
42
Figure 2. Workflow for Global Tyrosine Phosphorylation Profiling by Label-Free
Proteomics. A) Ventricular tissues were rinsed with PBS and subjected to Heat
Stabilization using a T1 Tissue Stabilizor (Denator, Sweden) to maximize phosphorylation
preservation, then snap -frozen in liquid nitrogen and stored at -80°C until further use. B)
Global Proteome Tyrosine Phosphorylation Discovery of Normal and Hypertrophic Hearts
Ntg
ErbB2
Whole Heart Lysates
n=5 Ntg mice
R403Q-aMyHCPooling(150 mg/pergroup)
Denature, Reduce,Alkylate, Tryptic Digest, C18 Desalt& Lyophilization-20°C X 3 days
Agarose G beads +Phospho-Tyrosine Mouse mAb(P-Tyr-100)
LC-MS/MS
UnbiasedDiscovery of
TyrosinePhospho-
Proteome
RP-HPLC
StageTipsC18
LTQ Orbitrap Elite
Heat StabilizationTissue Stabilizer T1 (Denator)
Whole Heart Lysates
n=5 TgErbB2 mice
Whole Heart Lysates
n=5 TgMHCmice
A B C DpTyr EnrichmentHeart Lysates PrepFresh Hearts PTMs Stabilization
& Storage
StageTipsC18
Stage
TipsC18
E F pTyr Sites Newly Discovered
pTyr Sites
Tyrosine Phosphorylated
Proteins
R403Q-aMyHC n=201
TgErbB2 n=211
NTgn=208 R403Q-aMyHC n=352
TgErbB2 n=348
NTgn=363
R403Q-aMyHC n=16
TgErbB2 n=15
NTgn=14
G
H
221
Upregulated
In R403Q-aMyHC
3
Downregulated
In TgErbB2
Upregulated
In TgErbB2
Downregulated
In R403Q-aMyHC
429
Pkp2-Y119Tln-Y70
Tln-Y1116
1% Peptide FDRLog2 transformed
Median SweepPCA, Clustering,
Partek, ANOVAk-means
PhosphoEnrichmentIngenuity Pathways
Analysis (IPA)
MSigDBPTMsigDB
MOBASProtein-Protein
Interaction Network
Kinase Substrate Enrichment
Figure 2
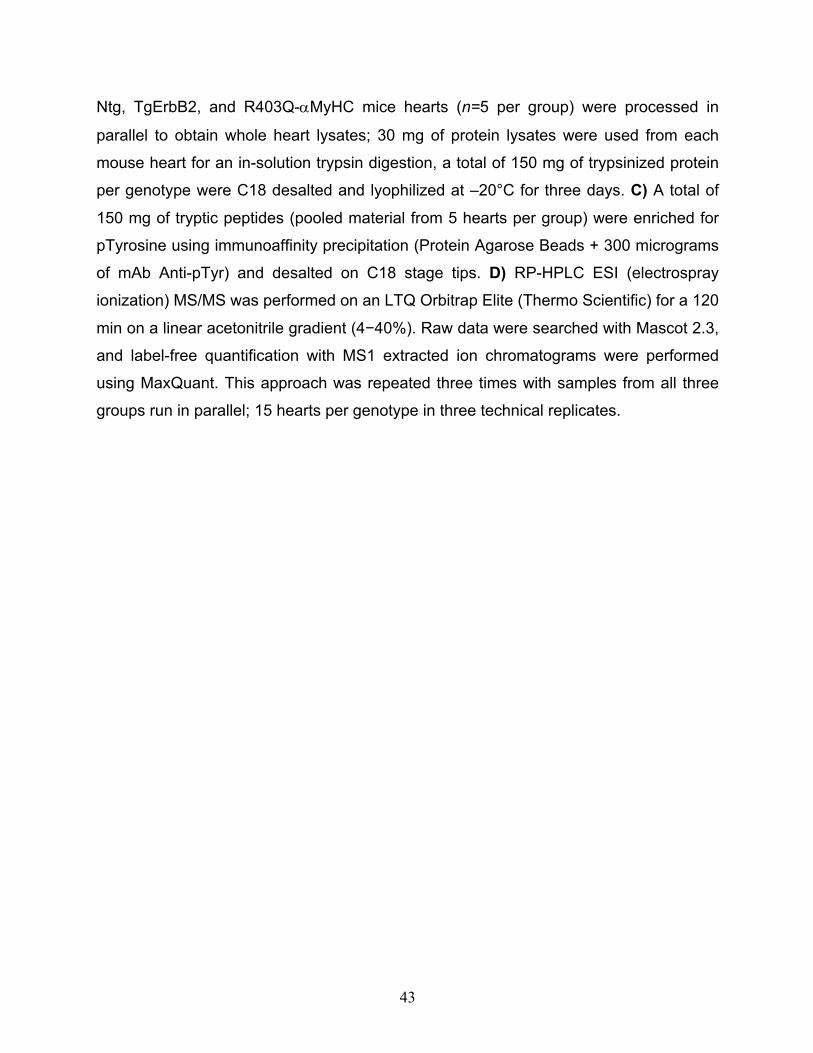
43
Ntg, TgErbB2, and R403Q-aMyHC mice hearts (n=5 per group) were processed in
parallel to obtain whole heart lysates; 30 mg of protein lysates were used from each
mouse heart for an in-solution trypsin digestion, a total of 150 mg of trypsinized protein
per genotype were C18 desalted and lyophilized at –20°C for three days. C) A total of
150 mg of tryptic peptides (pooled material from 5 hearts per group) were enriched for
pTyrosine using immunoaffinity precipitation (Protein Agarose Beads + 300 micrograms
of mAb Anti-pTyr) and desalted on C18 stage tips. D) RP-HPLC ESI (electrospray
ionization) MS/MS was performed on an LTQ Orbitrap Elite (Thermo Scientific) for a 120
min on a linear acetonitrile gradient (4−40%). Raw data were searched with Mascot 2.3,
and label-free quantification with MS1 extracted ion chromatograms were performed
using MaxQuant. This approach was repeated three times with samples from all three
groups run in parallel; 15 hearts per genotype in three technical replicates.
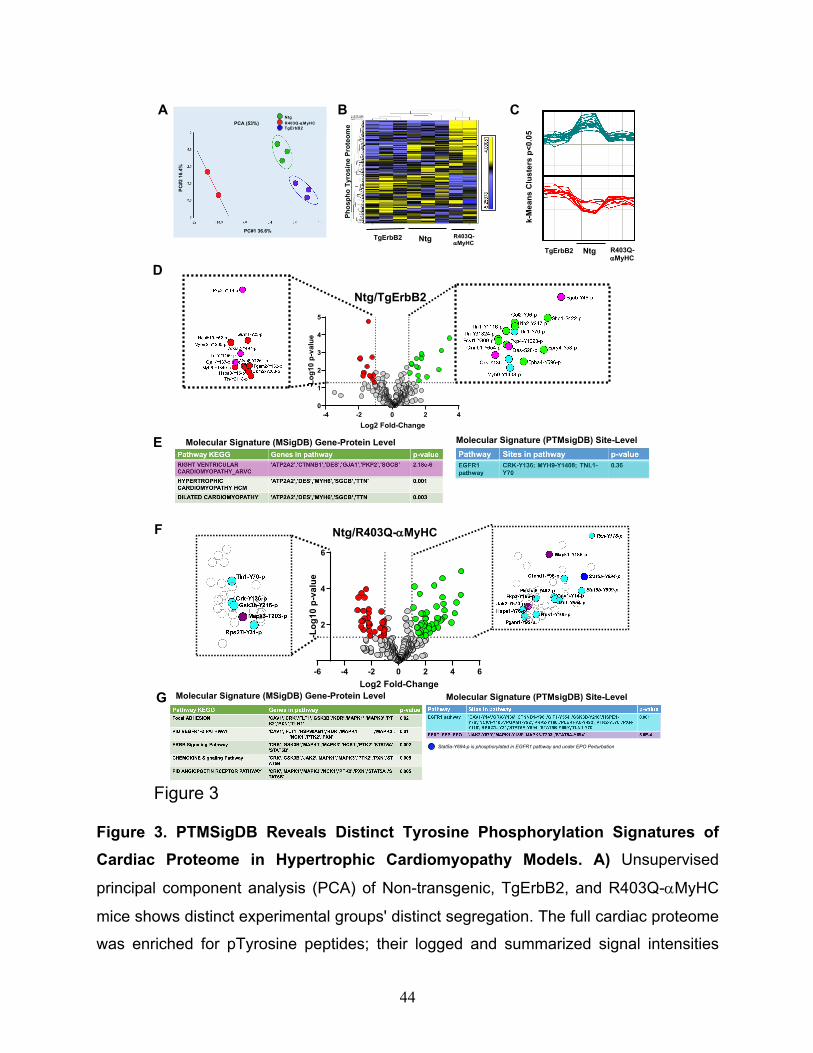
44
Figure 3. PTMSigDB Reveals Distinct Tyrosine Phosphorylation Signatures of
Cardiac Proteome in Hypertrophic Cardiomyopathy Models. A) Unsupervised
principal component analysis (PCA) of Non-transgenic, TgErbB2, and R403Q-aMyHC
mice shows distinct experimental groups' distinct segregation. The full cardiac proteome
was enriched for pTyrosine peptides; their logged and summarized signal intensities
A C
k-M
ea
ns
Clu
ste
rs p
<0
.05
B
Ntg R403Q-aMyHC
TgErbB2
Ph
osp
ho
Tyro
sin
e P
rote
om
e
Ntg
R403Q-aMyHC
TgErbB2
PC#1 36.6%
PC#216.4%
PCA (53%)
Ntg R403Q-aMyHC
TgErbB2
D
Ntg/TgErbB2
E
Ntg/R403Q-aMyHCF
G
-4 -2 0 2 4
0
1
2
3
4
5
Log2 Fold-Change
-Lo
g10
p-v
alu
e
-6 -4 -2 0 2 4 6
2
4
6
Log2 Fold-Change
-Lo
g1
0 p
-va
lue
Stat5a-Y694-p is phosphorylated in EGFR1 pathway and under EPO Perturbation
Molecular Signature (MSigDB) Gene-Protein Level Molecular Signature (PTMsigDB) Site-Level
Molecular Signature (MSigDB) Gene-Protein Level Molecular Signature (PTMsigDB) Site-Level
Figure 3
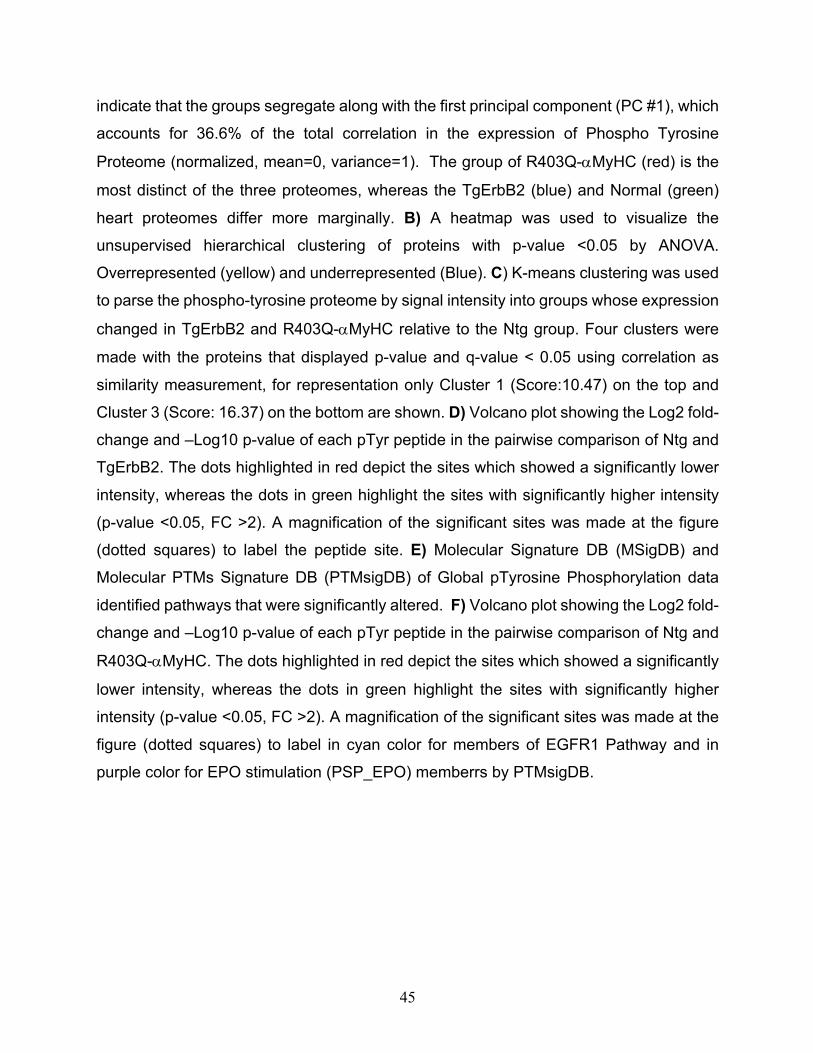
45
indicate that the groups segregate along with the first principal component (PC #1), which
accounts for 36.6% of the total correlation in the expression of Phospho Tyrosine
Proteome (normalized, mean=0, variance=1). The group of R403Q-aMyHC (red) is the
most distinct of the three proteomes, whereas the TgErbB2 (blue) and Normal (green)
heart proteomes differ more marginally. B) A heatmap was used to visualize the
unsupervised hierarchical clustering of proteins with p-value <0.05 by ANOVA.
Overrepresented (yellow) and underrepresented (Blue). C) K-means clustering was used
to parse the phospho-tyrosine proteome by signal intensity into groups whose expression
changed in TgErbB2 and R403Q-aMyHC relative to the Ntg group. Four clusters were
made with the proteins that displayed p-value and q-value < 0.05 using correlation as
similarity measurement, for representation only Cluster 1 (Score:10.47) on the top and
Cluster 3 (Score: 16.37) on the bottom are shown. D) Volcano plot showing the Log2 fold-
change and –Log10 p-value of each pTyr peptide in the pairwise comparison of Ntg and
TgErbB2. The dots highlighted in red depict the sites which showed a significantly lower
intensity, whereas the dots in green highlight the sites with significantly higher intensity
(p-value <0.05, FC >2). A magnification of the significant sites was made at the figure
(dotted squares) to label the peptide site. E) Molecular Signature DB (MSigDB) and
Molecular PTMs Signature DB (PTMsigDB) of Global pTyrosine Phosphorylation data
identified pathways that were significantly altered. F) Volcano plot showing the Log2 fold-
change and –Log10 p-value of each pTyr peptide in the pairwise comparison of Ntg and
R403Q-aMyHC. The dots highlighted in red depict the sites which showed a significantly
lower intensity, whereas the dots in green highlight the sites with significantly higher
intensity (p-value <0.05, FC >2). A magnification of the significant sites was made at the
figure (dotted squares) to label in cyan color for members of EGFR1 Pathway and in
purple color for EPO stimulation (PSP_EPO) memberrs by PTMsigDB.
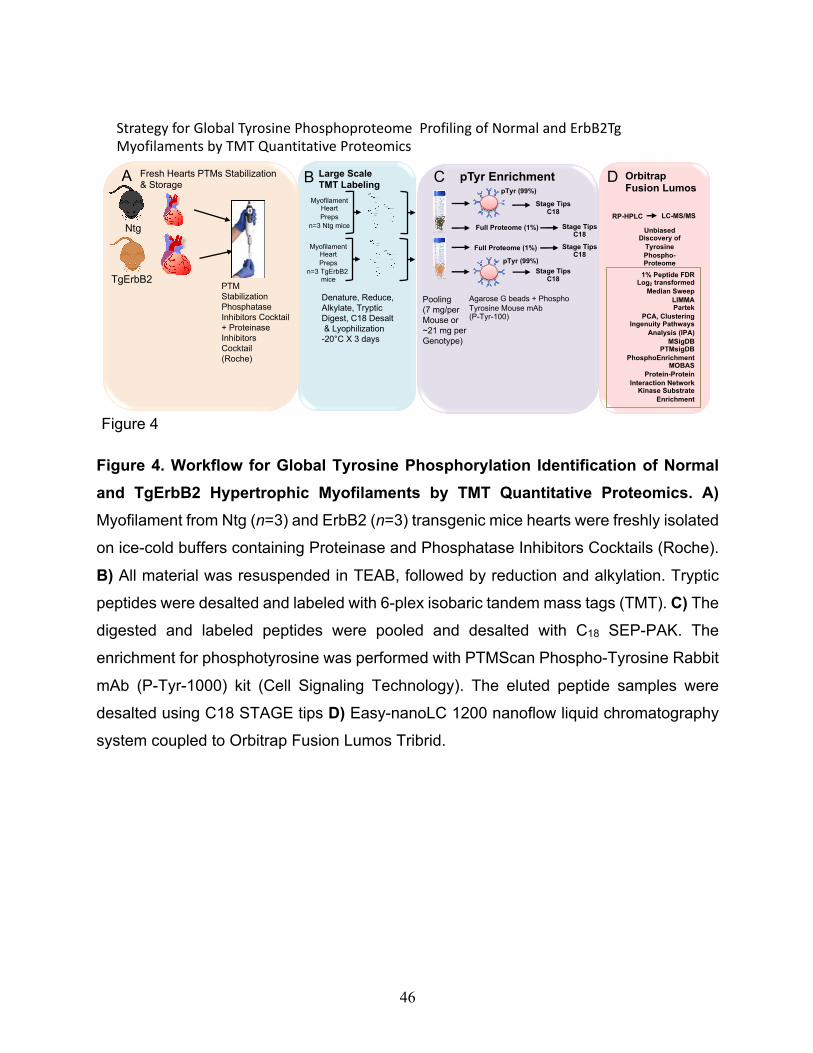
46
Figure 4. Workflow for Global Tyrosine Phosphorylation Identification of Normal
and TgErbB2 Hypertrophic Myofilaments by TMT Quantitative Proteomics. A)
Myofilament from Ntg (n=3) and ErbB2 (n=3) transgenic mice hearts were freshly isolated
on ice-cold buffers containing Proteinase and Phosphatase Inhibitors Cocktails (Roche).
B) All material was resuspended in TEAB, followed by reduction and alkylation. Tryptic
peptides were desalted and labeled with 6-plex isobaric tandem mass tags (TMT). C) The
digested and labeled peptides were pooled and desalted with C18 SEP-PAK. The
enrichment for phosphotyrosine was performed with PTMScan Phospho-Tyrosine Rabbit
mAb (P-Tyr-1000) kit (Cell Signaling Technology). The eluted peptide samples were
desalted using C18 STAGE tips D) Easy-nanoLC 1200 nanoflow liquid chromatography
system coupled to Orbitrap Fusion Lumos Tribrid.
Strategy for Global Tyrosine Phosphoproteome Profiling of Normal and ErbB2Tg
Myofilaments by TMT Quantitative Proteomics
Ntg
TgErbB2
MyofilamentHeart
Preps
n=3 Ntg mice
Pooling
(7 mg/per
Mouse or
~21 mg per
Genotype)
Denature, Reduce,
Alkylate, Tryptic
Digest, C18 Desalt
& Lyophilization
-20°C X 3 days
Agarose G beads + Phospho
Tyrosine Mouse mAb(P-Tyr-100)
Orbitrap
Fusion Lumos
PTM
Stabilization
Phosphatase
Inhibitors Cocktail
+ Proteinase
Inhibitors
Cocktail
(Roche)
MyofilamentHeart
Preps
n=3 TgErbB2 mice
A B C DpTyr EnrichmentLarge Scale
TMT Labeling
Fresh Hearts PTMs Stabilization
& Storage
LC-MS/MS
1% Peptide FDRLog2 transformed
Median Sweep
LIMMAPartek
PCA, ClusteringIngenuity Pathways
Analysis (IPA)
MSigDBPTMsigDB
PhosphoEnrichmentMOBAS
Protein-Protein
Interaction NetworkKinase Substrate
Enrichment
UnbiasedDiscovery of
Tyrosine
Phospho-Proteome
RP-HPLC
Stage TipsC18
Full Proteome (1%)
Full Proteome (1%)
pTyr (99%)
pTyr (99%)
Stage TipsC18
Stage TipsC18
Stage TipsC18
Figure 4
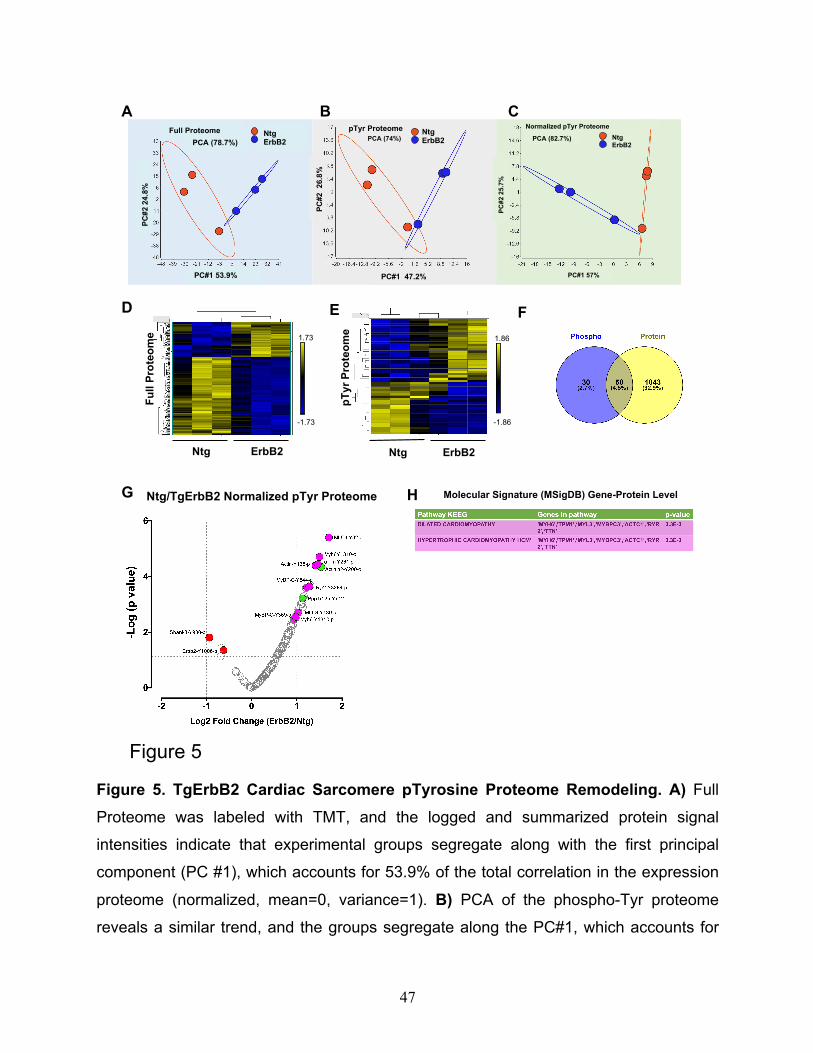
47
Figure 5. TgErbB2 Cardiac Sarcomere pTyrosine Proteome Remodeling. A) Full
Proteome was labeled with TMT, and the logged and summarized protein signal
intensities indicate that experimental groups segregate along with the first principal
component (PC #1), which accounts for 53.9% of the total correlation in the expression
proteome (normalized, mean=0, variance=1). B) PCA of the phospho-Tyr proteome
reveals a similar trend, and the groups segregate along the PC#1, which accounts for
NtgErbB2PCA (78.7%)
PC#1 53.9%
PC#224.8%
Full Proteome NtgErbB2PCA (74%)
PC#1 47.2%
PC#226.8%
pTyr Proteome Normalized pTyr Proteome
NtgErbB2
PCA (82.7%)
PC#1 57%
PC
#2
25
.7%
D E F
Ntg ErbB2
Fu
ll P
rote
om
e 1.73
-1.73
Ntg ErbB2
pT
yr
Pro
teo
me
1.86
-1.86
A CB
G HNtg/TgErbB2 Normalized pTyr Proteome Molecular Signature (MSigDB) Gene-Protein Level
Figure 5
48
47.2% of the correlation. C) Signal intensities of the phospho-Tyr proteome were
normalized to Full Proteome protein expression and analyzed by principal component
analysis. The distinctive signature of pTyr is still apparent by PC along PC#1 and
accounts for 57% of the correlation. D) A heatmap was used to visualize the unsupervised
hierarchical correlation clustering of protein expression and E) pTyr Proteome expression
with p<0.05 by LIMMA moderated 2-samples t-test comparison of TgErbB2 and Ntg
group. F) pTyr Phosphopeptides were matched to Proteins identified in the Full Proteome
set of peptides; the overlap did not vary significantly between matching pTyr Phospho
peptides to a Protein accession number or a Gene ID (Venn Diagram is shown). G)
Volcano plot showing the Log2 fold-change and –Log10 p-value of each pTyr peptide in
the pairwise comparison of Ntg and TgErbB2. The dots highlighted in red depict the sites
which showed a significantly lower intensity, whereas the dots in green highlight the sites
with significantly higher intensity (fold-change >0.5, p-value <0.05, and q-value <0.05).
For clarity of presentation, only some peptides were highlighted. H) Molecular Signature
DataBase (MSigDB) confirmed targets and the involvement of Dilated and Hypertrophic
cardiomyopathy KEEG Pathways also found on the label-free approach for TgErbB2
mice.
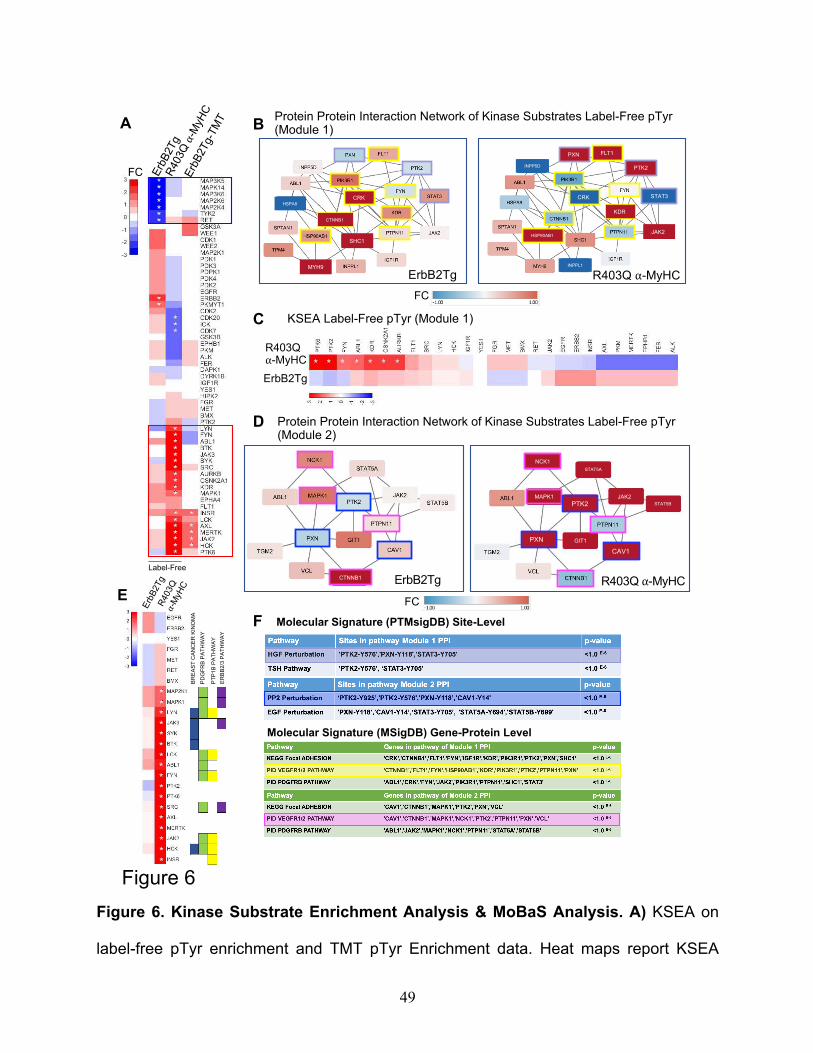
49
Figure 6. Kinase Substrate Enrichment Analysis & MoBaS Analysis. A) KSEA on
label-free pTyr enrichment and TMT pTyr Enrichment data. Heat maps report KSEA
A B
C
D
Protein Protein Interaction Network of Kinase Substrates Label-Free pTyr(Module 1)
Erb
B2Tg
R403Q
⍺-M
yHC
Erb
B2Tg-T
MT
Label-Free
FC
Molecular Signature (MSigDB) Gene-Protein Level
Molecular Signature (PTMsigDB) Site-Level
ErbB2Tg
R403Q ⍺-MyHC
KSEA Label-Free pTyr (Module 1)
Protein Protein Interaction Network of Kinase Substrates Label-Free pTyr(Module 2)
FC
F
ErbB2Tg R403Q ⍺-MyHC
FC
CRK
CTNNB1
SHC1
MYH9
JAK2
FLT1
KDR
HSP90AB1
PXN
PTK2
HSPA8
INPP5D
CRK
INPPL1
STAT3
ErbB2Tg R403Q ⍺-MyHCCTNNB1
NCK1
MAPK1
PXN
PTK2
STAT5A
STAT5B
JAK2
GIT1
CAV1
*******
**
***
***********
********
****
E
Erb
B2Tg
R403Q
⍺-M
yHC
BR
EA
ST
CA
NC
ER
KIN
OM
A
PD
GF
RB
PA
TH
WA
Y
PT
P1B
PA
TH
WA
Y
ER
BB
2/3
PA
TH
WA
Y
*****************
* * * * * * *
Figure 6
50
results according to normalized scores (i.e., TgErbB2/Ntg, R403Q-aMyHC/Ntg, etc.).
Only kinases shared between data sets are included, therefore present in Tg and Ntg.
Asterisks indicate the statistical significance of p <0.05. Red represents a positive score
and blue a negative score. Red rectangle highlights groups of activated kinases that
clustered together and are predominant in R403Q-aMyHC, whereas the blue rectangle
highlights suppressed kinases that clustered and are predominant on TgErbB2. B)
MoBaS identified a tightly interconnected subnetwork involved in growth factors signaling
(VEGF1/2 and Hepatocyte Growth Factor). Represented by the top-scoring Protein-
Protein Interaction (PPI) subnetwork called Module 1 was identified on TgErbB2 label-
free and compared to R403Q-aMyHC. C) KSEA on Module 1 group of substrates. D)
Second top-scoring PPI subnetwork called Module 2 identified on R403Q-aMyHC label-
free and compared to TgErbB2. E) KSEA on Module 2 group of substrates and associated
pathways and specific kinases are denoted with colored squares. F) Results from
PTMsigDB and MSigDB analysis. Color code highlight the pathway and the substrate
involved in the Modules 1 or 2. On PPI modules, each node is a phosphoprotein
represented by its most significant peptide. Node color is based on Log2 fold-change
relative to NTG. The scale is noted by FC and a bar colored from blue to red.
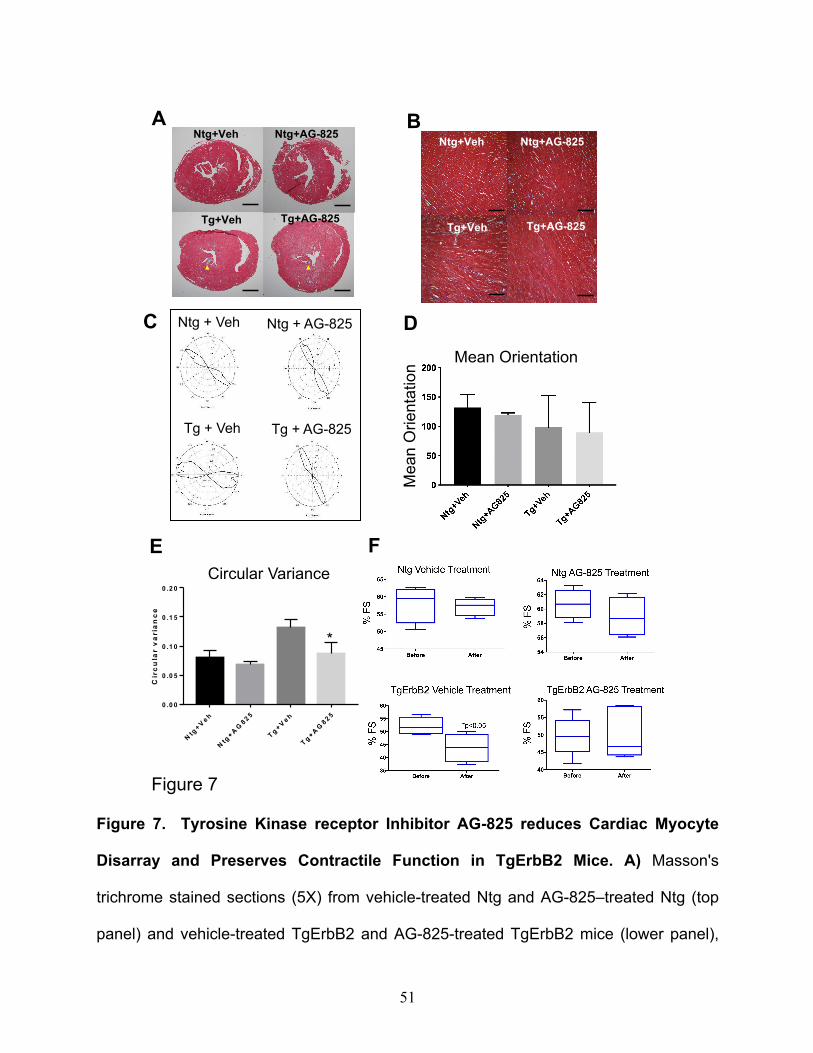
51
Figure 7. Tyrosine Kinase receptor Inhibitor AG-825 reduces Cardiac Myocyte
Disarray and Preserves Contractile Function in TgErbB2 Mice. A) Masson's
trichrome stained sections (5X) from vehicle-treated Ntg and AG-825–treated Ntg (top
panel) and vehicle-treated TgErbB2 and AG-825-treated TgErbB2 mice (lower panel),
Ntg+VehA
Ntg+AG-825
Tg+Veh Tg+AG-825
Ntg+Veh Ntg+AG-825
Tg+Veh Tg+AG-825
B
Ntg + Veh
Tg + Veh
Ntg + AG-825
Tg + AG-825
C
E
D
Ntg
+V
eh
Ntg
+A
G825
Tg
+V
eh
Tg
+A
G825
0 .0 0
0 .0 5
0 .1 0
0 .1 5
0 .2 0
C ir c . v a r ia n c e
Cir
cu
lar v
aria
nc
e
*
F
Mean Orientation
Mean O
rienta
tion
Circular Variance
Figure 7
52
yellow arrowheads point to fibrotic areas. Scale bar 1 mm. B) Masson's trichrome stained
sections (40X) from representative regions of interest (ROI) show increased Fibrosis in
TgErbB2 mice myocardium (Bottom left panel), that fibrosis improved after 2-weeks of
AG-825 Treatment. The same areas were used to determine the level of cardiac myocyte
disarray. This was achieved by analyzing cell orientation using CytoSpectre Software
from Vehicle and AG-825 treated Ntg and TgErbB2 mouse heart sections (scale bar
50µm). C) Plots of the distribution of cardiac cells orientation angles. Note how Ntg angles
are homogeneous and did not change in the group treated with AG-825 (Top panel). In
contrast, Tg treated with vehicle showed less homogenous and different orientation angle,
which confirms cardiomyocyte disarray (bottom left panel). AG-825 treatment reduces
cardiomyocyte disarray, and the orientation plot is similar to AG-825 treated NTG group.
D) Mean orientation angle of cardiac myocytes, and E) Circular variance, another
measure of isotropy, in Ntg and TgErbB2 mice with and without AG-825 treatment (n= 5
animals per condition). Graph bars are expressed as mean ± SD; the ANOVA test
performed statistical comparisons showing a significant improvement of TgErbB2 mice
treated with AG-825 (p-value<0.05). F) Cardiac echocardiography from the four groups
demonstrates that AG-825 treatment for 14 days preserved the contractile function,
estimated as % Fraction Shortening and % Ejection Fraction (not shown), in TgErbB2
mice (Lower right panel). In contrast, TgErbB2 mice treated with the vehicle deteriorated
significantly (Lower left panel, paired t-test, p-value<0.05). Ntg mice contractility was not
affected by vehicle or AG-825 Treatment (Upper Panels).
Figures
Figure 1
Global Tyrosine phosphorylation and c-Src activation is Enhanced in Cardiac Hypertrophy associatedwith ErbB2 overexpression. A) Western Blots show increased Tyrosine phosphorylation on TgErbB2 miceheart homogenates (Top Panel). Corresponding total protein loading by Coomassie Blue Staining isshown on the lower panel. B) Fluorescence densitometry analysis shows that after pTyrosine signal(IRDye® 800CW) was normalized to total cTnI (IRDye® 680 LT), the TgErbB2 mice had a signi�cantincrease (2.61±0.22 vs. 1.26±0.2, p<0.05). C) Western Blots show expression levels of total Src and p-Src(Tyr 416) and GAPDH as loading control. D), E) Densitometry analysis revealed that Src levels areelevated in TgErbB2, and p-Src phosphorylation levels are elevated. Signals were normalized to totalGAPDH. However, this �nding is also in�uenced by the signi�cant increase in total Src expression onTgErbB2 mice
Figure 2
Work�ow for Global Tyrosine Phosphorylation Pro�ling by Label-Free Proteomics. A) Ventricular tissueswere rinsed with PBS and subjected to Heat Stabilization using a T1 Tissue Stabilizor (Denator, Sweden)to maximize phosphorylation preservation, then snap -frozen in liquid nitrogen and stored at -80°C untilfurther use. B) Ntg, TgErbB2, and R403Q-αMyHC mice hearts (n=5 per group) were processed in parallel toobtain whole heart lysates; 30 mg of protein lysates were used from each mouse heart for an in-solutiontrypsin digestion, a total of 150 mg of trypsinized protein per genotype were C18 desalted and lyophilizedat –20°C for three days. C) A total of 150 mg of tryptic peptides (pooled material from 5 hearts per group)were enriched for pTyrosine using immunoa�nity precipitation (Protein Agarose Beads + 300
micrograms of mAb Anti-pTyr) and desalted on C18 stage tips. D) RP-HPLC ESI (electrospray ionization)MS/MS was performed on an LTQ Orbitrap Elite (Thermo Scienti�c) for a 120 min on a linear acetonitrilegradient (4−40%). Raw data were searched with Mascot 2.3, and label-free quanti�cation with MS1extracted ion chromatograms were performed using MaxQuant. This approach was repeated three timeswith samples from all three groups run in parallel; 15 hearts per genotype in three technical replicates.
Figure 3

PTMSigDB Reveals Distinct Tyrosine Phosphorylation Signatures of Cardiac Proteome in HypertrophicCardiomyopathy Models. A) Unsupervised principal component analysis (PCA) of Non-transgenic,TgErbB2, and R403Q-αMyHC mice shows distinct experimental groups' distinct segregation. The fullcardiac proteome was enriched for pTyrosine peptides; their logged and summarized signal intensitiesindicate that the groups segregate along with the �rst principal component (PC #1), which accounts for36.6% of the total correlation in the expression of Phospho Tyrosine Proteome (normalized, mean=0,variance=1). The group of R403Q-αMyHC (red) is the most distinct of the three proteomes, whereas theTgErbB2 (blue) and Normal (green) heart proteomes differ more marginally. B) A heatmap was used tovisualize the unsupervised hierarchical clustering of proteins with p-value <0.05 by ANOVA.Overrepresented (yellow) and underrepresented (Blue). C) K-means clustering was used to parse thephospho-tyrosine proteome by signal intensity into groups whose expression changed in TgErbB2 andR403Q-αMyHC relative to the Ntg group. Four clusters were made with the proteins that displayed p-valueand q-value < 0.05 using correlation as similarity measurement, for representation only Cluster 1(Score:10.47) on the top and Cluster 3 (Score: 16.37) on the bottom are shown. D) Volcano plot showingthe Log2 fold change and –Log10 p-value of each pTyr peptide in the pairwise comparison of Ntg andTgErbB2. The dots highlighted in red depict the sites which showed a signi�cantly lower intensity,whereas the dots in green highlight the sites with signi�cantly higher intensity (p-value <0.05, FC >2). Amagni�cation of the signi�cant sites was made at the �gure (dotted squares) to label the peptide site. E)Molecular Signature DB (MSigDB) and Molecular PTMs Signature DB (PTMsigDB) of Global pTyrosinePhosphorylation data identi�ed pathways that were signi�cantly altered. F) Volcano plot showing theLog2 fold change and –Log10 p-value of each pTyr peptide in the pairwise comparison of Ntg andR403Q-αMyHC. The dots highlighted in red depict the sites which showed a signi�cantly lower intensity,whereas the dots in green highlight the sites with signi�cantly higher intensity (p-value <0.05, FC >2). Amagni�cation of the signi�cant sites was made at the �gure (dotted squares) to label in cyan color formembers of EGFR1 Pathway and in purple color for EPO stimulation (PSP_EPO) memberrs by PTMsigDB.
Figure 4
Work�ow for Global Tyrosine Phosphorylation Identi�cation of Normal and TgErbB2 HypertrophicMyo�laments by TMT Quantitative Proteomics. A) Myo�lament from Ntg (n=3) and ErbB2 (n=3)transgenic mice hearts were freshly isolated on ice-cold buffers containing Proteinase and PhosphataseInhibitors Cocktails (Roche). B) All material was resuspended in TEAB, followed by reduction andalkylation. Tryptic peptides were desalted and labeled with 6-plex isobaric tandem mass tags (TMT). C)The digested and labeled peptides were pooled and desalted with C18 SEP-PAK. The enrichment forphosphotyrosine was performed with PTMScan Phospho-Tyrosine Rabbit mAb (P-Tyr-1000) kit (CellSignaling Technology). The eluted peptide samples were desalted using C18 STAGE tips D) Easy-nanoLC1200 nano�ow liquid chromatography system coupled to Orbitrap Fusion Lumos Tribrid.
Figure 5
TgErbB2 Cardiac Sarcomere pTyrosine Proteome Remodeling. A) Full Proteome was labeled with TMT,and the logged and summarized protein signal intensities indicate that experimental groups segregatealong with the �rst principal component (PC #1), which accounts for 53.9% of the total correlation in theexpression proteome (normalized, mean=0, variance=1). B) PCA of the phospho-Tyr proteome reveals asimilar trend, and the groups segregate along the PC#1, which accounts for 47.2% of the correlation. C)
Signal intensities of the phospho-Tyr proteome were normalized to Full Proteome protein expression andanalyzed by principal component analysis. The distinctive signature of pTyr is still apparent by PC alongPC#1 and accounts for 57% of the correlation. D) A heatmap was used to visualize the unsupervisedhierarchical correlation clustering of protein expression and E) pTyr Proteome expression with p<0.05 byLIMMA moderated 2-samples t-test comparison of TgErbB2 and Ntg group. F) pTyr Phosphopeptideswere matched to Proteins identi�ed in the Full Proteome set of peptides; the overlap did not varysigni�cantly between matching pTyr Phospho peptides to a Protein accession number or a Gene ID (VennDiagram is shown). G) Volcano plot showing the Log2 fold-change and –Log10 p-value of each pTyrpeptide in the pairwise comparison of Ntg and TgErbB2. The dots highlighted in red depict the sites whichshowed a signi�cantly lower intensity, whereas the dots in green highlight the sites with signi�cantlyhigher intensity (fold-change >0.5, p-value <0.05, and q-value <0.05). For clarity of presentation, onlysome peptides were highlighted. H) Molecular Signature DataBase (MSigDB) con�rmed targets and theinvolvement of Dilated and Hypertrophic cardiomyopathy KEEG Pathways also found on the label-freeapproach for TgErbB2 mice.
Figure 6
Kinase Substrate Enrichment Analysis & MoBaS Analysis. A) KSEA on label-free pTyr enrichment andTMT pTyr Enrichment data. Heat maps report KSEA results according to normalized scores (i.e.,TgErbB2/Ntg, R403Q-αMyHC/Ntg, etc.). Only kinases shared between data sets are included, thereforepresent in Tg and Ntg. Asterisks indicate the statistical signi�cance of p <0.05. Red represents a positivescore and blue a negative score. Red rectangle highlights groups of activated kinases that clustered
together and are predominant in R403Q-αMyHC, whereas the blue rectangle highlights suppressedkinases that clustered and are predominant on TgErbB2. B) MoBaS identi�ed a tightly interconnectedsubnetwork involved in growth factors signaling (VEGF1/2 and Hepatocyte Growth Factor). Representedby the top-scoring Protein Protein Interaction (PPI) subnetwork called Module 1 was identi�ed on TgErbB2label free and compared to R403Q-αMyHC. C) KSEA on Module 1 group of substrates. D) Second top-scoring PPI subnetwork called Module 2 identi�ed on R403Q-αMyHC label free and compared to TgErbB2.E) KSEA on Module 2 group of substrates and associated pathways and speci�c kinases are denotedwith colored squares. F) Results from PTMsigDB and MSigDB analysis. Color code highlight the pathwayand the substrate involved in the Modules 1 or 2. On PPI modules, each node is a phosphoproteinrepresented by its most signi�cant peptide. Node color is based on Log2 fold-change relative to NTG. Thescale is noted by FC and a bar colored from blue to red.
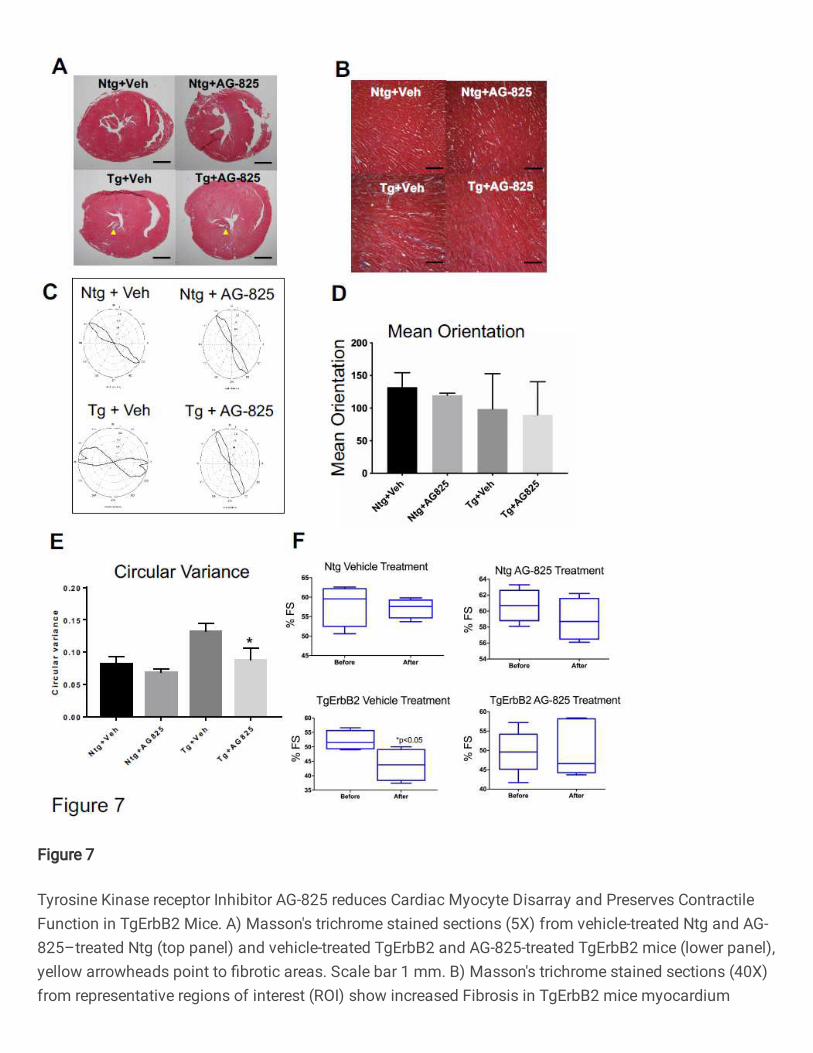
Figure 7
Tyrosine Kinase receptor Inhibitor AG-825 reduces Cardiac Myocyte Disarray and Preserves ContractileFunction in TgErbB2 Mice. A) Masson's trichrome stained sections (5X) from vehicle-treated Ntg and AG-825–treated Ntg (top panel) and vehicle-treated TgErbB2 and AG-825-treated TgErbB2 mice (lower panel),yellow arrowheads point to �brotic areas. Scale bar 1 mm. B) Masson's trichrome stained sections (40X)from representative regions of interest (ROI) show increased Fibrosis in TgErbB2 mice myocardium
(Bottom left panel), that �brosis improved after 2-weeks of AG-825 Treatment. The same areas were usedto determine the level of cardiac myocyte disarray. This was achieved by analyzing cell orientation usingCytoSpectre Software from Vehicle and AG-825 treated Ntg and TgErbB2 mouse heart sections (scale bar50m). C) Plots of the distribution of cardiac cells orientation angles. Note how Ntg angles arehomogeneous and did not change in the group treated with AG-825 (Top panel). In contrast, Tg treatedwith vehicle showed less homogenous and different orientation angle, which con�rms cardiomyocytedisarray (bottom left panel). AG-825 treatment reduces cardiomyocyte disarray, and the orientation plot issimilar to AG-825 treated NTG group. D) Mean orientation angle of cardiac myocytes, and E) Circularvariance, another measure of isotropy, in Ntg and TgErbB2 mice with and without AG-825 treatment (n= 5animals per condition). Graph bars are expressed as mean ± SD; the ANOVA test performed statisticalcomparisons showing a signi�cant improvement of TgErbB2 mice treated with AG-825 (p-value<0.05). F)Cardiac echocardiography from the four groups demonstrates that AG-825 treatment for 14 dayspreserved the contractile function, estimated as % Fraction Shortening and % Ejection Fraction (notshown), in TgErbB2 mice (Lower right panel). In contrast, TgErbB2 mice treated with the vehicledeteriorated signi�cantly (Lower left panel, paired t-test, p-value<0.05). Ntg mice contractility was notaffected by vehicle or AG-825 Treatment (Upper Panels).
Supplementary Files
This is a list of supplementary �les associated with this preprint. Click to download.
SupplementaryFigures.docx
DescriptionofSupplementaryMaterialFiles.docx
SupplementaryTable1.xlsx
SupplementaryTable2.xlsx
SupplementaryTable3.xlsx
SupplementaryTable4.xlsx
SupplementaryTable5.xlsx
SupplementaryTable6.xlsx
SupplementaryTable7.xlsx
SupplementaryTable8.xlsx
SupplementaryTable9.xlsx
SupplementaryTable10.xlsx
SupplementaryTable11.docx
SupplementaryTable12.xlsx