acquisition report 28 january 2013 - vanderbilt university · 2019-01-17 · acquisition report:...
TRANSCRIPT
Acquisition Report The Hain Celestial Group
28 January 2013
2 Acquisition Report: Hain Celestial Group
Group information Lelan Dunavant Amanda Hoffmann Joshua Jelesky Bailey Piercefield Adam Smith
Acquisition Report: Hain Celestial Group 3
Contents
Executive Summary Page 4
Strategic & Cultural Fit Page 5
Value Enhancement Strategies Page 5
Post Acquisition Value of Hain Page 6
Strategy to Convince Hain to Accept Offer Page 7
Appendix A: Hain Integration Model Comparison Page 8
Appendix B: Value Added to Hain Inside Nestle Page 9
Appendix C: Hain Normal Distribution Integration Page 10
Appendix D: Hain Slow Distribution Integration Page 11
Appendix E: Hain Fast Distribution Integration Page 12
Appendix F: Value Added DCF Comparison Page 13
Appendix G: Discount Cash Flow of Suggested Offer Page 14
Appendix H: ROI/Payback Analysis Page 15
References Page 16
4 Acquisition Report: Hain Celestial Group
Executive Summary Nestlé Corporation considers itself the world’s foremost nutrition, health, and wellness company. For 108 years Nestlé has been striving to achieve a set of core principles embodied in the phrase “Good Food, Good Life.” Nestlé, having identified itself as having an “unmatched product and brand portfolio” and focus on “nutrition health and wellness” as a primary growth driver, would continue building both aspects of their brand through the acquisition of The Hain Celestial Group (Hain). We have identified three primary synergies that leverage the immense resources at Nestlé’s disposal to provide value to Hain. It is estimated Nestlé would realize a 32% return on investment over 10 years in the purchase of Hain for 13 billion US dollars (Appendix H). Hain has been identified as having convergent organizational mission, vision, and culture drivers with Nestlé. A buyout of the Hain would add to Nestlé a product line consisting of high quality organic and all natural products that conflict in only four overlapping products. Nestlé’s access to resources and distribution channels along with its global networks would provide Hain with the strength and buying power needed to continue growing into new markets.
Acquisition Report: Hain Celestial Group 5
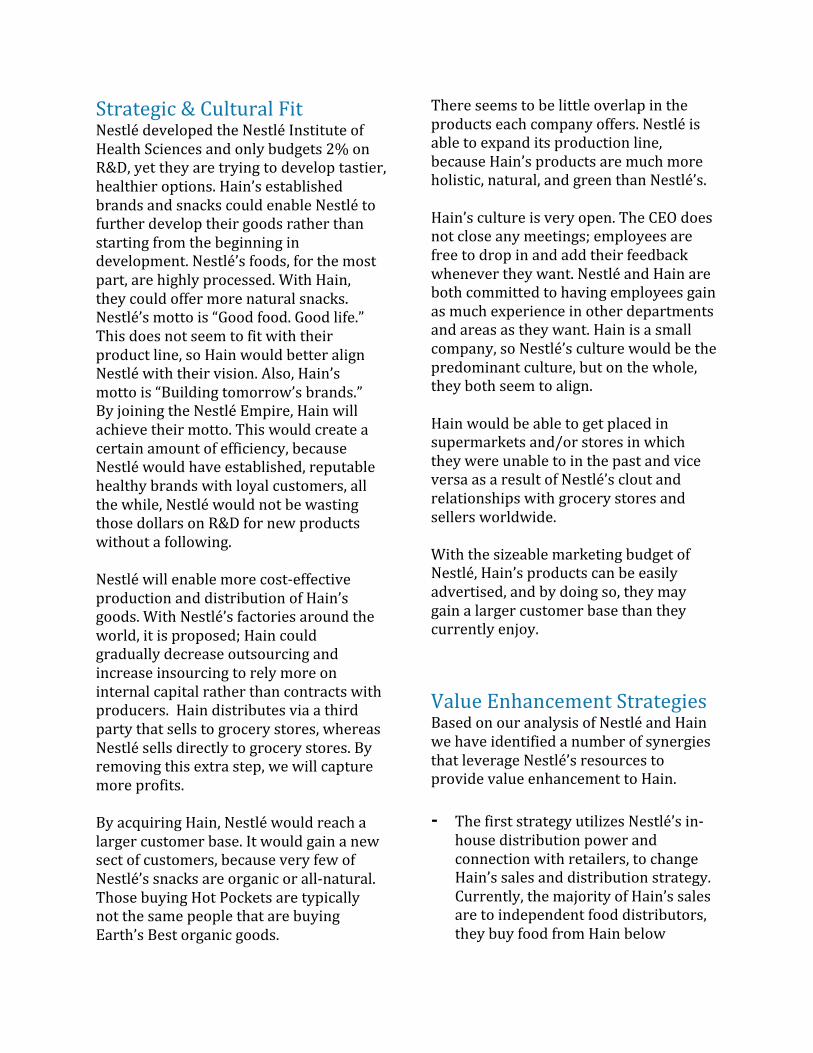
Strategic & Cultural Fit Nestlé developed the Nestlé Institute of Health Sciences and only budgets 2% on R&D, yet they are trying to develop tastier, healthier options. Hain’s established brands and snacks could enable Nestlé to further develop their goods rather than starting from the beginning in development. Nestlé’s foods, for the most part, are highly processed. With Hain, they could offer more natural snacks. Nestlé’s motto is “Good food. Good life.” This does not seem to fit with their product line, so Hain would better align Nestlé with their vision. Also, Hain’s motto is “Building tomorrow’s brands.” By joining the Nestlé Empire, Hain will achieve their motto. This would create a certain amount of efficiency, because Nestlé would have established, reputable healthy brands with loyal customers, all the while, Nestlé would not be wasting those dollars on R&D for new products without a following. Nestlé will enable more cost-‐effective production and distribution of Hain’s goods. With Nestlé’s factories around the world, it is proposed; Hain could gradually decrease outsourcing and increase insourcing to rely more on internal capital rather than contracts with producers. Hain distributes via a third party that sells to grocery stores, whereas Nestlé sells directly to grocery stores. By removing this extra step, we will capture more profits. By acquiring Hain, Nestlé would reach a larger customer base. It would gain a new sect of customers, because very few of Nestlé’s snacks are organic or all-‐natural. Those buying Hot Pockets are typically not the same people that are buying Earth’s Best organic goods.
There seems to be little overlap in the products each company offers. Nestlé is able to expand its production line, because Hain’s products are much more holistic, natural, and green than Nestlé’s. Hain’s culture is very open. The CEO does not close any meetings; employees are free to drop in and add their feedback whenever they want. Nestlé and Hain are both committed to having employees gain as much experience in other departments and areas as they want. Hain is a small company, so Nestlé’s culture would be the predominant culture, but on the whole, they both seem to align. Hain would be able to get placed in supermarkets and/or stores in which they were unable to in the past and vice versa as a result of Nestlé’s clout and relationships with grocery stores and sellers worldwide. With the sizeable marketing budget of Nestlé, Hain’s products can be easily advertised, and by doing so, they may gain a larger customer base than they currently enjoy.
Value Enhancement Strategies Based on our analysis of Nestlé and Hain we have identified a number of synergies that leverage Nestlé’s resources to provide value enhancement to Hain. -‐ The first strategy utilizes Nestlé’s in-‐
house distribution power and connection with retailers, to change Hain’s sales and distribution strategy. Currently, the majority of Hain’s sales are to independent food distributors, they buy food from Hain below
6 Acquisition Report: Hain Celestial Group
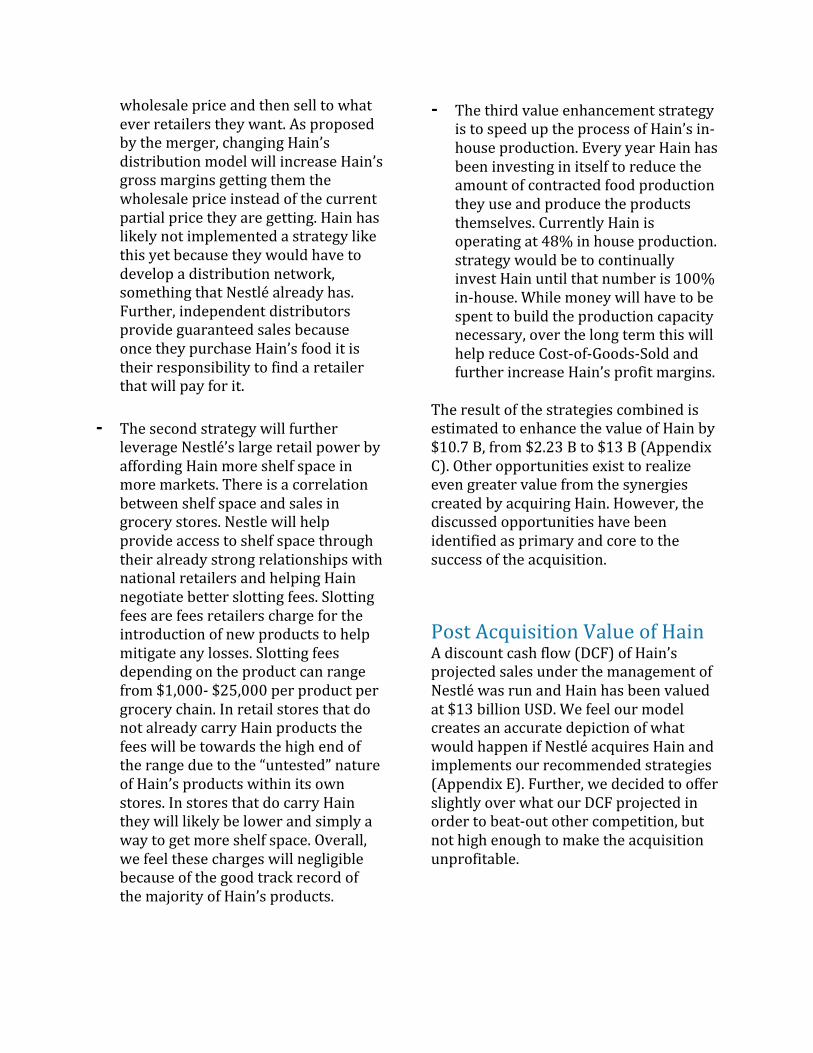
wholesale price and then sell to what ever retailers they want. As proposed by the merger, changing Hain’s distribution model will increase Hain’s gross margins getting them the wholesale price instead of the current partial price they are getting. Hain has likely not implemented a strategy like this yet because they would have to develop a distribution network, something that Nestlé already has. Further, independent distributors provide guaranteed sales because once they purchase Hain’s food it is their responsibility to find a retailer that will pay for it.
-‐ The second strategy will further
leverage Nestlé’s large retail power by affording Hain more shelf space in more markets. There is a correlation between shelf space and sales in grocery stores. Nestle will help provide access to shelf space through their already strong relationships with national retailers and helping Hain negotiate better slotting fees. Slotting fees are fees retailers charge for the introduction of new products to help mitigate any losses. Slotting fees depending on the product can range from $1,000-‐ $25,000 per product per grocery chain. In retail stores that do not already carry Hain products the fees will be towards the high end of the range due to the “untested” nature of Hain’s products within its own stores. In stores that do carry Hain they will likely be lower and simply a way to get more shelf space. Overall, we feel these charges will negligible because of the good track record of the majority of Hain’s products.
-‐ The third value enhancement strategy is to speed up the process of Hain’s in-‐house production. Every year Hain has been investing in itself to reduce the amount of contracted food production they use and produce the products themselves. Currently Hain is operating at 48% in house production. strategy would be to continually invest Hain until that number is 100% in-‐house. While money will have to be spent to build the production capacity necessary, over the long term this will help reduce Cost-‐of-‐Goods-‐Sold and further increase Hain’s profit margins.
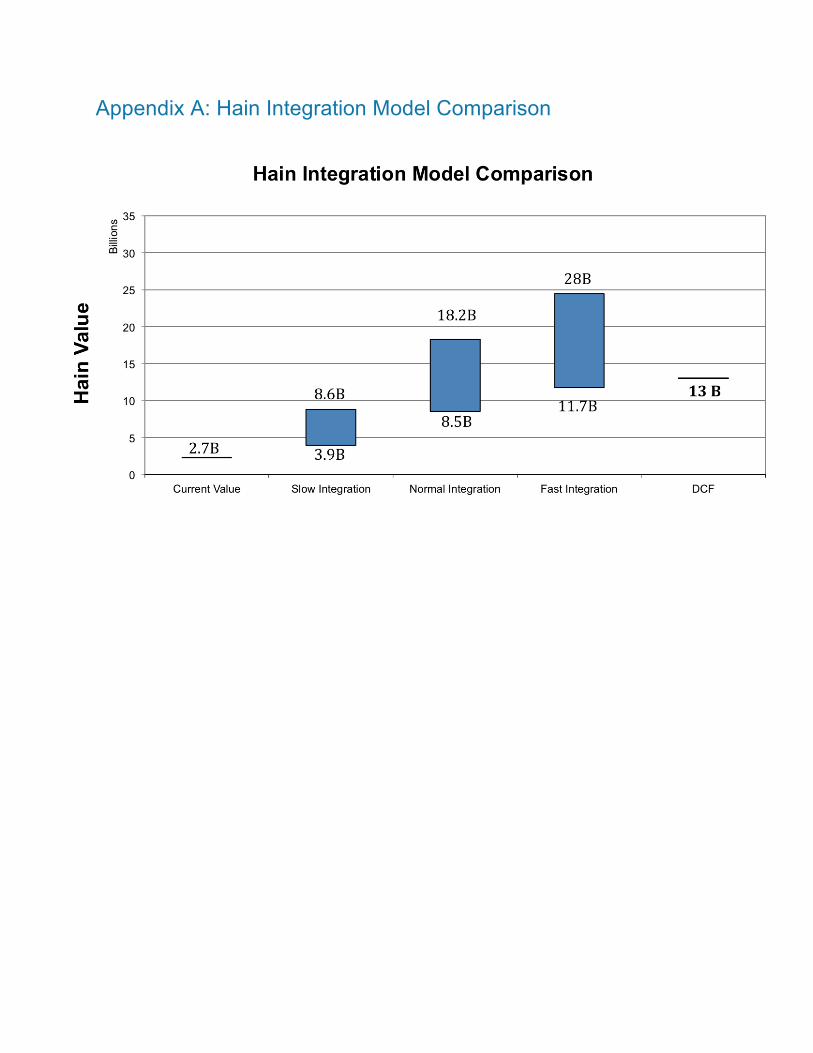
The result of the strategies combined is estimated to enhance the value of Hain by $10.7 B, from $2.23 B to $13 B (Appendix C). Other opportunities exist to realize even greater value from the synergies created by acquiring Hain. However, the discussed opportunities have been identified as primary and core to the success of the acquisition.
Post Acquisition Value of Hain A discount cash flow (DCF) of Hain’s projected sales under the management of Nestlé was run and Hain has been valued at $13 billion USD. We feel our model creates an accurate depiction of what would happen if Nestlé acquires Hain and implements our recommended strategies (Appendix E). Further, we decided to offer slightly over what our DCF projected in order to beat-‐out other competition, but not high enough to make the acquisition unprofitable.
Acquisition Report: Hain Celestial Group 7
Strategy to Convince Hain to Accept Offer Nestlé’s strategy to convince Hain to accept their offer should be to illustrate all the benefits Hain will gain from the acquisition. Hain currently aligns with Nestlé’s roadmap and vision of becoming well known in the health, nutrition, and wellness industry. The acquisition fits culturally and strategically in a way that will allow a seamless transition for both companies. By implementing value-‐enhancing strategies, Nestlé will increase the worth of Hain by a significant margin. The benefits Hain will obtain include an opportunity to expand their products into global markets. Currently, there is very little product competition or overlap between Hain and Nestlé. Bringing Hain’s products under Nestlé’s name will expand
their customer base and marketing reach. Value enhancement strategies include a reduction in outsourcing for Hain and an increase in direct sales. Nestlé will eliminate the barrier of entries that small companies face to get the best shelf space in large stores. Hain will also benefit from the Nestlé’s R&D centers and Nestlé Institute of Health Science. After the acquisition, Nestlé plans to keep Hain’s management and current employees on board. Furthermore, Nestlé has no plans to shut down Hain’s R&D centers or factories. To make the acquisition more enticing, Nestlé plans to offer Hain a package, which consists of a combination of 1.5 billion cash, debt at 3.5% interest, and $290M in shares to the board.
8 Acquisition Report: Hain Celestial Group
Appendix A: Hain Integration Model Comparison
Acquisition Report: Hain Celestial Group 9
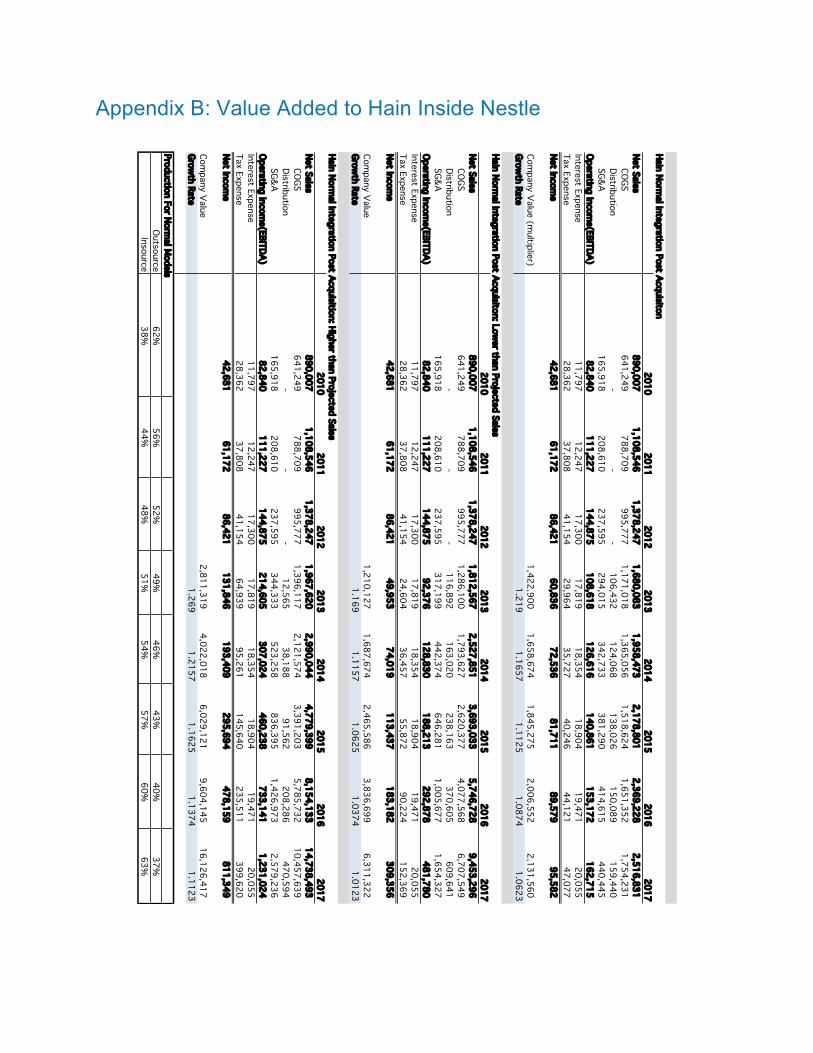
Appendix B: Value Added to Hain Inside Nestle
Hain Normal Integration Post Acquisiton
20102011
20122013
20142015
20162017
Net Sales890,007
1,108,546
1,378,247
1,680,083
1,958,473
2,178,801
2,369,228
2,516,831
COGS
641,249
788,709
995,777
1,171,018
1,365,056
1,518,624
1,651,352
1,754,231
Distribution-
-
-
106,432
124,068
138,026
150,089
159,440
SG&A
165,918
208,610
237,595
294,015
342,733
381,290
414,615
440,445
Operating Income(EBITDA)
82,840
111,227
144,875
108,618
126,616
140,861
153,172
162,715
Interest Expense11,797
12,247
17,300
17,819
18,354
18,904
19,471
20,055
Tax Expense
28,362
37,808
41,154
29,964
35,727
40,246
44,121
47,077
Net Income
42,681
61,172
86,421
60,836
72,536
81,711
89,579
95,582
Company Value (m
ultiplier)1,422,900
1,658,674
1,845,275
2,006,552
2,131,560
Grow
th Rate1.219
1.16571.1125
1.08741.0623
Hain Normal Integration Post Acquisiton: Low
er than Projected Sales2010
20112012
20132014
20152016
2017Net Sales
890,007
1,108,546
1,378,247
1,812,567
2,527,851
3,693,033
5,746,728
9,453,296
COGS641,249
788,709
995,777
1,286,100
1,793,627
2,620,377
4,077,568
6,707,549
Distribution
-
-
-
116,892
163,020
238,163
370,605
609,641
SG&A165,918
208,610
237,595
317,199
442,374
646,281
1,005,677
1,654,327
Operating Incom
e(EBITDA)82,840
111,227
144,875
92,376
128,830
188,213
292,878
481,780
Interest Expense
11,797
12,247
17,300
17,819
18,354
18,904
19,471
20,055
Tax Expense28,362
37,808
41,154
24,604
36,457
55,872
90,224
152,369
Net Incom
e42,681
61,172
86,421
49,953
74,019
113,437
183,182
309,356
Company Value
1,210,127
1,687,674
2,465,586
3,836,699
6,311,322
Growth Rate
1.1691.1157
1.06251.0374
1.0123
Hain Normal Integration Post Acquisition: Higher than Projected Sales
20102011
20122013
20142015
20162017
Net Sales890,007
1,108,546
1,378,247
1,967,620
2,990,044
4,779,399
8,154,133
14,738,493
COGS
641,249
788,709
995,777
1,396,117
2,121,574
3,391,203
5,785,732
10,457,639
Distribution-
-
-
12,565
38,188
91,562
208,286
470,594
SG&A
165,918
208,610
237,595
344,333
523,258
836,395
1,426,973
2,579,236
Operating Income(EBITDA)
82,840
111,227
144,875
214,605
307,024
460,238
733,141
1,231,024
Interest Expense11,797
12,247
17,300
17,819
18,354
18,904
19,471
20,055
Tax Expense
28,362
37,808
41,154
64,939
95,261
145,640
235,511
399,620
Net Income
42,681
61,172
86,421
131,846
193,409
295,694
478,159
811,349
Company Value
2,811,319
4,022,018
6,029,121
9,604,145
16,126,417
Growth Rate
1.2691.2157
1.16251.1374
1.1123
Production For Normal M
odelsOutsource
62%56%
52%49%
46%43%
40%37%
Insource38%
44%48%
51%54%
57%60%
63%
10 Acquisition Report: Hain Celestial Group
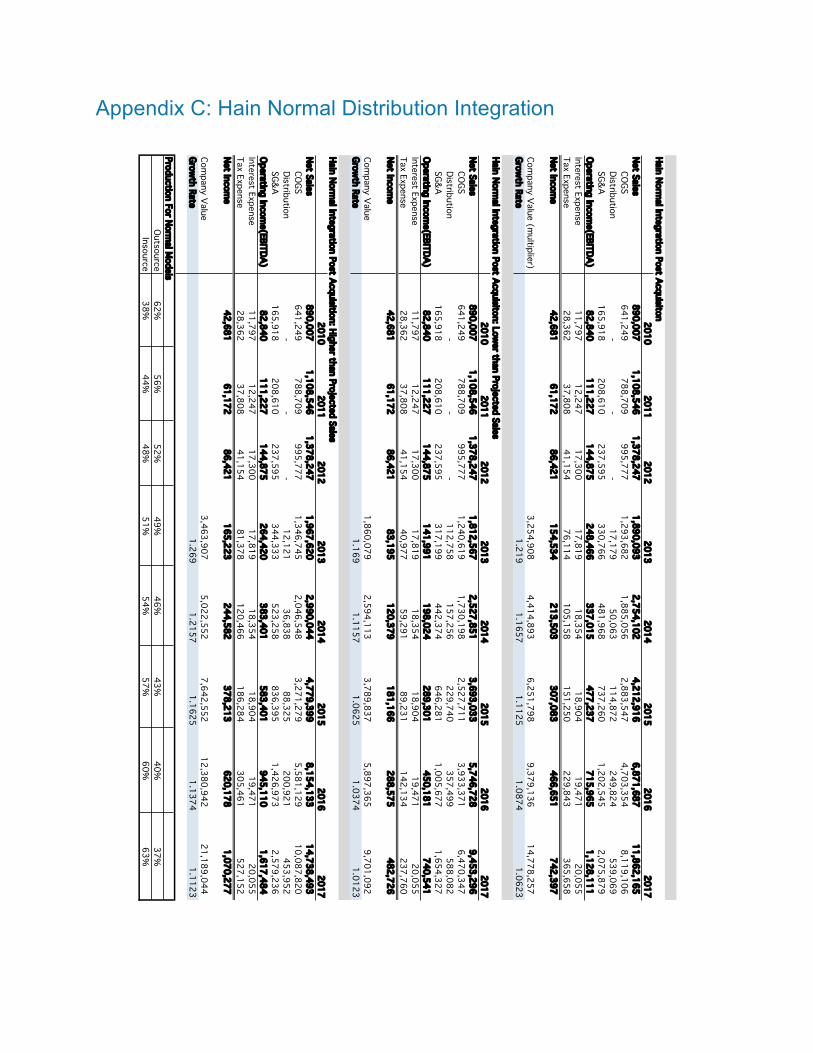
Appendix C: Hain Normal Distribution Integration
Hain Normal Integration Post Acquisiton2010
20112012
20132014
20152016
2017Net Sales
890,007
1,108,546
1,378,247
1,890,093
2,754,102
4,212,916
6,871,687
11,862,165
COGS641,249
788,709
995,777
1,293,682
1,885,056
2,883,547
4,703,354
8,119,106
Distribution
-
-
-
17,179
50,063
114,872
249,824
539,069
SG&A165,918
208,610
237,595
330,766
481,968
737,260
1,202,545
2,075,879
Operating Incom
e(EBITDA)82,840
111,227
144,875
248,466
337,015
477,237
715,965
1,128,111
Interest Expense
11,797
12,247
17,300
17,819
18,354
18,904
19,471
20,055
Tax Expense28,362
37,808
41,154
76,114
105,158
151,250
229,843
365,658
Net Incom
e42,681
61,172
86,421
154,534
213,503
307,083
466,651
742,397
Company Value (m
ultiplier)3,254,908
4,414,893
6,251,798
9,379,136
14,778,257
Grow
th Rate1.219
1.16571.1125
1.08741.0623
Hain Normal Integration Post Acquisiton: Low
er than Projected Sales2010
20112012
20132014
20152016
2017Net Sales
890,007
1,108,546
1,378,247
1,812,567
2,527,851
3,693,033
5,746,728
9,453,296
COGS641,249
788,709
995,777
1,240,619
1,730,198
2,527,711
3,933,371
6,470,347
Distribution
-
-
-
112,758
157,256
229,740
357,499
588,082
SG&A165,918
208,610
237,595
317,199
442,374
646,281
1,005,677
1,654,327
Operating Incom
e(EBITDA)82,840
111,227
144,875
141,991
198,024
289,301
450,181
740,541
Interest Expense
11,797
12,247
17,300
17,819
18,354
18,904
19,471
20,055
Tax Expense28,362
37,808
41,154
40,977
59,291
89,231
142,134
237,760
Net Incom
e42,681
61,172
86,421
83,195
120,379
181,166
288,575
482,726
Company Value
1,860,079
2,594,113
3,789,837
5,897,365
9,701,092
Growth Rate
1.1691.1157
1.06251.0374
1.0123
Hain Normal Integration Post Acquisition: Higher than Projected Sales
20102011
20122013
20142015
20162017
Net Sales890,007
1,108,546
1,378,247
1,967,620
2,990,044
4,779,399
8,154,133
14,738,493
COGS
641,249
788,709
995,777
1,346,745
2,046,548
3,271,279
5,581,129
10,087,820
Distribution-
-
-
12,121
36,838
88,325
200,921
453,952
SG&A
165,918
208,610
237,595
344,333
523,258
836,395
1,426,973
2,579,236
Operating Income(EBITDA)
82,840
111,227
144,875
264,420
383,401
583,401
945,110
1,617,484
Interest Expense11,797
12,247
17,300
17,819
18,354
18,904
19,471
20,055
Tax Expense
28,362
37,808
41,154
81,378
120,466
186,284
305,461
527,152
Net Income
42,681
61,172
86,421
165,223
244,582
378,213
620,178
1,070,277
Company Value
3,463,907
5,022,552
7,642,552
12,380,942
21,189,044
Growth Rate
1.2691.2157
1.16251.1374
1.1123
Production For Normal M
odelsOutsource
62%56%
52%49%
46%43%
40%37%
Insource38%
44%48%
51%54%
57%60%
63%
Acquisition Report: Hain Celestial Group 11
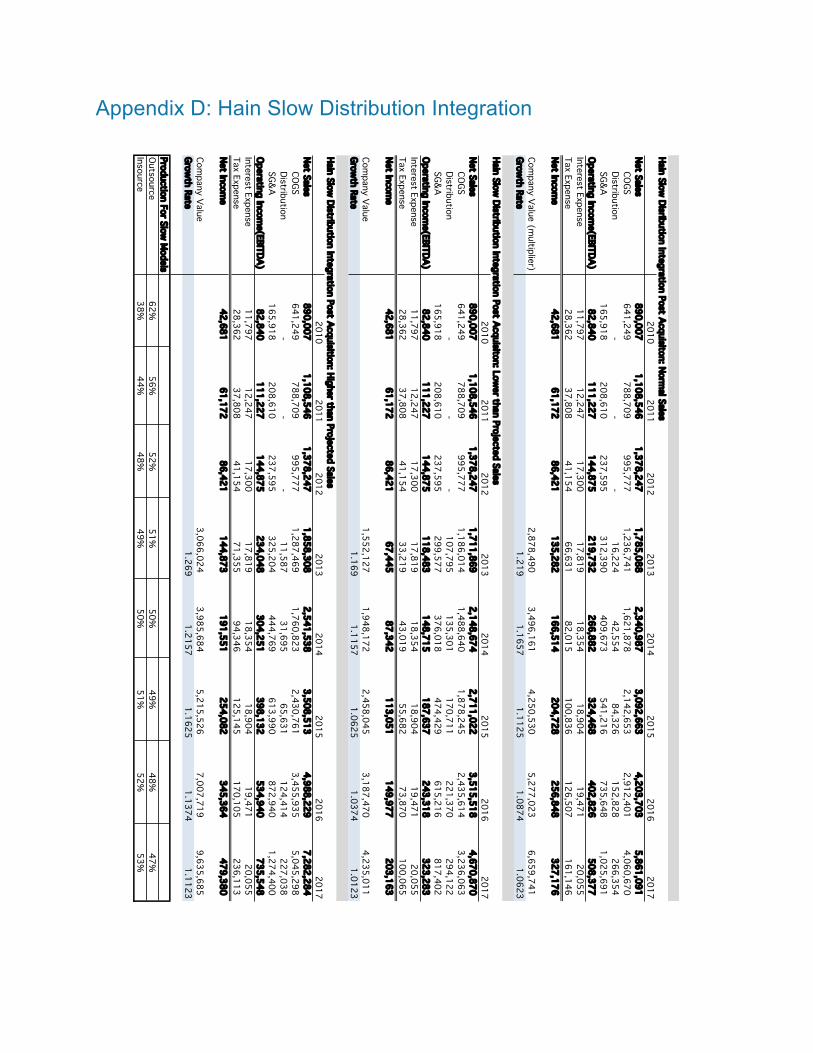
Appendix D: Hain Slow Distribution Integration
Hain Slow Disribution Integration Post Acquisiton: Norm
al Sales2010
20112012
20132014
20152016
2017Net Sales
890,007
1,108,546
1,378,247
1,785,088
2,340,987
3,092,663
4,203,703
5,861,091
COGS641,249
788,709
995,777
1,236,741
1,621,878
2,142,653
2,912,401
4,060,670
Distribution
-
-
-
16,224
42,554
84,326
152,828
266,354
SG&A165,918
208,610
237,595
312,390
409,673
541,216
735,648
1,025,691
Operating Incom
e(EBITDA)82,840
111,227
144,875
219,732
266,882
324,468
402,826
508,377
Interest Expense
11,797
12,247
17,300
17,819
18,354
18,904
19,471
20,055
Tax Expense28,362
37,808
41,154
66,631
82,015
100,836
126,507
161,146
Net Incom
e42,681
61,172
86,421
135,282
166,514
204,728
256,848
327,176
Company Value (m
ultiplier)2,878,490
3,496,161
4,250,530
5,277,023
6,659,741
Grow
th Rate1.219
1.16571.1125
1.08741.0623
Hain Slow Distribution Integration Post Acquisiton: Low
er than Projected Sales2010
20112012
20132014
20152016
2017Net Sales
890,007
1,108,546
1,378,247
1,711,869
2,148,674
2,711,022
3,515,518
4,670,870
COGS641,249
788,709
995,777
1,186,014
1,488,640
1,878,245
2,435,614
3,236,063
Distribution
-
-
-
107,795
135,301
170,711
221,370
294,122
SG&A165,918
208,610
237,595
299,577
376,018
474,429
615,216
817,402
Operating Incom
e(EBITDA)82,840
111,227
144,875
118,483
148,715
187,637
243,318
323,283
Interest Expense
11,797
12,247
17,300
17,819
18,354
18,904
19,471
20,055
Tax Expense28,362
37,808
41,154
33,219
43,019
55,682
73,870
100,065
Net Incom
e42,681
61,172
86,421
67,445
87,342
113,051
149,977
203,163
Company Value
1,552,127
1,948,172
2,458,045
3,187,470
4,235,011
Growth Rate
1.1691.1157
1.06251.0374
1.0123
Hain Slow Distribution Integration Post Acquisition: Higher than Projected Sales
20102011
20122013
20142015
20162017
Net Sales890,007
1,108,546
1,378,247
1,858,308
2,541,538
3,508,513
4,988,229
7,282,284
COGS
641,249
788,709
995,777
1,287,469
1,760,823
2,430,761
3,455,935
5,045,298
Distribution-
-
-
11,587
31,695
65,631
124,414
227,038
SG&A
165,918
208,610
237,595
325,204
444,769
613,990
872,940
1,274,400
Operating Income(EBITDA)
82,840
111,227
144,875
234,048
304,251
398,132
534,940
735,548
Interest Expense11,797
12,247
17,300
17,819
18,354
18,904
19,471
20,055
Tax Expense
28,362
37,808
41,154
71,355
94,346
125,145
170,105
236,113
Net Income
42,681
61,172
86,421
144,873
191,551
254,082
345,364
479,380
Company Value
3,066,024
3,985,684
5,215,526
7,007,719
9,635,685
Growth Rate
1.2691.2157
1.16251.1374
1.1123
Production For Slow M
odelsOutsource
62%56%
52%51%
50%49%
48%47%
Insource38%
44%48%
49%50%
51%52%
53%
12 Acquisition Report: Hain Celestial Group
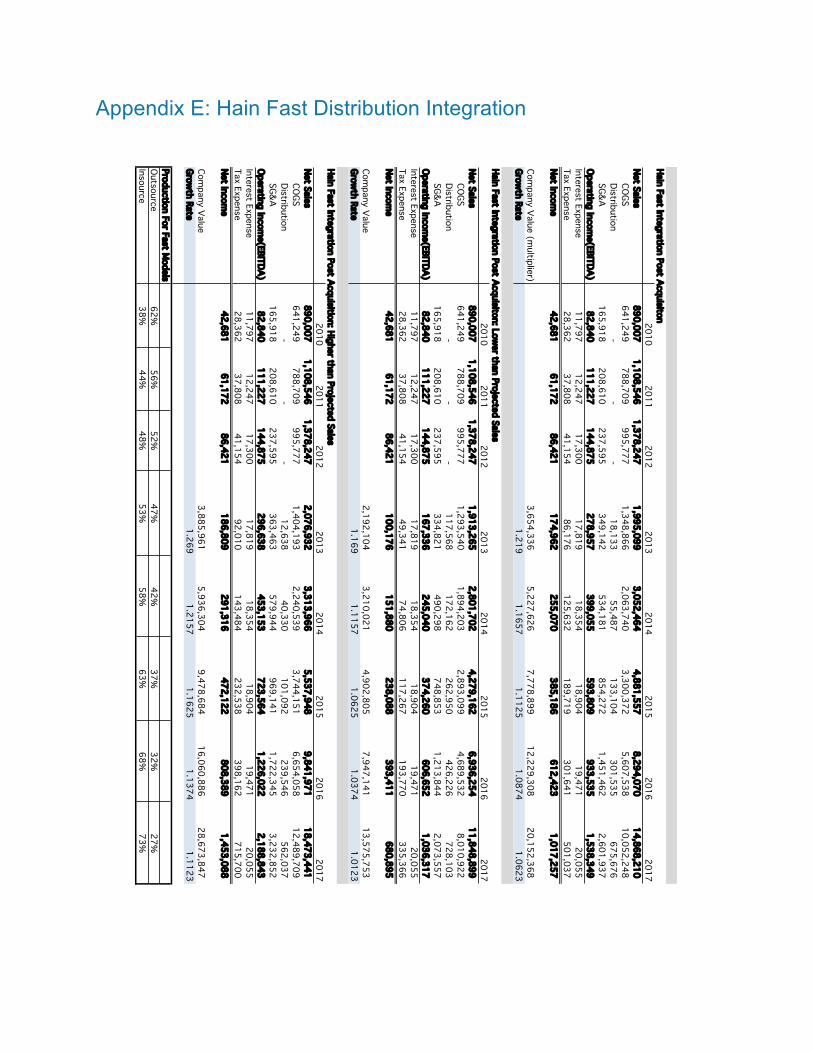
Appendix E: Hain Fast Distribution Integration
Hain Fast Integration Post Acquisiton20102011
20122013
20142015
20162017
Net Sales890,007
1,108,546
1,378,247
1,995,099
3,052,464
4,881,557
8,294,070
14,868,210
COGS
641,249
788,709
995,777
1,348,866
2,063,740
3,300,372
5,607,538
10,052,248
Distribution-
-
-
18,133
55,487
133,104
301,535
675,676
SG&A
165,918
208,610
237,595
349,142
534,181
854,272
1,451,462
2,601,937
Operating Income(EBITDA)
82,840
111,227
144,875
278,957
399,055
593,809
933,535
1,538,349
Interest Expense11,797
12,247
17,300
17,819
18,354
18,904
19,471
20,055
Tax Expense
28,362
37,808
41,154
86,176
125,632
189,719
301,641
501,037
Net Income
42,681
61,172
86,421
174,962
255,070
385,186
612,423
1,017,257
Company Value (m
ultiplier)3,654,336
5,227,626
7,778,899
12,229,308
20,152,368
Grow
th Rate1.219
1.16571.1125
1.08741.0623
Hain Fast Integration Post Acquisiton: Lower than Projected Sales
20102011
20122013
20142015
20162017
Net Sales890,007
1,108,546
1,378,247
1,913,265
2,801,702
4,279,162
6,936,254
11,848,899
COGS
641,249
788,709
995,777
1,293,540
1,894,203
2,893,099
4,689,532
8,010,922
Distribution-
-
-
117,568
172,162
262,950
426,226
728,103
SG&A
165,918
208,610
237,595
334,821
490,298
748,853
1,213,844
2,073,557
Operating Income(EBITDA)
82,840
111,227
144,875
167,336
245,040
374,260
606,652
1,036,317
Interest Expense11,797
12,247
17,300
17,819
18,354
18,904
19,471
20,055
Tax Expense
28,362
37,808
41,154
49,341
74,806
117,267
193,770
335,366
Net Income
42,681
61,172
86,421
100,176
151,880
238,088
393,411
680,895
Company Value
2,192,104
3,210,021
4,902,805
7,947,141
13,575,753
Growth Rate
1.1691.1157
1.06251.0374
1.0123
Hain Fast Integration Post Acquisition: Higher than Projected Sales2010
20112012
20132014
20152016
2017Net Sales
890,007
1,108,546
1,378,247
2,076,932
3,313,966
5,537,948
9,841,971
18,473,441
COGS641,249
788,709
995,777
1,404,193
2,240,539
3,744,151
6,654,058
12,489,709
Distribution
-
-
-
12,638
40,330
101,092
239,546
562,037
SG&A165,918
208,610
237,595
363,463
579,944
969,141
1,722,345
3,232,852
Operating Incom
e(EBITDA)82,840
111,227
144,875
296,638
453,153
723,564
1,226,022
2,188,843
Interest Expense
11,797
12,247
17,300
17,819
18,354
18,904
19,471
20,055
Tax Expense28,362
37,808
41,154
92,010
143,484
232,538
398,162
715,700
Net Incom
e42,681
61,172
86,421
186,809
291,316
472,122
808,389
1,453,088
Company Value
3,885,961
5,936,304
9,478,684
16,060,886
28,673,847
Growth Rate
1.2691.2157
1.16251.1374
1.1123
Production For Fast Models
Outsource62%
56%52%
47%42%
37%32%
27%Insource
38%44%
48%53%
58%63%
68%73%
Acquisition Report: Hain Celestial Group 13
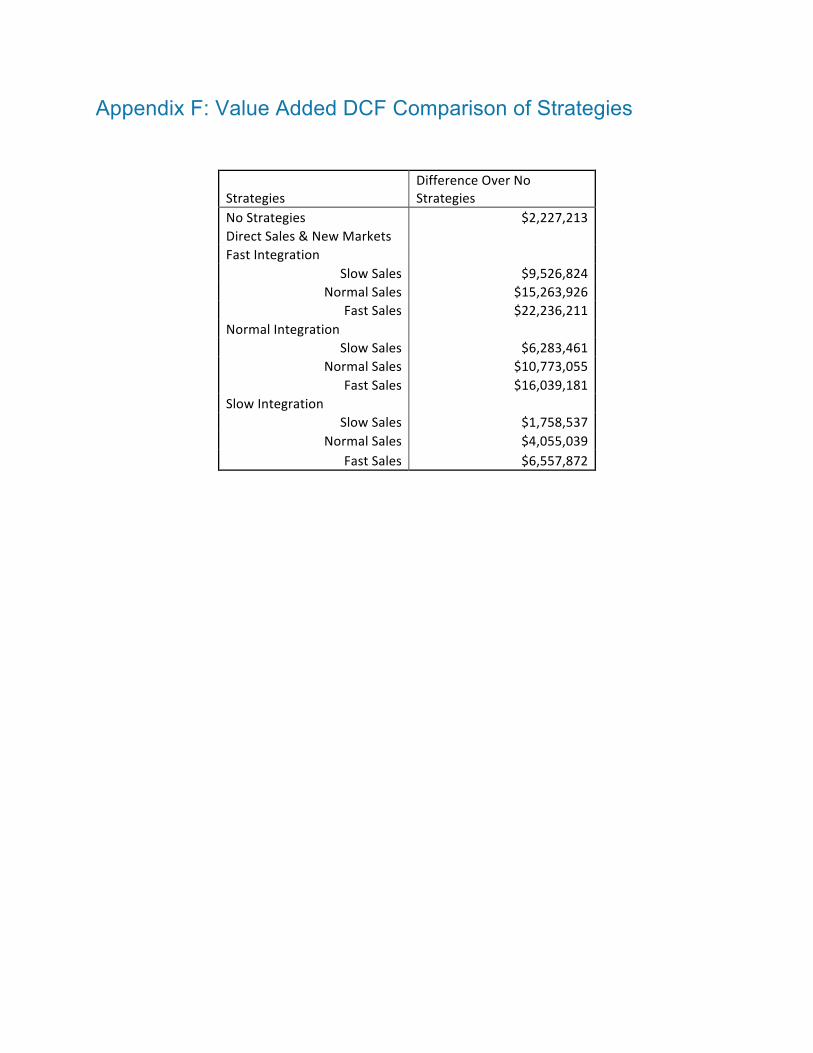
Appendix F: Value Added DCF Comparison of Strategies
Strategies Difference Over No Strategies
No Strategies $2,227,213 Direct Sales & New Markets Fast Integration
Slow Sales $9,526,824 Normal Sales $15,263,926
Fast Sales $22,236,211 Normal Integration
Slow Sales $6,283,461 Normal Sales $10,773,055
Fast Sales $16,039,181 Slow Integration
Slow Sales $1,758,537 Normal Sales $4,055,039
Fast Sales $6,557,872
14 Acquisition Report: Hain Celestial Group
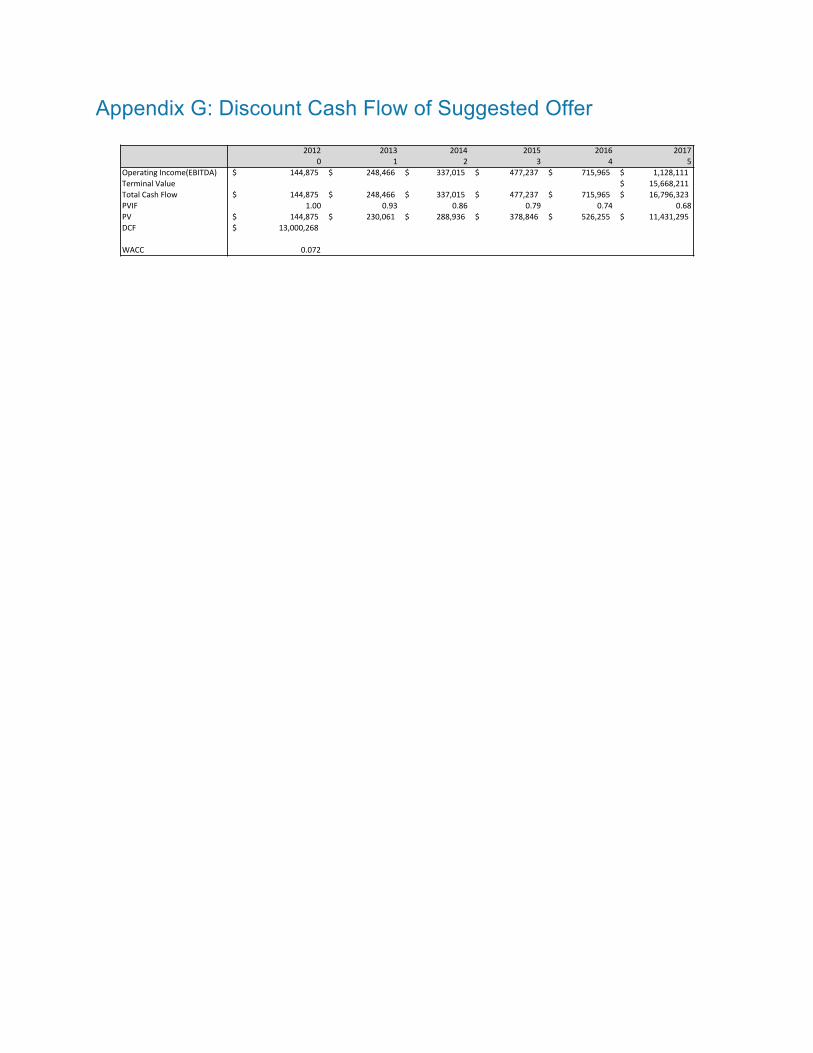
Appendix G: Discount Cash Flow of Suggested Offer
2012 2013 2014 2015 2016 20170 1 2 3 4 5
Operating2Income(EBITDA) 144,875$222222222222222222222222 248,466$2222222222222222 337,015$2222222222222 477,237$222222222222222 715,965$22222222222222 1,128,111$22222222222222Terminal2Value 15,668,211$222222222222Total2Cash2Flow 144,875$222222222222222222222222 248,466$2222222222222222 337,015$2222222222222 477,237$222222222222222 715,965$22222222222222 16,796,323$222222222222PVIF 1.00 0.93 0.86 0.79 0.74 0.68PV 144,875$222222222222222222222222 230,061$2222222222222222 288,936$2222222222222 378,846$222222222222222 526,255$22222222222222 11,431,295$222222222222DCF 13,000,268$22222222222222222222
WACC 0.072
Acquisition Report: Hain Celestial Group 15
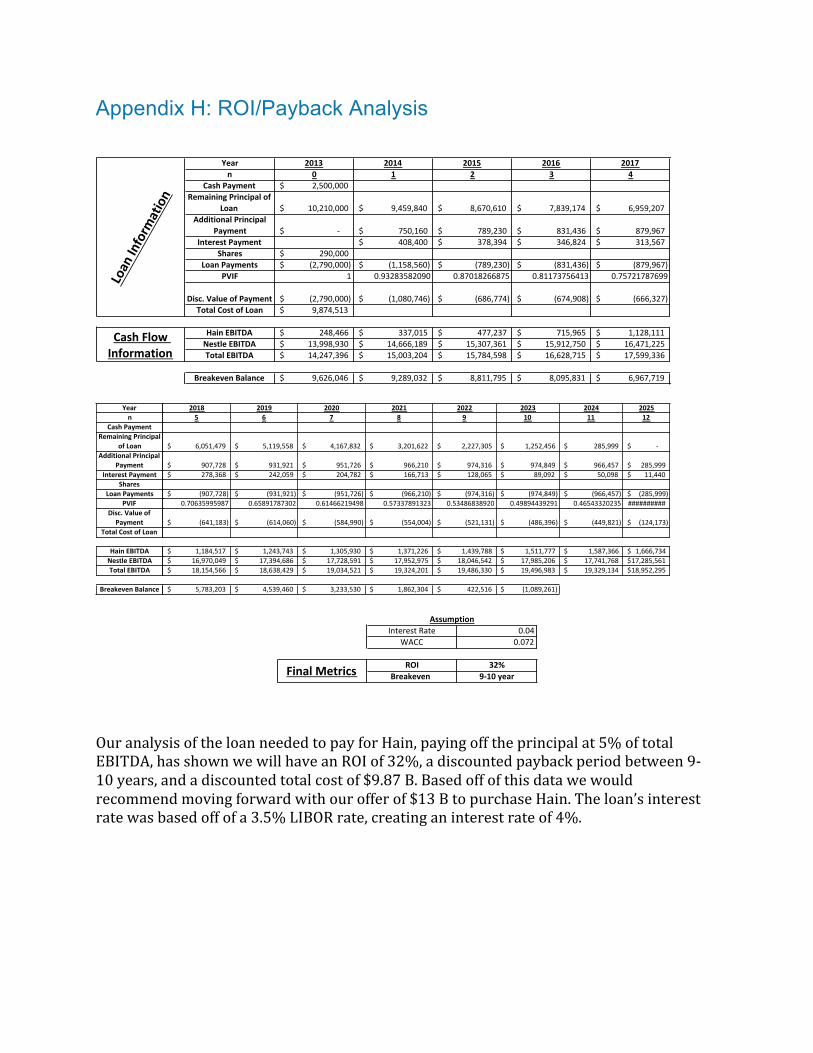
Appendix H: ROI/Payback Analysis
Our analysis of the loan needed to pay for Hain, paying off the principal at 5% of total EBITDA, has shown we will have an ROI of 32%, a discounted payback period between 9-‐10 years, and a discounted total cost of $9.87 B. Based off of this data we would recommend moving forward with our offer of $13 B to purchase Hain. The loan’s interest rate was based off of a 3.5% LIBOR rate, creating an interest rate of 4%.
Year 2013 2014 2015 2016 2017n 0 1 2 3 4
Cash1Payment 2,500,000$&&&&&&&&&&&&&&Remaining1Principal1of1
Loan 10,210,000$&&&&&&&&&&&& 9,459,840$&&&&&&&&&&&&&& 8,670,610$&&&&&&&&&&&&&& 7,839,174$&&&&&&&&&&&&&& 6,959,207$&&&&&&&&&&&&&&Additional1Principal1
Payment .$&&&&&&&&&&&&&&&&&&&&&&&& 750,160$&&&&&&&&&&&&&&&& 789,230$&&&&&&&&&&&&&&&& 831,436$&&&&&&&&&&&&&&&& 879,967$&&&&&&&&&&&&&&&&Interest1Payment 408,400$&&&&&&&&&&&&&&&& 378,394$&&&&&&&&&&&&&&&& 346,824$&&&&&&&&&&&&&&&& 313,567$&&&&&&&&&&&&&&&&
Shares 290,000$&&&&&&&&&&&&&&&&Loan1Payments (2,790,000)$&&&&&&&&&&&& (1,158,560)$&&&&&&&&&&&& (789,230)$&&&&&&&&&&&&&&& (831,436)$&&&&&&&&&&&&&&& (879,967)$&&&&&&&&&&&&&&&
PVIF 1 0.93283582090 0.87018266875 0.81173756413 0.75721787699
Disc.1Value1of1Payment (2,790,000)$&&&&&&&&&&&& (1,080,746)$&&&&&&&&&&&& (686,774)$&&&&&&&&&&&&&&& (674,908)$&&&&&&&&&&&&&&& (666,327)$&&&&&&&&&&&&&&&Total1Cost1of1Loan 9,874,513$&&&&&&&&&&&&&&
Hain1EBITDA 248,466$&&&&&&&&&&&&&&&& 337,015$&&&&&&&&&&&&&&&& 477,237$&&&&&&&&&&&&&&&& 715,965$&&&&&&&&&&&&&&&& 1,128,111$&&&&&&&&&&&&&&Nestle1EBITDA 13,998,930$&&&&&&&&&&&& 14,666,189$&&&&&&&&&&&& 15,307,361$&&&&&&&&&&&& 15,912,750$&&&&&&&&&&&& 16,471,225$&&&&&&&&&&&&Total1EBITDA 14,247,396$&&&&&&&&&&&& 15,003,204$&&&&&&&&&&&& 15,784,598$&&&&&&&&&&&& 16,628,715$&&&&&&&&&&&& 17,599,336$&&&&&&&&&&&&
Breakeven1Balance 9,626,046$&&&&&&&&&&&&&& 9,289,032$&&&&&&&&&&&&&& 8,811,795$&&&&&&&&&&&&&& 8,095,831$&&&&&&&&&&&&&& 6,967,719$&&&&&&&&&&&&&&
Loan1Information
Cash1Flow1Information
Yearn
Cash)PaymentRemaining)Principal)
of)LoanAdditional)Principal)
PaymentInterest)Payment
SharesLoan)Payments
PVIFDisc.)Value)of)Payment
Total)Cost)of)Loan
Hain)EBITDANestle)EBITDATotal)EBITDA
Breakeven)Balance
2018 2019 2020 2021 2022 2023 2024 20255 6 7 8 9 10 11 12
6,051,479$************** 5,119,558$************** 4,167,832$************** 3,201,622$************** 2,227,305$************ 1,252,456$************ 285,999$*************** .$**************
907,728$***************** 931,921$***************** 951,726$***************** 966,210$***************** 974,316$*************** 974,849$*************** 966,457$*************** 285,999$*******278,368$***************** 242,059$***************** 204,782$***************** 166,713$***************** 128,065$*************** 89,092$***************** 50,098$***************** 11,440$*********
(907,728)$*************** (931,921)$*************** (951,726)$*************** (966,210)$*************** (974,316)$************* (974,849)$************* (966,457)$************* (285,999)$*****0.70635995987 0.65891787302 0.61466219498 0.57337891323 0.53486838920 0.49894439291 0.46543320235 ##########
(641,183)$*************** (614,060)$*************** (584,990)$*************** (554,004)$*************** (521,131)$************* (486,396)$************* (449,821)$************* (124,173)$*****
1,184,517$************** 1,243,743$************** 1,305,930$************** 1,371,226$************** 1,439,788$************ 1,511,777$************ 1,587,366$************ 1,666,734$***16,970,049$************ 17,394,686$************ 17,728,591$************ 17,952,975$************ 18,046,542$********** 17,985,206$********** 17,741,768$********** 17,285,561$*18,154,566$************ 18,638,429$************ 19,034,521$************ 19,324,201$************ 19,486,330$********** 19,496,983$********** 19,329,134$********** 18,952,295$*
5,783,203$************** 4,539,460$************** 3,233,530$************** 1,862,304$************** 422,516$*************** (1,089,261)$***********
Interest'Rate 0.04WACC 0.072
ROI 32%Breakeven. 9010.year
Assumption
Final.Metrics
16 Acquisition Report: Hain Celestial Group
References http://ir.Hain-‐celestial.com/phoenix.zhtml?c=87078&p=irol-‐irhome http://www.nestle.com/asset-‐library/Documents/Library/Presentations/Sales_and_Results/2012-‐nine-‐month-‐sales-‐pressconf.pdf http://www.nestlecareers.co.uk/html/culture-‐nestle-‐jobs.htm http://www.nytimes.com/2011/03/20/business/20corner.html?pagewanted=all&_r=0 http://www.nytimes.com/2012/07/08/business/organic-‐food-‐purists-‐worry-‐about-‐big-‐companies-‐influence.html?ref=Haincelestialgroupinc http://specialtyfood.ning.com/forum/topics/699063:Topic:4685 http://www.vtspecialtyfoods.org/manual/interior.php/sid/22