©2008 the hain celestial group, inc. all rights reserved...
TRANSCRIPT

2007 ANNUAL REPORT
The Hain Celestial Group, Inc.58 South Service Road Melville, NY 11747+1-631-730-2200www.hain-celestial.com
Linda McCartney® is a registered trademark of Linda Enterprises Limited. NASDAQ® is a registered trademark of The NASDAQ Stock Market, Inc. Healthy Habits for Life™, Sesame Workshop®, Sesame Street® and associated characters, trademarks and design elements are owned and licensed by Sesame Workshop. ©2008 Sesame Workshop. Fair Trade Certified™ is a trademark of TransFair USA, Inc.
©2008 The Hain Celestial Group, Inc. All Rights Reserved. Product or brand names used in this annual report may be trademarks or registered trademarks of The Hain Celestial Group, Inc.
We are committed to growing
our Company while continuing
to implement environmentally
sound business practices and
manufacturing processes.
Printed on 10% post-consumer fi ber paper.
All paper manufactured alcohol-free.
100%
Cert no. SW-COC-1516
63715_Cover.indd 163715_Cover.indd 1 2/23/08 9:07:34 PM2/23/08 9:07:34 PM
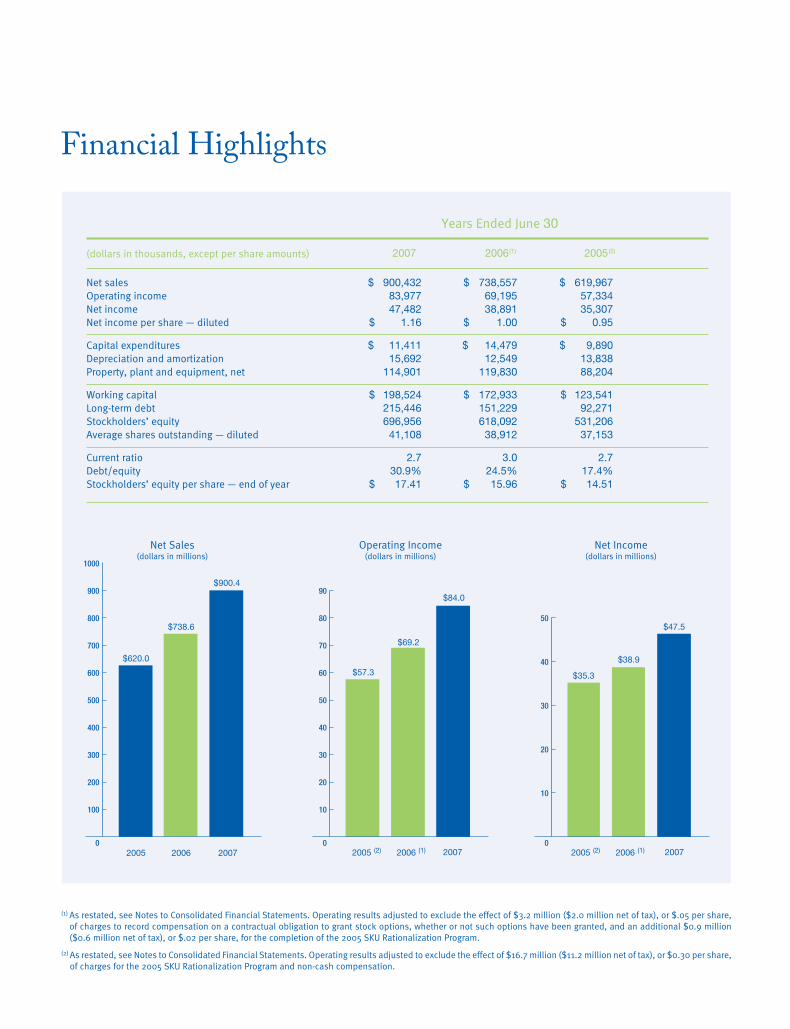
Years Ended June 30
(dollars in thousands, except per share amounts) 2007 2006(1) 2005(2)
Net sales $ 900,432 $ 738,557 $ 619,967
Operating income 83,977 69,195 57,334
Net income 47,482 38,891 35,307
Net income per share — diluted $ 1.16 $ 1.00 $ 0.95
Capital expenditures $ 11,411 $ 14,479 $ 9,890
Depreciation and amortization 15,692 12,549 13,838
Property, plant and equipment, net 114,901 119,830 88,204
Working capital $ 198,524 $ 172,933 $ 123,541
Long-term debt 215,446 151,229 92,271
Stockholders’ equity 696,956 618,092 531,206
Average shares outstanding — diluted 41,108 38,912 37,153
Current ratio 2.7 3.0 2.7
Debt/equity 30.9% 24.5% 17.4%
Stockholders’ equity per share — end of year $ 17.41 $ 15.96 $ 14.51
(1) As restated, see Notes to Consolidated Financial Statements. Operating results adjusted to exclude the effect of $3.2 million ($2.0 million net of tax), or $.05 per share, of charges to record compensation on a contractual obligation to grant stock options, whether or not such options have been granted, and an additional $0.9 million ($0.6 million net of tax), or $.02 per share, for the completion of the 2005 SKU Rationalization Program.
(2) As restated, see Notes to Consolidated Financial Statements. Operating results adjusted to exclude the effect of $16.7 million ($11.2 million net of tax), or $0.30 per share, of charges for the 2005 SKU Rationalization Program and non-cash compensation.
2005
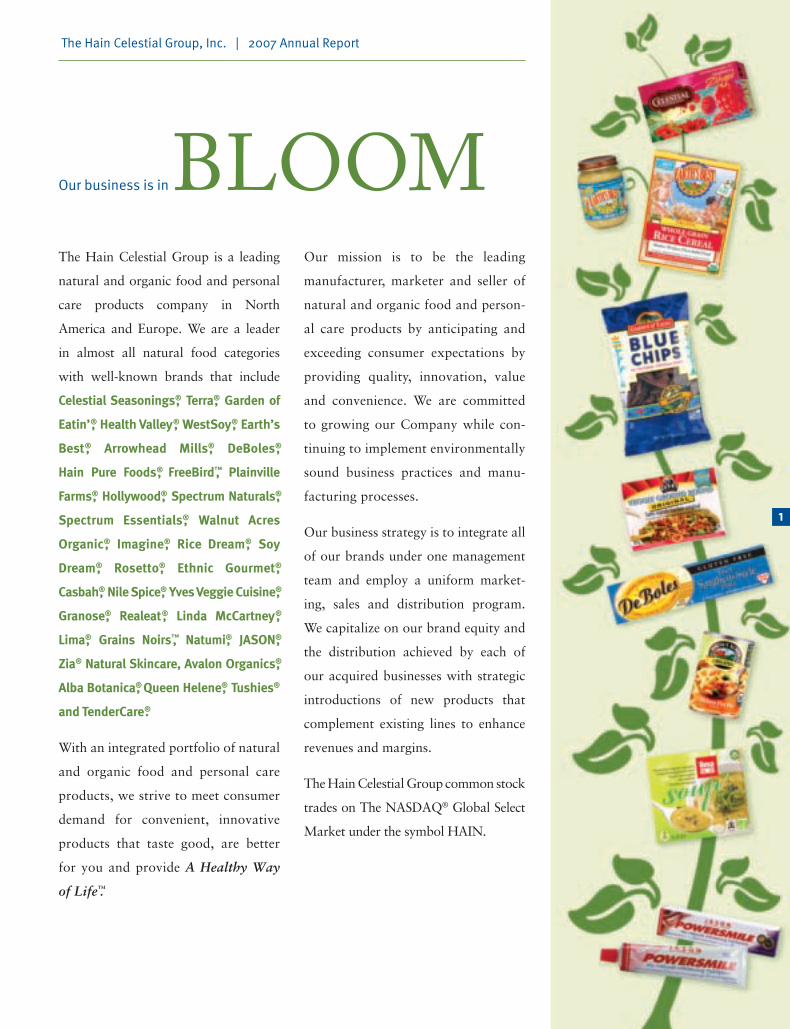
Net Sales(dollars in millions)
Operating Income(dollars in millions)
Net Income(dollars in millions)
2006 2007 2005 (2) 2006 (1) 2007
$35.3
$38.9
$47.5
$57.3
$69.2
$84.0
$620.0
$738.6
$900.4
Financial Highlights
2005 (2) 2006 (1) 2007
IRWIN D. SIMON President, Chief Executive Officer and Chairman of the Board
BARRY J. ALPERIN 1, 2
Consultant Retired Vice Chairman Hasbro, Inc.
RICHARD C. BERKE Vice President, Human Resources Broadridge Financial Solutions, Inc.
BETH L. BRONNER 3
Managing Director Mistral Equity Partners
JACK FUTTERMAN 2
Retired Chairman and Chief Executive Officer
Pathmark Stores, Inc.
DANIEL R. GLICKMAN 2
Chairman and Chief Executive Officer
Motion Picture Association of America, Inc.
Former U.S. Secretary of Agriculture
MARINA HAHN 3
Chief Marketing Officer Spirits Marque One LLC
ANDREW R. HEYER 2, 3
Founder Mistral Equity Partners
ROGER MELTZER Partner DLA Piper US LLP
MITCHELL A. RING 4
Senior Vice President—Business Development
H.J. Heinz Company
LEWIS D. SCHILIRO 1
Managing Partner Freeh Group International
LAWRENCE S. ZILAVY 1
Senior Vice President Barnes & Noble College Booksellers, Inc.
Board of Directors
Senior ManagementIRWIN D. SIMON President, Chief Executive Officer and Chairman of the Board
IRA J. LAMEL Executive Vice President,
Chief Financial Officer, Treasurer and Secretary
JOHN CARROLL Executive Vice President, President—Grocery and Snacks, and Personal Care
GERALD F. AMANTEA, Ph.D. Vice President— Technical Services
MARY CELESTE ANTHES Vice President— Investor Relations
DAVID ARROW Managing Director— Hain Celestial UK
BENJAMIN BRECHER Senior Vice President—
Special Projects
JOSEPH A. DEPIPPO President— Hain Pure Protein
ELLEN B. DEUTSCH Senior Vice President and
Chief Growth Officer
BEENA G. GOLDENBERG General Manager—
Hain Celestial Canada
ADAM S. LEVIT Chief Sales Officer— Grocery and Snacks
JAY LIEBERMAN Vice President— Financial Planning and Analysis
JAMES R. MEIERS Chief Supply Chain Officer— Grocery and Personal Care
LINDA D. PIACENTINI Vice President— Human Resources
MAUREEN M. PUTMAN Chief Marketing Officer—
Grocery and Snacks JAMES C. REED President— Plainville Farms
MICHAEL J. SPEILLER Vice President— Finance
PHILIPPE WOITRIN Chief Executive Officer—
Hain Celestial Europe
DAVID ZIEGERT Acting General Manager—
Celestial Seasonings
Directors and Senior Management
1 Member of the Audit Committee2 Member of the Corporate Governance and Nominating Committee3 Member of the Compensation Committee4 Not standing for re-election
63715_Cover.indd 263715_Cover.indd 2 2/23/08 7:14:46 PM2/23/08 7:14:46 PM
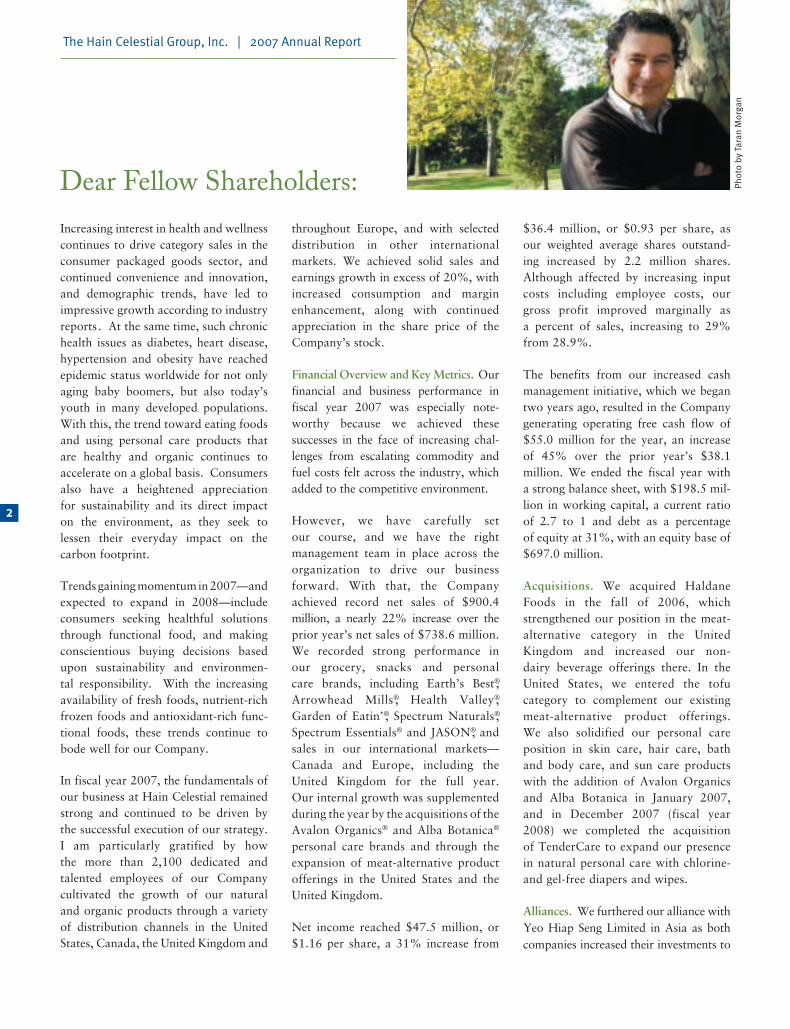
Our business is in BLOOMThe Hain Celestial Group is a leading
natural and organic food and personal
care products company in North
America and Europe. We are a leader
in almost all natural food categories
with well-known brands that include
Celestial Seasonings®, Terra®, Garden of
Eatin’®, Health Valley®, WestSoy®, Earth’s
Best®, Arrowhead Mills®, DeBoles®,
Hain Pure Foods®, FreeBird™, Plainville
Farms®, Hollywood®, Spectrum Naturals®,
Spectrum Essentials®, Walnut Acres
Organic®, Imagine®, Rice Dream®, Soy
Dream®, Rosetto®, Ethnic Gourmet®,
Casbah®, Nile Spice®, Yves Veggie Cuisine®,
Granose®, Realeat®, Linda McCartney®,
Lima®, Grains Noirs™, Natumi®, JASON®,
Zia® Natural Skincare, Avalon Organics®,
Alba Botanica®, Queen Helene®, Tushies®
and TenderCare®.
With an integrated portfolio of natural
and organic food and personal care
products, we strive to meet consumer
demand for convenient, innovative
products that taste good, are better
for you and provide A Healthy Way
of Life™.
Our mission is to be the leading
manufacturer, marketer and seller of
natural and organic food and person-
al care products by anticipating and
exceeding consumer expectations by
providing quality, innovation, value
and convenience. We are committed
to growing our Company while con-
tinuing to implement environmentally
sound business practices and manu-
facturing processes.
Our business strategy is to integrate all
of our brands under one management
team and employ a uniform market-
ing, sales and distribution program.
We capitalize on our brand equity and
the distribution achieved by each of
our acquired businesses with strategic
introductions of new products that
complement existing lines to enhance
revenues and margins.
The Hain Celestial Group common stock
trades on The NASDAQ® Global Select
Market under the symbol HAIN.
The Hain Celestial Group, Inc. | 2007 Annual Report
1
63715_Text.indd 163715_Text.indd 1 2/23/08 7:45:02 PM2/23/08 7:45:02 PM
Dear Fellow Shareholders:
Increasing interest in health and wellness continues to drive category sales in the consumer packaged goods sector, and continued convenience and innovation, and demographic trends, have led to impressive growth according to industry reports. At the same time, such chronic health issues as diabetes, heart disease, hypertension and obesity have reached epidemic status worldwide for not only aging baby boomers, but also today’s youth in many developed populations. With this, the trend toward eating foods and using personal care products that are healthy and organic continues to accelerate on a global basis. Consumers also have a heightened appreciation for sustainability and its direct impact on the environment, as they seek to lessen their everyday impact on the carbon footprint.
Trends gaining momentum in 2007—and expected to expand in 2008—include consumers seeking healthful solutions through functional food, and making conscientious buying decisions based upon sustainability and environmen-tal responsibility. With the increasing availability of fresh foods, nutrient-rich frozen foods and antioxidant-rich func-tional foods, these trends continue to bode well for our Company.
In fiscal year 2007, the fundamentals of our business at Hain Celestial remained strong and continued to be driven by the successful execution of our strategy. I am particularly gratified by how the more than 2,100 dedicated and talented employees of our Company cultivated the growth of our natural and organic products through a variety of distribution channels in the United States, Canada, the United Kingdom and
throughout Europe, and with selected distribution in other international markets. We achieved solid sales and earnings growth in excess of 20%, with increased consumption and margin enhancement, along with continued appreciation in the share price of theCompany’s stock.
Financial Overview and Key Metrics. Our financial and business performance in fiscal year 2007 was especially note-worthy because we achieved thesesuccesses in the face of increasing chal-lenges from escalating commodity and fuel costs felt across the industry, which added to the competitive environment.
However, we have carefully set our course, and we have the right management team in place across the organization to drive our business forward. With that, the Company achieved record net sales of $900.4 million, a nearly 22% increase over the prior year’s net sales of $738.6 million. We recorded strong performance in our grocery, snacks and personal care brands, including Earth’s Best®, Arrowhead Mills®, Health Valley®, Garden of Eatin’®, Spectrum Naturals®, Spectrum Essentials® and JASON®, and sales in our international markets—Canada and Europe, including the United Kingdom for the full year.Our internal growth was supplemented during the year by the acquisitions of the Avalon Organics® and Alba Botanica® personal care brands and through the expansion of meat-alternative product offerings in the United States and the United Kingdom.
Net income reached $47.5 million, or $1.16 per share, a 31% increase from
$36.4 million, or $0.93 per share, asour weighted average shares outstand-ing increased by 2.2 million shares. Although affected by increasing input costs including employee costs, our gross profit improved marginally as a percent of sales, increasing to 29% from 28.9%.
The benefits from our increased cash management initiative, which we began two years ago, resulted in the Company generating operating free cash flow of $55.0 million for the year, an increase of 45% over the prior year’s $38.1 million. We ended the fiscal year with a strong balance sheet, with $198.5 mil-lion in working capital, a current ratio of 2.7 to 1 and debt as a percentage of equity at 31%, with an equity base of $697.0 million.
Acquisitions. We acquired Haldane Foods in the fall of 2006, which strengthened our position in the meat-alternative category in the United Kingdom and increased our non-dairy beverage offerings there. In the United States, we entered the tofu category to complement our existing meat-alternative product offerings. We also solidified our personal care position in skin care, hair care, bath and body care, and sun care products with the addition of Avalon Organics and Alba Botanica in January 2007, and in December 2007 (fiscal year 2008) we completed the acquisition of TenderCare to expand our presence in natural personal care with chlorine- and gel-free diapers and wipes.
Alliances. We furthered our alliance with Yeo Hiap Seng Limited in Asia as both companies increased their investments to
The Hain Celestial Group, Inc. | 2007 Annual Report
Phot
o by
Tar
an M
orga
n
2
63715_Text.indd 263715_Text.indd 2 2/23/08 9:20:13 PM2/23/08 9:20:13 PM
“We achieved solid sales and earnings growth in excess of 20% … along with continued appreciation in the share price of the Company’s stock.”
a total of $8 million. We plan to establish two joint ventures to (i) pursue joint inter-ests in marketing and distribution of food and beverages, and product development, and (ii) make investments in natural and organic food and personal care product companies in Asia. At the beginning of fiscal year 2008, Hain Pure Protein acquired the assets of Plainville Turkey Farm in our home state of New York, increasing the scale of our specialty poul-try operations.
New Products. New products and inno-vation continue to be a solid cornerstone of our business. We introduced many new products including the successful relaunch of the Linda McCartney® range of vegetarian frozen food products in the United Kingdom, providing healthy and convenient meal solutions with improved, contemporary packaging. In the United States, we launched a gluten-free product initiative across many of our brands with more than 100 gluten-free products from Arrowhead Mills, DeBoles®, Imagine®, Rice Dream®, Soy Dream®, Hain Pure Foods® and Celestial Seasonings. Other new products included Rice Dream Supreme, Terra® Stripes and Blues™, Arrowhead Mills organic stuffing and cake mixes, and Garden of Eatin’ multi-grain varieties and baked tortilla chips. We reformulated many of our Health Valley® products to be organic,and the Earth’s Best Sesame Street® line expanded into the frozen foodscategory with the introduction of waffles,ravioli and pizza—all fortified withvitamins and minerals.
Management and Governance. As partof our strategy to reinvigorate Celestial Seasonings, we promoted several indi-viduals from our talent base within the Company, appointing David Ziegert as Acting General Manager and Jack White as Vice President—Sales, while Mike Bloom recently joined us as Vice President—Marketing. At our World
Headquarters, Linda Piacentini joined our corporate management team as Vice President—Human Resources, expand-ing the benefits of critical human resources disciplines across our growing worldwide business. We also gained experienced management through our acquisitions, as Lori Beaudoin joined us from Avalon Natural Products to become Chief Financial Officer—Personal Care and Jim Reed was appointed President—Plainville Farms. Our Board of Directors continues to provide invaluable support to the success of the Company, and this year, Richard Berke, Vice President—Human Resources for Broadridge Financial Solutions, Inc., global pro-vider of technology-based outsourcing solutions, was appointed to the Board, bringing a global perspective to the Company.
Social Responsibility. Our employees have a long tradition of service to their local communities, acting to help improve the lives of others with the same passion that drives our commitment to producing the finest healthful and natural food and personal care products for our customers. As a company, we recognize this by continuing to support many causes in the not-for-profit sector in the local communities in which we operate, as well as organizations on a national level, with corporate giving and other initiatives supported by our individual brands. Through the Green Campaign we inaugurated last year, we are conserving resources at all of our facilities by increasing usage of recycled papers and products, and harnessing alternative sources of energy by using solar, wind or hydroelectric power at some facilities.
Looking Ahead. As the natural and organic sector has moved into main-stream acceptance, Hain Celestial is well positioned to meet increasing con-sumer needs in various distribution
channels, despite the demands of increas-ing input costs and food inflation.Lasting consumer awareness of the benefits of natural and organic food and personal care products, coupled with our legacy brands and innovative products, continues to drive our sales growth in various distribution channels. This demand provides the Company with momentum for our solid sales and earnings growth. At the same time, as we leverage our existing infrastructure and integrate our acquired operations, we are focused on delivering addition-al operating efficiencies and margin improvements. I want to thank our employees, who have continued to build upon our leadership in the sector by thinking about how we can improve all aspects of our business while anticipat-ing our consumers’ needs.
Fiscal year 2007 was a dynamic one for our Company as we addressed signifi-cant challenges and realized important successes. With the loyal support of our customers and our worldwide consumer base, employees and business partners, we look to continue to deliver the sales and earnings growth that you and I, as shareholders, have come to expect.
May you continue to lead
A Healthy Way of Life™,
Irwin D. Simon
President, Chief Executive Officerand Chairman of the Board
3
63715_Text.indd 363715_Text.indd 3 2/23/08 9:20:43 PM2/23/08 9:20:43 PM

The Hain Celestial Group, Inc. | 2007 Annual Report
Doing what comes NATURALLYFertile Ground
The natural and organic products
industry in the United States has been
growing steadily for many years, but
2006 was a special year, indeed. For
the fi rst time since 1999, both natural
products retailers and mass market re-
tailers (including grocery, drug, mass
merchandisers, club and convenience
stores) saw double-digit growth of
natural products sales. It was the
second year in a row of double-digit
growth for natural products retailers,
who have close to 50% of the market
share for natural products.
With increasing consumer concerns
about food safety and environmen-
tal sustainability and protection,
and increasing demand for products
that are healthful and convenient,
the natural and organic products in-
dustry is ripe for continued growth.
In 2006, the industry reached nearly
$60 billion in sales in the United
States alone. Outside the United
States, the forecast for sales of nat-
ural and organic products is very
encouraging: global sales are expect-
ed to grow 20% to 30% each year
to reach $100 billion in 2008. Other
key markets we serve in Canada and
the European Union are expected to
continue their double-digit growth
through at least 2010.
While food products make up
approximately 56% of sales in the
natural and organic products in-
dustry, the personal care products
category has been a very strong per-
former. After growing more than
$2 billion between 2002 and 2006,
this category is expected to post an-
other large increase by 2012 with
projected annual sales of nearly
$10.2 billion.
Sowing the Seeds
At Hain Celestial, our diverse
portfolio of international natural
and organic brands consists of food
and personal care products and
positions us to take advantage of
these fl ourishing markets. As more
and more conventional retailers
add natural and organic products
to their shelves, as natural foods
retailers open more stores, and as
traditional supermarkets increase
their natural product offerings and
shift natural products into main-
stream aisles, producers are able to
develop a broader range of products
and expose more consumers to their
brands more frequently. This reach
helps develop consumer brand loy-
alty and creates greater demand for
higher quality natural and organic
products, furthering the opportuni-
ties for our portfolio of brands.
4
63715_Text.indd 463715_Text.indd 4 2/23/08 7:45:22 PM2/23/08 7:45:22 PM
The appeal of natural and organic
products is perhaps nowhere more
evident than in the baby products
market, where sales of our Earth’s
Best® brand of infant formula, food
and personal care items for babies
and toddlers continue to expand
with double-digit growth year
over year. In addition, the Earth’s
Best partnership with Sesame
Workshop® has been successful in
bringing healthful foods to toddlers
and children in the United States,
and in 2007 we began distributing
this product line in Canada.
Reaping the Benefi ts
Earth’s Best has also had success
in the freezer case with its Sesame
Street® Whole Grain Cheese Pizza,
which was named the “2007 Hot
Product of the Year” by Retailing
Today. Celestial Seasonings®, an im-
portant heritage brand, underwent
its fi rst major redesign in nearly 40
years. The new, modern look clearly
emphasizes fl avor, and a uniform
packaging architecture leads con-
sumers more easily to their favorite
teas on the shelf. At the begining of
fi scal year 2008, Celestial Seasonings
also entered the premium tea market
with Saphara™, a line of USDA Cer-
tifi ed Organic, Fair Trade Certifi ed™
whole-leaf teas packaged in pyramid
tea bags, and the coffee market with
a line of premium specialty blend
USDA Certifi ed Organic, Fair Trade
Certifi ed™ whole-bean coffee under
the Celestial Seasonings brand.
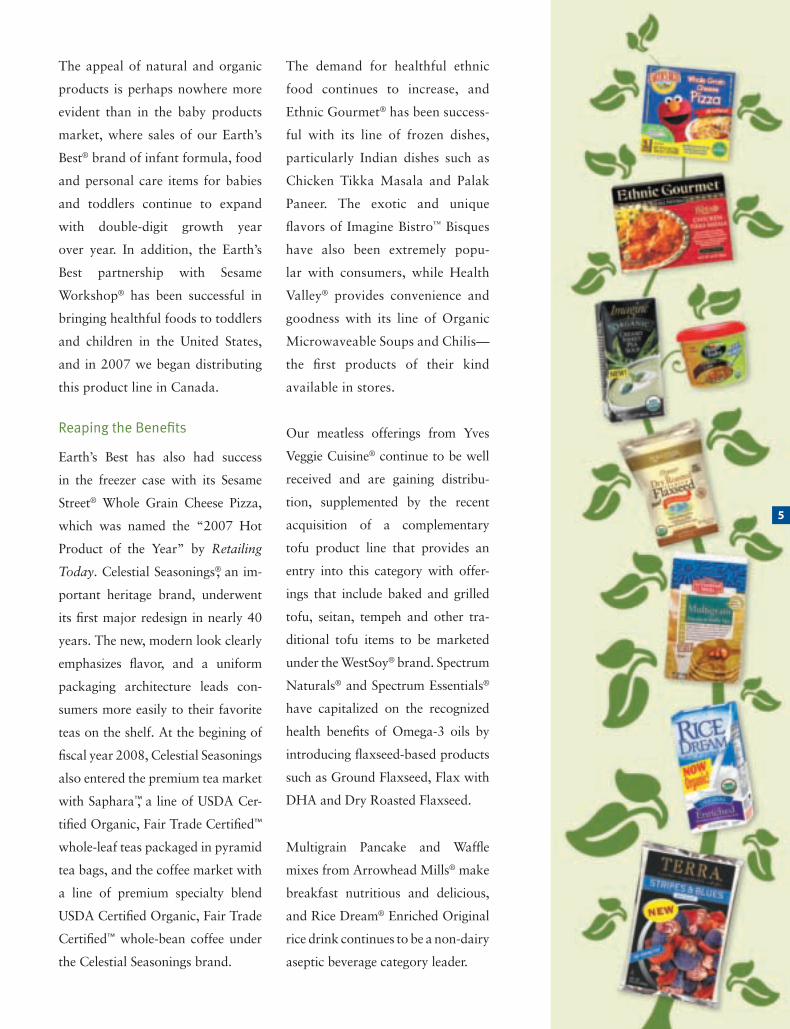
The demand for healthful ethnic
food continues to increase, and
Ethnic Gourmet® has been success-
ful with its line of frozen dishes,
particularly Indian dishes such as
Chicken Tikka Masala and Palak
Paneer. The exotic and unique
fl avors of Imagine Bistro™ Bisques
have also been extremely popu-
lar with consumers, while Health
Valley® provides convenience and
goodness with its line of Organic
Microwaveable Soups and Chilis—
the fi rst products of their kind
available in stores.
Our meatless offerings from Yves
Veggie Cuisine® continue to be well
received and are gaining distribu-
tion, supplemented by the recent
acquisition of a complementary
tofu product line that provides an
entry into this category with offer-
ings that include baked and grilled
tofu, seitan, tempeh and other tra-
ditional tofu items to be marketed
under the WestSoy® brand. Spectrum
Naturals® and Spectrum Essentials®
have capitalized on the recognized
health benefi ts of Omega-3 oils by
introducing fl axseed-based products
such as Ground Flaxseed, Flax with
DHA and Dry Roasted Flaxseed.
Multigrain Pancake and Waffl e
mixes from Arrowhead Mills® make
breakfast nutritious and delicious,
and Rice Dream® Enriched Original
rice drink continues to be a non-dairy
aseptic beverage category leader.
5
63715_Text.indd 563715_Text.indd 5 2/23/08 7:45:27 PM2/23/08 7:45:27 PM
At Hain Celestial, we are also proud
to affi rm our long-standing commit-
ment to providing all consumers,
including those with a sensitivity
to food allergens, with A Healthy
Way of Life™. One example of this
is our new multi-brand Gluten-Free
Product Initiative. With more than
100 gluten-free products spanning
our Arrowhead Mills®, Celestial
Seasonings®, DeBoles®, Imagine®, Rice
Dream®, Soy Dream® and Hain Pure
Foods® brands and products ranging
from fl uffy pancakes to cool, creamy
non-dairy frozen desserts, Hain
Celestial satisfi es gluten-free pal-
ates for both meal and snacking
occasions.
In Europe, Lima® celebrated 50
years of commitment to organic
foods with a special awareness-
building campaign, while Natumi®
underwent a brand restaging that
resulted in an increase in sales
of its vegetable milks. The Linda
McCartney® range of vegetarian
frozen entrées was relaunched in the
United Kingdom with a new look and
revitalized recipes that improved the
fl avors and aromas of the dishes. In
Canada, distribution of many core
brands such as Yves Veggie Cuisine®,
Earth’s Best®, Terra® and Imagine®
has expanded to other distribution
channels outside of grocery and
natural foods.
To meet the needs of the burgeoning
market for antibiotic-free, vegetarian-
fed natural chicken, we launched
the FreeBird™ line of fully cooked
chicken products for both retail
and foodservice applications in
the United States. FreeBird Grilled
Chicken Breast Strips were named by
Progressive Grocer as an “Editors’
Pick—Best New Product of 2007”
in the frozen food category, and
offer consumers the convenience and
delicious taste of fully cooked all-
natural chicken without preservatives
or antibiotics.
Pure, natural ingredients are also at
the core of Mountain Sun® juices,
and antioxidant-rich Pure Cranberry
is a standout product.
More than half of all food in the
United States is consumed outside
the home, and Hain Celestial has
adapted many products for use in
both commercial and non-commer-
cial foodservice outlets. Penetration
in all segments has increased over
last year, and foodservice remains a
strong opportunity for growth.
The Hain Celestial Group, Inc. | 2007 Annual Report
SPROUTINGup in new categories
6
63715_Text.indd 663715_Text.indd 6 2/23/08 7:45:29 PM2/23/08 7:45:29 PM
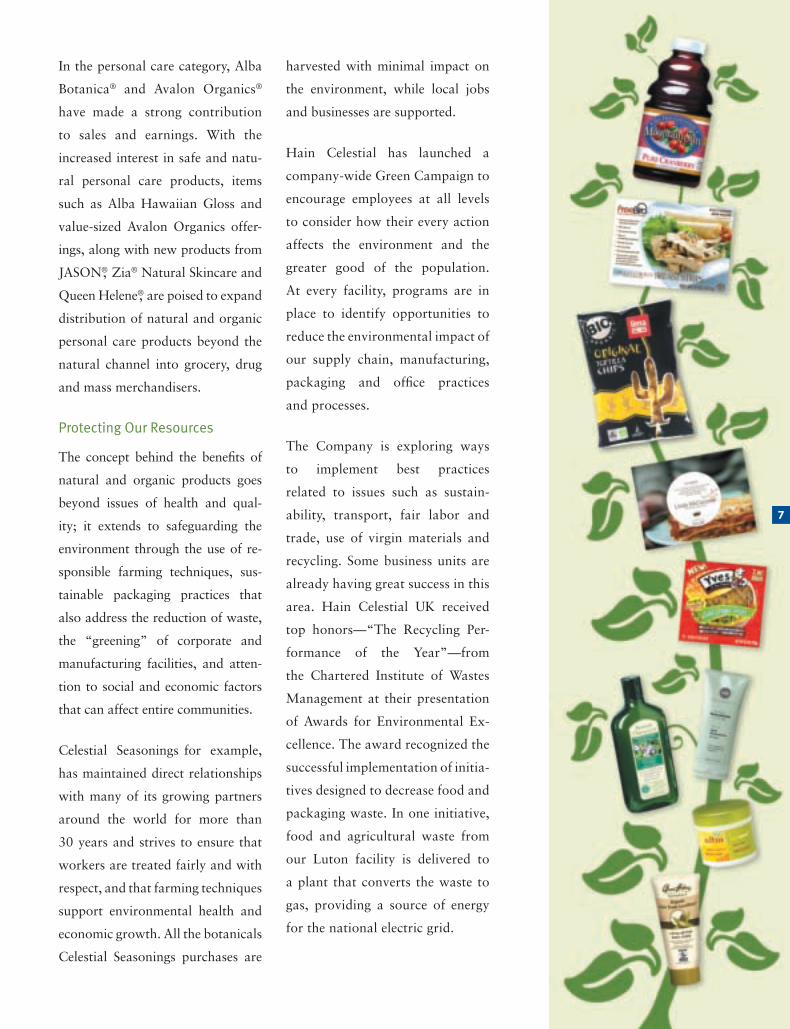
In the personal care category, Alba
Botanica® and Avalon Organics®
have made a strong contribution
to sales and earnings. With the
increased interest in safe and natu-
ral personal care products, items
such as Alba Hawaiian Gloss and
value-sized Avalon Organics offer-
ings, along with new products from
JASON®, Zia® Natural Skincare and
Queen Helene®, are poised to expand
distribution of natural and organic
personal care products beyond the
natural channel into grocery, drug
and mass merchandisers.
Protecting Our Resources
The concept behind the benefi ts of
natural and organic products goes
beyond issues of health and qual-
ity; it extends to safeguarding the
environment through the use of re-
sponsible farming techniques, sus-
tainable packaging practices that
also address the reduction of waste,
the “greening” of corporate and
manufacturing facilities, and atten-
tion to social and economic factors
that can affect entire communities.
Celestial Seasonings for example,
has maintained direct relationships
with many of its growing partners
around the world for more than
30 years and strives to ensure that
workers are treated fairly and with
respect, and that farming techniques
support environmental health and
economic growth. All the botanicals
Celestial Seasonings purchases are
harvested with minimal impact on
the environment, while local jobs
and businesses are supported.
Hain Celestial has launched a
company-wide Green Campaign to
encourage employees at all levels
to consider how their every action
affects the environment and the
greater good of the population.
At every facility, programs are in
place to identify opportunities to
reduce the environmental impact of
our supply chain, manufacturing,
packaging and offi ce practices
and processes.
The Company is exploring ways
to implement best practices
related to issues such as sustain-
ability, transport, fair labor and
trade, use of virgin materials and
recycling. Some business units are
already having great success in this
area. Hain Celestial UK received
top honors —“The Recycling Per-
formance of the Year”—from
the Chartered Institute of Wastes
Management at their presentation
of Awards for Environmental Ex-
cellence. The award recognized the
successful implementation of initia-
tives designed to decrease food and
packaging waste. In one initiative,
food and agricultural waste from
our Luton facility is delivered to
a plant that converts the waste to
gas, providing a source of energy
for the national electric grid.
7
63715_Text.indd 763715_Text.indd 7 2/23/08 7:45:34 PM2/23/08 7:45:34 PM
We are examining renewable energy
sources for all our operations, and
some facilities are already employing
solar, wind or hydroelectric power. In
Canada, a signifi cant portion of our
freight is now carried by rail rather
than by truck, providing a measur-
able reduction in fuel consumption
and reducing our carbon footprint.
Promoting Health
In addition to environmental con-
cerns, Hain Celestial is committed
to supporting social welfare and
health causes through sponsorships
and product development. With
heightened awareness of childhood
obesity, Earth’s Best® continues to
partner with Sesame Workshop®
on its Healthy Habits for Life™ ini-
tiative to offer healthful meal and
snack alternatives so children can
develop healthy eating habits at a
young age.
During fi scal year 2007, Celestial
Seasonings® continued its partner-
ship with the National Heart, Lung,
and Blood Institute to help raise
awareness of heart disease in women,
and Avalon Organics® strengthened
its long-standing relationship with
The Breast Cancer Fund by sponsor-
ing the Avalon Heroes Challenge, a
matching grant funding program for
breast cancer research.
We are very concerned with the
quality of ingredients we use to
make our products, and understand
the effects poor-quality or synthetic
ingredients can have on the health
of consumers. Many Hain Celestial
food and beverage products have
always been whole grain-based,
certifi ed organic, low in fat and
naturally sweetened, with no trans
fat, cholesterol, artifi cial colors and
fl avors, preservatives or genetically
engineered ingredients.
The Hain Celestial Group is com-
mitted to increasing the availability
of high-quality natural and organic
products to ensure the continued
health of you, your family and
our planet.
Join us in leading A Healthy Way
of Life™.
The Hain Celestial Group, Inc. | 2007 Annual Report
Organically GROWING our brands
8
63715_Text.indd 863715_Text.indd 8 2/23/08 7:45:36 PM2/23/08 7:45:36 PM
The Hain Celestial Group, Inc.
Common Stock Prices
The outstanding shares of our Common Stock, parvalue $.01 per share, are listed on the NASDAQGlobal Select Market under the ticker symbol HAIN.
The following table sets forth the reported high andlow sales prices for our Common Stock for each fiscalquarter from July 1, 2005 through December 31, 2007.
Common StockFY 2008 FY 2007 FY 2006
High Low High Low High Low
First Quarter . . . . . . . . . . . . . . . . . . . . . . . . . . . . . . . . . $32.33 $26.16 $26.99 $19.88 $20.59 $17.84Second Quarter . . . . . . . . . . . . . . . . . . . . . . . . . . . . . . . 35.14 29.69 31.93 25.09 22.75 18.11Third Quarter . . . . . . . . . . . . . . . . . . . . . . . . . . . . . . . . 31.31 28.20 26.67 20.73Fourth Quarter . . . . . . . . . . . . . . . . . . . . . . . . . . . . . . . 31.50 26.78 27.94 24.20
As of January 23, 2008, there were 460 holders ofrecord of our Common Stock. We have not paid anydividends on our Common Stock to date. We intendto retain all future earnings for use in the develop-ment of our business and do not anticipate declaringor paying any dividends in the foreseeable future. Thepayment of all dividends will be at the discretion of
our Board of Directors and will depend on, amongother things, future earnings, operations, capitalrequirements, contractual restrictions, includingrestrictions under our credit facility and our out-standing senior notes, our general financial conditionand general business conditions.
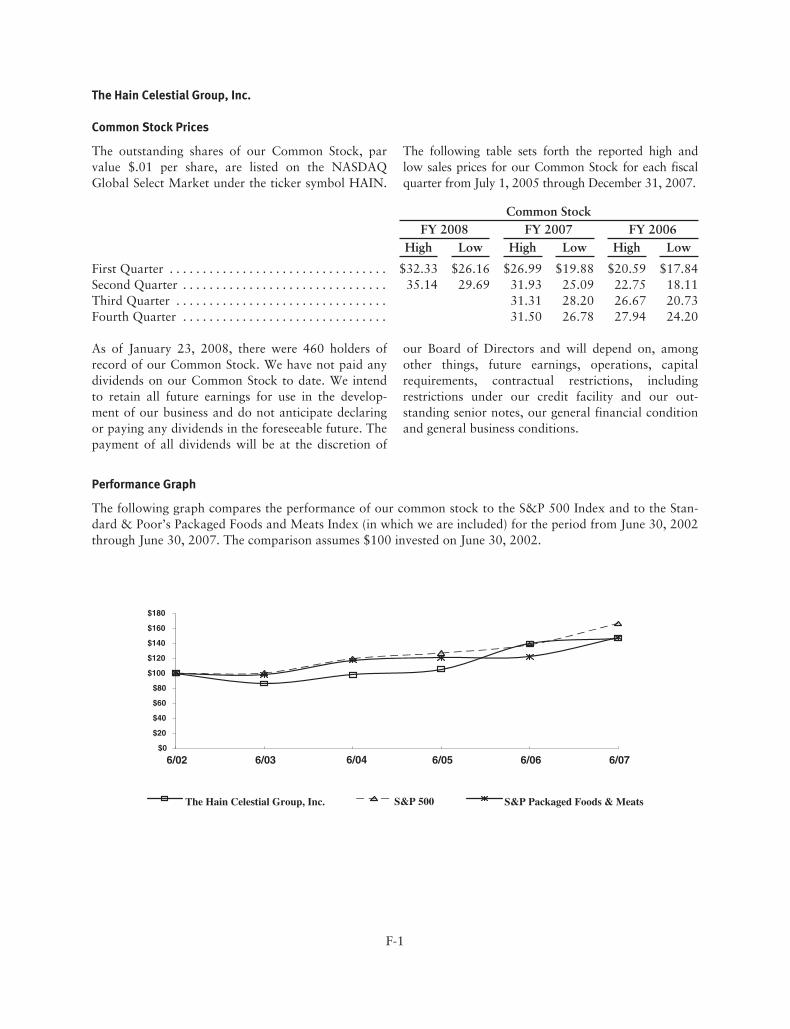
Performance Graph
The following graph compares the performance of our common stock to the S&P 500 Index and to the Stan-dard & Poor’s Packaged Foods and Meats Index (in which we are included) for the period from June 30, 2002through June 30, 2007. The comparison assumes $100 invested on June 30, 2002.
$0
$20
$40
$60
$80
$100
$120
$140
$160
$180
6/02 6/03 6/04 6/05 6/06 6/07
The Hain Celestial Group, Inc. S&P 500 S&P Packaged Foods & Meats
F-1
Management’s Discussion and Analysis of Financial Condition and Results of Operations.
Restatement of Previously IssuedFinancial Statements
In this Annual Report for the fiscal year endedJune 30, 2007 (the “2007 Annual Report”), theCompany is restating its consolidated balance sheetas of June 30, 2006, and the related consolidatedstatements of operations, stockholders’ equity andcash flows for each of the fiscal years endedJune 30, 2006 and 2005. This restatement resultedfrom the findings of an investigation of our histor-ical stock option grant processes and relatedaccounting that was undertaken by a group of ourindependent directors. This 2007 Annual Reportalso reflects the restatement of “Selected FinancialData” in for the fiscal years ended June 30, 2006,2005, 2004 and 2003.
Review of Historical Equity Granting Process
On June 15, 2007, we announced that the Companyhad received an informal inquiry from the SEC con-cerning the Company’s stock option granting practi-ces and the related accounting and disclosures.Shortly thereafter, a group of four independentdirectors (the “Independent Directors”) was estab-lished by Hain Celestial’s Board of Directors toconduct an independent investigation relating to theCompany’s historical stock option practices. Withthe assistance of independent legal counsel andexperts retained by counsel, the Independent Direc-tors conducted an extensive review of historicalstock option practices, including all awards made bythe Company since its initial public offering inNovember 1993 through May 6, 2005, the last dateon which stock options were granted. The inves-tigation also included review of the Company’saccounting policies, accounting records, supportingdocumentation, email communications and otherdocumentation, as well as interviews with a numberof current and former directors, officers andemployees. Based on this review, the Company hasdetermined that additional pre-tax, non-cash chargesfor stock-based compensation expense aggregating$16.9 million over the twelve-year period from 1994through 2005 should be recognized.1 The Companygranted options to purchase approximately 12 mil-
lion shares to more than 1,200 employees and direc-tors on 125 separate grant dates during the approx-imate twelve-year fiscal period reviewed. The grantsincluded (1) broad-based grants to large numbers ofHain Celestial employees, (2) new hire/promotiongrants, (3) grants to senior executives and(4) director grants.
On January 29, 2008, the Independent Directorsreported to the Board their final findings. TheIndependent Directors indicated that they and theiradvisors received the Company’s full cooperationthroughout the review. As described in more detailbelow, the review of the Company’s stock optiongrants and procedures identified various deficienciesin the process of granting and documenting stockoptions. The stock option granting process wasinformal and inadequately documented throughoutmuch of the period under review. In addition, formany grants there were insufficient or incompleteapprovals and inadequate or incomplete establish-ment of the terms of the grants, including the list ofindividual recipients.
The Independent Directors’ review found, amongother things, that:
• There was inadequate documentation supportingthe measurement dates for a number of company-wide annual grants as well as some executivegrants and grants to new employees;
• Approximately one-third of all options grantedwere priced at quarterly or annual lows;
• Some grant dates in earlier periods appear to havebeen selected with hindsight. Beginning in 2003,documentation relating to annual and othergrants improved, although some errors occurredthereafter in the form of additions, corrections oradjustments to lists of grant recipients after therecorded measurement dates;
• No information came to the attention of theIndependent Directors which caused them tobelieve that any current officers, directors oremployees of the Company engaged in any know-ing or intentional misconduct with regard to theCompany’s option granting process.
1 As discussed below, the Company has determined that, based on the revised measurement dates, the pre-tax, non-cash charges for stock-based compensation expense aggregated $20.5 million (before the reversal of the 2005 stock option vesting acceleration charge of $3.6million) over the twelve-year period from 1994 through 2005.
F-2
The Company’s Stock Option Plans and the OptionGranting Process
The vast majority of the Company’s stock optiongrants were made pursuant to five stock optionplans – two employee stock option plans adopted in1994 and 2002 (the “1994 Plan” and the “2002Plan”), two stock option plans for non-employeedirectors adopted in 1996 and 2000 (the “1996Directors Plan” and the “2000 Directors Plan”),and the 1993 Executive Stock Option Plan (the“1993 Plan”). The 1993 Plan, 1994 Plan and the2002 Plan for employee stock options provided foradministration by the Compensation Committee ofthe Board of Directors and gave the Committee theauthority to determine the exercise price of optionsgranted and the date of grant. The 1994 Plan andthe 2002 Plan also, however, allowed theCompensation Committee to delegate any of itsfunctions to officers or managers of the Company,except as to awards to Section 16 officers. As dis-cussed below, the Independent Directors’ reviewfound that while the Compensation Committee didmeet telephonically or in person on a number ofoccasions to approve option grants to Mr. Simon,typically with a representative of the Company, and,from time to time, outside counsel present, doc-umentation of the Compensation Committee’sactions was often not available in the Company’srecords. The members of the CompensationCommittee relied upon the Company to documentthe Committee’s actions and apply the appropriateaccounting treatment. The Independent Directors’review found that this lack of available doc-umentation in the Company’s records of actions bythe Compensation Committee made the determi-nation of the dates of approval of grants toMr. Simon difficult. For grants after 2002 betterdocumentation of the timing of approval of grantsto Mr. Simon was available, and no additionalcompensation expense for grants to Mr. Simon after2002 has been recognized.
As to grants to other officers and employees, possi-bly including Section 16 officers, delegation ofapproval authority to the Chief Executive Officerappears to have been the standard practice. Formost of the period from 1994 to 2004 the ChiefExecutive Officer of the Company, assisted by theChief Financial Officer, the Vice President forHuman Resources, and the executive heads of vari-ous divisions, determined the recipients and
amounts of stock option awards to employees of theCompany, with the final required action being theChief Executive Officer’s approval.
The Independent Directors found that the Compa-ny’s practice on pricing of option grants was incon-sistent – at times the Company used the closingprice of the Company’s stock the day before appro-val, and at other times the closing price on the dayof approval. In its restatement the Company hasadjusted options pricing to uniformly use the closingprice on the day of the approval of the options asthe preferable pricing method.
Of the $20.5 million in additional compensationexpense recognized, approximately $7.2 million isattributable to grants awarded to current or formerSection 16 officers, $0.4 million is attributable togrants awarded to directors, and the remaining$12.9 million is attributable to grants awarded toother employees.
Broad-Based Grants to Employees
For broad-based grants to employees, the requiredgranting action was the approval of the awards bythe Chief Executive Officer. The Independent Direc-tors’ review found that, prior to February 2003, thisapproval was not thoroughly documented if at all.The Independent Directors’ review found that fromFebruary 2003 forward the Company’s optiongranting processes included better documentation ofapproval, and a more formal granting process wasimplemented. The independent Directors conducteda grant-by-grant analysis using the available evi-dence for each grant, determined the date whengrants were fixed with finality, and revisedmeasurement dates if necessary.
New Hire or Promotion Grants
The Independent Directors’ review found that it wasthe practice at the Company for some senior execu-tives to receive stock options as part of their nego-tiated compensation package upon joining theCompany or upon assuming a more senior positionwithin the Company. It was noted in the review thatsome offer or promotion letters included a statementthat the employee would receive options at thelowest price within a several-month period. Reviewof selected personnel files for active and terminatedemployees demonstrated that: 1) option grants for
F-3
new hires and promotions were the exception,rather than the rule, and 2) even for those new hiresand promoted employees who received stockoptions as part of their compensation this “lowestprice” language was unusual. For grants to employ-ees whose new hire or promotion letter includedsuch “lowest price” language the Company hasconsidered whether that language led to the issuanceof a discounted option and accounted for the grantaccordingly.
The Independent Directors’ review also found anumber of instances in which new hire or promo-tion option grants did not follow the terms outlinedin the new hire or promotion letters. Those grantshave been treated as repricings and given variableaccounting treatment.
Grants to Senior Executives
The Company is recognizing $1,371,000 of compen-sation expense related to options granted toMr. Simon between 1995 and 2001. Mr. Simon,who has been the Company’s Chief Executive Offi-cer since its founding, did not have the ability toauthorize grants to himself. Rather, all ofMr. Simon’s grants were approved by the Compen-sation Committee of the Board of Directors or, asdiscussed below, in some cases by the full Board.Stock options were a significant part of Mr. Simon’scompensation and were specifically provided for inhis several employment agreements with the Com-pany as disclosed in the Company’s annual proxystatements. The Independent Directors’ reviewfound that the Compensation Committee did meettelephonically or in person on a number of occa-sions to approve option grants to Mr. Simon, typi-cally with a representative of the Company, and,from time to time, outside counsel present. Themembers of the Compensation Committee reliedupon the Company to document the Committee’sactions and apply the appropriate accountingtreatment. The Independent Directors’ review foundthat documentation of the Compensation Commit-tee’s actions was often not available in the Compa-ny’s records. This lack of available documentationin the Company’s records of actions by theCompensation Committee made the IndependentDirectors’ determination of the dates of approvaldifficult. For grants after 2002 better documentationof the timing of approval of grants to Mr. Simonwas available, and no additional compensation
expense for grants to Mr. Simon after 2002 hasbeen recognized.
Mr. Simon received 600,000 stock options with aJuly 31, 2000 date and a strike price of $26.63. Theevidence indicates that by approving a term sheetfor Simon’s new employment agreement on June 30,2000 the Board of Directors expressed its intent togrant 300,000 of those options on June 30, 2000and 300,000 on July 1, 2000. Accordingly, thechange in the language of Mr. Simon’s finalemployment agreement to grant and date theoptions on or before July 31, 2000 was effectively arepricing of the options, resulting in variableaccounting treatment for the life of the grant. Thischange resulted in approximately $3.5 million ofcompensation expense in the quarter endedDecember 31, 2000; however, in accordance withthe requirements of variable accounting, such com-pensation expense reversed in its entirety in the fol-lowing quarters as the market price of theCompany’s stock dropped below $26.63. Themarket price remained below $26.63 for all sub-sequent quarters with the exception of the quarterended December 31, 2001, until variable accountingtreatment was eliminated by the adoption of SFASNo. 123R. As a result, the repricing of this optiondid not have any impact on the cumulative effectrecorded as of July 1, 2004.
The Independent Directors’ review found that agrant of 300,000 options to Mr. Simon at theJuly 11, 2001 closing price, which was the low priceof the stock for that month, was approved by thefull Hain Celestial Board of Directors at a meetingon August 7, 2001. Although the Board was advisedthat a grant with a July 2001 date was required(Mr. Simon’s employment agreement provided thathis options would be granted between July 1 andJuly 31 of each year) in effect the Board approvedthe award of a stock option grant at a discountedprice on August 7. Because the approval action forthis grant occurred on August 7, 2001, that is therevised measurement date for this grant. Thischange resulted in approximately $1.2 million incompensation expense in the current restatement.
In determining the appropriate measurement datesfor Mr. Simon’s option grants, the Company gen-erally has relied upon the earliest contemporaneousdocumentary evidence for the grant. One exceptionis a grant made to Mr. Simon in connection with the
F-4
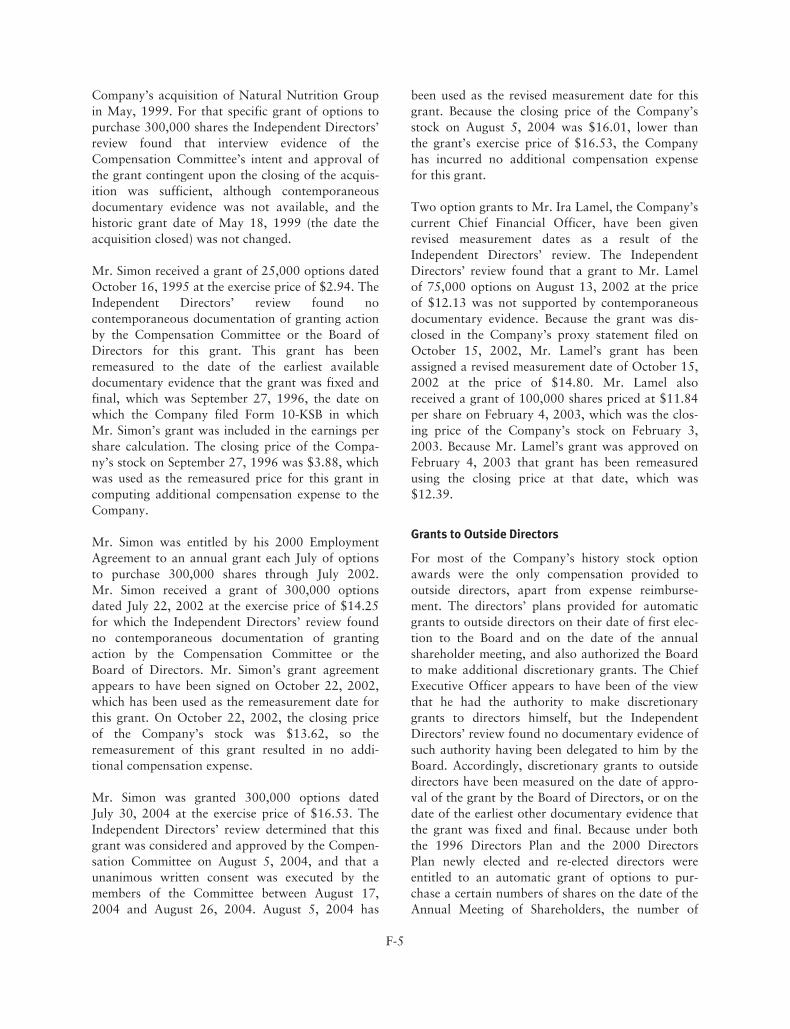
Company’s acquisition of Natural Nutrition Groupin May, 1999. For that specific grant of options topurchase 300,000 shares the Independent Directors’review found that interview evidence of theCompensation Committee’s intent and approval ofthe grant contingent upon the closing of the acquis-ition was sufficient, although contemporaneousdocumentary evidence was not available, and thehistoric grant date of May 18, 1999 (the date theacquisition closed) was not changed.
Mr. Simon received a grant of 25,000 options datedOctober 16, 1995 at the exercise price of $2.94. TheIndependent Directors’ review found nocontemporaneous documentation of granting actionby the Compensation Committee or the Board ofDirectors for this grant. This grant has beenremeasured to the date of the earliest availabledocumentary evidence that the grant was fixed andfinal, which was September 27, 1996, the date onwhich the Company filed Form 10-KSB in whichMr. Simon’s grant was included in the earnings pershare calculation. The closing price of the Compa-ny’s stock on September 27, 1996 was $3.88, whichwas used as the remeasured price for this grant incomputing additional compensation expense to theCompany.
Mr. Simon was entitled by his 2000 EmploymentAgreement to an annual grant each July of optionsto purchase 300,000 shares through July 2002.Mr. Simon received a grant of 300,000 optionsdated July 22, 2002 at the exercise price of $14.25for which the Independent Directors’ review foundno contemporaneous documentation of grantingaction by the Compensation Committee or theBoard of Directors. Mr. Simon’s grant agreementappears to have been signed on October 22, 2002,which has been used as the remeasurement date forthis grant. On October 22, 2002, the closing priceof the Company’s stock was $13.62, so theremeasurement of this grant resulted in no addi-tional compensation expense.
Mr. Simon was granted 300,000 options datedJuly 30, 2004 at the exercise price of $16.53. TheIndependent Directors’ review determined that thisgrant was considered and approved by the Compen-sation Committee on August 5, 2004, and that aunanimous written consent was executed by themembers of the Committee between August 17,2004 and August 26, 2004. August 5, 2004 has
been used as the revised measurement date for thisgrant. Because the closing price of the Company’sstock on August 5, 2004 was $16.01, lower thanthe grant’s exercise price of $16.53, the Companyhas incurred no additional compensation expensefor this grant.
Two option grants to Mr. Ira Lamel, the Company’scurrent Chief Financial Officer, have been givenrevised measurement dates as a result of theIndependent Directors’ review. The IndependentDirectors’ review found that a grant to Mr. Lamelof 75,000 options on August 13, 2002 at the priceof $12.13 was not supported by contemporaneousdocumentary evidence. Because the grant was dis-closed in the Company’s proxy statement filed onOctober 15, 2002, Mr. Lamel’s grant has beenassigned a revised measurement date of October 15,2002 at the price of $14.80. Mr. Lamel alsoreceived a grant of 100,000 shares priced at $11.84per share on February 4, 2003, which was the clos-ing price of the Company’s stock on February 3,2003. Because Mr. Lamel’s grant was approved onFebruary 4, 2003 that grant has been remeasuredusing the closing price at that date, which was$12.39.
Grants to Outside Directors
For most of the Company’s history stock optionawards were the only compensation provided tooutside directors, apart from expense reimburse-ment. The directors’ plans provided for automaticgrants to outside directors on their date of first elec-tion to the Board and on the date of the annualshareholder meeting, and also authorized the Boardto make additional discretionary grants. The ChiefExecutive Officer appears to have been of the viewthat he had the authority to make discretionarygrants to directors himself, but the IndependentDirectors’ review found no documentary evidence ofsuch authority having been delegated to him by theBoard. Accordingly, discretionary grants to outsidedirectors have been measured on the date of appro-val of the grant by the Board of Directors, or on thedate of the earliest other documentary evidence thatthe grant was fixed and final. Because under boththe 1996 Directors Plan and the 2000 DirectorsPlan newly elected and re-elected directors wereentitled to an automatic grant of options to pur-chase a certain numbers of shares on the date of theAnnual Meeting of Shareholders, the number of
F-5
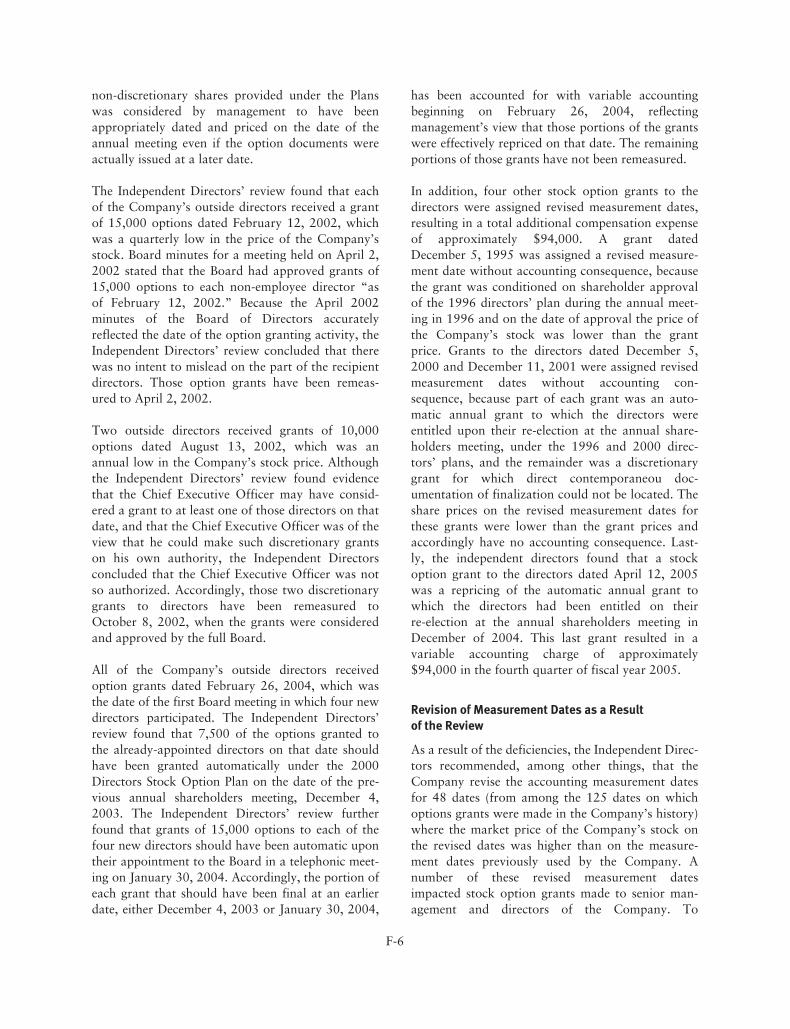
non-discretionary shares provided under the Planswas considered by management to have beenappropriately dated and priced on the date of theannual meeting even if the option documents wereactually issued at a later date.
The Independent Directors’ review found that eachof the Company’s outside directors received a grantof 15,000 options dated February 12, 2002, whichwas a quarterly low in the price of the Company’sstock. Board minutes for a meeting held on April 2,2002 stated that the Board had approved grants of15,000 options to each non-employee director “asof February 12, 2002.” Because the April 2002minutes of the Board of Directors accuratelyreflected the date of the option granting activity, theIndependent Directors’ review concluded that therewas no intent to mislead on the part of the recipientdirectors. Those option grants have been remeas-ured to April 2, 2002.
Two outside directors received grants of 10,000options dated August 13, 2002, which was anannual low in the Company’s stock price. Althoughthe Independent Directors’ review found evidencethat the Chief Executive Officer may have consid-ered a grant to at least one of those directors on thatdate, and that the Chief Executive Officer was of theview that he could make such discretionary grantson his own authority, the Independent Directorsconcluded that the Chief Executive Officer was notso authorized. Accordingly, those two discretionarygrants to directors have been remeasured toOctober 8, 2002, when the grants were consideredand approved by the full Board.
All of the Company’s outside directors receivedoption grants dated February 26, 2004, which wasthe date of the first Board meeting in which four newdirectors participated. The Independent Directors’review found that 7,500 of the options granted tothe already-appointed directors on that date shouldhave been granted automatically under the 2000Directors Stock Option Plan on the date of the pre-vious annual shareholders meeting, December 4,2003. The Independent Directors’ review furtherfound that grants of 15,000 options to each of thefour new directors should have been automatic upontheir appointment to the Board in a telephonic meet-ing on January 30, 2004. Accordingly, the portion ofeach grant that should have been final at an earlierdate, either December 4, 2003 or January 30, 2004,
has been accounted for with variable accountingbeginning on February 26, 2004, reflectingmanagement’s view that those portions of the grantswere effectively repriced on that date. The remainingportions of those grants have not been remeasured.
In addition, four other stock option grants to thedirectors were assigned revised measurement dates,resulting in a total additional compensation expenseof approximately $94,000. A grant datedDecember 5, 1995 was assigned a revised measure-ment date without accounting consequence, becausethe grant was conditioned on shareholder approvalof the 1996 directors’ plan during the annual meet-ing in 1996 and on the date of approval the price ofthe Company’s stock was lower than the grantprice. Grants to the directors dated December 5,2000 and December 11, 2001 were assigned revisedmeasurement dates without accounting con-sequence, because part of each grant was an auto-matic annual grant to which the directors wereentitled upon their re-election at the annual share-holders meeting, under the 1996 and 2000 direc-tors’ plans, and the remainder was a discretionarygrant for which direct contemporaneou doc-umentation of finalization could not be located. Theshare prices on the revised measurement dates forthese grants were lower than the grant prices andaccordingly have no accounting consequence. Last-ly, the independent directors found that a stockoption grant to the directors dated April 12, 2005was a repricing of the automatic annual grant towhich the directors had been entitled on theirre-election at the annual shareholders meeting inDecember of 2004. This last grant resulted in avariable accounting charge of approximately$94,000 in the fourth quarter of fiscal year 2005.
Revision of Measurement Dates as a Resultof the Review
As a result of the deficiencies, the Independent Direc-tors recommended, among other things, that theCompany revise the accounting measurement datesfor 48 dates (from among the 125 dates on whichoptions grants were made in the Company’s history)where the market price of the Company’s stock onthe revised dates was higher than on the measure-ment dates previously used by the Company. Anumber of these revised measurement datesimpacted stock option grants made to senior man-agement and directors of the Company. To
F-6
determine the revised measurement dates for theseoptions, we applied the guidance in AccountingPrinciples Board (“APB”) Opinion No. 25,“Accounting for Stock Issued to Employees,” whichdeems the measurement date as the first date onwhich all of the following are known: (1) theindividual employee who is entitled to receive theoption grant; (2) the number of options that anindividual employee is entitled to receive; and(3) the option’s exercise price. In addition, themeasurement date cannot be earlier than the date onwhich the grant is approved. We applied judgmentin determining whether to revise measurement datesfor prior option grants. In addition, if wedetermined that a measurement date needed to berevised, judgment was applied in determining theappropriate revised measurement date. In instanceswhere we determined we could not rely on theoriginal grant date for an option, we determinedrevised measurement dates based on our ability toestablish or confirm, in our reasonable judgment,whether through other documentation or crediblecircumstantial information, that all requirements forthe proper granting of the option had been satisfiedunder applicable accounting principles.
The Company previously accounted for its stockoption grants as fixed grants under APB OpinionNo. 25 and its related Interpretations, using ameasurement date of the recorded grant date,through its fiscal year ended June 30, 2005, afterwhich the Company adopted SFAS No. 123(R). Forall grants issued with an exercise price equal to thefair market value of our common stock on therecorded grant date or closing price on the day pre-ceding when the grant was approved,2 we originallyrecorded no stock-based compensation expense andprovided the required pro forma disclosures underSFAS No. 123, “Accounting for Stock-BasedCompensation.” Under APB Opinion No. 25, anon-cash, stock-based compensation expense wasrequired to be recognized for any option for whichthe exercise price was below the fair market valueon the actual grant date. This expense should havebeen amortized over the vesting period of theoption. We also determined that variable accountingtreatment was required under APB Opinion No. 25for certain stock option grants for which evidenceindicated that the original exercise price of theoption was subsequently modified. The applicationof variable accounting to stock option grantsrequires the remeasurement of the intrinsic value ofthe options be reported as compensation expense inthe consolidated statements of income at the end ofeach reporting period until the options areexercised, canceled or expire.
2 As noted above, the Independent Directors found that the Company’s practice on pricing of option grants was inconsistent – at times theCompany used the closing price of the Company’s stock the day before approval, and at other times the closing price on the day ofapproval. In its restatement the Company has adjusted options pricing to uniformly use the closing price on the day of the approval of theoptions as the preferable pricing method.
F-7
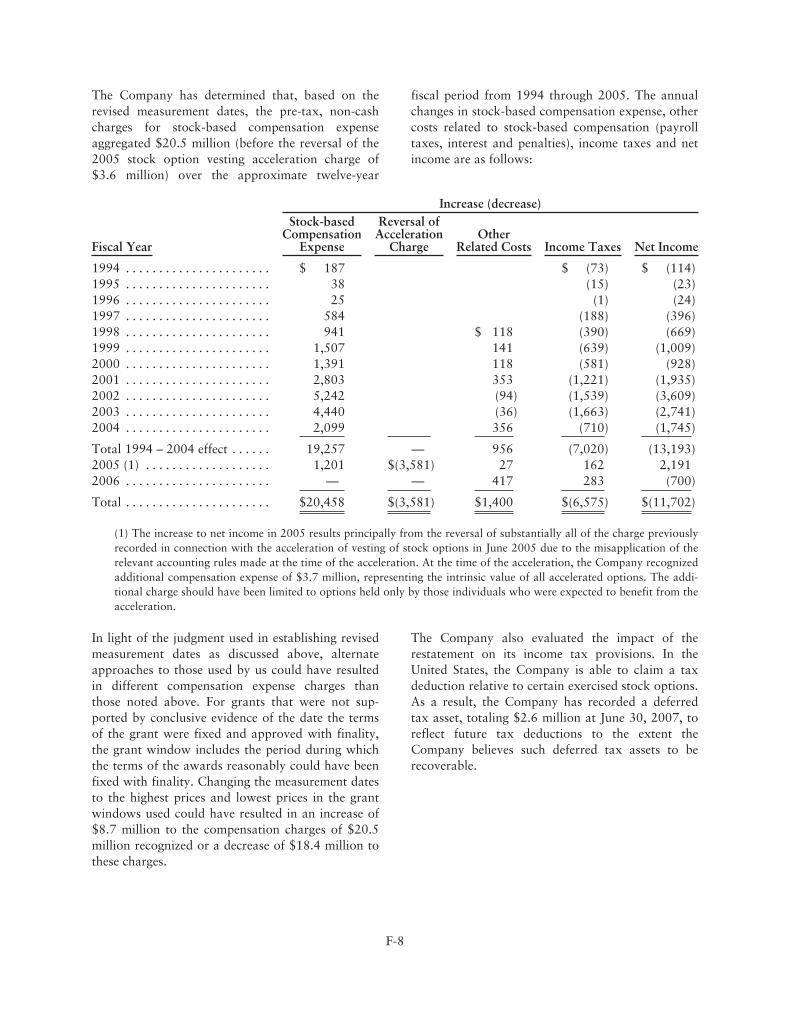
The Company has determined that, based on therevised measurement dates, the pre-tax, non-cashcharges for stock-based compensation expenseaggregated $20.5 million (before the reversal of the2005 stock option vesting acceleration charge of$3.6 million) over the approximate twelve-year
fiscal period from 1994 through 2005. The annualchanges in stock-based compensation expense, othercosts related to stock-based compensation (payrolltaxes, interest and penalties), income taxes and netincome are as follows:
Increase (decrease)
Fiscal Year
Stock-basedCompensation
Expense
Reversal ofAcceleration
ChargeOther
Related Costs Income Taxes Net Income
1994 . . . . . . . . . . . . . . . . . . . . . . $ 187 $ (73) $ (114)1995 . . . . . . . . . . . . . . . . . . . . . . 38 (15) (23)1996 . . . . . . . . . . . . . . . . . . . . . . 25 (1) (24)1997 . . . . . . . . . . . . . . . . . . . . . . 584 (188) (396)1998 . . . . . . . . . . . . . . . . . . . . . . 941 $ 118 (390) (669)1999 . . . . . . . . . . . . . . . . . . . . . . 1,507 141 (639) (1,009)2000 . . . . . . . . . . . . . . . . . . . . . . 1,391 118 (581) (928)2001 . . . . . . . . . . . . . . . . . . . . . . 2,803 353 (1,221) (1,935)2002 . . . . . . . . . . . . . . . . . . . . . . 5,242 (94) (1,539) (3,609)2003 . . . . . . . . . . . . . . . . . . . . . . 4,440 (36) (1,663) (2,741)2004 . . . . . . . . . . . . . . . . . . . . . . 2,099 356 (710) (1,745)
Total 1994 – 2004 effect . . . . . . 19,257 — 956 (7,020) (13,193)2005 (1) . . . . . . . . . . . . . . . . . . . 1,201 $(3,581) 27 162 2,1912006 . . . . . . . . . . . . . . . . . . . . . . — — 417 283 (700)
Total . . . . . . . . . . . . . . . . . . . . . . $20,458 $(3,581) $1,400 $(6,575) $(11,702)
(1) The increase to net income in 2005 results principally from the reversal of substantially all of the charge previouslyrecorded in connection with the acceleration of vesting of stock options in June 2005 due to the misapplication of therelevant accounting rules made at the time of the acceleration. At the time of the acceleration, the Company recognizedadditional compensation expense of $3.7 million, representing the intrinsic value of all accelerated options. The addi-tional charge should have been limited to options held only by those individuals who were expected to benefit from theacceleration.
In light of the judgment used in establishing revisedmeasurement dates as discussed above, alternateapproaches to those used by us could have resultedin different compensation expense charges thanthose noted above. For grants that were not sup-ported by conclusive evidence of the date the termsof the grant were fixed and approved with finality,the grant window includes the period during whichthe terms of the awards reasonably could have beenfixed with finality. Changing the measurement datesto the highest prices and lowest prices in the grantwindows used could have resulted in an increase of$8.7 million to the compensation charges of $20.5million recognized or a decrease of $18.4 million tothese charges.
The Company also evaluated the impact of therestatement on its income tax provisions. In theUnited States, the Company is able to claim a taxdeduction relative to certain exercised stock options.As a result, the Company has recorded a deferredtax asset, totaling $2.6 million at June 30, 2007, toreflect future tax deductions to the extent theCompany believes such deferred tax assets to berecoverable.
F-8
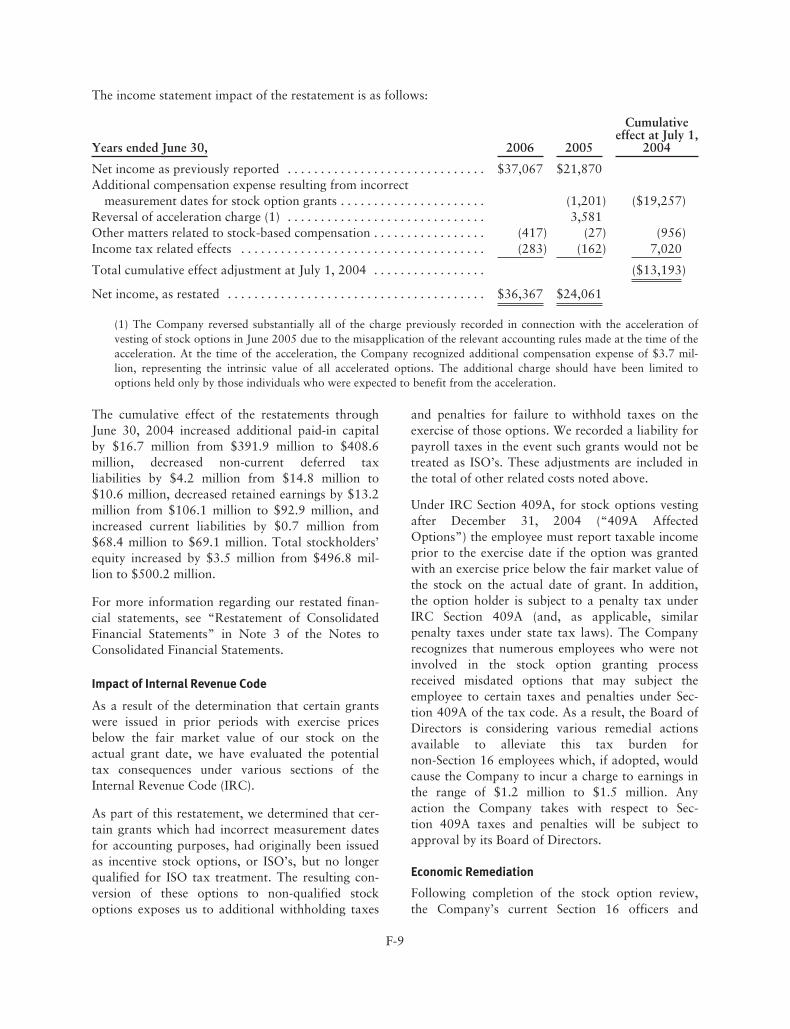
The income statement impact of the restatement is as follows:
Years ended June 30, 2006 2005
Cumulativeeffect at July 1,
2004
Net income as previously reported . . . . . . . . . . . . . . . . . . . . . . . . . . . . . . $37,067 $21,870Additional compensation expense resulting from incorrect
measurement dates for stock option grants . . . . . . . . . . . . . . . . . . . . . . (1,201) ($19,257)Reversal of acceleration charge (1) . . . . . . . . . . . . . . . . . . . . . . . . . . . . . . 3,581Other matters related to stock-based compensation . . . . . . . . . . . . . . . . . (417) (27) (956)Income tax related effects . . . . . . . . . . . . . . . . . . . . . . . . . . . . . . . . . . . . . (283) (162) 7,020
Total cumulative effect adjustment at July 1, 2004 . . . . . . . . . . . . . . . . . ($13,193)
Net income, as restated . . . . . . . . . . . . . . . . . . . . . . . . . . . . . . . . . . . . . . . $36,367 $24,061
(1) The Company reversed substantially all of the charge previously recorded in connection with the acceleration ofvesting of stock options in June 2005 due to the misapplication of the relevant accounting rules made at the time of theacceleration. At the time of the acceleration, the Company recognized additional compensation expense of $3.7 mil-lion, representing the intrinsic value of all accelerated options. The additional charge should have been limited tooptions held only by those individuals who were expected to benefit from the acceleration.
The cumulative effect of the restatements throughJune 30, 2004 increased additional paid-in capitalby $16.7 million from $391.9 million to $408.6million, decreased non-current deferred taxliabilities by $4.2 million from $14.8 million to$10.6 million, decreased retained earnings by $13.2million from $106.1 million to $92.9 million, andincreased current liabilities by $0.7 million from$68.4 million to $69.1 million. Total stockholders’equity increased by $3.5 million from $496.8 mil-lion to $500.2 million.
For more information regarding our restated finan-cial statements, see “Restatement of ConsolidatedFinancial Statements” in Note 3 of the Notes toConsolidated Financial Statements.
Impact of Internal Revenue Code
As a result of the determination that certain grantswere issued in prior periods with exercise pricesbelow the fair market value of our stock on theactual grant date, we have evaluated the potentialtax consequences under various sections of theInternal Revenue Code (IRC).
As part of this restatement, we determined that cer-tain grants which had incorrect measurement datesfor accounting purposes, had originally been issuedas incentive stock options, or ISO’s, but no longerqualified for ISO tax treatment. The resulting con-version of these options to non-qualified stockoptions exposes us to additional withholding taxes
and penalties for failure to withhold taxes on theexercise of those options. We recorded a liability forpayroll taxes in the event such grants would not betreated as ISO’s. These adjustments are included inthe total of other related costs noted above.
Under IRC Section 409A, for stock options vestingafter December 31, 2004 (“409A AffectedOptions”) the employee must report taxable incomeprior to the exercise date if the option was grantedwith an exercise price below the fair market value ofthe stock on the actual date of grant. In addition,the option holder is subject to a penalty tax underIRC Section 409A (and, as applicable, similarpenalty taxes under state tax laws). The Companyrecognizes that numerous employees who were notinvolved in the stock option granting processreceived misdated options that may subject theemployee to certain taxes and penalties under Sec-tion 409A of the tax code. As a result, the Board ofDirectors is considering various remedial actionsavailable to alleviate this tax burden fornon-Section 16 employees which, if adopted, wouldcause the Company to incur a charge to earnings inthe range of $1.2 million to $1.5 million. Anyaction the Company takes with respect to Sec-tion 409A taxes and penalties will be subject toapproval by its Board of Directors.
Economic Remediation
Following completion of the stock option review,the Company’s current Section 16 officers and
F-9
directors holding incorrectly priced and unexercisedstock options agreed to voluntarily reprice suchoptions, upon a finding of the Independent Direc-tors that such options were improperly priced, tothe closing share price on the revised measurementdate. The Section 16 officers and directors will notreceive cash payments to compensate them for theincrease in exercise price due to their voluntaryagreements to reprice such options. Consistent withthis recommendation, current Section 16 officersand directors also voluntarily agreed to repay to theCompany (either in cash or through further repric-ing of outstanding options) for options grantedwhile they were Section 16 officers or directors anamount equal to the difference in the price at whichstock options were exercised by them and the priceat which the Independent Directors believe the stockoptions should have been priced, net of any allo-cable portion of income taxes paid in connectionwith such exercise.
Corporate Governance Remediation
On September 21, 2006, the Company’s Board ofDirectors approved revised approval procedures forequity grants. Pursuant to those procedures, allequity grants will be recommended by the Compen-sation Committee to the full Board for approval. Alloption grants will have an exercise price equal tothe closing price of the Company’s stock on the dateof the Board’s approval of the grant.
Following completion of the stock option review,the Independent Directors recommended and theBoard of Directors approved, on January 29, 2008,the following additional changes:
• the Compensation Committee will bereconstituted and will be chaired by anindependent director;
• all equity awards other than new hire grants willgenerally be considered by the CompensationCommittee and Board of Directors annuallyfollowing each fiscal year end;
• the Board of Directors will delegate to theCompensation Committee the authority to grantnew hire grants during meetings on a quarterlybasis, and will provide that these options willhave an exercise price equal to the closing price ofthe Company’s stock on the last day of thequarter in which they were granted;
• details of recommended grants will be circulatedto the Compensation Committee in advance ofmeeting;
• corporate counsel will attend all CompensationCommittee meetings as secretary and willpromptly prepare minutes of the meetings;
• corporate counsel will oversee the documentationof equity grants; and
• one Board meeting per year will be focused oncorporate governance and compliance matters.
General
We manufacture, market, distribute and sell natural,organic, specialty and snack food products andnatural personal care products under brand nameswhich are sold as “better-for-you” products. Ourproducts are sold primarily to specialty and naturalfood distributors and are marketed nationally tosupermarkets, natural food stores, and other retailclasses of trade including mass-market retailers,drug stores, food service channels and club stores.Our overall mission is to be a leading marketer andseller of natural and organic food products andnatural personal care products by anticipating andexceeding consumer expectations and providingquality, innovation, value and convenience. Ourbusiness strategy is to integrate all of our brandsunder one management team and employ a uniformmarketing, sales and distribution program. We capi-talize on the brand equity and the distribution ach-ieved through each of our acquired brands withstrategic introductions of new product lines thatcomplement existing product lines to enhance rev-enues and margins. We believe that by integratingour various brands, we will achieve economies ofscale and enhanced market penetration.
Highlights of our accomplishments during fiscalyear 2007 include:
• Achieved solid sales and earnings growth drivenby increased consumption and marginenhancement
• Introduced innovative new products acrossmultiple product categories
• Implemented price increases to help offset risinginput costs
F-10
• Expanded and broadened our natural personalcare products offerings with the acquisition of theAvalon Organics and Alba Botanica brands
• Expanded our meat-free and non-dairy beverageofferings in the United Kingdom with theHaldane Foods acquisition and the re-launch ofthe Linda McCartney brand
• Entered the tofu category with the acquisition ofthe meat-alternative business of WhiteWaveFoods
• Increased our equity investment in Yeo Hiap Sengas part of our stratagey to provide co-brandedproduct offerings in Asia
Our consolidated net sales increased 21.9% in fiscal2007 compared to the year earlier period as a resultof growth in our existing brands and the impact ofacquisitions. We consider the acquisition of naturaland organic products companies and product linesas an integral part of our business strategy. Wemade the following acquisitions during the threeyears ended June 30, 2007:
• On June 8, 2007 we acquired the tofu and meat-alternative business of WhiteWave FoodsCompany. The product line includes baked andgrilled tofu, seitan, tempeh and other traditionaltofu items which are sold under the TofuTownand WhiteWave (under license) brand names.
• On January 12, 2007 we acquired AvalonNatural Products, Inc., including the AvalonOrganics and Alba Botanica brands, a leader inthe natural products category in the areas of skincare, hair care, bath and body and sun care.
• On December 8, 2006 we acquired the businessand certain assets of Haldane Foods Limited, aproducer of meat-free food and non-dairybeverage products.
• On June 12, 2006 we acquired the LindaMcCartney brand (under license) and the frozenmeat-free business from the H.J. Heinz Company,L.P. (“Heinz”), including a manufacturing facilityin Fakenham, England.
• On April 30, 2006 we acquired the fresh preparedfood business based in Luton, England fromHeinz.
• On March 3, 2006 we acquired the business andassets of Para Laboratories, Inc., including theQueen Helene, Batherapy, Shower Therapy andFootherapy brands of skin care, hair care, andbody care products for professional and personaluse.
• On December 16, 2005, we acquired SpectrumOrganic Products, Inc., a leading manufacturerand marketer of natural and organic culinary oils,vinegars, condiments and butter substitutes underthe Spectrum Naturals brand and nutritionalsupplements under the Spectrum Essentials brand.
• On July 1, 2005 we acquired a 50.1% controllinginterest in Hain Pure Protein Corporation, whichspecializes in natural, organic and antibiotic-freechickens.
• On April 4, 2005 we acquired Zia Cosmetics,Inc., including the Zia Natural Skincare brand, aleader in therapeutic products for healthy,beautiful skin sold mainly through natural foodretailers.
All of the foregoing acquisitions (“the acquisitions”or “acquired brands”) have been accounted for aspurchases. Consequently, the operations of theacquired brands are included in our results of oper-ations from their respective dates of acquisition.
On June 30, 2005, we sold our Kineret® and Kosher-ific® brands, which marketed and distributed a lineof frozen and dry kosher food products. Weacquired these brands in fiscal 1994.
On August 31, 2006, we sold our Biomarché oper-ations. Biomarché is a Belgium-based provider offresh organic fruits and vegetables. We acquired theBiomarché operations in fiscal 2002.
Critical Accounting Policies
Our financial statements are prepared in accordancewith accounting principles generally accepted in theUnited States. Our significant accounting policiesare described in Note 2 to the consolidated financialstatements. The policies below have been identifiedas the critical accounting policies we use whichrequire us to make estimates and assumptions thataffect the reported amounts of assets and liabilitiesat the date of the financial statements and amountsof income and expenses during the reporting periods
F-11
presented. We believe in the quality and reason-ableness of our critical accounting policies; how-ever, it is possible that materially different amountswould be reported under different conditions orusing assumptions different from those that we haveconsistently applied. Our critical accounting policiesare as follows, including our methodology for esti-mates made and assumptions used:
Revenue Recognition and Sales Incentives
Sales are recognized when the earnings process iscomplete, which occurs when products are shippedin accordance with terms of agreements, title andrisk of loss transfer to customers, collection is prob-able and pricing is fixed or determinable. Sales arereported net of sales incentives, which include tradediscounts and promotions and certain coupon costs.Shipping and handling costs billed to customers areincluded in reported sales. Allowances for cashdiscounts are recorded in the period in which therelated sale is recognized.
Valuation of Accounts and Chargebacks Receivable
We perform ongoing credit evaluations on existingand new customers daily. We apply reserves fordelinquent or uncollectible trade receivables basedon a specific identification methodology and alsoapply a general reserve based on the experience wehave with our trade receivables aging categories.Credit losses have been within our expectations inrecent years. While one of our customers repre-sented approximately 16% of our trade receivablebalance at June 30, 2007, we believe there is nocredit exposure at this time.
Based on cash collection history and other statisticalanalysis, we estimate the amount of unauthorizeddeductions that our customers have taken to berepaid and collectible in the near future in the formof a chargeback receivable. While our estimate ofthis receivable balance could be different had weused different assumptions and judgments, histor-ically our cash collections of this type of receivablehave been within our expectations and no sig-nificant write-offs have occurred during the mostrecent three fiscal years.
There can be no assurance that we would have thesame experience with our receivables during differ-ent economic conditions, or with changes in busi-
ness conditions, such as consolidation within thefood industry and/or a change in the way we marketand sell our products.
Inventory
Our inventory is valued at the lower of actual costor market, utilizing the first-in, first-out method. Weprovide write-downs for finished goods expected tobecome non-saleable due to age and specificallyidentify and provide for slow moving or obsoleteraw ingredients and packaging.
Property, Plant and Equipment
Our property, plant and equipment is carried at costand depreciated or amortized on a straight-line basisover the lesser of the estimated useful lives or leaselife, whichever is shorter. We believe the asset livesassigned to our property, plant and equipment arewithin the ranges/guidelines generally used in foodmanufacturing and distribution businesses. Ourmanufacturing plants and distribution centers, andtheir related assets, are periodically reviewed todetermine if any impairment exists by analyzingunderlying cash flow projections. At this time, webelieve no impairment exists on the carrying valueof such assets. Ordinary repairs and maintenanceare expensed as incurred.
Accounting for Acquisitions
Part of our growth strategy has included the acquis-ition of numerous businesses. The purchase price ofthese acquisitions has been determined after duediligence of the acquired business, market research,strategic planning, and the forecasting of expectedfuture results and synergies. Estimated future resultsand expected synergies are subject to revisions as weintegrate each acquisition and attempt to leverageresources.
Our recent acquisitions have been accounted forusing the purchase method of accounting as definedunder SFAS No. 141, “Business Combinations.”Accounting for these acquisitions has resulted in thecapitalization of the cost in excess of fair value ofthe net assets acquired in each of these acquisitionsas goodwill. We estimated the fair values of theassets acquired in each acquisition as of the date ofacquisition and these estimates are subject to
F-12
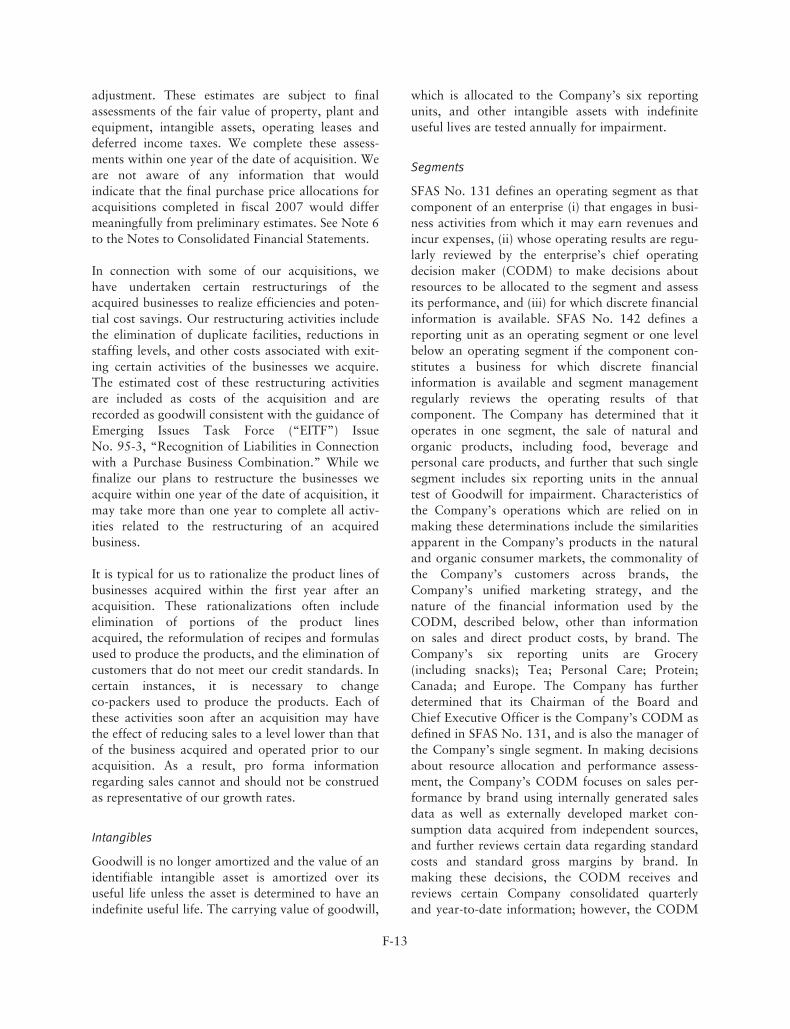
adjustment. These estimates are subject to finalassessments of the fair value of property, plant andequipment, intangible assets, operating leases anddeferred income taxes. We complete these assess-ments within one year of the date of acquisition. Weare not aware of any information that wouldindicate that the final purchase price allocations foracquisitions completed in fiscal 2007 would differmeaningfully from preliminary estimates. See Note 6to the Notes to Consolidated Financial Statements.
In connection with some of our acquisitions, wehave undertaken certain restructurings of theacquired businesses to realize efficiencies and poten-tial cost savings. Our restructuring activities includethe elimination of duplicate facilities, reductions instaffing levels, and other costs associated with exit-ing certain activities of the businesses we acquire.The estimated cost of these restructuring activitiesare included as costs of the acquisition and arerecorded as goodwill consistent with the guidance ofEmerging Issues Task Force (“EITF”) IssueNo. 95-3, “Recognition of Liabilities in Connectionwith a Purchase Business Combination.” While wefinalize our plans to restructure the businesses weacquire within one year of the date of acquisition, itmay take more than one year to complete all activ-ities related to the restructuring of an acquiredbusiness.
It is typical for us to rationalize the product lines ofbusinesses acquired within the first year after anacquisition. These rationalizations often includeelimination of portions of the product linesacquired, the reformulation of recipes and formulasused to produce the products, and the elimination ofcustomers that do not meet our credit standards. Incertain instances, it is necessary to changeco-packers used to produce the products. Each ofthese activities soon after an acquisition may havethe effect of reducing sales to a level lower than thatof the business acquired and operated prior to ouracquisition. As a result, pro forma informationregarding sales cannot and should not be construedas representative of our growth rates.
Intangibles
Goodwill is no longer amortized and the value of anidentifiable intangible asset is amortized over itsuseful life unless the asset is determined to have anindefinite useful life. The carrying value of goodwill,
which is allocated to the Company’s six reportingunits, and other intangible assets with indefiniteuseful lives are tested annually for impairment.
Segments
SFAS No. 131 defines an operating segment as thatcomponent of an enterprise (i) that engages in busi-ness activities from which it may earn revenues andincur expenses, (ii) whose operating results are regu-larly reviewed by the enterprise’s chief operatingdecision maker (CODM) to make decisions aboutresources to be allocated to the segment and assessits performance, and (iii) for which discrete financialinformation is available. SFAS No. 142 defines areporting unit as an operating segment or one levelbelow an operating segment if the component con-stitutes a business for which discrete financialinformation is available and segment managementregularly reviews the operating results of thatcomponent. The Company has determined that itoperates in one segment, the sale of natural andorganic products, including food, beverage andpersonal care products, and further that such singlesegment includes six reporting units in the annualtest of Goodwill for impairment. Characteristics ofthe Company’s operations which are relied on inmaking these determinations include the similaritiesapparent in the Company’s products in the naturaland organic consumer markets, the commonality ofthe Company’s customers across brands, theCompany’s unified marketing strategy, and thenature of the financial information used by theCODM, described below, other than informationon sales and direct product costs, by brand. TheCompany’s six reporting units are Grocery(including snacks); Tea; Personal Care; Protein;Canada; and Europe. The Company has furtherdetermined that its Chairman of the Board andChief Executive Officer is the Company’s CODM asdefined in SFAS No. 131, and is also the manager ofthe Company’s single segment. In making decisionsabout resource allocation and performance assess-ment, the Company’s CODM focuses on sales per-formance by brand using internally generated salesdata as well as externally developed market con-sumption data acquired from independent sources,and further reviews certain data regarding standardcosts and standard gross margins by brand. Inmaking these decisions, the CODM receives andreviews certain Company consolidated quarterlyand year-to-date information; however, the CODM
F-13
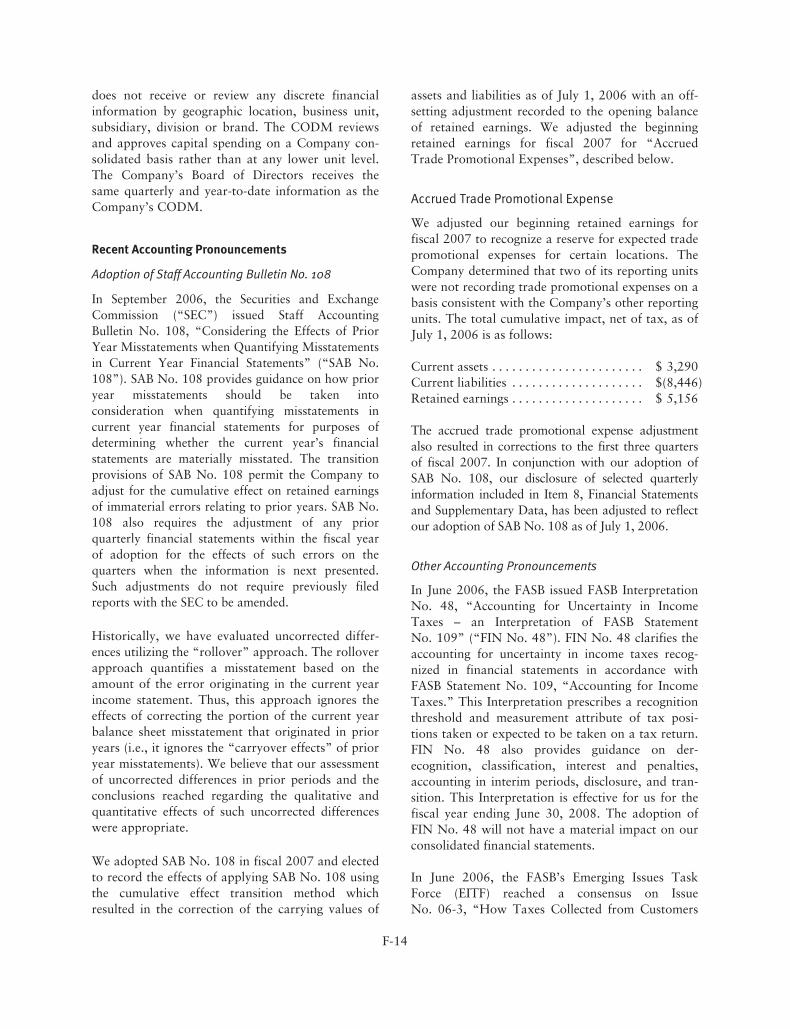
does not receive or review any discrete financialinformation by geographic location, business unit,subsidiary, division or brand. The CODM reviewsand approves capital spending on a Company con-solidated basis rather than at any lower unit level.The Company’s Board of Directors receives thesame quarterly and year-to-date information as theCompany’s CODM.
Recent Accounting Pronouncements
Adoption of Staff Accounting Bulletin No. 108
In September 2006, the Securities and ExchangeCommission (“SEC”) issued Staff AccountingBulletin No. 108, “Considering the Effects of PriorYear Misstatements when Quantifying Misstatementsin Current Year Financial Statements” (“SAB No.108”). SAB No. 108 provides guidance on how prioryear misstatements should be taken intoconsideration when quantifying misstatements incurrent year financial statements for purposes ofdetermining whether the current year’s financialstatements are materially misstated. The transitionprovisions of SAB No. 108 permit the Company toadjust for the cumulative effect on retained earningsof immaterial errors relating to prior years. SAB No.108 also requires the adjustment of any priorquarterly financial statements within the fiscal yearof adoption for the effects of such errors on thequarters when the information is next presented.Such adjustments do not require previously filedreports with the SEC to be amended.
Historically, we have evaluated uncorrected differ-ences utilizing the “rollover” approach. The rolloverapproach quantifies a misstatement based on theamount of the error originating in the current yearincome statement. Thus, this approach ignores theeffects of correcting the portion of the current yearbalance sheet misstatement that originated in prioryears (i.e., it ignores the “carryover effects” of prioryear misstatements). We believe that our assessmentof uncorrected differences in prior periods and theconclusions reached regarding the qualitative andquantitative effects of such uncorrected differenceswere appropriate.
We adopted SAB No. 108 in fiscal 2007 and electedto record the effects of applying SAB No. 108 usingthe cumulative effect transition method whichresulted in the correction of the carrying values of
assets and liabilities as of July 1, 2006 with an off-setting adjustment recorded to the opening balanceof retained earnings. We adjusted the beginningretained earnings for fiscal 2007 for “AccruedTrade Promotional Expenses”, described below.
Accrued Trade Promotional Expense
We adjusted our beginning retained earnings forfiscal 2007 to recognize a reserve for expected tradepromotional expenses for certain locations. TheCompany determined that two of its reporting unitswere not recording trade promotional expenses on abasis consistent with the Company’s other reportingunits. The total cumulative impact, net of tax, as ofJuly 1, 2006 is as follows:
Current assets . . . . . . . . . . . . . . . . . . . . . . . $ 3,290Current liabilities . . . . . . . . . . . . . . . . . . . . $(8,446)Retained earnings . . . . . . . . . . . . . . . . . . . . $ 5,156
The accrued trade promotional expense adjustmentalso resulted in corrections to the first three quartersof fiscal 2007. In conjunction with our adoption ofSAB No. 108, our disclosure of selected quarterlyinformation included in Item 8, Financial Statementsand Supplementary Data, has been adjusted to reflectour adoption of SAB No. 108 as of July 1, 2006.
Other Accounting Pronouncements
In June 2006, the FASB issued FASB InterpretationNo. 48, “Accounting for Uncertainty in IncomeTaxes – an Interpretation of FASB StatementNo. 109” (“FIN No. 48”). FIN No. 48 clarifies theaccounting for uncertainty in income taxes recog-nized in financial statements in accordance withFASB Statement No. 109, “Accounting for IncomeTaxes.” This Interpretation prescribes a recognitionthreshold and measurement attribute of tax posi-tions taken or expected to be taken on a tax return.FIN No. 48 also provides guidance on der-ecognition, classification, interest and penalties,accounting in interim periods, disclosure, and tran-sition. This Interpretation is effective for us for thefiscal year ending June 30, 2008. The adoption ofFIN No. 48 will not have a material impact on ourconsolidated financial statements.
In June 2006, the FASB’s Emerging Issues TaskForce (EITF) reached a consensus on IssueNo. 06-3, “How Taxes Collected from Customers
F-14
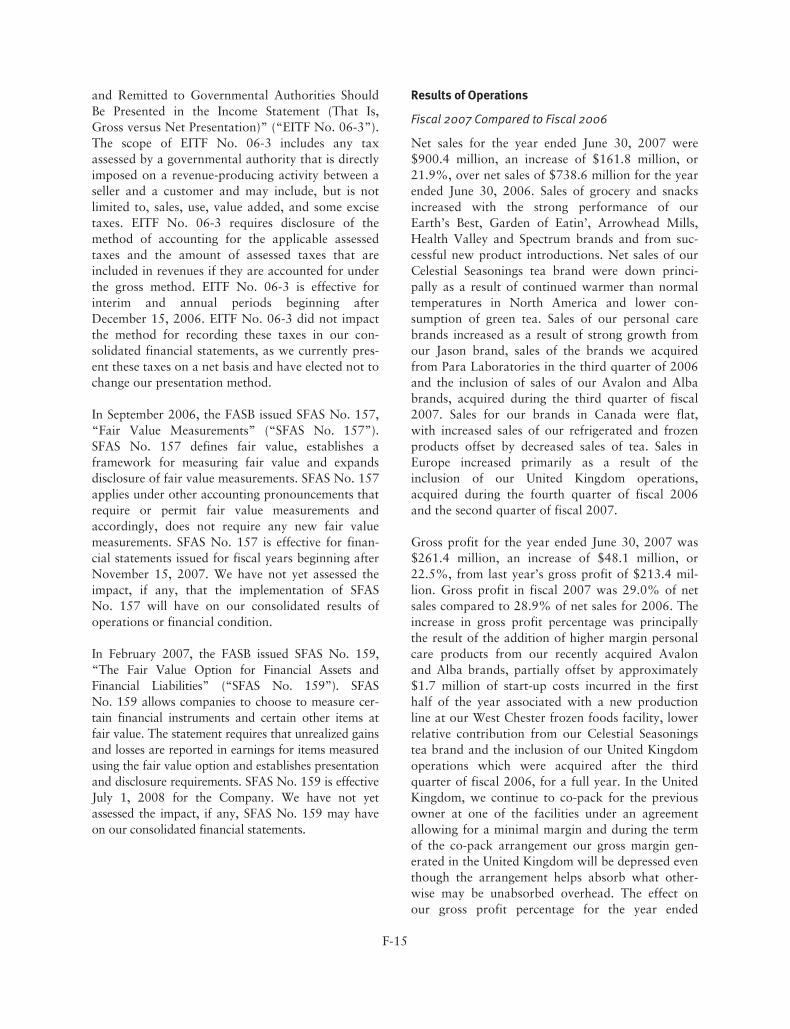
and Remitted to Governmental Authorities ShouldBe Presented in the Income Statement (That Is,Gross versus Net Presentation)” (“EITF No. 06-3”).The scope of EITF No. 06-3 includes any taxassessed by a governmental authority that is directlyimposed on a revenue-producing activity between aseller and a customer and may include, but is notlimited to, sales, use, value added, and some excisetaxes. EITF No. 06-3 requires disclosure of themethod of accounting for the applicable assessedtaxes and the amount of assessed taxes that areincluded in revenues if they are accounted for underthe gross method. EITF No. 06-3 is effective forinterim and annual periods beginning afterDecember 15, 2006. EITF No. 06-3 did not impactthe method for recording these taxes in our con-solidated financial statements, as we currently pres-ent these taxes on a net basis and have elected not tochange our presentation method.
In September 2006, the FASB issued SFAS No. 157,“Fair Value Measurements” (“SFAS No. 157”).SFAS No. 157 defines fair value, establishes aframework for measuring fair value and expandsdisclosure of fair value measurements. SFAS No. 157applies under other accounting pronouncements thatrequire or permit fair value measurements andaccordingly, does not require any new fair valuemeasurements. SFAS No. 157 is effective for finan-cial statements issued for fiscal years beginning afterNovember 15, 2007. We have not yet assessed theimpact, if any, that the implementation of SFASNo. 157 will have on our consolidated results ofoperations or financial condition.
In February 2007, the FASB issued SFAS No. 159,“The Fair Value Option for Financial Assets andFinancial Liabilities” (“SFAS No. 159”). SFASNo. 159 allows companies to choose to measure cer-tain financial instruments and certain other items atfair value. The statement requires that unrealized gainsand losses are reported in earnings for items measuredusing the fair value option and establishes presentationand disclosure requirements. SFAS No. 159 is effectiveJuly 1, 2008 for the Company. We have not yetassessed the impact, if any, SFAS No. 159 may haveon our consolidated financial statements.
Results of Operations
Fiscal 2007 Compared to Fiscal 2006
Net sales for the year ended June 30, 2007 were$900.4 million, an increase of $161.8 million, or21.9%, over net sales of $738.6 million for the yearended June 30, 2006. Sales of grocery and snacksincreased with the strong performance of ourEarth’s Best, Garden of Eatin’, Arrowhead Mills,Health Valley and Spectrum brands and from suc-cessful new product introductions. Net sales of ourCelestial Seasonings tea brand were down princi-pally as a result of continued warmer than normaltemperatures in North America and lower con-sumption of green tea. Sales of our personal carebrands increased as a result of strong growth fromour Jason brand, sales of the brands we acquiredfrom Para Laboratories in the third quarter of 2006and the inclusion of sales of our Avalon and Albabrands, acquired during the third quarter of fiscal2007. Sales for our brands in Canada were flat,with increased sales of our refrigerated and frozenproducts offset by decreased sales of tea. Sales inEurope increased primarily as a result of theinclusion of our United Kingdom operations,acquired during the fourth quarter of fiscal 2006and the second quarter of fiscal 2007.
Gross profit for the year ended June 30, 2007 was$261.4 million, an increase of $48.1 million, or22.5%, from last year’s gross profit of $213.4 mil-lion. Gross profit in fiscal 2007 was 29.0% of netsales compared to 28.9% of net sales for 2006. Theincrease in gross profit percentage was principallythe result of the addition of higher margin personalcare products from our recently acquired Avalonand Alba brands, partially offset by approximately$1.7 million of start-up costs incurred in the firsthalf of the year associated with a new productionline at our West Chester frozen foods facility, lowerrelative contribution from our Celestial Seasoningstea brand and the inclusion of our United Kingdomoperations which were acquired after the thirdquarter of fiscal 2006, for a full year. In the UnitedKingdom, we continue to co-pack for the previousowner at one of the facilities under an agreementallowing for a minimal margin and during the termof the co-pack arrangement our gross margin gen-erated in the United Kingdom will be depressed eventhough the arrangement helps absorb what other-wise may be unabsorbed overhead. The effect onour gross profit percentage for the year ended
F-15
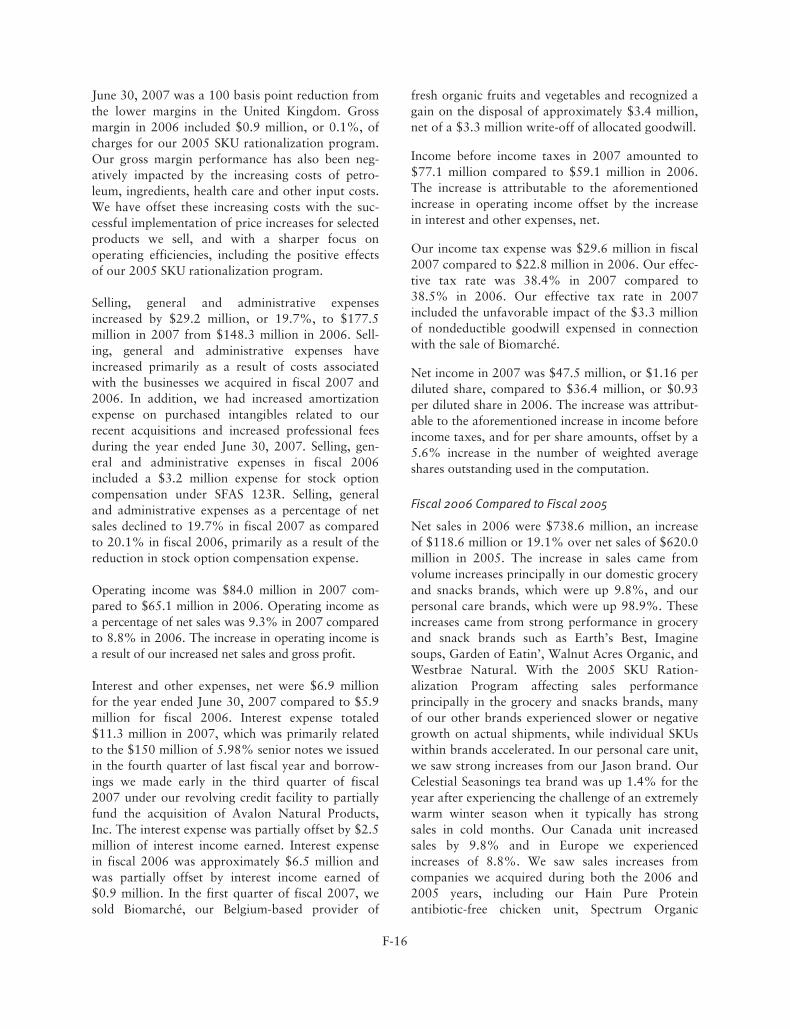
June 30, 2007 was a 100 basis point reduction fromthe lower margins in the United Kingdom. Grossmargin in 2006 included $0.9 million, or 0.1%, ofcharges for our 2005 SKU rationalization program.Our gross margin performance has also been neg-atively impacted by the increasing costs of petro-leum, ingredients, health care and other input costs.We have offset these increasing costs with the suc-cessful implementation of price increases for selectedproducts we sell, and with a sharper focus onoperating efficiencies, including the positive effectsof our 2005 SKU rationalization program.
Selling, general and administrative expensesincreased by $29.2 million, or 19.7%, to $177.5million in 2007 from $148.3 million in 2006. Sell-ing, general and administrative expenses haveincreased primarily as a result of costs associatedwith the businesses we acquired in fiscal 2007 and2006. In addition, we had increased amortizationexpense on purchased intangibles related to ourrecent acquisitions and increased professional feesduring the year ended June 30, 2007. Selling, gen-eral and administrative expenses in fiscal 2006included a $3.2 million expense for stock optioncompensation under SFAS 123R. Selling, generaland administrative expenses as a percentage of netsales declined to 19.7% in fiscal 2007 as comparedto 20.1% in fiscal 2006, primarily as a result of thereduction in stock option compensation expense.
Operating income was $84.0 million in 2007 com-pared to $65.1 million in 2006. Operating income asa percentage of net sales was 9.3% in 2007 comparedto 8.8% in 2006. The increase in operating income isa result of our increased net sales and gross profit.
Interest and other expenses, net were $6.9 millionfor the year ended June 30, 2007 compared to $5.9million for fiscal 2006. Interest expense totaled$11.3 million in 2007, which was primarily relatedto the $150 million of 5.98% senior notes we issuedin the fourth quarter of last fiscal year and borrow-ings we made early in the third quarter of fiscal2007 under our revolving credit facility to partiallyfund the acquisition of Avalon Natural Products,Inc. The interest expense was partially offset by $2.5million of interest income earned. Interest expensein fiscal 2006 was approximately $6.5 million andwas partially offset by interest income earned of$0.9 million. In the first quarter of fiscal 2007, wesold Biomarché, our Belgium-based provider of
fresh organic fruits and vegetables and recognized again on the disposal of approximately $3.4 million,net of a $3.3 million write-off of allocated goodwill.
Income before income taxes in 2007 amounted to$77.1 million compared to $59.1 million in 2006.The increase is attributable to the aforementionedincrease in operating income offset by the increasein interest and other expenses, net.
Our income tax expense was $29.6 million in fiscal2007 compared to $22.8 million in 2006. Our effec-tive tax rate was 38.4% in 2007 compared to38.5% in 2006. Our effective tax rate in 2007included the unfavorable impact of the $3.3 millionof nondeductible goodwill expensed in connectionwith the sale of Biomarché.
Net income in 2007 was $47.5 million, or $1.16 perdiluted share, compared to $36.4 million, or $0.93per diluted share in 2006. The increase was attribut-able to the aforementioned increase in income beforeincome taxes, and for per share amounts, offset by a5.6% increase in the number of weighted averageshares outstanding used in the computation.
Fiscal 2006 Compared to Fiscal 2005
Net sales in 2006 were $738.6 million, an increaseof $118.6 million or 19.1% over net sales of $620.0million in 2005. The increase in sales came fromvolume increases principally in our domestic groceryand snacks brands, which were up 9.8%, and ourpersonal care brands, which were up 98.9%. Theseincreases came from strong performance in groceryand snack brands such as Earth’s Best, Imaginesoups, Garden of Eatin’, Walnut Acres Organic, andWestbrae Natural. With the 2005 SKU Ration-alization Program affecting sales performanceprincipally in the grocery and snacks brands, manyof our other brands experienced slower or negativegrowth on actual shipments, while individual SKUswithin brands accelerated. In our personal care unit,we saw strong increases from our Jason brand. OurCelestial Seasonings tea brand was up 1.4% for theyear after experiencing the challenge of an extremelywarm winter season when it typically has strongsales in cold months. Our Canada unit increasedsales by 9.8% and in Europe we experiencedincreases of 8.8%. We saw sales increases fromcompanies we acquired during both the 2006 and2005 years, including our Hain Pure Proteinantibiotic-free chicken unit, Spectrum Organic
F-16
Products in grocery and snacks, Para Laboratoriesin personal care, and both the meat-free frozenoperation and the fresh prepared foods operation inthe United Kingdom.
Gross profit in 2006 was 28.9% of net sales ascompared to 27.6% of net sales in 2005. Grossprofit in 2006 was negatively impacted by theinclusion of the operations of our Hain Pure Proteinantibiotic-free chicken unit and the new fresh pre-pared foods unit in Europe, each of which operatesat margins significantly lower than our other units.Without the negative impact of these units’ grossmargins, our gross margins would have been30.1%, or 1.3% higher than our total. Gross mar-gin was further affected by charges for our SKURationalization Program of $0.9 million, or 0.1% in2006, and $9.0 million, or 1.2% in 2005. Our grossmargin performance has also been negativelyimpacted by the increasing costs of petroleum,ingredients, health care and other input costs. Wehave offset these increasing costs with the successfulimplementation of price increases for selected prod-ucts we sell, and with a sharper focus on operatingefficiencies, including the positive effects of our SKURationalization Program. Our gross margin as apercentage of sales has been further diluted by themix of our sales as our higher margin tea sales con-tinue to contribute a lower proportion of our con-solidated sales.
Selling, general and administrative expensesincreased by $17.9 million to $148.3 million in2006 from $130.4 million in 2005. These expensesas a percentage of net sales were 20.1% in 2006compared to 21.0% in 2005. Selling, general andadministrative expenses increased from the additionof $7.7 million of costs added with acquisitions in2006, and were further increased by a $3.2 millioncharge associated with the adoption of FASNo. 123R (See Note 14 to Notes to ConsolidatedFinancial Statements). Other increases resulted fromthe increased scale of our business.
Operating income was $65.1 million in 2006 com-pared to $40.5 million in 2005. Operating incomeas a percentage of net sales was 8.8% in 2006compared to 6.5% in 2005. These changes are aresult of higher sales and better gross margin per-formance, as well as the reduced results in 2005having been caused by the $12.1 million of chargesfor our 2005 SKU Rationalization Program.
Interest and other expenses, net, amounted to $5.9million in 2006 compared to $3.7 million in 2005.We incurred higher interest costs in 2006 resultingfrom borrowings for acquisitions and higher marketinterest rates. In May 2006, we completed a privateplacement of $150 million of 10-year 5.98% fixedrate notes.
Income before income taxes in 2006 amounted to$59.1 million compared to $36.9 million in 2005.The increase is attributable to the aforementionedincrease in operating income offset by the increasein interest and other expenses, net.
Income taxes in 2006 amounted to $22.8 millioncompared to $12.8 million in 2005. Our effectivetax rate was 38.5% in 2006 compared to 34.7% in2005. Our lower effective tax rate in 2005 wasattributable to a $1.3 reduction in tax liabilitiesresulting from the termination of certain out-standing tax matters.
Net income in 2006 amounted to $36.4 million, or$0.93 per diluted share, compared to $24.1 million,or $0.65 per diluted share in 2005. The increasewas attributable to the aforementioned increase inincome before income taxes, and for per shareamounts, offset by a 4.7% increase in the number ofweighted average shares used in the computation.
Liquidity and Capital Resources
We finance our operations and growth primarilywith the cash flows we generate from our operationsand from both long-term fixed-rate borrowings andborrowings available to us under our Credit Facility.
Our working capital was $198.5 million at June 30,2007, an increase of $25.6 million from $172.9million at the end of fiscal 2006. This was due prin-cipally to a $23.2 million increase in inventories, a$14.6 million increase in accounts receivable, an$11.6 million increase in cash and a $6.1 millionincrease in other current assets, offset by a $29.9million increase in accounts payable and other cur-rent liabilities. The increases in our accounts receiv-able, inventories and accounts payable werepartially attributable to the recent acquisitions wemade. Our inventories also increased as a result ofhigher levels of inventory carried in the personalcare unit, an inventory build-up in the United King-dom as we integrate the Haldane frozen food fac-
F-17
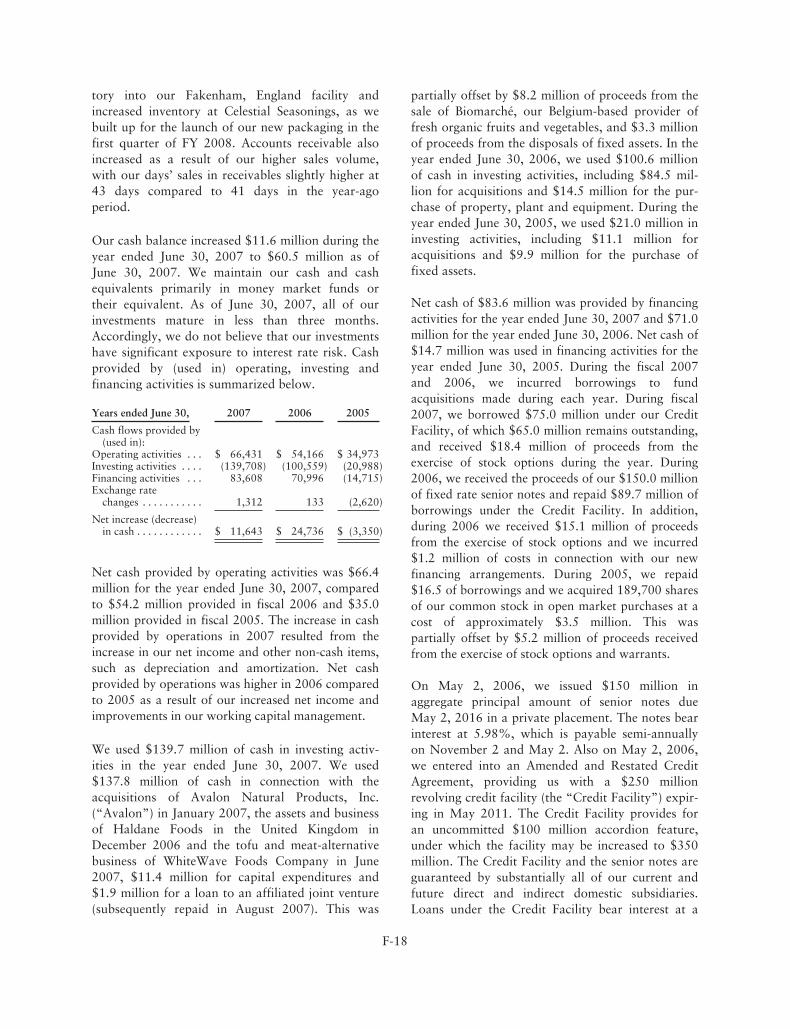
tory into our Fakenham, England facility andincreased inventory at Celestial Seasonings, as webuilt up for the launch of our new packaging in thefirst quarter of FY 2008. Accounts receivable alsoincreased as a result of our higher sales volume,with our days’ sales in receivables slightly higher at43 days compared to 41 days in the year-agoperiod.
Our cash balance increased $11.6 million during theyear ended June 30, 2007 to $60.5 million as ofJune 30, 2007. We maintain our cash and cashequivalents primarily in money market funds ortheir equivalent. As of June 30, 2007, all of ourinvestments mature in less than three months.Accordingly, we do not believe that our investmentshave significant exposure to interest rate risk. Cashprovided by (used in) operating, investing andfinancing activities is summarized below.
Years ended June 30, 2007 2006 2005
Cash flows provided by(used in):
Operating activities . . . $ 66,431 $ 54,166 $ 34,973Investing activities . . . . (139,708) (100,559) (20,988)Financing activities . . . 83,608 70,996 (14,715)Exchange rate
changes . . . . . . . . . . . 1,312 133 (2,620)
Net increase (decrease)in cash . . . . . . . . . . . . $ 11,643 $ 24,736 $ (3,350)
Net cash provided by operating activities was $66.4million for the year ended June 30, 2007, comparedto $54.2 million provided in fiscal 2006 and $35.0million provided in fiscal 2005. The increase in cashprovided by operations in 2007 resulted from theincrease in our net income and other non-cash items,such as depreciation and amortization. Net cashprovided by operations was higher in 2006 comparedto 2005 as a result of our increased net income andimprovements in our working capital management.
We used $139.7 million of cash in investing activ-ities in the year ended June 30, 2007. We used$137.8 million of cash in connection with theacquisitions of Avalon Natural Products, Inc.(“Avalon”) in January 2007, the assets and businessof Haldane Foods in the United Kingdom inDecember 2006 and the tofu and meat-alternativebusiness of WhiteWave Foods Company in June2007, $11.4 million for capital expenditures and$1.9 million for a loan to an affiliated joint venture(subsequently repaid in August 2007). This was
partially offset by $8.2 million of proceeds from thesale of Biomarché, our Belgium-based provider offresh organic fruits and vegetables, and $3.3 millionof proceeds from the disposals of fixed assets. In theyear ended June 30, 2006, we used $100.6 millionof cash in investing activities, including $84.5 mil-lion for acquisitions and $14.5 million for the pur-chase of property, plant and equipment. During theyear ended June 30, 2005, we used $21.0 million ininvesting activities, including $11.1 million foracquisitions and $9.9 million for the purchase offixed assets.
Net cash of $83.6 million was provided by financingactivities for the year ended June 30, 2007 and $71.0million for the year ended June 30, 2006. Net cash of$14.7 million was used in financing activities for theyear ended June 30, 2005. During the fiscal 2007and 2006, we incurred borrowings to fundacquisitions made during each year. During fiscal2007, we borrowed $75.0 million under our CreditFacility, of which $65.0 million remains outstanding,and received $18.4 million of proceeds from theexercise of stock options during the year. During2006, we received the proceeds of our $150.0 millionof fixed rate senior notes and repaid $89.7 million ofborrowings under the Credit Facility. In addition,during 2006 we received $15.1 million of proceedsfrom the exercise of stock options and we incurred$1.2 million of costs in connection with our newfinancing arrangements. During 2005, we repaid$16.5 of borrowings and we acquired 189,700 sharesof our common stock in open market purchases at acost of approximately $3.5 million. This waspartially offset by $5.2 million of proceeds receivedfrom the exercise of stock options and warrants.
On May 2, 2006, we issued $150 million inaggregate principal amount of senior notes dueMay 2, 2016 in a private placement. The notes bearinterest at 5.98%, which is payable semi-annuallyon November 2 and May 2. Also on May 2, 2006,we entered into an Amended and Restated CreditAgreement, providing us with a $250 millionrevolving credit facility (the “Credit Facility”) expir-ing in May 2011. The Credit Facility provides foran uncommitted $100 million accordion feature,under which the facility may be increased to $350million. The Credit Facility and the senior notes areguaranteed by substantially all of our current andfuture direct and indirect domestic subsidiaries.Loans under the Credit Facility bear interest at a
F-18
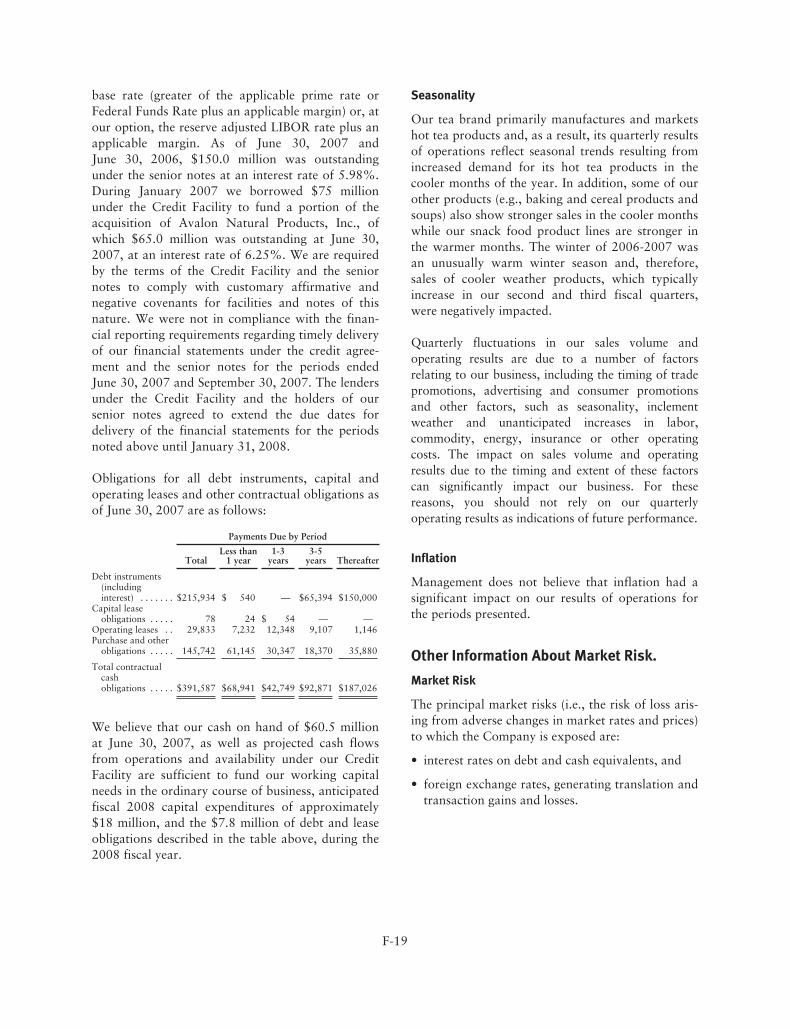
base rate (greater of the applicable prime rate orFederal Funds Rate plus an applicable margin) or, atour option, the reserve adjusted LIBOR rate plus anapplicable margin. As of June 30, 2007 andJune 30, 2006, $150.0 million was outstandingunder the senior notes at an interest rate of 5.98%.During January 2007 we borrowed $75 millionunder the Credit Facility to fund a portion of theacquisition of Avalon Natural Products, Inc., ofwhich $65.0 million was outstanding at June 30,2007, at an interest rate of 6.25%. We are requiredby the terms of the Credit Facility and the seniornotes to comply with customary affirmative andnegative covenants for facilities and notes of thisnature. We were not in compliance with the finan-cial reporting requirements regarding timely deliveryof our financial statements under the credit agree-ment and the senior notes for the periods endedJune 30, 2007 and September 30, 2007. The lendersunder the Credit Facility and the holders of oursenior notes agreed to extend the due dates fordelivery of the financial statements for the periodsnoted above until January 31, 2008.
Obligations for all debt instruments, capital andoperating leases and other contractual obligations asof June 30, 2007 are as follows:
Payments Due by Period
TotalLess than
1 year1-3
years3-5
years Thereafter
Debt instruments(includinginterest) . . . . . . . $215,934 $ 540 — $65,394 $150,000
Capital leaseobligations . . . . . 78 24 $ 54 — —
Operating leases . . 29,833 7,232 12,348 9,107 1,146Purchase and other
obligations . . . . . 145,742 61,145 30,347 18,370 35,880
Total contractualcashobligations . . . . . $391,587 $68,941 $42,749 $92,871 $187,026
We believe that our cash on hand of $60.5 millionat June 30, 2007, as well as projected cash flowsfrom operations and availability under our CreditFacility are sufficient to fund our working capitalneeds in the ordinary course of business, anticipatedfiscal 2008 capital expenditures of approximately$18 million, and the $7.8 million of debt and leaseobligations described in the table above, during the2008 fiscal year.
Seasonality
Our tea brand primarily manufactures and marketshot tea products and, as a result, its quarterly resultsof operations reflect seasonal trends resulting fromincreased demand for its hot tea products in thecooler months of the year. In addition, some of ourother products (e.g., baking and cereal products andsoups) also show stronger sales in the cooler monthswhile our snack food product lines are stronger inthe warmer months. The winter of 2006-2007 wasan unusually warm winter season and, therefore,sales of cooler weather products, which typicallyincrease in our second and third fiscal quarters,were negatively impacted.
Quarterly fluctuations in our sales volume andoperating results are due to a number of factorsrelating to our business, including the timing of tradepromotions, advertising and consumer promotionsand other factors, such as seasonality, inclementweather and unanticipated increases in labor,commodity, energy, insurance or other operatingcosts. The impact on sales volume and operatingresults due to the timing and extent of these factorscan significantly impact our business. For thesereasons, you should not rely on our quarterlyoperating results as indications of future performance.
Inflation
Management does not believe that inflation had asignificant impact on our results of operations forthe periods presented.
Other Information About Market Risk.
Market Risk
The principal market risks (i.e., the risk of loss aris-ing from adverse changes in market rates and prices)to which the Company is exposed are:
• interest rates on debt and cash equivalents, and
• foreign exchange rates, generating translation andtransaction gains and losses.
F-19
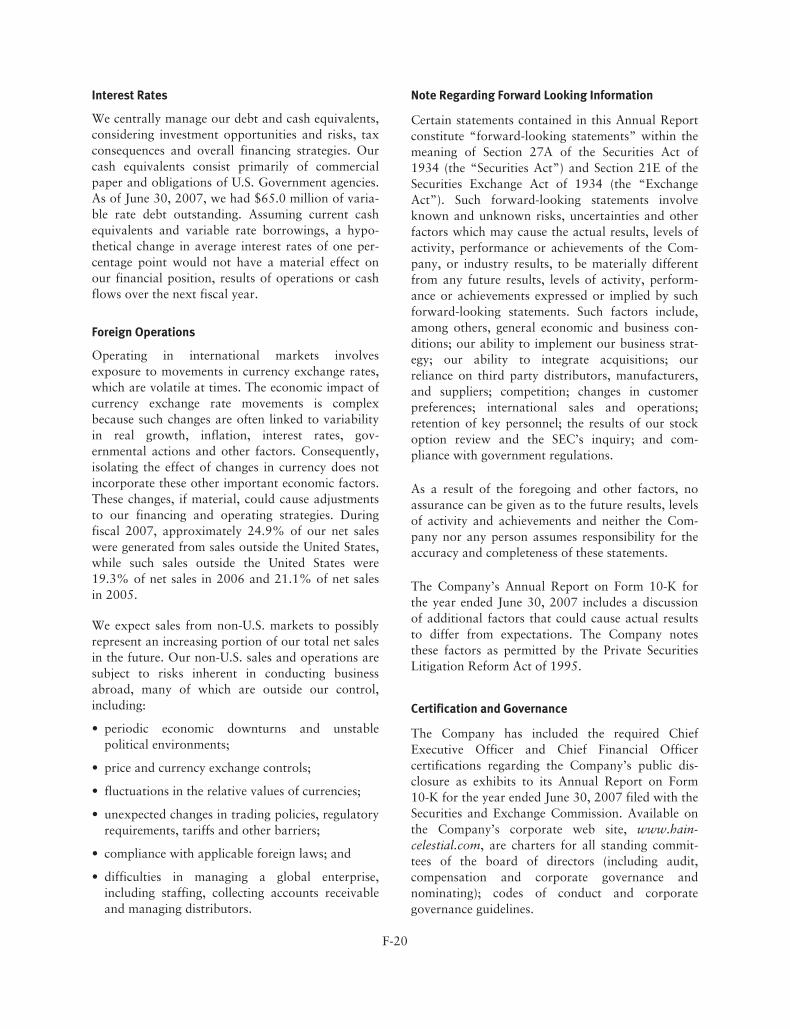
Interest Rates
We centrally manage our debt and cash equivalents,considering investment opportunities and risks, taxconsequences and overall financing strategies. Ourcash equivalents consist primarily of commercialpaper and obligations of U.S. Government agencies.As of June 30, 2007, we had $65.0 million of varia-ble rate debt outstanding. Assuming current cashequivalents and variable rate borrowings, a hypo-thetical change in average interest rates of one per-centage point would not have a material effect onour financial position, results of operations or cashflows over the next fiscal year.
Foreign Operations
Operating in international markets involvesexposure to movements in currency exchange rates,which are volatile at times. The economic impact ofcurrency exchange rate movements is complexbecause such changes are often linked to variabilityin real growth, inflation, interest rates, gov-ernmental actions and other factors. Consequently,isolating the effect of changes in currency does notincorporate these other important economic factors.These changes, if material, could cause adjustmentsto our financing and operating strategies. Duringfiscal 2007, approximately 24.9% of our net saleswere generated from sales outside the United States,while such sales outside the United States were19.3% of net sales in 2006 and 21.1% of net salesin 2005.
We expect sales from non-U.S. markets to possiblyrepresent an increasing portion of our total net salesin the future. Our non-U.S. sales and operations aresubject to risks inherent in conducting businessabroad, many of which are outside our control,including:
• periodic economic downturns and unstablepolitical environments;
• price and currency exchange controls;
• fluctuations in the relative values of currencies;
• unexpected changes in trading policies, regulatoryrequirements, tariffs and other barriers;
• compliance with applicable foreign laws; and
• difficulties in managing a global enterprise,including staffing, collecting accounts receivableand managing distributors.
Note Regarding Forward Looking Information
Certain statements contained in this Annual Reportconstitute “forward-looking statements” within themeaning of Section 27A of the Securities Act of1934 (the “Securities Act”) and Section 21E of theSecurities Exchange Act of 1934 (the “ExchangeAct”). Such forward-looking statements involveknown and unknown risks, uncertainties and otherfactors which may cause the actual results, levels ofactivity, performance or achievements of the Com-pany, or industry results, to be materially differentfrom any future results, levels of activity, perform-ance or achievements expressed or implied by suchforward-looking statements. Such factors include,among others, general economic and business con-ditions; our ability to implement our business strat-egy; our ability to integrate acquisitions; ourreliance on third party distributors, manufacturers,and suppliers; competition; changes in customerpreferences; international sales and operations;retention of key personnel; the results of our stockoption review and the SEC’s inquiry; and com-pliance with government regulations.
As a result of the foregoing and other factors, noassurance can be given as to the future results, levelsof activity and achievements and neither the Com-pany nor any person assumes responsibility for theaccuracy and completeness of these statements.
The Company’s Annual Report on Form 10-K forthe year ended June 30, 2007 includes a discussionof additional factors that could cause actual resultsto differ from expectations. The Company notesthese factors as permitted by the Private SecuritiesLitigation Reform Act of 1995.
Certification and Governance
The Company has included the required ChiefExecutive Officer and Chief Financial Officercertifications regarding the Company’s public dis-closure as exhibits to its Annual Report on Form10-K for the year ended June 30, 2007 filed with theSecurities and Exchange Commission. Available onthe Company’s corporate web site, www.hain-celestial.com, are charters for all standing commit-tees of the board of directors (including audit,compensation and corporate governance andnominating); codes of conduct and corporategovernance guidelines.
F-20
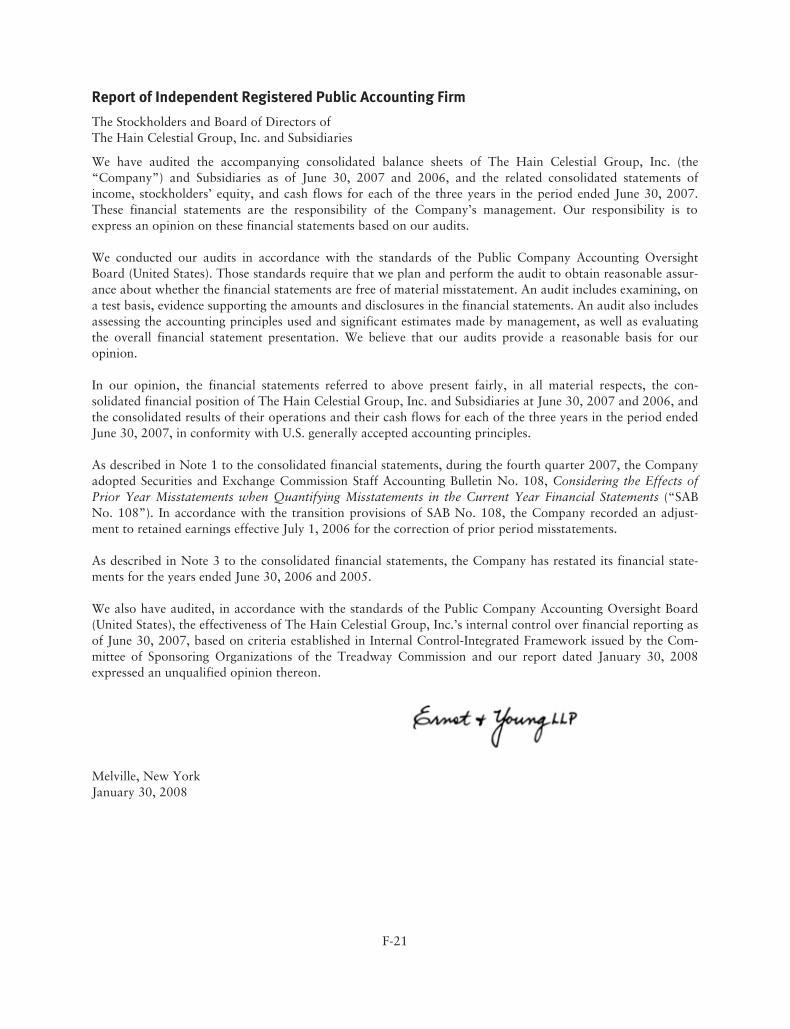
Report of Independent Registered Public Accounting Firm
The Stockholders and Board of Directors ofThe Hain Celestial Group, Inc. and Subsidiaries
We have audited the accompanying consolidated balance sheets of The Hain Celestial Group, Inc. (the“Company”) and Subsidiaries as of June 30, 2007 and 2006, and the related consolidated statements ofincome, stockholders’ equity, and cash flows for each of the three years in the period ended June 30, 2007.These financial statements are the responsibility of the Company’s management. Our responsibility is toexpress an opinion on these financial statements based on our audits.
We conducted our audits in accordance with the standards of the Public Company Accounting OversightBoard (United States). Those standards require that we plan and perform the audit to obtain reasonable assur-ance about whether the financial statements are free of material misstatement. An audit includes examining, ona test basis, evidence supporting the amounts and disclosures in the financial statements. An audit also includesassessing the accounting principles used and significant estimates made by management, as well as evaluatingthe overall financial statement presentation. We believe that our audits provide a reasonable basis for ouropinion.
In our opinion, the financial statements referred to above present fairly, in all material respects, the con-solidated financial position of The Hain Celestial Group, Inc. and Subsidiaries at June 30, 2007 and 2006, andthe consolidated results of their operations and their cash flows for each of the three years in the period endedJune 30, 2007, in conformity with U.S. generally accepted accounting principles.
As described in Note 1 to the consolidated financial statements, during the fourth quarter 2007, the Companyadopted Securities and Exchange Commission Staff Accounting Bulletin No. 108, Considering the Effects ofPrior Year Misstatements when Quantifying Misstatements in the Current Year Financial Statements (“SABNo. 108”). In accordance with the transition provisions of SAB No. 108, the Company recorded an adjust-ment to retained earnings effective July 1, 2006 for the correction of prior period misstatements.
As described in Note 3 to the consolidated financial statements, the Company has restated its financial state-ments for the years ended June 30, 2006 and 2005.
We also have audited, in accordance with the standards of the Public Company Accounting Oversight Board(United States), the effectiveness of The Hain Celestial Group, Inc.’s internal control over financial reporting asof June 30, 2007, based on criteria established in Internal Control-Integrated Framework issued by the Com-mittee of Sponsoring Organizations of the Treadway Commission and our report dated January 30, 2008expressed an unqualified opinion thereon.
Melville, New YorkJanuary 30, 2008
F-21
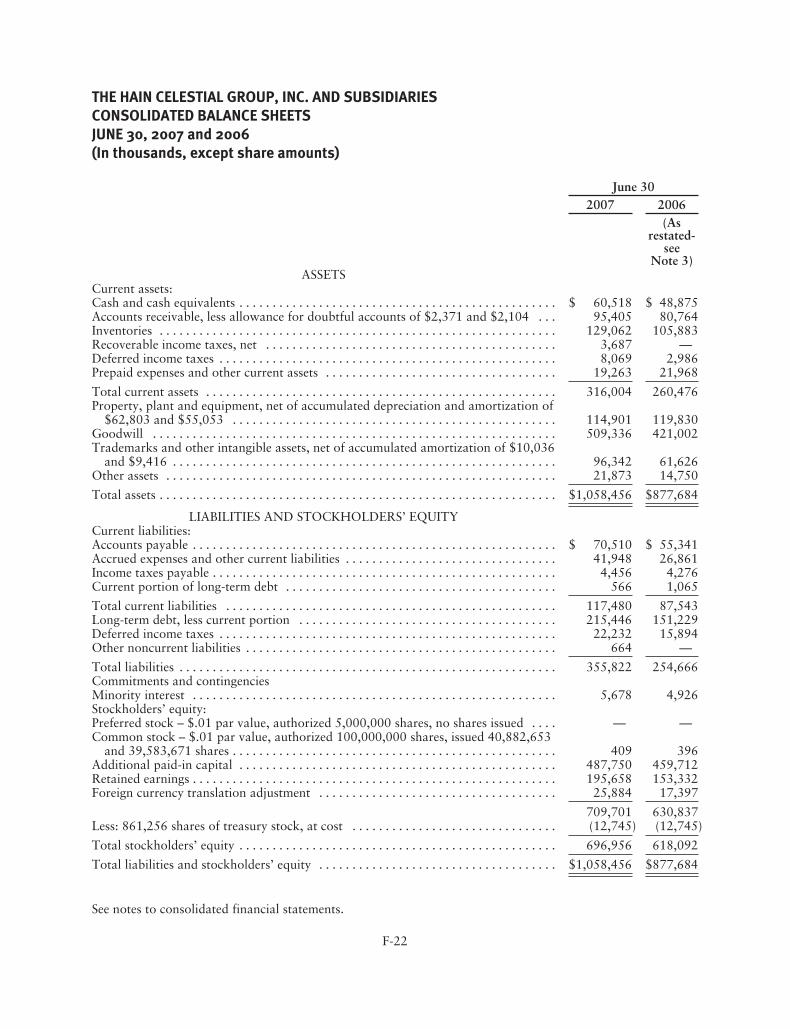
THE HAIN CELESTIAL GROUP, INC. AND SUBSIDIARIESCONSOLIDATED BALANCE SHEETSJUNE 30, 2007 and 2006(In thousands, except share amounts)
June 302007 2006
(Asrestated-
seeNote 3)
ASSETSCurrent assets:Cash and cash equivalents . . . . . . . . . . . . . . . . . . . . . . . . . . . . . . . . . . . . . . . . . . . . . . . . $ 60,518 $ 48,875Accounts receivable, less allowance for doubtful accounts of $2,371 and $2,104 . . . 95,405 80,764Inventories . . . . . . . . . . . . . . . . . . . . . . . . . . . . . . . . . . . . . . . . . . . . . . . . . . . . . . . . . . . . 129,062 105,883Recoverable income taxes, net . . . . . . . . . . . . . . . . . . . . . . . . . . . . . . . . . . . . . . . . . . . . 3,687 —Deferred income taxes . . . . . . . . . . . . . . . . . . . . . . . . . . . . . . . . . . . . . . . . . . . . . . . . . . . 8,069 2,986Prepaid expenses and other current assets . . . . . . . . . . . . . . . . . . . . . . . . . . . . . . . . . . . 19,263 21,968
Total current assets . . . . . . . . . . . . . . . . . . . . . . . . . . . . . . . . . . . . . . . . . . . . . . . . . . . . . 316,004 260,476Property, plant and equipment, net of accumulated depreciation and amortization of
$62,803 and $55,053 . . . . . . . . . . . . . . . . . . . . . . . . . . . . . . . . . . . . . . . . . . . . . . . . . 114,901 119,830Goodwill . . . . . . . . . . . . . . . . . . . . . . . . . . . . . . . . . . . . . . . . . . . . . . . . . . . . . . . . . . . . . 509,336 421,002Trademarks and other intangible assets, net of accumulated amortization of $10,036
and $9,416 . . . . . . . . . . . . . . . . . . . . . . . . . . . . . . . . . . . . . . . . . . . . . . . . . . . . . . . . . . 96,342 61,626Other assets . . . . . . . . . . . . . . . . . . . . . . . . . . . . . . . . . . . . . . . . . . . . . . . . . . . . . . . . . . . 21,873 14,750
Total assets . . . . . . . . . . . . . . . . . . . . . . . . . . . . . . . . . . . . . . . . . . . . . . . . . . . . . . . . . . . . $1,058,456 $877,684
LIABILITIES AND STOCKHOLDERS’ EQUITYCurrent liabilities:Accounts payable . . . . . . . . . . . . . . . . . . . . . . . . . . . . . . . . . . . . . . . . . . . . . . . . . . . . . . . $ 70,510 $ 55,341Accrued expenses and other current liabilities . . . . . . . . . . . . . . . . . . . . . . . . . . . . . . . . 41,948 26,861Income taxes payable . . . . . . . . . . . . . . . . . . . . . . . . . . . . . . . . . . . . . . . . . . . . . . . . . . . . 4,456 4,276Current portion of long-term debt . . . . . . . . . . . . . . . . . . . . . . . . . . . . . . . . . . . . . . . . . 566 1,065
Total current liabilities . . . . . . . . . . . . . . . . . . . . . . . . . . . . . . . . . . . . . . . . . . . . . . . . . . 117,480 87,543Long-term debt, less current portion . . . . . . . . . . . . . . . . . . . . . . . . . . . . . . . . . . . . . . . 215,446 151,229Deferred income taxes . . . . . . . . . . . . . . . . . . . . . . . . . . . . . . . . . . . . . . . . . . . . . . . . . . . 22,232 15,894Other noncurrent liabilities . . . . . . . . . . . . . . . . . . . . . . . . . . . . . . . . . . . . . . . . . . . . . . . 664 —
Total liabilities . . . . . . . . . . . . . . . . . . . . . . . . . . . . . . . . . . . . . . . . . . . . . . . . . . . . . . . . . 355,822 254,666Commitments and contingenciesMinority interest . . . . . . . . . . . . . . . . . . . . . . . . . . . . . . . . . . . . . . . . . . . . . . . . . . . . . . . 5,678 4,926Stockholders’ equity:Preferred stock – $.01 par value, authorized 5,000,000 shares, no shares issued . . . . — —Common stock – $.01 par value, authorized 100,000,000 shares, issued 40,882,653
and 39,583,671 shares . . . . . . . . . . . . . . . . . . . . . . . . . . . . . . . . . . . . . . . . . . . . . . . . . 409 396Additional paid-in capital . . . . . . . . . . . . . . . . . . . . . . . . . . . . . . . . . . . . . . . . . . . . . . . . 487,750 459,712Retained earnings . . . . . . . . . . . . . . . . . . . . . . . . . . . . . . . . . . . . . . . . . . . . . . . . . . . . . . . 195,658 153,332Foreign currency translation adjustment . . . . . . . . . . . . . . . . . . . . . . . . . . . . . . . . . . . . 25,884 17,397
709,701 630,837Less: 861,256 shares of treasury stock, at cost . . . . . . . . . . . . . . . . . . . . . . . . . . . . . . . (12,745) (12,745)
Total stockholders’ equity . . . . . . . . . . . . . . . . . . . . . . . . . . . . . . . . . . . . . . . . . . . . . . . . 696,956 618,092
Total liabilities and stockholders’ equity . . . . . . . . . . . . . . . . . . . . . . . . . . . . . . . . . . . . $1,058,456 $877,684
See notes to consolidated financial statements.
F-22
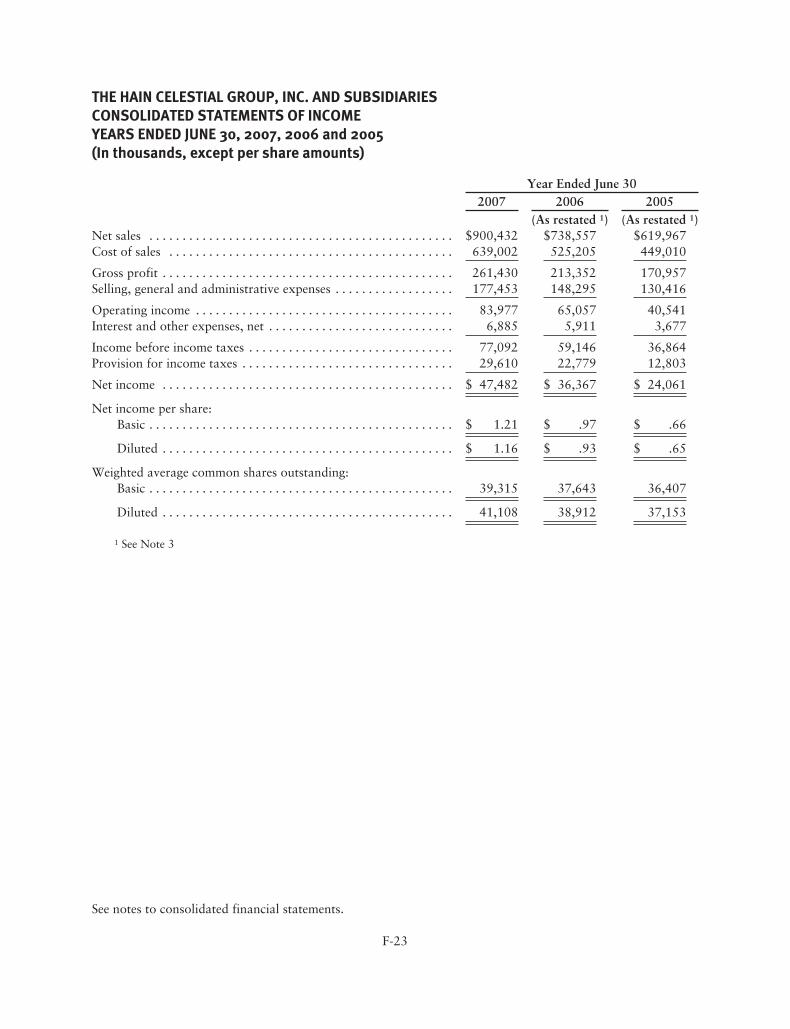
THE HAIN CELESTIAL GROUP, INC. AND SUBSIDIARIESCONSOLIDATED STATEMENTS OF INCOMEYEARS ENDED JUNE 30, 2007, 2006 and 2005(In thousands, except per share amounts)
Year Ended June 302007 2006 2005
(As restated 1) (As restated 1)Net sales . . . . . . . . . . . . . . . . . . . . . . . . . . . . . . . . . . . . . . . . . . . . . . $900,432 $738,557 $619,967Cost of sales . . . . . . . . . . . . . . . . . . . . . . . . . . . . . . . . . . . . . . . . . . . 639,002 525,205 449,010
Gross profit . . . . . . . . . . . . . . . . . . . . . . . . . . . . . . . . . . . . . . . . . . . . 261,430 213,352 170,957Selling, general and administrative expenses . . . . . . . . . . . . . . . . . . 177,453 148,295 130,416
Operating income . . . . . . . . . . . . . . . . . . . . . . . . . . . . . . . . . . . . . . . 83,977 65,057 40,541Interest and other expenses, net . . . . . . . . . . . . . . . . . . . . . . . . . . . . 6,885 5,911 3,677
Income before income taxes . . . . . . . . . . . . . . . . . . . . . . . . . . . . . . . 77,092 59,146 36,864Provision for income taxes . . . . . . . . . . . . . . . . . . . . . . . . . . . . . . . . 29,610 22,779 12,803
Net income . . . . . . . . . . . . . . . . . . . . . . . . . . . . . . . . . . . . . . . . . . . . $ 47,482 $ 36,367 $ 24,061
Net income per share:Basic . . . . . . . . . . . . . . . . . . . . . . . . . . . . . . . . . . . . . . . . . . . . . . $ 1.21 $ .97 $ .66
Diluted . . . . . . . . . . . . . . . . . . . . . . . . . . . . . . . . . . . . . . . . . . . . $ 1.16 $ .93 $ .65
Weighted average common shares outstanding:Basic . . . . . . . . . . . . . . . . . . . . . . . . . . . . . . . . . . . . . . . . . . . . . . 39,315 37,643 36,407
Diluted . . . . . . . . . . . . . . . . . . . . . . . . . . . . . . . . . . . . . . . . . . . . 41,108 38,912 37,153
1 See Note 3
See notes to consolidated financial statements.
F-23
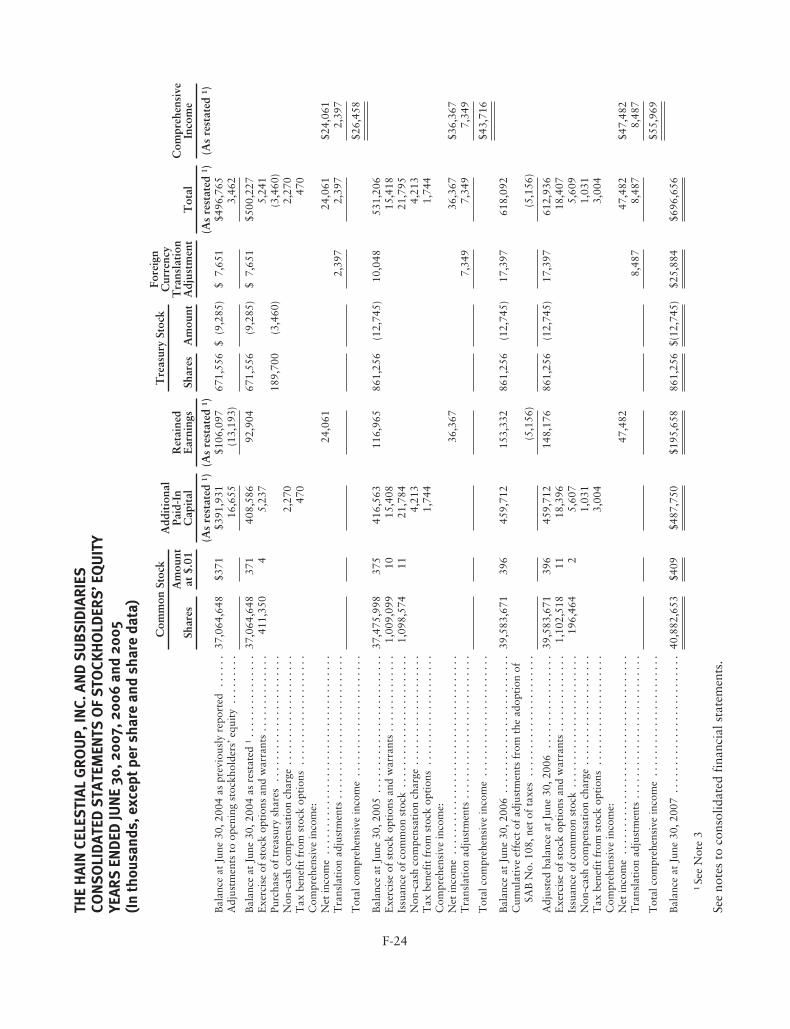
THE
HAI
NCE
LES
TIAL
GR
OU
P,IN
C.AN
DS
UB
SID
IAR
IES
CON
SO
LID
ATED
STA
TEM
ENTS
OF
STO
CKH
OLD
ERS
’EQ
UIT
YYE
ARS
END
EDJU
NE
30,2
007,
2006
and
2005
(In
thou
sand
s,ex
cept
pers
hare
and
shar
eda
ta)
Com
mon
Stoc
kA
ddit
iona
lPa
id-I
nC
apit
alR
etai
ned
Ear
ning
s
Tre
asur
ySt
ock
Fore
ign
Cur
renc
yT
rans
lati
onA
djus
tmen
tT
otal
Com
preh
ensi
veIn
com
eSh
ares
Am
ount
at$.
01Sh
ares
Am
ount
(As
rest
ated
1 )(A
sre
stat
ed1 )
(As
rest
ated
1 )(A
sre
stat
ed1 )
Bal
ance
atJu
ne30
,200
4as
prev
ious
lyre
port
ed..
....
37,0
64,6
48$3
71$3
91,9
31$1
06,0
9767
1,55
6$
(9,2
85)
$7,
651
$496
,765
Adj
ustm
ents
toop
enin
gst
ockh
olde
rs’e
quit
y..
....
...
16,6
55(1
3,19
3)3,
462
Bal
ance
atJu
ne30
,200
4as
rest
ated
1..
....
....
....
.37
,064
,648
371
408,
586
92,9
0467
1,55
6(9
,285
)$
7,65
1$5
00,2
27E
xerc
ise
ofst
ock
opti
ons
and
war
rant
s..
....
....
....
411,
350
45,
237
5,24
1Pu
rcha
seof
trea
sury
shar
es..
....
....
....
....
....
.18
9,70
0(3
,460
)(3
,460
)N
on-c
ash
com
pens
atio
nch
arge
....
....
....
....
....
2,27
02,
270
Tax
bene
fit
from
stoc
kop
tion
s..
....
....
....
....
..47
047
0C
ompr
ehen
sive
inco
me:
Net
inco
me
....
....
....
....
....
....
....
....
....
24,0
6124
,061
$24,
061
Tra
nsla
tion
adju
stm
ents
....
....
....
....
....
....
..2,
397
2,39
72,
397
Tot
alco
mpr
ehen
sive
inco
me
....
....
....
....
....
..$2
6,45
8
Bal
ance
atJu
ne30
,200
5..
....
....
....
....
....
...
37,4
75,9
9837
541
6,56
311
6,96
586
1,25
6(1
2,74
5)10
,048
531,
206
Exe
rcis
eof
stoc
kop
tion
san
dw
arra
nts
....
....
....
..1,
009,
099
1015
,408
15,4
18Is
suan
ceof
com
mon
stoc
k..
....
....
....
....
....
..1,
098,
574
1121
,784
21,7
95N
on-c
ash
com
pens
atio
nch
arge
....
....
....
....
....
4,21
34,
213
Tax
bene
fit
from
stoc
kop
tion
s..
....
....
....
....
..1,
744
1,74
4C
ompr
ehen
sive
inco
me:
Net
inco
me
....
....
....
....
....
....
....
....
....
36,3
6736
,367
$36,
367
Tra
nsla
tion
adju
stm
ents
....
....
....
....
....
....
..7,
349
7,34
97,
349
Tot
alco
mpr
ehen
sive
inco
me
....
....
....
....
....
..$4
3,71
6
Bal
ance
atJu
ne30
,200
6..
....
....
....
....
....
...
39,5
83,6
7139
645
9,71
215
3,33
286
1,25
6(1
2,74
5)17
,397
618,
092
Cum
ulat
ive
effe
ctof
adju
stm
ents
from
the
adop
tion
ofSA
BN
o.10
8,ne
tof
taxe
s..
....
....
....
....
....
(5,1
56)
(5,1
56)
Adj
uste
dba
lanc
eat
June
30,2
006
....
....
....
....
.39
,583
,671
396
459,
712
148,
176
861,
256
(12,
745)
17,3
9761
2,93
6E
xerc
ise
ofst
ock
opti
ons
and
war
rant
s..
....
....
....
1,10
2,51
811
18,3
9618
,407
Issu
ance
ofco
mm
onst
ock
....
....
....
....
....
....
196,
464
25,
607
5,60
9N
on-c
ash
com
pens
atio
nch
arge
....
....
....
....
....
1,03
11,
031
Tax
bene
fit
from
stoc
kop
tion
s..
....
....
....
....
..3,
004
3,00
4C
ompr
ehen
sive
inco
me:
Net
inco
me
....
....
....
....
....
....
....
....
....
47,4
8247
,482
$47,
482
Tra
nsla
tion
adju
stm
ents
....
....
....
....
....
....
..8,
487
8,48
78,
487
Tot
alco
mpr
ehen
sive
inco
me
....
....
....
....
....
..$5
5,96
9
Bal
ance
atJu
ne30
,200
7..
....
....
....
....
....
...
40,8
82,6
53$4
09$4
87,7
50$1
95,6
5886
1,25
6$(
12,7
45)
$25,
884
$696
,656
1Se
eN
ote
3
See
note
sto
cons
olid
ated
fina
ncia
lsta
tem
ents
.
F-24
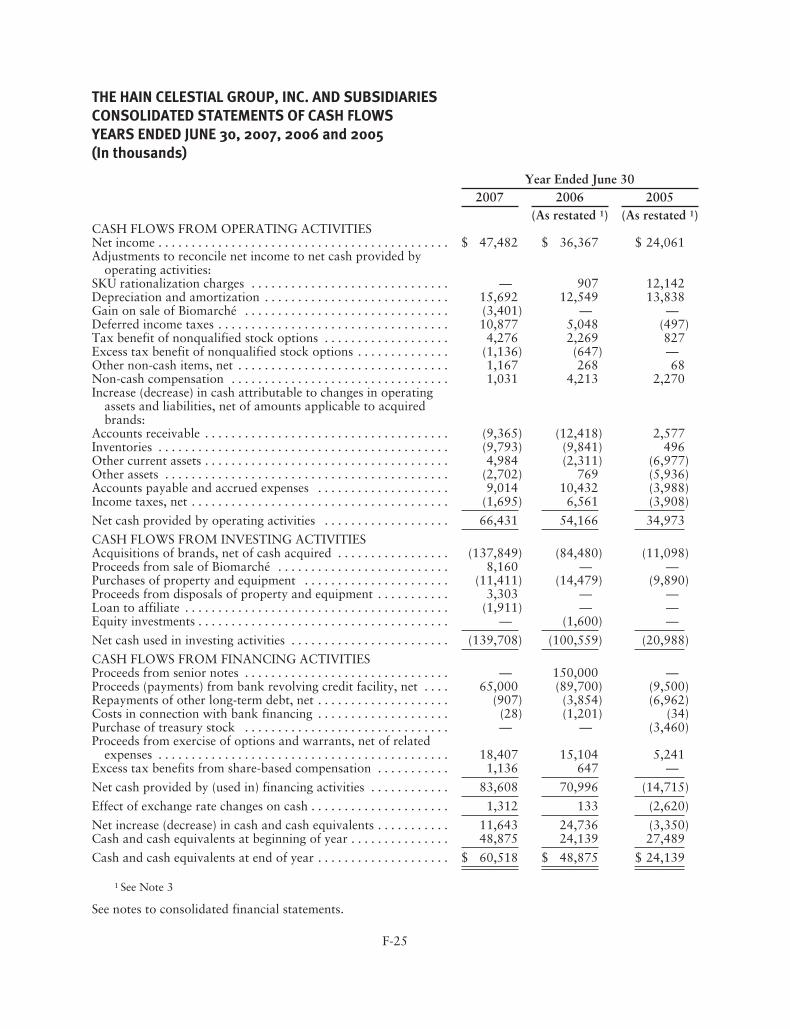
THE HAIN CELESTIAL GROUP, INC. AND SUBSIDIARIESCONSOLIDATED STATEMENTS OF CASH FLOWSYEARS ENDED JUNE 30, 2007, 2006 and 2005(In thousands)
Year Ended June 302007 2006 2005
(As restated 1) (As restated 1)CASH FLOWS FROM OPERATING ACTIVITIESNet income . . . . . . . . . . . . . . . . . . . . . . . . . . . . . . . . . . . . . . . . . . . . $ 47,482 $ 36,367 $ 24,061Adjustments to reconcile net income to net cash provided by
operating activities:SKU rationalization charges . . . . . . . . . . . . . . . . . . . . . . . . . . . . . . — 907 12,142Depreciation and amortization . . . . . . . . . . . . . . . . . . . . . . . . . . . . 15,692 12,549 13,838Gain on sale of Biomarché . . . . . . . . . . . . . . . . . . . . . . . . . . . . . . . (3,401) — —Deferred income taxes . . . . . . . . . . . . . . . . . . . . . . . . . . . . . . . . . . . 10,877 5,048 (497)Tax benefit of nonqualified stock options . . . . . . . . . . . . . . . . . . . 4,276 2,269 827Excess tax benefit of nonqualified stock options . . . . . . . . . . . . . . (1,136) (647) —Other non-cash items, net . . . . . . . . . . . . . . . . . . . . . . . . . . . . . . . . 1,167 268 68Non-cash compensation . . . . . . . . . . . . . . . . . . . . . . . . . . . . . . . . . 1,031 4,213 2,270Increase (decrease) in cash attributable to changes in operating
assets and liabilities, net of amounts applicable to acquiredbrands:
Accounts receivable . . . . . . . . . . . . . . . . . . . . . . . . . . . . . . . . . . . . . (9,365) (12,418) 2,577Inventories . . . . . . . . . . . . . . . . . . . . . . . . . . . . . . . . . . . . . . . . . . . . (9,793) (9,841) 496Other current assets . . . . . . . . . . . . . . . . . . . . . . . . . . . . . . . . . . . . . 4,984 (2,311) (6,977)Other assets . . . . . . . . . . . . . . . . . . . . . . . . . . . . . . . . . . . . . . . . . . . (2,702) 769 (5,936)Accounts payable and accrued expenses . . . . . . . . . . . . . . . . . . . . 9,014 10,432 (3,988)Income taxes, net . . . . . . . . . . . . . . . . . . . . . . . . . . . . . . . . . . . . . . . (1,695) 6,561 (3,908)
Net cash provided by operating activities . . . . . . . . . . . . . . . . . . . 66,431 54,166 34,973
CASH FLOWS FROM INVESTING ACTIVITIESAcquisitions of brands, net of cash acquired . . . . . . . . . . . . . . . . . (137,849) (84,480) (11,098)Proceeds from sale of Biomarché . . . . . . . . . . . . . . . . . . . . . . . . . . 8,160 — —Purchases of property and equipment . . . . . . . . . . . . . . . . . . . . . . (11,411) (14,479) (9,890)Proceeds from disposals of property and equipment . . . . . . . . . . . 3,303 — —Loan to affiliate . . . . . . . . . . . . . . . . . . . . . . . . . . . . . . . . . . . . . . . . (1,911) — —Equity investments . . . . . . . . . . . . . . . . . . . . . . . . . . . . . . . . . . . . . . — (1,600) —
Net cash used in investing activities . . . . . . . . . . . . . . . . . . . . . . . . (139,708) (100,559) (20,988)
CASH FLOWS FROM FINANCING ACTIVITIESProceeds from senior notes . . . . . . . . . . . . . . . . . . . . . . . . . . . . . . . — 150,000 —Proceeds (payments) from bank revolving credit facility, net . . . . 65,000 (89,700) (9,500)Repayments of other long-term debt, net . . . . . . . . . . . . . . . . . . . . (907) (3,854) (6,962)Costs in connection with bank financing . . . . . . . . . . . . . . . . . . . . (28) (1,201) (34)Purchase of treasury stock . . . . . . . . . . . . . . . . . . . . . . . . . . . . . . . — — (3,460)Proceeds from exercise of options and warrants, net of related
expenses . . . . . . . . . . . . . . . . . . . . . . . . . . . . . . . . . . . . . . . . . . . . 18,407 15,104 5,241Excess tax benefits from share-based compensation . . . . . . . . . . . 1,136 647 —
Net cash provided by (used in) financing activities . . . . . . . . . . . . 83,608 70,996 (14,715)
Effect of exchange rate changes on cash . . . . . . . . . . . . . . . . . . . . . 1,312 133 (2,620)
Net increase (decrease) in cash and cash equivalents . . . . . . . . . . . 11,643 24,736 (3,350)Cash and cash equivalents at beginning of year . . . . . . . . . . . . . . . 48,875 24,139 27,489
Cash and cash equivalents at end of year . . . . . . . . . . . . . . . . . . . . $ 60,518 $ 48,875 $ 24,139
1 See Note 3
See notes to consolidated financial statements.
F-25
THE HAIN CELESTIAL GROUP, INC. AND SUBSIDIARIESNOTES TO CONSOLIDATED FINANCIAL STATEMENTS
1. BUSINESS
The Hain Celestial Group, Inc., a Delaware corpo-ration, and its subsidiaries (collectively, the“Company”, and herein referred to as “we”, “us”,and “our”) manufacture, market, distribute and sellnatural and organic food products and naturalpersonal care products under brand names whichare sold as “better-for-you” products. We are aleader in many of the top natural food categories,with such well-known food brands as CelestialSeasonings®, Hain Pure Foods®, Westbrae Natu-ral®, WestSoy®, Rice Dream®, Soy Dream®, Imag-ine®, Walnut Acres Organic®, Ethnic Gourmet®,Rosetto®, Little Bear Organic Foods®, Bearitos®,Arrowhead Mills®, Health Valley®, Breadshop’s®,Casbah®, Spectrum Naturals®, Spectrum Essen-tials®, Hollywood® cooking oils, Garden of Eatin’®,Terra®, Harry’s Premium Snacks®, Boston’s TheBest You’ve Ever Tasted®, Lima®, Grains Noirs™,Natumi®, Yves Veggie Cuisine®, DeBoles®, Earth’sBest®, Nile Spice®, Linda McCartney®, Realeat®
and Granose®. The Company’s principal specialtyproduct lines include Estee® sugar-free products andAlba®. Our natural personal care product line ismarketed under the JASON®, Zia®, Orjene®,Shaman Earthly Organics®, Heather’s®, QueenHelene®, Batherapy®, Shower Therapy®, Foot-herapy®, Avalon Organics®, Alba Botanica® andTenderCare® personal care brands. Our natural andorganic antibiotic-free chicken is marketed underthe FreeBird™ brand and our antibiotic-free turkeyis marketed under the Plainville Farms® brand.
We operate in one business segment: the sale ofnatural and organic food and personal care prod-ucts. During the three years ended June 30, 2007,approximately 46%, 47% and 47% of our revenueswere derived from products that are manufacturedwithin our own facilities with 54%, 53% and 53%produced by various co-packers. In fiscal 2007,2006 and 2005, there were no co-packers whomanufactured 10% or more of our products.
2. SUMMARY OF SIGNIFICANT ACCOUNTING POLICIES
In the Notes to Consolidated Financial Statements,all dollar amounts, except per share data, are inthousands unless otherwise indicated.
Consolidation Policy
Our accompanying consolidated financial state-ments include the accounts of the Company and allof its wholly-owned and majority-owned sub-sidiaries. Material intercompany accounts andtransactions have been eliminated in consolidation.Investments in affiliated companies in which thecompany exercises significant influence, but which itdoes not control, are accounted for in the accom-panying consolidated financial statements under theequity method of accounting. As such, consolidatednet income includes the company’s equity portion ofcurrent earnings or losses of such companies.Investments in which the company does not exercisesignificant influence (generally less than a 20 percentownership interest) are accounted for under the costmethod.
Use of Estimates
The financial statements are prepared in accordancewith accounting principles generally accepted in theUnited States. The accounting principles we userequire us to make estimates and assumptions thataffect the reported amounts of assets and liabilitiesat the date of the financial statements and amountsof income and expenses during the reporting periodspresented. We believe in the quality and reason-ableness of our critical accounting policies; how-ever, it is likely that materially different amountswould be reported under different conditions orusing assumptions different from those that we haveconsistently applied.
Cash and Cash Equivalents
The Company considers cash and cash equivalentsto include cash in banks, commercial paper anddeposits with financial institutions that can beliquidated without prior notice or penalty. TheCompany considers all highly liquid investmentswith an original maturity of three months or less tobe cash equivalents.
F-26
Valuation of Accounts and Chargebacks Receivableand Concentration of Credit Risk
We perform ongoing credit evaluations on existingand new customers daily. We apply reserves fordelinquent or uncollectible trade receivables basedon a specific identification methodology and alsoapply an additional reserve based on the experiencewe have with our trade receivables aging categories.Credit losses have been within our expectations inrecent years. While one of our customers repre-sented 16% of our trade receivables balance as ofJune 30, 2007 and 12% of our trade receivablesbalance as of June 30, 2006, we believe there is nocredit exposure at this time.
Based on cash collection history and other statisticalanalysis, we estimate the amount of unauthorizeddeductions our customers have taken that we expectto be repaid in the near future in the form of achargeback receivable. Our estimate of this receiv-able balance ($2.4 million at June 30, 2007 and$4.1 million at June 30, 2006) could be differenthad we used different assumptions and judgments.
During the year ended June 30, 2007, sales to onecustomer and its affiliates approximated 20% of netsales. In fiscal 2006 sales to one customer and itsaffiliates approximated 21% of net sales. In fiscal2005, sales to one customer and its affiliatesapproximated 22% of net sales.
Inventory
Our inventory is valued at the lower of actual costor market, utilizing the first-in, first-out method. Weprovide write-downs for finished goods expected tobecome non-saleable due to age and specificallyidentify and provide for slow moving or obsoleteraw ingredients and packaging.
Property, Plant and Equipment
Our property, plant and equipment is carried at costand depreciated or amortized on a straight-line basisover the estimated useful lives or lease life, which-ever is shorter. We believe the asset lives assigned toour property, plant and equipment are withinranges generally used in food manufacturing anddistribution businesses. Our manufacturing plantsand distribution centers, and their related assets, areperiodically reviewed to determine if any impair-
ment exists by analyzing underlying cash flow pro-jections. At this time, we believe no impairmentexists on the carrying value of such assets. Ordinaryrepairs and maintenance are expensed as incurred.We utilize the following ranges of asset lives:
Buildings and improvements . . . . . . . . 10-40 yearsMachinery and equipment . . . . . . . . . 3-20 yearsFurniture and fixtures . . . . . . . . . . . . . 3-15 years
Leasehold improvements are amortized over theshorter of the respective initial lease term or theestimated useful life of the assets, and generallyrange from 3 to 15 years.
Intangibles
Goodwill is no longer amortized and the value of anidentifiable intangible asset is amortized over itsuseful life unless the asset is determined to have anindefinite useful life. The carrying value of goodwill,which is allocated to reporting units, and otherintangible assets with indefinite useful lives aretested annually for impairment.
Revenue Recognition and Sales Incentives
Sales are recognized when the earnings process iscomplete, which occurs when products are shippedin accordance with terms of agreements, title andrisk of loss transfer to customers, collection is prob-able and pricing is fixed or determinable. Sales arereported net of sales incentives, which include tradediscounts and promotions and certain coupon costs.Shipping and handling costs billed to customers areincluded in reported sales. Allowances for cashdiscounts are recorded in the period in which therelated sale is recognized.
Foreign Currency Translation
Financial statements of foreign subsidiaries are trans-lated into U.S. dollars at current rates, except thatrevenues, costs and expenses are translated at aver-age rates during each reporting period. Netexchange gains or losses resulting from the trans-lation of foreign financial statements and the effectof exchange rate changes on intercompany trans-actions of a long-term investment nature areaccumulated and credited or charged directly to aseparate component of stockholders’ equity andother comprehensive income.
F-27
Research and Development Costs
Research and development costs are expensed asincurred and are included in selling, general andadministrative expenses in the accompanying con-solidated financial statements. Research anddevelopment costs amounted to $1.5 million in fis-cal 2007, $1.2 million in fiscal 2006 and $2.6 mil-lion in fiscal year 2005. Our research anddevelopment expenditures do not include theexpenditures on such activities undertaken byco-packers who develop numerous products on theirown initiative with the expectation that we willaccept their new product ideas and market themunder our brands. These efforts by co-packers haveresulted in a substantial number of our new productintroductions. We are unable to estimate theamount of expenditures made by co-packers onresearch and development; however, we believe suchactivities and expenditures are important to ourcontinuing ability to introduce new products.
Advertising Costs
Media advertising costs, which are included in sell-ing, general and administrative expenses, amountedto $7.5 million in fiscal 2007, $5.4 million in fiscal2006 and $4.3 million in fiscal year 2005. Suchcosts are expensed as incurred.
Income Taxes
We follow the liability method of accounting forincome taxes. Under the liability method, deferredtaxes are determined based on the differencesbetween the financial statement and tax bases ofassets and liabilities at enacted rates in effect in theyears in which the differences are expected toreverse. Valuation allowances are provided fordeferred tax assets to the extent it is more likelythan not that deferred tax assets will not berecoverable against future taxable income.
Shipping and Handling Costs
We include the costs associated with shipping andhandling of our inventory as a component of costof sales.
Fair Values of Financial Instruments
Financial instruments consist primarily of invest-ments in cash and cash equivalents, trade accounts
receivable, accounts payable and debt obligations.The Company estimates the fair value of financialinstruments based on interest rates available to theCompany and by comparison to quoted marketprices. At June 30, 2007 and 2006, we had $40.5million and $27.8 million invested in corporatemoney market securities, including commercialpaper, repurchase agreements, variable rate instru-ments and bank instruments. These securities areclassified as cash equivalents as their maturitieswhen purchased are less than three months. AtJune 30, 2007 and 2006, the carrying amounts ofcash and cash equivalents, accounts receivable,income taxes receivable and payable and accountspayable are considered to be representative of theirrespective fair values due to their short-term nature.The carrying amounts of the notes payable to banksare considered to be representative of theirrespective fair values as their interest rates are basedon market rates. The estimated fair value of theCompany’s Senior Notes payable was $150 millionat June 30, 2007 and June 30, 2006.
Stock-Based Compensation
The Company has employee and director stock-based compensation plans which are more fullydescribed in Note 14. Effective July 1, 2005, theCompany adopted Statement of Financial Account-ing Standards No. 123(R) (“SFAS No. 123(R)”),“Share Based Payment,” to account for stock-basedcompensation, using the modified-prospective tran-sition method. Under that transition method, com-pensation cost is recognized for the vested portionof stock-based payments granted on or after July 1,2005, based on the grant-date fair value estimatedin accordance with the provisions of SFASNo. 123(R) and for all stock-based paymentsgranted prior to, but not yet vested as of July 1,2005, based on the grant-date fair value estimatedin accordance with the original provisions of SFASNo. 123. Results for prior periods have not beenrestated as allowed under the modified prospectivetransition method. Prior to July 1, 2005, the Com-pany accounted for its stock-based compensationplans under the recognition and measurementprinciples of Accounting Principles Board (“APB”)Opinion No. 25, “Accounting for Stock Issued toEmployees.” As a result, no stock-based compensa-tion costs were reflected in results of operations foroptions granted, since the Company historically hastreated its stock options as having been granted at
F-28
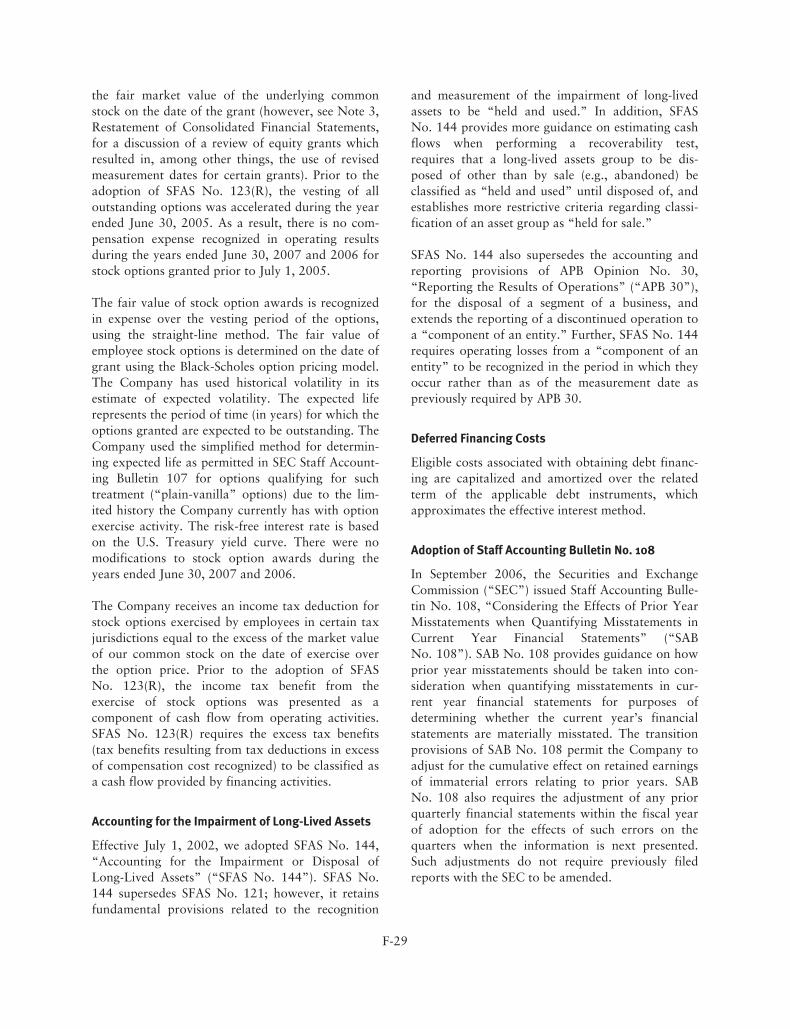
the fair market value of the underlying commonstock on the date of the grant (however, see Note 3,Restatement of Consolidated Financial Statements,for a discussion of a review of equity grants whichresulted in, among other things, the use of revisedmeasurement dates for certain grants). Prior to theadoption of SFAS No. 123(R), the vesting of alloutstanding options was accelerated during the yearended June 30, 2005. As a result, there is no com-pensation expense recognized in operating resultsduring the years ended June 30, 2007 and 2006 forstock options granted prior to July 1, 2005.
The fair value of stock option awards is recognizedin expense over the vesting period of the options,using the straight-line method. The fair value ofemployee stock options is determined on the date ofgrant using the Black-Scholes option pricing model.The Company has used historical volatility in itsestimate of expected volatility. The expected liferepresents the period of time (in years) for which theoptions granted are expected to be outstanding. TheCompany used the simplified method for determin-ing expected life as permitted in SEC Staff Account-ing Bulletin 107 for options qualifying for suchtreatment (“plain-vanilla” options) due to the lim-ited history the Company currently has with optionexercise activity. The risk-free interest rate is basedon the U.S. Treasury yield curve. There were nomodifications to stock option awards during theyears ended June 30, 2007 and 2006.
The Company receives an income tax deduction forstock options exercised by employees in certain taxjurisdictions equal to the excess of the market valueof our common stock on the date of exercise overthe option price. Prior to the adoption of SFASNo. 123(R), the income tax benefit from theexercise of stock options was presented as acomponent of cash flow from operating activities.SFAS No. 123(R) requires the excess tax benefits(tax benefits resulting from tax deductions in excessof compensation cost recognized) to be classified asa cash flow provided by financing activities.
Accounting for the Impairment of Long-Lived Assets
Effective July 1, 2002, we adopted SFAS No. 144,“Accounting for the Impairment or Disposal ofLong-Lived Assets” (“SFAS No. 144”). SFAS No.144 supersedes SFAS No. 121; however, it retainsfundamental provisions related to the recognition
and measurement of the impairment of long-livedassets to be “held and used.” In addition, SFASNo. 144 provides more guidance on estimating cashflows when performing a recoverability test,requires that a long-lived assets group to be dis-posed of other than by sale (e.g., abandoned) beclassified as “held and used” until disposed of, andestablishes more restrictive criteria regarding classi-fication of an asset group as “held for sale.”
SFAS No. 144 also supersedes the accounting andreporting provisions of APB Opinion No. 30,“Reporting the Results of Operations” (“APB 30”),for the disposal of a segment of a business, andextends the reporting of a discontinued operation toa “component of an entity.” Further, SFAS No. 144requires operating losses from a “component of anentity” to be recognized in the period in which theyoccur rather than as of the measurement date aspreviously required by APB 30.
Deferred Financing Costs
Eligible costs associated with obtaining debt financ-ing are capitalized and amortized over the relatedterm of the applicable debt instruments, whichapproximates the effective interest method.
Adoption of Staff Accounting Bulletin No. 108
In September 2006, the Securities and ExchangeCommission (“SEC”) issued Staff Accounting Bulle-tin No. 108, “Considering the Effects of Prior YearMisstatements when Quantifying Misstatements inCurrent Year Financial Statements” (“SABNo. 108”). SAB No. 108 provides guidance on howprior year misstatements should be taken into con-sideration when quantifying misstatements in cur-rent year financial statements for purposes ofdetermining whether the current year’s financialstatements are materially misstated. The transitionprovisions of SAB No. 108 permit the Company toadjust for the cumulative effect on retained earningsof immaterial errors relating to prior years. SABNo. 108 also requires the adjustment of any priorquarterly financial statements within the fiscal yearof adoption for the effects of such errors on thequarters when the information is next presented.Such adjustments do not require previously filedreports with the SEC to be amended.
F-29
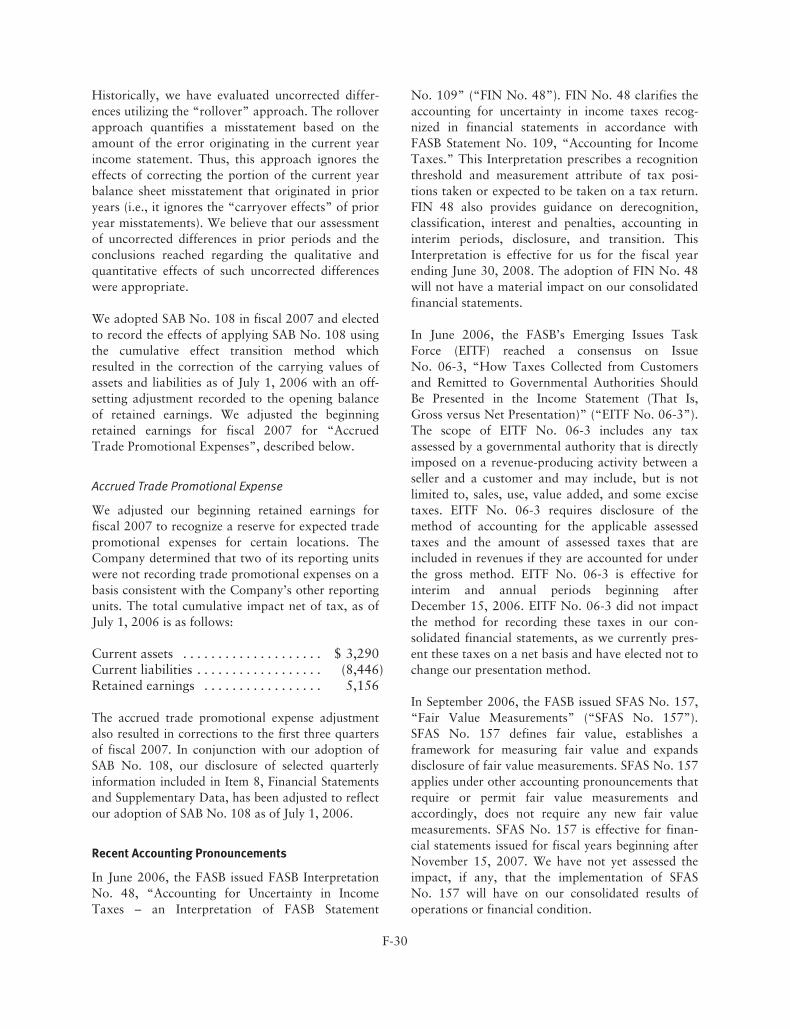
Historically, we have evaluated uncorrected differ-ences utilizing the “rollover” approach. The rolloverapproach quantifies a misstatement based on theamount of the error originating in the current yearincome statement. Thus, this approach ignores theeffects of correcting the portion of the current yearbalance sheet misstatement that originated in prioryears (i.e., it ignores the “carryover effects” of prioryear misstatements). We believe that our assessmentof uncorrected differences in prior periods and theconclusions reached regarding the qualitative andquantitative effects of such uncorrected differenceswere appropriate.
We adopted SAB No. 108 in fiscal 2007 and electedto record the effects of applying SAB No. 108 usingthe cumulative effect transition method whichresulted in the correction of the carrying values ofassets and liabilities as of July 1, 2006 with an off-setting adjustment recorded to the opening balanceof retained earnings. We adjusted the beginningretained earnings for fiscal 2007 for “AccruedTrade Promotional Expenses”, described below.
Accrued Trade Promotional Expense
We adjusted our beginning retained earnings forfiscal 2007 to recognize a reserve for expected tradepromotional expenses for certain locations. TheCompany determined that two of its reporting unitswere not recording trade promotional expenses on abasis consistent with the Company’s other reportingunits. The total cumulative impact net of tax, as ofJuly 1, 2006 is as follows:
Current assets . . . . . . . . . . . . . . . . . . . . $ 3,290Current liabilities . . . . . . . . . . . . . . . . . . (8,446)Retained earnings . . . . . . . . . . . . . . . . . 5,156
The accrued trade promotional expense adjustmentalso resulted in corrections to the first three quartersof fiscal 2007. In conjunction with our adoption ofSAB No. 108, our disclosure of selected quarterlyinformation included in Item 8, Financial Statementsand Supplementary Data, has been adjusted to reflectour adoption of SAB No. 108 as of July 1, 2006.
Recent Accounting Pronouncements
In June 2006, the FASB issued FASB InterpretationNo. 48, “Accounting for Uncertainty in IncomeTaxes – an Interpretation of FASB Statement
No. 109” (“FIN No. 48”). FIN No. 48 clarifies theaccounting for uncertainty in income taxes recog-nized in financial statements in accordance withFASB Statement No. 109, “Accounting for IncomeTaxes.” This Interpretation prescribes a recognitionthreshold and measurement attribute of tax posi-tions taken or expected to be taken on a tax return.FIN 48 also provides guidance on derecognition,classification, interest and penalties, accounting ininterim periods, disclosure, and transition. ThisInterpretation is effective for us for the fiscal yearending June 30, 2008. The adoption of FIN No. 48will not have a material impact on our consolidatedfinancial statements.
In June 2006, the FASB’s Emerging Issues TaskForce (EITF) reached a consensus on IssueNo. 06-3, “How Taxes Collected from Customersand Remitted to Governmental Authorities ShouldBe Presented in the Income Statement (That Is,Gross versus Net Presentation)” (“EITF No. 06-3”).The scope of EITF No. 06-3 includes any taxassessed by a governmental authority that is directlyimposed on a revenue-producing activity between aseller and a customer and may include, but is notlimited to, sales, use, value added, and some excisetaxes. EITF No. 06-3 requires disclosure of themethod of accounting for the applicable assessedtaxes and the amount of assessed taxes that areincluded in revenues if they are accounted for underthe gross method. EITF No. 06-3 is effective forinterim and annual periods beginning afterDecember 15, 2006. EITF No. 06-3 did not impactthe method for recording these taxes in our con-solidated financial statements, as we currently pres-ent these taxes on a net basis and have elected not tochange our presentation method.
In September 2006, the FASB issued SFAS No. 157,“Fair Value Measurements” (“SFAS No. 157”).SFAS No. 157 defines fair value, establishes aframework for measuring fair value and expandsdisclosure of fair value measurements. SFAS No. 157applies under other accounting pronouncements thatrequire or permit fair value measurements andaccordingly, does not require any new fair valuemeasurements. SFAS No. 157 is effective for finan-cial statements issued for fiscal years beginning afterNovember 15, 2007. We have not yet assessed theimpact, if any, that the implementation of SFASNo. 157 will have on our consolidated results ofoperations or financial condition.
F-30
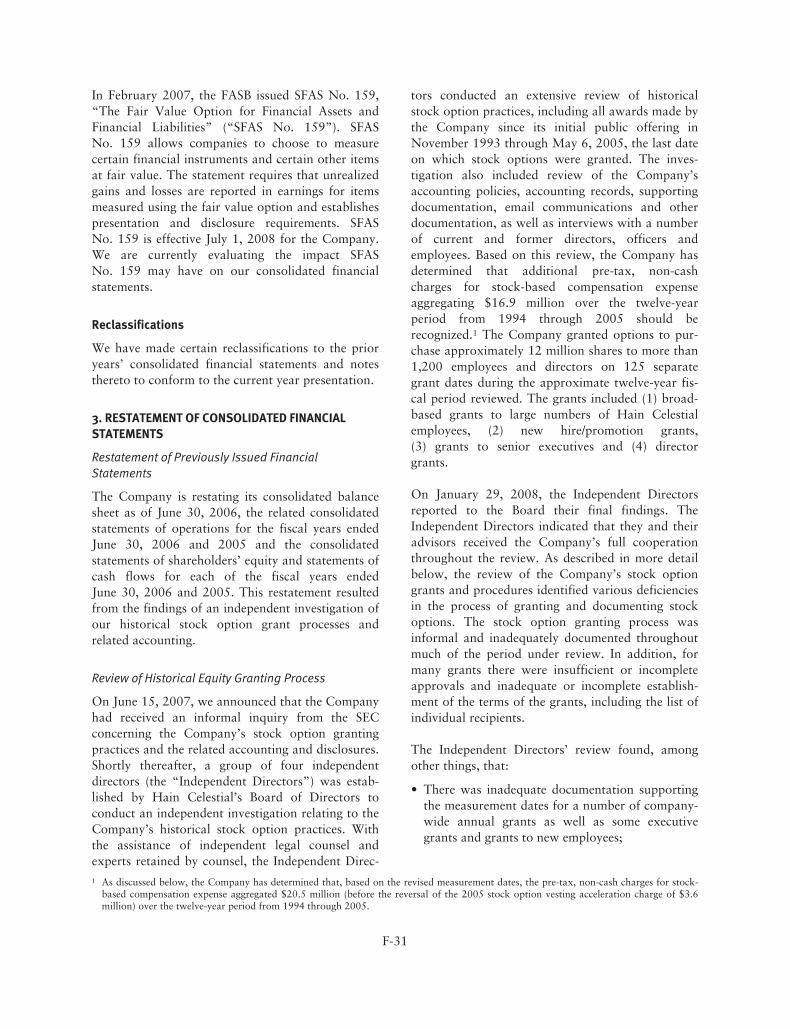
In February 2007, the FASB issued SFAS No. 159,“The Fair Value Option for Financial Assets andFinancial Liabilities” (“SFAS No. 159”). SFASNo. 159 allows companies to choose to measurecertain financial instruments and certain other itemsat fair value. The statement requires that unrealizedgains and losses are reported in earnings for itemsmeasured using the fair value option and establishespresentation and disclosure requirements. SFASNo. 159 is effective July 1, 2008 for the Company.We are currently evaluating the impact SFASNo. 159 may have on our consolidated financialstatements.
Reclassifications
We have made certain reclassifications to the prioryears’ consolidated financial statements and notesthereto to conform to the current year presentation.
3. RESTATEMENT OF CONSOLIDATED FINANCIALSTATEMENTS
Restatement of Previously Issued FinancialStatements
The Company is restating its consolidated balancesheet as of June 30, 2006, the related consolidatedstatements of operations for the fiscal years endedJune 30, 2006 and 2005 and the consolidatedstatements of shareholders’ equity and statements ofcash flows for each of the fiscal years endedJune 30, 2006 and 2005. This restatement resultedfrom the findings of an independent investigation ofour historical stock option grant processes andrelated accounting.
Review of Historical Equity Granting Process
On June 15, 2007, we announced that the Companyhad received an informal inquiry from the SECconcerning the Company’s stock option grantingpractices and the related accounting and disclosures.Shortly thereafter, a group of four independentdirectors (the “Independent Directors”) was estab-lished by Hain Celestial’s Board of Directors toconduct an independent investigation relating to theCompany’s historical stock option practices. Withthe assistance of independent legal counsel andexperts retained by counsel, the Independent Direc-
tors conducted an extensive review of historicalstock option practices, including all awards made bythe Company since its initial public offering inNovember 1993 through May 6, 2005, the last dateon which stock options were granted. The inves-tigation also included review of the Company’saccounting policies, accounting records, supportingdocumentation, email communications and otherdocumentation, as well as interviews with a numberof current and former directors, officers andemployees. Based on this review, the Company hasdetermined that additional pre-tax, non-cashcharges for stock-based compensation expenseaggregating $16.9 million over the twelve-yearperiod from 1994 through 2005 should berecognized.1 The Company granted options to pur-chase approximately 12 million shares to more than1,200 employees and directors on 125 separategrant dates during the approximate twelve-year fis-cal period reviewed. The grants included (1) broad-based grants to large numbers of Hain Celestialemployees, (2) new hire/promotion grants,(3) grants to senior executives and (4) directorgrants.
On January 29, 2008, the Independent Directorsreported to the Board their final findings. TheIndependent Directors indicated that they and theiradvisors received the Company’s full cooperationthroughout the review. As described in more detailbelow, the review of the Company’s stock optiongrants and procedures identified various deficienciesin the process of granting and documenting stockoptions. The stock option granting process wasinformal and inadequately documented throughoutmuch of the period under review. In addition, formany grants there were insufficient or incompleteapprovals and inadequate or incomplete establish-ment of the terms of the grants, including the list ofindividual recipients.
The Independent Directors’ review found, amongother things, that:
• There was inadequate documentation supportingthe measurement dates for a number of company-wide annual grants as well as some executivegrants and grants to new employees;
1 As discussed below, the Company has determined that, based on the revised measurement dates, the pre-tax, non-cash charges for stock-based compensation expense aggregated $20.5 million (before the reversal of the 2005 stock option vesting acceleration charge of $3.6million) over the twelve-year period from 1994 through 2005.
F-31
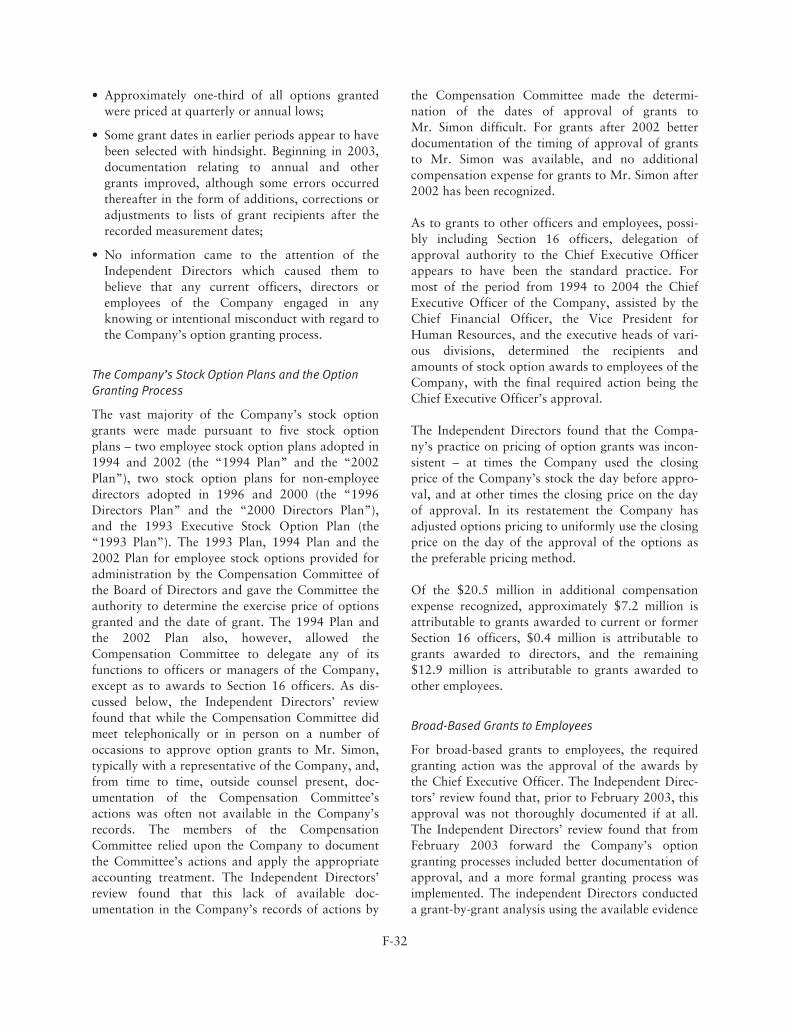
• Approximately one-third of all options grantedwere priced at quarterly or annual lows;
• Some grant dates in earlier periods appear to havebeen selected with hindsight. Beginning in 2003,documentation relating to annual and othergrants improved, although some errors occurredthereafter in the form of additions, corrections oradjustments to lists of grant recipients after therecorded measurement dates;
• No information came to the attention of theIndependent Directors which caused them tobelieve that any current officers, directors oremployees of the Company engaged in anyknowing or intentional misconduct with regard tothe Company’s option granting process.
The Company’s Stock Option Plans and the OptionGranting Process
The vast majority of the Company’s stock optiongrants were made pursuant to five stock optionplans – two employee stock option plans adopted in1994 and 2002 (the “1994 Plan” and the “2002Plan”), two stock option plans for non-employeedirectors adopted in 1996 and 2000 (the “1996Directors Plan” and the “2000 Directors Plan”),and the 1993 Executive Stock Option Plan (the“1993 Plan”). The 1993 Plan, 1994 Plan and the2002 Plan for employee stock options provided foradministration by the Compensation Committee ofthe Board of Directors and gave the Committee theauthority to determine the exercise price of optionsgranted and the date of grant. The 1994 Plan andthe 2002 Plan also, however, allowed theCompensation Committee to delegate any of itsfunctions to officers or managers of the Company,except as to awards to Section 16 officers. As dis-cussed below, the Independent Directors’ reviewfound that while the Compensation Committee didmeet telephonically or in person on a number ofoccasions to approve option grants to Mr. Simon,typically with a representative of the Company, and,from time to time, outside counsel present, doc-umentation of the Compensation Committee’sactions was often not available in the Company’srecords. The members of the CompensationCommittee relied upon the Company to documentthe Committee’s actions and apply the appropriateaccounting treatment. The Independent Directors’review found that this lack of available doc-umentation in the Company’s records of actions by
the Compensation Committee made the determi-nation of the dates of approval of grants toMr. Simon difficult. For grants after 2002 betterdocumentation of the timing of approval of grantsto Mr. Simon was available, and no additionalcompensation expense for grants to Mr. Simon after2002 has been recognized.
As to grants to other officers and employees, possi-bly including Section 16 officers, delegation ofapproval authority to the Chief Executive Officerappears to have been the standard practice. Formost of the period from 1994 to 2004 the ChiefExecutive Officer of the Company, assisted by theChief Financial Officer, the Vice President forHuman Resources, and the executive heads of vari-ous divisions, determined the recipients andamounts of stock option awards to employees of theCompany, with the final required action being theChief Executive Officer’s approval.
The Independent Directors found that the Compa-ny’s practice on pricing of option grants was incon-sistent – at times the Company used the closingprice of the Company’s stock the day before appro-val, and at other times the closing price on the dayof approval. In its restatement the Company hasadjusted options pricing to uniformly use the closingprice on the day of the approval of the options asthe preferable pricing method.
Of the $20.5 million in additional compensationexpense recognized, approximately $7.2 million isattributable to grants awarded to current or formerSection 16 officers, $0.4 million is attributable togrants awarded to directors, and the remaining$12.9 million is attributable to grants awarded toother employees.
Broad-Based Grants to Employees
For broad-based grants to employees, the requiredgranting action was the approval of the awards bythe Chief Executive Officer. The Independent Direc-tors’ review found that, prior to February 2003, thisapproval was not thoroughly documented if at all.The Independent Directors’ review found that fromFebruary 2003 forward the Company’s optiongranting processes included better documentation ofapproval, and a more formal granting process wasimplemented. The independent Directors conducteda grant-by-grant analysis using the available evidence
F-32
for each grant, determined the date when grantswere fixed with finality, and revised measurementdates if necessary.
New Hire or Promotion Grants
The Independent Directors’ review found that it wasthe practice at the Company for some senior execu-tives to receive stock options as part of their nego-tiated compensation package upon joining theCompany or upon assuming a more senior positionwithin the Company. It was noted in the review thatsome offer or promotion letters included a statementthat the employee would receive options at thelowest price within a several-month period. Reviewof selected personnel files for active and terminatedemployees demonstrated that: 1) option grants fornew hires and promotions were the exception,rather than the rule, and 2) even for those new hiresand promoted employees who received stockoptions as part of their compensation this “lowestprice” language was unusual. For grants to employ-ees whose new hire or promotion letter includedsuch “lowest price” language the Company hasconsidered whether that language led to the issuanceof a discounted option and accounted for the grantaccordingly.
The Independent Directors’ review also found anumber of instances in which new hire or promo-tion option grants did not follow the terms outlinedin the new hire or promotion letters. Those grantshave been treated as repricings and given variableaccounting treatment.
Grants to Senior Executives
The Company is recognizing $1,371,000 of compen-sation expense related to options granted toMr. Simon between 1995 and 2001. Mr. Simon,who has been the Company’s Chief Executive Offi-cer since its founding, did not have the ability toauthorize grants to himself. Rather, all ofMr. Simon’s grants were approved by the Compen-sation Committee of the Board of Directors or, asdiscussed below, in some cases by the full Board.Stock options were a significant part of Mr. Simon’scompensation and were specifically provided for inhis several employment agreements with the Com-pany as disclosed in the Company’s annual proxystatements. The Independent Directors’ reviewfound that the Compensation Committee did meet
telephonically or in person on a number of occa-sions to approve option grants to Mr. Simon, typi-cally with a representative of the Company, and,from time to time, outside counsel present. Themembers of the Compensation Committee reliedupon the Company to document the Committee’sactions and apply the appropriate accountingtreatment. The Independent Directors’ review foundthat documentation of the Compensation Commit-tee’s actions was often not available in the Compa-ny’s records. This lack of available documentationin the Company’s records of actions by theCompensation Committee made the IndependentDirectors’ determination of the dates of approvaldifficult. For grants after 2002 better documentationof the timing of approval of grants to Mr. Simonwas available, and no additional compensationexpense for grants to Mr. Simon after 2002 hasbeen recognized.
Mr. Simon received 600,000 stock options with aJuly 31, 2000 date and a strike price of $26.63. Theevidence indicates that by approving a term sheetfor Simon’s new employment agreement on June 30,2000 the Board of Directors expressed its intent togrant 300,000 of those options on June 30, 2000and 300,000 on July 1, 2000. Accordingly, thechange in the language of Mr. Simon’s finalemployment agreement to grant and date theoptions on or before July 31, 2000 was effectively arepricing of the options, resulting in variableaccounting treatment for the life of the grant. Thischange resulted in approximately $3.5 million ofcompensation expense in the quarter endedDecember 31, 2000; however, in accordance withthe requirements of variable accounting, such com-pensation expense reversed in its entirety in the fol-lowing quarters as the market price of theCompany’s stock dropped below $26.63. Themarket price remained below $26.63 for all sub-sequent quarters with the exception of the quarterended December 31, 2001, until variable accountingtreatment was eliminated by the adoption of SFASNo. 123R. As a result, the repricing of this optiondid not have any impact on the cumulative effectrecorded as of July 1, 2004.
The Independent Directors’ review found that agrant of 300,000 options to Mr. Simon at theJuly 11, 2001 closing price, which was the low priceof the stock for that month, was approved by thefull Hain Celestial Board of Directors at a meeting
F-33
on August 7, 2001. Although the Board was advisedthat a grant with a July 2001 date was required(Mr. Simon’s employment agreement provided thathis options would be granted between July 1 andJuly 31 of each year) in effect the Board approvedthe award of a stock option grant at a discountedprice on August 7. Because the approval action forthis grant occurred on August 7, 2001, that is therevised measurement date for this grant. Thischange resulted in approximately $1.2 million incompensation expense in the current restatement.
In determining the appropriate measurement datesfor Mr. Simon’s option grants, the Company gen-erally has relied upon the earliest contemporaneousdocumentary evidence for the grant. One exceptionis a grant made to Mr. Simon in connection with theCompany’s acquisition of Natural Nutrition Groupin May, 1999. For that specific grant of options topurchase 300,000 shares the Independent Directors’review found that interview evidence of theCompensation Committee’s intent and approval ofthe grant contingent upon the closing of the acquis-ition was sufficient, although contemporaneousdocumentary evidence was not available, and thehistoric grant date of May 18, 1999 (the date theacquisition closed) was not changed.
Mr. Simon received a grant of 25,000 options datedOctober 16, 1995 at the exercise price of $2.94. TheIndependent Directors’ review found nocontemporaneous documentation of granting actionby the Compensation Committee or the Board ofDirectors for this grant. This grant has beenremeasured to the date of the earliest availabledocumentary evidence that the grant was fixed andfinal, which was September 27, 1996, the date onwhich the Company filed Form 10-KSB in whichMr. Simon’s grant was included in the earnings pershare calculation. The closing price of the Compa-ny’s stock on September 27, 1996 was $3.88, whichwas used as the remeasured price for this grant incomputing additional compensation expense to theCompany.
Mr. Simon was entitled by his 2000 EmploymentAgreement to an annual grant each July of optionsto purchase 300,000 shares through July 2002.Mr. Simon received a grant of 300,000 optionsdated July 22, 2002 at the exercise price of $14.25for which the Independent Directors’ review foundno contemporaneous documentation of granting
action by the Compensation Committee or theBoard of Directors. Mr. Simon’s grant agreementappears to have been signed on October 22, 2002,which has been used as the remeasurement date forthis grant. On October 22, 2002, the closing priceof the Company’s stock was $13.62, so theremeasurement of this grant resulted in no addi-tional compensation expense.
Mr. Simon was granted 300,000 options datedJuly 30, 2004 at the exercise price of $16.53. TheIndependent Directors’ review determined that thisgrant was considered and approved by the Compen-sation Committee on August 5, 2004, and that aunanimous written consent was executed by themembers of the Committee between August 17,2004 and August 26, 2004. August 5, 2004 hasbeen used as the revised measurement date for thisgrant. Because the closing price of the Company’sstock on August 5, 2004 was $16.01, lower thanthe grant’s exercise price of $16.53, the Companyhas incurred no additional compensation expensefor this grant.
Two option grants to Mr. Ira Lamel, the Company’scurrent Chief Financial Officer, have been givenrevised measurement dates as a result of theIndependent Directors’ review. The IndependentDirectors’ review found that a grant to Mr. Lamelof 75,000 options on August 13, 2002 at the priceof $12.13 was not supported by contemporaneousdocumentary evidence. Because the grant was dis-closed in the Company’s proxy statement filed onOctober 15, 2002, Mr. Lamel’s grant has beenassigned a revised measurement date of October 15,2002 at the price of $14.80. Mr. Lamel alsoreceived a grant of 100,000 shares priced at $11.84per share on February 4, 2003, which was the clos-ing price of the Company’s stock on February 3,2003. Because Mr. Lamel’s grant was approved onFebruary 4, 2003 that grant has been remeasuredusing the closing price at that date, which was$12.39.
Grants to Outside Directors
For most of the Company’s history stock optionawards were the only compensation provided tooutside directors, apart from expense reimburse-ment. The directors’ plans provided for automaticgrants to outside directors on their date of first elec-tion to the Board and on the date of the annual
F-34
shareholder meeting, and also authorized the Boardto make additional discretionary grants. The ChiefExecutive Officer appears to have been of the viewthat he had the authority to make discretionarygrants to directors himself, but the IndependentDirectors’ review found no documentary evidence ofsuch authority having been delegated to him by theBoard. Accordingly, discretionary grants to outsidedirectors have been measured on the date of appro-val of the grant by the Board of Directors, or on thedate of the earliest other documentary evidence thatthe grant was fixed and final. Because under boththe 1996 Directors Plan and the 2000 DirectorsPlan newly elected and re-elected directors wereentitled to an automatic grant of options to pur-chase a certain numbers of shares on the date of theAnnual Meeting of Shareholders, the number ofnon-discretionary shares provided under the Planswas considered by management to have beenappropriately dated and priced on the date of theannual meeting even if the option documents wereactually issued at a later date.
The Independent Directors’ review found that eachof the Company’s outside directors received a grantof 15,000 options dated February 12, 2002, whichwas a quarterly low in the price of the Company’sstock. Board minutes for a meeting held on April 2,2002 stated that the Board had approved grants of15,000 options to each non-employee director “asof February 12, 2002.” Because the April 2002minutes of the Board of Directors accuratelyreflected the date of the option granting activity, theIndependent Directors’ review concluded that therewas no intent to mislead on the part of the recipientdirectors. Those option grants have been remeas-ured to April 2, 2002.
Two outside directors received grants of 10,000options dated August 13, 2002, which was anannual low in the Company’s stock price. Althoughthe Independent Directors’ review found evidencethat the Chief Executive Officer may have consid-ered a grant to at least one of those directors on thatdate, and that the Chief Executive Officer was of theview that he could make such discretionary grantson his own authority, the Independent Directorsconcluded that the Chief Executive Officer was notso authorized. Accordingly, those two discretionarygrants to directors have been remeasured toOctober 8, 2002, when the grants were consideredand approved by the full Board.
All of the Company’s outside directors receivedoption grants dated February 26, 2004, which wasthe date of the first Board meeting in which fournew directors participated. The Independent Direc-tors’ review found that 7,500 of the options grantedto the already-appointed directors on that dateshould have been granted automatically under the2000 Directors Stock Option Plan on the date of theprevious annual shareholders meeting, December 4,2003. The Independent Directors’ review furtherfound that grants of 15,000 options to each of thefour new directors should have been automaticupon their appointment to the Board in a telephonicmeeting on January 30, 2004. Accordingly, the por-tion of each grant that should have been final at anearlier date, either December 4, 2003 or January 30,2004, has been accounted for with variable account-ing beginning on February 26, 2004, reflectingmanagement’s view that those portions of the grantswere effectively repriced on that date. The remain-ing portions of those grants have not been remeas-ured.
In addition, four other stock option grants to thedirectors were assigned revised measurement dates,resulting in a total additional compensation expenseof approximately $94,000. A grant datedDecember 5, 1995 was assigned a revised measure-ment date without accounting consequence, becausethe grant was conditioned on shareholder approvalof the 1996 directors’ plan during the annual meet-ing in 1996 and on the date of approval the price ofthe Company’s stock was lower than the grantprice. Grants to the directors dated December 5,2000 and December 11, 2001 were assigned revisedmeasurement dates without accounting con-sequence, because part of each grant was an auto-matic annual grant to which the directors wereentitled upon their re-election at the annual share-holders meeting, under the 1996 and 2000 direc-tors’ plans, and the remainder was a discretionarygrant for which direct contemporaneous doc-umentation of finalization could not be located. Theshare prices on the revised measurement dates forthese grants were lower than the grant prices andaccordingly have no accounting consequence. Last-ly, the independent directors found that a stockoption grant to the directors dated April 12, 2005was a repricing of the automatic annual grant towhich the directors had been entitled on theirre-election at the annual shareholders meeting inDecember of 2004. This last grant resulted in a
F-35
variable accounting charge of approximately$94,000 in the fourth quarter of fiscal year 2005.
Revision of Measurement Dates as a Result of theReview
As a result of the deficiencies, the Independent Direc-tors recommended, among other things, that theCompany revise the accounting measurement datesfor 48 dates (from among the 125 dates on whichoptions grants were made in the Company’s history)where the market price of the Company’s stock onthe revised dates was higher than on the measure-ment dates previously used by the Company. Anumber of these revised measurement datesimpacted stock option grants made to senior man-agement and directors of the Company. Todetermine the revised measurement dates for theseoptions, we applied the guidance in AccountingPrinciples Board (“APB”) Opinion No. 25,“Accounting for Stock Issued to Employees,” whichdeems the measurement date as the first date onwhich all of the following are known: (1) theindividual employee who is entitled to receive theoption grant; (2) the number of options that anindividual employee is entitled to receive; and(3) the option’s exercise price. In addition, themeasurement date cannot be earlier than the date onwhich the grant is approved. We applied judgmentin determining whether to revise measurement datesfor prior option grants. In addition, if wedetermined that a measurement date needed to berevised, judgment was applied in determining theappropriate revised measurement date. In instanceswhere we determined we could not rely on theoriginal grant date for an option, we determinedrevised measurement dates based on our ability toestablish or confirm, in our reasonable judgment,whether through other documentation or crediblecircumstantial information, that all requirements forthe proper granting of the option had been satisfiedunder applicable accounting principles.
The Company previously accounted for its stockoption grants as fixed grants under APB OpinionNo. 25 and its related Interpretations, using ameasurement date of the recorded grant date,through its fiscal year ended June 30, 2005, after
which the Company adopted SFAS No. 123(R). Forall grants issued with an exercise price equal to thefair market value of our common stock on therecorded grant date or closing price on the day pre-ceeding when the grant was approved,2 we origi-nally recorded no stock-based compensationexpense and provided the required pro forma dis-closures under SFAS No. 123, “Accounting forStock-Based Compensation.” Under APB OpinionNo. 25, a non-cash, stock-based compensationexpense was required to be recognized for anyoption for which the exercise price was below thefair market value on the actual grant date. Thisexpense should have been amortized over the vest-ing period of the option. We also determined thatvariable accounting treatment was required underAPB Opinion No. 25 for certain stock option grantsfor which evidence indicated that the originalexercise price of the option was subsequently modi-fied. The application of variable accounting to stockoption grants requires the remeasurement of theintrinsic value of the options be reported ascompensation expense in the consolidated state-ments of income at the end of each reporting perioduntil the options are exercised, canceled or expire.
The Company has determined that, based on therevised measurement dates, the pre-tax, non-cashcharges for stock-based compensation expenseaggregated $20.5 million (before the reversal of the2005 stock option vesting acceleration charge of$3.6 million) over the approximate twelve-year fis-cal period from 1994 through 2005.
The Company also evaluated the impact of therestatement on its income tax provisions. In theUnited States the Company is able to claim a taxdeduction relative to certain exercised stock options.As a result, the Company has recorded a deferredtax asset, totaling $2.6 million at June 30, 2007, toreflect future tax deductions to the extent theCompany believes such deferred tax assets to berecoverable.
2 As noted above, the Independent Directors found that the Company’s practice on pricing of option grants was inconsistent – at times theCompany used the closing price of the Company’s stock the day before approval, and at other times the closing price on the day ofapproval. In its restatement the Company has adjusted options pricing to uniformly use the closing price on the day of the approval of theoptions as the preferable pricing method.
F-36
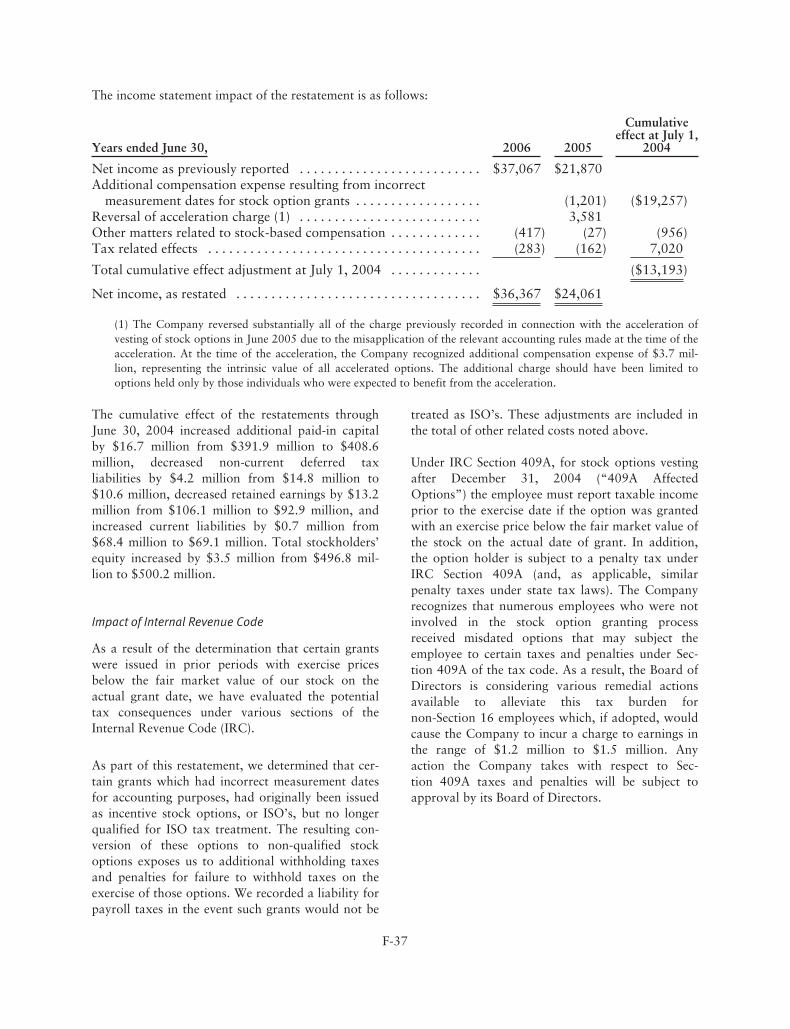
The income statement impact of the restatement is as follows:
Years ended June 30, 2006 2005
Cumulativeeffect at July 1,
2004
Net income as previously reported . . . . . . . . . . . . . . . . . . . . . . . . . . $37,067 $21,870Additional compensation expense resulting from incorrect
measurement dates for stock option grants . . . . . . . . . . . . . . . . . . (1,201) ($19,257)Reversal of acceleration charge (1) . . . . . . . . . . . . . . . . . . . . . . . . . . 3,581Other matters related to stock-based compensation . . . . . . . . . . . . . (417) (27) (956)Tax related effects . . . . . . . . . . . . . . . . . . . . . . . . . . . . . . . . . . . . . . . (283) (162) 7,020
Total cumulative effect adjustment at July 1, 2004 . . . . . . . . . . . . . ($13,193)
Net income, as restated . . . . . . . . . . . . . . . . . . . . . . . . . . . . . . . . . . . $36,367 $24,061
(1) The Company reversed substantially all of the charge previously recorded in connection with the acceleration ofvesting of stock options in June 2005 due to the misapplication of the relevant accounting rules made at the time of theacceleration. At the time of the acceleration, the Company recognized additional compensation expense of $3.7 mil-lion, representing the intrinsic value of all accelerated options. The additional charge should have been limited tooptions held only by those individuals who were expected to benefit from the acceleration.
The cumulative effect of the restatements throughJune 30, 2004 increased additional paid-in capitalby $16.7 million from $391.9 million to $408.6million, decreased non-current deferred taxliabilities by $4.2 million from $14.8 million to$10.6 million, decreased retained earnings by $13.2million from $106.1 million to $92.9 million, andincreased current liabilities by $0.7 million from$68.4 million to $69.1 million. Total stockholders’equity increased by $3.5 million from $496.8 mil-lion to $500.2 million.
Impact of Internal Revenue Code
As a result of the determination that certain grantswere issued in prior periods with exercise pricesbelow the fair market value of our stock on theactual grant date, we have evaluated the potentialtax consequences under various sections of theInternal Revenue Code (IRC).
As part of this restatement, we determined that cer-tain grants which had incorrect measurement datesfor accounting purposes, had originally been issuedas incentive stock options, or ISO’s, but no longerqualified for ISO tax treatment. The resulting con-version of these options to non-qualified stockoptions exposes us to additional withholding taxesand penalties for failure to withhold taxes on theexercise of those options. We recorded a liability forpayroll taxes in the event such grants would not be
treated as ISO’s. These adjustments are included inthe total of other related costs noted above.
Under IRC Section 409A, for stock options vestingafter December 31, 2004 (“409A AffectedOptions”) the employee must report taxable incomeprior to the exercise date if the option was grantedwith an exercise price below the fair market value ofthe stock on the actual date of grant. In addition,the option holder is subject to a penalty tax underIRC Section 409A (and, as applicable, similarpenalty taxes under state tax laws). The Companyrecognizes that numerous employees who were notinvolved in the stock option granting processreceived misdated options that may subject theemployee to certain taxes and penalties under Sec-tion 409A of the tax code. As a result, the Board ofDirectors is considering various remedial actionsavailable to alleviate this tax burden fornon-Section 16 employees which, if adopted, wouldcause the Company to incur a charge to earnings inthe range of $1.2 million to $1.5 million. Anyaction the Company takes with respect to Sec-tion 409A taxes and penalties will be subject toapproval by its Board of Directors.
F-37
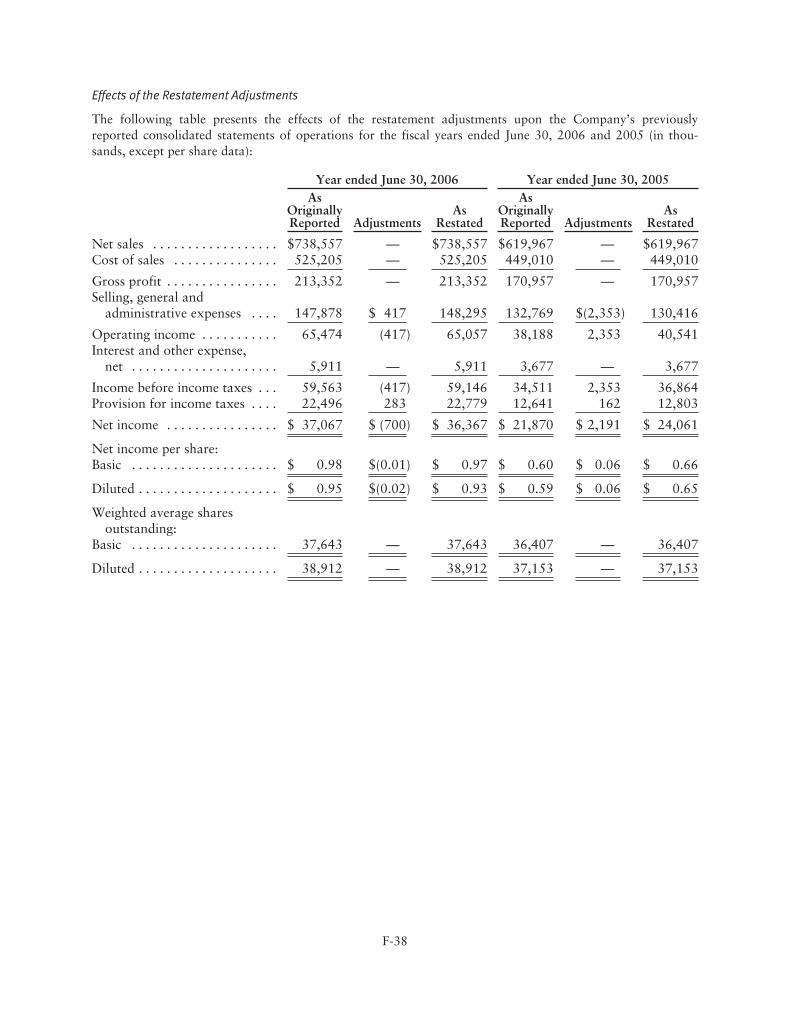
Effects of the Restatement Adjustments
The following table presents the effects of the restatement adjustments upon the Company’s previouslyreported consolidated statements of operations for the fiscal years ended June 30, 2006 and 2005 (in thou-sands, except per share data):
Year ended June 30, 2006 Year ended June 30, 2005As
OriginallyReported Adjustments
AsRestated
AsOriginallyReported Adjustments
AsRestated
Net sales . . . . . . . . . . . . . . . . . . $738,557 — $738,557 $619,967 — $619,967Cost of sales . . . . . . . . . . . . . . . 525,205 — 525,205 449,010 — 449,010
Gross profit . . . . . . . . . . . . . . . . 213,352 — 213,352 170,957 — 170,957Selling, general and
administrative expenses . . . . 147,878 $ 417 148,295 132,769 $(2,353) 130,416
Operating income . . . . . . . . . . . 65,474 (417) 65,057 38,188 2,353 40,541Interest and other expense,
net . . . . . . . . . . . . . . . . . . . . . 5,911 — 5,911 3,677 — 3,677
Income before income taxes . . . 59,563 (417) 59,146 34,511 2,353 36,864Provision for income taxes . . . . 22,496 283 22,779 12,641 162 12,803
Net income . . . . . . . . . . . . . . . . $ 37,067 $ (700) $ 36,367 $ 21,870 $ 2,191 $ 24,061
Net income per share:Basic . . . . . . . . . . . . . . . . . . . . . $ 0.98 $(0.01) $ 0.97 $ 0.60 $ 0.06 $ 0.66
Diluted . . . . . . . . . . . . . . . . . . . . $ 0.95 $(0.02) $ 0.93 $ 0.59 $ 0.06 $ 0.65
Weighted average sharesoutstanding:
Basic . . . . . . . . . . . . . . . . . . . . . 37,643 — 37,643 36,407 — 36,407
Diluted . . . . . . . . . . . . . . . . . . . . 38,912 — 38,912 37,153 — 37,153
F-38
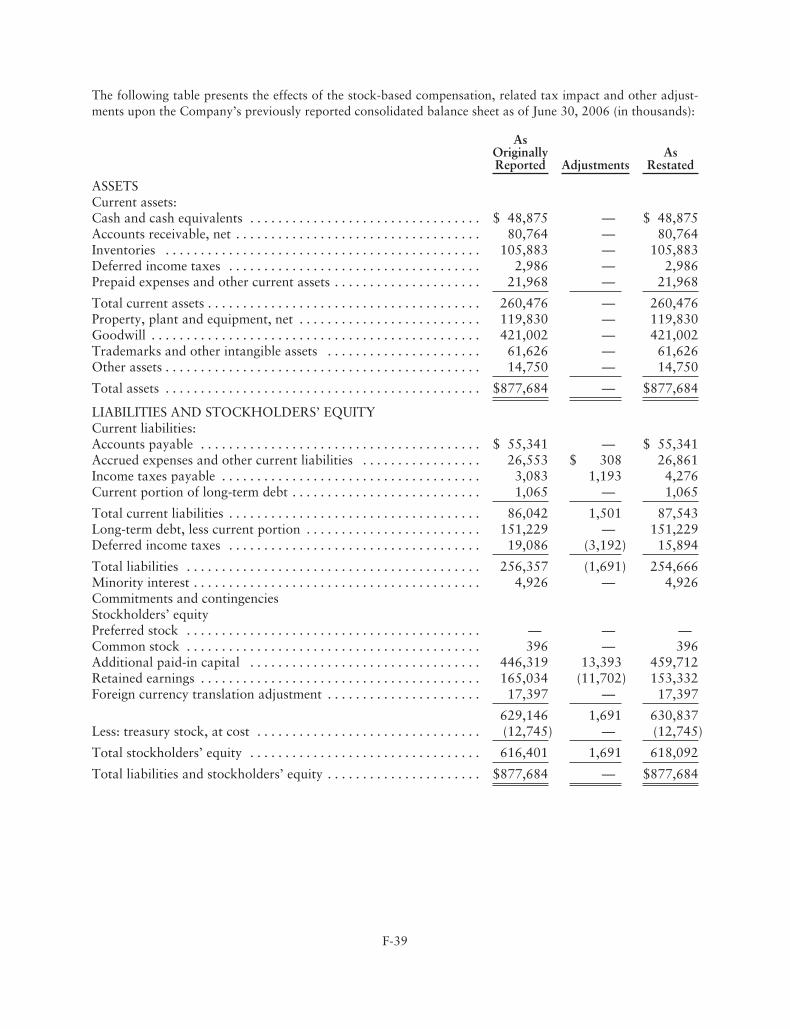
The following table presents the effects of the stock-based compensation, related tax impact and other adjust-ments upon the Company’s previously reported consolidated balance sheet as of June 30, 2006 (in thousands):
AsOriginallyReported Adjustments
AsRestated
ASSETSCurrent assets:Cash and cash equivalents . . . . . . . . . . . . . . . . . . . . . . . . . . . . . . . . . $ 48,875 — $ 48,875Accounts receivable, net . . . . . . . . . . . . . . . . . . . . . . . . . . . . . . . . . . . 80,764 — 80,764Inventories . . . . . . . . . . . . . . . . . . . . . . . . . . . . . . . . . . . . . . . . . . . . . 105,883 — 105,883Deferred income taxes . . . . . . . . . . . . . . . . . . . . . . . . . . . . . . . . . . . . 2,986 — 2,986Prepaid expenses and other current assets . . . . . . . . . . . . . . . . . . . . . 21,968 — 21,968
Total current assets . . . . . . . . . . . . . . . . . . . . . . . . . . . . . . . . . . . . . . . 260,476 — 260,476Property, plant and equipment, net . . . . . . . . . . . . . . . . . . . . . . . . . . 119,830 — 119,830Goodwill . . . . . . . . . . . . . . . . . . . . . . . . . . . . . . . . . . . . . . . . . . . . . . . 421,002 — 421,002Trademarks and other intangible assets . . . . . . . . . . . . . . . . . . . . . . 61,626 — 61,626Other assets . . . . . . . . . . . . . . . . . . . . . . . . . . . . . . . . . . . . . . . . . . . . . 14,750 — 14,750
Total assets . . . . . . . . . . . . . . . . . . . . . . . . . . . . . . . . . . . . . . . . . . . . . $877,684 — $877,684
LIABILITIES AND STOCKHOLDERS’ EQUITYCurrent liabilities:Accounts payable . . . . . . . . . . . . . . . . . . . . . . . . . . . . . . . . . . . . . . . . $ 55,341 — $ 55,341Accrued expenses and other current liabilities . . . . . . . . . . . . . . . . . 26,553 $ 308 26,861Income taxes payable . . . . . . . . . . . . . . . . . . . . . . . . . . . . . . . . . . . . . 3,083 1,193 4,276Current portion of long-term debt . . . . . . . . . . . . . . . . . . . . . . . . . . . 1,065 — 1,065
Total current liabilities . . . . . . . . . . . . . . . . . . . . . . . . . . . . . . . . . . . . 86,042 1,501 87,543Long-term debt, less current portion . . . . . . . . . . . . . . . . . . . . . . . . . 151,229 — 151,229Deferred income taxes . . . . . . . . . . . . . . . . . . . . . . . . . . . . . . . . . . . . 19,086 (3,192) 15,894
Total liabilities . . . . . . . . . . . . . . . . . . . . . . . . . . . . . . . . . . . . . . . . . . 256,357 (1,691) 254,666Minority interest . . . . . . . . . . . . . . . . . . . . . . . . . . . . . . . . . . . . . . . . . 4,926 — 4,926Commitments and contingenciesStockholders’ equityPreferred stock . . . . . . . . . . . . . . . . . . . . . . . . . . . . . . . . . . . . . . . . . . — — —Common stock . . . . . . . . . . . . . . . . . . . . . . . . . . . . . . . . . . . . . . . . . . 396 — 396Additional paid-in capital . . . . . . . . . . . . . . . . . . . . . . . . . . . . . . . . . 446,319 13,393 459,712Retained earnings . . . . . . . . . . . . . . . . . . . . . . . . . . . . . . . . . . . . . . . . 165,034 (11,702) 153,332Foreign currency translation adjustment . . . . . . . . . . . . . . . . . . . . . . 17,397 — 17,397
629,146 1,691 630,837Less: treasury stock, at cost . . . . . . . . . . . . . . . . . . . . . . . . . . . . . . . . (12,745) — (12,745)
Total stockholders’ equity . . . . . . . . . . . . . . . . . . . . . . . . . . . . . . . . . 616,401 1,691 618,092
Total liabilities and stockholders’ equity . . . . . . . . . . . . . . . . . . . . . . $877,684 — $877,684
F-39
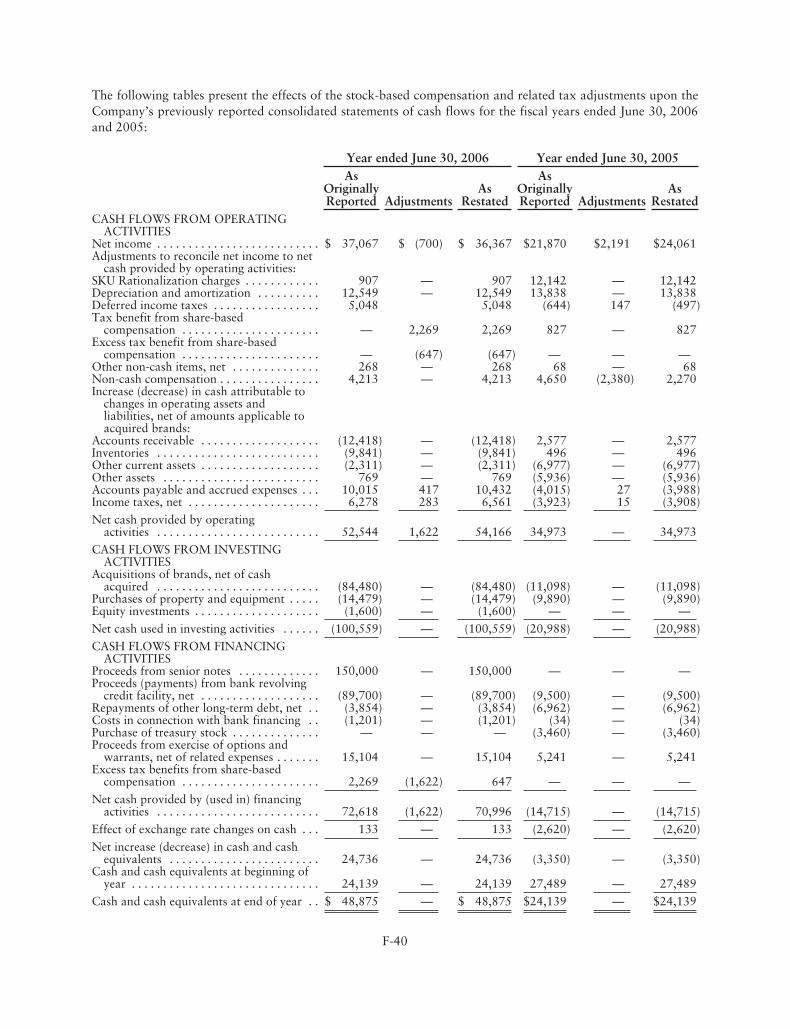
The following tables present the effects of the stock-based compensation and related tax adjustments upon theCompany’s previously reported consolidated statements of cash flows for the fiscal years ended June 30, 2006and 2005:
Year ended June 30, 2006 Year ended June 30, 2005As
OriginallyReported Adjustments
AsRestated
AsOriginallyReported Adjustments
AsRestated
CASH FLOWS FROM OPERATINGACTIVITIES
Net income . . . . . . . . . . . . . . . . . . . . . . . . . . $ 37,067 $ (700) $ 36,367 $21,870 $2,191 $24,061Adjustments to reconcile net income to net
cash provided by operating activities:SKU Rationalization charges . . . . . . . . . . . . 907 — 907 12,142 — 12,142Depreciation and amortization . . . . . . . . . . 12,549 — 12,549 13,838 — 13,838Deferred income taxes . . . . . . . . . . . . . . . . . 5,048 5,048 (644) 147 (497)Tax benefit from share-based
compensation . . . . . . . . . . . . . . . . . . . . . . — 2,269 2,269 827 — 827Excess tax benefit from share-based
compensation . . . . . . . . . . . . . . . . . . . . . . — (647) (647) — — —Other non-cash items, net . . . . . . . . . . . . . . 268 — 268 68 — 68Non-cash compensation . . . . . . . . . . . . . . . . 4,213 — 4,213 4,650 (2,380) 2,270Increase (decrease) in cash attributable to
changes in operating assets andliabilities, net of amounts applicable toacquired brands:
Accounts receivable . . . . . . . . . . . . . . . . . . . (12,418) — (12,418) 2,577 — 2,577Inventories . . . . . . . . . . . . . . . . . . . . . . . . . . (9,841) — (9,841) 496 — 496Other current assets . . . . . . . . . . . . . . . . . . . (2,311) — (2,311) (6,977) — (6,977)Other assets . . . . . . . . . . . . . . . . . . . . . . . . . 769 — 769 (5,936) — (5,936)Accounts payable and accrued expenses . . . 10,015 417 10,432 (4,015) 27 (3,988)Income taxes, net . . . . . . . . . . . . . . . . . . . . . 6,278 283 6,561 (3,923) 15 (3,908)
Net cash provided by operatingactivities . . . . . . . . . . . . . . . . . . . . . . . . . . 52,544 1,622 54,166 34,973 — 34,973
CASH FLOWS FROM INVESTINGACTIVITIES
Acquisitions of brands, net of cashacquired . . . . . . . . . . . . . . . . . . . . . . . . . . (84,480) — (84,480) (11,098) — (11,098)
Purchases of property and equipment . . . . . (14,479) — (14,479) (9,890) — (9,890)Equity investments . . . . . . . . . . . . . . . . . . . . (1,600) — (1,600) — — —
Net cash used in investing activities . . . . . . (100,559) — (100,559) (20,988) — (20,988)
CASH FLOWS FROM FINANCINGACTIVITIES
Proceeds from senior notes . . . . . . . . . . . . . 150,000 — 150,000 — — —Proceeds (payments) from bank revolving
credit facility, net . . . . . . . . . . . . . . . . . . . (89,700) — (89,700) (9,500) — (9,500)Repayments of other long-term debt, net . . (3,854) — (3,854) (6,962) — (6,962)Costs in connection with bank financing . . (1,201) — (1,201) (34) — (34)Purchase of treasury stock . . . . . . . . . . . . . . — — — (3,460) — (3,460)Proceeds from exercise of options and
warrants, net of related expenses . . . . . . . 15,104 — 15,104 5,241 — 5,241Excess tax benefits from share-based
compensation . . . . . . . . . . . . . . . . . . . . . . 2,269 (1,622) 647 — — —
Net cash provided by (used in) financingactivities . . . . . . . . . . . . . . . . . . . . . . . . . . 72,618 (1,622) 70,996 (14,715) — (14,715)
Effect of exchange rate changes on cash . . . 133 — 133 (2,620) — (2,620)
Net increase (decrease) in cash and cashequivalents . . . . . . . . . . . . . . . . . . . . . . . . 24,736 — 24,736 (3,350) — (3,350)
Cash and cash equivalents at beginning ofyear . . . . . . . . . . . . . . . . . . . . . . . . . . . . . . 24,139 — 24,139 27,489 — 27,489
Cash and cash equivalents at end of year . . $ 48,875 — $ 48,875 $24,139 — $24,139
F-40
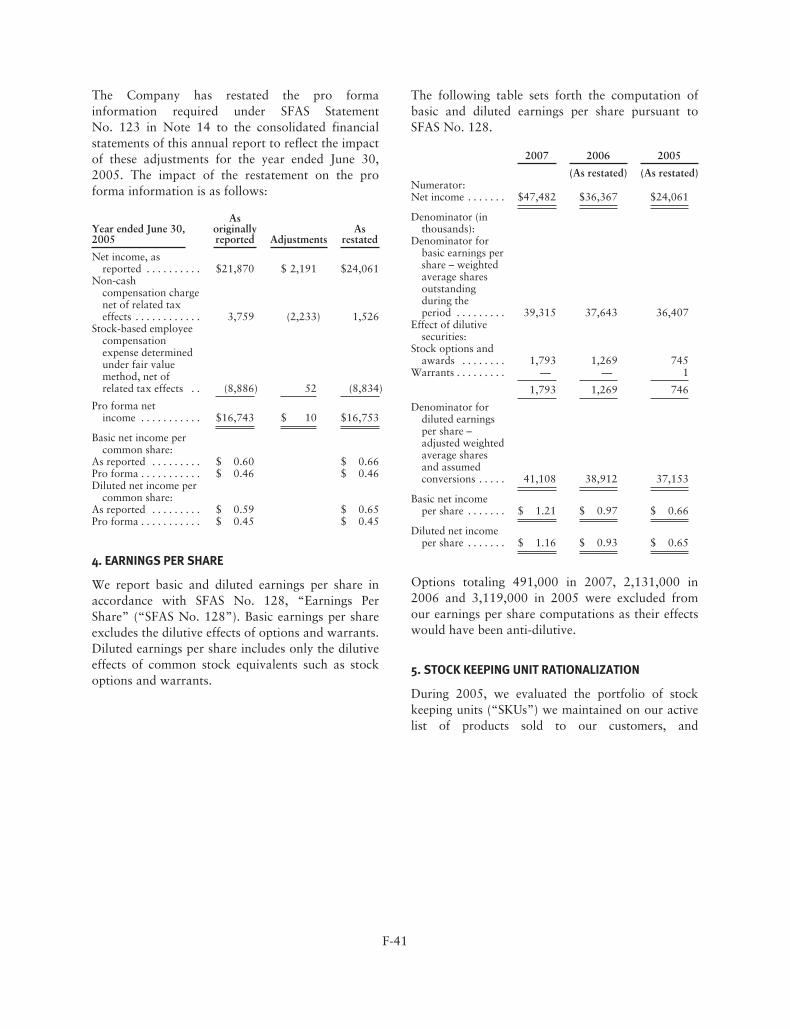
The Company has restated the pro formainformation required under SFAS StatementNo. 123 in Note 14 to the consolidated financialstatements of this annual report to reflect the impactof these adjustments for the year ended June 30,2005. The impact of the restatement on the proforma information is as follows:
Year ended June 30,2005
Asoriginallyreported Adjustments
Asrestated
Net income, asreported . . . . . . . . . . $21,870 $ 2,191 $24,061
Non-cashcompensation chargenet of related taxeffects . . . . . . . . . . . . 3,759 (2,233) 1,526
Stock-based employeecompensationexpense determinedunder fair valuemethod, net ofrelated tax effects . . (8,886) 52 (8,834)
Pro forma netincome . . . . . . . . . . . $16,743 $ 10 $16,753
Basic net income percommon share:
As reported . . . . . . . . . $ 0.60 $ 0.66Pro forma . . . . . . . . . . . $ 0.46 $ 0.46Diluted net income per
common share:As reported . . . . . . . . . $ 0.59 $ 0.65Pro forma . . . . . . . . . . . $ 0.45 $ 0.45
4. EARNINGS PER SHARE
We report basic and diluted earnings per share inaccordance with SFAS No. 128, “Earnings PerShare” (“SFAS No. 128”). Basic earnings per shareexcludes the dilutive effects of options and warrants.Diluted earnings per share includes only the dilutiveeffects of common stock equivalents such as stockoptions and warrants.
The following table sets forth the computation ofbasic and diluted earnings per share pursuant toSFAS No. 128.
2007 2006 2005
(As restated) (As restated)Numerator:Net income . . . . . . . $47,482 $36,367 $24,061
Denominator (inthousands):
Denominator forbasic earnings pershare – weightedaverage sharesoutstandingduring theperiod . . . . . . . . . 39,315 37,643 36,407
Effect of dilutivesecurities:
Stock options andawards . . . . . . . . 1,793 1,269 745
Warrants . . . . . . . . . — — 1
1,793 1,269 746
Denominator fordiluted earningsper share –adjusted weightedaverage sharesand assumedconversions . . . . . 41,108 38,912 37,153
Basic net incomeper share . . . . . . . $ 1.21 $ 0.97 $ 0.66
Diluted net incomeper share . . . . . . . $ 1.16 $ 0.93 $ 0.65
Options totaling 491,000 in 2007, 2,131,000 in2006 and 3,119,000 in 2005 were excluded fromour earnings per share computations as their effectswould have been anti-dilutive.
5. STOCK KEEPING UNIT RATIONALIZATION
During 2005, we evaluated the portfolio of stockkeeping units (“SKUs”) we maintained on our activelist of products sold to our customers, and
F-41
determined that there were numerous under-performing SKUs that should be eliminated based ontheir low volume of sales or insufficient margins dueto disproportionate manufacturing and other costs.As a result, cost of sales for 2005 includes a chargefor approximately $9.0 million of ingredient and fin-ished goods inventories, including the costs of dis-posal, for SKUs eliminated, and selling, general andadministrative expenses includes a charge for approx-imately $3.1 million for the write-off of deferredpackaging design and other costs related to theseSKUs. While the SKU rationalization impacted prod-ucts across virtually all of our brands, approximately20% of the charges were related to the dis-continuance of our CarbFit line of low-carbohydrateproducts. The SKU rationalization program wascompleted in June 2006, at which time a furthercharge to cost of sales was required amounting to$0.9 million.
6. ACQUISITIONS AND DISPOSAL
We account for acquisitions using the purchasemethod of accounting, and accordingly, the resultsof operations for each acquisition have beenincluded in our consolidated results from theirrespective acquisition dates.
Fiscal 2007
On June 8, 2007, we acquired the tofu and meat-alternative business of WhiteWave Foods Company,a subsidiary of Dean Foods Company. The productline includes baked and grilled tofu, seitan, tempehand other traditional tofu items which are soldunder the TofuTown® and WhiteWave® (under a12-month license) brand names. The acquisitioncomplements our existing Yves Veggie Cuisine®
product line, strengthening and expanding ourfresh, meat-free alternative product offerings. Thetotal consideration paid was approximately $2.1million, including transaction costs.
On January 11, 2007, we acquired Avalon NaturalProducts, Inc. (“Avalon”), a leader in the naturalproducts category in the areas of skin care, haircare, bath and body and sun care, for approx-imately $126.1 million in cash, including trans-action costs. We believe that the addition of theAvalon Organics®, Alba Botanica® and AlbaOrganics™ brands provides us with a stronger,broader product portfolio in the natural and organic
personal care products category. The acquisitionwas funded with available cash balances and bor-rowings under our Credit Facility (see Note 11).The Company is in the process of allocating thepurchase price and obtaining a valuation foracquired intangible assets. Based on our preliminarypurchase price allocation, we recorded goodwill(which is not deductible for tax purposes) of $119.4million at June 30, 2007 in connection with thisacquisition. Management is currently developingintegration plans which may result in additionalcosts which will be accrued as a liability in con-junction with recording the purchase of Avalon andwhich will result in an increase to goodwill. Thefollowing table summarizes the preliminary alloca-tion of the purchase price to the fair values of theassets acquired and liabilities assumed of Avalon asof the date of acquisition:
Current assets . . . . . . . . . . . . . . . . . . . . . $ 15,377Property and equipment . . . . . . . . . . . . . 471Goodwill . . . . . . . . . . . . . . . . . . . . . . . . . 119,438Other assets . . . . . . . . . . . . . . . . . . . . . . . 412
Total assets . . . . . . . . . . . . . . . . . . . . . . . 135,698Current liabilities . . . . . . . . . . . . . . . . . . (9,555)
Total preliminary purchase priceallocation . . . . . . . . . . . . . . . . . . . . . . . $126,143
On December 8, 2006, we acquired the businessand certain assets of Haldane Foods Limited, aUnited Kingdom-based producer of meat-free foodand non-dairy beverage products. Haldane’s prod-uct lines include Realeat® frozen foods; Granose®,Direct Foods and Realeat® dry mixes; and Granose®
non-dairy beverages. The Haldane frozen meat-freebusiness is a complementary fit with the LindaMcCartney® brand, acquired last fiscal year. Thetotal consideration paid was approximately $10.1million, including transaction costs. As a result ofthe initial purchase price allocation, we recordedgoodwill of $2.5 million (which is deductible for taxpurposes) at June 30, 2007 in connection with thisacquisition. In conjunction with the acquisition ofthe Haldane business and during 2007, the Com-pany identified opportunities to integrate the frozenmeat-free foods business into its existing Fakenham,United Kingdom facility. Subsequent to the acquis-ition, the Company approved integration actionsrelating to the acquired business in the amount of$1.1 million, which were recorded as costs of the
F-42
acquisition. These actions principally reflect sev-erance costs associated with production and admin-istrative functions of the acquired business as wellas the cost of lease and other contractual obligationsfor which no future benefit will be realized. Duringfiscal 2007, we utilized $0.2 million of this reserve.The purchase of the Haldane business did not havea material impact on our consolidated financialposition or results of operations.
The purchase price allocations for these acquisitionsare preliminary and may be revised as additionalinformation becomes available. Any change in thefair value of the net assets acquired will change theamount of the purchase price allocable to goodwill.The balance sheet at June 30, 2007 includes theassets acquired and liabilities assumed valued on apreliminary basis at fair market value at the dates ofpurchase. We are in the process of performing theprocedures required to finalize the purchase priceallocation for the above fiscal 2007 acquisitions;however, these procedures are in the early stagesand are expected to be completed during fiscal2008. Any required adjustments to the preliminarypurchase price will be recorded in the period final-ized.
On August 31, 2006, we completed the sale ofBiomarché, our Belgium-based provider of freshorganic fruits and vegetables, to Pro Natura, aFrench company specializing in the distribution oforganic produce. Biomarché generated approx-imately $18.0 million in sales for the fiscal yearended June 30, 2006. Total consideration receivedwas €6.5 million (approximately $8.3 million). Wealso earned a contingent additional payment ofapproximately €0.7 million ($0.9 million) based onsales achieved for the year ended June 30, 2007. Werecognized a pretax gain of $3.4 million, net of a$3.3 million charge for allocated goodwill ($1.2million after tax) in connection with the sale, whichis included in “Interest and other expenses, net” inthe accompanying consolidated statement ofincome. The results of operations and cash flows forBiomarché for the two months ended August 31,2006, which were not material, are included in theconsolidated statements of income and of cashflows, respectively.
Fiscal 2006
On June 12, 2006, we acquired the Linda McCart-ney® brand (under license) of frozen meat-free busi-
ness from the H.J. Heinz Company, including itsmanufacturing facility based in Fakenham, England.A leader in the meat-free category with its range ofsausages, ready meals, and pastry products, theLinda McCartney brand is recognized for its vegeta-rian credentials while providing healthy and tastymeal solutions. Total consideration paid wasapproximately $6.6 million including transactioncosts. We utilized independent valuation firms toassist in estimating the fair value of the acquiredfixed and identifiable intangible assets. No goodwillresulted from this transaction since assets acquiredexceeded consideration paid. The excess of the netassets acquired over the purchase price of approx-imately $13.1 million was allocated as a reductionof fixed and intangible assets.
On April 30, 2006, we acquired the fresh preparedfoods business based in Luton, England, from theH.J. Heinz Company. Total consideration paid wasapproximately $2.7 million including transactioncosts. We utilized independent valuation firms toassist in estimating the fair value of the acquiredfixed and identifiable intangible assets. No goodwillresulted from this transaction since assets acquiredexceeded consideration paid. The excess of netassets acquired over the purchase price of approx-imately $8.5 million was allocated as a reduction offixed and intangible assets.
On March 3, 2006, we acquired the business andassets of Para Laboratories, Inc., including theQueen Helene®, Batherapy®, Shower Therapy® andFootherapy® brands of skin care, hair care, andbody care products, which are sold through drugstores, supermarkets and mass retailers. The totalconsideration paid was approximately $25.1 millionin cash, $2.5 million in stock, plus the assumptionof certain liabilities. The purchase price excludescontingency payments we may be obligated to pay.The contingency payments are based on theachievement by the acquired business of certainfinancial targets over an approximate two-yearperiod following the date of acquisition. Suchpayments, which could total $3.0 million, will becharged to goodwill if and when paid. No suchcontingency payments have been made since theacquisition. The purchase price was allocated to thetangible and identifiable intangible assets acquiredand liabilities assumed based on their fair values atthe acquisition date. The Company has assigned
F-43
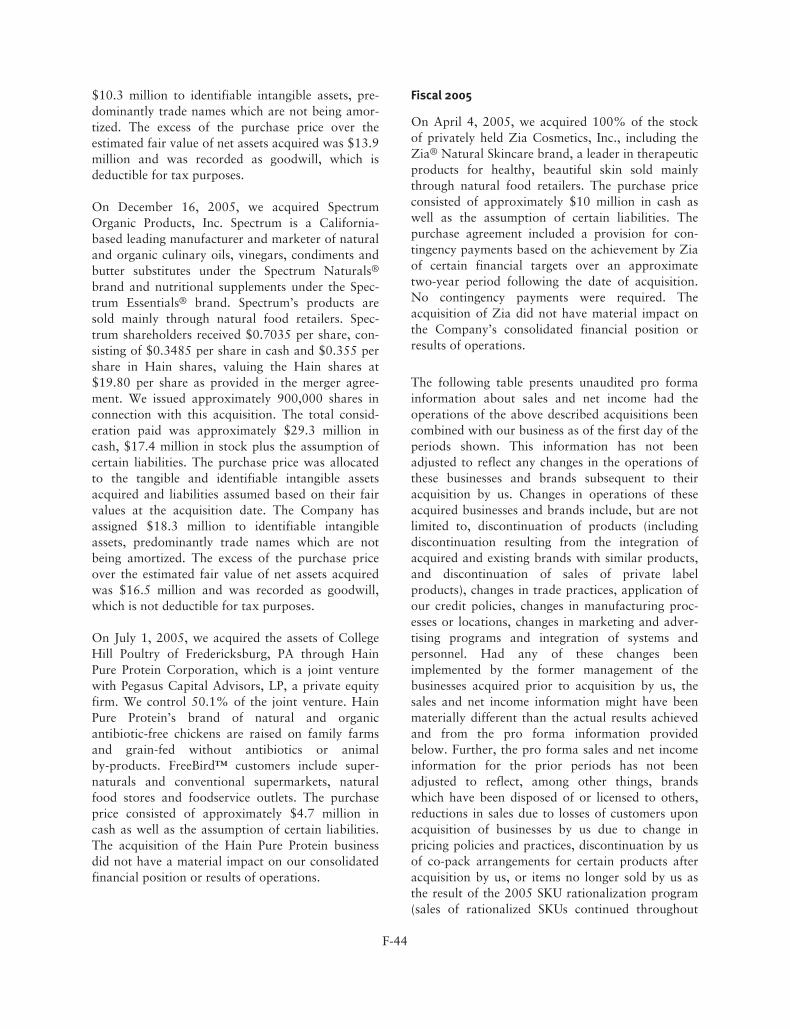
$10.3 million to identifiable intangible assets, pre-dominantly trade names which are not being amor-tized. The excess of the purchase price over theestimated fair value of net assets acquired was $13.9million and was recorded as goodwill, which isdeductible for tax purposes.
On December 16, 2005, we acquired SpectrumOrganic Products, Inc. Spectrum is a California-based leading manufacturer and marketer of naturaland organic culinary oils, vinegars, condiments andbutter substitutes under the Spectrum Naturals®
brand and nutritional supplements under the Spec-trum Essentials® brand. Spectrum’s products aresold mainly through natural food retailers. Spec-trum shareholders received $0.7035 per share, con-sisting of $0.3485 per share in cash and $0.355 pershare in Hain shares, valuing the Hain shares at$19.80 per share as provided in the merger agree-ment. We issued approximately 900,000 shares inconnection with this acquisition. The total consid-eration paid was approximately $29.3 million incash, $17.4 million in stock plus the assumption ofcertain liabilities. The purchase price was allocatedto the tangible and identifiable intangible assetsacquired and liabilities assumed based on their fairvalues at the acquisition date. The Company hasassigned $18.3 million to identifiable intangibleassets, predominantly trade names which are notbeing amortized. The excess of the purchase priceover the estimated fair value of net assets acquiredwas $16.5 million and was recorded as goodwill,which is not deductible for tax purposes.
On July 1, 2005, we acquired the assets of CollegeHill Poultry of Fredericksburg, PA through HainPure Protein Corporation, which is a joint venturewith Pegasus Capital Advisors, LP, a private equityfirm. We control 50.1% of the joint venture. HainPure Protein’s brand of natural and organicantibiotic-free chickens are raised on family farmsand grain-fed without antibiotics or animalby-products. FreeBird™ customers include super-naturals and conventional supermarkets, naturalfood stores and foodservice outlets. The purchaseprice consisted of approximately $4.7 million incash as well as the assumption of certain liabilities.The acquisition of the Hain Pure Protein businessdid not have a material impact on our consolidatedfinancial position or results of operations.
Fiscal 2005
On April 4, 2005, we acquired 100% of the stockof privately held Zia Cosmetics, Inc., including theZia® Natural Skincare brand, a leader in therapeuticproducts for healthy, beautiful skin sold mainlythrough natural food retailers. The purchase priceconsisted of approximately $10 million in cash aswell as the assumption of certain liabilities. Thepurchase agreement included a provision for con-tingency payments based on the achievement by Ziaof certain financial targets over an approximatetwo-year period following the date of acquisition.No contingency payments were required. Theacquisition of Zia did not have material impact onthe Company’s consolidated financial position orresults of operations.
The following table presents unaudited pro formainformation about sales and net income had theoperations of the above described acquisitions beencombined with our business as of the first day of theperiods shown. This information has not beenadjusted to reflect any changes in the operations ofthese businesses and brands subsequent to theiracquisition by us. Changes in operations of theseacquired businesses and brands include, but are notlimited to, discontinuation of products (includingdiscontinuation resulting from the integration ofacquired and existing brands with similar products,and discontinuation of sales of private labelproducts), changes in trade practices, application ofour credit policies, changes in manufacturing proc-esses or locations, changes in marketing and adver-tising programs and integration of systems andpersonnel. Had any of these changes beenimplemented by the former management of thebusinesses acquired prior to acquisition by us, thesales and net income information might have beenmaterially different than the actual results achievedand from the pro forma information providedbelow. Further, the pro forma sales and net incomeinformation for the prior periods has not beenadjusted to reflect, among other things, brandswhich have been disposed of or licensed to others,reductions in sales due to losses of customers uponacquisition of businesses by us due to change inpricing policies and practices, discontinuation by usof co-pack arrangements for certain products afteracquisition by us, or items no longer sold by us asthe result of the 2005 SKU rationalization program(sales of rationalized SKUs continued throughout
F-44
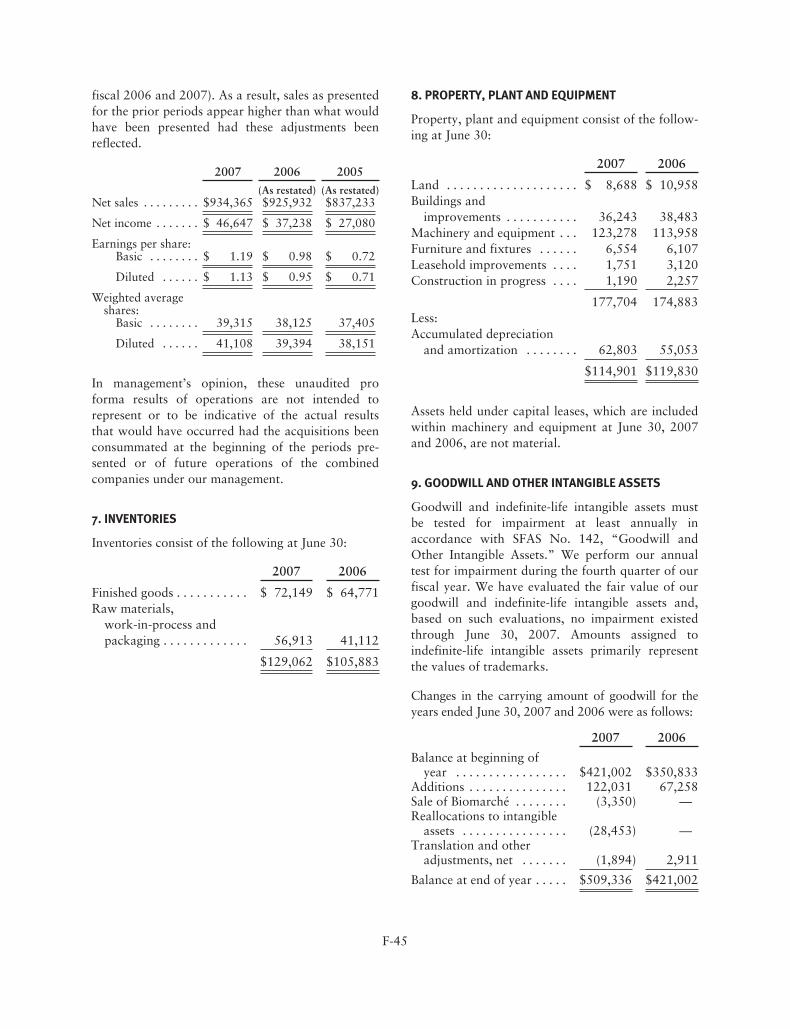
fiscal 2006 and 2007). As a result, sales as presentedfor the prior periods appear higher than what wouldhave been presented had these adjustments beenreflected.
2007 2006 2005
(As restated) (As restated)Net sales . . . . . . . . . $934,365 $925,932 $837,233
Net income . . . . . . . $ 46,647 $ 37,238 $ 27,080
Earnings per share:Basic . . . . . . . . $ 1.19 $ 0.98 $ 0.72
Diluted . . . . . . $ 1.13 $ 0.95 $ 0.71
Weighted averageshares:
Basic . . . . . . . . 39,315 38,125 37,405
Diluted . . . . . . 41,108 39,394 38,151
In management’s opinion, these unaudited proforma results of operations are not intended torepresent or to be indicative of the actual resultsthat would have occurred had the acquisitions beenconsummated at the beginning of the periods pre-sented or of future operations of the combinedcompanies under our management.
7. INVENTORIES
Inventories consist of the following at June 30:
2007 2006
Finished goods . . . . . . . . . . . $ 72,149 $ 64,771Raw materials,
work-in-process andpackaging . . . . . . . . . . . . . 56,913 41,112
$129,062 $105,883
8. PROPERTY, PLANT AND EQUIPMENT
Property, plant and equipment consist of the follow-ing at June 30:
2007 2006
Land . . . . . . . . . . . . . . . . . . . . $ 8,688 $ 10,958Buildings and
improvements . . . . . . . . . . . 36,243 38,483Machinery and equipment . . . 123,278 113,958Furniture and fixtures . . . . . . 6,554 6,107Leasehold improvements . . . . 1,751 3,120Construction in progress . . . . 1,190 2,257
177,704 174,883Less:Accumulated depreciation
and amortization . . . . . . . . 62,803 55,053
$114,901 $119,830
Assets held under capital leases, which are includedwithin machinery and equipment at June 30, 2007and 2006, are not material.
9. GOODWILL AND OTHER INTANGIBLE ASSETS
Goodwill and indefinite-life intangible assets mustbe tested for impairment at least annually inaccordance with SFAS No. 142, “Goodwill andOther Intangible Assets.” We perform our annualtest for impairment during the fourth quarter of ourfiscal year. We have evaluated the fair value of ourgoodwill and indefinite-life intangible assets and,based on such evaluations, no impairment existedthrough June 30, 2007. Amounts assigned toindefinite-life intangible assets primarily representthe values of trademarks.
Changes in the carrying amount of goodwill for theyears ended June 30, 2007 and 2006 were as follows:
2007 2006
Balance at beginning ofyear . . . . . . . . . . . . . . . . . $421,002 $350,833
Additions . . . . . . . . . . . . . . . 122,031 67,258Sale of Biomarché . . . . . . . . (3,350) —Reallocations to intangible
assets . . . . . . . . . . . . . . . . (28,453) —Translation and other
adjustments, net . . . . . . . (1,894) 2,911
Balance at end of year . . . . . $509,336 $421,002
F-45
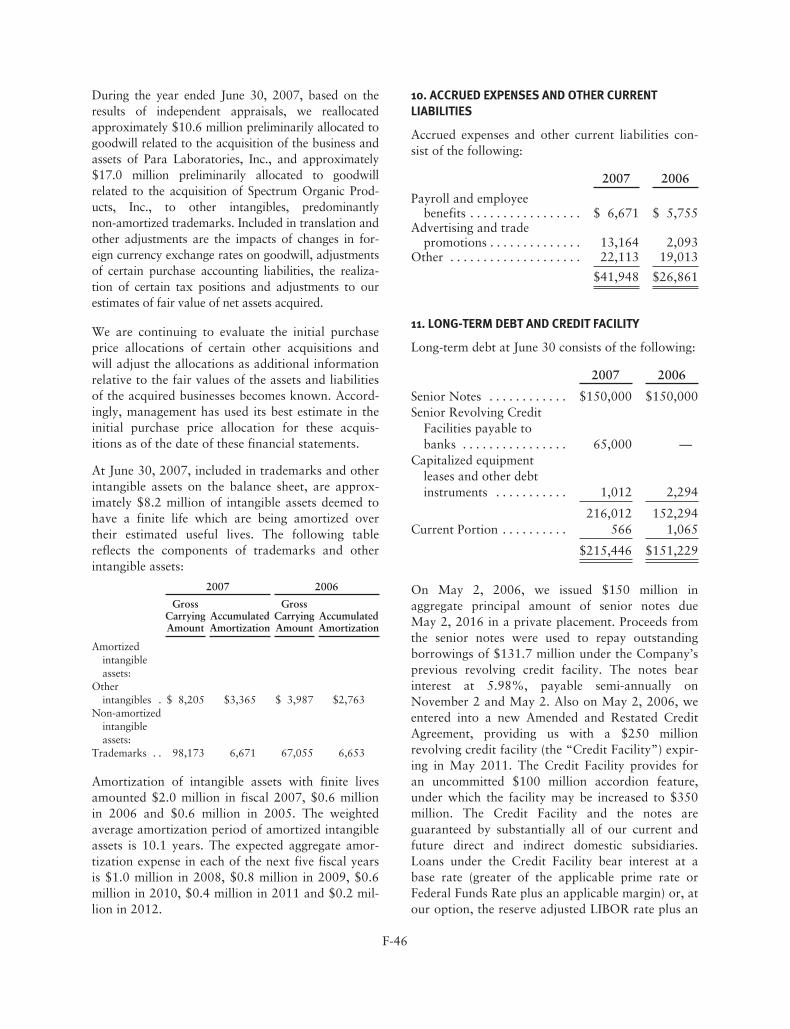
During the year ended June 30, 2007, based on theresults of independent appraisals, we reallocatedapproximately $10.6 million preliminarily allocated togoodwill related to the acquisition of the business andassets of Para Laboratories, Inc., and approximately$17.0 million preliminarily allocated to goodwillrelated to the acquisition of Spectrum Organic Prod-ucts, Inc., to other intangibles, predominantlynon-amortized trademarks. Included in translation andother adjustments are the impacts of changes in for-eign currency exchange rates on goodwill, adjustmentsof certain purchase accounting liabilities, the realiza-tion of certain tax positions and adjustments to ourestimates of fair value of net assets acquired.
We are continuing to evaluate the initial purchaseprice allocations of certain other acquisitions andwill adjust the allocations as additional informationrelative to the fair values of the assets and liabilitiesof the acquired businesses becomes known. Accord-ingly, management has used its best estimate in theinitial purchase price allocation for these acquis-itions as of the date of these financial statements.
At June 30, 2007, included in trademarks and otherintangible assets on the balance sheet, are approx-imately $8.2 million of intangible assets deemed tohave a finite life which are being amortized overtheir estimated useful lives. The following tablereflects the components of trademarks and otherintangible assets:
2007 2006
GrossCarryingAmount
AccumulatedAmortization
GrossCarryingAmount
AccumulatedAmortization
Amortizedintangibleassets:
Otherintangibles . $ 8,205 $3,365 $ 3,987 $2,763
Non-amortizedintangibleassets:
Trademarks . . 98,173 6,671 67,055 6,653
Amortization of intangible assets with finite livesamounted $2.0 million in fiscal 2007, $0.6 millionin 2006 and $0.6 million in 2005. The weightedaverage amortization period of amortized intangibleassets is 10.1 years. The expected aggregate amor-tization expense in each of the next five fiscal yearsis $1.0 million in 2008, $0.8 million in 2009, $0.6million in 2010, $0.4 million in 2011 and $0.2 mil-lion in 2012.
10. ACCRUED EXPENSES AND OTHER CURRENTLIABILITIES
Accrued expenses and other current liabilities con-sist of the following:
2007 2006
Payroll and employeebenefits . . . . . . . . . . . . . . . . . $ 6,671 $ 5,755
Advertising and tradepromotions . . . . . . . . . . . . . . 13,164 2,093
Other . . . . . . . . . . . . . . . . . . . . 22,113 19,013
$41,948 $26,861
11. LONG-TERM DEBT AND CREDIT FACILITY
Long-term debt at June 30 consists of the following:
2007 2006
Senior Notes . . . . . . . . . . . . $150,000 $150,000Senior Revolving Credit
Facilities payable tobanks . . . . . . . . . . . . . . . . 65,000 —
Capitalized equipmentleases and other debtinstruments . . . . . . . . . . . 1,012 2,294
216,012 152,294Current Portion . . . . . . . . . . 566 1,065
$215,446 $151,229
On May 2, 2006, we issued $150 million inaggregate principal amount of senior notes dueMay 2, 2016 in a private placement. Proceeds fromthe senior notes were used to repay outstandingborrowings of $131.7 million under the Company’sprevious revolving credit facility. The notes bearinterest at 5.98%, payable semi-annually onNovember 2 and May 2. Also on May 2, 2006, weentered into a new Amended and Restated CreditAgreement, providing us with a $250 millionrevolving credit facility (the “Credit Facility”) expir-ing in May 2011. The Credit Facility provides foran uncommitted $100 million accordion feature,under which the facility may be increased to $350million. The Credit Facility and the notes areguaranteed by substantially all of our current andfuture direct and indirect domestic subsidiaries.Loans under the Credit Facility bear interest at abase rate (greater of the applicable prime rate orFederal Funds Rate plus an applicable margin) or, atour option, the reserve adjusted LIBOR rate plus an
F-46
applicable margin. The Credit Facility provides forreductions in the applicable margin as compared tothe Credit Facility prior to its amendment andrestatement. As of June 30, 2007 and 2006, $150.0million of the senior notes was outstanding at aninterest rate of 5.98%. As of June 30, 2007, therewere $65.0 million of borrowings outstandingunder the Credit Facility. There were no borrowingsoutstanding under the Credit Facility as of June 30,2006. We are required by the terms of the CreditFacility and the senior notes to comply withcustomary affirmative and negative covenants forfacilities and notes of this nature. We were not incompliance with the financial reporting require-ments regarding timely delivery of our financialstatements under the credit agreement and thesenior notes for the periods ended June 30, 2007and September 30, 2007. The lenders under theCredit Facility and the holders of our senior noteshave agreed to extend the due dates for delivery ofthe financial statements for the periods noted aboveuntil January 31, 2008.
Our other debt instruments aggregate $1.0 millionand include obligations under capitalized leases formachinery and equipment and a note payable of$0.5 million due by our European operations to oneof the banks that is a participant in our CreditFacility.
Maturities of all debt instruments at June 30, 2007,are as follows:
2008 . . . . . . . . . . . . . . . . . . . . . . . . . . . . . $ 5662009 . . . . . . . . . . . . . . . . . . . . . . . . . . . . . 222010 . . . . . . . . . . . . . . . . . . . . . . . . . . . . . 312011 . . . . . . . . . . . . . . . . . . . . . . . . . . . . . 65,3932012 . . . . . . . . . . . . . . . . . . . . . . . . . . . . . —Thereafter . . . . . . . . . . . . . . . . . . . . . . . . 150,000
$216,012
Interest paid (which approximates the relatedexpense) during the years ended June 30, 2007,2006 and 2005 amounted to $11.1 million, $5.6million and $3.9 million, respectively.
12. INCOME TAXES
The components of income before income taxes forthe years ended June 30, 2007, 2006 and 2005 areas follows:
2007 2006 2005(As restated) (As restated)
Domestic . . . . $52,721 $45,890 $29,096Foreign . . . . . 24,371 13,256 7,768
Total . . . . . . . $77,092 $59,146 $36,864
The provision for income taxes for the yearsended June 30, 2007, 2006 and 2005 is presentedbelow.
2007 2006 2005
(As restated) (As restated)Current:Federal . . . . . . . . . $ 9,852 $ 9,540 $ 8,805State . . . . . . . . . . . 2,160 1,806 1,841Foreign . . . . . . . . . 6,721 4,666 2,639
18,733 16,012 13,285
Deferred:Federal and
state . . . . . . . . . 9,535 6,767 (482)Foreign . . . . . . . . . 1,342 — —
10,877 6,767 (482)
Total . . . . . . . . . . $29,610 $22,779 $12,803
The federal and state income tax provisions do notreflect tax savings resulting from deductions asso-ciated with our stock option plans. The current taxbenefit realized upon the exercise of stock optionscharged to additional paid in capital amounted to$3.0 million in 2007, $1.7 million in 2006 and $0.5million in 2005.
Income taxes paid during the years ended June 30,2007, 2006 and 2005 amounted to $20.6 million,$8.0 million and $14.6 million.
F-47
Reconciliations of expected income taxes at the U.S.federal statutory rate to the Company’s provisionfor income taxes for the years ended June 30 are asfollows:
2007 % 2006 % 2005 %
(Asrestated)
(Asrestated)
Expected U.S.federalincome tax atstatutoryrate . . . . . . . . $26,982 35.0% $20,701 35.0% $12,903 35.0%
State incometaxes, net offederalbenefit . . . . . 2,185 2.8 1,949 3.3 997 2.7
Stockoptions . . . . . 619 1.7
Foreign incomeat differentrates . . . . . . . 16 0.0 115 0.2 160 0.4
Non-deductiblegoodwillwritten offondisposal . . . . 1,173 1.5
Other . . . . . . . . (746) (0.9) 14 (0.0) (1,876) (5.1)
Provision forincometaxes . . . . . . $29,610 38.4% $22,779 38.5% $12,803 34.7%
Deferred income taxes reflect the net tax effects oftemporary differences between the carrying amountof assets and liabilities for financial reporting pur-poses and the amounts used for income tax pur-poses. Components of our deferred tax assets(liabilities) as of June 30 are as follows:
2007 2006(As restated)
Current deferred taxassets: . . . . . . . . . . . . . .
Basis difference oninventory . . . . . . . . . . . $ 2,695 $ 2,074
Allowance for doubtfulaccounts . . . . . . . . . . . . 548 387
Net operating losscarryforwards . . . . . . . — 191
Reserves not currentlydeductible . . . . . . . . . . . 4,826 334
Current deferred taxassets . . . . . . . . . . . . . . 8,069 2,986
Noncurrent deferred taxliabilities:
Difference inamortization . . . . . . . . (18,966) (15,821)
Basis difference onproperty andequipment . . . . . . . . . . (11,782) (7,689)
Noncurrent deferred taxassets:
Net operating loss andtax creditcarryforwards . . . . . . . 7,140 5,228
Stock options ascompensation . . . . . . . . 3,470 4,758
Other . . . . . . . . . . . . . . . . 196 —Valuation allowances . . . (2,290) (2,370)
Noncurrent deferred taxliabilities, net . . . . . . . . (22,232) (15,894)
$(14,163) $(12,908)
We have U.S. tax credit carryforwards of $1.7 mil-lion at June 30, 2007 with various expiration datesthrough 2016. We have U.S. federal tax net operat-ing losses available for carryforward at June 30,2007 of $9.1 million that were generated by certainsubsidiaries prior to their acquisition and haveexpiration dates through 2022. The use ofpre-acquisition operating losses is subject to limi-tations imposed by the Internal Revenue Code. Wedo not anticipate that these limitations will affect
F-48
utilization of the carryforwards prior to their expira-tion. The Company and various subsidiaries havestate tax net operating loss carryforwards of $8.2million at June 30, 2007 with varying expirationdates. We also have foreign net operating losses ofapproximately $4.9 million which are available toreduce future income tax payments in Germany andBelgium. Of the $7.1 million deferred tax asset forcredit and net operating loss carryforwards atJune 30, 2007, the Company considers it unlikelythat a portion of these tax benefits will be realized; a$2.3 million valuation allowance has been estab-lished against these respective deferred tax assets.
As of June 30, 2007, the Company had approx-imately $32 million of undistributed earnings offoreign subsidiaries for which taxes have not beenprovided as the Company has invested or expects toinvest these undistributed earnings indefinitely. If inthe future these earnings are repatriated to the U.S.,or if the Company determines such earnings will beremitted in the foreseeable future, additional taxprovisions would be required. Due to complexitiesin the tax laws and the assumptions that wouldhave to be made, it is not practicable to estimate theamounts of income taxes that might be payable ifsome or all of such earnings were to be remitted.
The Company is routinely audited by federal, stateand foreign tax authorities with respect to itsincome taxes. The Company regularly reviews andevaluates the likelihood of audit assessments andbelieves it has adequately accrued for exposures fortax liabilities resulting from future tax audits. Tothe extent the Company would be required to payamounts in excess of reserves or prevail on mattersfor which accruals have been established, theCompany’s effective tax rate in a given period maybe materially impacted. The Company’s federalincome tax returns for fiscal years 2004 and 2005are currently being audited by the Internal RevenueService. Although proposed adjustments have notbeen received for these years and the outcome ofin-progress tax audits is always uncertain, manage-ment believes the ultimate outcome of the audit willnot have a material impact on the Company’s con-solidated financial statements.
13. STOCKHOLDERS’ EQUITY
Preferred Stock
We are authorized to issue “blank check” preferredstock (up to 5 million shares) with such designations,rights and preferences as may be determined fromtime to time by the Board of Directors. Accordingly,the Board of Directors is empowered to issue, with-out stockholder approval, preferred stock with divi-dends, liquidation, conversion, voting, or otherrights which could decrease the amount of earningsand assets available for distribution to holders of ourCommon Stock. At June 30, 2007 and 2006, nopreferred stock was issued or outstanding.
Warrants
In connection with an acquisition in 1997, weissued warrants to Argosy Investment Corp.(“Argosy”) to acquire 100,000 shares of ourcommon stock at an exercise price of $12.688. Infiscal 2001, Argosy exercised 26,666 of these war-rants, resulting in proceeds of $0.3 million. In fiscal2002 and 2003, Argosy exercised no warrants. Infiscal 2004, Argosy exercised 36,667 of the war-rants resulting in proceeds of $0.5 million. Duringfiscal 2005, the remaining 36,667 warrants wereexercised resulting in proceeds of $0.5 million.
Common Stock Issued – Business Acquisitions
As part of the Spectrum and Para Laboratoriesacquisitions consummated during fiscal 2006,998,092 common shares were issued to the sellers,valued at approximately $20.1 million in theaggregate. (See Note 5)
In connection with our strategic alliance with YeoHiap Seng, Limited, we issued 100,482 commonshares in September 2005 valued at approximately$2.0 million and 196,464 common shares in May2007 valued at approximately $6.0 million. (SeeNote 15)
14. STOCK BASED COMPENSATION
The Company has various plans under which theCompany’s officers, senior management, other keyemployees and directors may be granted options topurchase the Company’s common stock or otherforms of equity-based awards. We had stock optionawards outstanding under seven long-term incentiveplans as of June 30, 2007.
F-49
2002 Long-Term Incentive and Stock Award Plan,as amended. In October 2002, we adopted the 2002Long-Term Incentive and Stock Award Plan. Theplan provides for the granting of stock options andother equity awards to employees, directors andconsultants to purchase shares of our commonstock. An aggregate of 1,600,000 shares of commonstock were originally reserved for issuance underthis plan. In December 2003, the plan was amendedto increase the number of shares issuable by1,500,000 shares and in November 2005, the planwas further amended to increase the number ofshares issuable by 750,000 shares bringing the totalshares issuable under this plan to 3,850,000. At the2006 Annual Meeting of Stockholders, the plan wasamended to increase the number of shares issuableby 2,000,000 shares to 5,850,000 shares. All of theoptions granted to date under the plan have beenincentive or non-qualified stock options providingfor the exercise price equal to the fair market priceat the date of grant and expiration ten years afterthe date of grant. Effective December 1, 2005, newoptions granted under the plan will expire sevenyears after the date of grant. Vesting terms aredetermined at the discretion of the Company. Noawards shall be granted under this plan afterDecember 1, 2015. During fiscal year 2005, optionsto purchase 1,545,400 shares were granted at pricesranging from $16.01 to $20.57 per share. Duringfiscal years 2006 and 2007, no options were grantedunder this plan. At June 30, 2007, 1,385,396options were outstanding and 2,794,950 optionswere available for grant under this plan.
2000 Directors Stock Option Plan, as amended. InMay 2000, we adopted the 2000 Directors StockOption Plan. The plan originally provided for thegranting of stock options to non-employee directorsto purchase up to an aggregate of 750,000 shares ofour common stock. In December 2003, the plan wasamended to increase the number of shares issuableby 200,000 shares to 950,000 shares. During fiscalyear 2005, options to purchase 67,500 shares weregranted at a price of $18.11 per share. During fiscalyears 2006 and 2007, no options were grantedunder this plan. At June 30, 2007, 505,500 optionswere outstanding and 264,500 options were avail-able for grant under this plan.
At June 30, 2007 there were 3,864,508 optionsoutstanding that were granted under five other priorHain and Celestial Seasonings plans. Although no
further awards can be granted under those plans,the options outstanding continue in accordance withthe terms of the respective plans.
Prior to fiscal 2006, the Company elected to followthe accounting provisions of APB Opinion No. 25for stock-based compensation and to provide the proforma disclosures required under SFAS No. 148,“Accounting for Stock-Based Compensation – Tran-sition and Disclosure.” Accordingly, the Companydid not recognize compensation expense for stockoption grants for periods prior to July 1, 2005, as theCompany has historically treated its stock options ashaving been granted at fair market value of theunderlying stock on the date of grant (however, seeNote 3, Restatement of Consolidated FinancialStatements, for a discussion of a review of equitygrants which resulted in, among other things, the useof revised measurement dates for certain grants).
Total stock-based compensation expenses includedin selling, general and administrative expense in theconsolidated statements of income were $984 for2007, $4,213 for 2006 and $4,650 for 2005. AtJune 30, 2007 there was no unrecognizedcompensation expense.
SFAS No. 123(R) requires that contractual commit-ments to issue stock options be recorded ascompensation cost whether or not the options havebeen granted. The Company’s employment agree-ment with its Chief Executive Officer (“CEO”)contains such a commitment; however the optionswhich were to be awarded in July 2005 and July2006 have not been granted, principally due to aninsufficient number of shares available under theCompany’s Long Term Incentive and Stock AwardPlans. Under SFAS No. 123(R), regardless ofwhether the options are ever granted, either cur-rently or in the future, a non-cash accountingexpense is required to be recorded during the yearleading up to the anticipated grant date under thecontract. This period is defined in SFAS No. 123(R)as the “requisite service period.” The requisite serv-ice period related to the July 2005 un-grantedoptions was completed on June 30, 2005, whichwas prior to the required implementation of SFASNo. 123(R) and, therefore, no expense has beenrecorded for the July 2005 options. The Companywill incur a charge to earnings at such time as thoseoptions are granted. The requisite service periodrelated to the July 2006 un-granted options was
F-50
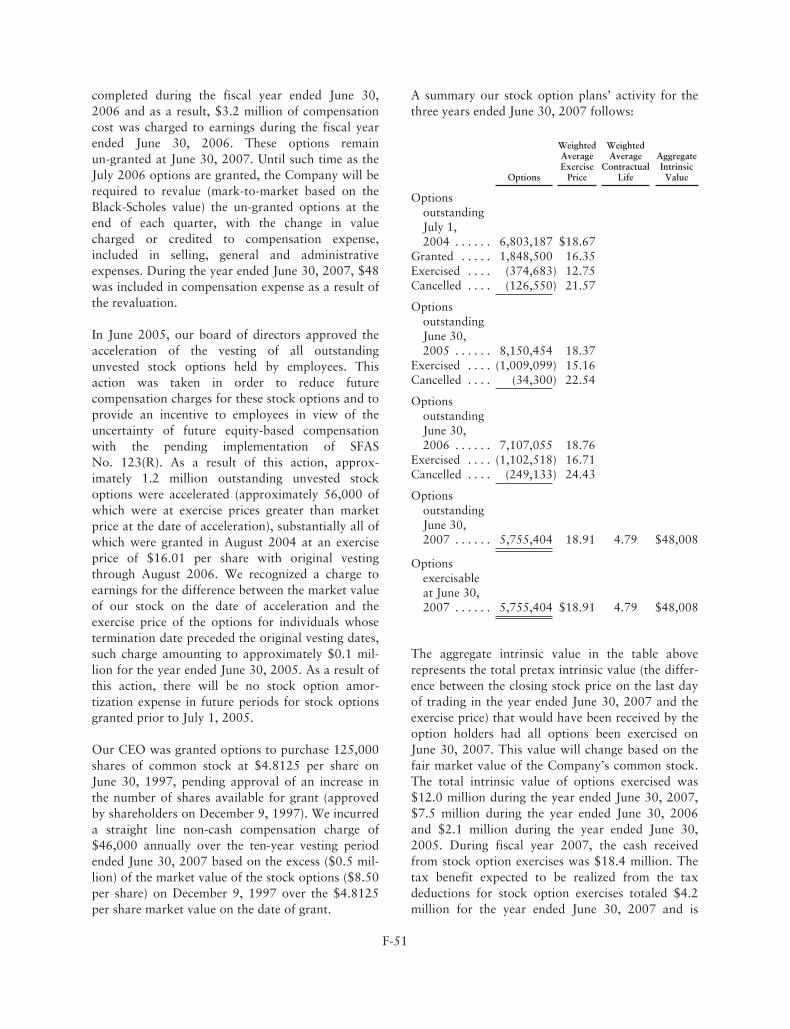
completed during the fiscal year ended June 30,2006 and as a result, $3.2 million of compensationcost was charged to earnings during the fiscal yearended June 30, 2006. These options remainun-granted at June 30, 2007. Until such time as theJuly 2006 options are granted, the Company will berequired to revalue (mark-to-market based on theBlack-Scholes value) the un-granted options at theend of each quarter, with the change in valuecharged or credited to compensation expense,included in selling, general and administrativeexpenses. During the year ended June 30, 2007, $48was included in compensation expense as a result ofthe revaluation.
In June 2005, our board of directors approved theacceleration of the vesting of all outstandingunvested stock options held by employees. Thisaction was taken in order to reduce futurecompensation charges for these stock options and toprovide an incentive to employees in view of theuncertainty of future equity-based compensationwith the pending implementation of SFASNo. 123(R). As a result of this action, approx-imately 1.2 million outstanding unvested stockoptions were accelerated (approximately 56,000 ofwhich were at exercise prices greater than marketprice at the date of acceleration), substantially all ofwhich were granted in August 2004 at an exerciseprice of $16.01 per share with original vestingthrough August 2006. We recognized a charge toearnings for the difference between the market valueof our stock on the date of acceleration and theexercise price of the options for individuals whosetermination date preceded the original vesting dates,such charge amounting to approximately $0.1 mil-lion for the year ended June 30, 2005. As a result ofthis action, there will be no stock option amor-tization expense in future periods for stock optionsgranted prior to July 1, 2005.
Our CEO was granted options to purchase 125,000shares of common stock at $4.8125 per share onJune 30, 1997, pending approval of an increase inthe number of shares available for grant (approvedby shareholders on December 9, 1997). We incurreda straight line non-cash compensation charge of$46,000 annually over the ten-year vesting periodended June 30, 2007 based on the excess ($0.5 mil-lion) of the market value of the stock options ($8.50per share) on December 9, 1997 over the $4.8125per share market value on the date of grant.
A summary our stock option plans’ activity for thethree years ended June 30, 2007 follows:
Options
WeightedAverageExercise
Price
WeightedAverage
ContractualLife
AggregateIntrinsicValue
OptionsoutstandingJuly 1,2004 . . . . . . 6,803,187 $18.67
Granted . . . . . 1,848,500 16.35Exercised . . . . (374,683) 12.75Cancelled . . . . (126,550) 21.57
OptionsoutstandingJune 30,2005 . . . . . . 8,150,454 18.37
Exercised . . . . (1,009,099) 15.16Cancelled . . . . (34,300) 22.54
OptionsoutstandingJune 30,2006 . . . . . . 7,107,055 18.76
Exercised . . . . (1,102,518) 16.71Cancelled . . . . (249,133) 24.43
OptionsoutstandingJune 30,2007 . . . . . . 5,755,404 18.91 4.79 $48,008
Optionsexercisableat June 30,2007 . . . . . . 5,755,404 $18.91 4.79 $48,008
The aggregate intrinsic value in the table aboverepresents the total pretax intrinsic value (the differ-ence between the closing stock price on the last dayof trading in the year ended June 30, 2007 and theexercise price) that would have been received by theoption holders had all options been exercised onJune 30, 2007. This value will change based on thefair market value of the Company’s common stock.The total intrinsic value of options exercised was$12.0 million during the year ended June 30, 2007,$7.5 million during the year ended June 30, 2006and $2.1 million during the year ended June 30,2005. During fiscal year 2007, the cash receivedfrom stock option exercises was $18.4 million. Thetax benefit expected to be realized from the taxdeductions for stock option exercises totaled $4.2million for the year ended June 30, 2007 and is
F-51
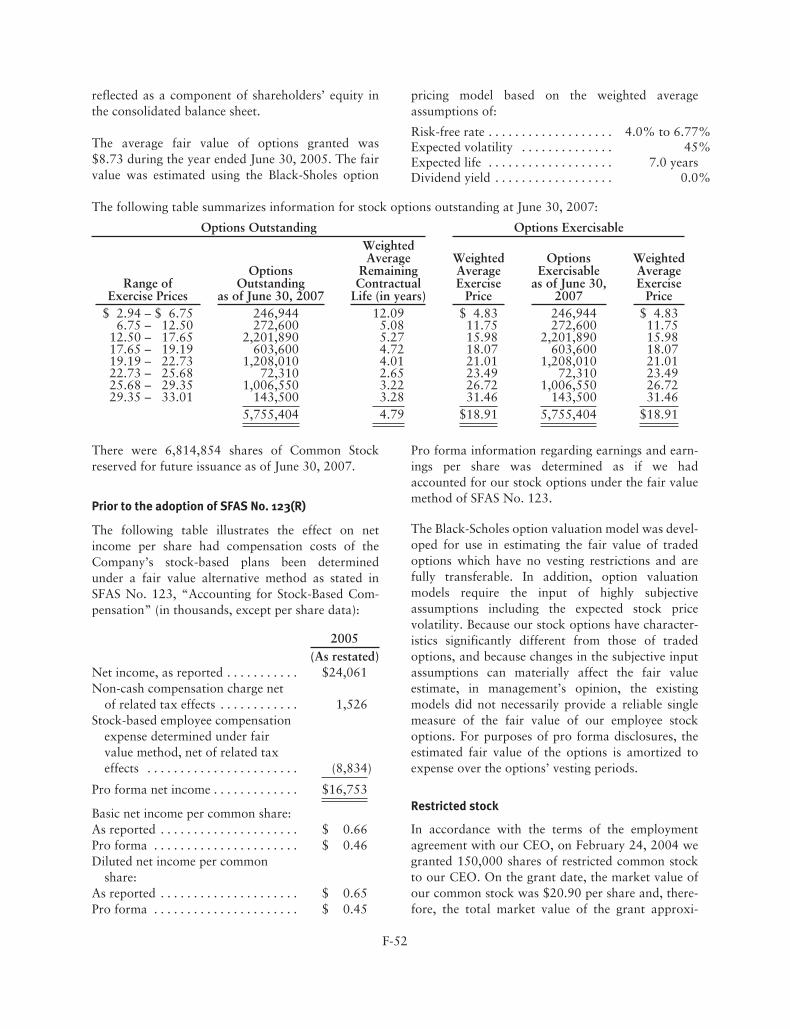
reflected as a component of shareholders’ equity inthe consolidated balance sheet.
The average fair value of options granted was$8.73 during the year ended June 30, 2005. The fairvalue was estimated using the Black-Sholes option
pricing model based on the weighted averageassumptions of:
Risk-free rate . . . . . . . . . . . . . . . . . . . 4.0% to 6.77%Expected volatility . . . . . . . . . . . . . . 45%Expected life . . . . . . . . . . . . . . . . . . . 7.0 yearsDividend yield . . . . . . . . . . . . . . . . . . 0.0%
The following table summarizes information for stock options outstanding at June 30, 2007:
Options Outstanding Options Exercisable
Range ofExercise Prices
OptionsOutstanding
as of June 30, 2007
WeightedAverage
RemainingContractual
Life (in years)
WeightedAverageExercise
Price
OptionsExercisable
as of June 30,2007
WeightedAverageExercise
Price$ 2.94 – $ 6.75 246,944 12.09 $ 4.83 246,944 $ 4.83
6.75 – 12.50 272,600 5.08 11.75 272,600 11.7512.50 – 17.65 2,201,890 5.27 15.98 2,201,890 15.9817.65 – 19.19 603,600 4.72 18.07 603,600 18.0719.19 – 22.73 1,208,010 4.01 21.01 1,208,010 21.0122.73 – 25.68 72,310 2.65 23.49 72,310 23.4925.68 – 29.35 1,006,550 3.22 26.72 1,006,550 26.7229.35 – 33.01 143,500 3.28 31.46 143,500 31.46
5,755,404 4.79 $18.91 5,755,404 $18.91
There were 6,814,854 shares of Common Stockreserved for future issuance as of June 30, 2007.
Prior to the adoption of SFAS No. 123(R)
The following table illustrates the effect on netincome per share had compensation costs of theCompany’s stock-based plans been determinedunder a fair value alternative method as stated inSFAS No. 123, “Accounting for Stock-Based Com-pensation” (in thousands, except per share data):
2005(As restated)
Net income, as reported . . . . . . . . . . . $24,061Non-cash compensation charge net
of related tax effects . . . . . . . . . . . . 1,526Stock-based employee compensation
expense determined under fairvalue method, net of related taxeffects . . . . . . . . . . . . . . . . . . . . . . . (8,834)
Pro forma net income . . . . . . . . . . . . . $16,753
Basic net income per common share:As reported . . . . . . . . . . . . . . . . . . . . . $ 0.66Pro forma . . . . . . . . . . . . . . . . . . . . . . $ 0.46Diluted net income per common
share:As reported . . . . . . . . . . . . . . . . . . . . . $ 0.65Pro forma . . . . . . . . . . . . . . . . . . . . . . $ 0.45
Pro forma information regarding earnings and earn-ings per share was determined as if we hadaccounted for our stock options under the fair valuemethod of SFAS No. 123.
The Black-Scholes option valuation model was devel-oped for use in estimating the fair value of tradedoptions which have no vesting restrictions and arefully transferable. In addition, option valuationmodels require the input of highly subjectiveassumptions including the expected stock pricevolatility. Because our stock options have character-istics significantly different from those of tradedoptions, and because changes in the subjective inputassumptions can materially affect the fair valueestimate, in management’s opinion, the existingmodels did not necessarily provide a reliable singlemeasure of the fair value of our employee stockoptions. For purposes of pro forma disclosures, theestimated fair value of the options is amortized toexpense over the options’ vesting periods.
Restricted stock
In accordance with the terms of the employmentagreement with our CEO, on February 24, 2004 wegranted 150,000 shares of restricted common stockto our CEO. On the grant date, the market value ofour common stock was $20.90 per share and, there-fore, the total market value of the grant approxi-
F-52
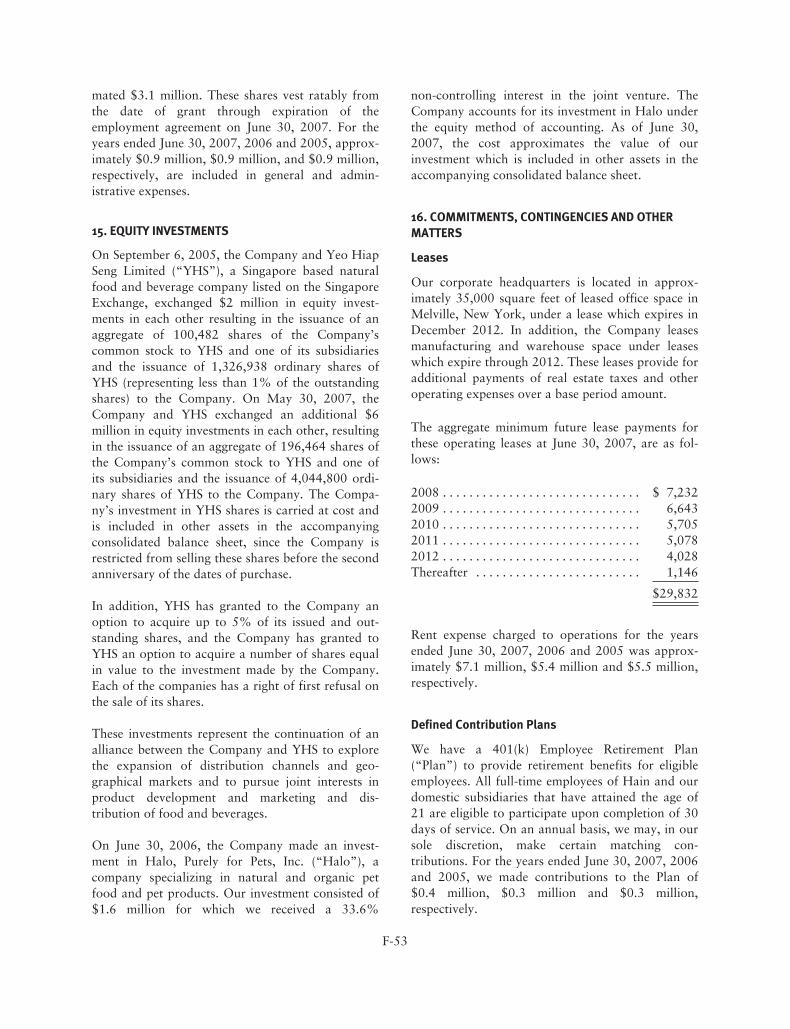
mated $3.1 million. These shares vest ratably fromthe date of grant through expiration of theemployment agreement on June 30, 2007. For theyears ended June 30, 2007, 2006 and 2005, approx-imately $0.9 million, $0.9 million, and $0.9 million,respectively, are included in general and admin-istrative expenses.
15. EQUITY INVESTMENTS
On September 6, 2005, the Company and Yeo HiapSeng Limited (“YHS”), a Singapore based naturalfood and beverage company listed on the SingaporeExchange, exchanged $2 million in equity invest-ments in each other resulting in the issuance of anaggregate of 100,482 shares of the Company’scommon stock to YHS and one of its subsidiariesand the issuance of 1,326,938 ordinary shares ofYHS (representing less than 1% of the outstandingshares) to the Company. On May 30, 2007, theCompany and YHS exchanged an additional $6million in equity investments in each other, resultingin the issuance of an aggregate of 196,464 shares ofthe Company’s common stock to YHS and one ofits subsidiaries and the issuance of 4,044,800 ordi-nary shares of YHS to the Company. The Compa-ny’s investment in YHS shares is carried at cost andis included in other assets in the accompanyingconsolidated balance sheet, since the Company isrestricted from selling these shares before the secondanniversary of the dates of purchase.
In addition, YHS has granted to the Company anoption to acquire up to 5% of its issued and out-standing shares, and the Company has granted toYHS an option to acquire a number of shares equalin value to the investment made by the Company.Each of the companies has a right of first refusal onthe sale of its shares.
These investments represent the continuation of analliance between the Company and YHS to explorethe expansion of distribution channels and geo-graphical markets and to pursue joint interests inproduct development and marketing and dis-tribution of food and beverages.
On June 30, 2006, the Company made an invest-ment in Halo, Purely for Pets, Inc. (“Halo”), acompany specializing in natural and organic petfood and pet products. Our investment consisted of$1.6 million for which we received a 33.6%
non-controlling interest in the joint venture. TheCompany accounts for its investment in Halo underthe equity method of accounting. As of June 30,2007, the cost approximates the value of ourinvestment which is included in other assets in theaccompanying consolidated balance sheet.
16. COMMITMENTS, CONTINGENCIES AND OTHERMATTERS
Leases
Our corporate headquarters is located in approx-imately 35,000 square feet of leased office space inMelville, New York, under a lease which expires inDecember 2012. In addition, the Company leasesmanufacturing and warehouse space under leaseswhich expire through 2012. These leases provide foradditional payments of real estate taxes and otheroperating expenses over a base period amount.
The aggregate minimum future lease payments forthese operating leases at June 30, 2007, are as fol-lows:
2008 . . . . . . . . . . . . . . . . . . . . . . . . . . . . . . $ 7,2322009 . . . . . . . . . . . . . . . . . . . . . . . . . . . . . . 6,6432010 . . . . . . . . . . . . . . . . . . . . . . . . . . . . . . 5,7052011 . . . . . . . . . . . . . . . . . . . . . . . . . . . . . . 5,0782012 . . . . . . . . . . . . . . . . . . . . . . . . . . . . . . 4,028Thereafter . . . . . . . . . . . . . . . . . . . . . . . . . 1,146
$29,832
Rent expense charged to operations for the yearsended June 30, 2007, 2006 and 2005 was approx-imately $7.1 million, $5.4 million and $5.5 million,respectively.
Defined Contribution Plans
We have a 401(k) Employee Retirement Plan(“Plan”) to provide retirement benefits for eligibleemployees. All full-time employees of Hain and ourdomestic subsidiaries that have attained the age of21 are eligible to participate upon completion of 30days of service. On an annual basis, we may, in oursole discretion, make certain matching con-tributions. For the years ended June 30, 2007, 2006and 2005, we made contributions to the Plan of$0.4 million, $0.3 million and $0.3 million,respectively.
F-53
Our subsidiary, Hain Celestial Canada ULC, has itsown separate Registered Retirement Employee Sav-ings Plan for those employees residing in Canada.Employees of Yves who meet eligibility require-ments may participate in that plan.
Foreign Exchange Risk Management
We have no involvement with derivative financialinstruments and do not use them for trading pur-poses. We may enter into foreign currency optionsor forward exchange contracts to hedge certain for-eign currency transactions. The intent of this prac-tice would be to minimize the impact of foreignexchange rate movements on our operating results.As of June 30, 2007, we had no outstanding for-ward exchange contracts.
17. LEGAL PROCEEDINGS
From time to time, we are involved in litigationincidental to the ordinary conduct of our business.Disposition of pending litigation related to thesematters is not expected by management to have amaterial adverse effect on our business, results ofoperations or financial condition.
A purported shareholder derivative action was filedagainst the Company (solely as a nominal defend-ant) and certain current and former officers anddirectors on September 21, 2006 in the SupremeCourt of the State of New York, County of Suffolk,alleging breaches of fiduciary duties and unjustenrichment in connection with the Company’s paststock option practices. The plaintiff seeksunspecified damages, disgorgement of options,attorneys’ fees and expenses, and other unspecifiedequitable relief from the defendants. A second pur-ported shareholder derivative action was filed onOctober 31, 2006 in the same court, against sub-stantially the same defendants and containing sub-stantially the same allegations, adding a claim ofbreach of fiduciary duty. The Company is defendingthese lawsuits. Plaintiffs have filed a motion toconsolidate the two actions. The motion is pending.
On June 15, 2007 the Company announced that ithad been informed by the SEC that it was conduct-ing an informal inquiry into its stock option practi-ces. The Company is cooperating in the SEC’sinvestigation.
A complaint was filed by Change to Win against theCompany on January 10, 2008 in the Court ofChancery of the State of Delaware seeking to com-pel the Company to conduct its 2007 Annual Meet-ing pursuant to 8 Del. C. §211, which entitles theCompany’s stockholders to an annual meetingwithin thirteen months of the last annual meeting.
18. SEGMENT INFORMATION
Our company is engaged in one business segment:the manufacturing, distribution and marketing ofnatural and organic food and personal care prod-ucts. We define business segments as components ofan enterprise about which separate financialinformation is available that is evaluated on a regu-lar basis by our chief operating decision maker(“CODM”). Our chief operating decision maker isthe Company’s Chief Executive Officer. Character-istics of our operations which are relied on in mak-ing this determination include the similaritiesapparent in the Company’s products in the naturaland organic consumer markets, the commonality ofthe Company’s customers across brands, theCompany’s unified marketing strategy, and thenature of the financial information used by theCODM, described below, other than informationon sales and direct product costs, by brand. Inmaking decisions about resource allocation andperformance assessment, the Company’s CODMfocuses on sales performance by brand usinginternally generated sales data as well as externallydeveloped market consumption data acquired fromindependent sources, and further reviews certaindata regarding standard costs and standard grossmargins by brand. In making these decisions, theCODM receives and reviews certain Companyconsolidated quarterly and year-to-dateinformation; however, the CODM does not receiveor review any discrete financial information bygeographic location, business unit, subsidiary, divi-sion or brand. The CODM reviews and approvescapital spending on a Company consolidated basisrather than at any lower unit level.
F-54
The Company’s sales by product category are asfollows:
2007 2006 2005
Grocery . . . . . . $462,310 $376,518 $343,445Snacks . . . . . . . 96,567 96,243 87,207Tea . . . . . . . . . . 91,539 100,918 100,871Personal
care . . . . . . . . 93,978 47,074 29,230Other . . . . . . . . 156,038 117,804 59,214
$900,432 $738,557 $619,967
The “other” category in the above table includes,but is not limited to, sales in such product categoriesas protein, meat alternative products, and freshprepared foods. Sales of each of these categories wasless than 10% of total sales in each year.
Outside the United States, we primarily conductbusiness in Canada and Europe. Selectedinformation related to our operations by geographicarea is as follows:
Years ended June 30, 2007 2006 2005
(Asrestated)
(Asrestated)
Net sales:United States . . . $676,505 $595,754 $489,096Canada . . . . . . . . 57,850 51,408 46,833Europe . . . . . . . . 166,077 91,395 84,038
$900,432 $738,557 $619,967
Earnings beforeincome taxes:United States . . . $ 52,721 $ 45,890 $ 29,096Canada . . . . . . . . 7,608 5,701 3,291Europe . . . . . . . . 16,763 7,555 4,477
$ 77,092 $ 59,146 $ 36,864
As of June 30, 2007 2006
Long-lived assets:United States . . . . . . . . $619,451 $508,002Canada . . . . . . . . . . . . . 60,491 56,348Europe . . . . . . . . . . . . . 62,510 52,858
$742,452 $617,208
19. SUBSEQUENT EVENTS
Acquisitions and Disposal
On August 2, 2007, we sold our 50% interest in aBelgium-based rice cakes manufacturing joint ven-ture which we entered into at the beginning of fiscal
2007 for which we received approximately€1.8 million (approximately $2.4 million) in cash.
On August 29, 2007, we acquired, through our50.1%-owned Hain Pure Protein Inc., PlainvilleTurkey Farm, Inc., a leading supplier of natural andantibiotic-free whole turkeys and deli turkey prod-ucts to the natural and grocery channels in theNortheast and Mid-Atlantic regions, for approx-imately $11.7 million in cash.
On December 10, 2007, we acquired TenderCareInternational Inc., a marketer and distributor ofchlorine-free and gel-free natural diapers and babywipes under the Tushies® and TenderCare® brandnames, for approximately $3.9 million in cash.
Nasdaq Delisting Notice
In September 2007, we received a Nasdaq staffdetermination letter stating that, as a result of thedelayed filing of our annual report on Form 10-Kfor the year ended June 30, 2007, we were not incompliance with the filing requirements for con-tinued listing as set forth in MarketplaceRule 4310(c) (14) and were therefore subject todelisting from the Nasdaq Global Select Market. Wereceived an additional Nasdaq staff determinationletter with respect to our failure to timely file ourQuarterly Report on Form 10-Q for the quarterended September 30, 2007. We requested and sub-sequently attended a hearing before the NasdaqListing Qualifications Panel, which was held onOctober 31, 2007, to appeal the staff determinationand present a plan to cure the filing deficiencies andregain compliance. On November 21, 2007 wesubmitted additional information to assist the List-ings Qualifications Panel in their assessment of ourlisting status. On December 19, 2007, the NasdaqListing Qualifications Panel granted our request forcontinued listing, provided that we supply Nasdaqwith certain information regarding the findings ofthe option investigation on or about January 21,2008 and file our Form 10-K and the QuarterlyReport on Form 10-Q for the quarter and Sep-tember 30, 2007 by January 31, 2008. With the fil-ing of our Form 10-K report and the filing of ourQuarterly Report on Form 10-Q for the periodended September 30, 2007, the Company believesthat it has remedied its non-compliance withMarketplace Rule 4310(c) (14), and no longer besubject to delisting from the Nasdaq Global SelectMarket.
F-55
Summary of Quarterly Results (Unaudited)
Unaudited quarterly financial data (in thousands, except per share amounts) for fiscal 2007 and 2006 issummarized as follows:
Three Months EndedSeptember 30,
2006 (a)December 31,
2006 (a)March 31,2007 (a)
June 30,2007
(As restated 1) (As restated 1) (As restated1)Net sales . . . . . . . . . . . . . . . . . . . . . . . . . . . . . $209,895 $230,190 $238,027 $222,320Gross profit (b) . . . . . . . . . . . . . . . . . . . . . . . . 58,830 69,871 70,738 61,991Operating income . . . . . . . . . . . . . . . . . . . . . . 16,880 24,925 23,540 18,632Income before income taxes . . . . . . . . . . . . . 15,060 23,171 20,248 18,613Net income . . . . . . . . . . . . . . . . . . . . . . . . . . . 8,739 14,213 12,390 12,140Basic earnings per common share . . . . . . . . . $ 0.23 $ 0.36 $ 0.31 $ 0.30Diluted earnings per common share . . . . . . . $ 0.22 $ 0.34 $ 0.30 $ 0.29
Three Months EndedSeptember 30,
2005December 31,
2005March 31,
2006June 30,
2006(As restated 1) (As restated 1) (As restated 1) (As restated 1)
Net sales . . . . . . . . . . . . . . . . . . . . . . . . . . . . . $161,097 $186,227 $196,443 $194,790Gross profit (c) . . . . . . . . . . . . . . . . . . . . . . . . 45,849 58,166 57,683 51,654Operating income . . . . . . . . . . . . . . . . . . . . . . 11,899 21,060 16,017 16,081Income before income taxes . . . . . . . . . . . . . 11,031 19,751 14,435 13,929Net income . . . . . . . . . . . . . . . . . . . . . . . . . . . 6,752 12,092 8,831 8,692Basic earnings per common share . . . . . . . . . $ 0.18 $ 0.33 $ 0.23 $ 0.23Diluted earnings per common share . . . . . . . $ 0.18 $ 0.31 $ 0.22 $ 0.22
(a) The amounts for the first three quarters of fiscal 2007 reflect adjustments recorded in the fourth quarter of fiscal2007 as a result of the adoption of SAB No. 108 as of July 1, 2006. For more information, see Note 2, “Summary ofSignificant Accounting Policies”, in the Notes to Consolidated Financial Statements.
(b) Gross profit was negatively impacted by approximately $1.1 million ($0.7 million net of tax) for the three monthsended September 30, 2006, and $0.6 million ($0.4 million net of tax) for the three months ended December 31, 2006,as the result of start-up costs associated with a new production line at the Company’s West Chester, PA frozen foodsfacility.
(c) Gross profit was negatively impacted by approximately $0.9 million ($0.6 million net of tax) for the three monthsended June 30, 2006, as the result of charges related to the Company’s 2005 SKU rationalization program.
(1) See Note 3, “Restatement of Consolidated Financial Statements”, in the Notes to Consolidated Financial State-ments.
F-56
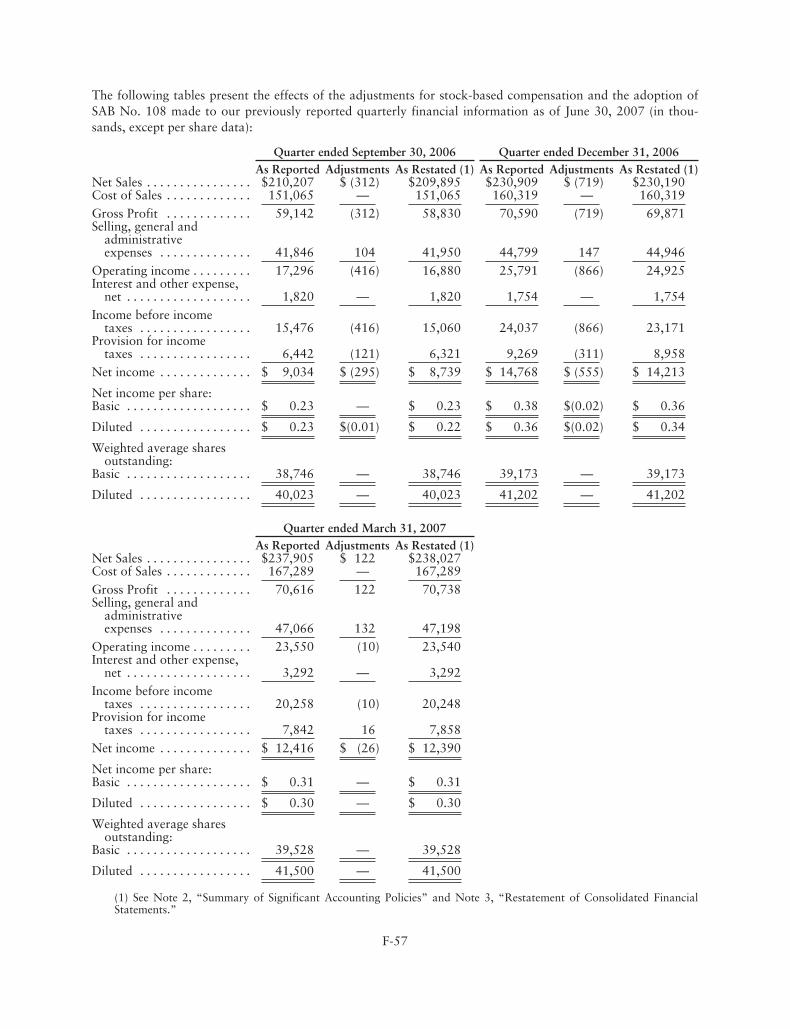
The following tables present the effects of the adjustments for stock-based compensation and the adoption ofSAB No. 108 made to our previously reported quarterly financial information as of June 30, 2007 (in thou-sands, except per share data):
Quarter ended September 30, 2006 Quarter ended December 31, 2006As Reported Adjustments As Restated (1) As Reported Adjustments As Restated (1)
Net Sales . . . . . . . . . . . . . . . . $210,207 $ (312) $209,895 $230,909 $ (719) $230,190Cost of Sales . . . . . . . . . . . . . 151,065 — 151,065 160,319 — 160,319Gross Profit . . . . . . . . . . . . . 59,142 (312) 58,830 70,590 (719) 69,871Selling, general and
administrativeexpenses . . . . . . . . . . . . . . 41,846 104 41,950 44,799 147 44,946
Operating income . . . . . . . . . 17,296 (416) 16,880 25,791 (866) 24,925Interest and other expense,
net . . . . . . . . . . . . . . . . . . . 1,820 — 1,820 1,754 — 1,754Income before income
taxes . . . . . . . . . . . . . . . . . 15,476 (416) 15,060 24,037 (866) 23,171Provision for income
taxes . . . . . . . . . . . . . . . . . 6,442 (121) 6,321 9,269 (311) 8,958Net income . . . . . . . . . . . . . . $ 9,034 $ (295) $ 8,739 $ 14,768 $ (555) $ 14,213
Net income per share:Basic . . . . . . . . . . . . . . . . . . . $ 0.23 — $ 0.23 $ 0.38 $(0.02) $ 0.36
Diluted . . . . . . . . . . . . . . . . . $ 0.23 $(0.01) $ 0.22 $ 0.36 $(0.02) $ 0.34
Weighted average sharesoutstanding:
Basic . . . . . . . . . . . . . . . . . . . 38,746 — 38,746 39,173 — 39,173
Diluted . . . . . . . . . . . . . . . . . 40,023 — 40,023 41,202 — 41,202
Quarter ended March 31, 2007As Reported Adjustments As Restated (1)
Net Sales . . . . . . . . . . . . . . . . $237,905 $ 122 $238,027Cost of Sales . . . . . . . . . . . . . 167,289 — 167,289Gross Profit . . . . . . . . . . . . . 70,616 122 70,738Selling, general and
administrativeexpenses . . . . . . . . . . . . . . 47,066 132 47,198
Operating income . . . . . . . . . 23,550 (10) 23,540Interest and other expense,
net . . . . . . . . . . . . . . . . . . . 3,292 — 3,292Income before income
taxes . . . . . . . . . . . . . . . . . 20,258 (10) 20,248Provision for income
taxes . . . . . . . . . . . . . . . . . 7,842 16 7,858Net income . . . . . . . . . . . . . . $ 12,416 $ (26) $ 12,390
Net income per share:Basic . . . . . . . . . . . . . . . . . . . $ 0.31 — $ 0.31
Diluted . . . . . . . . . . . . . . . . . $ 0.30 — $ 0.30
Weighted average sharesoutstanding:
Basic . . . . . . . . . . . . . . . . . . . 39,528 — 39,528
Diluted . . . . . . . . . . . . . . . . . 41,500 — 41,500
(1) See Note 2, “Summary of Significant Accounting Policies” and Note 3, “Restatement of Consolidated FinancialStatements.”
F-57
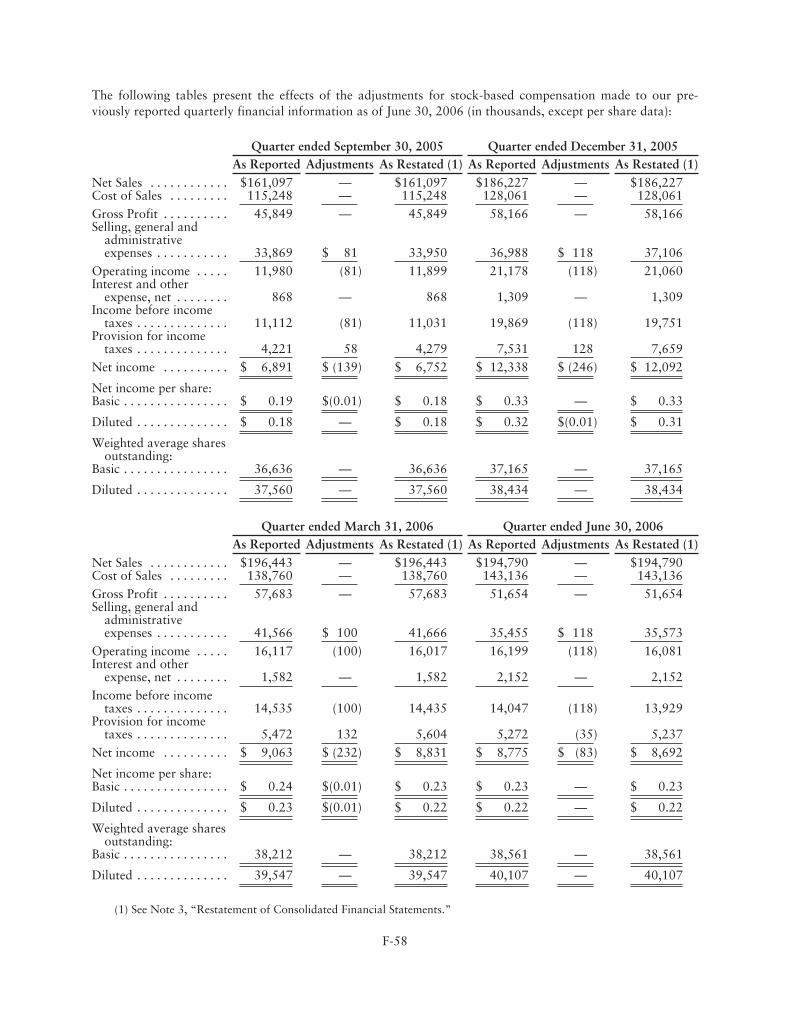
The following tables present the effects of the adjustments for stock-based compensation made to our pre-viously reported quarterly financial information as of June 30, 2006 (in thousands, except per share data):
Quarter ended September 30, 2005 Quarter ended December 31, 2005As Reported Adjustments As Restated (1) As Reported Adjustments As Restated (1)
Net Sales . . . . . . . . . . . . $161,097 — $161,097 $186,227 — $186,227Cost of Sales . . . . . . . . . 115,248 — 115,248 128,061 — 128,061Gross Profit . . . . . . . . . . 45,849 — 45,849 58,166 — 58,166Selling, general and
administrativeexpenses . . . . . . . . . . . 33,869 $ 81 33,950 36,988 $ 118 37,106
Operating income . . . . . 11,980 (81) 11,899 21,178 (118) 21,060Interest and other
expense, net . . . . . . . . 868 — 868 1,309 — 1,309Income before income
taxes . . . . . . . . . . . . . . 11,112 (81) 11,031 19,869 (118) 19,751Provision for income
taxes . . . . . . . . . . . . . . 4,221 58 4,279 7,531 128 7,659Net income . . . . . . . . . . $ 6,891 $ (139) $ 6,752 $ 12,338 $ (246) $ 12,092
Net income per share:Basic . . . . . . . . . . . . . . . . $ 0.19 $(0.01) $ 0.18 $ 0.33 — $ 0.33
Diluted . . . . . . . . . . . . . . $ 0.18 — $ 0.18 $ 0.32 $(0.01) $ 0.31
Weighted average sharesoutstanding:
Basic . . . . . . . . . . . . . . . . 36,636 — 36,636 37,165 — 37,165
Diluted . . . . . . . . . . . . . . 37,560 — 37,560 38,434 — 38,434
Quarter ended March 31, 2006 Quarter ended June 30, 2006As Reported Adjustments As Restated (1) As Reported Adjustments As Restated (1)
Net Sales . . . . . . . . . . . . $196,443 — $196,443 $194,790 — $194,790Cost of Sales . . . . . . . . . 138,760 — 138,760 143,136 — 143,136Gross Profit . . . . . . . . . . 57,683 — 57,683 51,654 — 51,654Selling, general and
administrativeexpenses . . . . . . . . . . . 41,566 $ 100 41,666 35,455 $ 118 35,573
Operating income . . . . . 16,117 (100) 16,017 16,199 (118) 16,081Interest and other
expense, net . . . . . . . . 1,582 — 1,582 2,152 — 2,152Income before income
taxes . . . . . . . . . . . . . . 14,535 (100) 14,435 14,047 (118) 13,929Provision for income
taxes . . . . . . . . . . . . . . 5,472 132 5,604 5,272 (35) 5,237Net income . . . . . . . . . . $ 9,063 $ (232) $ 8,831 $ 8,775 $ (83) $ 8,692
Net income per share:Basic . . . . . . . . . . . . . . . . $ 0.24 $(0.01) $ 0.23 $ 0.23 — $ 0.23
Diluted . . . . . . . . . . . . . . $ 0.23 $(0.01) $ 0.22 $ 0.22 — $ 0.22
Weighted average sharesoutstanding:
Basic . . . . . . . . . . . . . . . . 38,212 — 38,212 38,561 — 38,561
Diluted . . . . . . . . . . . . . . 39,547 — 39,547 40,107 — 40,107
(1) See Note 3, “Restatement of Consolidated Financial Statements.”
F-58
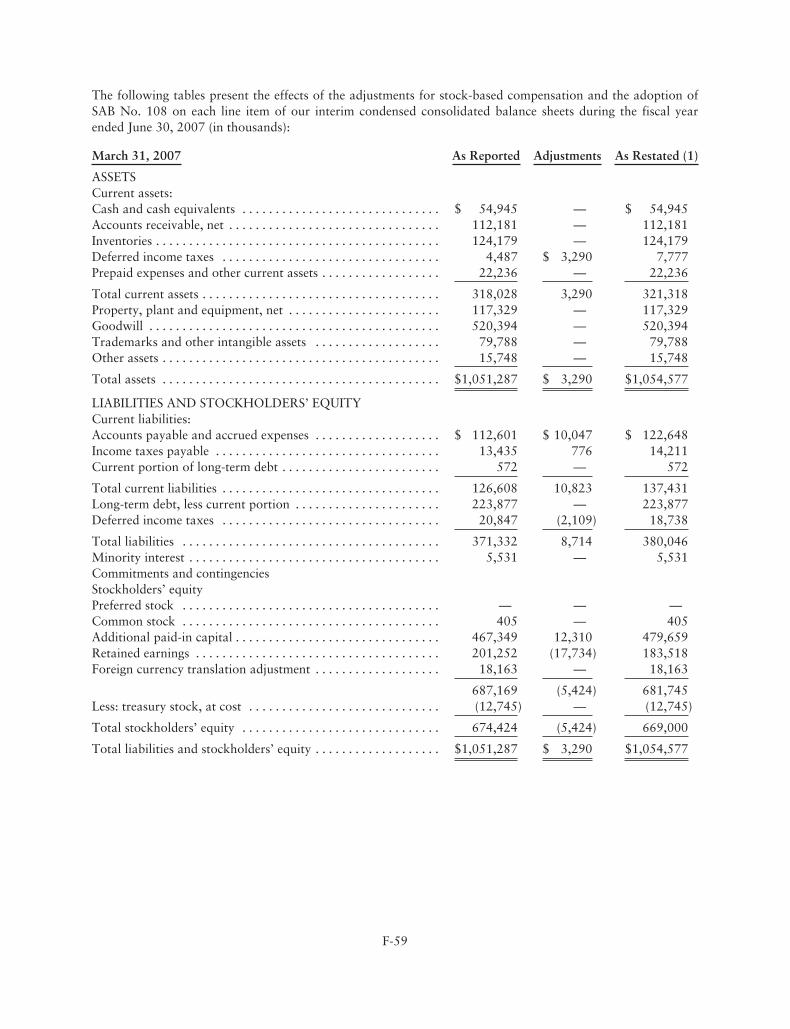
The following tables present the effects of the adjustments for stock-based compensation and the adoption ofSAB No. 108 on each line item of our interim condensed consolidated balance sheets during the fiscal yearended June 30, 2007 (in thousands):
March 31, 2007 As Reported Adjustments As Restated (1)
ASSETSCurrent assets:Cash and cash equivalents . . . . . . . . . . . . . . . . . . . . . . . . . . . . . . $ 54,945 — $ 54,945Accounts receivable, net . . . . . . . . . . . . . . . . . . . . . . . . . . . . . . . . 112,181 — 112,181Inventories . . . . . . . . . . . . . . . . . . . . . . . . . . . . . . . . . . . . . . . . . . . 124,179 — 124,179Deferred income taxes . . . . . . . . . . . . . . . . . . . . . . . . . . . . . . . . . 4,487 $ 3,290 7,777Prepaid expenses and other current assets . . . . . . . . . . . . . . . . . . 22,236 — 22,236
Total current assets . . . . . . . . . . . . . . . . . . . . . . . . . . . . . . . . . . . . 318,028 3,290 321,318Property, plant and equipment, net . . . . . . . . . . . . . . . . . . . . . . . 117,329 — 117,329Goodwill . . . . . . . . . . . . . . . . . . . . . . . . . . . . . . . . . . . . . . . . . . . . 520,394 — 520,394Trademarks and other intangible assets . . . . . . . . . . . . . . . . . . . 79,788 — 79,788Other assets . . . . . . . . . . . . . . . . . . . . . . . . . . . . . . . . . . . . . . . . . . 15,748 — 15,748
Total assets . . . . . . . . . . . . . . . . . . . . . . . . . . . . . . . . . . . . . . . . . . $1,051,287 $ 3,290 $1,054,577
LIABILITIES AND STOCKHOLDERS’ EQUITYCurrent liabilities:Accounts payable and accrued expenses . . . . . . . . . . . . . . . . . . . $ 112,601 $ 10,047 $ 122,648Income taxes payable . . . . . . . . . . . . . . . . . . . . . . . . . . . . . . . . . . 13,435 776 14,211Current portion of long-term debt . . . . . . . . . . . . . . . . . . . . . . . . 572 — 572
Total current liabilities . . . . . . . . . . . . . . . . . . . . . . . . . . . . . . . . . 126,608 10,823 137,431Long-term debt, less current portion . . . . . . . . . . . . . . . . . . . . . . 223,877 — 223,877Deferred income taxes . . . . . . . . . . . . . . . . . . . . . . . . . . . . . . . . . 20,847 (2,109) 18,738
Total liabilities . . . . . . . . . . . . . . . . . . . . . . . . . . . . . . . . . . . . . . . 371,332 8,714 380,046Minority interest . . . . . . . . . . . . . . . . . . . . . . . . . . . . . . . . . . . . . . 5,531 — 5,531Commitments and contingenciesStockholders’ equityPreferred stock . . . . . . . . . . . . . . . . . . . . . . . . . . . . . . . . . . . . . . . — — —Common stock . . . . . . . . . . . . . . . . . . . . . . . . . . . . . . . . . . . . . . . 405 — 405Additional paid-in capital . . . . . . . . . . . . . . . . . . . . . . . . . . . . . . . 467,349 12,310 479,659Retained earnings . . . . . . . . . . . . . . . . . . . . . . . . . . . . . . . . . . . . . 201,252 (17,734) 183,518Foreign currency translation adjustment . . . . . . . . . . . . . . . . . . . 18,163 — 18,163
687,169 (5,424) 681,745Less: treasury stock, at cost . . . . . . . . . . . . . . . . . . . . . . . . . . . . . (12,745) — (12,745)
Total stockholders’ equity . . . . . . . . . . . . . . . . . . . . . . . . . . . . . . 674,424 (5,424) 669,000
Total liabilities and stockholders’ equity . . . . . . . . . . . . . . . . . . . $1,051,287 $ 3,290 $1,054,577
F-59
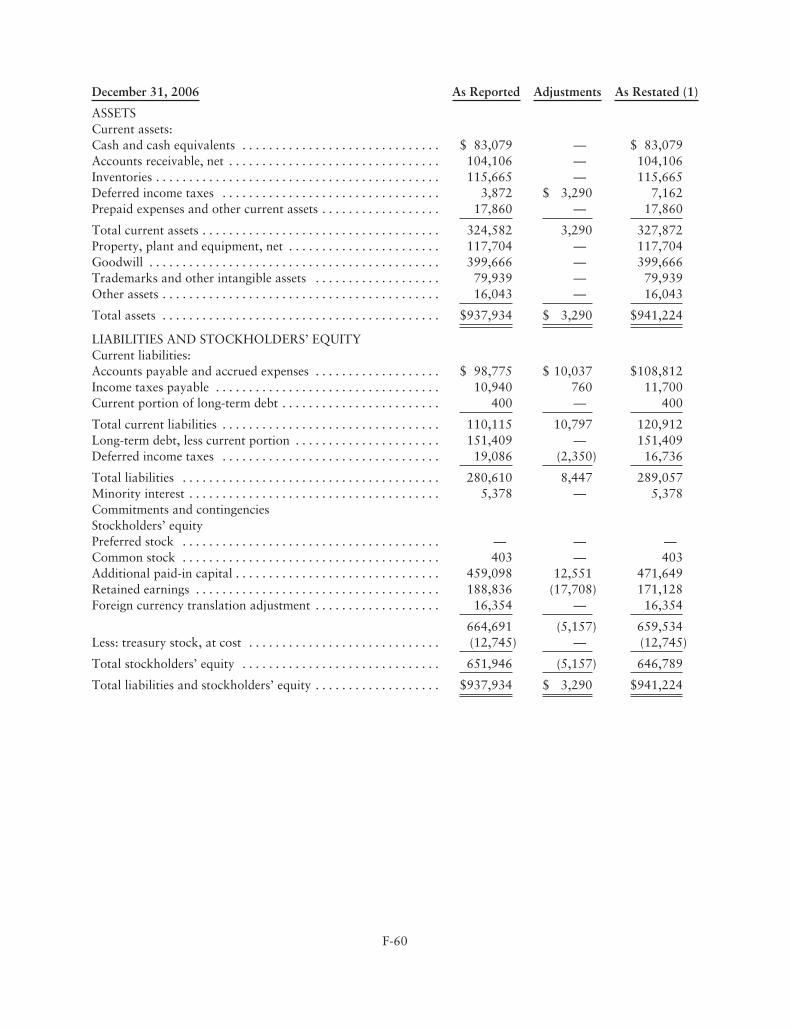
December 31, 2006 As Reported Adjustments As Restated (1)
ASSETSCurrent assets:Cash and cash equivalents . . . . . . . . . . . . . . . . . . . . . . . . . . . . . . $ 83,079 — $ 83,079Accounts receivable, net . . . . . . . . . . . . . . . . . . . . . . . . . . . . . . . . 104,106 — 104,106Inventories . . . . . . . . . . . . . . . . . . . . . . . . . . . . . . . . . . . . . . . . . . . 115,665 — 115,665Deferred income taxes . . . . . . . . . . . . . . . . . . . . . . . . . . . . . . . . . 3,872 $ 3,290 7,162Prepaid expenses and other current assets . . . . . . . . . . . . . . . . . . 17,860 — 17,860
Total current assets . . . . . . . . . . . . . . . . . . . . . . . . . . . . . . . . . . . . 324,582 3,290 327,872Property, plant and equipment, net . . . . . . . . . . . . . . . . . . . . . . . 117,704 — 117,704Goodwill . . . . . . . . . . . . . . . . . . . . . . . . . . . . . . . . . . . . . . . . . . . . 399,666 — 399,666Trademarks and other intangible assets . . . . . . . . . . . . . . . . . . . 79,939 — 79,939Other assets . . . . . . . . . . . . . . . . . . . . . . . . . . . . . . . . . . . . . . . . . . 16,043 — 16,043
Total assets . . . . . . . . . . . . . . . . . . . . . . . . . . . . . . . . . . . . . . . . . . $937,934 $ 3,290 $941,224
LIABILITIES AND STOCKHOLDERS’ EQUITYCurrent liabilities:Accounts payable and accrued expenses . . . . . . . . . . . . . . . . . . . $ 98,775 $ 10,037 $108,812Income taxes payable . . . . . . . . . . . . . . . . . . . . . . . . . . . . . . . . . . 10,940 760 11,700Current portion of long-term debt . . . . . . . . . . . . . . . . . . . . . . . . 400 — 400
Total current liabilities . . . . . . . . . . . . . . . . . . . . . . . . . . . . . . . . . 110,115 10,797 120,912Long-term debt, less current portion . . . . . . . . . . . . . . . . . . . . . . 151,409 — 151,409Deferred income taxes . . . . . . . . . . . . . . . . . . . . . . . . . . . . . . . . . 19,086 (2,350) 16,736
Total liabilities . . . . . . . . . . . . . . . . . . . . . . . . . . . . . . . . . . . . . . . 280,610 8,447 289,057Minority interest . . . . . . . . . . . . . . . . . . . . . . . . . . . . . . . . . . . . . . 5,378 — 5,378Commitments and contingenciesStockholders’ equityPreferred stock . . . . . . . . . . . . . . . . . . . . . . . . . . . . . . . . . . . . . . . — — —Common stock . . . . . . . . . . . . . . . . . . . . . . . . . . . . . . . . . . . . . . . 403 — 403Additional paid-in capital . . . . . . . . . . . . . . . . . . . . . . . . . . . . . . . 459,098 12,551 471,649Retained earnings . . . . . . . . . . . . . . . . . . . . . . . . . . . . . . . . . . . . . 188,836 (17,708) 171,128Foreign currency translation adjustment . . . . . . . . . . . . . . . . . . . 16,354 — 16,354
664,691 (5,157) 659,534Less: treasury stock, at cost . . . . . . . . . . . . . . . . . . . . . . . . . . . . . (12,745) — (12,745)
Total stockholders’ equity . . . . . . . . . . . . . . . . . . . . . . . . . . . . . . 651,946 (5,157) 646,789
Total liabilities and stockholders’ equity . . . . . . . . . . . . . . . . . . . $937,934 $ 3,290 $941,224
F-60
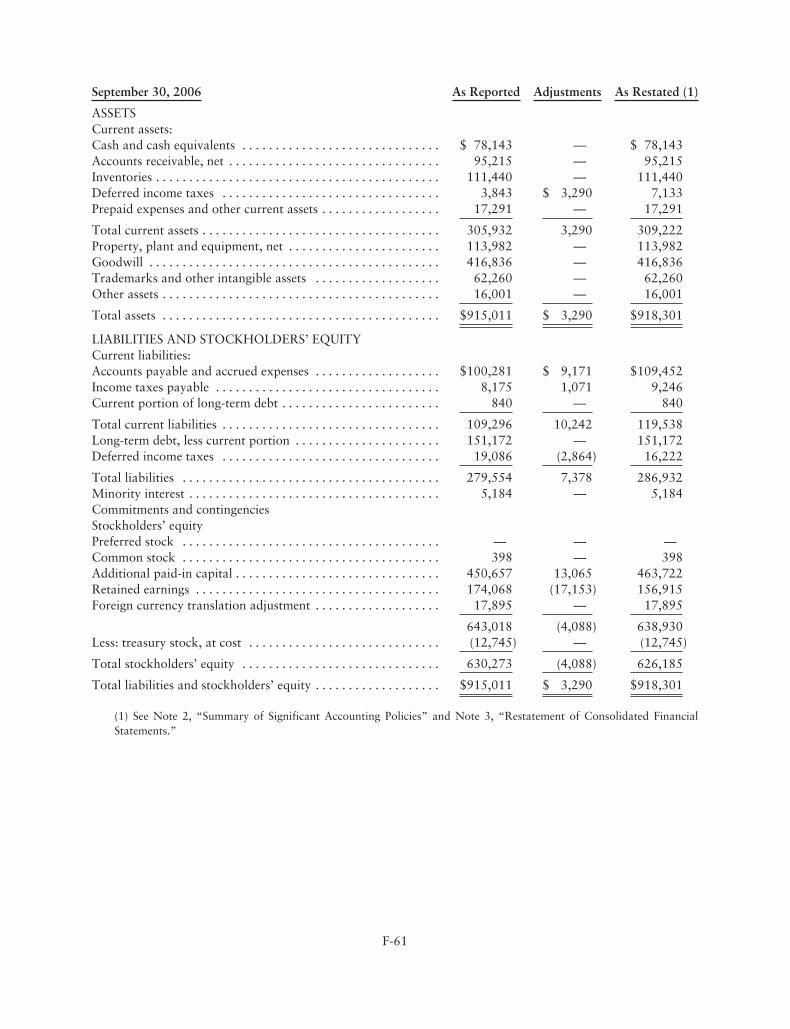
September 30, 2006 As Reported Adjustments As Restated (1)
ASSETSCurrent assets:Cash and cash equivalents . . . . . . . . . . . . . . . . . . . . . . . . . . . . . . $ 78,143 — $ 78,143Accounts receivable, net . . . . . . . . . . . . . . . . . . . . . . . . . . . . . . . . 95,215 — 95,215Inventories . . . . . . . . . . . . . . . . . . . . . . . . . . . . . . . . . . . . . . . . . . . 111,440 — 111,440Deferred income taxes . . . . . . . . . . . . . . . . . . . . . . . . . . . . . . . . . 3,843 $ 3,290 7,133Prepaid expenses and other current assets . . . . . . . . . . . . . . . . . . 17,291 — 17,291
Total current assets . . . . . . . . . . . . . . . . . . . . . . . . . . . . . . . . . . . . 305,932 3,290 309,222Property, plant and equipment, net . . . . . . . . . . . . . . . . . . . . . . . 113,982 — 113,982Goodwill . . . . . . . . . . . . . . . . . . . . . . . . . . . . . . . . . . . . . . . . . . . . 416,836 — 416,836Trademarks and other intangible assets . . . . . . . . . . . . . . . . . . . 62,260 — 62,260Other assets . . . . . . . . . . . . . . . . . . . . . . . . . . . . . . . . . . . . . . . . . . 16,001 — 16,001
Total assets . . . . . . . . . . . . . . . . . . . . . . . . . . . . . . . . . . . . . . . . . . $915,011 $ 3,290 $918,301
LIABILITIES AND STOCKHOLDERS’ EQUITYCurrent liabilities:Accounts payable and accrued expenses . . . . . . . . . . . . . . . . . . . $100,281 $ 9,171 $109,452Income taxes payable . . . . . . . . . . . . . . . . . . . . . . . . . . . . . . . . . . 8,175 1,071 9,246Current portion of long-term debt . . . . . . . . . . . . . . . . . . . . . . . . 840 — 840
Total current liabilities . . . . . . . . . . . . . . . . . . . . . . . . . . . . . . . . . 109,296 10,242 119,538Long-term debt, less current portion . . . . . . . . . . . . . . . . . . . . . . 151,172 — 151,172Deferred income taxes . . . . . . . . . . . . . . . . . . . . . . . . . . . . . . . . . 19,086 (2,864) 16,222
Total liabilities . . . . . . . . . . . . . . . . . . . . . . . . . . . . . . . . . . . . . . . 279,554 7,378 286,932Minority interest . . . . . . . . . . . . . . . . . . . . . . . . . . . . . . . . . . . . . . 5,184 — 5,184Commitments and contingenciesStockholders’ equityPreferred stock . . . . . . . . . . . . . . . . . . . . . . . . . . . . . . . . . . . . . . . — — —Common stock . . . . . . . . . . . . . . . . . . . . . . . . . . . . . . . . . . . . . . . 398 — 398Additional paid-in capital . . . . . . . . . . . . . . . . . . . . . . . . . . . . . . . 450,657 13,065 463,722Retained earnings . . . . . . . . . . . . . . . . . . . . . . . . . . . . . . . . . . . . . 174,068 (17,153) 156,915Foreign currency translation adjustment . . . . . . . . . . . . . . . . . . . 17,895 — 17,895
643,018 (4,088) 638,930Less: treasury stock, at cost . . . . . . . . . . . . . . . . . . . . . . . . . . . . . (12,745) — (12,745)
Total stockholders’ equity . . . . . . . . . . . . . . . . . . . . . . . . . . . . . . 630,273 (4,088) 626,185
Total liabilities and stockholders’ equity . . . . . . . . . . . . . . . . . . . $915,011 $ 3,290 $918,301
(1) See Note 2, “Summary of Significant Accounting Policies” and Note 3, “Restatement of Consolidated FinancialStatements.”
F-61
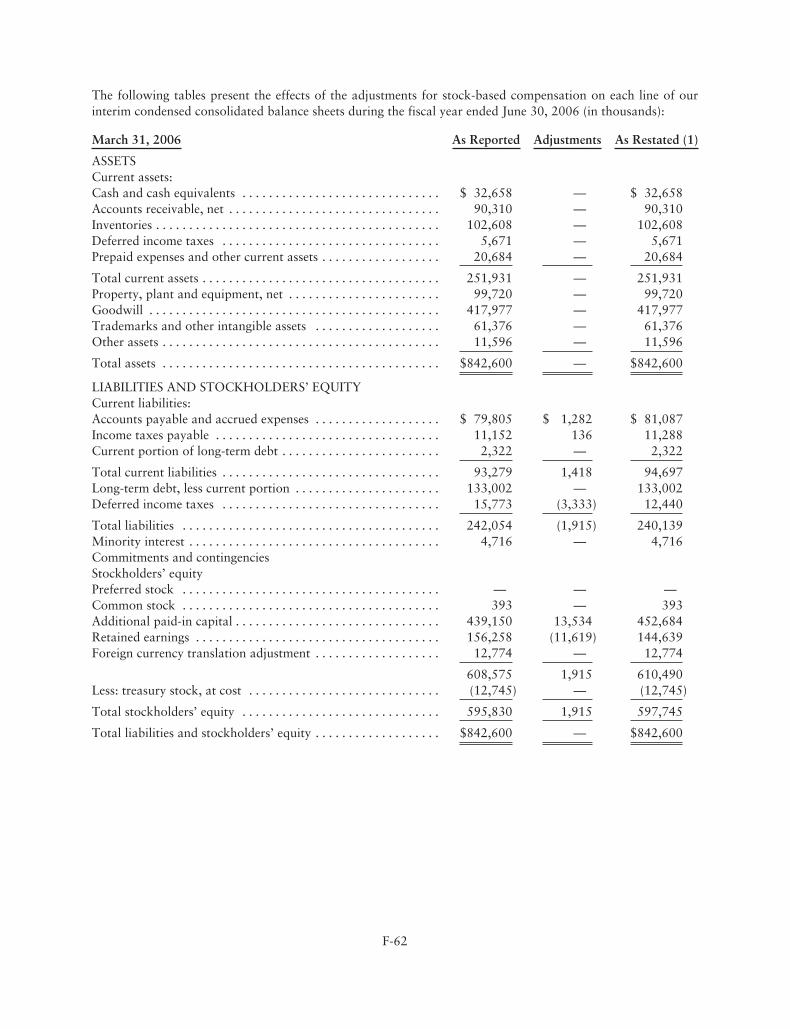
The following tables present the effects of the adjustments for stock-based compensation on each line of ourinterim condensed consolidated balance sheets during the fiscal year ended June 30, 2006 (in thousands):
March 31, 2006 As Reported Adjustments As Restated (1)
ASSETSCurrent assets:Cash and cash equivalents . . . . . . . . . . . . . . . . . . . . . . . . . . . . . . $ 32,658 — $ 32,658Accounts receivable, net . . . . . . . . . . . . . . . . . . . . . . . . . . . . . . . . 90,310 — 90,310Inventories . . . . . . . . . . . . . . . . . . . . . . . . . . . . . . . . . . . . . . . . . . . 102,608 — 102,608Deferred income taxes . . . . . . . . . . . . . . . . . . . . . . . . . . . . . . . . . 5,671 — 5,671Prepaid expenses and other current assets . . . . . . . . . . . . . . . . . . 20,684 — 20,684
Total current assets . . . . . . . . . . . . . . . . . . . . . . . . . . . . . . . . . . . . 251,931 — 251,931Property, plant and equipment, net . . . . . . . . . . . . . . . . . . . . . . . 99,720 — 99,720Goodwill . . . . . . . . . . . . . . . . . . . . . . . . . . . . . . . . . . . . . . . . . . . . 417,977 — 417,977Trademarks and other intangible assets . . . . . . . . . . . . . . . . . . . 61,376 — 61,376Other assets . . . . . . . . . . . . . . . . . . . . . . . . . . . . . . . . . . . . . . . . . . 11,596 — 11,596
Total assets . . . . . . . . . . . . . . . . . . . . . . . . . . . . . . . . . . . . . . . . . . $842,600 — $842,600
LIABILITIES AND STOCKHOLDERS’ EQUITYCurrent liabilities:Accounts payable and accrued expenses . . . . . . . . . . . . . . . . . . . $ 79,805 $ 1,282 $ 81,087Income taxes payable . . . . . . . . . . . . . . . . . . . . . . . . . . . . . . . . . . 11,152 136 11,288Current portion of long-term debt . . . . . . . . . . . . . . . . . . . . . . . . 2,322 — 2,322
Total current liabilities . . . . . . . . . . . . . . . . . . . . . . . . . . . . . . . . . 93,279 1,418 94,697Long-term debt, less current portion . . . . . . . . . . . . . . . . . . . . . . 133,002 — 133,002Deferred income taxes . . . . . . . . . . . . . . . . . . . . . . . . . . . . . . . . . 15,773 (3,333) 12,440
Total liabilities . . . . . . . . . . . . . . . . . . . . . . . . . . . . . . . . . . . . . . . 242,054 (1,915) 240,139Minority interest . . . . . . . . . . . . . . . . . . . . . . . . . . . . . . . . . . . . . . 4,716 — 4,716Commitments and contingenciesStockholders’ equityPreferred stock . . . . . . . . . . . . . . . . . . . . . . . . . . . . . . . . . . . . . . . — — —Common stock . . . . . . . . . . . . . . . . . . . . . . . . . . . . . . . . . . . . . . . 393 — 393Additional paid-in capital . . . . . . . . . . . . . . . . . . . . . . . . . . . . . . . 439,150 13,534 452,684Retained earnings . . . . . . . . . . . . . . . . . . . . . . . . . . . . . . . . . . . . . 156,258 (11,619) 144,639Foreign currency translation adjustment . . . . . . . . . . . . . . . . . . . 12,774 — 12,774
608,575 1,915 610,490Less: treasury stock, at cost . . . . . . . . . . . . . . . . . . . . . . . . . . . . . (12,745) — (12,745)
Total stockholders’ equity . . . . . . . . . . . . . . . . . . . . . . . . . . . . . . 595,830 1,915 597,745
Total liabilities and stockholders’ equity . . . . . . . . . . . . . . . . . . . $842,600 — $842,600
F-62
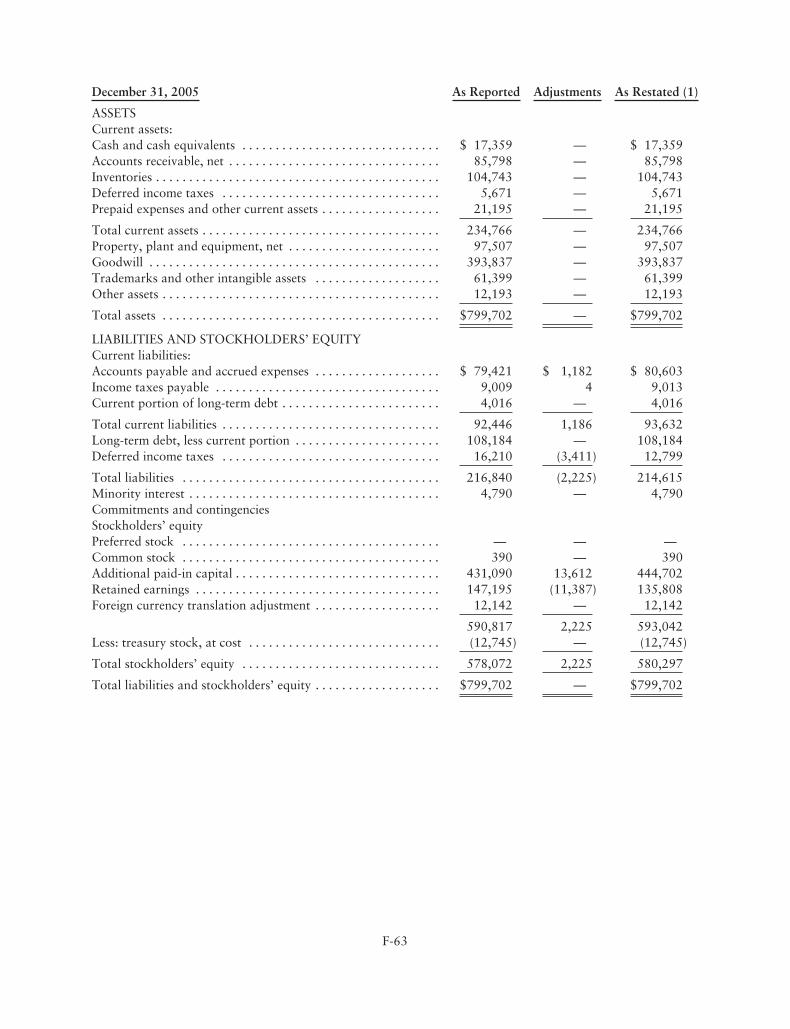
December 31, 2005 As Reported Adjustments As Restated (1)
ASSETSCurrent assets:Cash and cash equivalents . . . . . . . . . . . . . . . . . . . . . . . . . . . . . . $ 17,359 — $ 17,359Accounts receivable, net . . . . . . . . . . . . . . . . . . . . . . . . . . . . . . . . 85,798 — 85,798Inventories . . . . . . . . . . . . . . . . . . . . . . . . . . . . . . . . . . . . . . . . . . . 104,743 — 104,743Deferred income taxes . . . . . . . . . . . . . . . . . . . . . . . . . . . . . . . . . 5,671 — 5,671Prepaid expenses and other current assets . . . . . . . . . . . . . . . . . . 21,195 — 21,195
Total current assets . . . . . . . . . . . . . . . . . . . . . . . . . . . . . . . . . . . . 234,766 — 234,766Property, plant and equipment, net . . . . . . . . . . . . . . . . . . . . . . . 97,507 — 97,507Goodwill . . . . . . . . . . . . . . . . . . . . . . . . . . . . . . . . . . . . . . . . . . . . 393,837 — 393,837Trademarks and other intangible assets . . . . . . . . . . . . . . . . . . . 61,399 — 61,399Other assets . . . . . . . . . . . . . . . . . . . . . . . . . . . . . . . . . . . . . . . . . . 12,193 — 12,193
Total assets . . . . . . . . . . . . . . . . . . . . . . . . . . . . . . . . . . . . . . . . . . $799,702 — $799,702
LIABILITIES AND STOCKHOLDERS’ EQUITYCurrent liabilities:Accounts payable and accrued expenses . . . . . . . . . . . . . . . . . . . $ 79,421 $ 1,182 $ 80,603Income taxes payable . . . . . . . . . . . . . . . . . . . . . . . . . . . . . . . . . . 9,009 4 9,013Current portion of long-term debt . . . . . . . . . . . . . . . . . . . . . . . . 4,016 — 4,016
Total current liabilities . . . . . . . . . . . . . . . . . . . . . . . . . . . . . . . . . 92,446 1,186 93,632Long-term debt, less current portion . . . . . . . . . . . . . . . . . . . . . . 108,184 — 108,184Deferred income taxes . . . . . . . . . . . . . . . . . . . . . . . . . . . . . . . . . 16,210 (3,411) 12,799
Total liabilities . . . . . . . . . . . . . . . . . . . . . . . . . . . . . . . . . . . . . . . 216,840 (2,225) 214,615Minority interest . . . . . . . . . . . . . . . . . . . . . . . . . . . . . . . . . . . . . . 4,790 — 4,790Commitments and contingenciesStockholders’ equityPreferred stock . . . . . . . . . . . . . . . . . . . . . . . . . . . . . . . . . . . . . . . — — —Common stock . . . . . . . . . . . . . . . . . . . . . . . . . . . . . . . . . . . . . . . 390 — 390Additional paid-in capital . . . . . . . . . . . . . . . . . . . . . . . . . . . . . . . 431,090 13,612 444,702Retained earnings . . . . . . . . . . . . . . . . . . . . . . . . . . . . . . . . . . . . . 147,195 (11,387) 135,808Foreign currency translation adjustment . . . . . . . . . . . . . . . . . . . 12,142 — 12,142
590,817 2,225 593,042Less: treasury stock, at cost . . . . . . . . . . . . . . . . . . . . . . . . . . . . . (12,745) — (12,745)
Total stockholders’ equity . . . . . . . . . . . . . . . . . . . . . . . . . . . . . . 578,072 2,225 580,297
Total liabilities and stockholders’ equity . . . . . . . . . . . . . . . . . . . $799,702 — $799,702
F-63
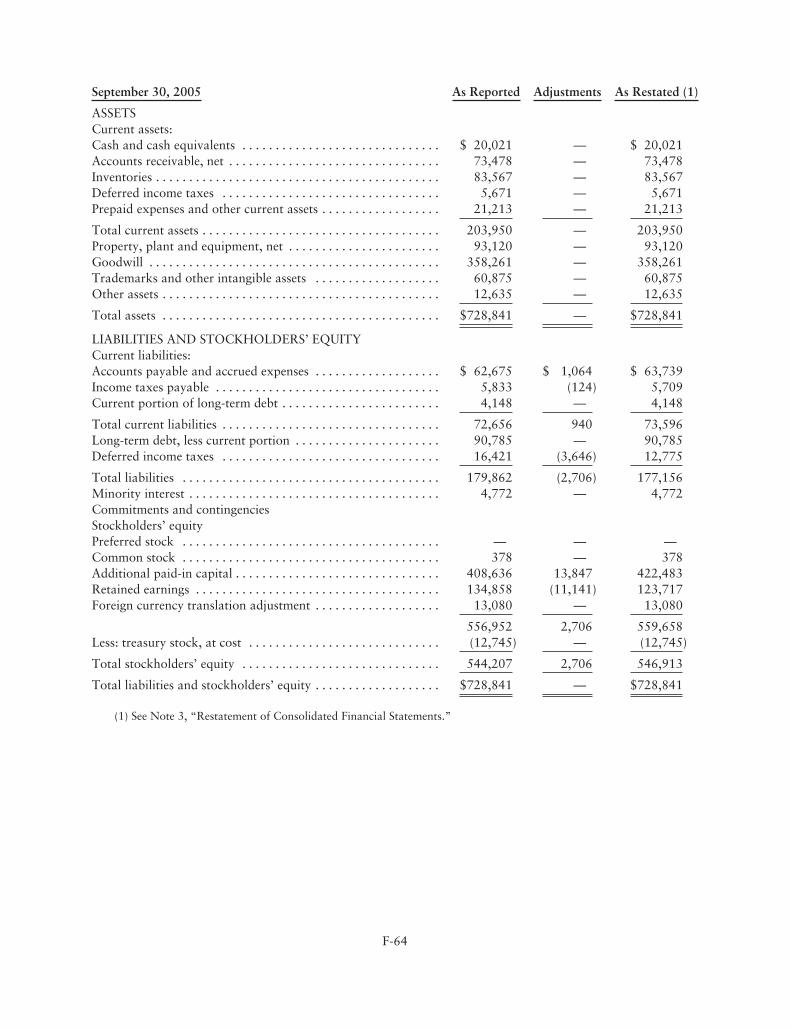
September 30, 2005 As Reported Adjustments As Restated (1)
ASSETSCurrent assets:Cash and cash equivalents . . . . . . . . . . . . . . . . . . . . . . . . . . . . . . $ 20,021 — $ 20,021Accounts receivable, net . . . . . . . . . . . . . . . . . . . . . . . . . . . . . . . . 73,478 — 73,478Inventories . . . . . . . . . . . . . . . . . . . . . . . . . . . . . . . . . . . . . . . . . . . 83,567 — 83,567Deferred income taxes . . . . . . . . . . . . . . . . . . . . . . . . . . . . . . . . . 5,671 — 5,671Prepaid expenses and other current assets . . . . . . . . . . . . . . . . . . 21,213 — 21,213
Total current assets . . . . . . . . . . . . . . . . . . . . . . . . . . . . . . . . . . . . 203,950 — 203,950Property, plant and equipment, net . . . . . . . . . . . . . . . . . . . . . . . 93,120 — 93,120Goodwill . . . . . . . . . . . . . . . . . . . . . . . . . . . . . . . . . . . . . . . . . . . . 358,261 — 358,261Trademarks and other intangible assets . . . . . . . . . . . . . . . . . . . 60,875 — 60,875Other assets . . . . . . . . . . . . . . . . . . . . . . . . . . . . . . . . . . . . . . . . . . 12,635 — 12,635
Total assets . . . . . . . . . . . . . . . . . . . . . . . . . . . . . . . . . . . . . . . . . . $728,841 — $728,841
LIABILITIES AND STOCKHOLDERS’ EQUITYCurrent liabilities:Accounts payable and accrued expenses . . . . . . . . . . . . . . . . . . . $ 62,675 $ 1,064 $ 63,739Income taxes payable . . . . . . . . . . . . . . . . . . . . . . . . . . . . . . . . . . 5,833 (124) 5,709Current portion of long-term debt . . . . . . . . . . . . . . . . . . . . . . . . 4,148 — 4,148
Total current liabilities . . . . . . . . . . . . . . . . . . . . . . . . . . . . . . . . . 72,656 940 73,596Long-term debt, less current portion . . . . . . . . . . . . . . . . . . . . . . 90,785 — 90,785Deferred income taxes . . . . . . . . . . . . . . . . . . . . . . . . . . . . . . . . . 16,421 (3,646) 12,775
Total liabilities . . . . . . . . . . . . . . . . . . . . . . . . . . . . . . . . . . . . . . . 179,862 (2,706) 177,156Minority interest . . . . . . . . . . . . . . . . . . . . . . . . . . . . . . . . . . . . . . 4,772 — 4,772Commitments and contingenciesStockholders’ equityPreferred stock . . . . . . . . . . . . . . . . . . . . . . . . . . . . . . . . . . . . . . . — — —Common stock . . . . . . . . . . . . . . . . . . . . . . . . . . . . . . . . . . . . . . . 378 — 378Additional paid-in capital . . . . . . . . . . . . . . . . . . . . . . . . . . . . . . . 408,636 13,847 422,483Retained earnings . . . . . . . . . . . . . . . . . . . . . . . . . . . . . . . . . . . . . 134,858 (11,141) 123,717Foreign currency translation adjustment . . . . . . . . . . . . . . . . . . . 13,080 — 13,080
556,952 2,706 559,658Less: treasury stock, at cost . . . . . . . . . . . . . . . . . . . . . . . . . . . . . (12,745) — (12,745)
Total stockholders’ equity . . . . . . . . . . . . . . . . . . . . . . . . . . . . . . 544,207 2,706 546,913
Total liabilities and stockholders’ equity . . . . . . . . . . . . . . . . . . . $728,841 — $728,841
(1) See Note 3, “Restatement of Consolidated Financial Statements.”
F-64
Management’s Report on Internal Control overFinancial ReportingManagement, including our Chief Executive Officerand our Chief Financial Officer, is responsible forestablishing and maintaining adequate internalcontrol over financial reporting. The Company’sinternal control system was designed to providereasonable assurance to the Company’s manage-ment and board of directors regarding the prepara-tion and fair presentation of the published financialstatements in accordance with generally acceptedaccounting principles.
Management assessed the effectiveness of ourinternal control over financial reporting as ofJune 30, 2007. In making this assessment, manage-ment used the criteria set forth by the Committee onSponsoring Organizations of the TreadwayCommission (COSO) in Internal Control –Integrated Framework. Based on our assessment, webelieve that, as of June 30, 2007, our internal con-trol over financial reporting is effective based onthose criteria.
Management’s assessment of the effectiveness ofinternal control over financial reporting as ofJune 30, 2007 has been audited by Ernst & YoungLLP, the independent registered public accountingfirm who also audited the Company’s consolidatedfinancial statements. Ernst & Young’s attestationreport on management’s assessment of the Compa-ny’s internal control over financial reporting fol-lows.
Report of Independent Registered PublicAccounting Firm
The Stockholders and Board of Directors ofThe Hain Celestial Group, Inc. and SubsidiariesWe have audited The Hain Celestial Group, Inc.’s(the “Company”) and Subsidiaries internal controlover financial reporting as of June 30, 2007, basedon criteria established in Internal Control –Integrated Framework issued by the Committee ofSponsoring Organizations of the TreadwayCommission (the COSO criteria). The Company’smanagement is responsible for maintaining effectiveinternal control over financial reporting and for itsassessment of the effectiveness of internal controlover financial reporting included in the accompany-ing Management’s Report on Internal Control overFinancial Reporting. Our responsibility is to expressan opinion on the Company’s internal control overfinancial reporting based on our audit.
We conducted our audit in accordance with thestandards of the Public Company Accounting Over-sight Board (United States). Those standards requirethat we plan and perform the audit to obtainreasonable assurance about whether effectiveinternal control over financial reporting was main-tained in all material respects. Our audit included
obtaining an understanding of internal control overfinancial reporting, assessing the risk that a materialweakness exists, testing and evaluating the designand operating effectiveness of internal control basedon the assessed risk, and performing such otherprocedures as we considered necessary in thecircumstances. We believe that our audit provides areasonable basis for our opinion.
A company’s internal control over financial report-ing is a process designed to provide reasonableassurance regarding the reliability of financialreporting and the preparation of financial statementsfor external purposes in accordance with generallyaccepted accounting principles. A company’s internalcontrol over financial reporting includes those poli-cies and procedures that (1) pertain to the main-tenance of records that, in reasonable detail,accurately and fairly reflect the transactions anddispositions of the assets of the company; (2) providereasonable assurance that transactions are recordedas necessary to permit preparation of financialstatements in accordance with generally acceptedaccounting principles, and that receipts andexpenditures of the company are being made only inaccordance with authorizations of management anddirectors of the company; and (3) provide reasonableassurance regarding prevention or timely detection ofunauthorized acquisition, use, or disposition of thecompany’s assets that could have a material effect onthe financial statements.
Because of its inherent limitations, internal controlover financial reporting may not prevent or detectmisstatements. Also, projections of any evaluationof effectiveness to future periods are subject to therisk that controls may become inadequate becauseof changes in conditions, or that the degree ofcompliance with the policies or procedures maydeteriorate.
In our opinion, the Company maintained, in allmaterial respects, effective internal control overfinancial reporting as of June 30, 2007, based onthe COSO criteria.
We also have audited, in accordance with the stan-dards of the Public Company Accounting OversightBoard (United States), the consolidated balancesheets of The Hain Celestial Group, Inc. and Sub-sidiaries as of June 30, 2007 and 2006, and therelated consolidated statements of income, stock-holders’ equity, and cash flows for each of the threeyears in the period ended June 30, 2007 of theCompany and our report dated January 30, 2008expressed an unqualified opinion thereon.
Melville, New YorkJanuary 30, 2008
F-65
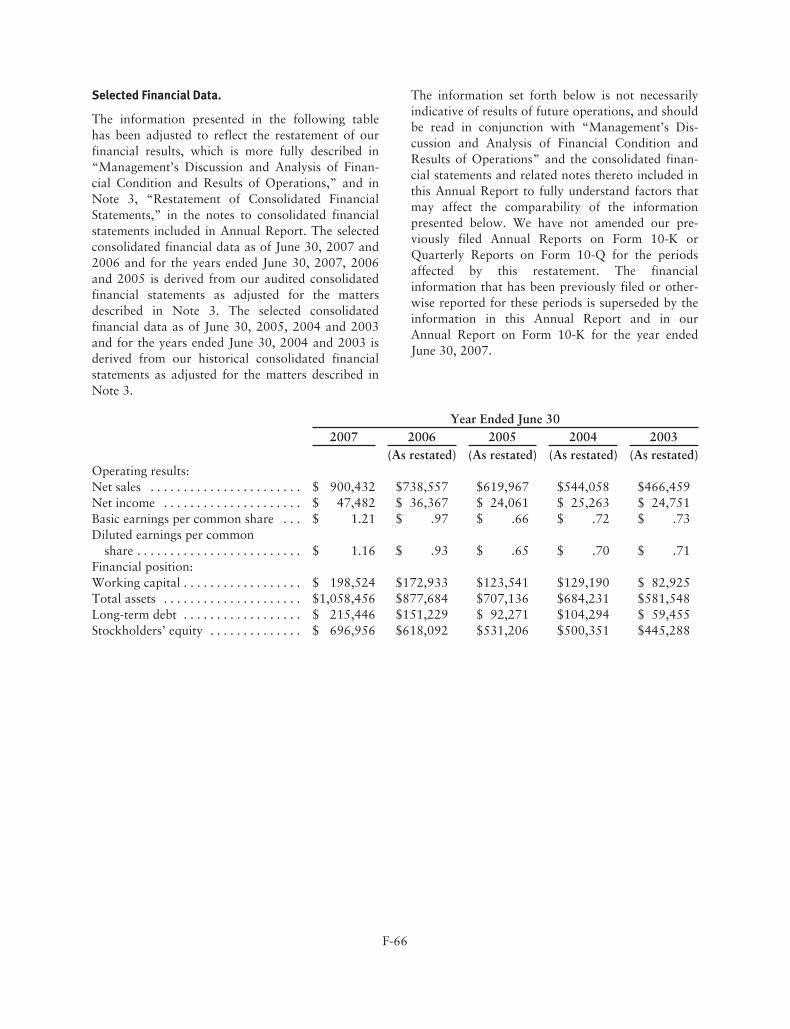
Selected Financial Data.
The information presented in the following tablehas been adjusted to reflect the restatement of ourfinancial results, which is more fully described in“Management’s Discussion and Analysis of Finan-cial Condition and Results of Operations,” and inNote 3, “Restatement of Consolidated FinancialStatements,” in the notes to consolidated financialstatements included in Annual Report. The selectedconsolidated financial data as of June 30, 2007 and2006 and for the years ended June 30, 2007, 2006and 2005 is derived from our audited consolidatedfinancial statements as adjusted for the mattersdescribed in Note 3. The selected consolidatedfinancial data as of June 30, 2005, 2004 and 2003and for the years ended June 30, 2004 and 2003 isderived from our historical consolidated financialstatements as adjusted for the matters described inNote 3.
The information set forth below is not necessarilyindicative of results of future operations, and shouldbe read in conjunction with “Management’s Dis-cussion and Analysis of Financial Condition andResults of Operations” and the consolidated finan-cial statements and related notes thereto included inthis Annual Report to fully understand factors thatmay affect the comparability of the informationpresented below. We have not amended our pre-viously filed Annual Reports on Form 10-K orQuarterly Reports on Form 10-Q for the periodsaffected by this restatement. The financialinformation that has been previously filed or other-wise reported for these periods is superseded by theinformation in this Annual Report and in ourAnnual Report on Form 10-K for the year endedJune 30, 2007.
Year Ended June 302007 2006 2005 2004 2003
(As restated) (As restated) (As restated) (As restated)Operating results:Net sales . . . . . . . . . . . . . . . . . . . . . . . $ 900,432 $738,557 $619,967 $544,058 $466,459Net income . . . . . . . . . . . . . . . . . . . . . $ 47,482 $ 36,367 $ 24,061 $ 25,263 $ 24,751Basic earnings per common share . . . $ 1.21 $ .97 $ .66 $ .72 $ .73Diluted earnings per common
share . . . . . . . . . . . . . . . . . . . . . . . . . $ 1.16 $ .93 $ .65 $ .70 $ .71Financial position:Working capital . . . . . . . . . . . . . . . . . . $ 198,524 $172,933 $123,541 $129,190 $ 82,925Total assets . . . . . . . . . . . . . . . . . . . . . $1,058,456 $877,684 $707,136 $684,231 $581,548Long-term debt . . . . . . . . . . . . . . . . . . $ 215,446 $151,229 $ 92,271 $104,294 $ 59,455Stockholders’ equity . . . . . . . . . . . . . . $ 696,956 $618,092 $531,206 $500,351 $445,288
F-66
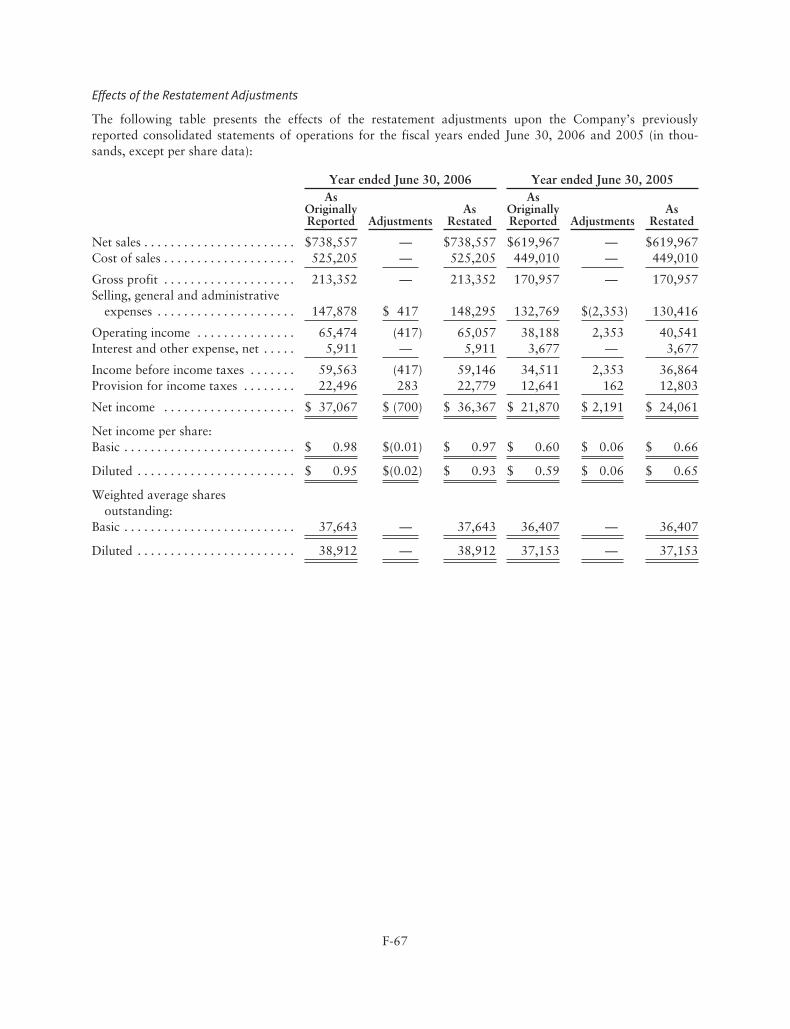
Effects of the Restatement Adjustments
The following table presents the effects of the restatement adjustments upon the Company’s previouslyreported consolidated statements of operations for the fiscal years ended June 30, 2006 and 2005 (in thou-sands, except per share data):
Year ended June 30, 2006 Year ended June 30, 2005As
OriginallyReported Adjustments
AsRestated
AsOriginallyReported Adjustments
AsRestated
Net sales . . . . . . . . . . . . . . . . . . . . . . . $738,557 — $738,557 $619,967 — $619,967Cost of sales . . . . . . . . . . . . . . . . . . . . 525,205 — 525,205 449,010 — 449,010
Gross profit . . . . . . . . . . . . . . . . . . . . 213,352 — 213,352 170,957 — 170,957Selling, general and administrative
expenses . . . . . . . . . . . . . . . . . . . . . 147,878 $ 417 148,295 132,769 $(2,353) 130,416
Operating income . . . . . . . . . . . . . . . 65,474 (417) 65,057 38,188 2,353 40,541Interest and other expense, net . . . . . 5,911 — 5,911 3,677 — 3,677
Income before income taxes . . . . . . . 59,563 (417) 59,146 34,511 2,353 36,864Provision for income taxes . . . . . . . . 22,496 283 22,779 12,641 162 12,803
Net income . . . . . . . . . . . . . . . . . . . . $ 37,067 $ (700) $ 36,367 $ 21,870 $ 2,191 $ 24,061
Net income per share:Basic . . . . . . . . . . . . . . . . . . . . . . . . . . $ 0.98 $(0.01) $ 0.97 $ 0.60 $ 0.06 $ 0.66
Diluted . . . . . . . . . . . . . . . . . . . . . . . . $ 0.95 $(0.02) $ 0.93 $ 0.59 $ 0.06 $ 0.65
Weighted average sharesoutstanding:
Basic . . . . . . . . . . . . . . . . . . . . . . . . . . 37,643 — 37,643 36,407 — 36,407
Diluted . . . . . . . . . . . . . . . . . . . . . . . . 38,912 — 38,912 37,153 — 37,153
F-67
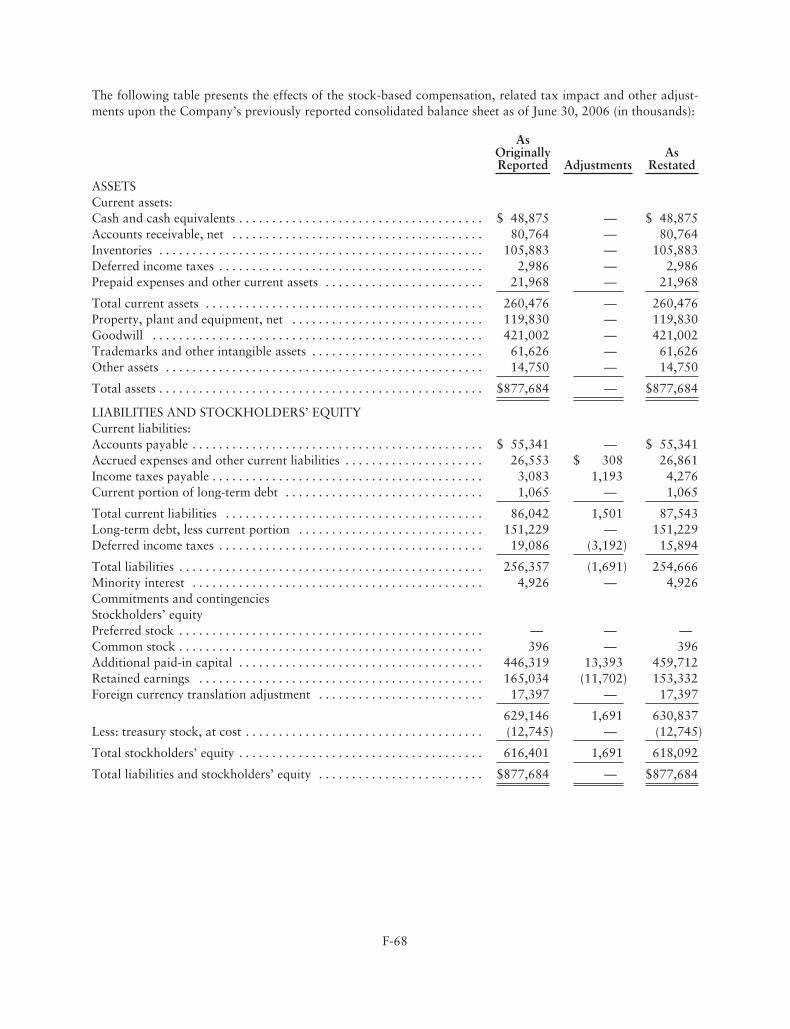
The following table presents the effects of the stock-based compensation, related tax impact and other adjust-ments upon the Company’s previously reported consolidated balance sheet as of June 30, 2006 (in thousands):
AsOriginallyReported Adjustments
AsRestated
ASSETSCurrent assets:Cash and cash equivalents . . . . . . . . . . . . . . . . . . . . . . . . . . . . . . . . . . . . . $ 48,875 — $ 48,875Accounts receivable, net . . . . . . . . . . . . . . . . . . . . . . . . . . . . . . . . . . . . . . 80,764 — 80,764Inventories . . . . . . . . . . . . . . . . . . . . . . . . . . . . . . . . . . . . . . . . . . . . . . . . . 105,883 — 105,883Deferred income taxes . . . . . . . . . . . . . . . . . . . . . . . . . . . . . . . . . . . . . . . . 2,986 — 2,986Prepaid expenses and other current assets . . . . . . . . . . . . . . . . . . . . . . . . 21,968 — 21,968
Total current assets . . . . . . . . . . . . . . . . . . . . . . . . . . . . . . . . . . . . . . . . . . 260,476 — 260,476Property, plant and equipment, net . . . . . . . . . . . . . . . . . . . . . . . . . . . . . 119,830 — 119,830Goodwill . . . . . . . . . . . . . . . . . . . . . . . . . . . . . . . . . . . . . . . . . . . . . . . . . . 421,002 — 421,002Trademarks and other intangible assets . . . . . . . . . . . . . . . . . . . . . . . . . . 61,626 — 61,626Other assets . . . . . . . . . . . . . . . . . . . . . . . . . . . . . . . . . . . . . . . . . . . . . . . . 14,750 — 14,750
Total assets . . . . . . . . . . . . . . . . . . . . . . . . . . . . . . . . . . . . . . . . . . . . . . . . . $877,684 — $877,684
LIABILITIES AND STOCKHOLDERS’ EQUITYCurrent liabilities:Accounts payable . . . . . . . . . . . . . . . . . . . . . . . . . . . . . . . . . . . . . . . . . . . . $ 55,341 — $ 55,341Accrued expenses and other current liabilities . . . . . . . . . . . . . . . . . . . . . 26,553 $ 308 26,861Income taxes payable . . . . . . . . . . . . . . . . . . . . . . . . . . . . . . . . . . . . . . . . . 3,083 1,193 4,276Current portion of long-term debt . . . . . . . . . . . . . . . . . . . . . . . . . . . . . . 1,065 — 1,065
Total current liabilities . . . . . . . . . . . . . . . . . . . . . . . . . . . . . . . . . . . . . . . 86,042 1,501 87,543Long-term debt, less current portion . . . . . . . . . . . . . . . . . . . . . . . . . . . . 151,229 — 151,229Deferred income taxes . . . . . . . . . . . . . . . . . . . . . . . . . . . . . . . . . . . . . . . . 19,086 (3,192) 15,894
Total liabilities . . . . . . . . . . . . . . . . . . . . . . . . . . . . . . . . . . . . . . . . . . . . . . 256,357 (1,691) 254,666Minority interest . . . . . . . . . . . . . . . . . . . . . . . . . . . . . . . . . . . . . . . . . . . . 4,926 — 4,926Commitments and contingenciesStockholders’ equityPreferred stock . . . . . . . . . . . . . . . . . . . . . . . . . . . . . . . . . . . . . . . . . . . . . . — — —Common stock . . . . . . . . . . . . . . . . . . . . . . . . . . . . . . . . . . . . . . . . . . . . . . 396 — 396Additional paid-in capital . . . . . . . . . . . . . . . . . . . . . . . . . . . . . . . . . . . . . 446,319 13,393 459,712Retained earnings . . . . . . . . . . . . . . . . . . . . . . . . . . . . . . . . . . . . . . . . . . . 165,034 (11,702) 153,332Foreign currency translation adjustment . . . . . . . . . . . . . . . . . . . . . . . . . 17,397 — 17,397
629,146 1,691 630,837Less: treasury stock, at cost . . . . . . . . . . . . . . . . . . . . . . . . . . . . . . . . . . . . (12,745) — (12,745)
Total stockholders’ equity . . . . . . . . . . . . . . . . . . . . . . . . . . . . . . . . . . . . . 616,401 1,691 618,092
Total liabilities and stockholders’ equity . . . . . . . . . . . . . . . . . . . . . . . . . $877,684 — $877,684
F-68
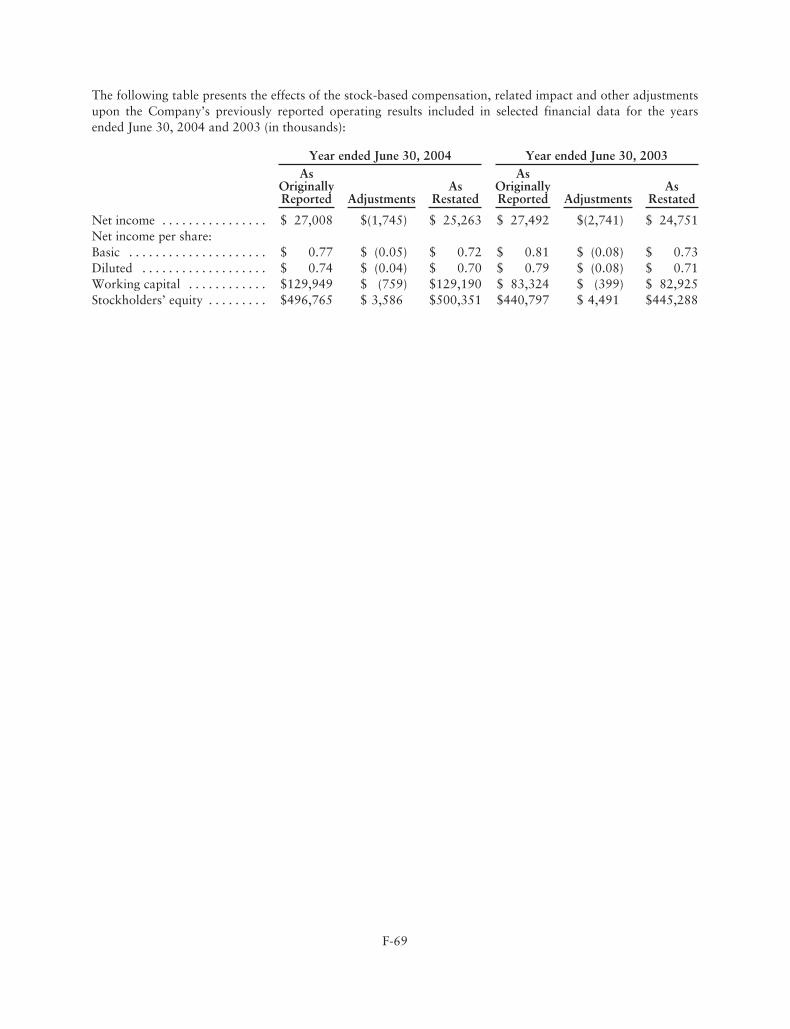
The following table presents the effects of the stock-based compensation, related impact and other adjustmentsupon the Company’s previously reported operating results included in selected financial data for the yearsended June 30, 2004 and 2003 (in thousands):
Year ended June 30, 2004 Year ended June 30, 2003As
OriginallyReported Adjustments
AsRestated
AsOriginallyReported Adjustments
AsRestated
Net income . . . . . . . . . . . . . . . . $ 27,008 $(1,745) $ 25,263 $ 27,492 $(2,741) $ 24,751Net income per share:Basic . . . . . . . . . . . . . . . . . . . . . $ 0.77 $ (0.05) $ 0.72 $ 0.81 $ (0.08) $ 0.73Diluted . . . . . . . . . . . . . . . . . . . $ 0.74 $ (0.04) $ 0.70 $ 0.79 $ (0.08) $ 0.71Working capital . . . . . . . . . . . . $129,949 $ (759) $129,190 $ 83,324 $ (399) $ 82,925Stockholders’ equity . . . . . . . . . $496,765 $ 3,586 $500,351 $440,797 $ 4,491 $445,288
F-69
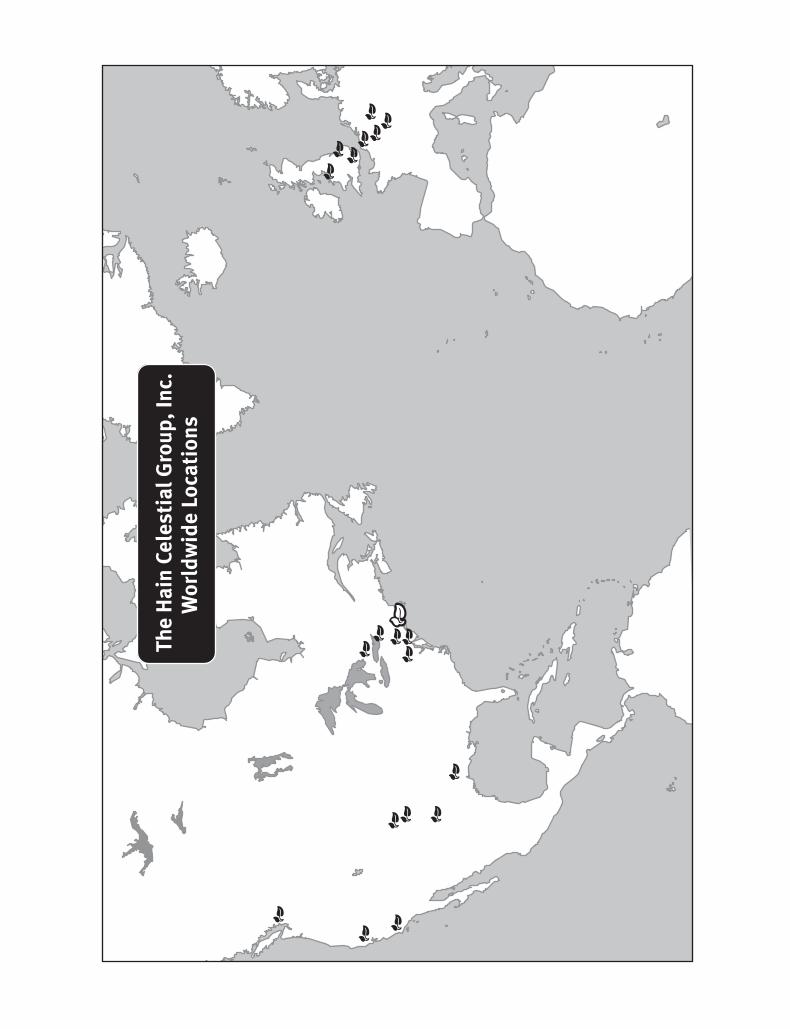
The
Hai
n Ce
lest
ial G
roup
, Inc
.W
orld
wid
e Lo
cati
ons
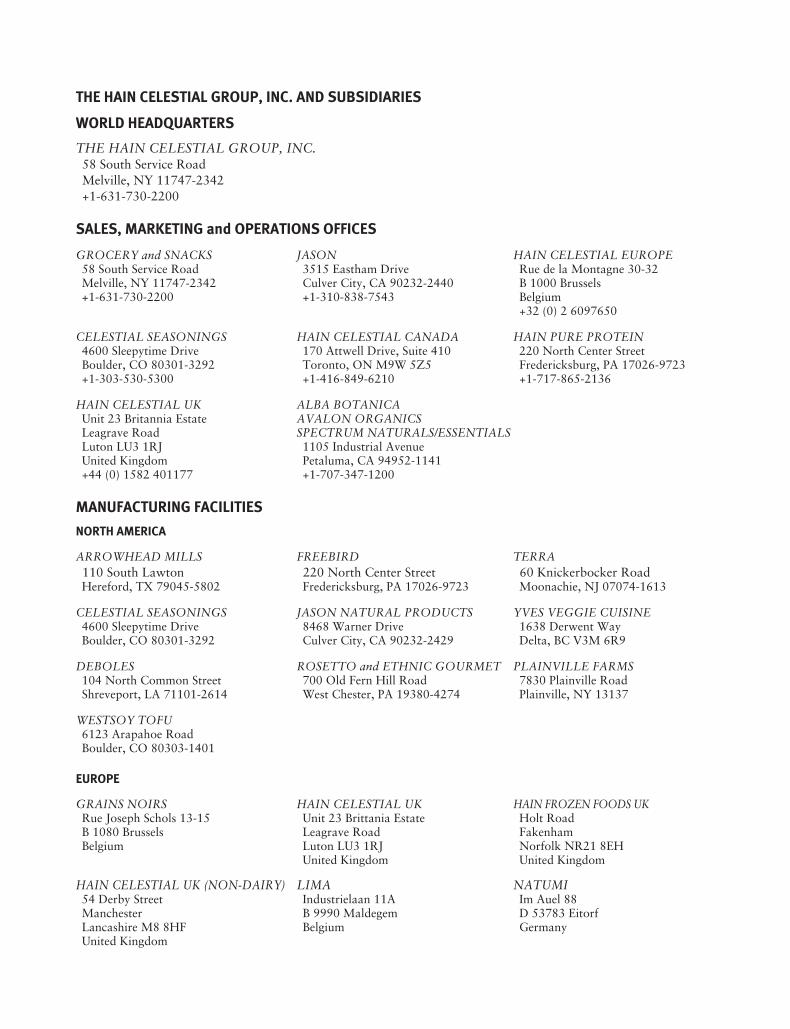
THE HAIN CELESTIAL GROUP, INC. AND SUBSIDIARIES
WORLD HEADQUARTERS
THE HAIN CELESTIAL GROUP, INC.58 South Service RoadMelville, NY 11747-2342+1-631-730-2200
SALES, MARKETING and OPERATIONS OFFICES
GROCERY and SNACKS JASON HAIN CELESTIAL EUROPE58 South Service Road 3515 Eastham Drive Rue de la Montagne 30-32Melville, NY 11747-2342 Culver City, CA 90232-2440 B 1000 Brussels+1-631-730-2200 +1-310-838-7543 Belgium
+32 (0) 2 6097650
CELESTIAL SEASONINGS HAIN CELESTIAL CANADA HAIN PURE PROTEIN4600 Sleepytime Drive 170 Attwell Drive, Suite 410 220 North Center StreetBoulder, CO 80301-3292 Toronto, ON M9W 5Z5 Fredericksburg, PA 17026-9723+1-303-530-5300 +1-416-849-6210 +1-717-865-2136
HAIN CELESTIAL UK ALBA BOTANICAUnit 23 Britannia Estate AVALON ORGANICSLeagrave Road SPECTRUM NATURALS/ESSENTIALSLuton LU3 1RJ 1105 Industrial AvenueUnited Kingdom Petaluma, CA 94952-1141+44 (0) 1582 401177 +1-707-347-1200
MANUFACTURING FACILITIES
NORTH AMERICA
ARROWHEAD MILLS FREEBIRD TERRA110 South Lawton 220 North Center Street 60 Knickerbocker RoadHereford, TX 79045-5802 Fredericksburg, PA 17026-9723 Moonachie, NJ 07074-1613
CELESTIAL SEASONINGS JASON NATURAL PRODUCTS YVES VEGGIE CUISINE4600 Sleepytime Drive 8468 Warner Drive 1638 Derwent WayBoulder, CO 80301-3292 Culver City, CA 90232-2429 Delta, BC V3M 6R9
DEBOLES ROSETTO and ETHNIC GOURMET PLAINVILLE FARMS104 North Common Street 700 Old Fern Hill Road 7830 Plainville RoadShreveport, LA 71101-2614 West Chester, PA 19380-4274 Plainville, NY 13137
WESTSOY TOFU6123 Arapahoe RoadBoulder, CO 80303-1401
EUROPE
GRAINS NOIRS HAIN CELESTIAL UK HAIN FROZEN FOODS UKRue Joseph Schols 13-15 Unit 23 Brittania Estate Holt RoadB 1080 Brussels Leagrave Road FakenhamBelgium Luton LU3 1RJ Norfolk NR21 8EH
United Kingdom United Kingdom
HAIN CELESTIAL UK (NON-DAIRY) LIMA NATUMI54 Derby Street Industrielaan 11A Im Auel 88Manchester B 9990 Maldegem D 53783 EitorfLancashire M8 8HF Belgium GermanyUnited Kingdom
CORPORATE DATA
The Hain Celestial Group, Inc.The Hain Celestial Group, headquartered inMelville, NY, is a leading natural and organicbeverage, snack, specialty food and personal careproducts company in North America and Europe.Hain Celestial is a leader in almost all natural foodcategories—Beverages, Specialty Tea, Snacks, Gro-cery, Frozen Foods—and the natural Personal Carecategory with well-known brands that include:Celestial Seasonings®, Terra®, Garden of Eatin’®,Health Valley®, WestSoy®, Earth’s Best®, Arrow-head Mills®, DeBoles®, Hain Pure Foods®, Free-Bird™, Plainville Farms®, Hollywood®, SpectrumNaturals®, Spectrum Essentials®, Walnut AcresOrganic®, Westbrae Natural®, Imagine®, RiceDream®, Soy Dream®, Rosetto®, Ethnic Gourmet®,Casbah®, Nile Spice®, Yves Veggie Cuisine®, Gran-ose®, Realeat®, Linda McCartney®, Lima®, Natu-mi®, JASON®, Zia® Natural Skincare, AvalonOrganics®, Alba Botanica®, Queen Helene®, Tush-ies®, and TenderCare®. The Company’s principalspecialty product lines include Estee® sugar-freeproducts and Alba®.
Annual MeetingThe 2007 Annual Meeting of Shareholders will beheld at 11:00 AM on Tuesday, April 1, 2008, in theAmphitheater at the Hain Celestial Group World-wide Headquarters at 58 South Service Road,Melville, NY 11747.
Investor RelationsSecurities analysts and investors seeking moreinformation about the Company should direct theirinquiries to Mary Celeste Anthes in the InvestorRelations Department. Investors may obtain, at nocharge, a copy of Hain Celestial’s 2007 report to theSecurities and Exchange Commission on Form 10-Kat www.hain-celestial.com or by contacting InvestorRelations.Telephone: 631-730-2460Email: [email protected]
Media RelationsMembers of the media seeking more informationabout the Company should direct their inquiries tothe Media Relations Department.Telephone: 631-730-2200Email: [email protected]
Consumer RelationsConsumers seeking more information about ourproducts should direct their inquiries to theConsumer Relations Department.Telephone: 800-434-HAIN (4246)Email: [email protected]
Human ResourcesThe Hain Celestial Group provides employment forapproximately 2,200 people full time, plus otherson a part-time basis during seasonal periods. Formore information about career opportunities withthe Company, please visit www.hain-celestial.com/careers.
Equal Employment OpportunityThe Hain Celestial Group hires, trains, promotes,and compensates employees and makes all otheremployment decisions, without regard to race, col-or, sex, age, religion, national origin, disability orother protected conditions or characteristics. Wehave affirmative action programs in place at alldomestic locations to ensure equal opportunity forevery employee.
Transfer Agent & RegistrarContinental Stock Transfer & Trust Co.17 Battery PlaceNew York, NY 10004212-509-4000
Independent Registered Public Accounting FirmErnst & Young LLP395 North Service RoadMelville, NY 11747
CounselDLA Piper US LLP1251 Avenue of the AmericasNew York, NY 10020-1104
Common StockNASDAQ® Global Select MarketTicker symbol: HAIN
WebsitesAn overview of the Company, as well asinformation about our brands and products, isavailable at our corporate websites:United States: www.hain-celestial.comCanada: www.hain-celestial.caUnited Kingdom: www.hain-celestial.co.ukEuropean Union: www.hain-celestial.eu
To learn more about our brands and products, or to find a store near you that carries our products, visit ourwebsite at www.hain-celestial.com or call Consumer Relations at 800-434-HAIN (4246).
Years Ended June 30
(dollars in thousands, except per share amounts) 2007 2006(1) 2005(2)
Net sales $ 900,432 $ 738,557 $ 619,967
Operating income 83,977 69,195 57,334
Net income 47,482 38,891 35,307
Net income per share — diluted $ 1.16 $ 1.00 $ 0.95
Capital expenditures $ 11,411 $ 14,479 $ 9,890
Depreciation and amortization 15,692 12,549 13,838
Property, plant and equipment, net 114,901 119,830 88,204
Working capital $ 198,524 $ 172,933 $ 123,541
Long-term debt 215,446 151,229 92,271
Stockholders’ equity 696,956 618,092 531,206
Average shares outstanding — diluted 41,108 38,912 37,153
Current ratio 2.7 3.0 2.7
Debt/equity 30.9% 24.5% 17.4%
Stockholders’ equity per share — end of year $ 17.41 $ 15.96 $ 14.51
(1) As restated, see Notes to Consolidated Financial Statements. Operating results adjusted to exclude the effect of $3.2 million ($2.0 million net of tax), or $.05 per share, of charges to record compensation on a contractual obligation to grant stock options, whether or not such options have been granted, and an additional $0.9 million ($0.6 million net of tax), or $.02 per share, for the completion of the 2005 SKU Rationalization Program.
(2) As restated, see Notes to Consolidated Financial Statements. Operating results adjusted to exclude the effect of $16.7 million ($11.2 million net of tax), or $0.30 per share, of charges for the 2005 SKU Rationalization Program and non-cash compensation.
2005
Net Sales(dollars in millions)
Operating Income(dollars in millions)
Net Income(dollars in millions)
2006 2007 2005 (2) 2006 (1) 2007
$35.3
$38.9
$47.5
$57.3
$69.2
$84.0
$620.0
$738.6
$900.4
Financial Highlights
2005 (2) 2006 (1) 2007
IRWIN D. SIMON President, Chief Executive Officer and Chairman of the Board
BARRY J. ALPERIN 1, 2
Consultant Retired Vice Chairman Hasbro, Inc.
RICHARD C. BERKE Vice President, Human Resources Broadridge Financial Solutions, Inc.
BETH L. BRONNER 3
Managing Director Mistral Equity Partners
JACK FUTTERMAN 2
Retired Chairman and Chief Executive Officer
Pathmark Stores, Inc.
DANIEL R. GLICKMAN 2
Chairman and Chief Executive Officer
Motion Picture Association of America, Inc.
Former U.S. Secretary of Agriculture
MARINA HAHN 3
Chief Marketing Officer Spirits Marque One LLC
ANDREW R. HEYER 2, 3
Founder Mistral Equity Partners
ROGER MELTZER Partner DLA Piper US LLP
MITCHELL A. RING 4
Senior Vice President—Business Development
H.J. Heinz Company
LEWIS D. SCHILIRO 1
Managing Partner Freeh Group International
LAWRENCE S. ZILAVY 1
Senior Vice President Barnes & Noble College Booksellers, Inc.
Board of Directors
Senior ManagementIRWIN D. SIMON President, Chief Executive Officer and Chairman of the Board
IRA J. LAMEL Executive Vice President,
Chief Financial Officer, Treasurer and Secretary
JOHN CARROLL Executive Vice President, President—Grocery and Snacks, and Personal Care
GERALD F. AMANTEA, Ph.D. Vice President— Technical Services
MARY CELESTE ANTHES Vice President— Investor Relations
DAVID ARROW Managing Director— Hain Celestial UK
BENJAMIN BRECHER Senior Vice President—
Special Projects
JOSEPH A. DEPIPPO President— Hain Pure Protein
ELLEN B. DEUTSCH Senior Vice President and
Chief Growth Officer
BEENA G. GOLDENBERG General Manager—
Hain Celestial Canada
ADAM S. LEVIT Chief Sales Officer— Grocery and Snacks
JAY LIEBERMAN Vice President— Financial Planning and Analysis
JAMES R. MEIERS Chief Supply Chain Officer— Grocery and Personal Care
LINDA D. PIACENTINI Vice President— Human Resources
MAUREEN M. PUTMAN Chief Marketing Officer—
Grocery and Snacks JAMES C. REED President— Plainville Farms
MICHAEL J. SPEILLER Vice President— Finance
PHILIPPE WOITRIN Chief Executive Officer—
Hain Celestial Europe
DAVID ZIEGERT Acting General Manager—
Celestial Seasonings
Directors and Senior Management
1 Member of the Audit Committee2 Member of the Corporate Governance and Nominating Committee3 Member of the Compensation Committee4 Not standing for re-election
63715_Cover.indd 263715_Cover.indd 2 2/23/08 7:14:46 PM2/23/08 7:14:46 PM

2007 ANNUAL REPORT
The Hain Celestial Group, Inc.58 South Service Road Melville, NY 11747+1-631-730-2200www.hain-celestial.com
Linda McCartney® is a registered trademark of Linda Enterprises Limited. NASDAQ® is a registered trademark of The NASDAQ Stock Market, Inc. Healthy Habits for Life™, Sesame Workshop®, Sesame Street® and associated characters, trademarks and design elements are owned and licensed by Sesame Workshop. ©2008 Sesame Workshop. Fair Trade Certified™ is a trademark of TransFair USA, Inc.
©2008 The Hain Celestial Group, Inc. All Rights Reserved. Product or brand names used in this annual report may be trademarks or registered trademarks of The Hain Celestial Group, Inc.
We are committed to growing
our Company while continuing
to implement environmentally
sound business practices and
manufacturing processes.
Printed on 10% post-consumer fi ber paper.
All paper manufactured alcohol-free.
100%
Cert no. SW-COC-1516
63715_Cover.indd 163715_Cover.indd 1 2/23/08 9:07:34 PM2/23/08 9:07:34 PM