a new seamless, high-resolution digital elevation …. department of the interior u.s. geological...
TRANSCRIPT
U.S. Department of the Interior U.S. Geological Survey
A New Seamless, High-Resolution Digital Elevation Model of the San Francisco Bay-Delta Estuary, California
Open-File Report 2017–1067

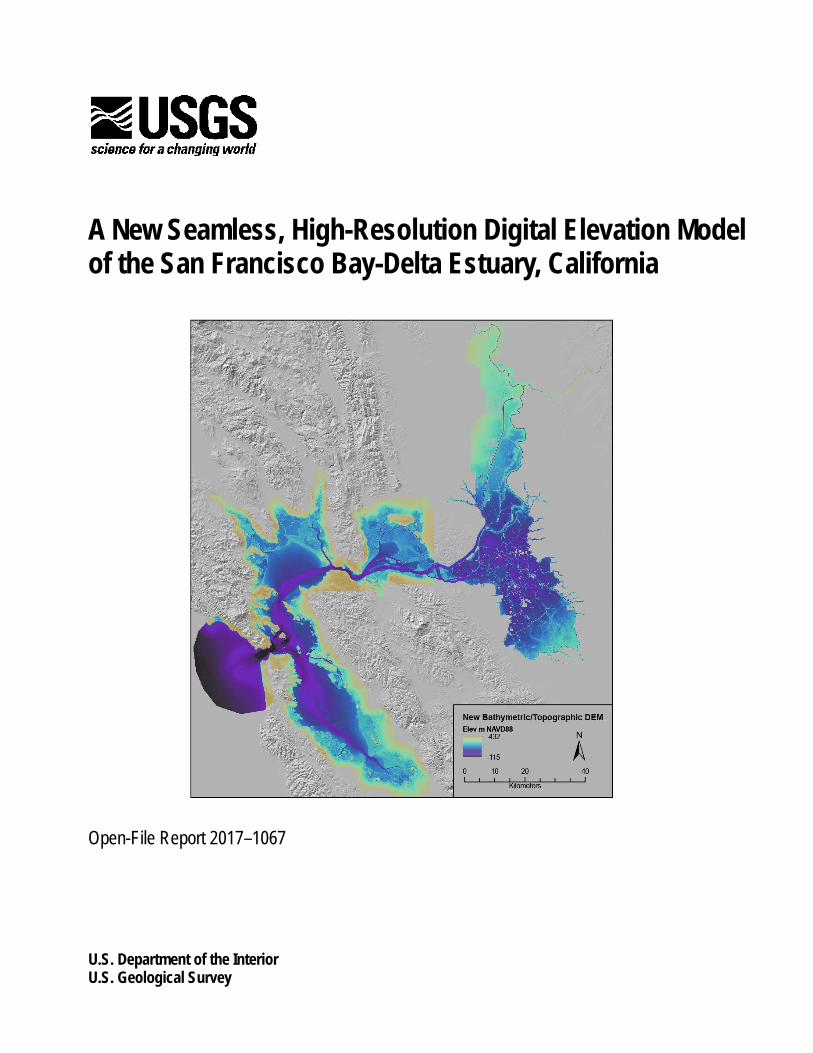
Cover. Map of the San Francisco Bay-Delta, California, showing the final U.S. Geological Survey bathymetric/topographic digital elevation model (DEM) for the Delta.
A New Seamless, High-Resolution Digital Elevation Model of the San Francisco Bay-Delta Estuary, California
By Theresa A. Fregoso, Rueen-Fang Wang, Eli S. Ateljevich, and Bruce E. Jaffe
Open-File Report 2017–1067
U.S. Department of the Interior U.S. Geological Survey
U.S. Department of the Interior RYAN K. ZINKE, Secretary
U.S. Geological Survey William H. Werkheiser, Acting Director
U.S. Geological Survey, Reston, Virginia: 2017
For more information on the USGS—the Federal source for science about the Earth, its natural and living resources, natural hazards, and the environment—visit https://www.usgs.gov/ or call 1–888–ASK–USGS (1–888–275–8747).
For an overview of USGS information products, including maps, imagery, and publications, visit https://store.usgs.gov.
Any use of trade, firm, or product names is for descriptive purposes only and does not imply endorsement by the U.S. Government.
Although this information product, for the most part, is in the public domain, it also may contain copyrighted materials as noted in the text. Permission to reproduce copyrighted items must be secured from the copyright owner.
Suggested citation: Fregoso, T.A., Wang, R-F. T., Ateljevich, E.S., and Jaffe, B.E., 2017, A new seamless, high-resolution digital elevation model of the San Francisco Bay-Delta Estuary, California: U.S. Geological Survey Open-File Report 2017–1067, 27 p., https://doi.org/10.3133/ofr20171067.
ISSN 2331-1258 (online)
iii
Acknowledgments The work in this report would not have been possible without the input of many people from the
California State Department of Water Resources (DWR), the U.S. Geological Survey (USGS), and the United Nations Educational, Scientific and Cultural Organization-Institute for Hydraulic and Environmental Engineering (UNESCO-IHE) in the Netherlands. We would like to make special mention of the contributions of Joel Dudas from DWR who originally shared with us lidar data for the Sacramento-San Joaquin portion of the Delta and connected the USGS and DWR together in this collaborative effort. We also want to thank Shawn Mayr of DWR and his group who conducted bathymetric surveys for DWR and willingly shared data.
USGS collaborators were many in this report; key players were Noah Knowles and Lisa Lucas who head the USGS Computational Assessments of Scenarios of Change for the Delta Ecosystem (CASCaDE) II project and provided guidance and opinions on the final product. Justin Minear was very helpful in tracking down data and making it available for use. Amy Foxgrover, who produced the original digital elevation model (DEM) for the Delta, provided valuable insights into her gridding methodology. The work of John Burau, Pete Smith, Randal Dinehart, Brent Lunghino, and Lisa Lucas was instrumental in creating the bathymetric surface for Mildred Island. We also want to thank the members of the modeling team, whose input drove the shaping of the DEM—Mick van der Wegen and Fernanda Minikowski-Achete from UNESCO-IHE, and Rosanne Martyr from the University of California San Diego. This report was improved by the careful reviews and insights of Dan Hoover and Bernard McNamara of the USGS
iv
Contents Acknowledgments .......................................................................................................................................... iii Abstract ......................................................................................................................................................... 1 Introduction .................................................................................................................................................... 1 Creation of the Seamless DEM ...................................................................................................................... 4
Phase 1 ...................................................................................................................................................... 4 Evaluating the 2005 USGS Bathymetric DEM for Areas in Need of Updating ........................................ 4 Bathymetry Update ................................................................................................................................. 7 Shoreline Update .................................................................................................................................... 7
Phase 2 ...................................................................................................................................................... 9 New Data Sources and Map Products .................................................................................................... 9 Creating an Integrated USGS/DWR Seamless Bathymetric/Topographic DEM for the San Francisco Bay-Delta Estuary, California. .............................................................................................................. 13
2004 Surveys of the San Joaquin and Sacramento Rivers done for USACE ................................... 13 Mildred Island ................................................................................................................................... 14 Incorporating the USGS EROS 2-Meter Seamless Bathymetric/Topographic Product ..................... 18 Eliminating Inland Topography ......................................................................................................... 20
Phase 2 DEM ....................................................................................................................................... 20 Phase 3 .................................................................................................................................................... 20
Extending the Sacramento River Bathymetry and Including the Yolo Bypass .................................. 23 Extending the American River .......................................................................................................... 23
Restoring Island Elevations for the Interior Delta ................................................................................. 23 The New High-Resolution DEM of the San Francisco Bay-Delta ................................................................. 24 Improvements for the Future........................................................................................................................ 25 Data ............................................................................................................................................................. 25 References Cited ......................................................................................................................................... 25
Figures Figure 1. Locator map showing study area discussed in this report, the San Francisco Bay – Delta Estuary, California ............................................................................................................................................................... 2 Figure 2. Map showing areas covered by the 2005 U.S. Geological Survey (USGS) 10-meter bathymetric digital elevation model (DEM). ............................................................................................................................................. 3 Figure 3. Map of Suisun Bay and the Sacramento-San Joaquin Delta, California, showing depth soundings (by year) that were used to create the 2005 U.S. Geological Survey bathymetric digital elevation model (DEM). .......... 5 Figure 4. Map of Suisun Bay and the Sacramento-San Joaquin Delta, California, showing (1) areas of older bathymetric surveys where depth soundings were collected from 1933 to 1977 and (2) significant areas with no bathymetric data in the 2005 U.S. Geological Survey 10-meter bathymetric digital elevation model (DEM). ............ 6 Figure 5. Map showing the 10-meter bathymetric digital elevation model (DEM) resulting from phase 1 activities to update the 2005 U.S. Geological Survey DEM for Suisun Bay and the Sacramento-San Joaquin Delta, California. ............................................................................................................................................................... 8 Figure 6. Map of the Sacramento-San Joaquin Delta, California, showing newer (2005 and later) bathymetric datasets acquired by the California Department of Water Resources (DWR).. ........................................................ 10 Figure 7. Map showing the 2012 California Department of Water Resources (DWR) seamless 10-meter bathymetric/topographic digital elevation model (DEM) of the San Francisco Bay Delta estuary, California. .......... 11
v
Figure 8. Map showing the 2013 U.S. Geological Survey Earth Resources Observation and Science Center (EROS) 2-meter seamless bathymetric/topographic digital elevation model (DEM) for the San Francisco Bay region (U.S. Geological Survey, 2013). .............................................................................................................................. 12 Figure 9. Map of the Sacramento-San Joaquin Delta, California, showing areas where data from a 2004 survey done for U.S. Army Corps of Engineers (USACE) (Sea Surveyor, Inc./Bestor Engineers, Inc., 2005) was reinterpolated by the U.S. Geological Survey. ......................................................................................................... 14 Figure 10. Map showing Mildred Island in the Sacramento-San Joaquin Delta, California. Depth soundings made by the U.S. Geological Survey (USGS) in 2001. ...................................................................................................... 15 Figure 11. Map of Mildred Island in the Sacramento-San Joaquin Delta, California. Showing data used by the U.S. Geological Survey (USGS) to create an updated Mildred Island digital elevation model (DEM). ..................... 17 Figure 12. Map showing the updated digital elevation model (DEM) for flooded Mildred Island in the Sacramento-San Joaquin Delta, California. ................................................................................................................................. 18 Figure 13. Map showing where data from the 2013 U.S. Geological Survey (USGS) Earth Resources Observation and Science Center (EROS) 2-meter bathymetric/topographic digital elevation model (DEM) for the San Francisco Bay region was used in phase 2 of creating a new DEM for the Bay-Delta. .................................... 19 Figure 14. Map of the San Francisco Bay Delta, California, showing the completed U.S. Geological Survey phase 2 bathymetric/topographic digital elevation model (DEM) for the Delta. ........................................................ 21 Figure 15. Map of the northern Sacramento-San Joaquin Delta, California, showing extents of data from California Department of Water Resources (DWR), the United States Geological Survey (USGS), and the United States Army Corp of Engineers (USACE), for the phase 3 expansion of the digital elevation model (DEM). ......... 22 Figure 16. Map of the San Francisco Bay-Delta, California, showing the final U.S. Geological Survey phase 3 bathymetric/topographic digital elevation model (DEM) for the Delta. ..................................................................... 24
vi
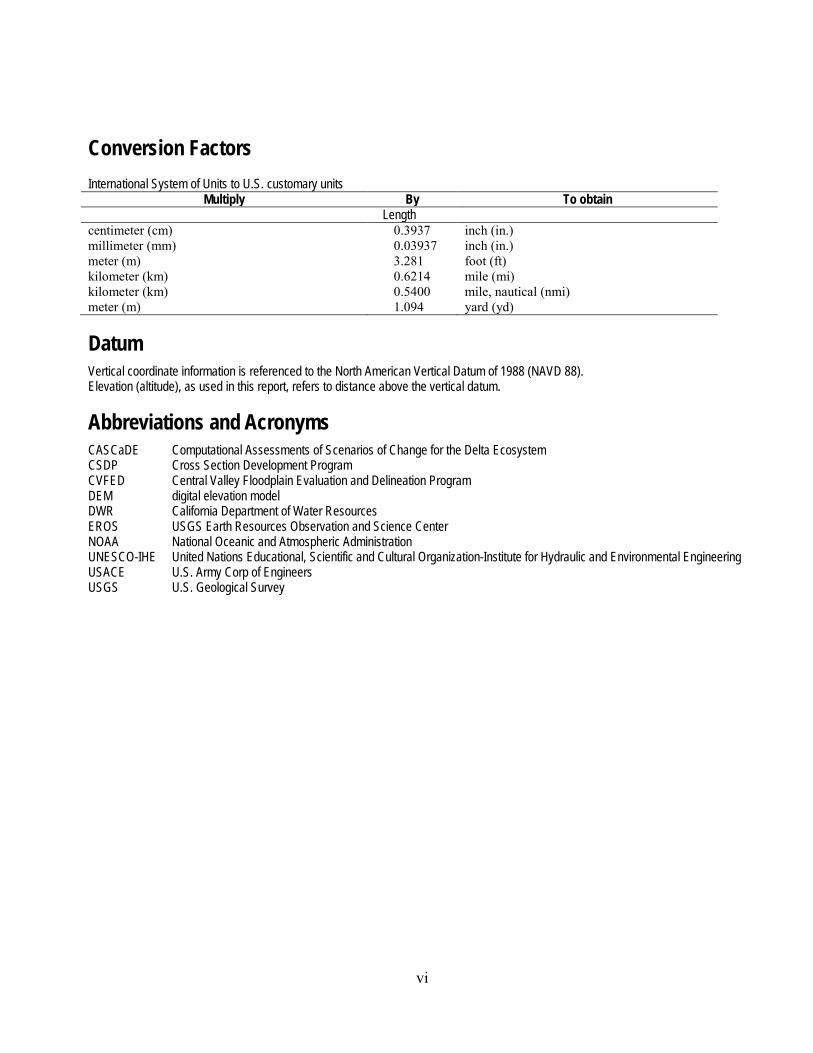
Conversion Factors International System of Units to U.S. customary units
Multiply By To obtain Length
centimeter (cm) 0.3937 inch (in.) millimeter (mm) 0.03937 inch (in.) meter (m) 3.281 foot (ft) kilometer (km) 0.6214 mile (mi) kilometer (km) 0.5400 mile, nautical (nmi) meter (m) 1.094 yard (yd)
Datum Vertical coordinate information is referenced to the North American Vertical Datum of 1988 (NAVD 88). Elevation (altitude), as used in this report, refers to distance above the vertical datum.
Abbreviations and Acronyms CASCaDE Computational Assessments of Scenarios of Change for the Delta Ecosystem CSDP Cross Section Development Program CVFED Central Valley Floodplain Evaluation and Delineation Program DEM digital elevation model DWR California Department of Water Resources EROS USGS Earth Resources Observation and Science Center NOAA National Oceanic and Atmospheric Administration UNESCO-IHE United Nations Educational, Scientific and Cultural Organization-Institute for Hydraulic and Environmental Engineering USACE U.S. Army Corp of Engineers USGS U.S. Geological Survey
A New Seamless, High-Resolution Digital Elevation Model of the San Francisco Bay-Delta Estuary, California
By Theresa A. Fregoso,1 Rueen-Fang T. Wang,2 Eli S. Ateljevich,2 and Bruce E. Jaffe1
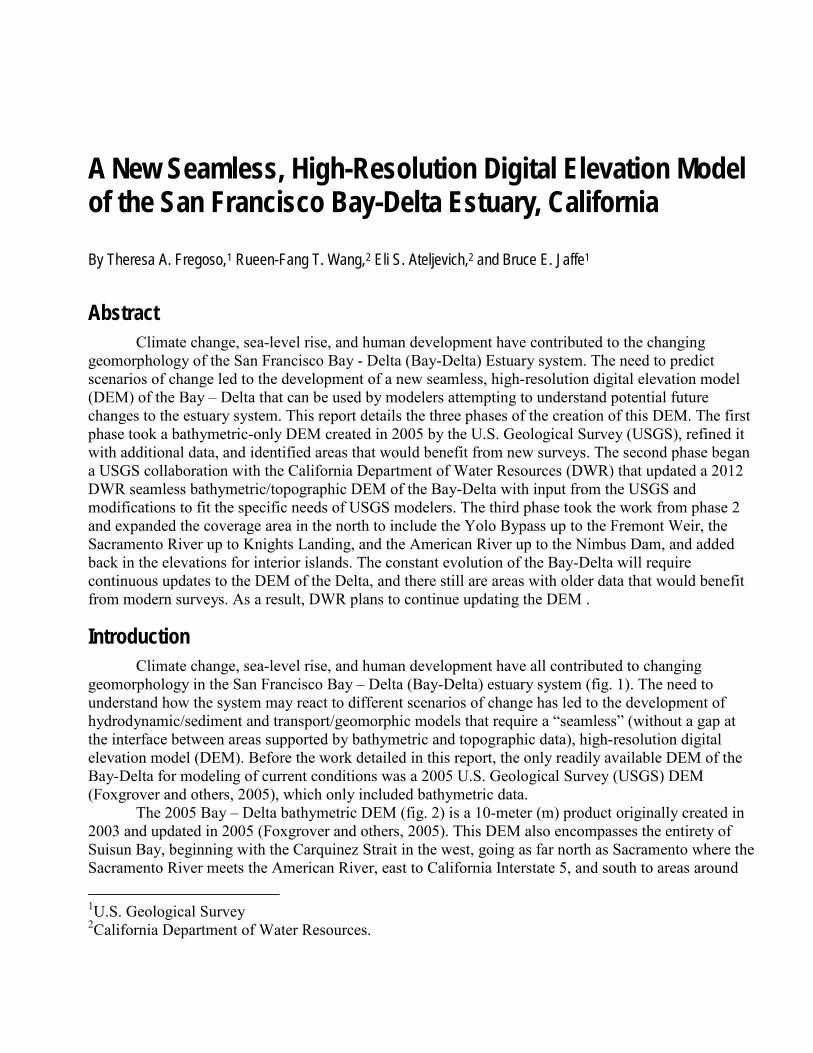
Abstract Climate change, sea-level rise, and human development have contributed to the changing
geomorphology of the San Francisco Bay - Delta (Bay-Delta) Estuary system. The need to predict scenarios of change led to the development of a new seamless, high-resolution digital elevation model (DEM) of the Bay – Delta that can be used by modelers attempting to understand potential future changes to the estuary system. This report details the three phases of the creation of this DEM. The first phase took a bathymetric-only DEM created in 2005 by the U.S. Geological Survey (USGS), refined it with additional data, and identified areas that would benefit from new surveys. The second phase began a USGS collaboration with the California Department of Water Resources (DWR) that updated a 2012 DWR seamless bathymetric/topographic DEM of the Bay-Delta with input from the USGS and modifications to fit the specific needs of USGS modelers. The third phase took the work from phase 2 and expanded the coverage area in the north to include the Yolo Bypass up to the Fremont Weir, the Sacramento River up to Knights Landing, and the American River up to the Nimbus Dam, and added back in the elevations for interior islands. The constant evolution of the Bay-Delta will require continuous updates to the DEM of the Delta, and there still are areas with older data that would benefit from modern surveys. As a result, DWR plans to continue updating the DEM .
Introduction Climate change, sea-level rise, and human development have all contributed to changing
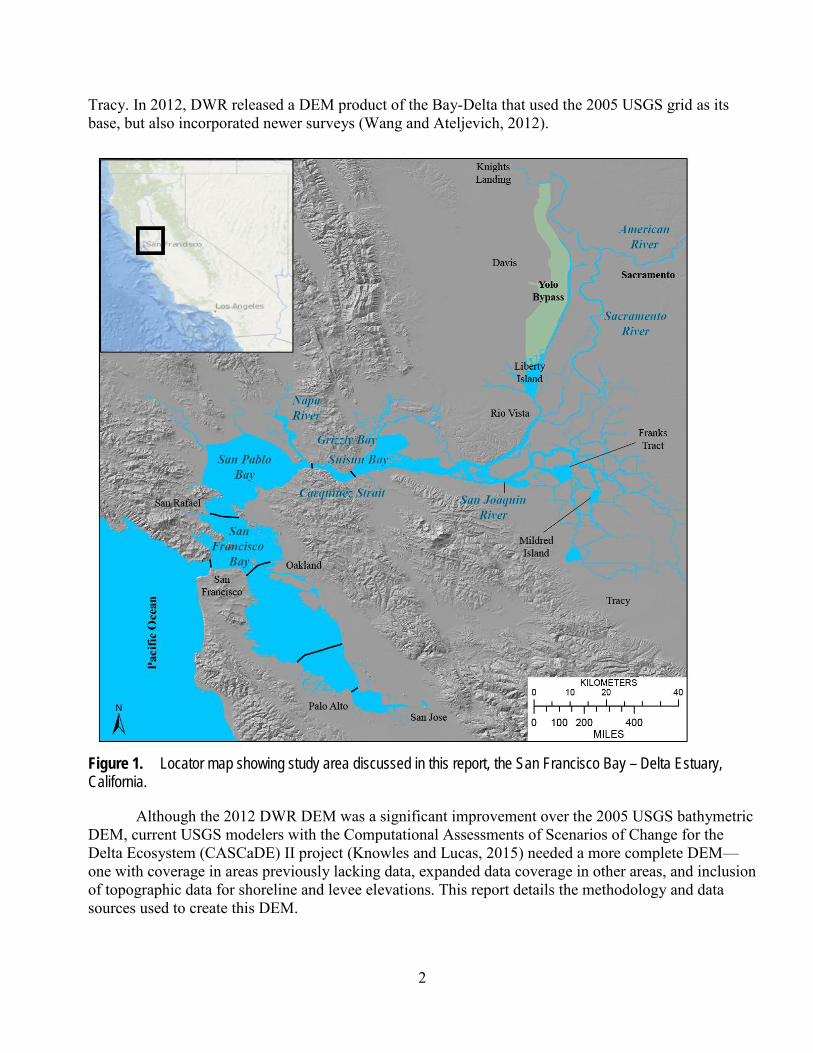
geomorphology in the San Francisco Bay – Delta (Bay-Delta) estuary system (fig. 1). The need to understand how the system may react to different scenarios of change has led to the development of hydrodynamic/sediment and transport/geomorphic models that require a “seamless” (without a gap at the interface between areas supported by bathymetric and topographic data), high-resolution digital elevation model (DEM). Before the work detailed in this report, the only readily available DEM of the Bay-Delta for modeling of current conditions was a 2005 U.S. Geological Survey (USGS) DEM (Foxgrover and others, 2005), which only included bathymetric data.
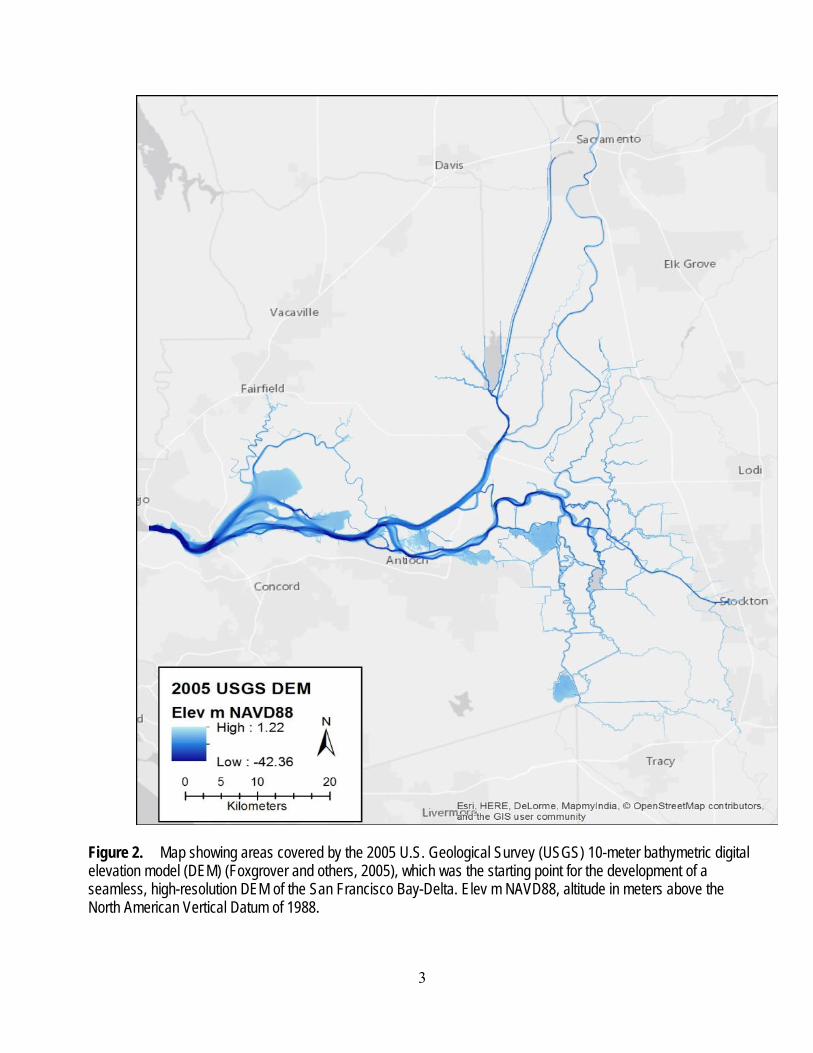
The 2005 Bay – Delta bathymetric DEM (fig. 2) is a 10-meter (m) product originally created in 2003 and updated in 2005 (Foxgrover and others, 2005). This DEM also encompasses the entirety of Suisun Bay, beginning with the Carquinez Strait in the west, going as far north as Sacramento where the Sacramento River meets the American River, east to California Interstate 5, and south to areas around 1U.S. Geological Survey 2California Department of Water Resources.
2
Tracy. In 2012, DWR released a DEM product of the Bay-Delta that used the 2005 USGS grid as its base, but also incorporated newer surveys (Wang and Ateljevich, 2012).
Figure 1. Locator map showing study area discussed in this report, the San Francisco Bay – Delta Estuary, California.
Although the 2012 DWR DEM was a significant improvement over the 2005 USGS bathymetric DEM, current USGS modelers with the Computational Assessments of Scenarios of Change for the Delta Ecosystem (CASCaDE) II project (Knowles and Lucas, 2015) needed a more complete DEM—one with coverage in areas previously lacking data, expanded data coverage in other areas, and inclusion of topographic data for shoreline and levee elevations. This report details the methodology and data sources used to create this DEM.
3
Figure 2. Map showing areas covered by the 2005 U.S. Geological Survey (USGS) 10-meter bathymetric digital elevation model (DEM) (Foxgrover and others, 2005), which was the starting point for the development of a seamless, high-resolution DEM of the San Francisco Bay-Delta. Elev m NAVD88, altitude in meters above the North American Vertical Datum of 1988.
4
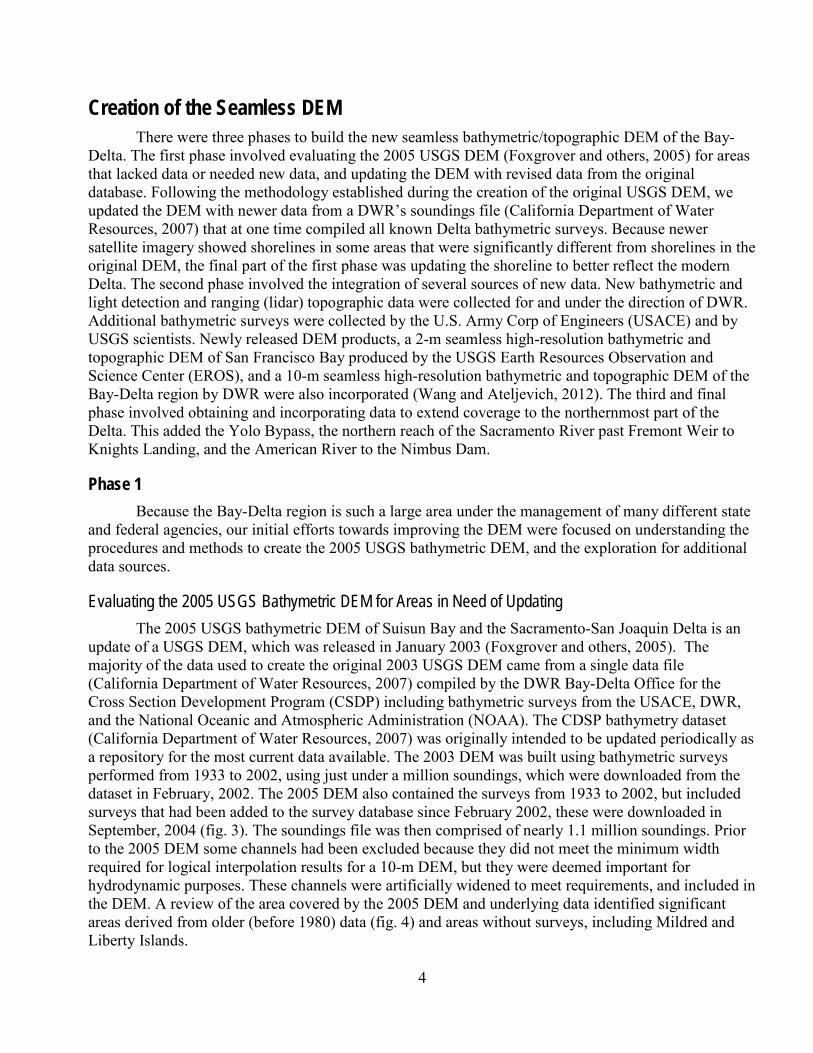
Creation of the Seamless DEM There were three phases to build the new seamless bathymetric/topographic DEM of the Bay-
Delta. The first phase involved evaluating the 2005 USGS DEM (Foxgrover and others, 2005) for areas that lacked data or needed new data, and updating the DEM with revised data from the original database. Following the methodology established during the creation of the original USGS DEM, we updated the DEM with newer data from a DWR’s soundings file (California Department of Water Resources, 2007) that at one time compiled all known Delta bathymetric surveys. Because newer satellite imagery showed shorelines in some areas that were significantly different from shorelines in the original DEM, the final part of the first phase was updating the shoreline to better reflect the modern Delta. The second phase involved the integration of several sources of new data. New bathymetric and light detection and ranging (lidar) topographic data were collected for and under the direction of DWR. Additional bathymetric surveys were collected by the U.S. Army Corp of Engineers (USACE) and by USGS scientists. Newly released DEM products, a 2-m seamless high-resolution bathymetric and topographic DEM of San Francisco Bay produced by the USGS Earth Resources Observation and Science Center (EROS), and a 10-m seamless high-resolution bathymetric and topographic DEM of the Bay-Delta region by DWR were also incorporated (Wang and Ateljevich, 2012). The third and final phase involved obtaining and incorporating data to extend coverage to the northernmost part of the Delta. This added the Yolo Bypass, the northern reach of the Sacramento River past Fremont Weir to Knights Landing, and the American River to the Nimbus Dam.
Phase 1 Because the Bay-Delta region is such a large area under the management of many different state
and federal agencies, our initial efforts towards improving the DEM were focused on understanding the procedures and methods to create the 2005 USGS bathymetric DEM, and the exploration for additional data sources.
Evaluating the 2005 USGS Bathymetric DEM for Areas in Need of Updating The 2005 USGS bathymetric DEM of Suisun Bay and the Sacramento-San Joaquin Delta is an
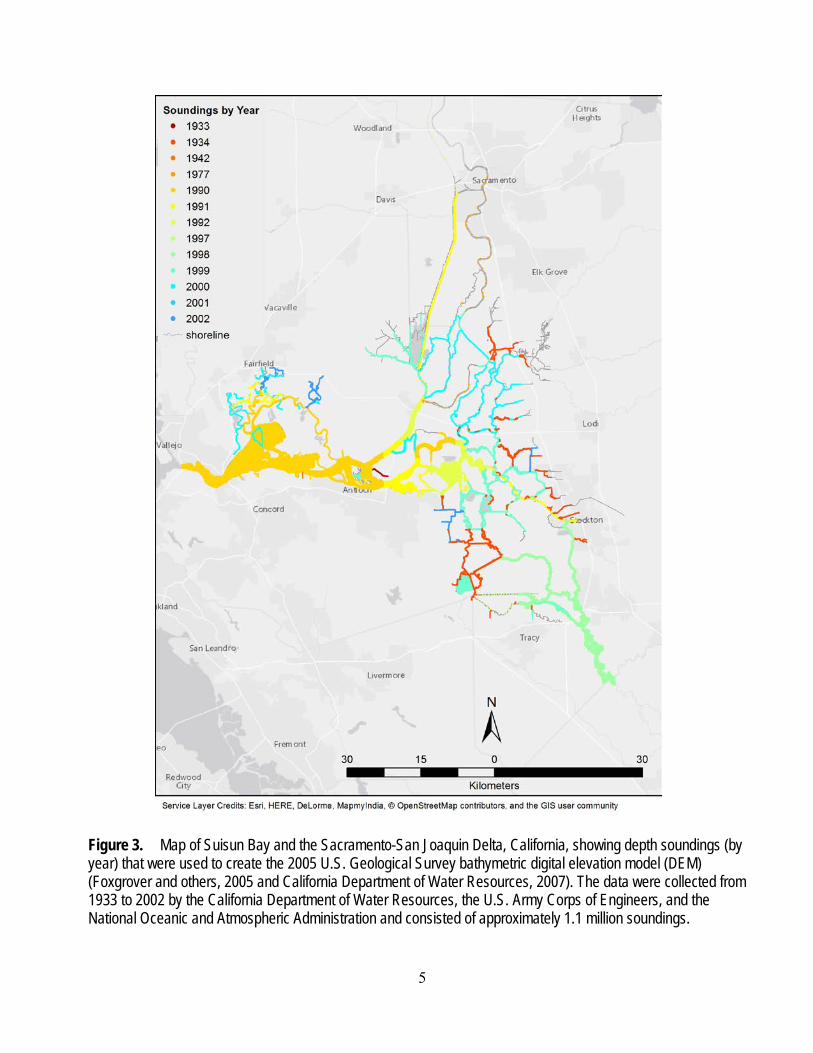
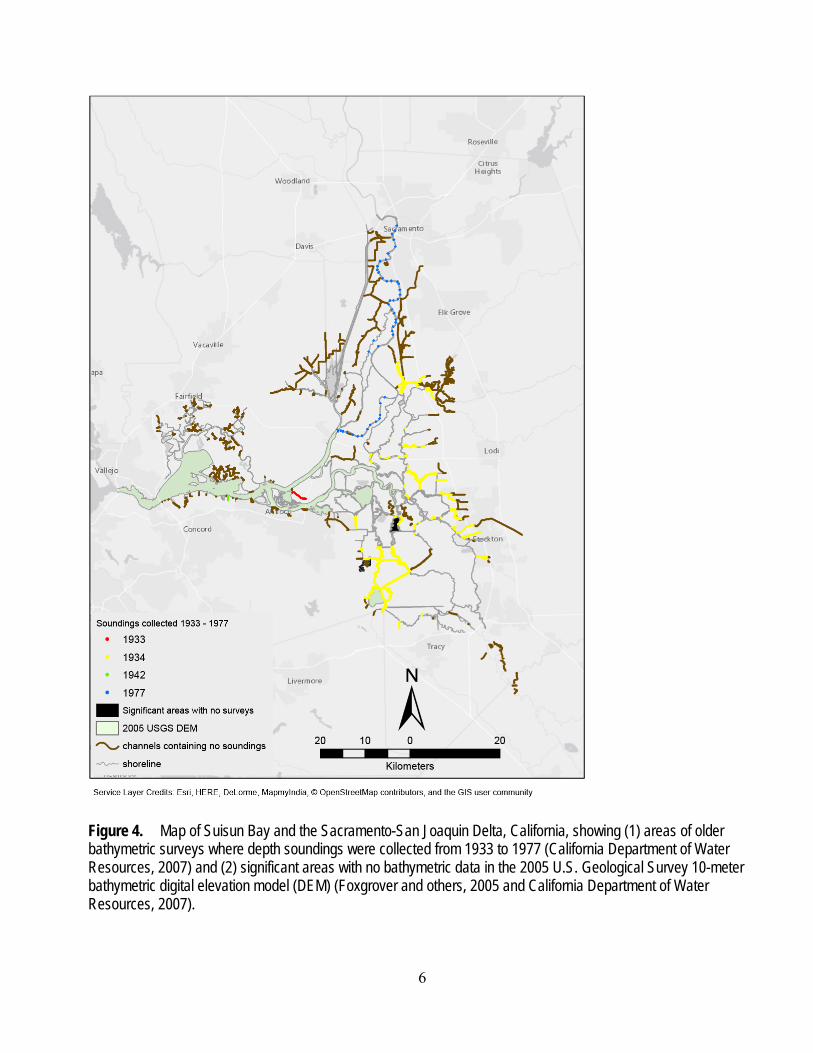
update of a USGS DEM, which was released in January 2003 (Foxgrover and others, 2005). The majority of the data used to create the original 2003 USGS DEM came from a single data file (California Department of Water Resources, 2007) compiled by the DWR Bay-Delta Office for the Cross Section Development Program (CSDP) including bathymetric surveys from the USACE, DWR, and the National Oceanic and Atmospheric Administration (NOAA). The CDSP bathymetry dataset (California Department of Water Resources, 2007) was originally intended to be updated periodically as a repository for the most current data available. The 2003 DEM was built using bathymetric surveys performed from 1933 to 2002, using just under a million soundings, which were downloaded from the dataset in February, 2002. The 2005 DEM also contained the surveys from 1933 to 2002, but included surveys that had been added to the survey database since February 2002, these were downloaded in September, 2004 (fig. 3). The soundings file was then comprised of nearly 1.1 million soundings. Prior to the 2005 DEM some channels had been excluded because they did not meet the minimum width required for logical interpolation results for a 10-m DEM, but they were deemed important for hydrodynamic purposes. These channels were artificially widened to meet requirements, and included in the DEM. A review of the area covered by the 2005 DEM and underlying data identified significant areas derived from older (before 1980) data (fig. 4) and areas without surveys, including Mildred and Liberty Islands.
5
Figure 3. Map of Suisun Bay and the Sacramento-San Joaquin Delta, California, showing depth soundings (by year) that were used to create the 2005 U.S. Geological Survey bathymetric digital elevation model (DEM) (Foxgrover and others, 2005 and California Department of Water Resources, 2007). The data were collected from 1933 to 2002 by the California Department of Water Resources, the U.S. Army Corps of Engineers, and the National Oceanic and Atmospheric Administration and consisted of approximately 1.1 million soundings.
6
Figure 4. Map of Suisun Bay and the Sacramento-San Joaquin Delta, California, showing (1) areas of older bathymetric surveys where depth soundings were collected from 1933 to 1977 (California Department of Water Resources, 2007) and (2) significant areas with no bathymetric data in the 2005 U.S. Geological Survey 10-meter bathymetric digital elevation model (DEM) (Foxgrover and others, 2005 and California Department of Water Resources, 2007).
7
Bathymetry Update Because newer data were available for significant areas of the 2005 USGS bathymetric DEM of
Suisun Bay and the Sacramento-San Joaquin Delta, the first phase of the project included updating the DEM with these data. The update followed the procedures and methodology laid out in “Suisun Bay & Delta bathymetry: Production of a 10 meter grid” (Smith and others, 2003) found on the USGS Suisun and Delta Bathymetry website (Foxgrover and others, 2005). Converting single-beam sounding data into an elevation surface was performed using the TOPOGRID module (Esri, 2008). TOPOGRID and its successor, Topo to Raster, generate hydrologically correct grids of elevation from points (sounding data), elevation lines (contours and shorelines), and boundary polygons (grid extents). Both methods allow for the interpolation of elevation values while imposing constraints supplied by contours for the correct representation of a surface with drainage networks (Esri, 2008, 2016). Newer surveys were obtained from the CSDP dataset (California Department of Water Resources, 2007). While the CSDP dataset was originally intended to be updated periodically as a repository for the most current data available, the most recent new dataset found in the CSDP dataset used by the USGS was a DWR survey conducted in 2005 and added to the file in 2007. Overall, we identified a total of five DWR surveys that had been added to the CSDP dataset since the 2005 update. These surveys were added to the data used to create the updated DEM, and in cases where the new data were dense enough, older surveys were completely replaced.
Shoreline Update A big component, and the most time intensive part, of creating the new DEM of the Bay-Delta
was updating the shoreline. An accurate shoreline with appropriate elevation values is a necessary component for constraining interpolation during the gridding process. The shoreline for this dataset came from DWR and was originally checked for accuracy by comparing the DEM shoreline to digital orthophoto quadrangles (DOQs) from the 1990’s, at a scale of 1:12,000. As part of the USGS software agreement with Esri, the USGS has access to their satellite imagery of the world, which has a maximum resolution of 0.3 m in the conterminous United States (Esri, 2011). Comparing the DEM shoreline to this much higher resolution imagery enabled the shoreline to be adjusted with a much higher attention to detail. The satellite images used for this update were from June 15, 2007, October 18, 2008, and November 1, 2008, and have a listed accuracy of 2.45 m and were collected by AEX Aerials Maps & Data (Esri, 2011). In addition to this satellite imagery, we also used the NOAA shoreline data explorer (National Oceanic and Atmospheric Administration, 2015), which contains shorelines already digitized from satellite images obtained by NOAA on April 1, 1983, February 7, 2003, and June 13, 2007, which were checked against the most recent imagery and adjusted when necessary.
Because the update resulted in substantial changes in the shoreline data, it was also necessary to recreate the “shoreline buffer,” a component of the interpolation method used to create the new DEM. To improve elevation estimates near channel edges, a depth contour was created 5 m from the shoreline on the waterside and tagged with a depth based on nearby soundings. A new shoreline buffer was then generated, and by using the “Select By Location” function in ArcMap, most of the values from the original shoreline buffer were transferred to the new buffer. For the areas where the new shoreline differed significantly from the old shoreline, the adjacent area was inspected visually, and an appropriate depth value was assigned to the buffer based on nearby soundings.
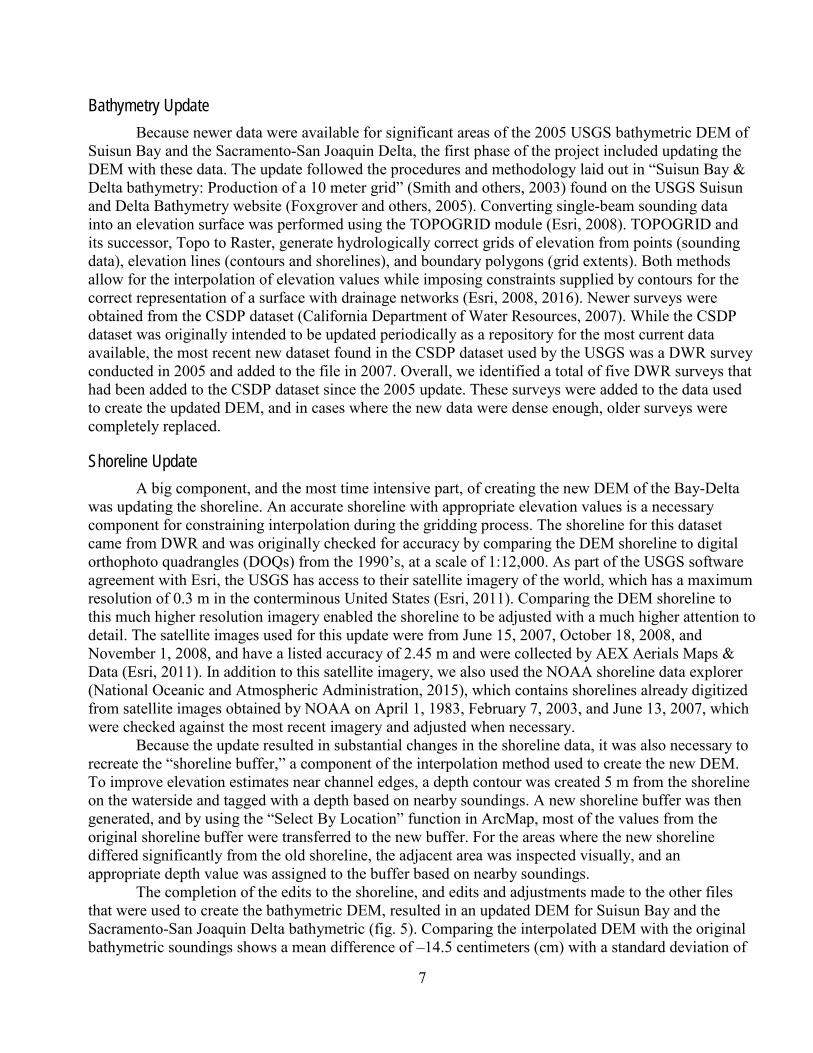
The completion of the edits to the shoreline, and edits and adjustments made to the other files that were used to create the bathymetric DEM, resulted in an updated DEM for Suisun Bay and the Sacramento-San Joaquin Delta bathymetric (fig. 5). Comparing the interpolated DEM with the original bathymetric soundings shows a mean difference of –14.5 centimeters (cm) with a standard deviation of
8
78 cm, indicating that on average the DEM is slightly shallower than the sounding data. Considering the age and density of soundings in many of the survey areas, the narrow channels, and complexity of the Delta’s hydrodynamics, these numbers are considered to be acceptable for our purpose.
Phase 1 work involved important exercises that laid the foundation for this collaborative effort and prepared us for the tasks that followed. However, we didn’t incorporate the phase 1 product (fig. 5) into the final model because it was superseded by the work completed in the later phases.
Figure 5. Map showing the 10-meter bathymetric digital elevation model (DEM) resulting from phase 1 activities to update the 2005 U.S. Geological Survey DEM for Suisun Bay and the Sacramento-San Joaquin Delta, California ((Foxgrover and others, 2005). Elev m NAVD88, altitude in meters above the North American Vertical Datum of 1988.
9
Phase 2 The search for new data source carried out in phase 1 resulted in identifying more recent efforts
to map the San Francisco Bay-Delta Estuary. Surveys had been conducted of both land/topography, and water/bathymetry, using the most up-to-date survey technology.
New Data Sources and Map Products Although the most recent bathymetric data in the CSDP dataset were collected in 2005, more
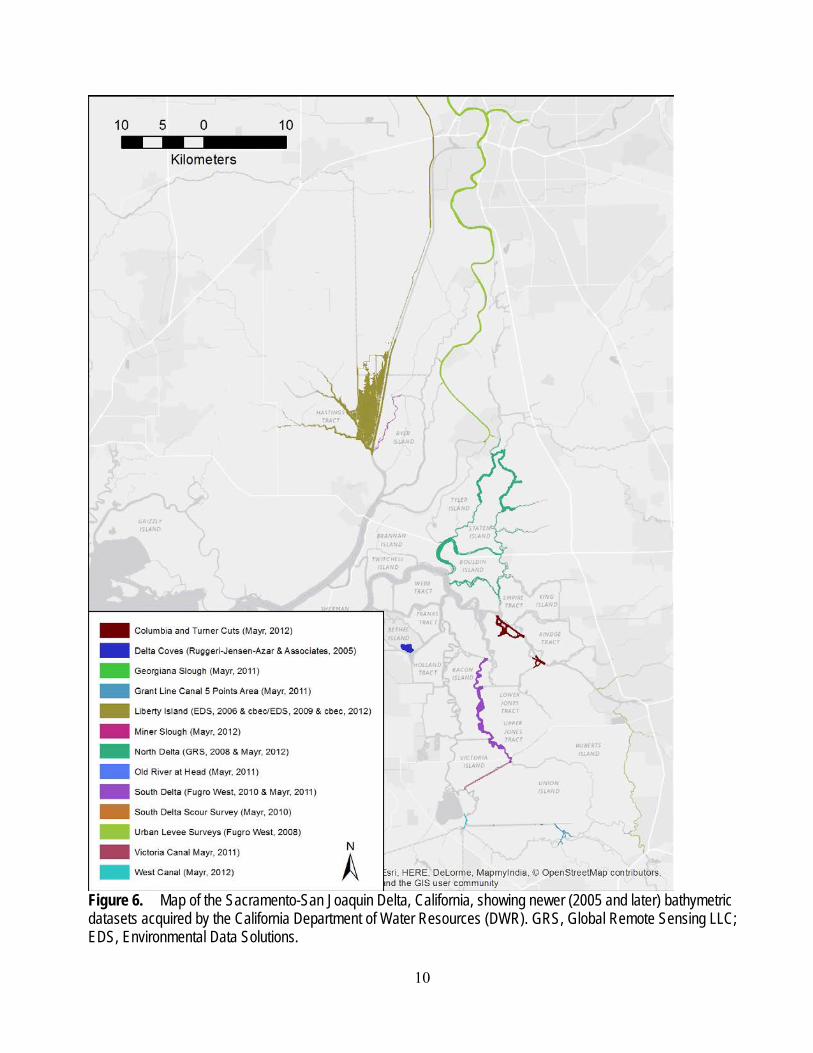
recent data are available. In 2005, new single-beam and multibeam bathymetric surveys by various government and private entities became available. Figure 5 shows the locations of these new bathymetric products acquired by DWR. The Bathymetry and Technical Support Section of DWR’s North Central Region Office published an online “Delta Bathymetry Catalog” to share their survey results (see https://gis.water.ca.gov/app/bathymetry/), including additional bathymetry datasets that are not shown in figure 6.
Topographic data for the Delta was collected by lidar survey flights beginning in 2007 for DWR’s 2009 and 2010 FloodSAFE initiative (see http://www.water.ca.gov/floodsafe/), specifically for the initiative’s Central Valley Floodplain Evaluation and Delineation Program (California Department of Water Resources, 2009). A group within DWR further refined the lidar dataset by removing areas of standing water, leaving those areas empty of data in the final lidar product.
In 2012, DWR released a 10-m seamless bathymetric and topographic DEM (fig. 7), “A Continuous Surface Elevation Map for Modeling,” that encompassed the entire Bay-Delta, including the coast, with a special focus on the Delta part (Wang and Ateljevich, 2012). This 10-m DEM included the most current bathymetry and topography data available for the region up to the time of its publication. It used (1) the 2005 USGS bathymetric DEM (Foxgrover and others, 2005) in areas where no new data were available and (2) NOAA’s 2011 central California and San Francisco Bay 1/3 arc-second (~10 m) DEM (Carignan and others, 2011) for the entirety of San Francisco Bay, starting from the Pacific Ocean along the coast in the west and the far eastern reach of Suisun Bay to the east, including topography and bathymetry.
10
Figure 6. Map of the Sacramento-San Joaquin Delta, California, showing newer (2005 and later) bathymetric datasets acquired by the California Department of Water Resources (DWR). GRS, Global Remote Sensing LLC; EDS, Environmental Data Solutions.
11
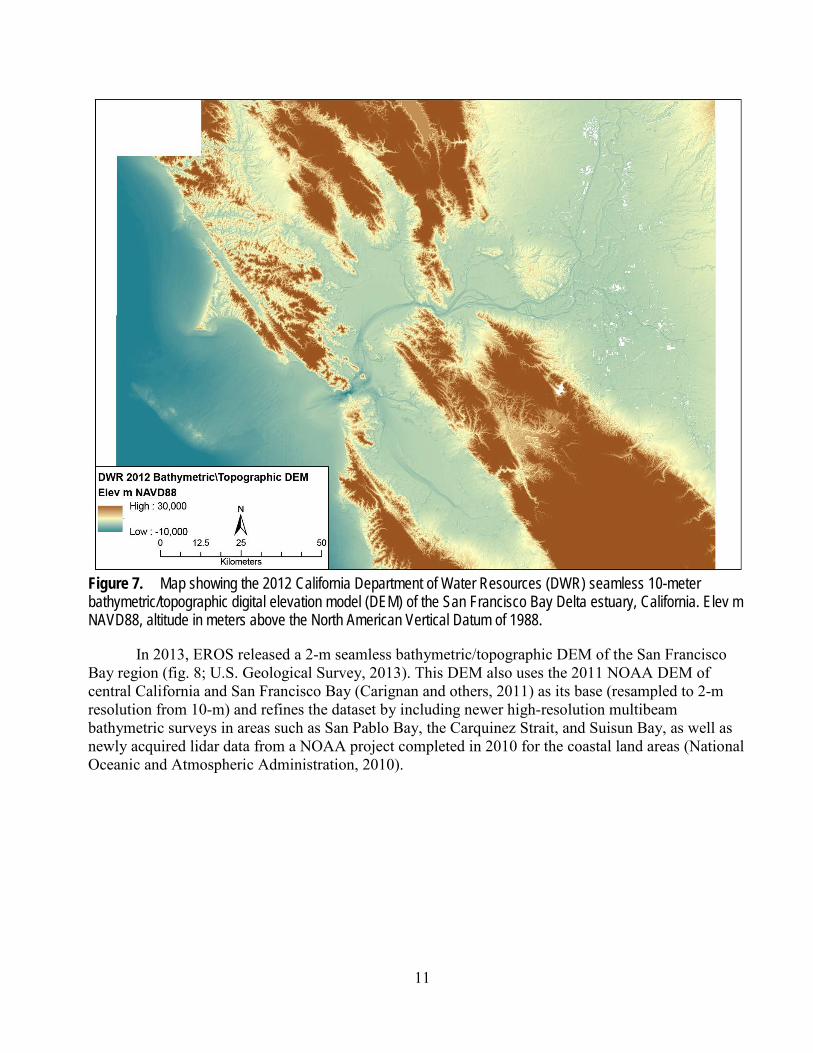
Figure 7. Map showing the 2012 California Department of Water Resources (DWR) seamless 10-meter bathymetric/topographic digital elevation model (DEM) of the San Francisco Bay Delta estuary, California. Elev m NAVD88, altitude in meters above the North American Vertical Datum of 1988.
In 2013, EROS released a 2-m seamless bathymetric/topographic DEM of the San Francisco Bay region (fig. 8; U.S. Geological Survey, 2013). This DEM also uses the 2011 NOAA DEM of central California and San Francisco Bay (Carignan and others, 2011) as its base (resampled to 2-m resolution from 10-m) and refines the dataset by including newer high-resolution multibeam bathymetric surveys in areas such as San Pablo Bay, the Carquinez Strait, and Suisun Bay, as well as newly acquired lidar data from a NOAA project completed in 2010 for the coastal land areas (National Oceanic and Atmospheric Administration, 2010).
12
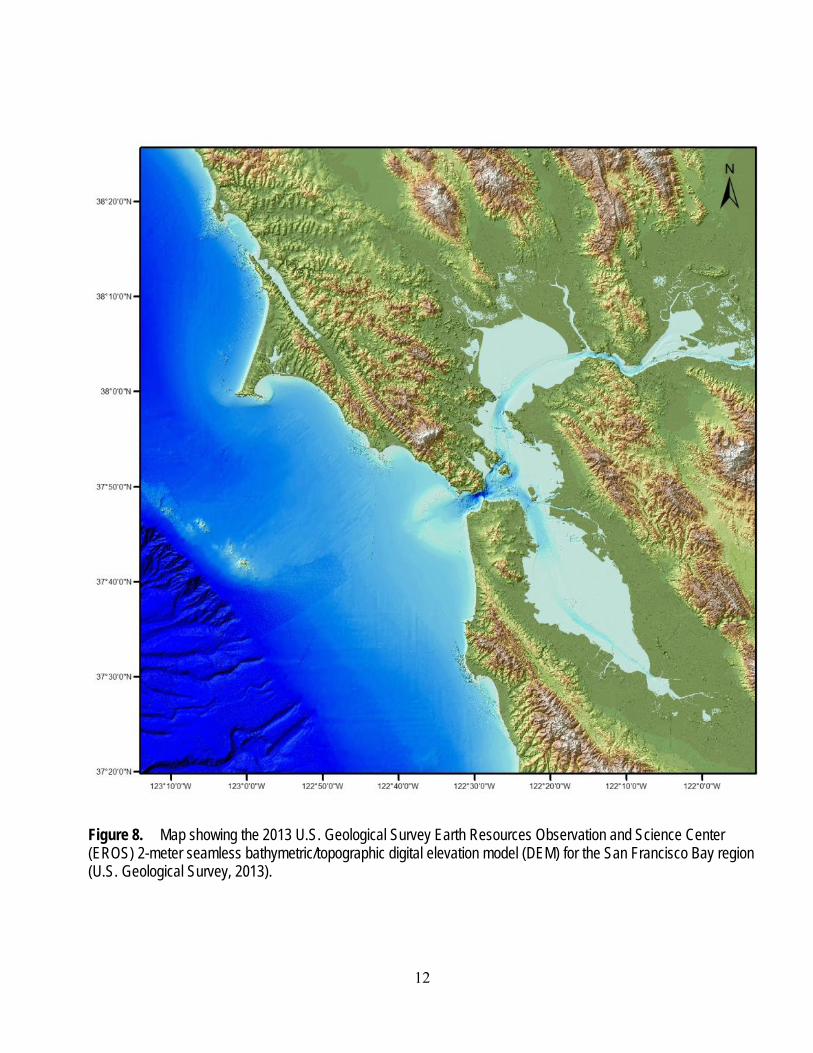
Figure 8. Map showing the 2013 U.S. Geological Survey Earth Resources Observation and Science Center (EROS) 2-meter seamless bathymetric/topographic digital elevation model (DEM) for the San Francisco Bay region (U.S. Geological Survey, 2013).
13
Creating an Integrated USGS/DWR Seamless Bathymetric/Topographic DEM for the San Francisco Bay-Delta Estuary, California.
In early 2013, the USGS and DWR combined expertise to refine the 2012 DWR DEM of the Bay-Delta (Wang and Ateljevich, 2012) in preparation for future DWR DEM updates and releases, and to satisfy the needs dictated by USGS and DWR modelers. Rather than continue to duplicate efforts, USGS and DWR collaborated to refine methodology and to share efforts for future DEM releases by both agencies.
The 2012 DWR DEM is a reasonably thought out product with careful attention paid to sensible transitions between the bathymetric and topographic datasets, minimal edge effects between adjacent surveys, and the hydrodynamics of areas with sparse data. However, discussions on DEM development revealed that in areas with multiple datasets of the same type (that is, single beam or multibeam), collected at different times, the 2012 DEM was based on the combination of all the datasets to produce an average surface. The averaging method was initially chosen as an attempt to prevent bias in the model due to signals from possible extreme events. The drawback of such averaging is that it can result in wider and (or) shallower channels, and it can also create unnatural artifacts, as seasonal and decadal changes combine in the final product. The problems appear to be exacerbated when trying to merge data from dense, self-consistent multibeam datasets that differ by both a small collection bias and bedform migration. The 2005 USGS DEM (Foxgrover and others, 2005) was created using a similar methodology for combining surveys, but in that case efforts were made to remove older surveys to avoid artifacts when newer surveys had adequate trackline spacing and coverage.
To produce a new DEM optimized for geomorphic modeling, we chose to rebuild some areas of the 2012 DWR DEM using only the most recent surveys. The USGS also had access to newer data collected by the USGS for the area of Mildred Island, so we created an updated grid of that section. When the 2-m EROS DEM of the San Francisco Bay region (U.S. Geological Survey, 2013), which included more recent bathymetric surveys and lidar data integrated into a seamless product, became available, we opted to take advantage of these data as well. The revised parts will also be added into the next version of the Bay-Delta DEM released by DWR. The following sections provide details on modifications made to the 2012 DWR DEM to create the new DEM of the Bay-Delta.
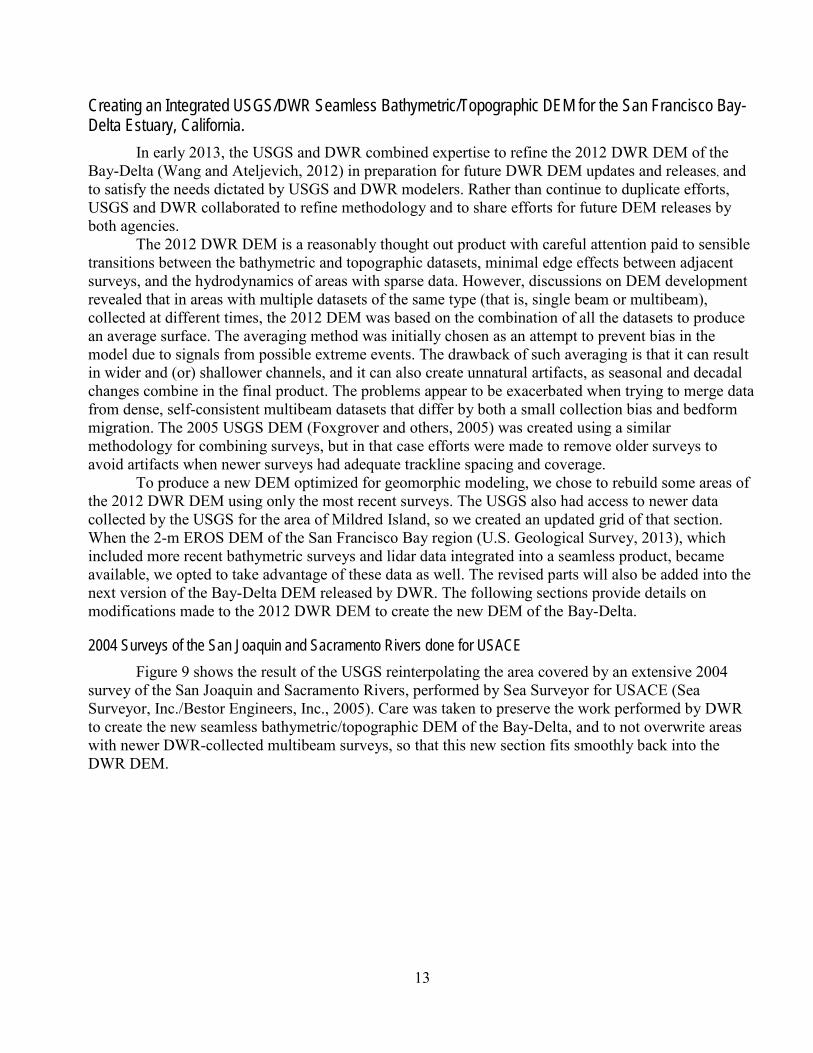
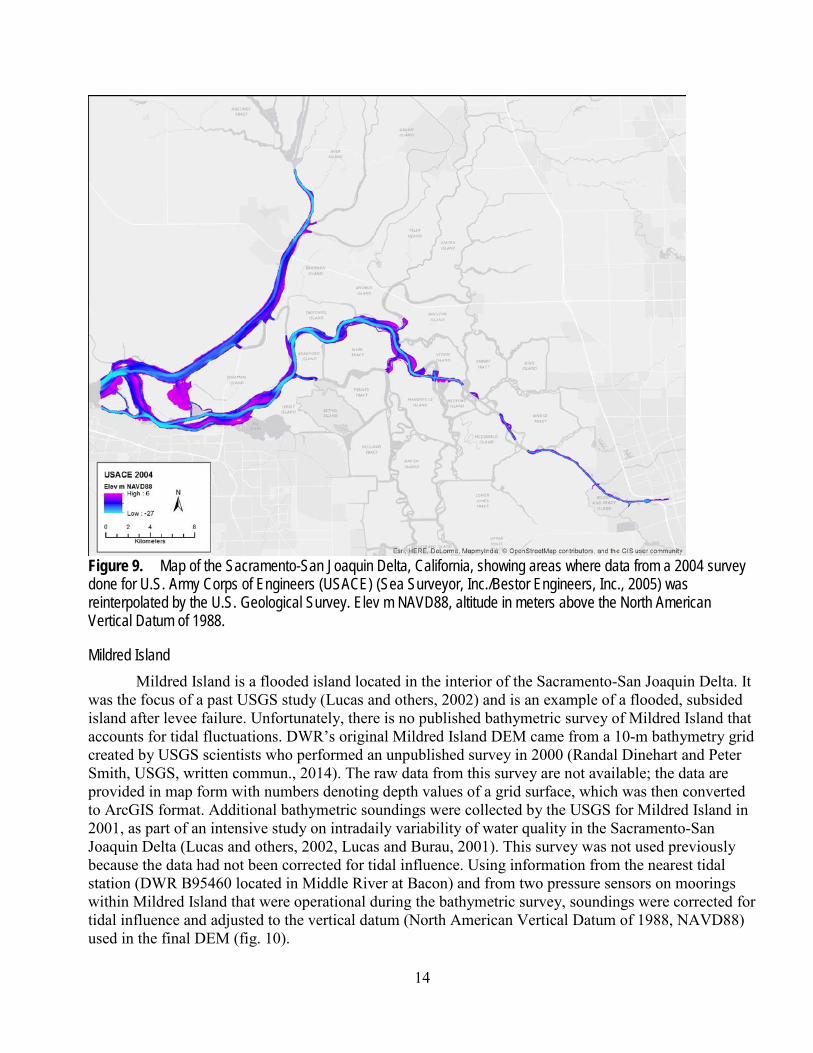
2004 Surveys of the San Joaquin and Sacramento Rivers done for USACE Figure 9 shows the result of the USGS reinterpolating the area covered by an extensive 2004
survey of the San Joaquin and Sacramento Rivers, performed by Sea Surveyor for USACE (Sea Surveyor, Inc./Bestor Engineers, Inc., 2005). Care was taken to preserve the work performed by DWR to create the new seamless bathymetric/topographic DEM of the Bay-Delta, and to not overwrite areas with newer DWR-collected multibeam surveys, so that this new section fits smoothly back into the DWR DEM.
14
Figure 9. Map of the Sacramento-San Joaquin Delta, California, showing areas where data from a 2004 survey done for U.S. Army Corps of Engineers (USACE) (Sea Surveyor, Inc./Bestor Engineers, Inc., 2005) was reinterpolated by the U.S. Geological Survey. Elev m NAVD88, altitude in meters above the North American Vertical Datum of 1988.
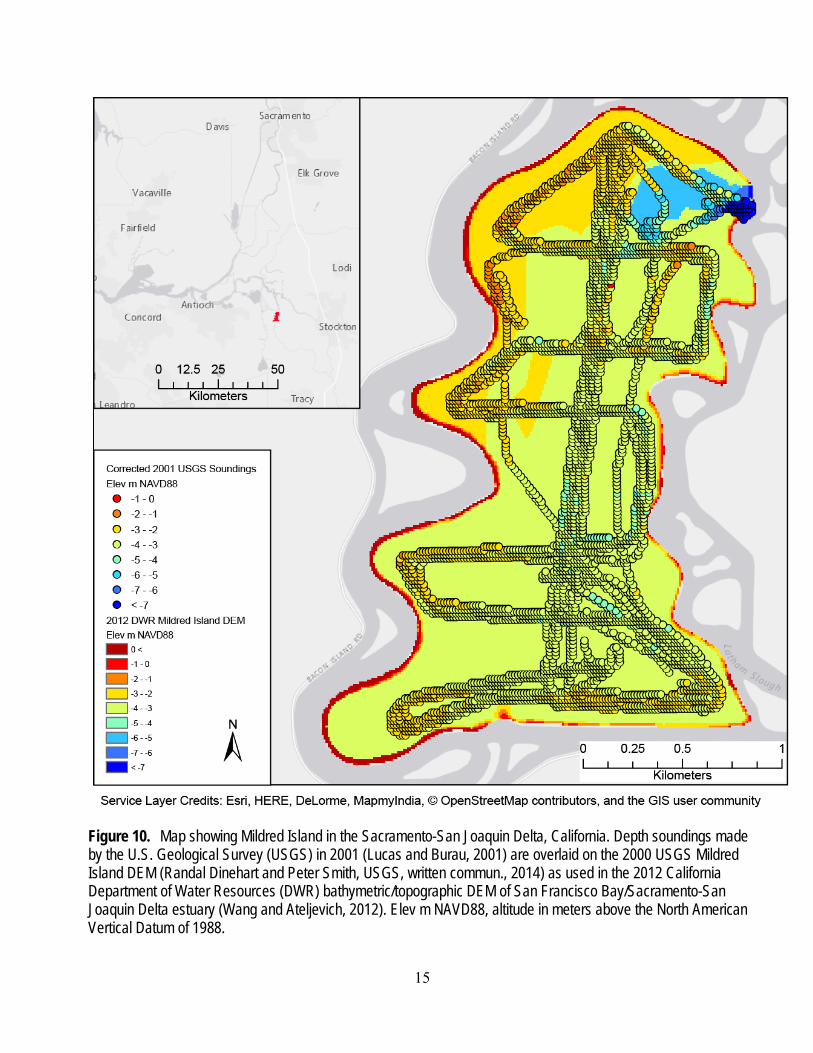
Mildred Island Mildred Island is a flooded island located in the interior of the Sacramento-San Joaquin Delta. It
was the focus of a past USGS study (Lucas and others, 2002) and is an example of a flooded, subsided island after levee failure. Unfortunately, there is no published bathymetric survey of Mildred Island that accounts for tidal fluctuations. DWR’s original Mildred Island DEM came from a 10-m bathymetry grid created by USGS scientists who performed an unpublished survey in 2000 (Randal Dinehart and Peter Smith, USGS, written commun., 2014). The raw data from this survey are not available; the data are provided in map form with numbers denoting depth values of a grid surface, which was then converted to ArcGIS format. Additional bathymetric soundings were collected by the USGS for Mildred Island in 2001, as part of an intensive study on intradaily variability of water quality in the Sacramento-San Joaquin Delta (Lucas and others, 2002, Lucas and Burau, 2001). This survey was not used previously because the data had not been corrected for tidal influence. Using information from the nearest tidal station (DWR B95460 located in Middle River at Bacon) and from two pressure sensors on moorings within Mildred Island that were operational during the bathymetric survey, soundings were corrected for tidal influence and adjusted to the vertical datum (North American Vertical Datum of 1988, NAVD88) used in the final DEM (fig. 10).
15
Figure 10. Map showing Mildred Island in the Sacramento-San Joaquin Delta, California. Depth soundings made by the U.S. Geological Survey (USGS) in 2001 (Lucas and Burau, 2001) are overlaid on the 2000 USGS Mildred Island DEM (Randal Dinehart and Peter Smith, USGS, written commun., 2014) as used in the 2012 California Department of Water Resources (DWR) bathymetric/topographic DEM of San Francisco Bay/Sacramento-San Joaquin Delta estuary (Wang and Ateljevich, 2012). Elev m NAVD88, altitude in meters above the North American Vertical Datum of 1988.
16
During processing of Lucas and Burau (2001) survey data, problems were noted with the locations of the soundings. It was subsequently determined that during archiving of the data, the latitude and longitude data values each lost one digit (creating a positional accuracy to anywhere within 11 m of the actual location), so that multiple depth soundings (as many as 244) appeared to be in the same location. To address this problem, we used the mean sounding value for each sounding’s “position” to build a new bathymetric DEM. This new bathy DEM was then compared to the Mildred Island DEM used by DWR. On average, the DWR Mildred Island DEM had a –0.3-m difference from the tidally corrected soundings (that is, the data used by DWR were deeper than the corrected soundings). Because no information was available regarding whether or not a tidal correction had been applied to the data used to create the bathymetric portion of the DWR Mildred Island DEM, the bathymetric surface was shifted upward by 0.3 m to match the tidally corrected soundings. This shift was accomplished by extracting the bathymetric part of Mildred Island from the DWR DEM then raising only that section of the DEM. The topography of the broken levees surrounding Mildred Island are an important component of the hydrodynamics of this flooded island, with values taken from a lidar dataset, so it was important to ensure they were not altered when raising the bathymetric surface.
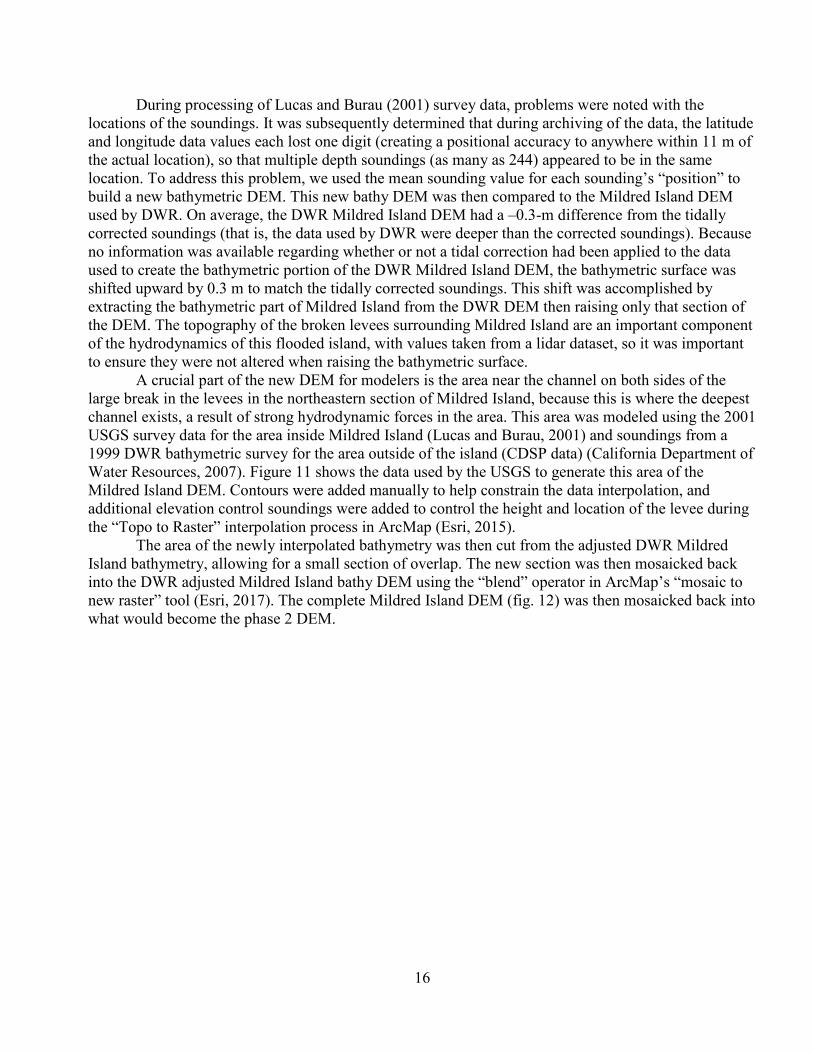
A crucial part of the new DEM for modelers is the area near the channel on both sides of the large break in the levees in the northeastern section of Mildred Island, because this is where the deepest channel exists, a result of strong hydrodynamic forces in the area. This area was modeled using the 2001 USGS survey data for the area inside Mildred Island (Lucas and Burau, 2001) and soundings from a 1999 DWR bathymetric survey for the area outside of the island (CDSP data) (California Department of Water Resources, 2007). Figure 11 shows the data used by the USGS to generate this area of the Mildred Island DEM. Contours were added manually to help constrain the data interpolation, and additional elevation control soundings were added to control the height and location of the levee during the “Topo to Raster” interpolation process in ArcMap (Esri, 2015).
The area of the newly interpolated bathymetry was then cut from the adjusted DWR Mildred Island bathymetry, allowing for a small section of overlap. The new section was then mosaicked back into the DWR adjusted Mildred Island bathy DEM using the “blend” operator in ArcMap’s “mosaic to new raster” tool (Esri, 2017). The complete Mildred Island DEM (fig. 12) was then mosaicked back into what would become the phase 2 DEM.
17
Figure 11. Map of Mildred Island in the Sacramento-San Joaquin Delta, California. Showing data used by the U.S. Geological Survey (USGS) to create an updated Mildred Island digital elevation model (DEM). USGS 2001 data from Lucas and Burau, 2001. California Department of Water Resources (DWR) 1999 from (California Department of Water Resources, 2007); Elev m NAVD88, altitude in meters above the North American Vertical Datum of 1988.
18
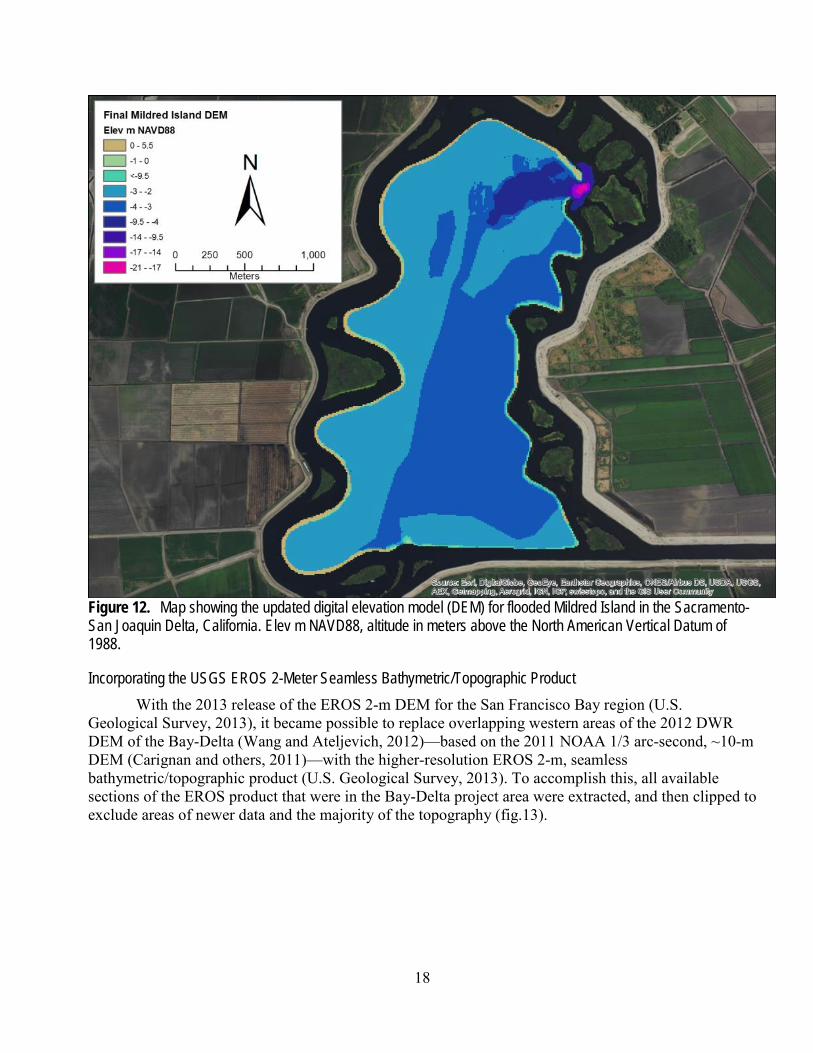
Figure 12. Map showing the updated digital elevation model (DEM) for flooded Mildred Island in the Sacramento-San Joaquin Delta, California. Elev m NAVD88, altitude in meters above the North American Vertical Datum of 1988.
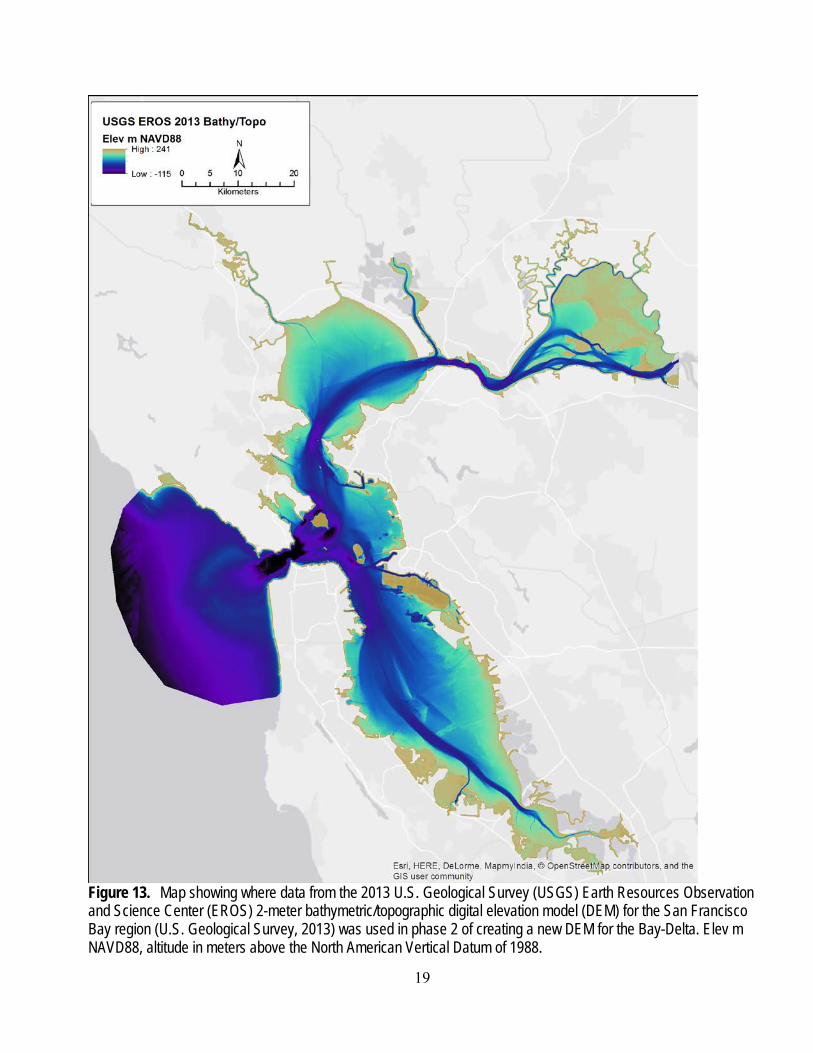
Incorporating the USGS EROS 2-Meter Seamless Bathymetric/Topographic Product With the 2013 release of the EROS 2-m DEM for the San Francisco Bay region (U.S.
Geological Survey, 2013), it became possible to replace overlapping western areas of the 2012 DWR DEM of the Bay-Delta (Wang and Ateljevich, 2012)—based on the 2011 NOAA 1/3 arc-second, ~10-m DEM (Carignan and others, 2011)—with the higher-resolution EROS 2-m, seamless bathymetric/topographic product (U.S. Geological Survey, 2013). To accomplish this, all available sections of the EROS product that were in the Bay-Delta project area were extracted, and then clipped to exclude areas of newer data and the majority of the topography (fig.13).
19
Figure 13. Map showing where data from the 2013 U.S. Geological Survey (USGS) Earth Resources Observation and Science Center (EROS) 2-meter bathymetric/topographic digital elevation model (DEM) for the San Francisco Bay region (U.S. Geological Survey, 2013) was used in phase 2 of creating a new DEM for the Bay-Delta. Elev m NAVD88, altitude in meters above the North American Vertical Datum of 1988.
20
Eliminating Inland Topography The inclusion of topographic data in the 2012 DWR DEM of the Bay-Delta (Wang and
Ateljevich, 2012) and 2013 EROS (U.S. Geological Survey, 2013) DEMs added a huge amount of new data to the process of creating the new DEM for the Sacramento-San Joaquin Delta. Although the inclusion of topographic data along the shore and on levees was very helpful for modelers, much of the topographic data were not needed for hydrodynamic modeling being conducted at that time. To make the new DEM of the Delta more manageable, extraneous topographic data were removed from the 2012 DWR and 2013 EROS DEMs. Topographic data retained in the DEMs includes at least 100 m of topographic data directly adjacent to shore and levee profiles.
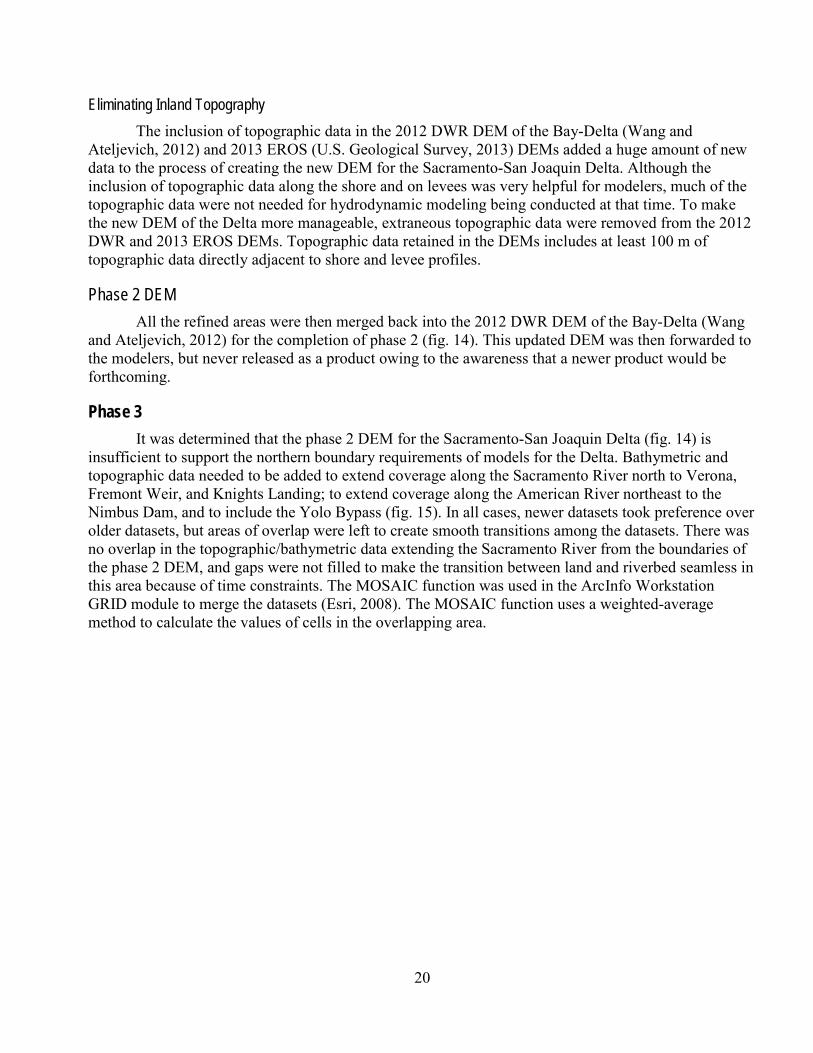
Phase 2 DEM All the refined areas were then merged back into the 2012 DWR DEM of the Bay-Delta (Wang
and Ateljevich, 2012) for the completion of phase 2 (fig. 14). This updated DEM was then forwarded to the modelers, but never released as a product owing to the awareness that a newer product would be forthcoming.
Phase 3 It was determined that the phase 2 DEM for the Sacramento-San Joaquin Delta (fig. 14) is
insufficient to support the northern boundary requirements of models for the Delta. Bathymetric and topographic data needed to be added to extend coverage along the Sacramento River north to Verona, Fremont Weir, and Knights Landing; to extend coverage along the American River northeast to the Nimbus Dam, and to include the Yolo Bypass (fig. 15). In all cases, newer datasets took preference over older datasets, but areas of overlap were left to create smooth transitions among the datasets. There was no overlap in the topographic/bathymetric data extending the Sacramento River from the boundaries of the phase 2 DEM, and gaps were not filled to make the transition between land and riverbed seamless in this area because of time constraints. The MOSAIC function was used in the ArcInfo Workstation GRID module to merge the datasets (Esri, 2008). The MOSAIC function uses a weighted-average method to calculate the values of cells in the overlapping area.
21
Figure 14. Map of the San Francisco Bay Delta, California, showing the completed U.S. Geological Survey phase 2 bathymetric/topographic digital elevation model (DEM) for the Delta. Elev m NAVD88, altitude in meters above the North American Vertical Datum of 1988.
22
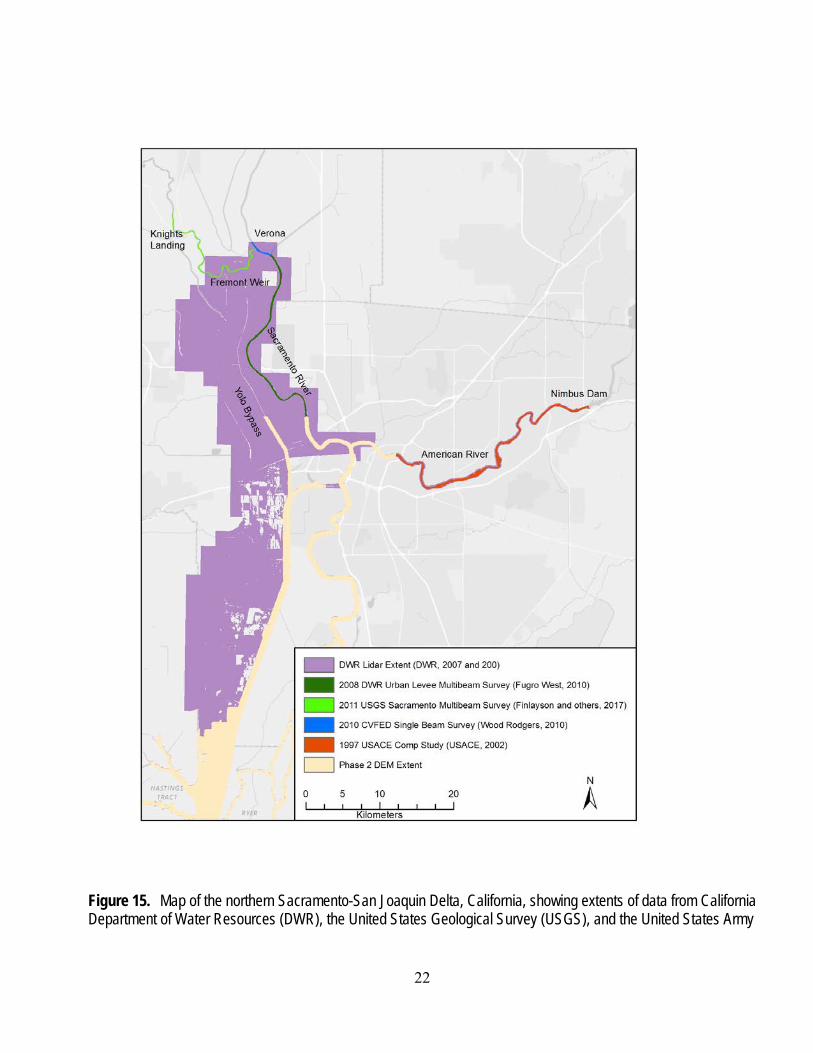
Figure 15. Map of the northern Sacramento-San Joaquin Delta, California, showing extents of data from California Department of Water Resources (DWR), the United States Geological Survey (USGS), and the United States Army
23
Corp of Engineers (USACE), for the phase 3 expansion of the digital elevation model (DEM) for the Delta by the U.S. Geological Survey.
Extending the Sacramento River Bathymetry and Including the Yolo Bypass As part of CVFED, bathymetric and topographic data for California’s Central Valley were
collected from a variety of sources, including private consulting firms and DWR-led survey teams, with collection dates as early as 2008 for lidar flights and as late as 2011 for some of the bathymetric surveys. These new data included bathymetric data for the Sacramento River, from Walnut Grove to Verona, that were collected during a multibeam survey conducted by DWR’s Urban Levees program in 2008 (Fugro West, Inc., 2008). The Urban Levees data also included a 5-mile (~8 kilometer) stretch of the American River from its confluence with the Sacramento River. These data were converted from feet to meters, and then resampled to 10-m resolution for merging into the new DEM of the Bay-Delta.
Accurate representation of the Yolo Bypass is crucial for hydrodynamic/geomorphic modeling of the Bay-Delta system. Most often the Bypass is just marsh, farmland, and mostly is above water, but in extremely wet years, flood waters can be routed to the Bypass to prevent flooding in Sacramento and other communities in the vicinity of the Sacramento River. To include the Bypass in the new DEM of the Delta, the necessary lidar files were extracted from the CVFED dataset (Fugro Earth Data, Inc., 2010), mosaicked together, and resampled from 1- to 10-m resolution. The lidar data were inspected for artifacts, and areas of standing water (represented by a mostly flat surface) were removed from the DEM. Because extensive areas of shallow water can have significant impacts on hydrodynamic models, we chose to remove them so modelers would have to consider explicitly how they treat these areas. Although this does detract from the “seamless” quality of the DEM, simple filling techniques work well to correct the issue.
Adding the Yolo Bypass also allowed the use of a 2011 interferometric sidescan swath bathymetric survey collected by the USGS of the Sacramento River, starting from the confluence with Feather River at Verona and ending at Knights Landing (Finlayson and others, 2017). A stretch of the Sacramento River just downstream of Verona that was not included in either the 2011 USGS survey, or by CVFED in earlier multibeam surveys, was filled using a 2010 single beam survey from the CVFED data that was interpolated to fill the gap (Wood Rodgers, Inc., 2010).
Extending the American River The coverage of the American River was obtained from a comprehensive study of the
Sacramento and San Joaquin Rivers by USACE (U.S Army Corp of Engineers and California Reclamation Board, 2002), which included bathymetric and topographic data from USACE surveys conducted in 1997. The USACE surveys were available as a 2-foot contour triangulated irregular network (TIN) file that included both bathymetric and topographic data. These data were converted to a raster format with a cell size of 1 m and then resampled to 10 m for inclusion in the new DEM of the Bay-Delta.
Restoring Island Elevations for the Interior Delta As USGS modelers advanced in their progress to model scenarios of change throughout the Bay-
Delta, a request was made to include the interior islands elevations in the new DEM of the Bay-Delta. Elevations for the interior islands exist mostly in the form of topographic lidar data that were included in the 2012 DWR DEM for the Bay-Delta (Wang and Ateljevich, 2012). Previously, in phase 2, inland
24
topography had been removed to make the new DEM more manageable in size, and also because the focus was only on areas where water levels had overtopped levees.
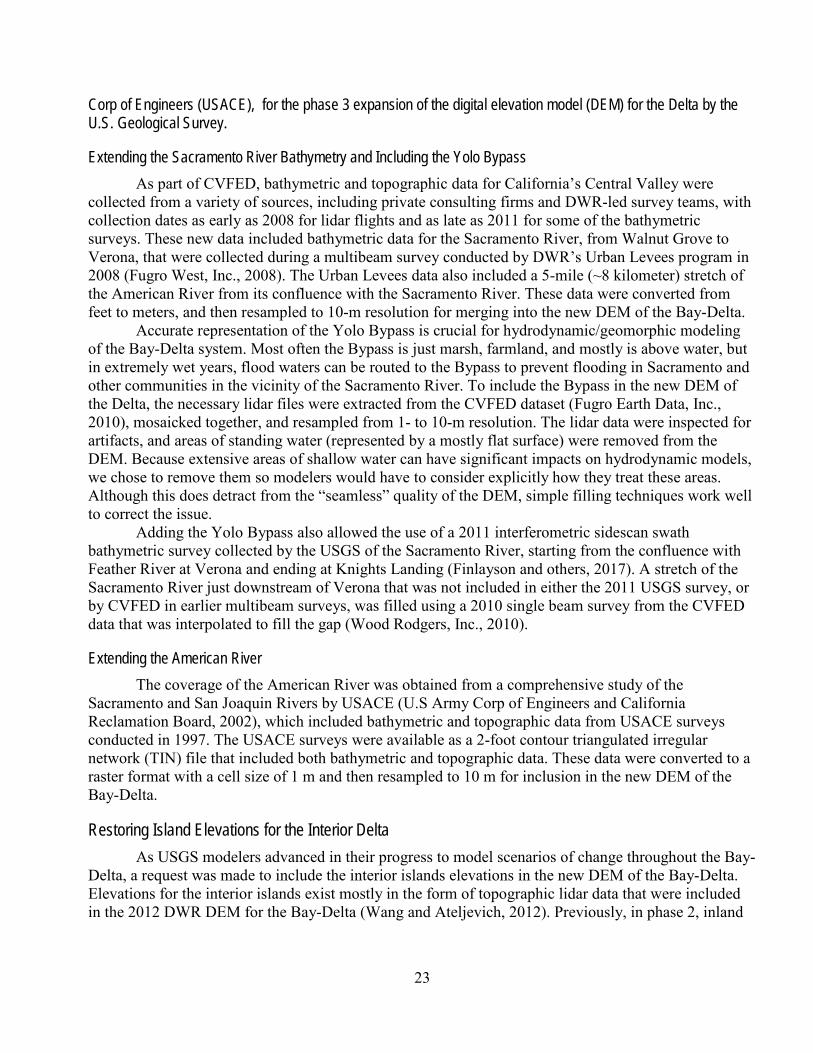
The New High-Resolution DEM of the San Francisco Bay-Delta The completion of the phase 3 additions resulted in the new high-resolution DEM of the San
Francisco Bay Delta presented in this report (fig. 16). The DEM remains a mainly seamless product, except in the newly added northern region. We hope that work will be conducted in the future to fill any gaps in the land/water interface along the Sacramento River area up to Knights Landing.
Figure 16. Map of the San Francisco Bay-Delta, California, showing the final U.S. Geological Survey phase 3 bathymetric/topographic digital elevation model (DEM) for the Delta. Elev m NAVD88, altitude in meters above the North American Vertical Datum of 1988.
25
Improvements for the Future The San Francisco Bay/Sacramento-San Joaquin Delta region is ever changing, and the impacts
of major storm systems, sea-level rise, and manmade structures will continue to alter the landscape. This means that predictive models will need updated DEMs, based on new bathymetric and topographic data, to continue to be relevant to planning decisions. Besides what is required to keep pace with change, there are still some areas within the new Bay-Delta DEM that were derived from older data, obtained with less modern sensors, and had less accurate positioning that require remedial work. New surveys of these areas would improve the DEM and the performance of predictive models. DWR plans to continue to update the DEM as newer data becomes available. Finally, we recommend improvements of coverage in the “tidal prism” region, the interface between water (soundings) and land (lidar). In older high-resolution surveys this was an intractable problem. Newer sideward-looking instrumentation can better cover the gap under favorable conditions, but vegetation, poor visibility, and shallow depths remain significant challenges.
Data The phase 3 DEM is available for public use and can be downloaded at
https://doi.org/10.5066/F7GH9G27 (Fregoso and others, 2017).
References Cited California Department of Water Resources, 2007, Cross Section Development Program bathymetry
data: California Department of Water Resources, Bay-Delta Office, accessed May 10, 2017, at http://baydeltaoffice.water.ca.gov/modeling/deltamodeling/models/csdp/csdp.cfm.
California Department of Water Resources, 2007, 2007 California Department of Water Resources Topographic LiDAR—San Joaquin Delta: NOAA Office for Coastal Management, accessed May 13, 2017, at https://coast.noaa.gov/dataviewer/#/lidar/search/where:ID=2523
California Department of Water Resources, 2009, Central Valley Floodplain Evaluation and Delineation Program: California Department of Water Resources, accessed March 6, 2017, at http://www.water.ca.gov/floodsafe/docs/CVFED.pdf.
Carignan, K.S., Taylor, L.A., Eakins, B.W., Caldwell, R.J., Friday, D.Z., Grothe, P.R., and Lim, E., 2011, Digital elevation models of central California and San Francisco Bay—Procedures, data sources and analysis: National Atmospheric and Oceanic Administration Technical Memorandum NESDIS NGDC-52, 49 p., accessed March 6, 2017, at https://docs.lib.noaa.gov/noaa_documents/NESDIS/NGDC/TM/NOAA_TM_NESDIS_NGDC_52.pdf.
Cbec, Inc., Eco Engineering, 2012, Yolo Bypass Two-Dimensional Hydrodynamic Modeling, Tule Canal and Toe Drain bathymetry – Data Collection Procedures: Cbec, Inc., Eco Engineering, report prepared for California Department of Water Resources, DWR Task Order 32, 10 p.
Deltares, 2014, D-flow flexible mesh, Technical Reference Manual: Delft, The Netherlands, Deltares, 82 p.
Environmental Data Solutions, 2006, Draft filed data report—Barker Slough, Calhoun Cut, Lindsey Slough and Cache Creek, Solano County, California—Bathymetric survey: Environmental Data Solutions report, 13 p.
Environmental Data Solutions, 2009, West delta condition bathymetric surveys—Field data collection procedures: Environmental Data Solutions report prepared for Cbec, Inc., 41 p.
26
Esri, 2008, ArcInfo 9.3 Workstation MOSAIC GRID function, ArcDoc version 9.3:ESRI software command.
Esri, 2008, ArcInfo 9.3 Workstation TOPOGRID module, ArcDoc version 9.3:ESRI software module. Esri, 2011, Imagery with metadata: Esri web page, accessed May 10, 2017, at
http://www.arcgis.com/home/item.html?id=c03a526d94704bfb839445e80de95495 Esri, 2016 Topo to Raster, ArcGIS 10.3., Esri web page, accessed May 10, 2017, at
http://desktop.arcgis.com/en/arcmap/latest/tools/spatial-analyst-toolbox/topo-to-raster.htm Esri, 2017 Mosaic to New Raster, ArcGIS 10.3., Esri web page, accessed May 10, 2017, at
http://desktop.arcgis.com/en/arcmap/10.3/tools/data-management-toolbox/mosaic-to-new-raster.htm Finlayson, D.P, Smith, D.L., Mulvey, B.M., Jaffe, B.E., Fregoso, T.A., and Reiss, T.E, 2017,
Bathymetric and acoustic backscatter data of the Sacramento River, from the Feather River to Knights Landing, California in February, 2011: U.S. Geological Survey data release, https://doi.org/10.5066/F72B8W65.
Foxgrover, A., Smith, R.E., and Jaffe, B.E., 2005, Suisun Bay and delta bathymetry: U.S. Geological Survey website, accessed March 6, 2017, at http://sfbay.wr.usgs.gov/sediment/delta/index.html.
Fregoso, T.A., Wang, R-F, Alteljevich, E., and Jaffe, B.E., 2017, San Francisco Bay-Delta bathymetric/topographic digital elevation model (DEM): U.S. Geological Survey data release, https://doi.org/10.5066/F7GH9G27.
Fugro West, Inc., 2008, Bathymetric surveys in support of urban levees, geotechnical evaluation: Fugro West, Inc., report prepared for URS Corporation and California Department of Water Resources, DWR Task Order 32, 30 p.
Fugro West, Inc., 2010, Multibeam hydrographic survey Middle River: Fugro West, Inc., report prepared for Storesund Consulting, 6 p.
Fugro Earth Data, Inc, 2010, DWR Central Valley Floodplain Evaluation and Delineation (CVFED), metadata prepared for California Department of Water Resources, DWR Task Order 13.
Global Remote Sensing LLC, 2008, Mokelumne River (California delta), California Hydrographic Survey Report: Global Remote Sensing LLC report prepared for the Law Offices of Herum, Crabtree, and Brown, 76 p.
Knowles, N., and Lucas, L.V., 2015, CASCaDE II project final report: U.S. Geological Survey, accessed March 6, 2017, at https://cascade.wr.usgs.gov/reports/C2_final_report/CASCaDE_2_Final_Report.pdf.
Lucas, L.V., Burau, J., 2001, Updated Mildred Island 2001 depth sounding data, accessed May 10, 2017, at https://sfbay.wr.usgs.gov/access/wqdata/overview/people/MildredIsland2001_UPDATED.xls
Lucas, L.V., Cloern, J.E., Thompson, J.K., and Monsen, N. E., 2002, Functional variability of habitats in the Sacramento-San Joaquin Delta—Restoration implications: Ecological Applications, v. 12, no. 5, p. 1528–1547.
Mayr, S., 2011, Multibeam bathymetry survey report—Middle River-North Canal-Victoria Canal: California Department of Water Resources report, 17 p., accessed March 6, 2017, at http://www.water.ca.gov/floodsafe/fessro/docs/dkip_bathymetry_report.pdf.
Mayr, S., 2010-2016, Delta bathymetry catalog: California Department of Water Resources website, accessed May 10, 2017, at https://gis.water.ca.gov/app/bathymetry/.
National Oceanic and Atmospheric Administration, 2010, 2010 Northern San Francisco Bay area lidar—Portions of Alameda, Contra Costa, Marin, Napa, San Francisco, Solano, and Sonoma Counties: National Oceanic and Atmospheric Administration, National Ocean Service, Office for Coastal Management database, accessed March 6, 2017, at
27
https://coast.noaa.gov/dataservices/Metadata/TransformMetadata?u=https://coast.noaa.gov/htdata/lidar1_z/geoid12a/data/584/2010_SFBay_metadata.xml&f=html.
National Oceanic and Atmospheric Administration, 2015, NOAA Shoreline Data Explorer: National Oceanic and Atmospheric Administration website, accessed March 6, 2017, at http://www.ngs.noaa.gov/NSDE/.
Ruggeri-Jensen-Azar & Associates, 2005, Delta Coves, Bethel Island, Contra Costa County, California: website, accessed May 25, 2017, at http://www.rja-gps.com/project/delta-cove/
Sea Surveyor, Inc./Bestor Engineers, Inc., 2005, 2004 Hydrographic survey of north San Francisco bays, delta, lower San Joaquin and Sacramento Rivers, and Sacramento Deep Water Ship Channel: Sea Surveyor, Inc./Bestor Engineers, Inc., report prepared for the U.S. Army Corps of Engineers, USACE Contract No. DACW-007-02-D-0002.
Smith, R.E., Foxgrover, A., and Smith, P.E., 2003, Suisun Bay & delta bathymetry—Production of a 10 meter grid: CALFED Science Conference 2003 poster [unpublished], accessed March 6, 2017, at https://sfbay.wr.usgs.gov/sediment/delta/Delta_bathy_CALFED.pdf.
U.S Army Corp of Engineers and California Reclamation Board, 2002, Sacramento and San Joaquin River Basins California Comprehensive Study—Interim Report: accessed March 6, 2017, at http://www.deltarevision.com/2002_docs/interimrpt-cover.pdf.
U.S. Geological Survey, 2013, 2 meter coastal national elevation dataset: U.S. Geological Survey Earth Resources Observation and Science Center (EROS) database, accessed May 10, 2017, at http://edcintl.cr.usgs.gov/downloads/sciweb1/shared/topo/downloads/Topobathy/TOPOBATHY_SAN_FRANCISCO_ELEV_METERS.zip.
Wang, R-F., and Ateljevich, E., 2012, A continuous surface elevation map for modeling, chapter 6 of Methodology for flow and salinity estimates in the Sacramento-San Joaquin Delta and Suisun Marsh—33rd annual progress report to the State Water Resources Control Board in accordance with Water Right Decisions 1485 and 1641: California Department of Water Resources, p. 6-ii–6-22, accessed March 6, 2017, at http://baydeltaoffice.water.ca.gov/modeling/deltamodeling/AR2012/Method_DeltaModel_2012_FullReport_FINAL_Web.pdf.
Wood Rodgers, Inc., 2010, Central Valley Floodplain Evaluation and Delineation Program, Lower Sacramento River Basin, for California Department of Water Resources: Wood Rodgers project summary website, accessed May 24, 2017, at http://www.woodrodgers.com/services/water-resources/flood-management/central-valley-floodplain-evaluation/

ISSN 2331-1258 (online) https://doi.org/10.3133/ofr20171067